
Back in August, Nvidia announced its new RTX 20-series cards based on the Turing architecture. Three cards were announced – the RTX 2080 and 2080 Ti, which launched almost a month ago, and the RTX 2070. With a lot made over the high prices of the 2080 and 2080 Ti cards, the RTX 2070 has almost gone unnoticed – until now that is, as today we can publish our first 2070 review.
The card in question is not the Nvidia Founders Edition, however – but the MSI RTX 2070 Gaming Z 8G. This is MSI's flagship 2070 model, with features including a custom PCB, a hefty factory overclock and – of course – bling-tastic RGB lighting. With an MSRP of £605.99 it comes in almost £40 more expensive than Nvidia's Founders Edition, so the question is – how competitive can it be at this price?
| GPU | RTX 2080 Ti (FE) | GTX 1080 Ti | RTX 2080 (FE) | GTX 1080 | RTX 2070 (FE) | GTX 1070 |
| SMs | 68 | 28 | 46 | 20 | 36 | 15 |
| CUDA Cores | 4352 | 3584 | 2944 | 2560 | 2304 | 1920 |
| Tensor Cores | 544 | N/A | 368 | N/A | 288 | N/A |
| Tensor FLOPS | 114 | N/A | 85 | N/A | 63 | N/A |
| RT Cores | 68 | N/A | 46 | N/A | 36 | N/A |
| Texture Units | 272 | 224 | 184 | N/A | 144 | 120 |
| ROPs | 88 | 88 | 64 | 64 | 64 | 64 |
| Rays Cast | 10 Giga Rays/sec | 1.1 Giga Rays/sec | 8 Giga Rays/sec | 0.877 Giga Rays/sec | 6 Giga Rays/sec | 0.65 Giga Rays/sec |
| RTX Performance | 87 Trillion RTX-OPS | 11.3 Trillion RTX-OPS | 60 Trillion RTX-OPS | 8.9 Trillion RTX-OPS | 45 Trillion RTX-OPS | 6.5 Trillion RTX-OPS |
| GPU Boost Clock | 1635 MHz | 1582 MHz | 1800 MHz | 1733 MHz | 1710 MHz | 1683 MHz |
| Memory Clock | 14 Gbps | 11 Gbps | 14 Gbps | 10 Gbps | 14 Gbps | 8 Gbps |
| Total Video Memory | 11GB GDDR6 | 11GB GDDR5X | 8GB GDDR6 | 8GB GDDR5X | 8GB GDDR6 | 8GB GDDR5 |
| Memory Interface | 352-bit | 352-bit | 256-bit | 256-bit | 256-bit | 256-bit |
| Memory Bandwidth | 616 GB/sec | 484 GB/sec | 448 GB/sec | 320 GB/sec | 448 GB/sec | 256 GB/sec |
| TDP | 260W | 250W | 225W | 180W | 185W | 150W |
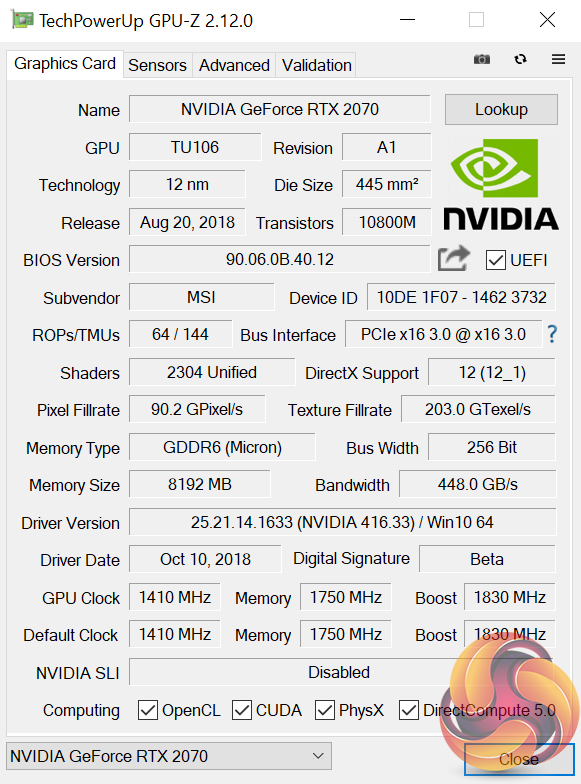
First of all – it is worth taking a quick look at the RTX 2070 specs as it has been a while since these were first announced. The 2070 uses the TU106 GPU which is equipped with 2304 CUDA cores, 144 texture units and 64 ROPS. As part of the Turing architecture, the 2070 also boasts 288 Tensor cores and 36 RT cores.
Memory is provided by 8GB GDDR6 which is exactly the same as the memory found with the RTX 2080 – so it operates over a 256-bit bus providing 448 GB/s bandwidth, with a stock frequency of 1750MHz.
While the Founders Edition (FE) RTX 2070 has a boost clock of 1710MHz (which is 90MHz faster than reference 2070 speeds), this MSI RTX 2070 Gaming Z 8G ups the boost clock to 1830MHz, though memory is left at stock. There is no dual-BIOS functionality and no need to download software to achieve this speed – meaning it runs at 1830MHz out of the box.
If you're interested in reading more about the Turing architecture, we published a detailed breakdown within our initial RTX 2080 and RTX 2080 Ti reviews. It's obviously the same design as used with the RTX 2070, so all of what you can read there applies to this card as well.
The MSI RTX 2070 Gaming Z 8G ships in a dark box with a big image of the card visible from the front – the eye-catching RGB lighting is clearly quite a feature.
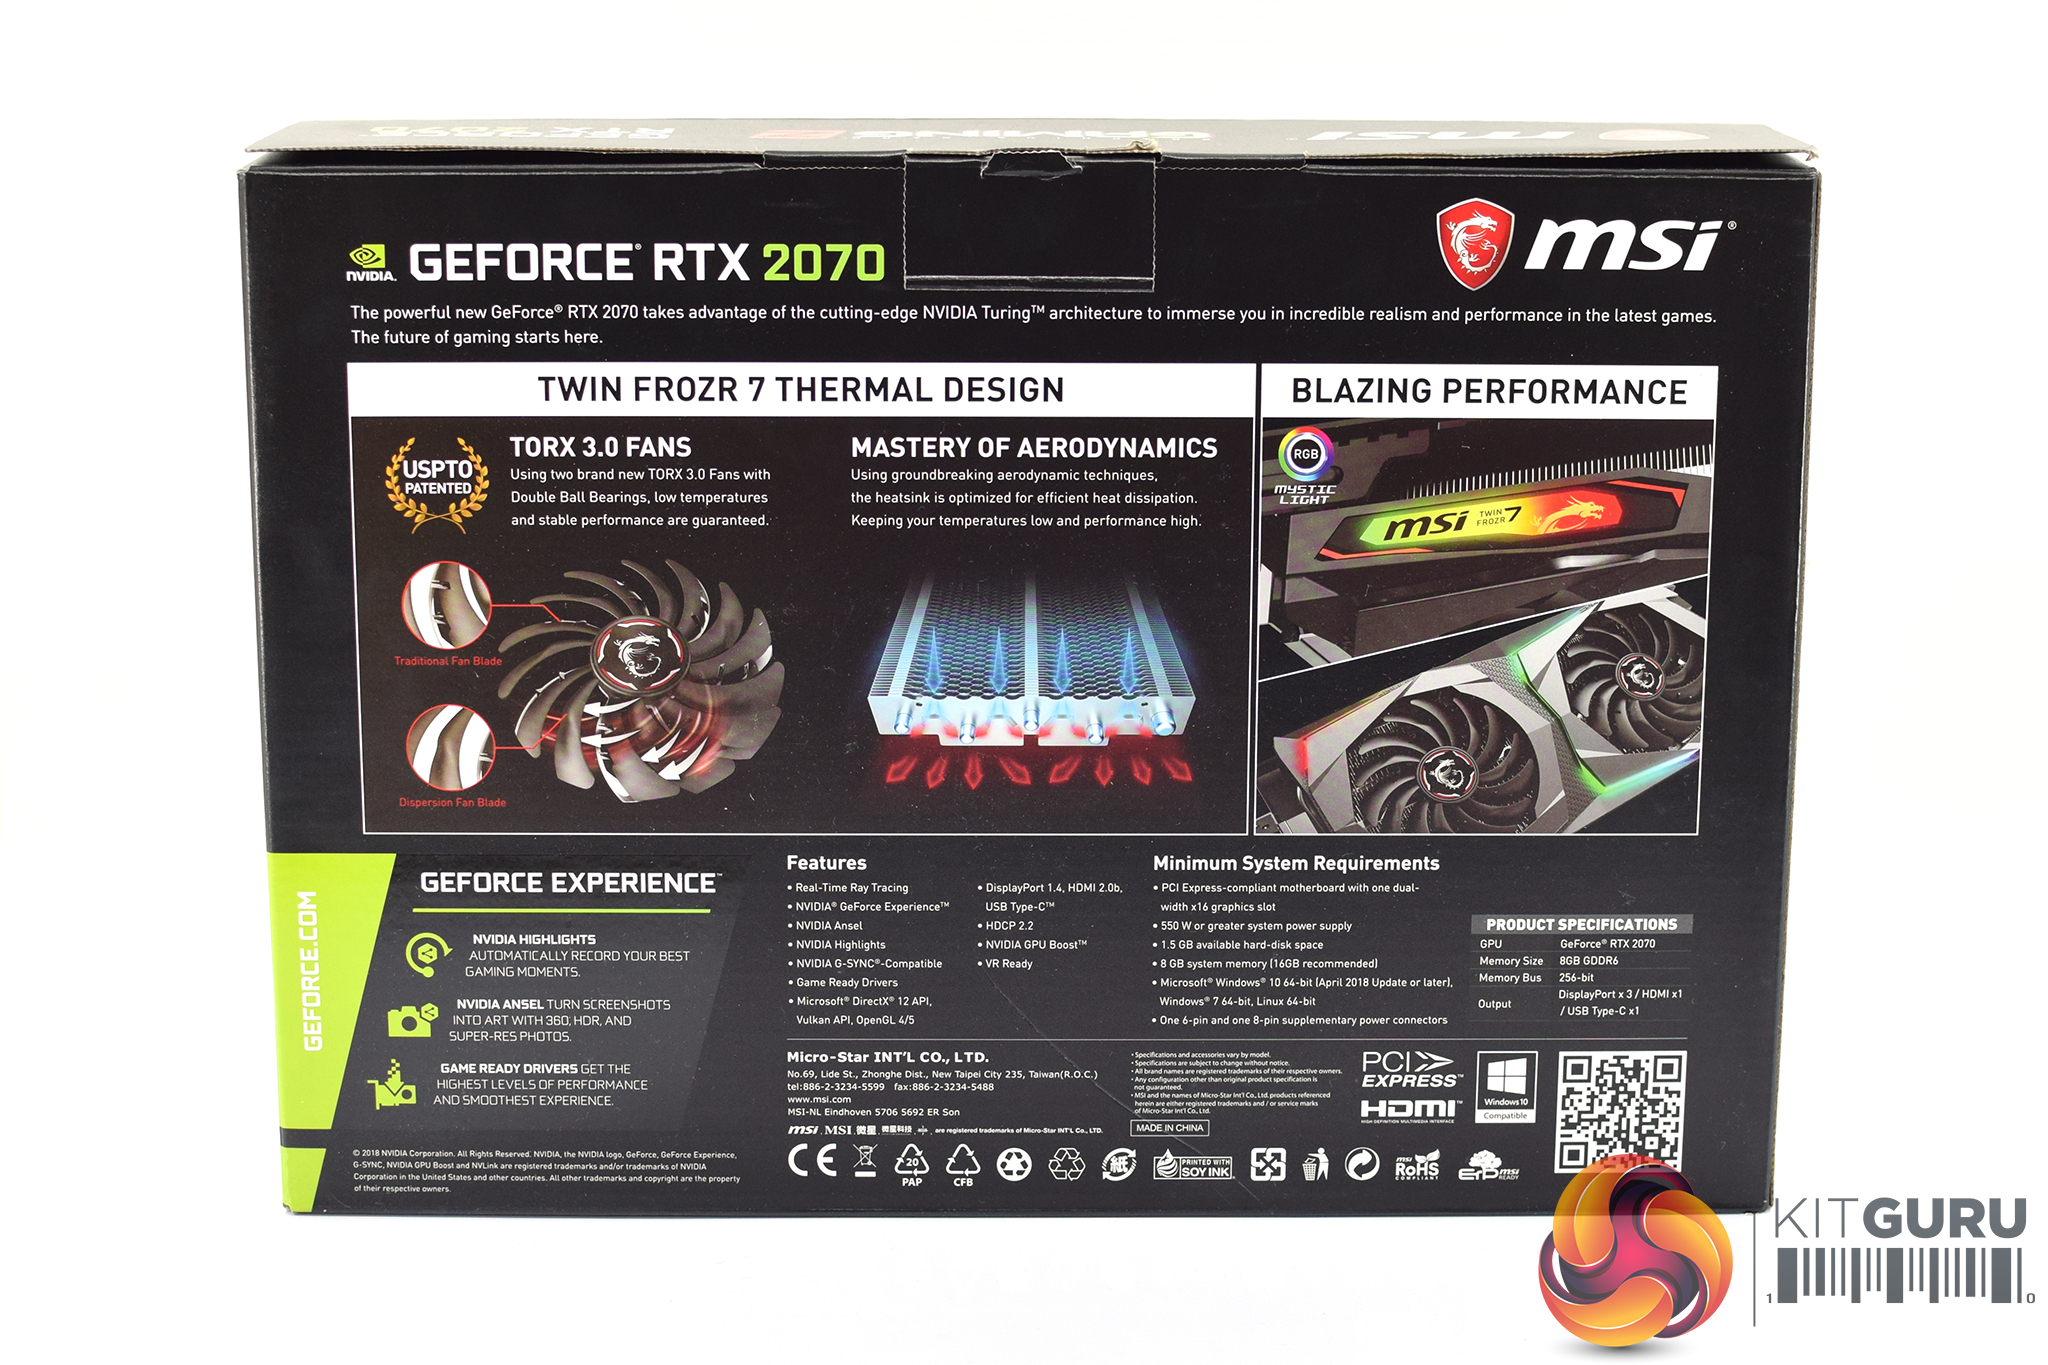
On the back we find some spec info as well as three key features of the card – including its Torx 3.0 fans, the improved aerodynamics of the card design, and RGB lighting – again!
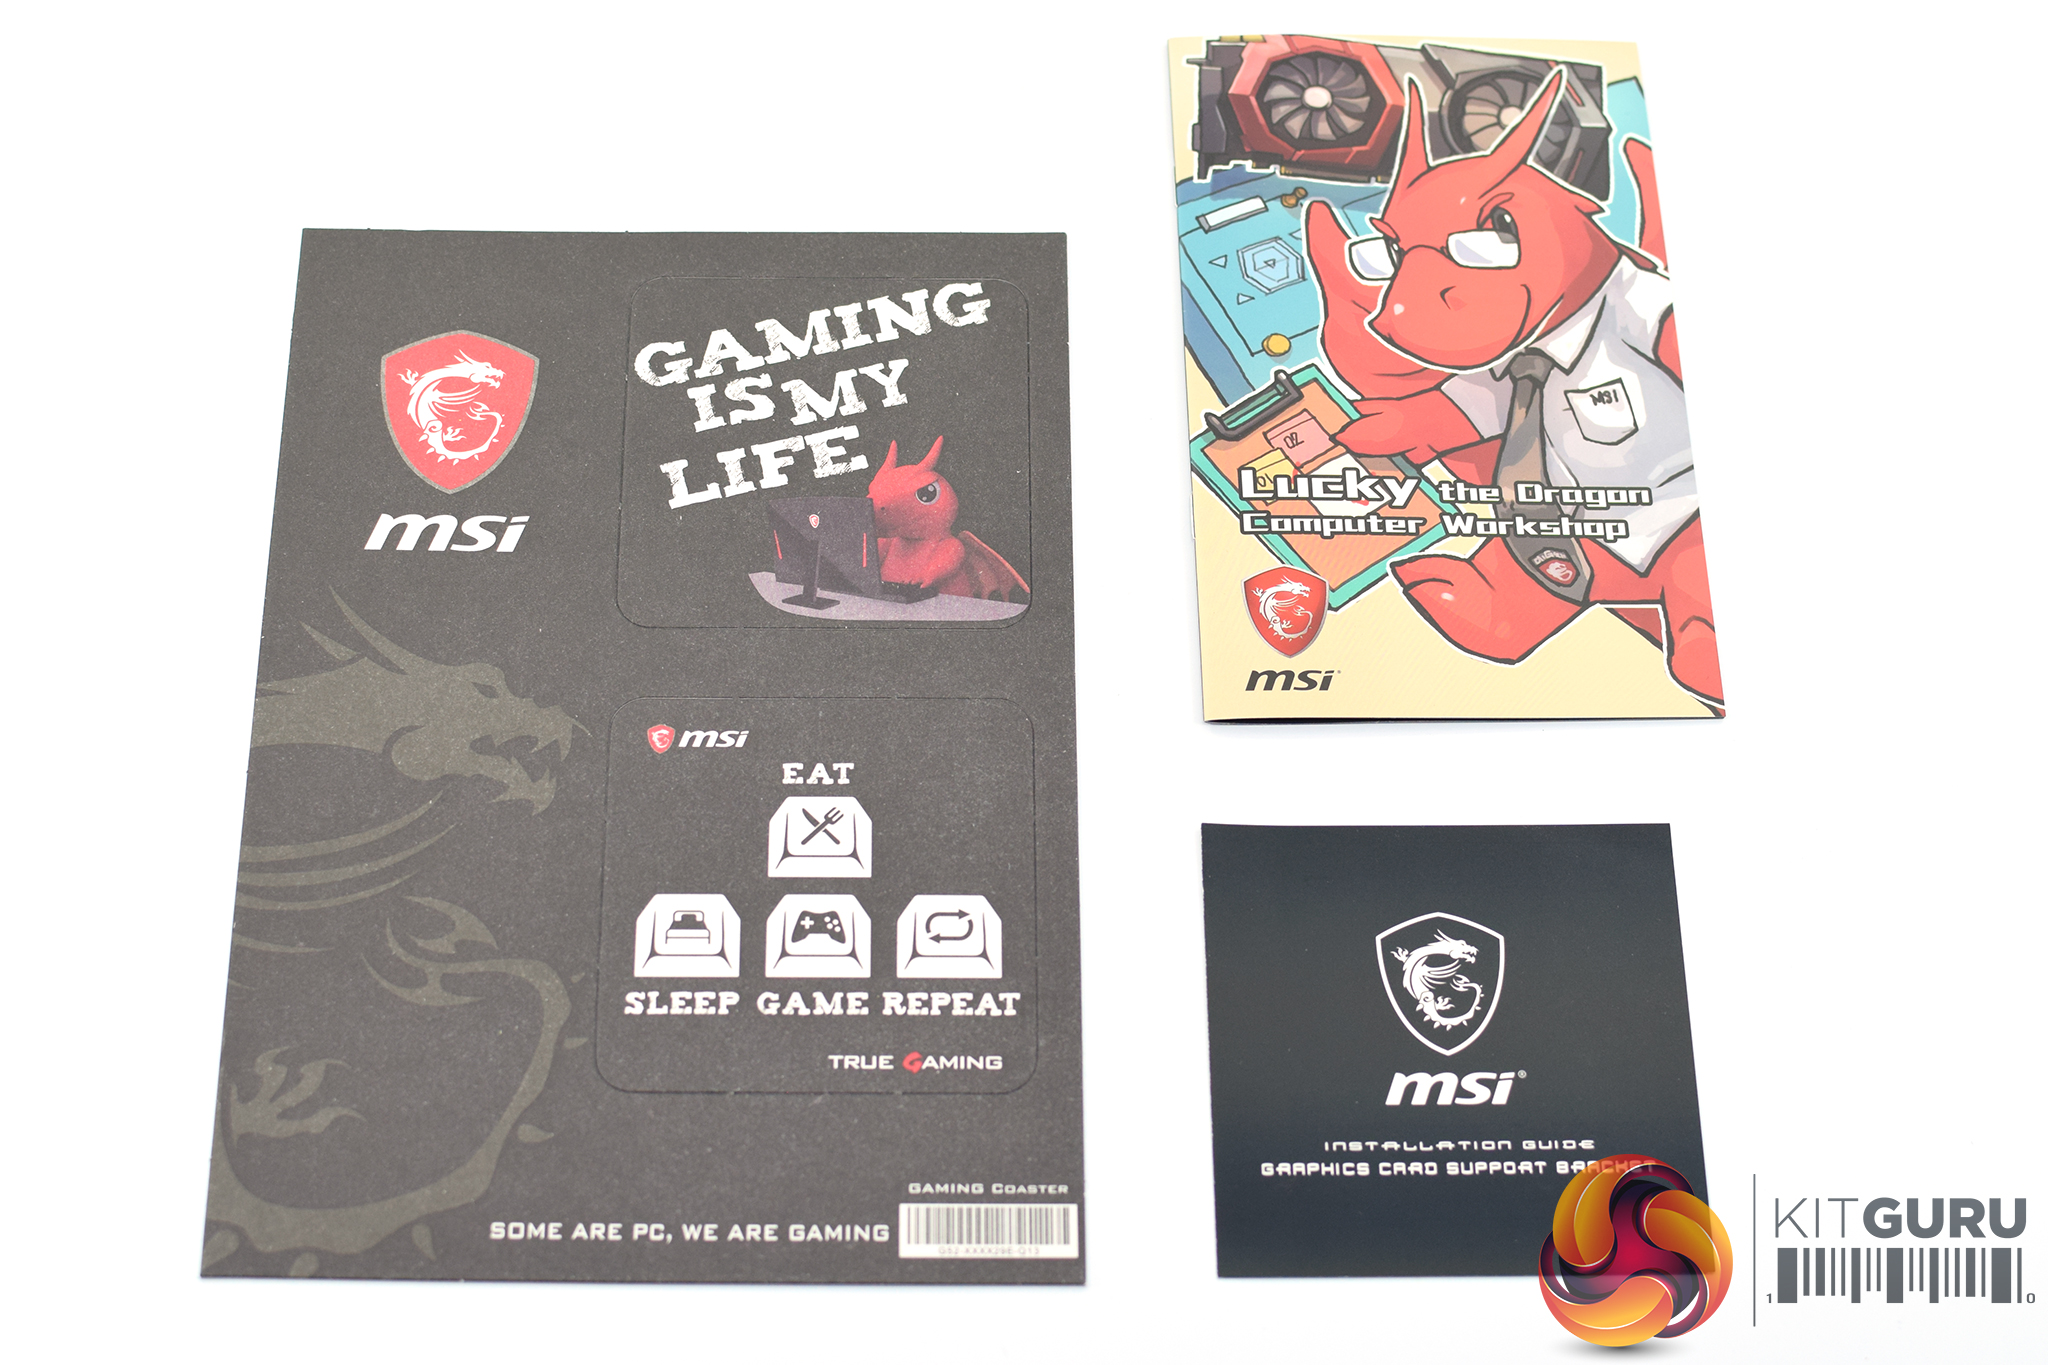
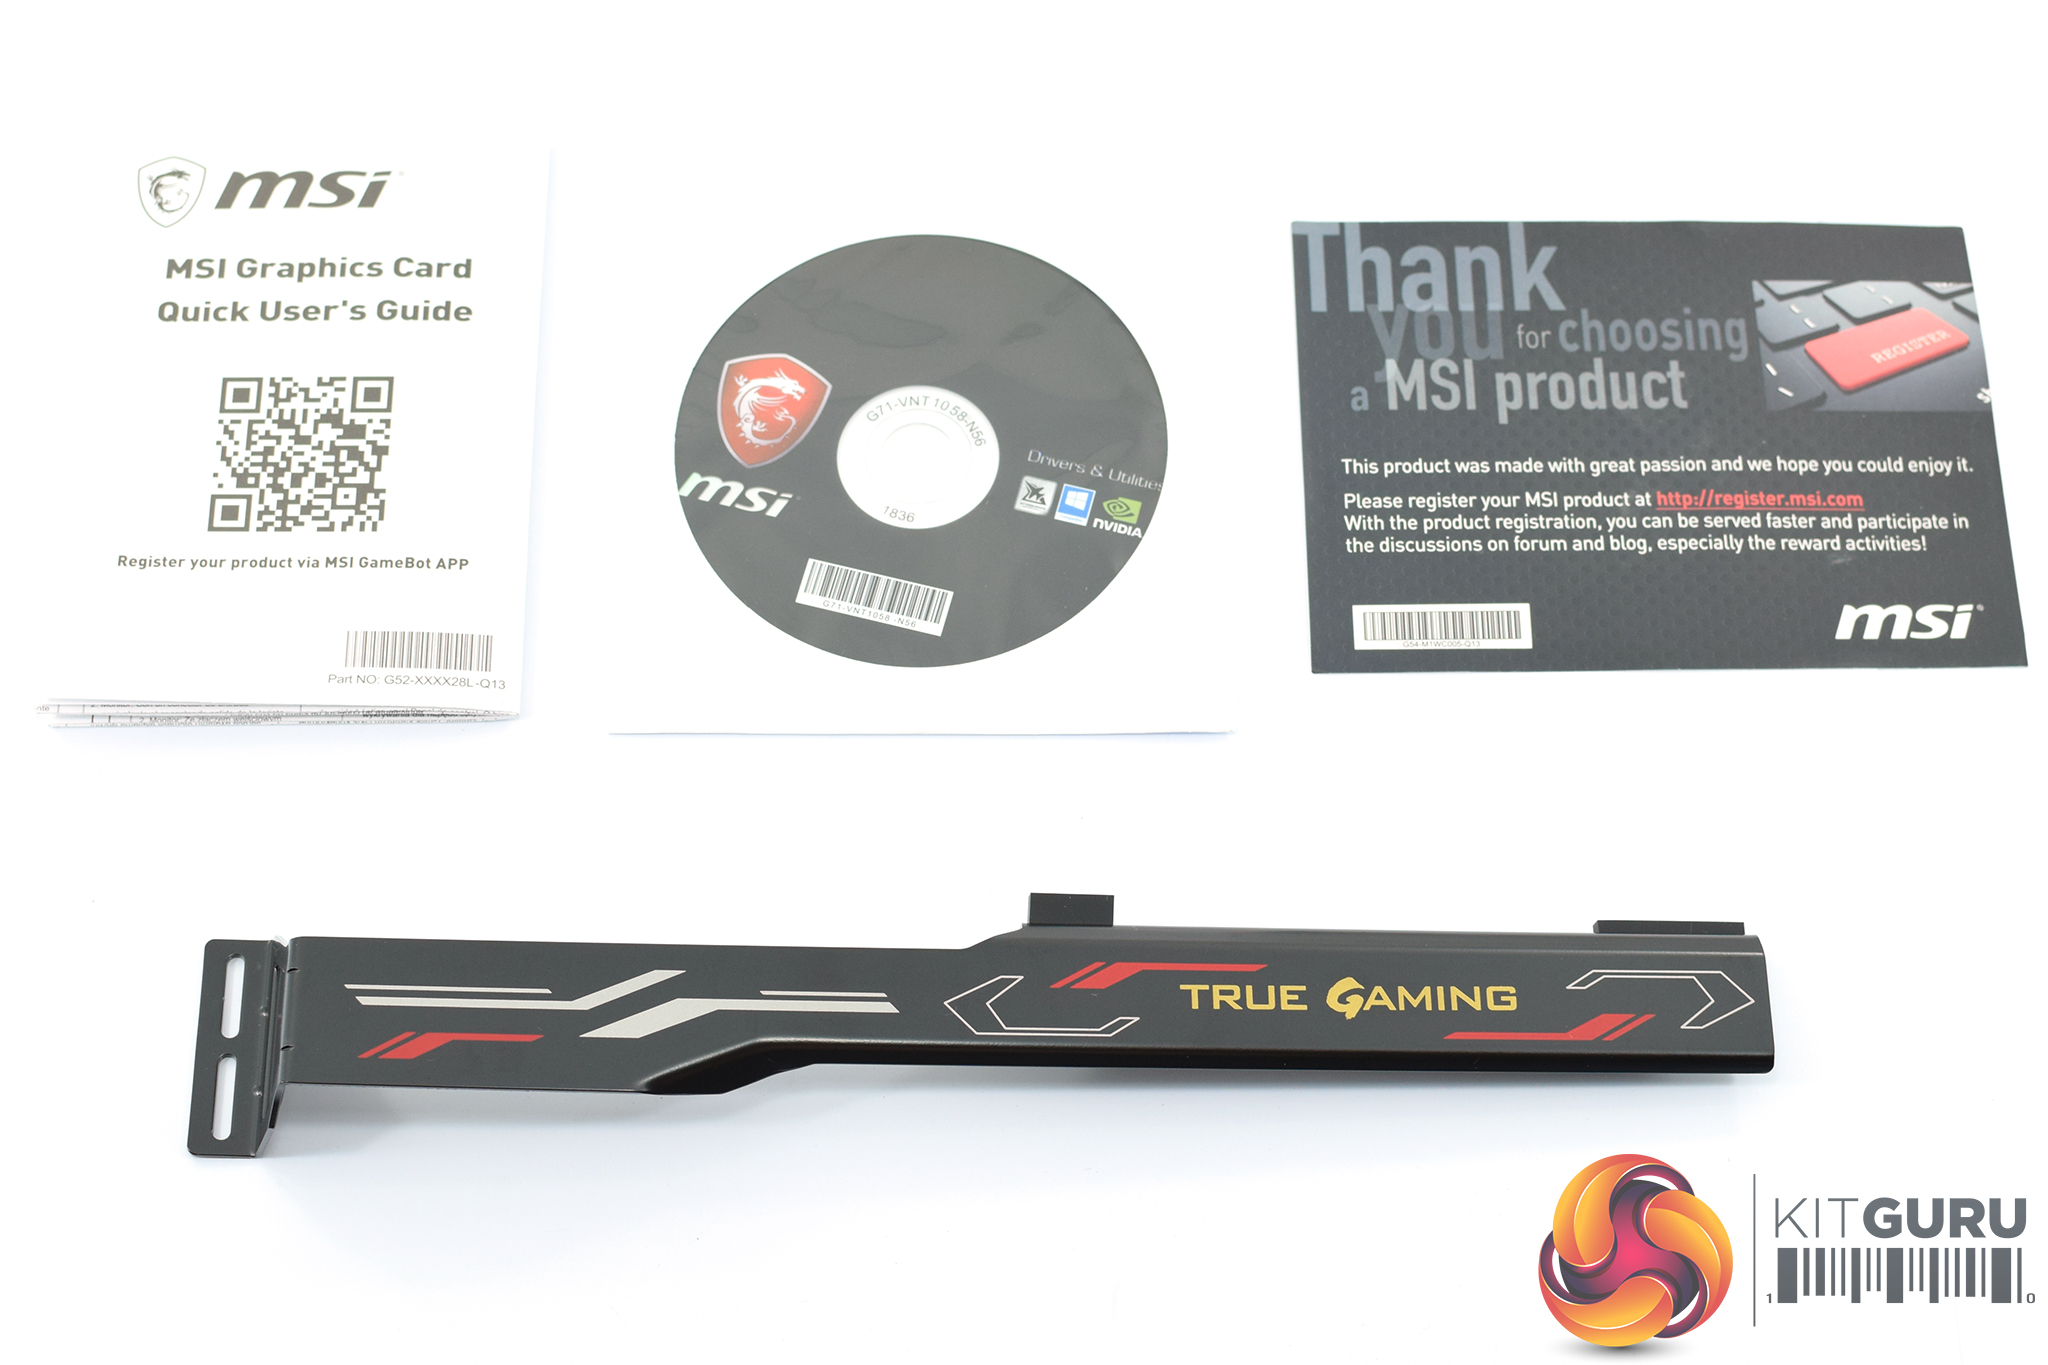
A wealth of accessories come included in the box – we find two MSI coasters, a Lucky the Dragon cartoon, a quick start guide, a driver disk, and a product registration reminder.
Most useful, however, is certainly the included anti-sag metal bracket. As we will see shortly, the Gaming Z is no small card, so MSI includes this fairly hefty bracket to keep the card from sagging and potentially damaging your motherboard's PCIe x16 slot.
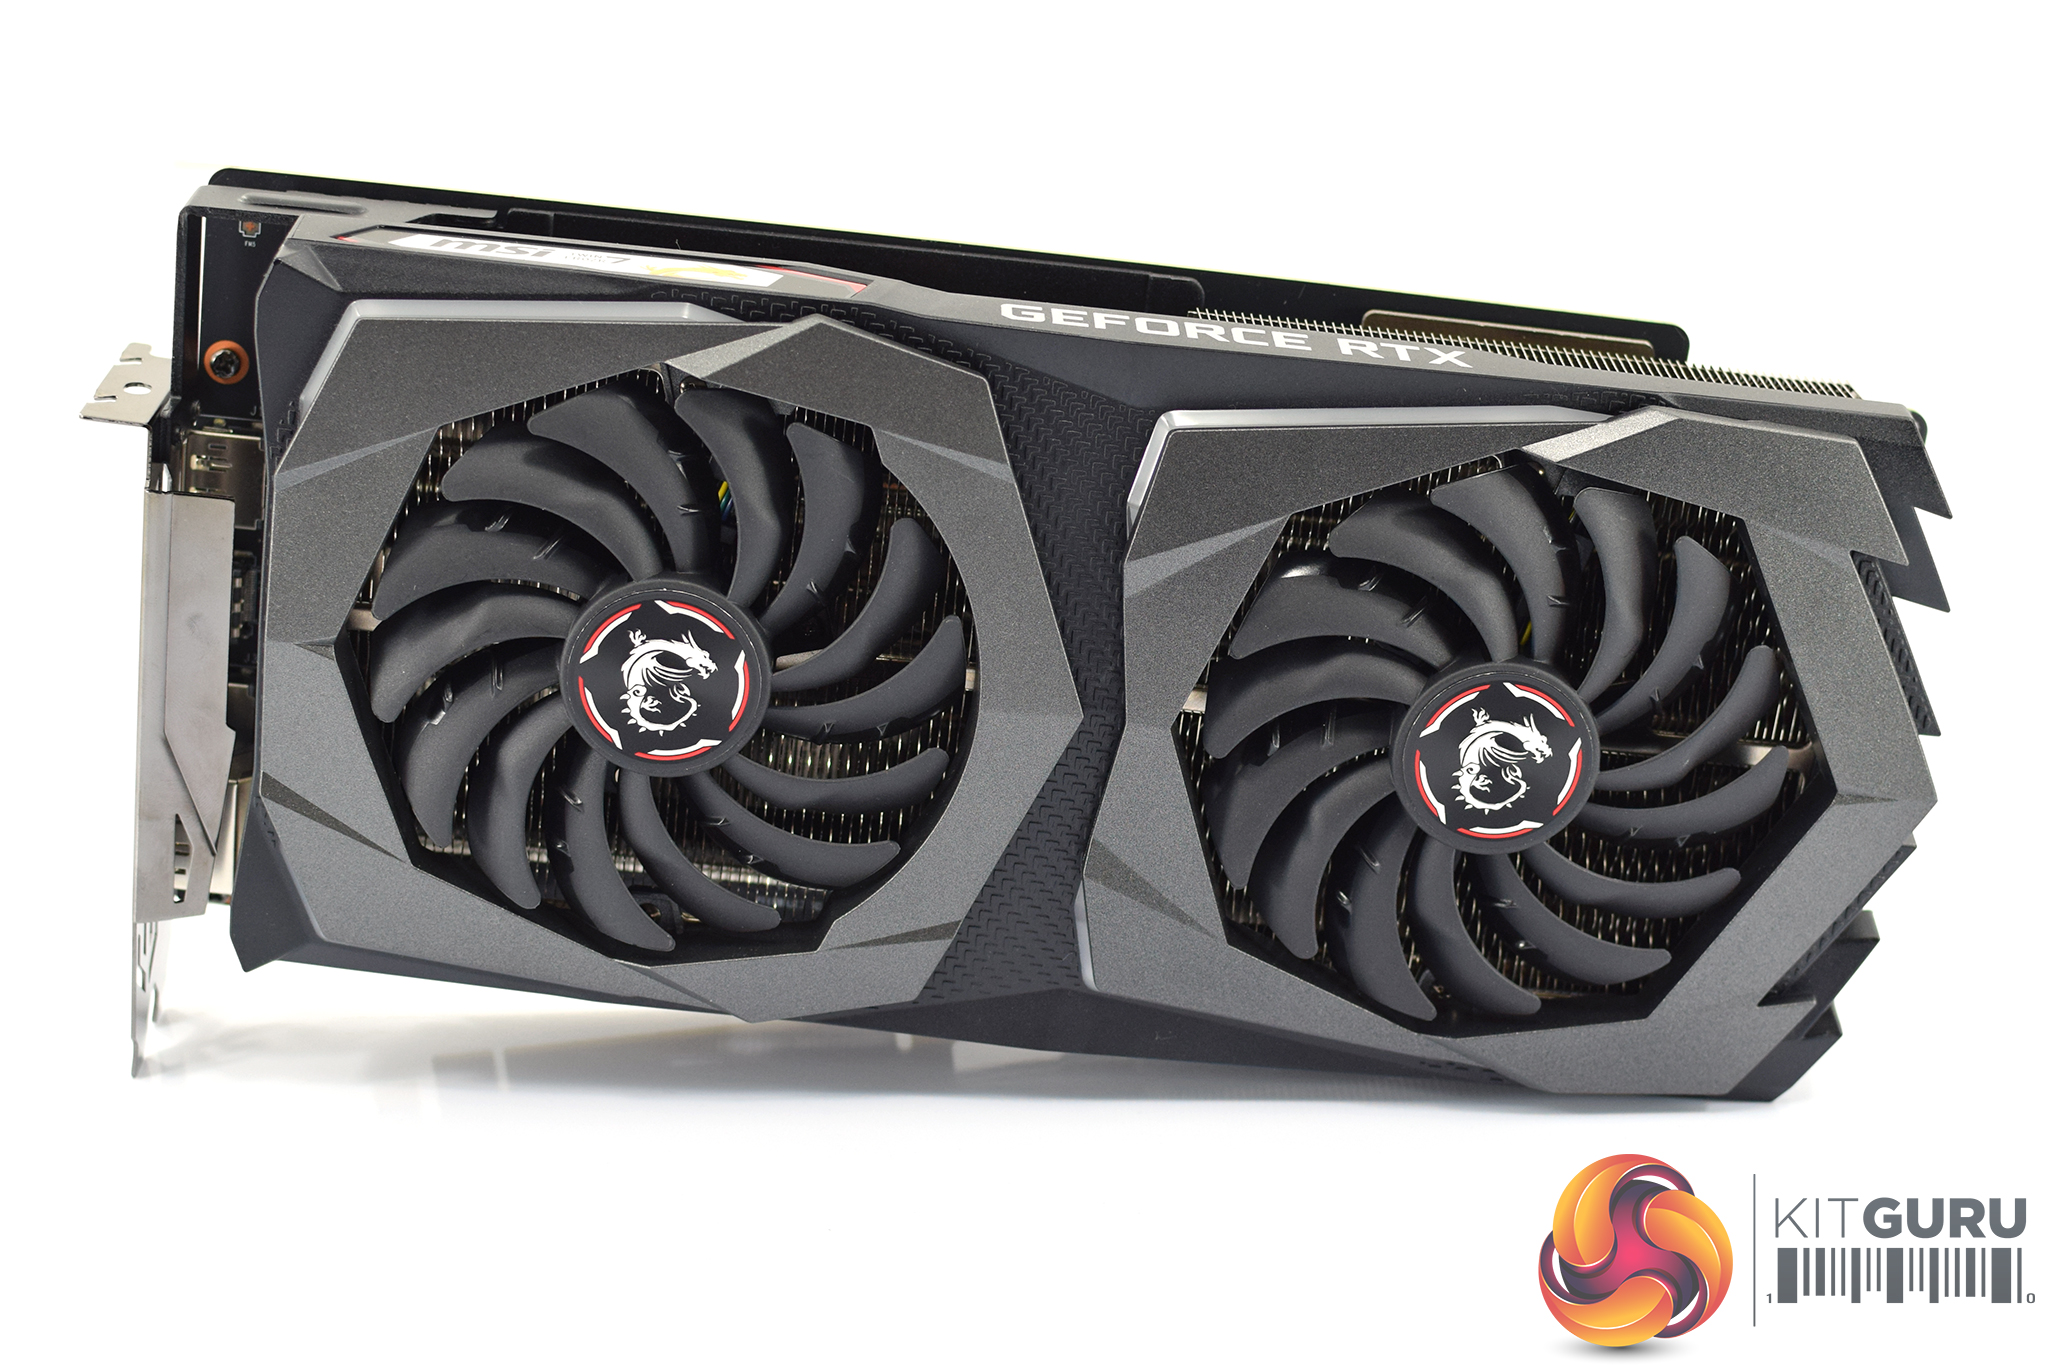
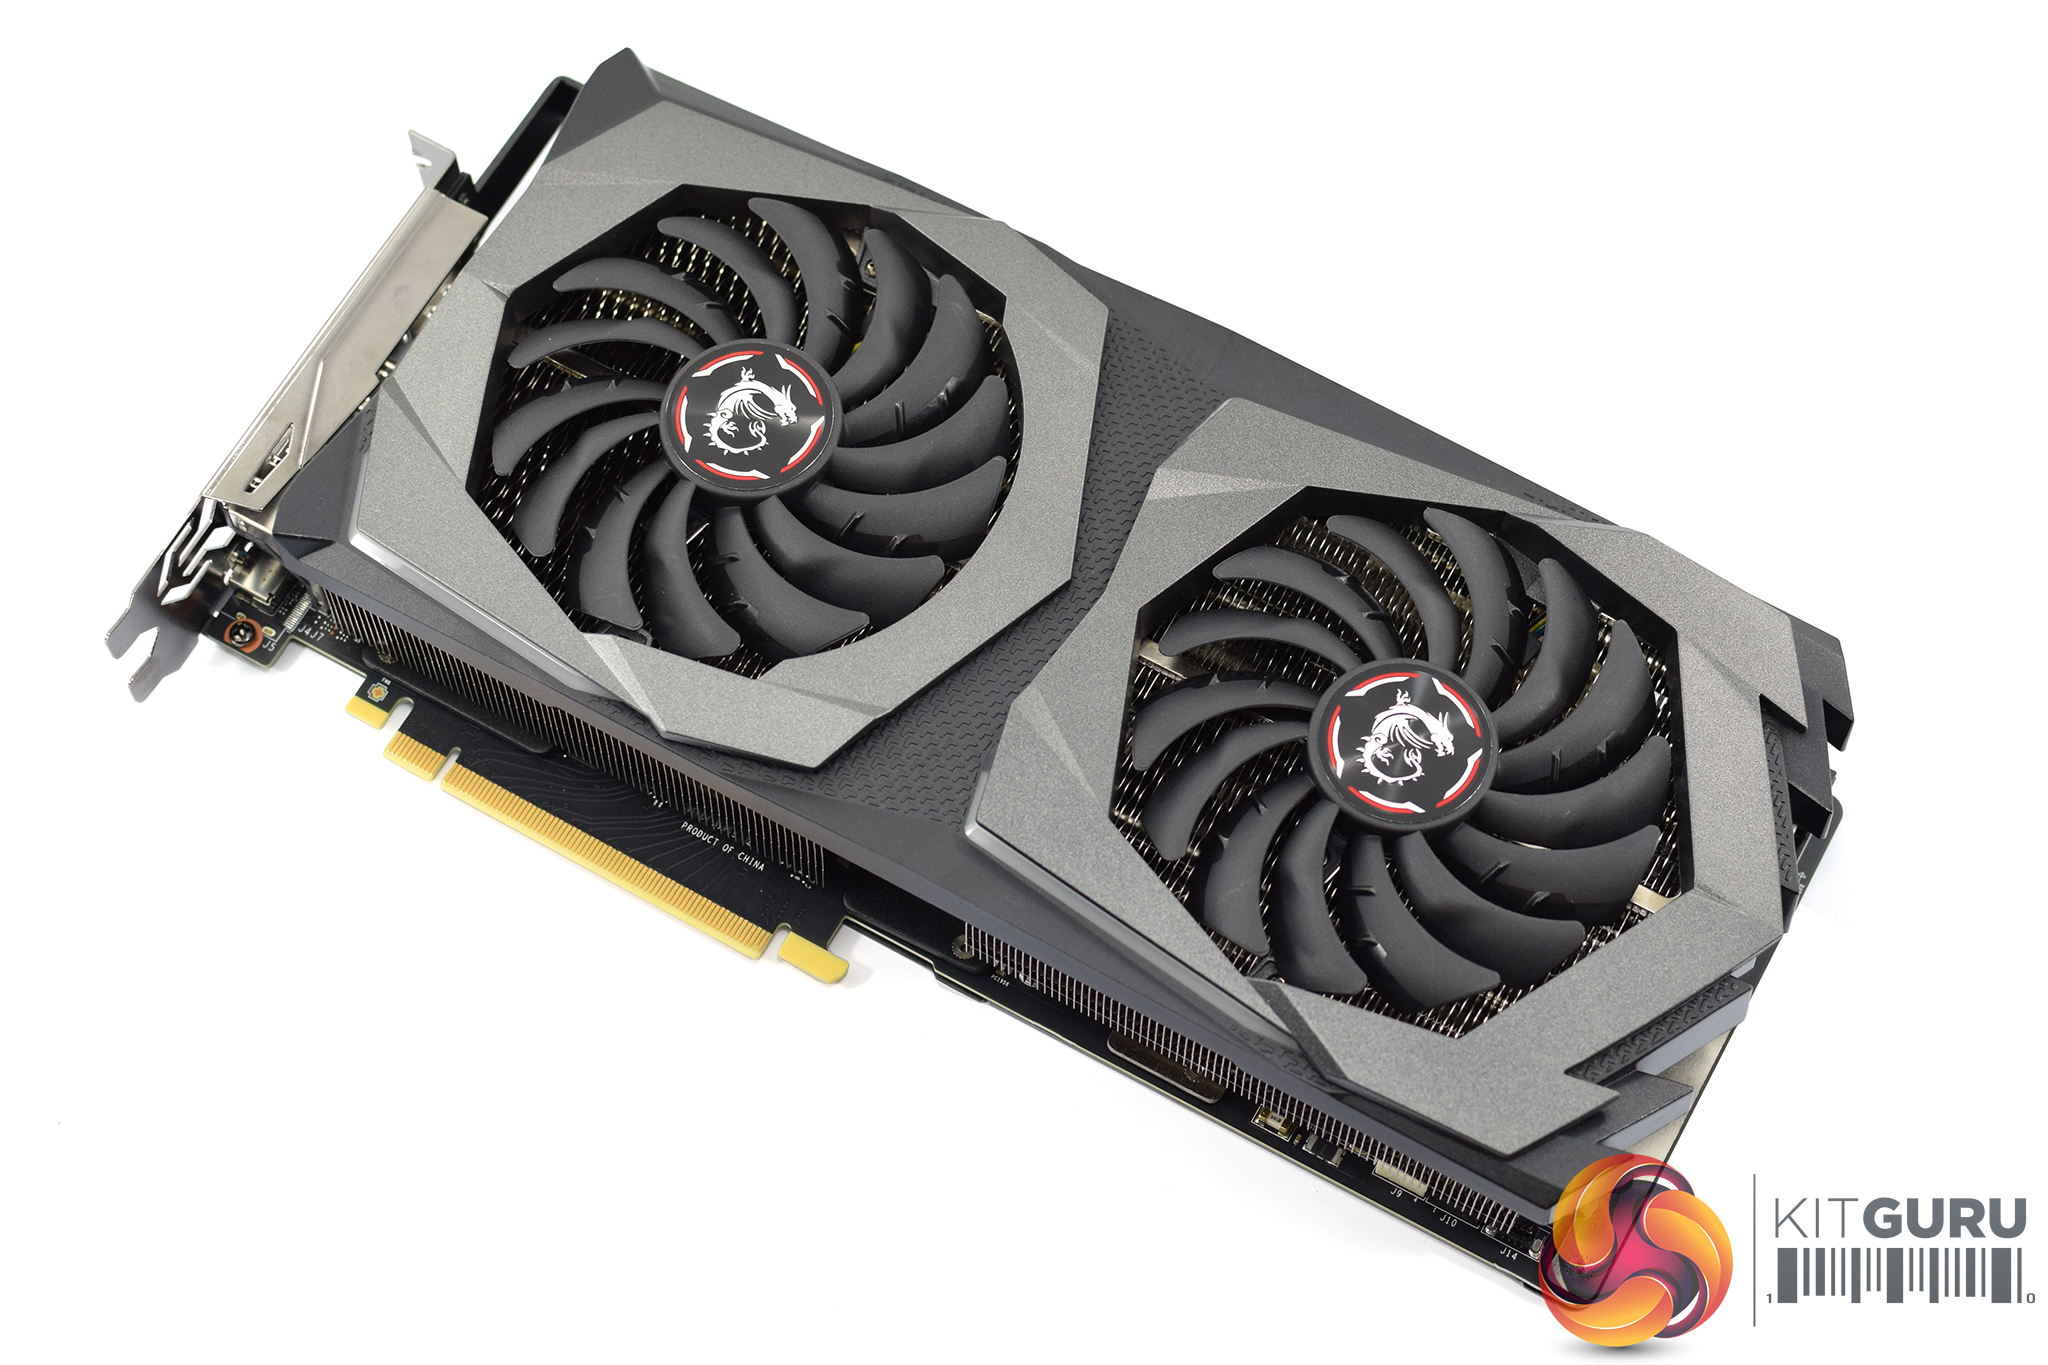
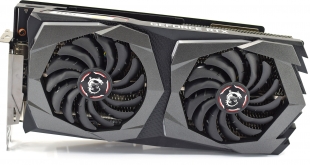
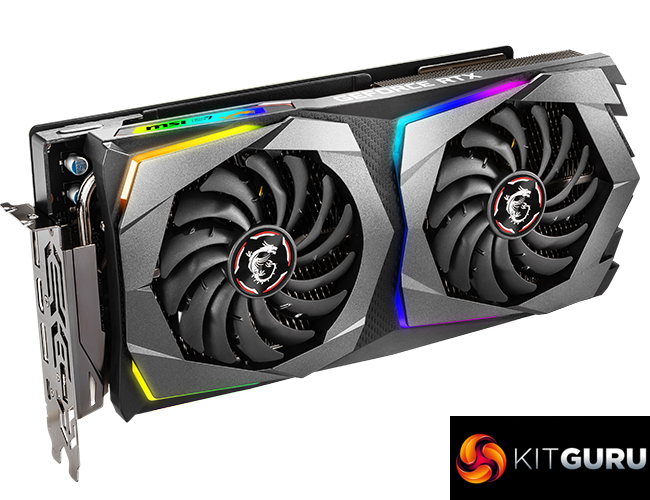
Moving onto the card itself, I have to admit this is probably the best looking aftermarket RTX card I have seen so far. The shroud uses both black and gunmetal grey sections, with some angular elements to give the card a bit of an aggressive appearance – but not so much as to make it look tacky.
The two fans are – as we saw from the back of the box – MSI's Torx 3.0 design. They measure 100mm in diameter and use what MSI calls ‘dispersion fan blades' – meaning the blade design is curved to improve airflow. Somewhat laughably, MSI also says these fans are for ‘gaming with balls of steel'… thanks to the double ball bearings used, of course.
As we mentioned, the Gaming Z is not a small card – in fact, it is the biggest aftermarket RTX card I have seen so far, at least in terms of its length and height. The full dimensions are 307 x 155 x 50 mm, so definitely make sure this will fit in your case. The 50mm thickness makes it a 2.5 slot card.
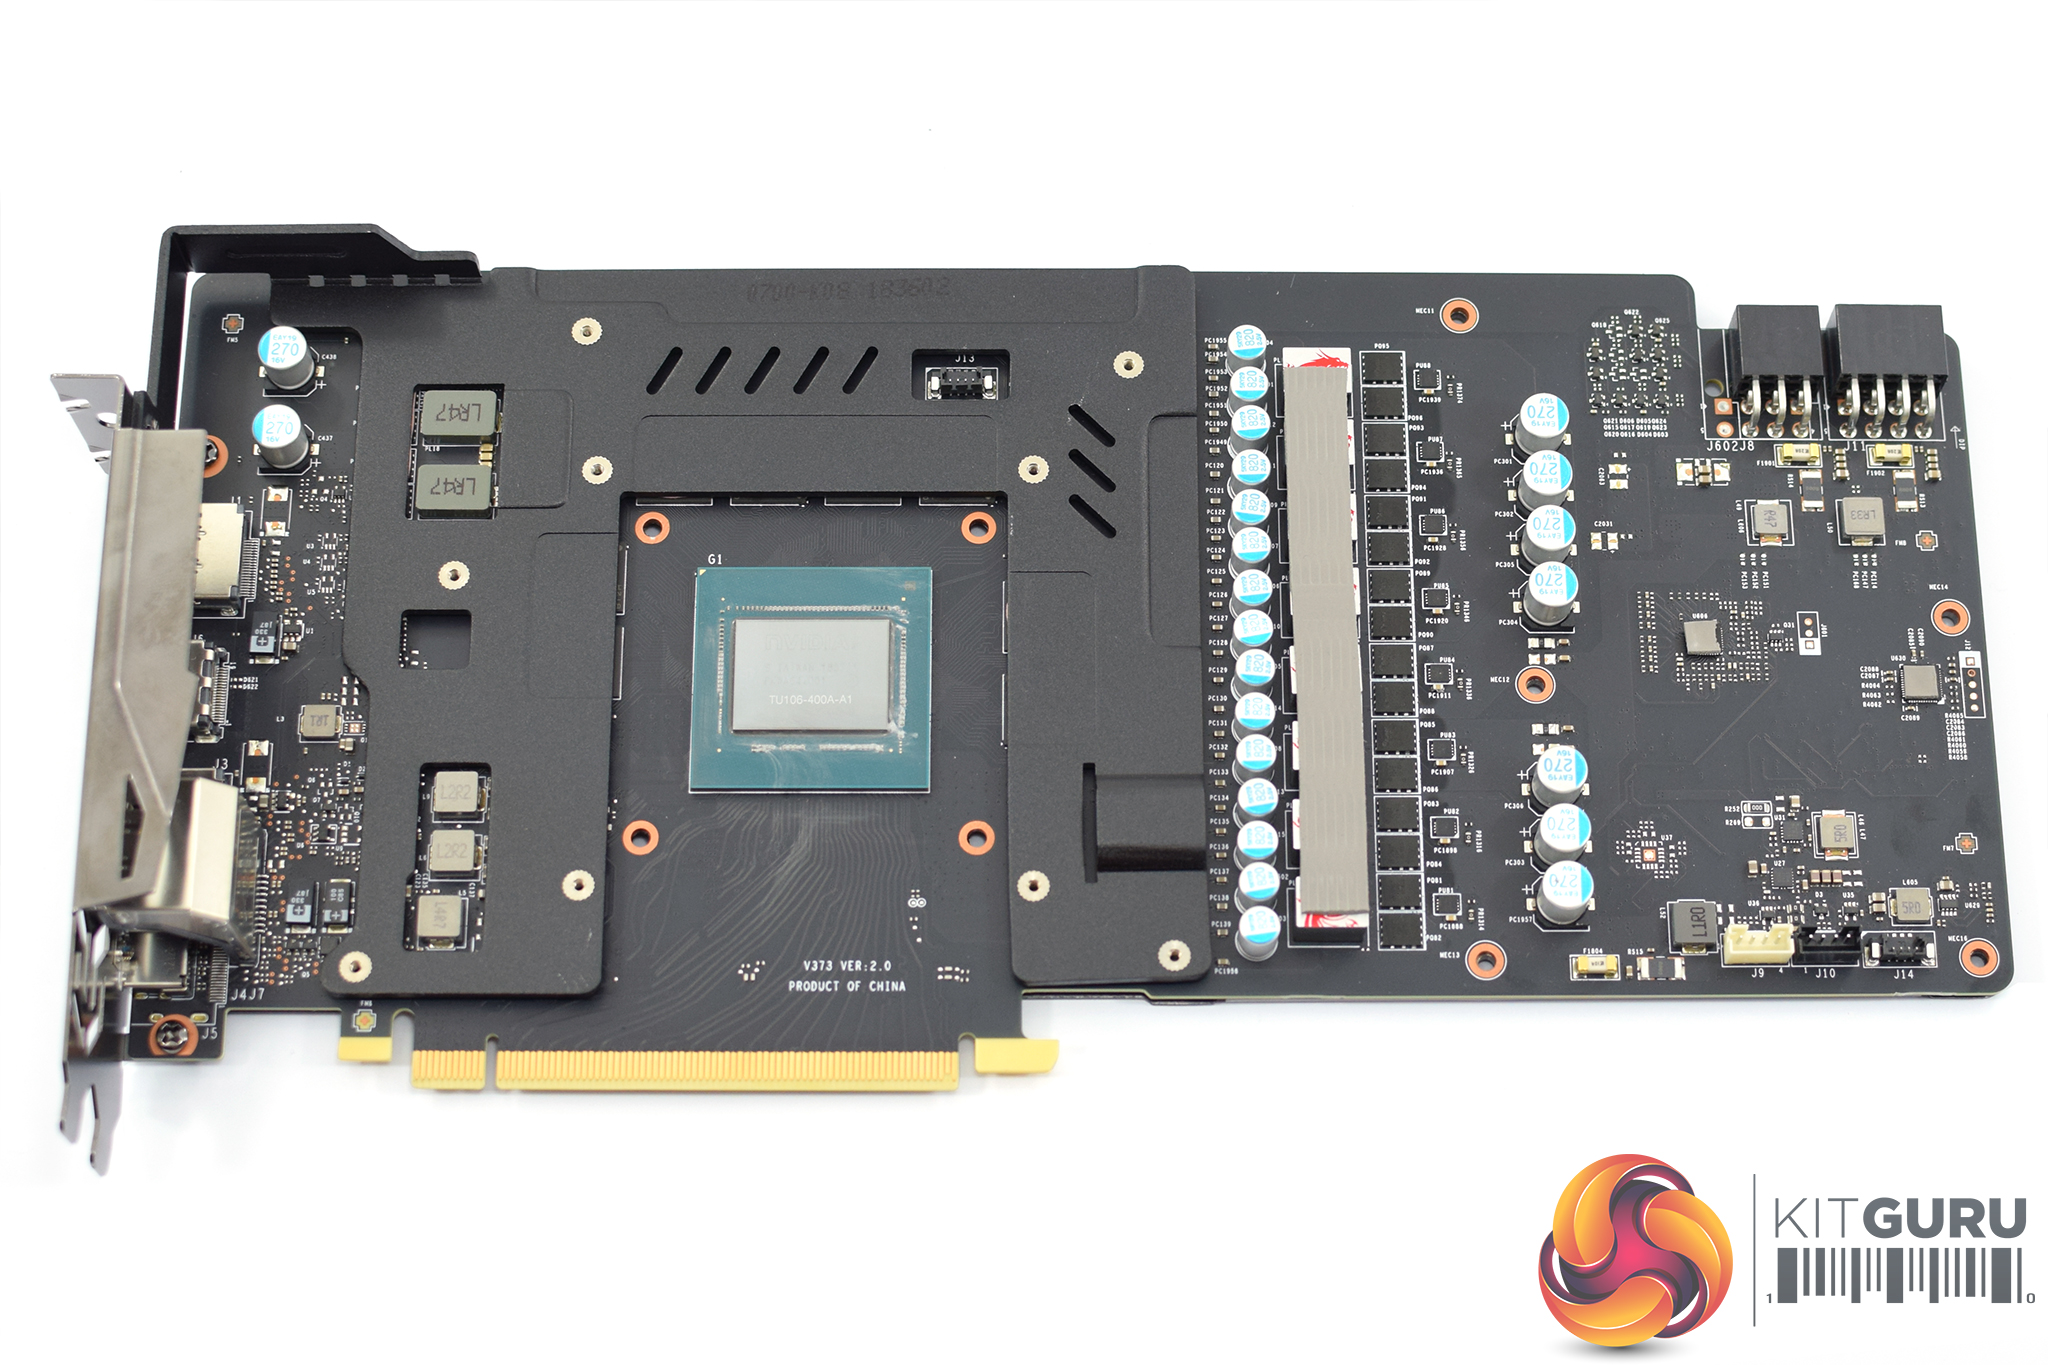
Disassembly is slightly long-winded as you have to remove 18 screws from the back of the card. Once you do that, the heatsink pulls free and we can note the use of a die-cast metal frame which covers the VRAM chips and some power circuitry – similar to the frame we saw on the ASUS Strix RTX 2080. This is what MSI calls a ‘close quarters heatsink' as it cools those VRAM chips, though it also provides some extra structural rigidity to help prevent sagging.
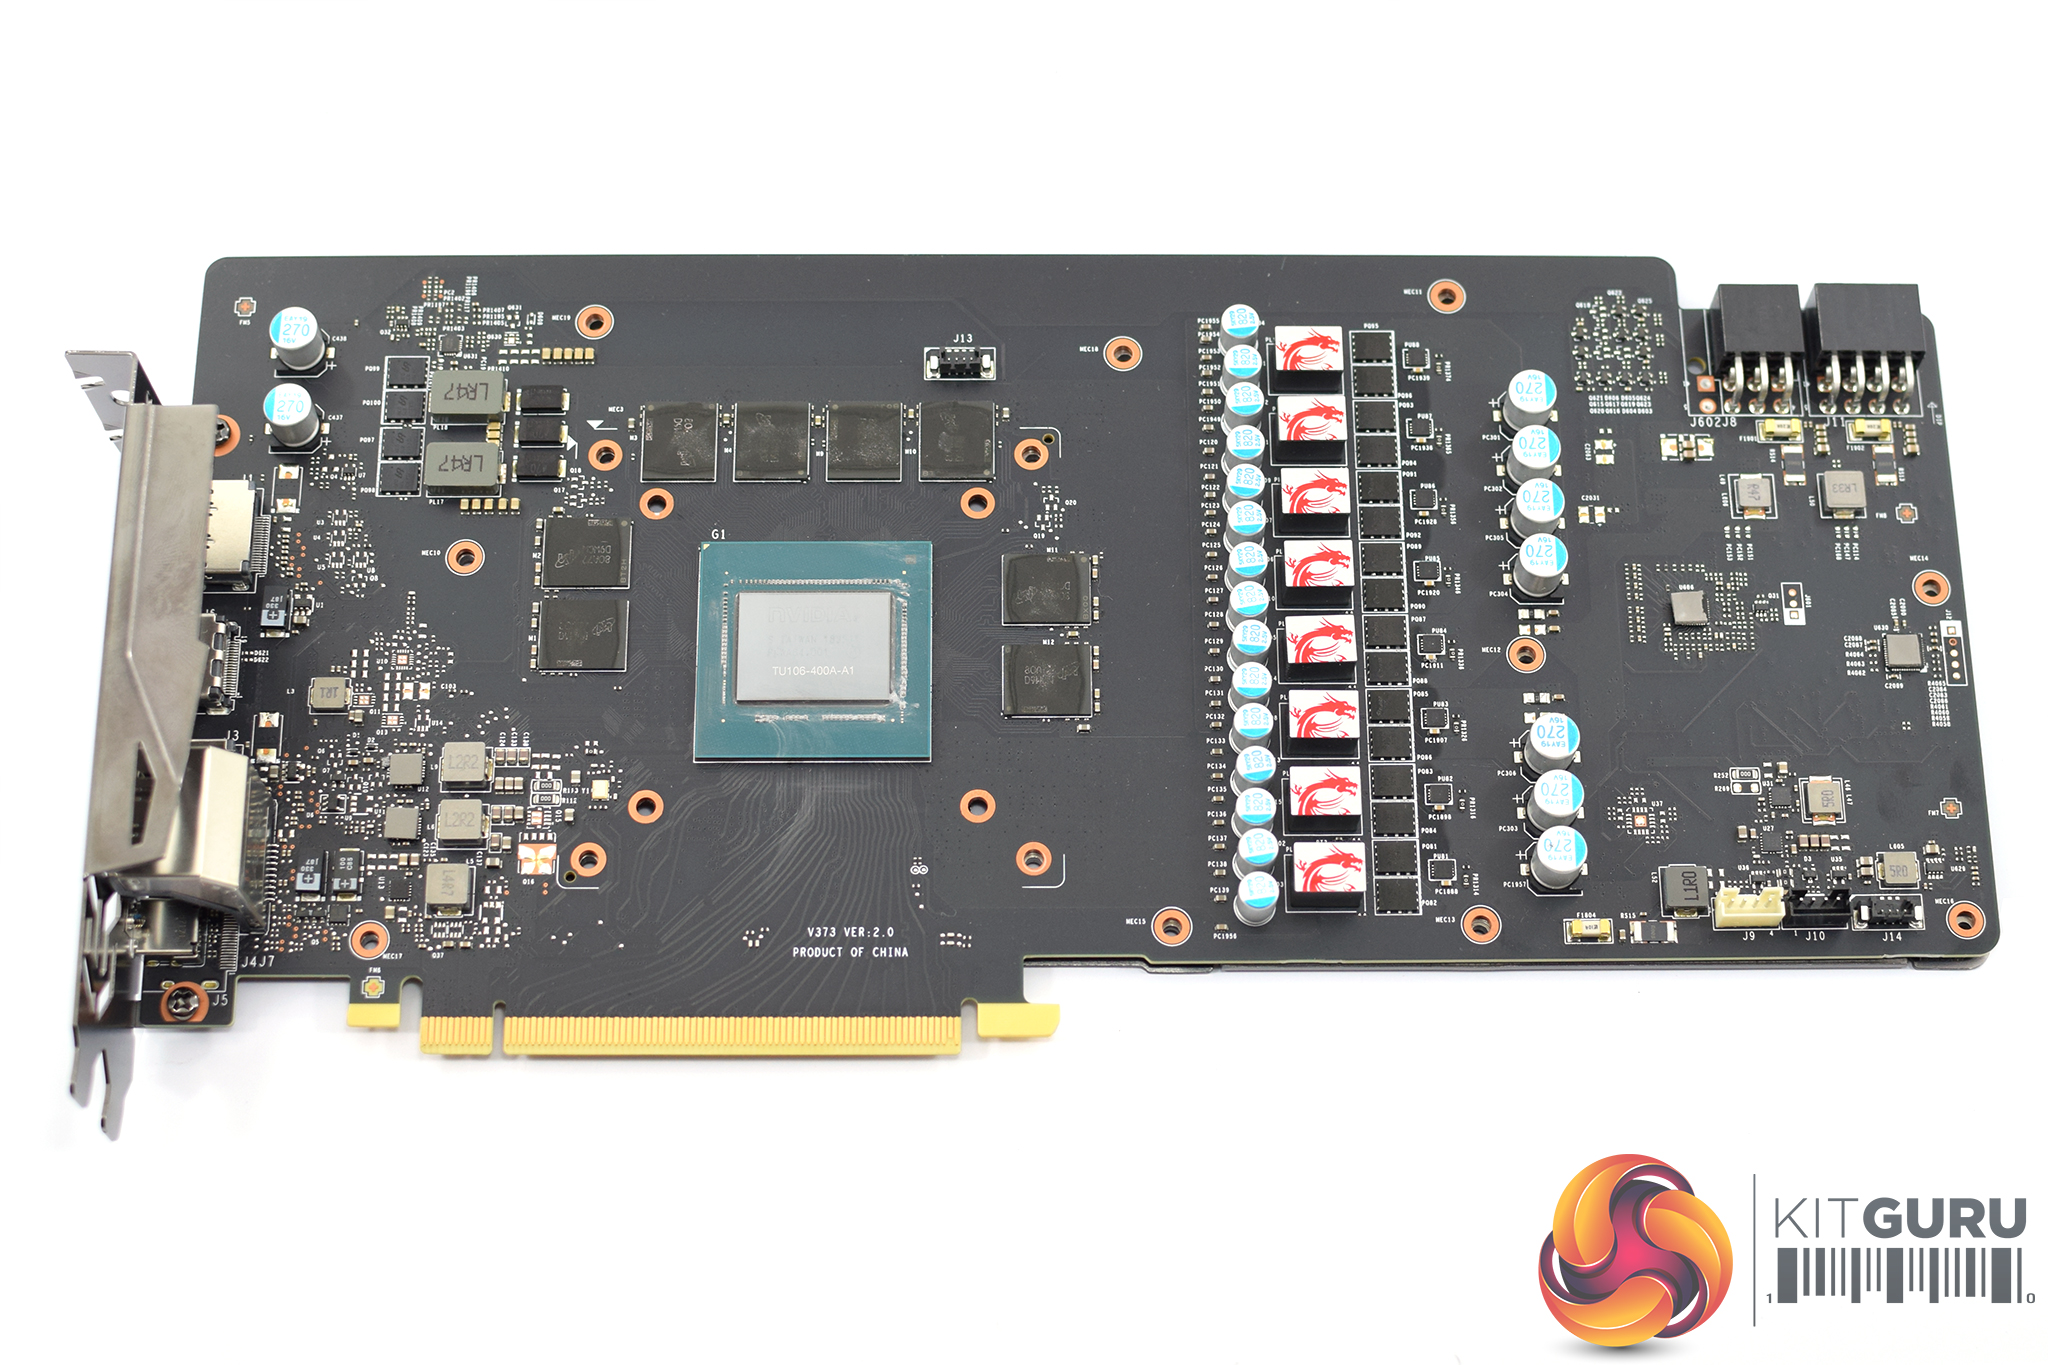
That frame is removed by unscrewing two screws from the I/O bracket, and then we get a look at the PCB in all its glory. You will note that this is a custom board with an enhanced 8+2 power phase design – Nvidia's Founders Edition 2070 uses 6 power phases for the GPU, although I am not sure about the memory power delivery. I am also appreciative of the dragon design MSI has used on its inductors.
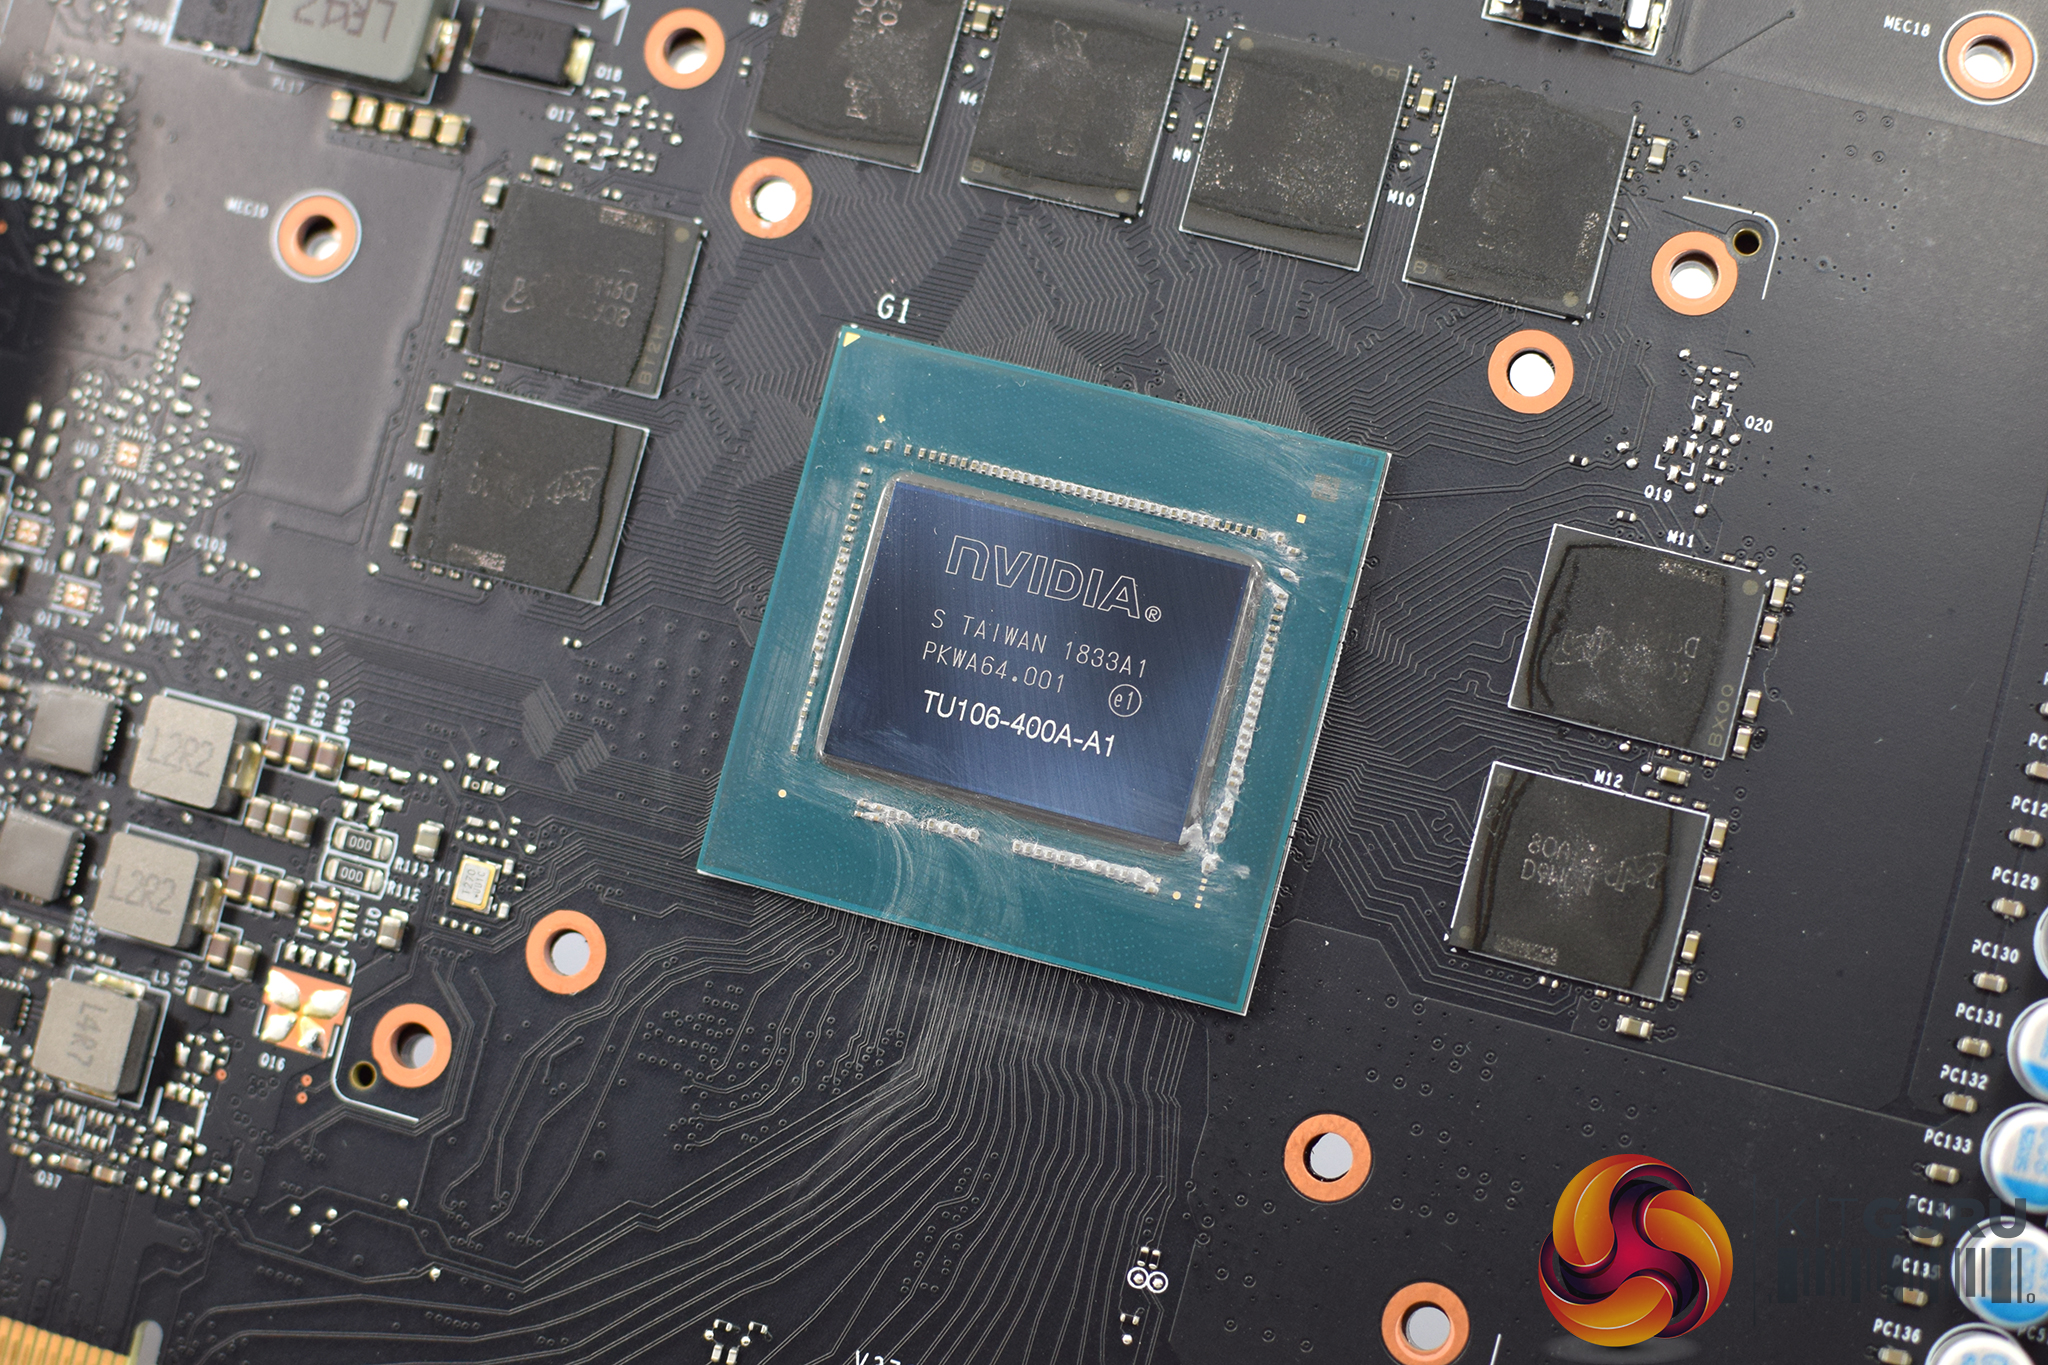
Elsewhere, the GPU die is labelled ‘TU106-400A', with the A denoting that this is a binned chip suitable to be sold with a factory overclock. Non-A chips have to be sold by Nvidia's partners at reference clocks. The eagle-eyed among you will also have noticed the TU106 die is a little bit smaller and more rectangular than the TU104 chip used for RTX 2080 cards.
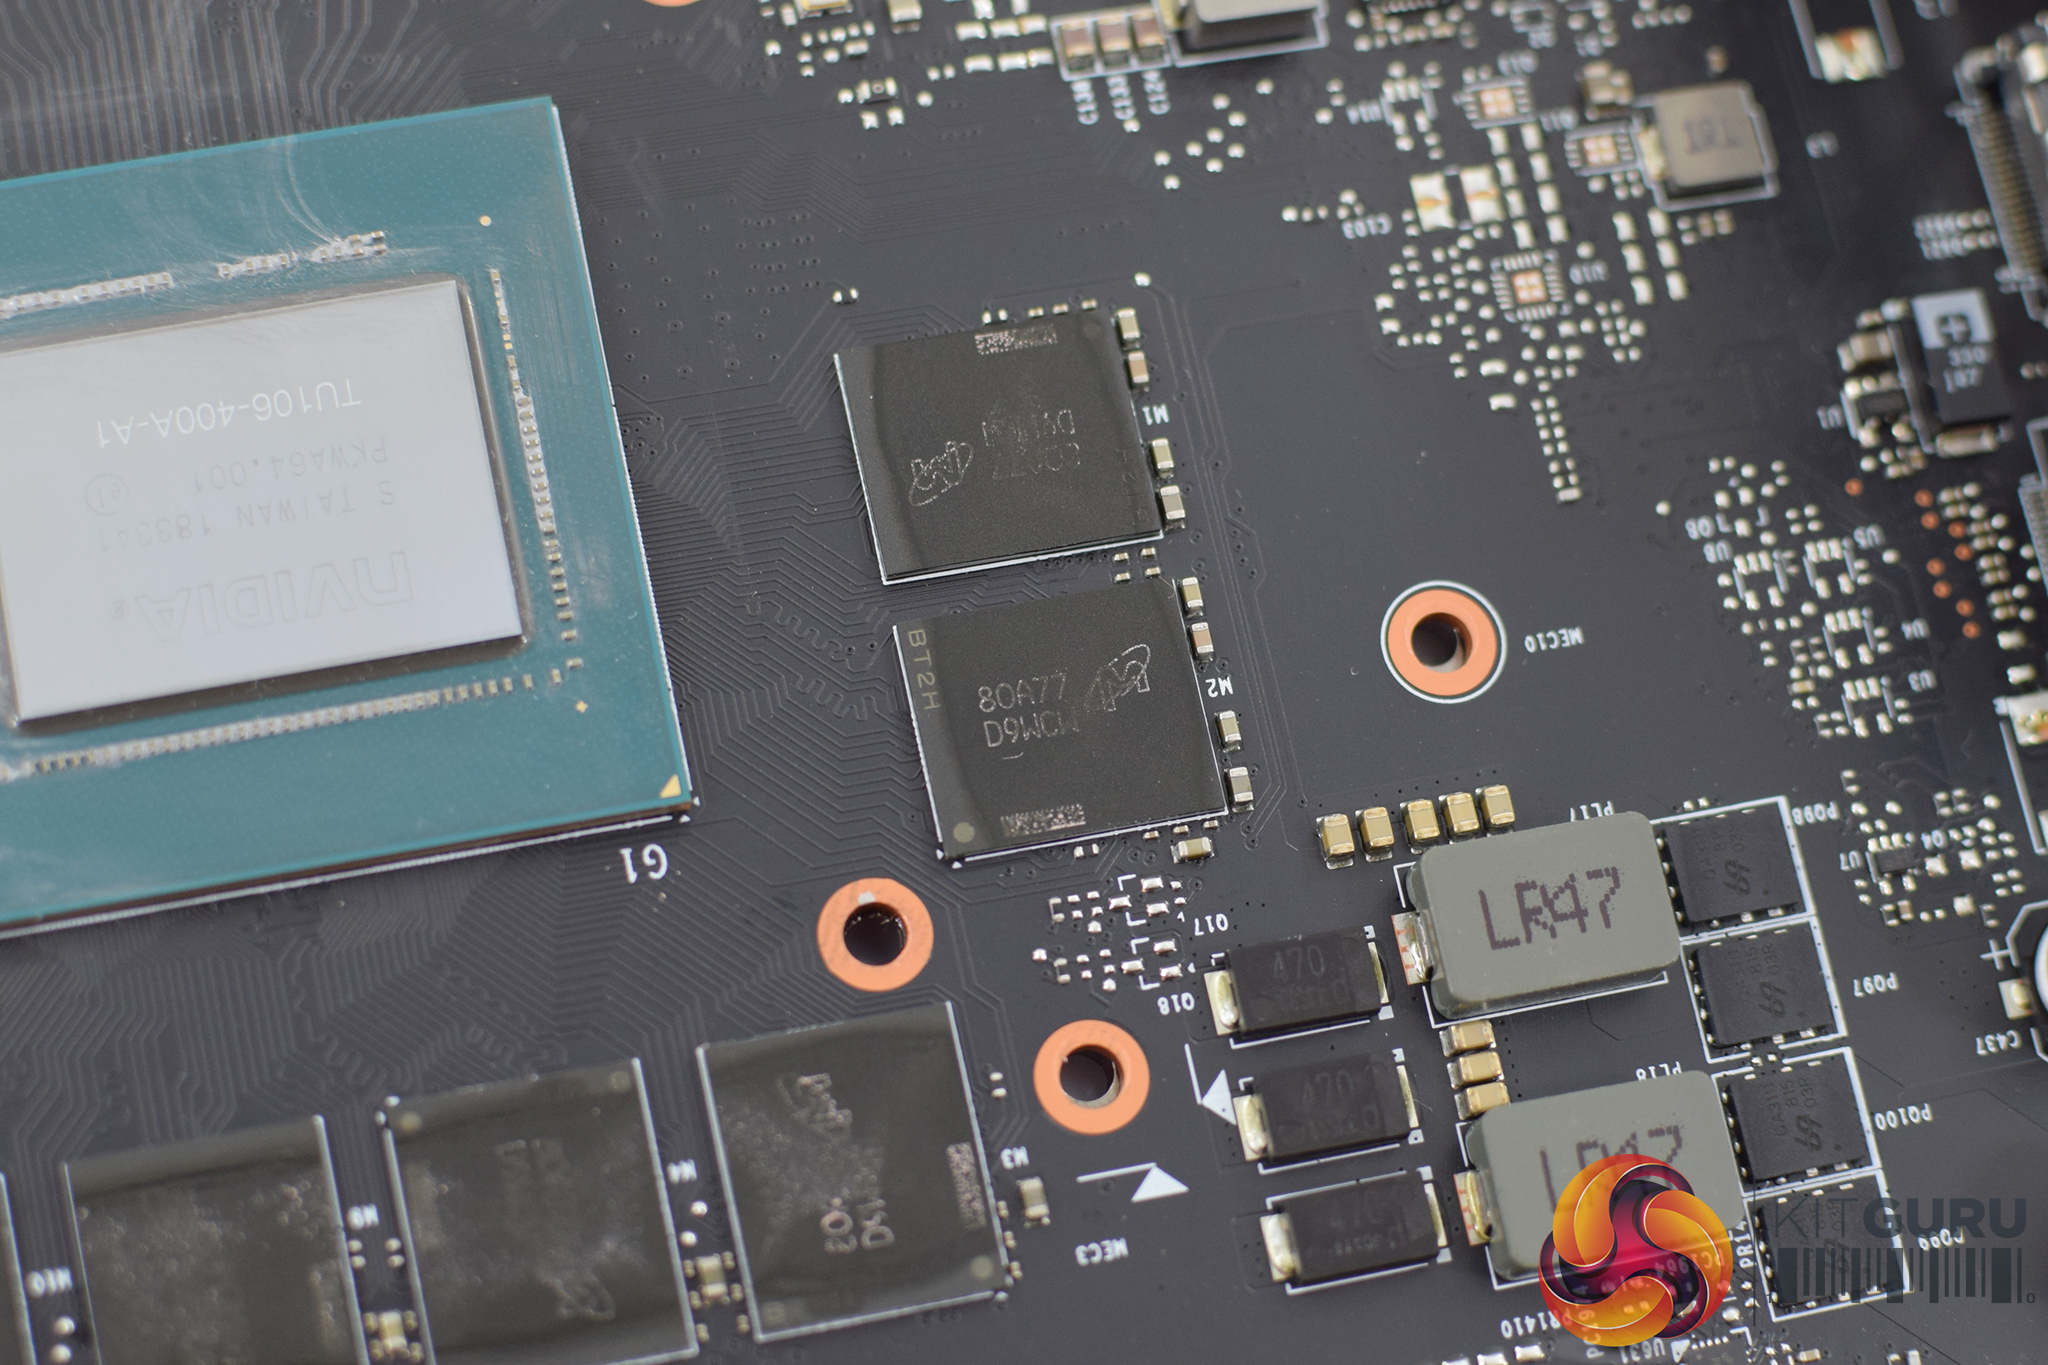
Lastly, memory is again provided by Micron with 8 GDDR6 chips. These are labelled ‘8OA77D9WCW'.
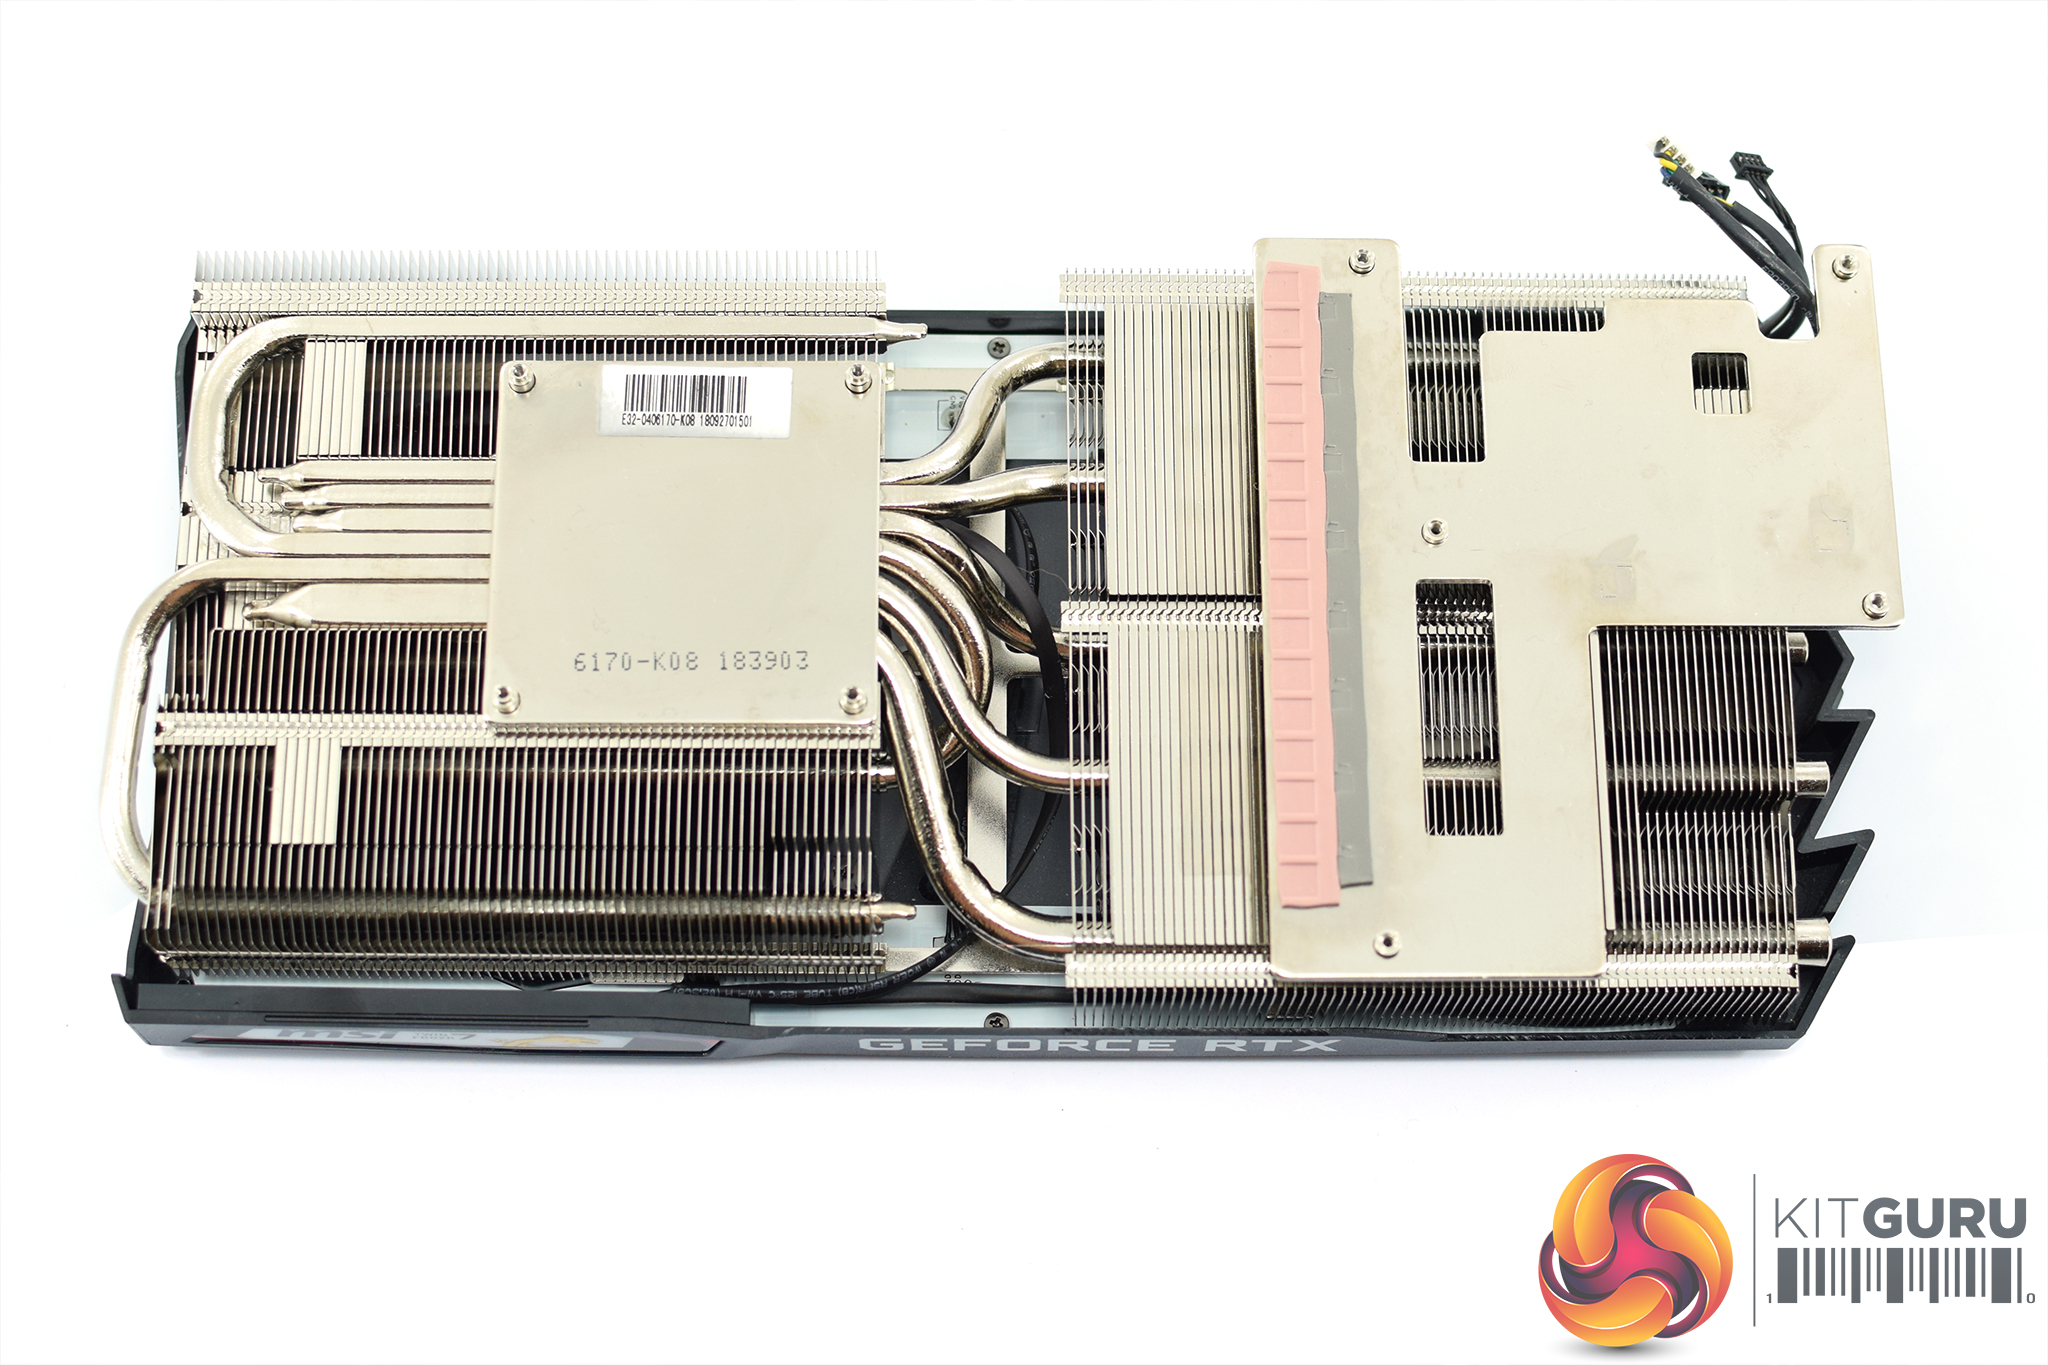
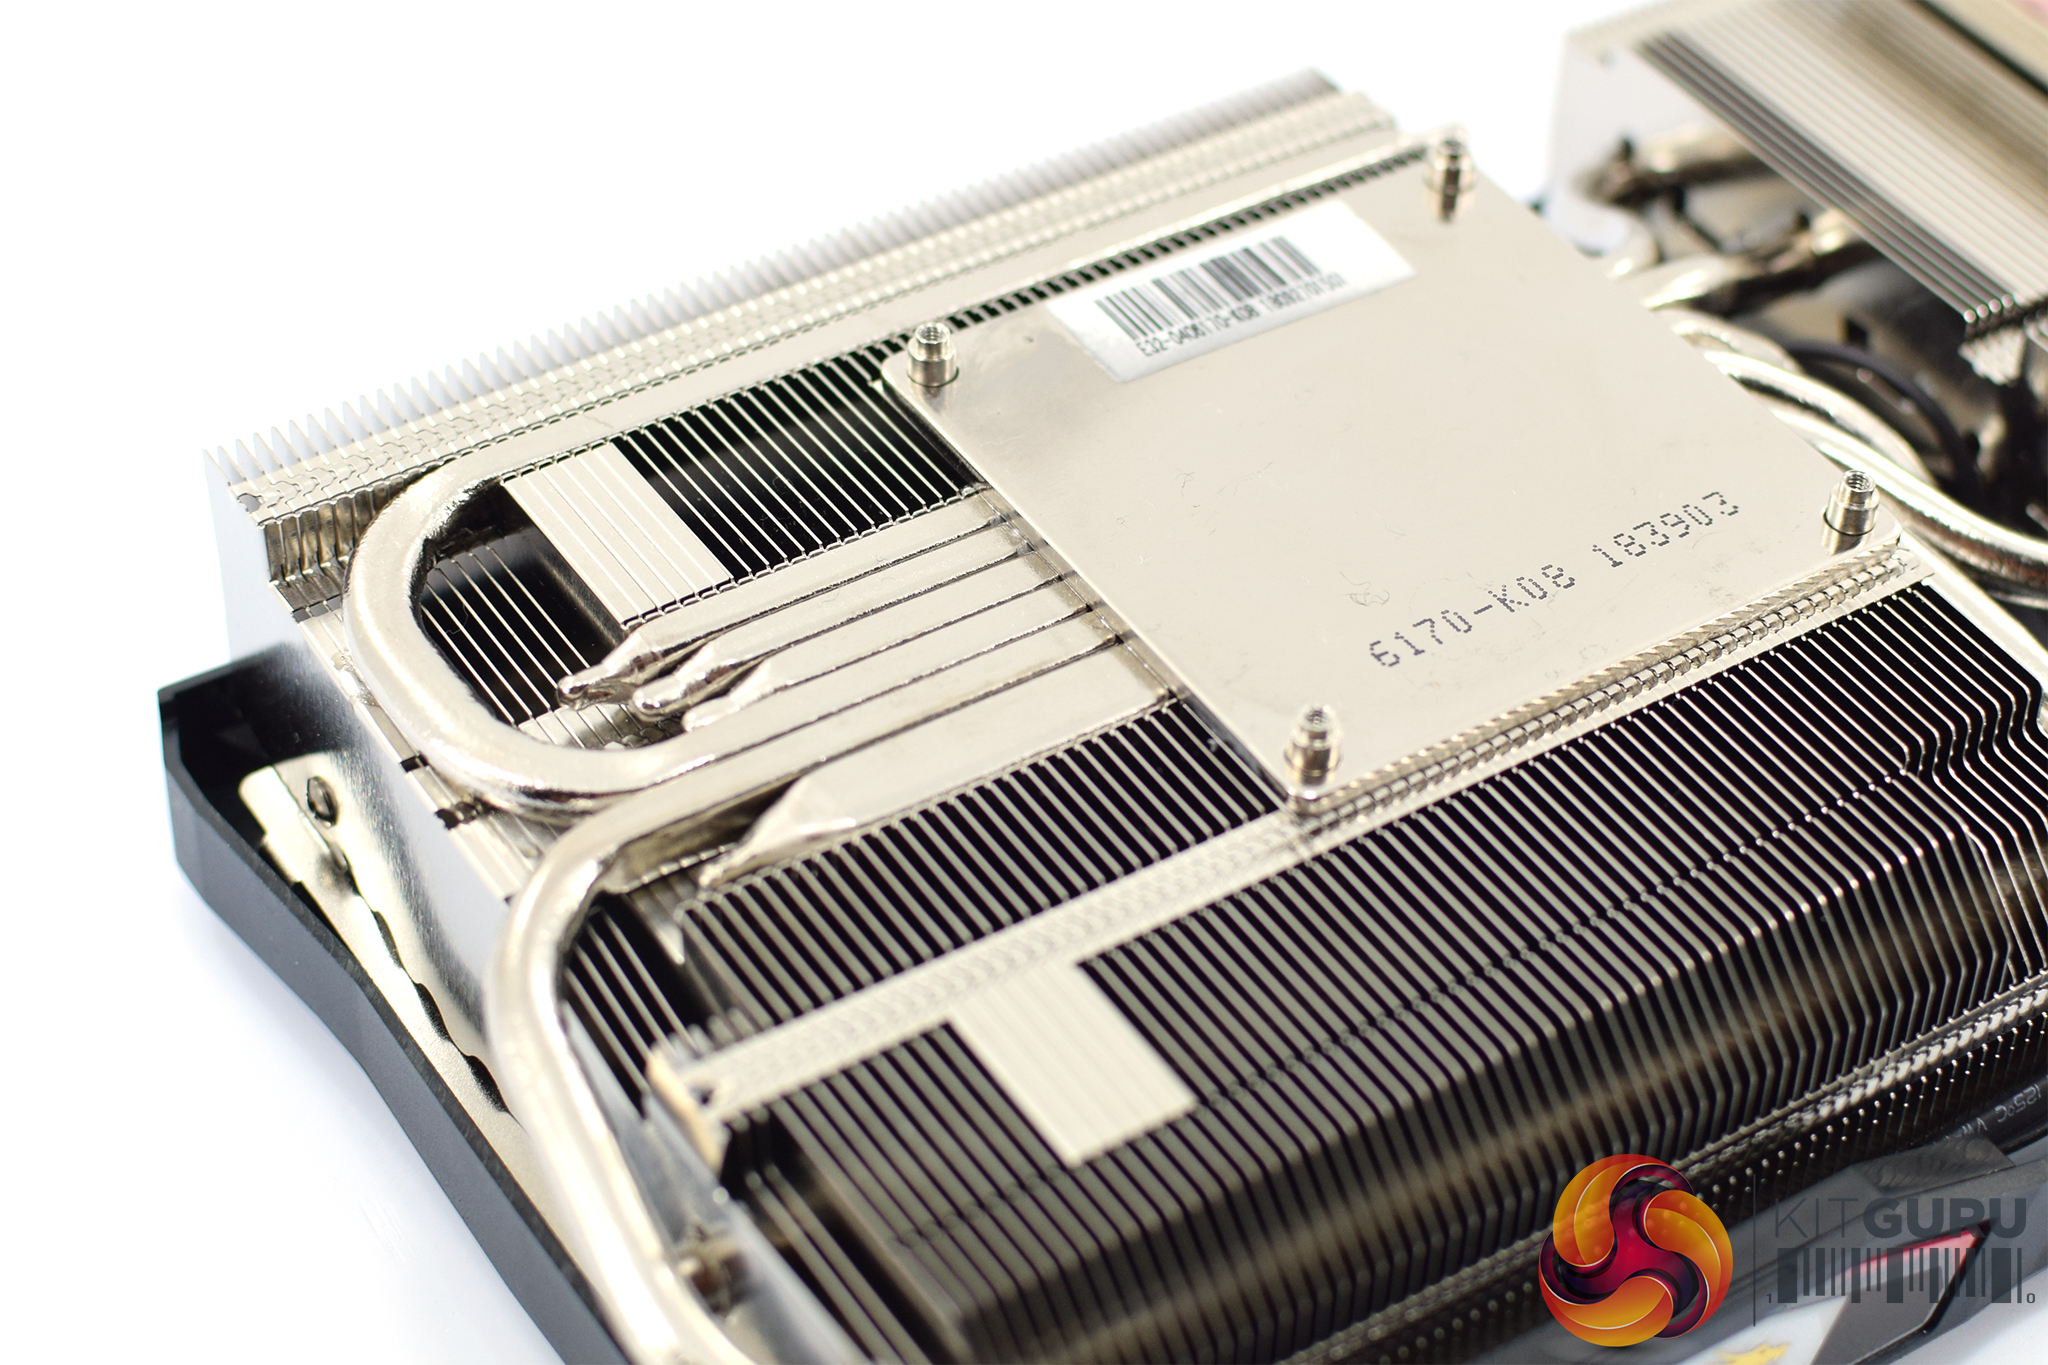
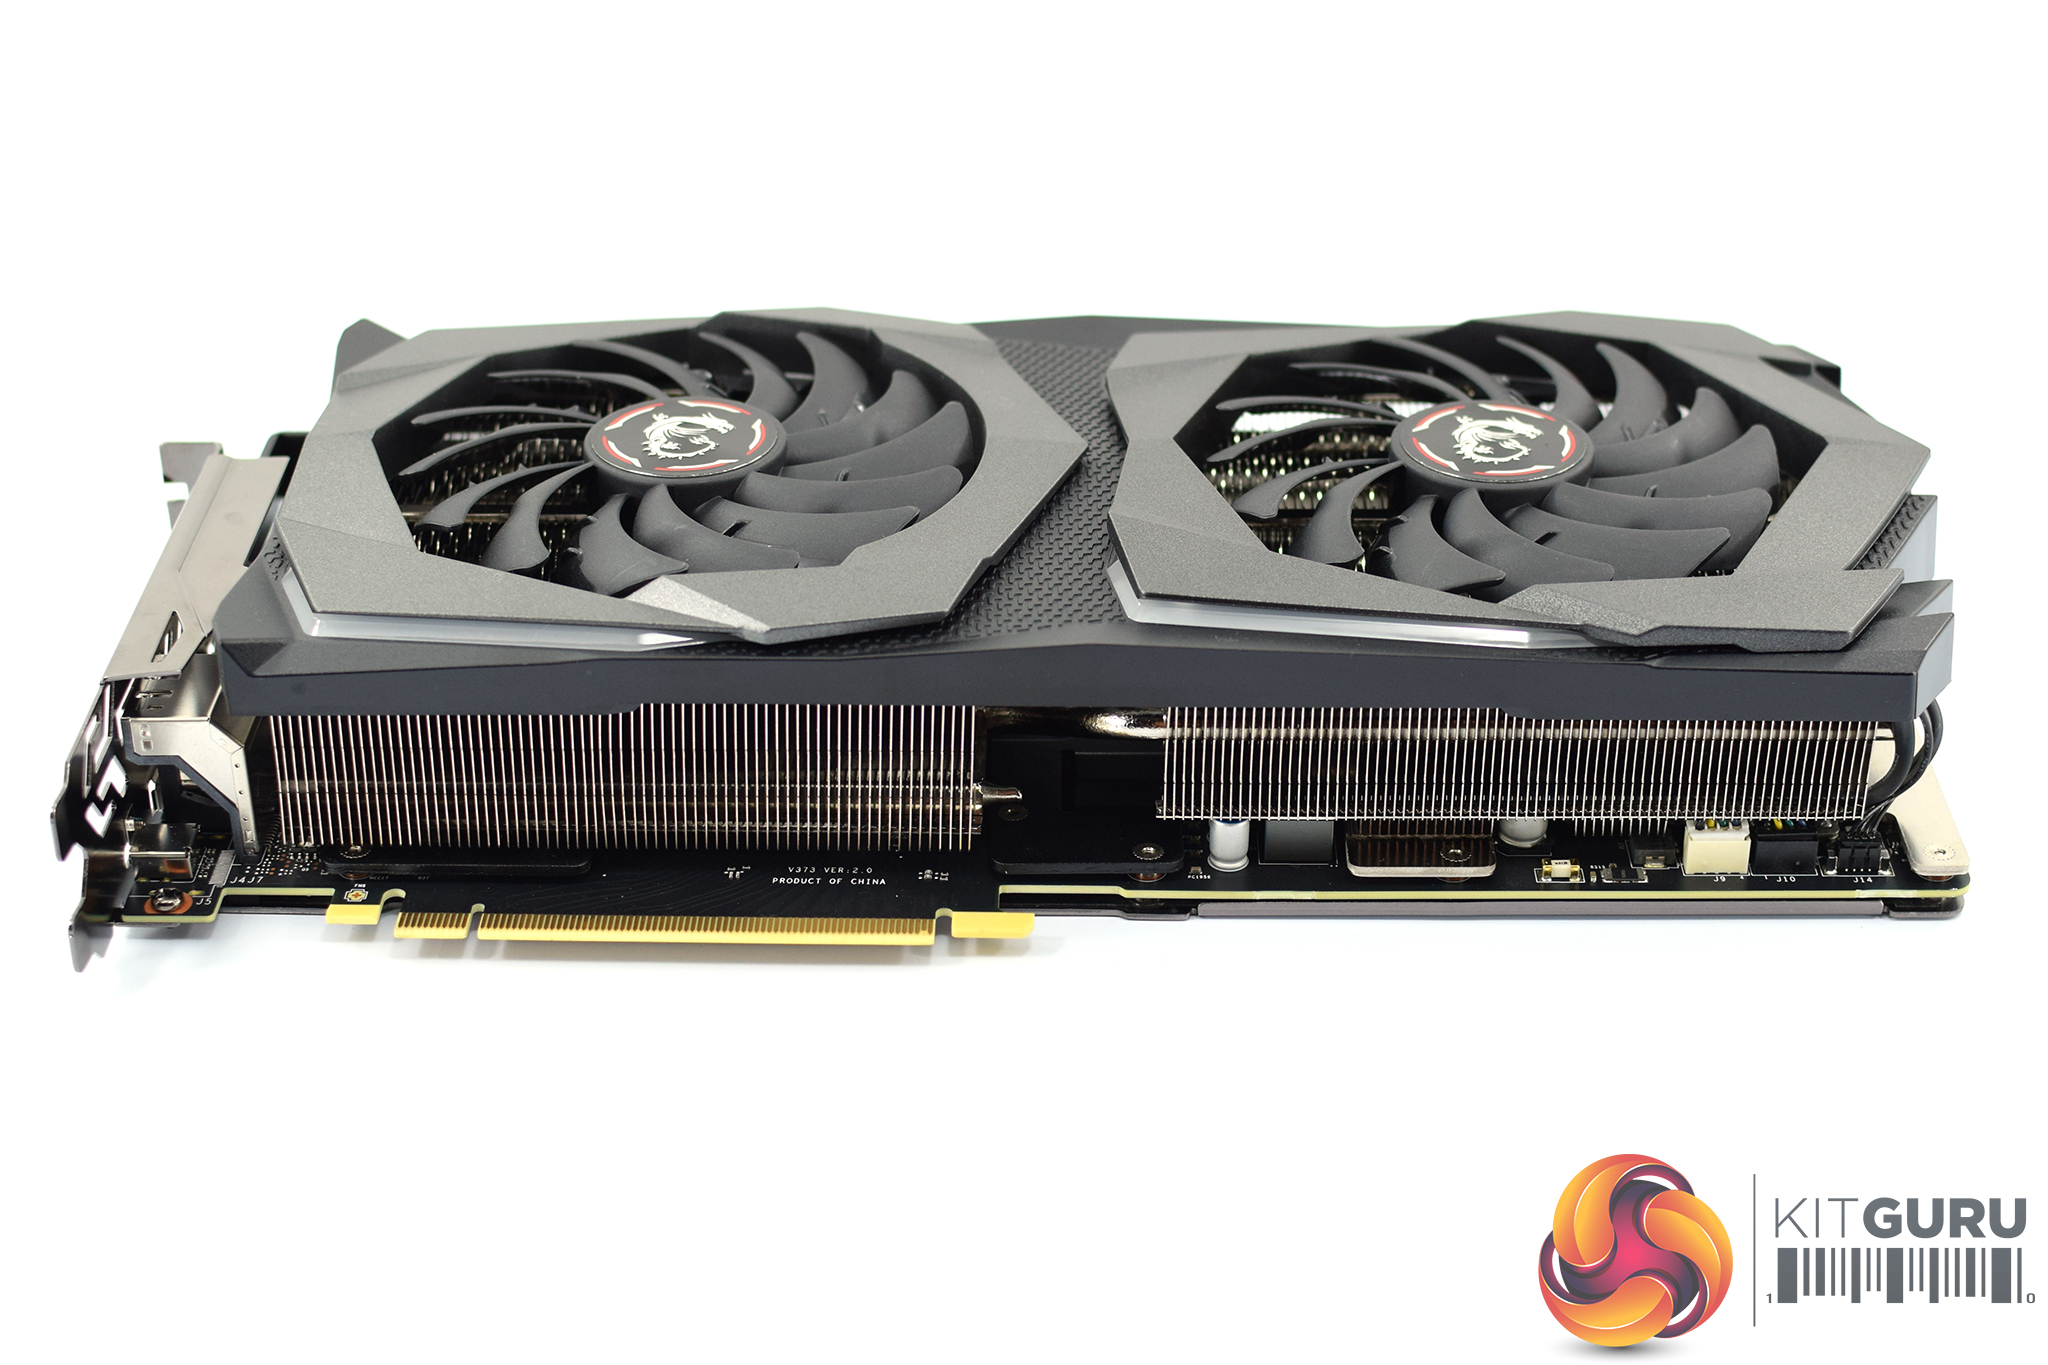
Cooling the GPU and VRM is MSI's 7th-generation Twin Frozr heatsink. This uses 6 nickel-plated heatpipes (which appear to be comprised of 1x 8mm and 5x 6mm pipes) and a nickel-plated copper baseplate to cool the GPU. MSI also says its heatpipes are as compact as possible where they touch the copper baseplate to ensure maximum thermal transfer.
Elsewhere, we have a hefty aluminium fin stack as is standard, and a secondary baseplate to cool the MOSFETs and additional power circuitry. The inductors contact directly to the fin stack via a thermal pad.
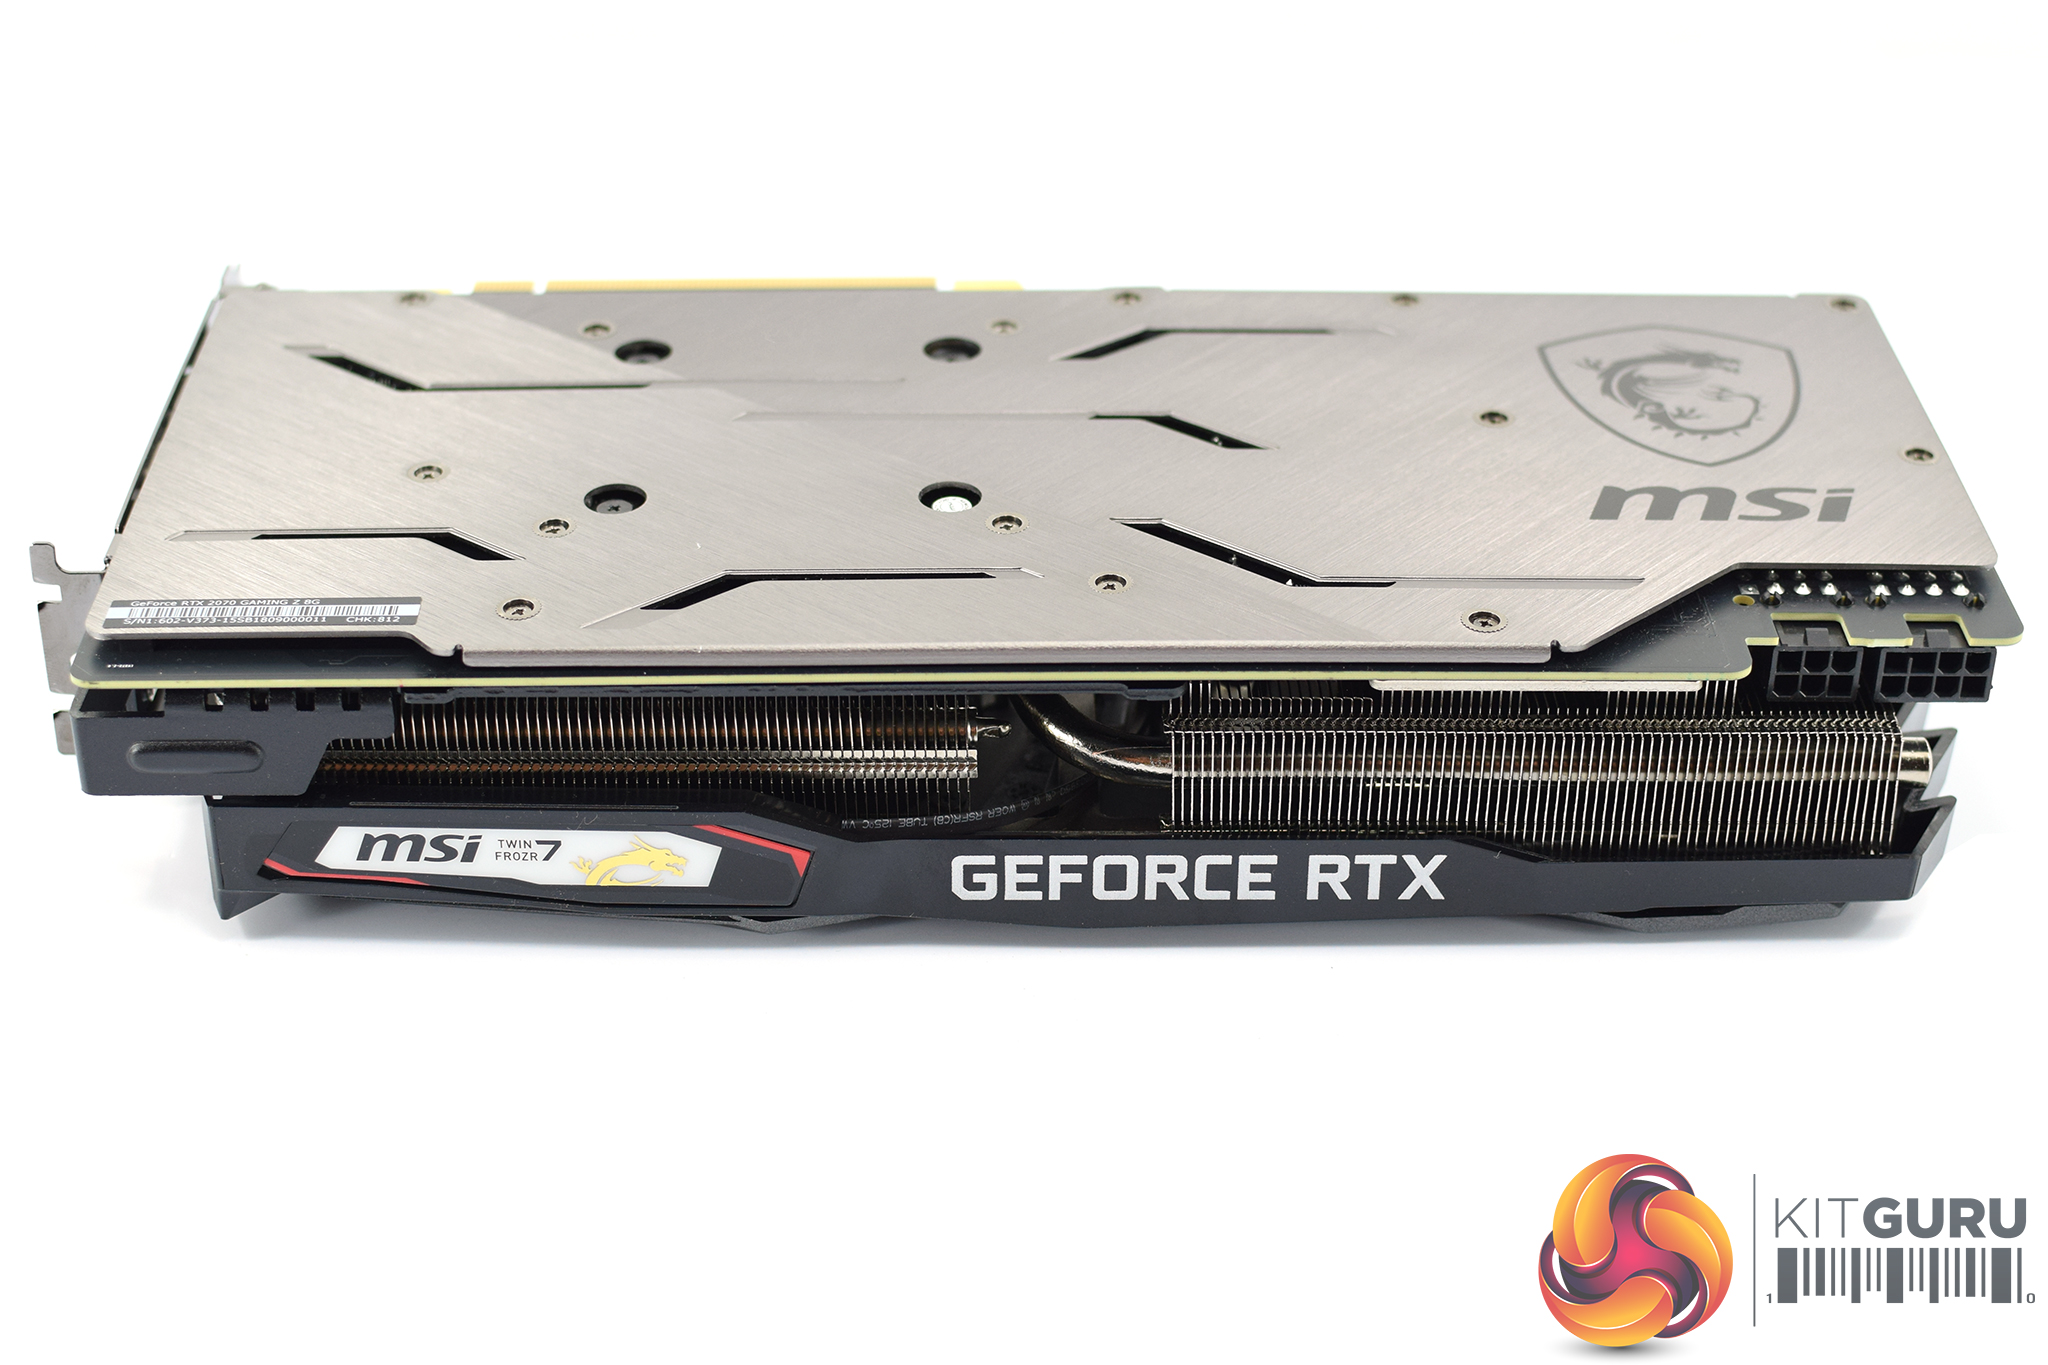
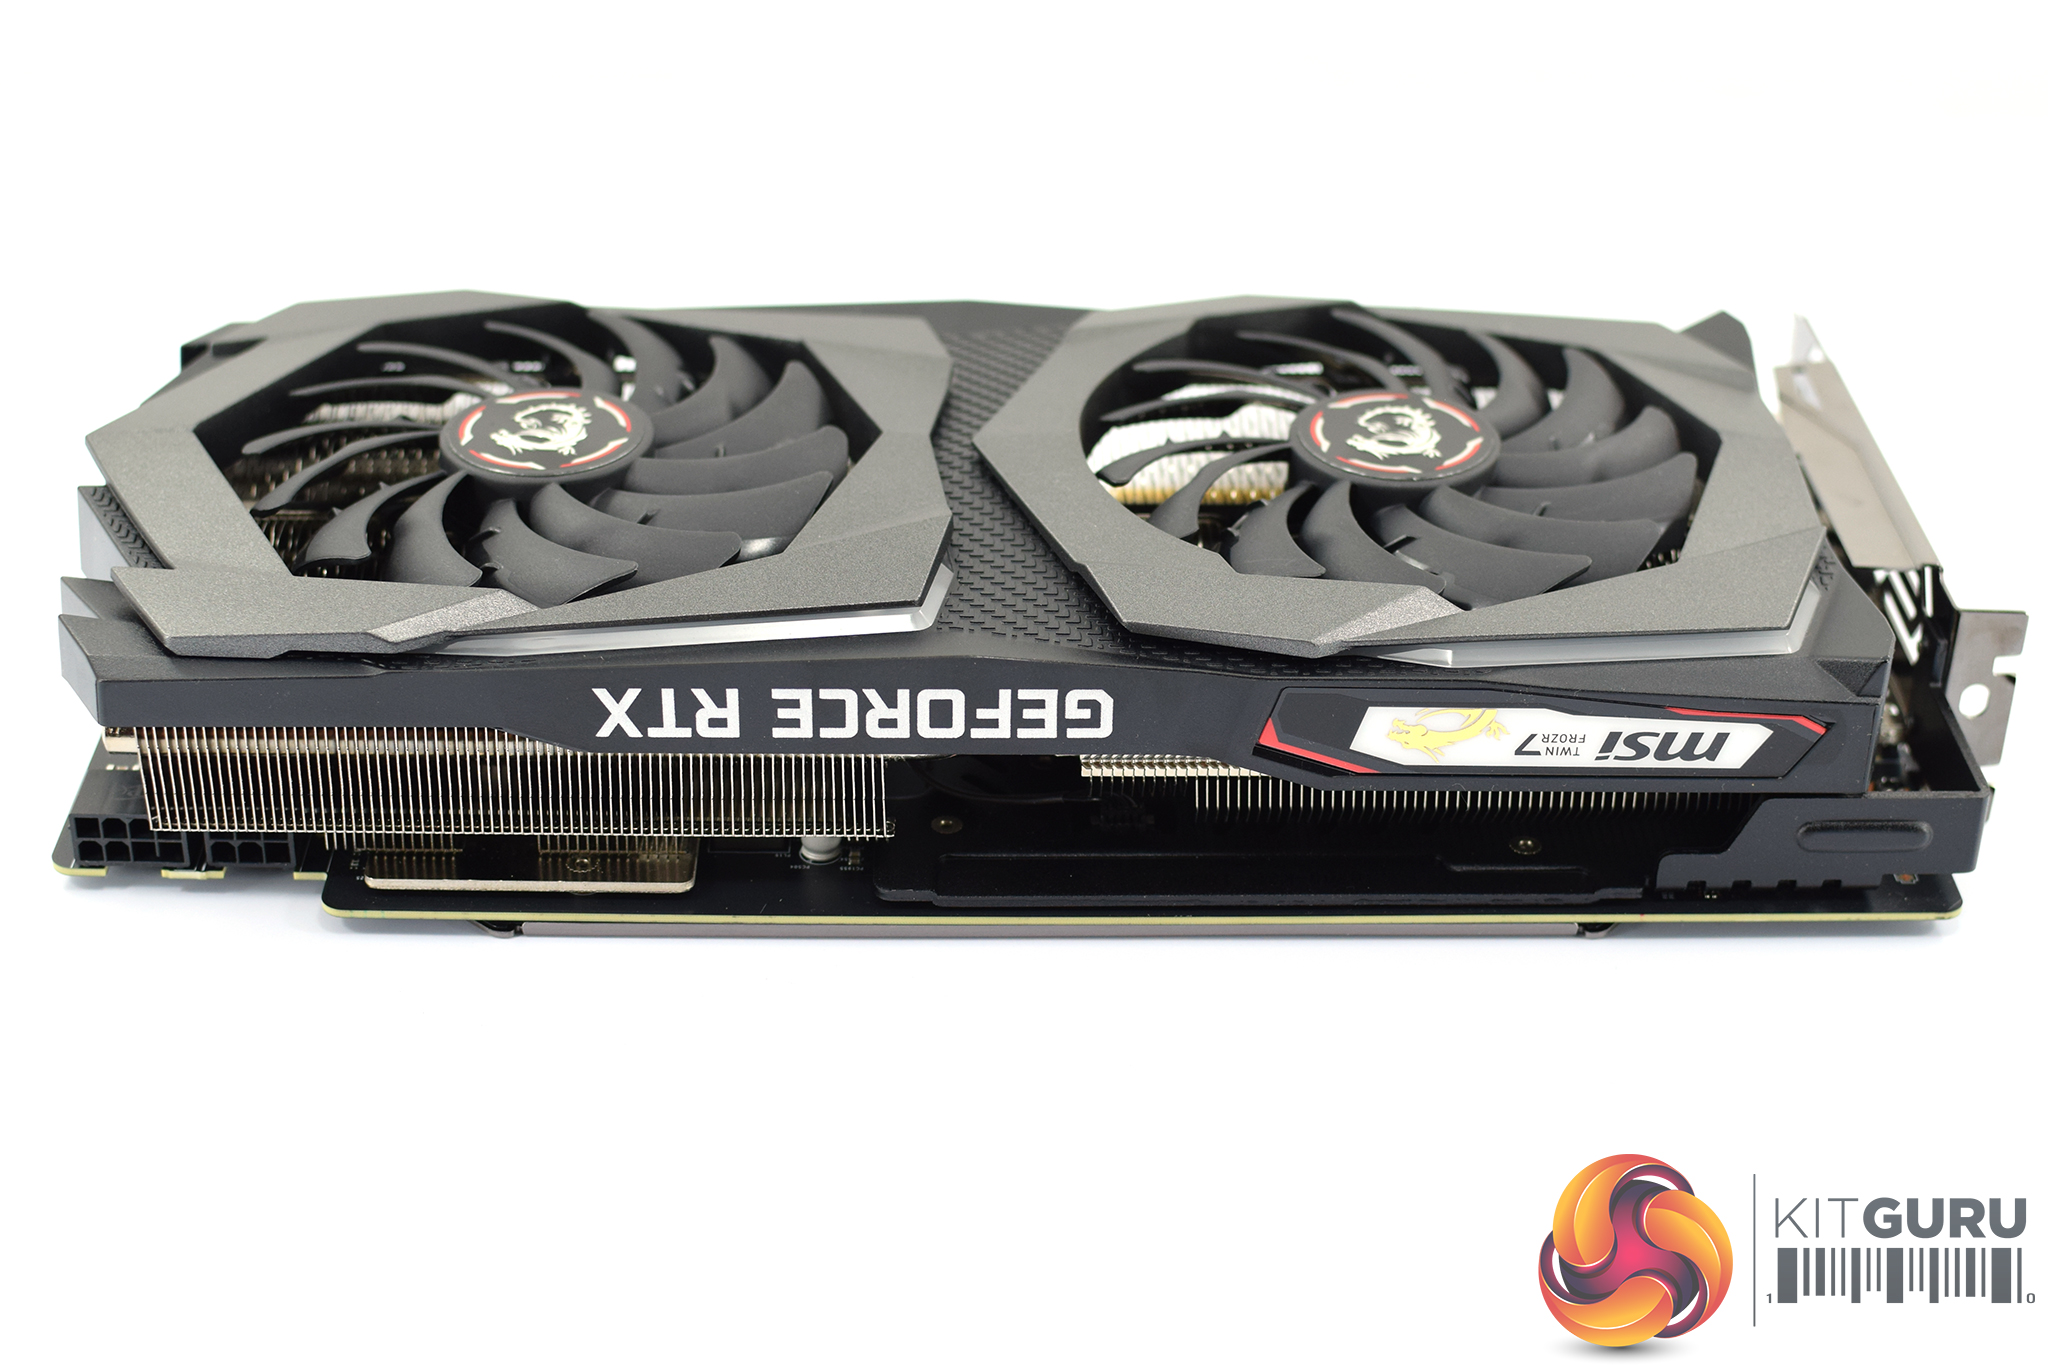
Moving over to the front side of the card, here you will notice there is no NVLink connector or SLI finger – with the new RTX 20-series cards, two-way SLI is only supported with the RTX 2080 and RTX 2080 Ti. The MSI logo on the left-hand side is one of the RGB lighting zones, while there is also some GeForce RTX branding in the middle of the card.
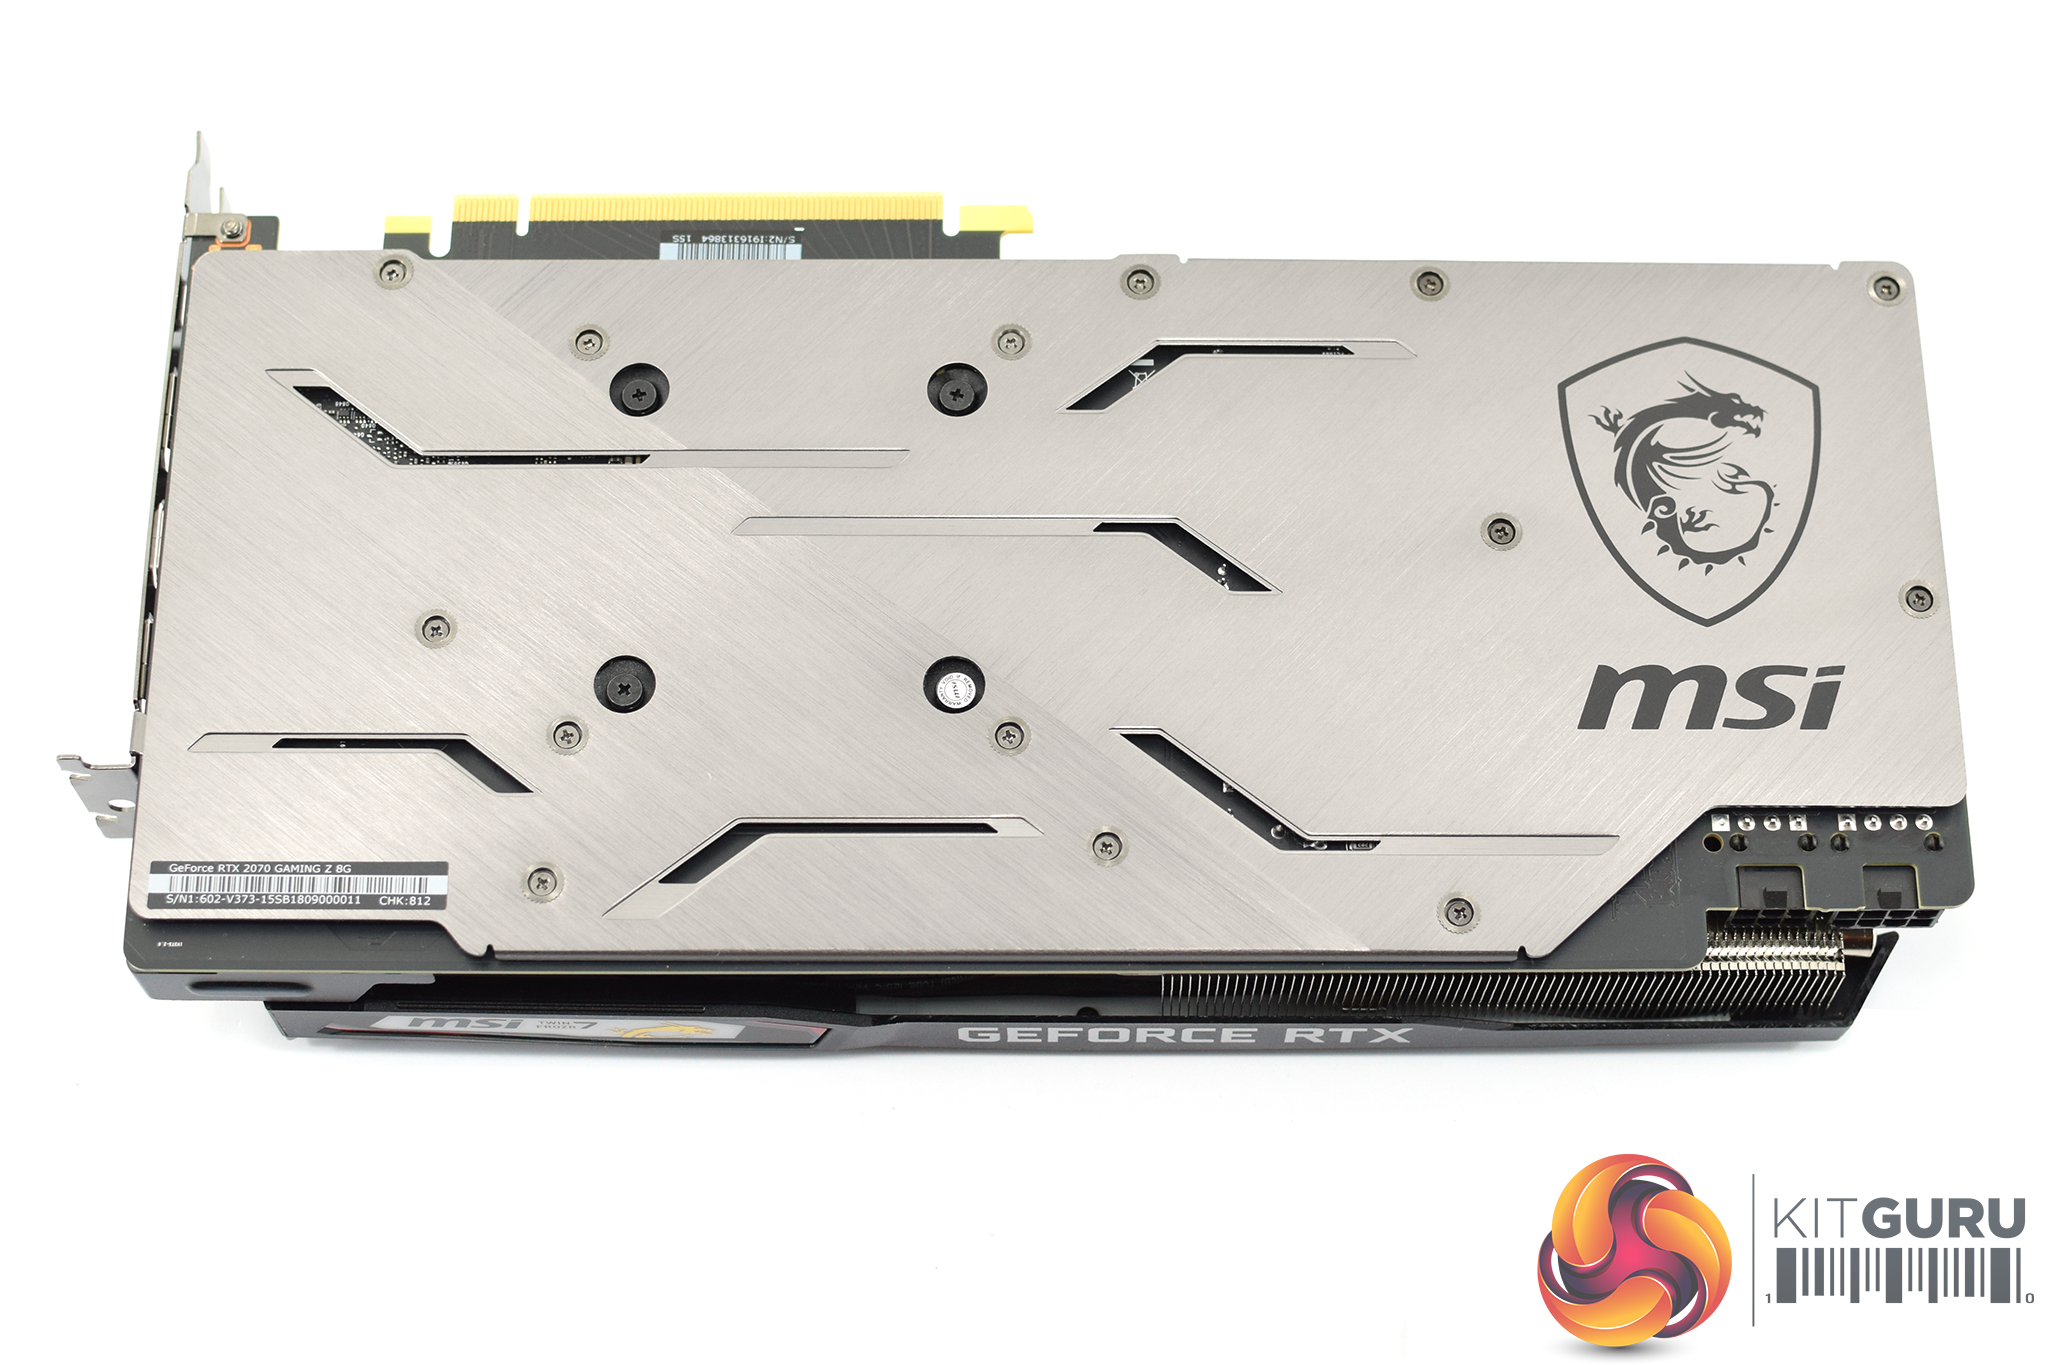
In terms of the backplate, I have to say MSI has made it look very stylish. It's a light grey brushed metal backplate, but because the metal is brushed in two different directions, depending on how light hits the backplate it gives it a very stylish two-tone look. This isn't best demonstrated above as our bright studio lights ensure the backplate is evenly lit, but be sure to watch our video on the first page to get a good look at this effect in action.
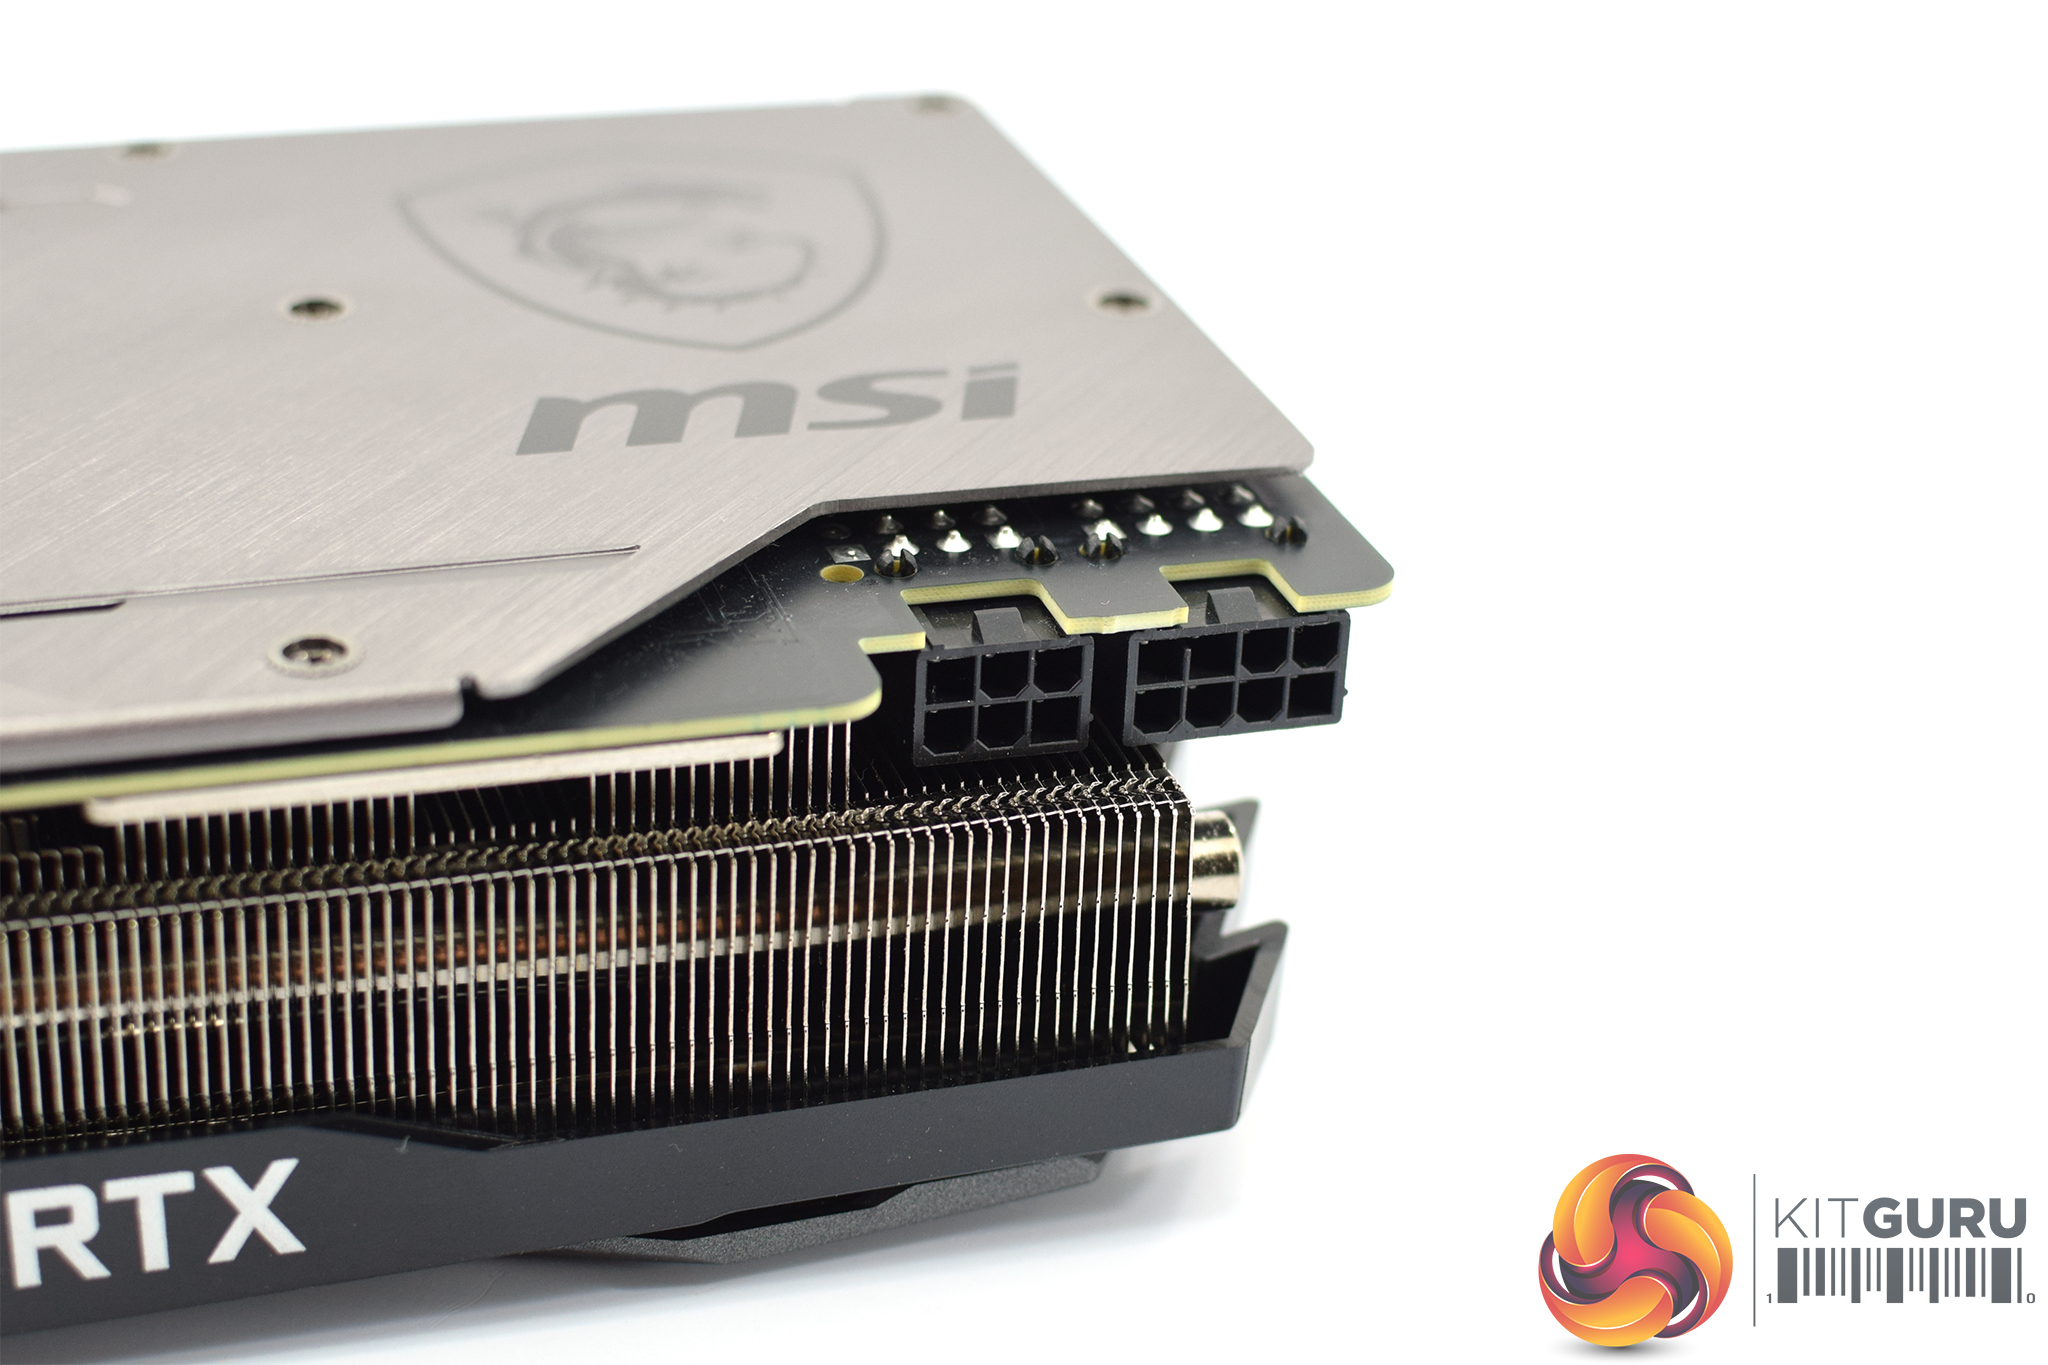
Here we can also see the power requirements for the Gaming Z – 1x 6-pin and 1x 8-pin PCIe power connectors. The Founders Edition 2070 only requires 1x 8pin.
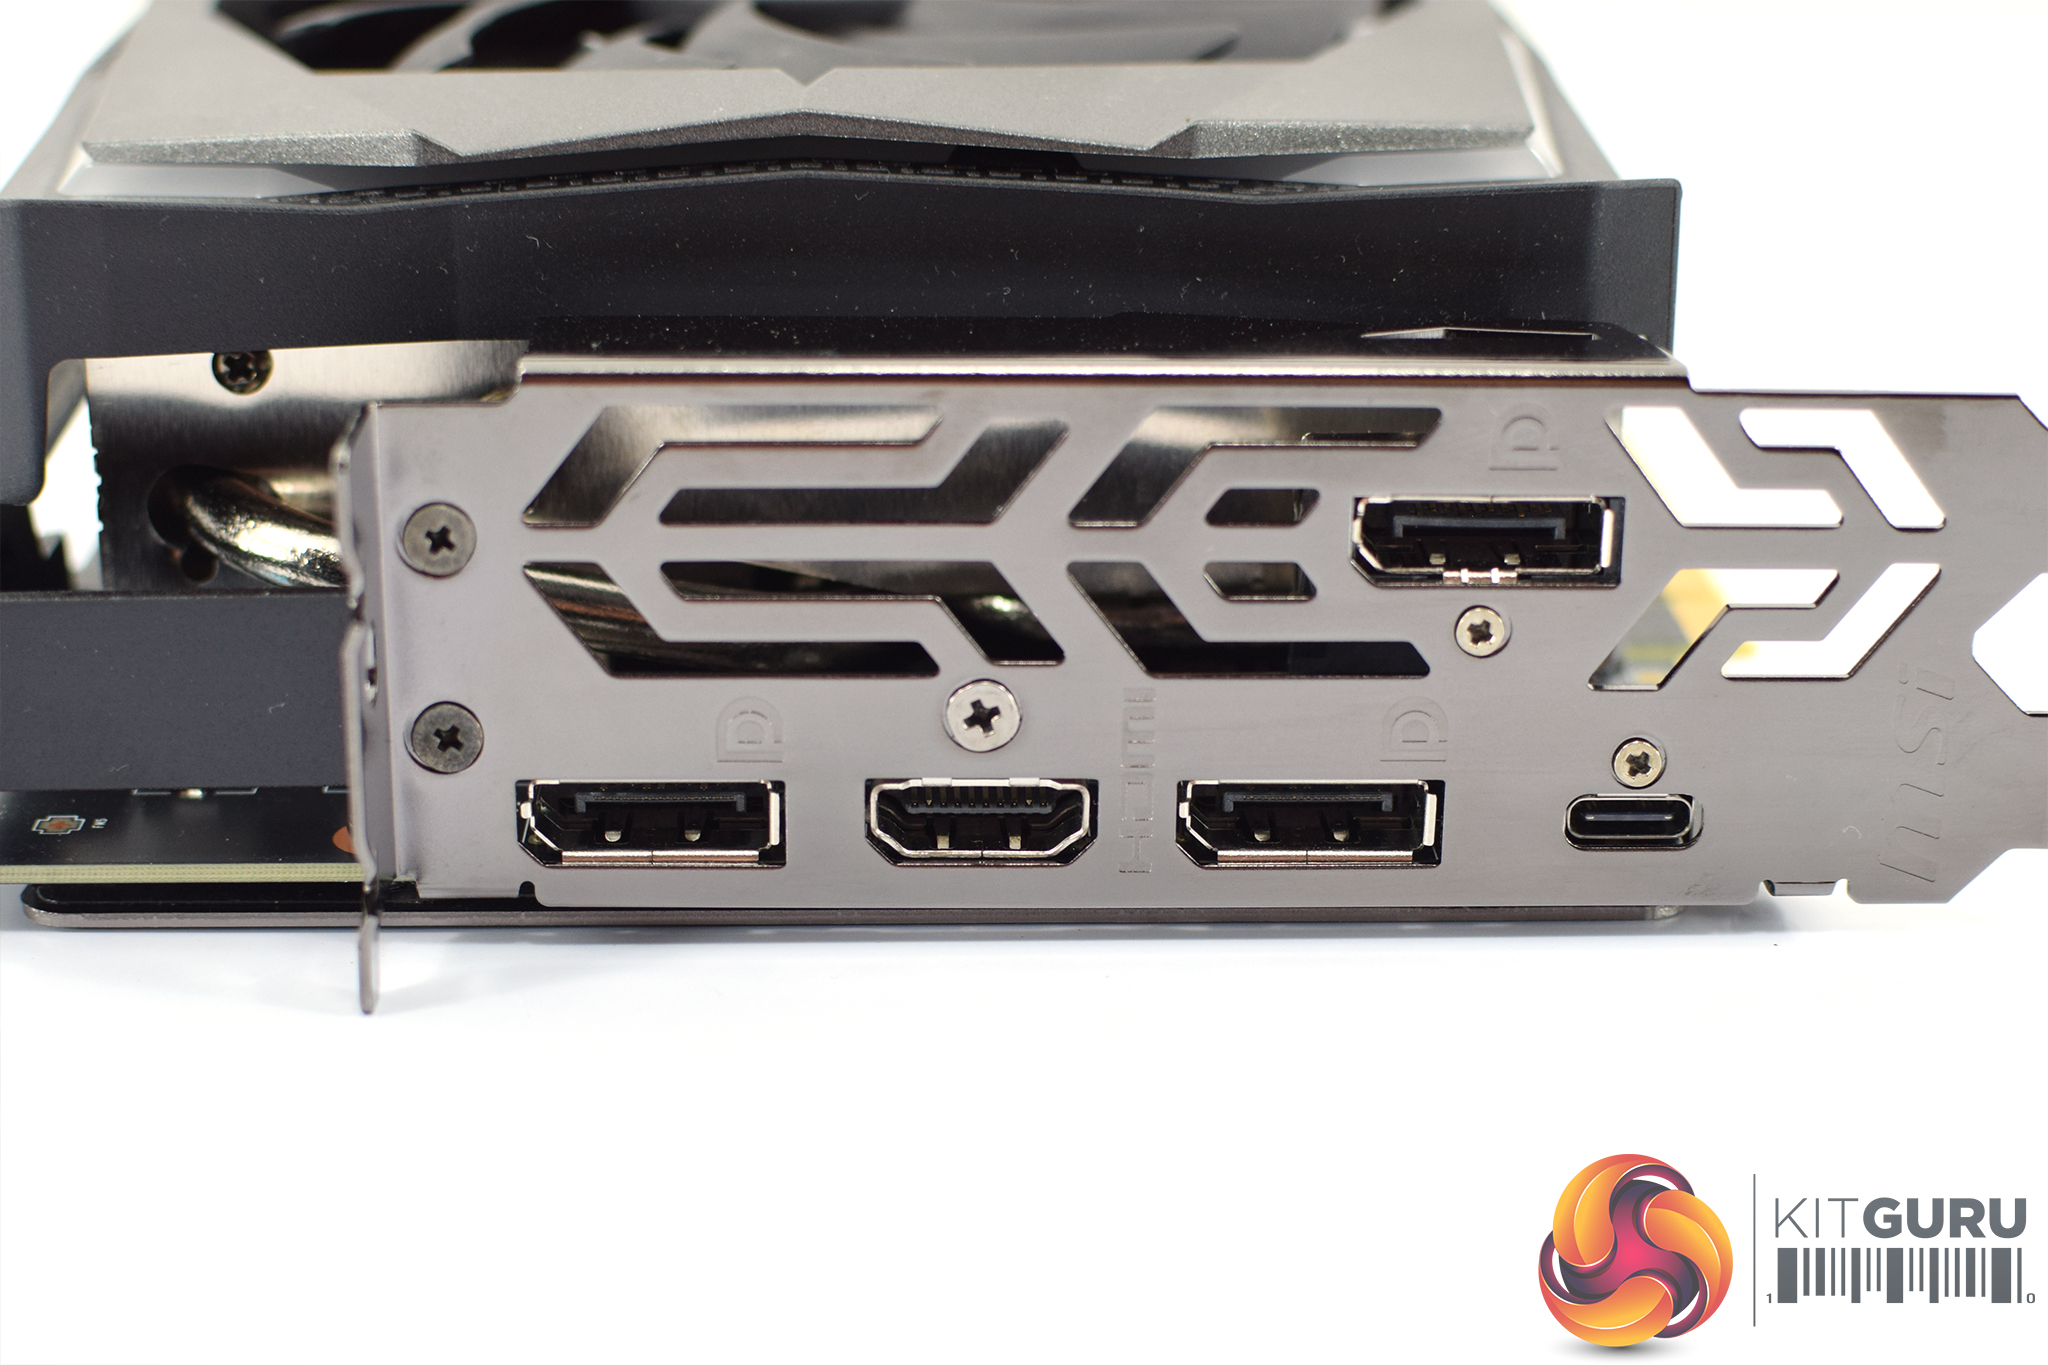
Lastly, display outputs are the same as the RTX 2080 – meaning 3x DisplayPort, 1x HDMI and 1x USB-C. The reference RTX 2070 actually has one less DisplayPort in favour of a DVI port, but I think MSI has made a sensible decision to stick with the DisplayPort connector.Our newest GPU test procedure has been built with the intention of benchmarking high-end graphics cards. We test at 1920×1080 (1080p), 2560×1440 (1440p), and 3840×2160 (4K UHD) resolutions.
We try to test using the DX12 API if titles offer support. This gives us an interpretation into the graphics card performance hierarchy in the present time and the near future, when DX12 becomes more prevalent. After all, graphics cards of this expense may stay in a gamer’s system for a number of product generations/years before being upgraded.
We tested the RX Vega64 and Vega56 using the ‘Turbo‘ power mode in AMD’s WattMan software. This prioritises all-out performance over power efficiency, noise output, and lower thermals.
As mentioned, the Gaming Z runs at 1830MHz boost – 120MHz faster than Nvidia's Founders card, and 210MHz faster than reference speeds.
Driver Notes
- AMD graphics cards were benchmarked with the Adrenalin 18.9.1 driver.
- Nvidia graphics cards (apart from RTX 20 series cards) were benchmarked with the Nvidia 399.24 driver.
- RTX 2080 and 2080 Ti cards were benchmarked with the Nvidia 411.63 driver.
- RTX 2070 was benchmarked with the Nvidia 416.33 driver.
Test System
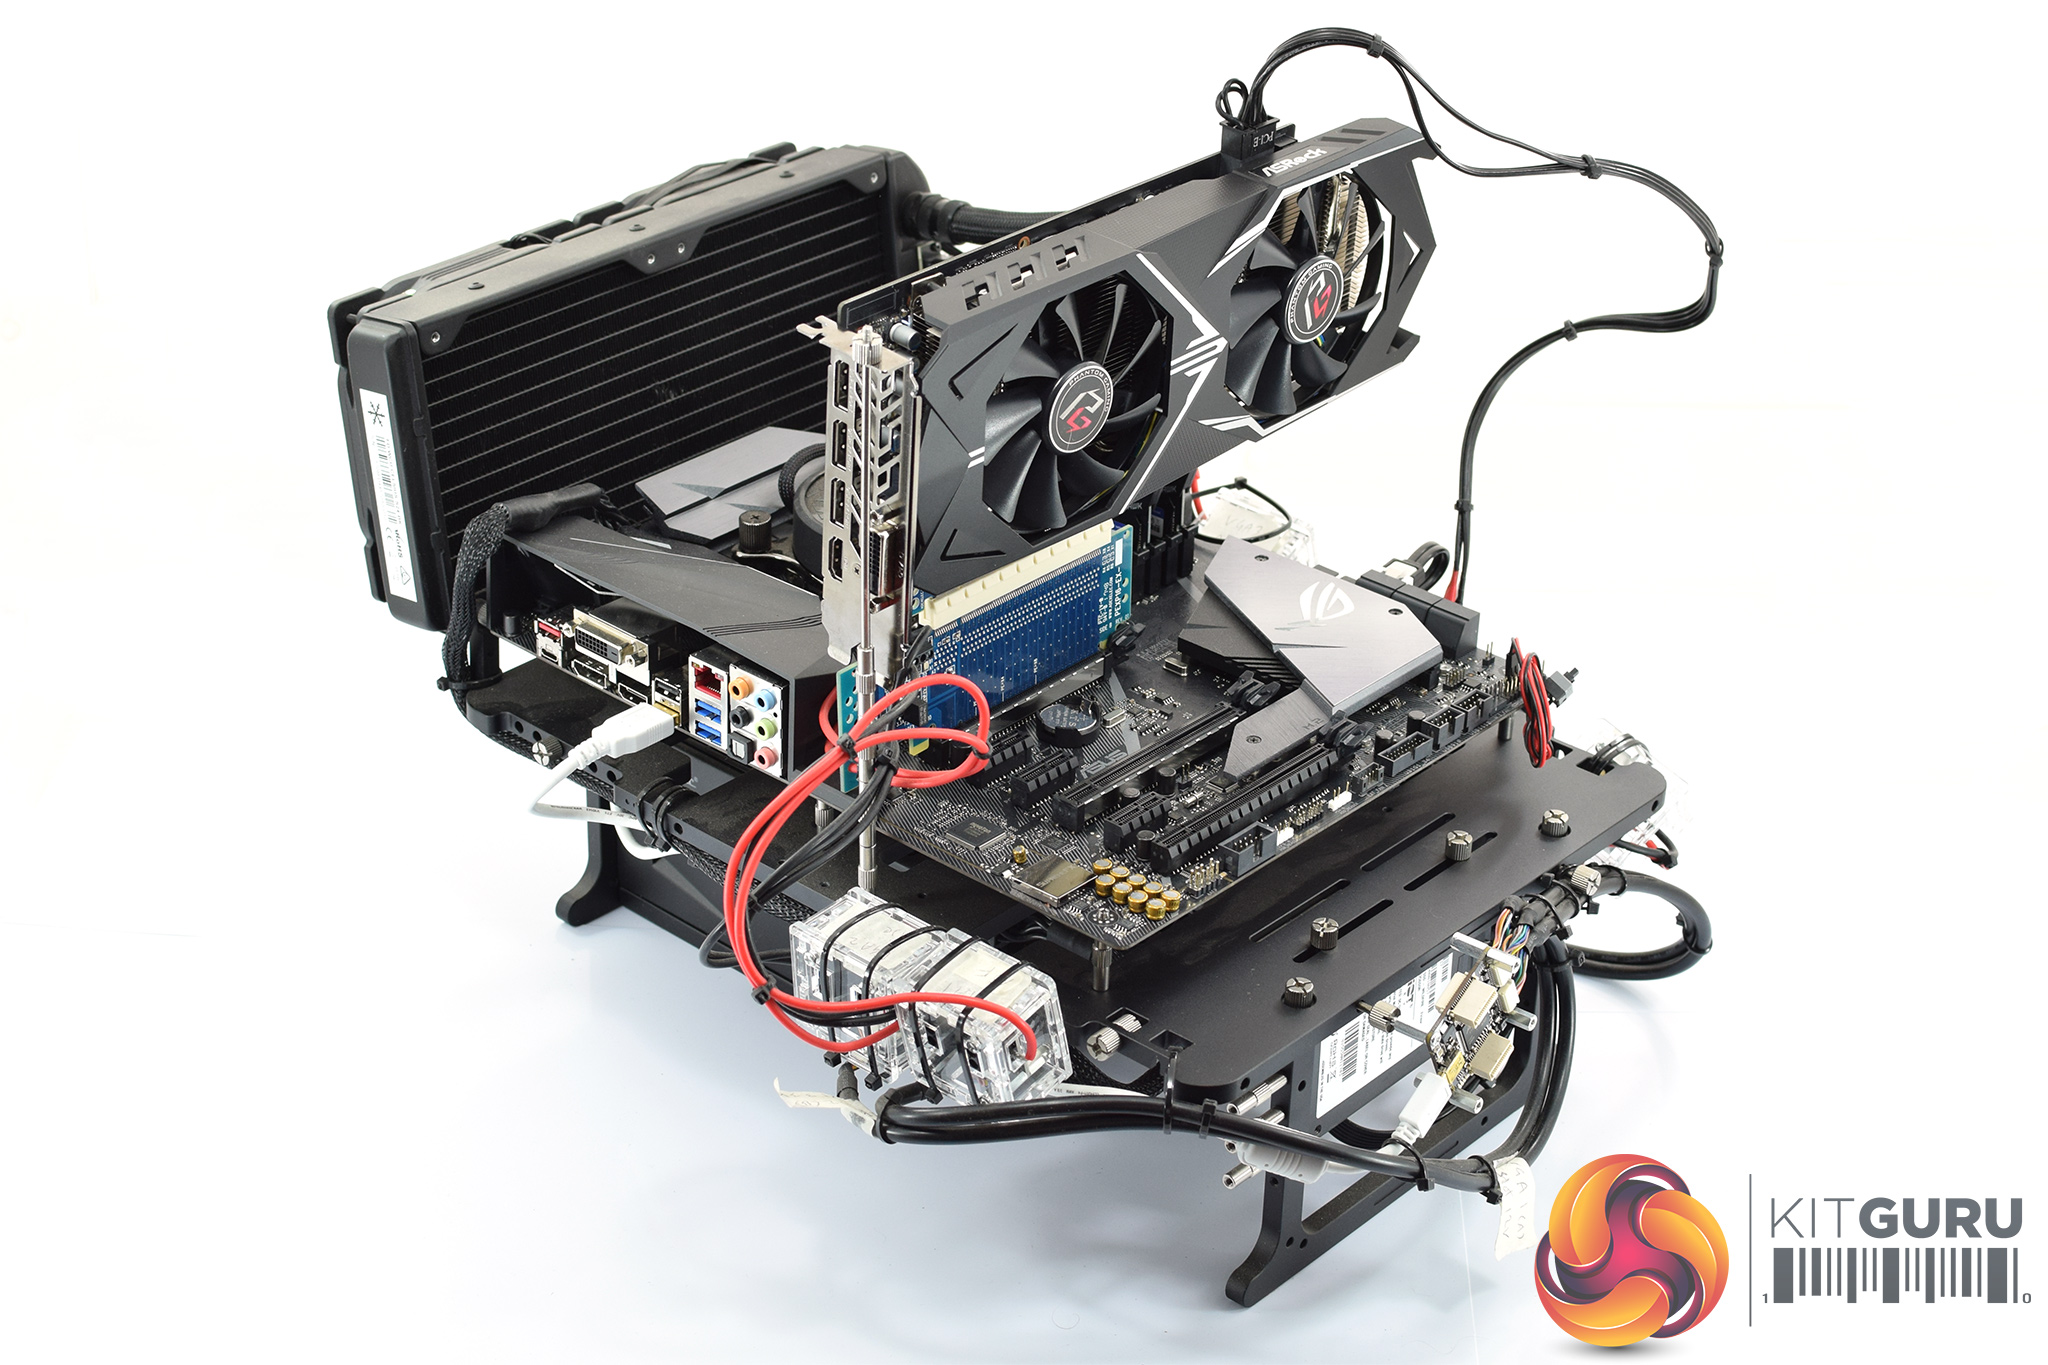
We test using the Overclockers UK Germanium pre-built system. You can read more about it over HERE. It is important to note we have had to re-house the components to an open-air test bench to accommodate our new GPU power testing (more on that later) but the core of the system is unchanged and the performance figures you see presented here are what you can expect from the Germanium.
| CPU |
Intel Core i7-8700K
Overclocked to 4.8GHz |
| Motherboard |
ASUS ROG Strix Z370-F Gaming
|
| Memory |
Team Group Dark Hawk RGB
16GB (2x8GB) @ 3200MHz 16-18-18-38 |
| Graphics Card |
Varies
|
| System Drive |
Patriot Wildfire 240GB
|
| Games Drive | Crucial M4 512GB |
| Chassis | Streacom ST-BC1 Bench |
| CPU Cooler |
OCUK TechLabs 240mm AIO
|
| Power Supply |
SuperFlower Leadex II 850W 80Plus Gold
|
| Operating System |
Windows 10 Professional
|
Comparison Graphics Cards List
- Nvidia RTX 2080 Ti Founders Edition (FE) 11GB
- Nvidia RTX 2080 Founders Edition (FE) 8GB
- Gigabyte RTX 2080 Gaming OC 8GB
- Palit RTX 2080 GameRock Premium 8GB
- ASUS ROG RTX 2080 Strix OC 8GB
- Nvidia GTX 1080 Ti Founders Edition (FE) 11GB
- Gigabyte GTX 1080 G1 Gaming 8GB
- Palit GTX 1070 Ti Super Jetstream 8GB
- Nvidia GTX 1070 Founders Edition (FE) 8GB
- Nvidia GTX 1060 Founders Edition (FE) 6GB
- Gigabyte GTX 980 Ti XTREME Gaming 6GB
- AMD RX Vega 64 Air 8GB
- AMD RX Vega 56 8GB
- Sapphire RX 580 Nitro+ Limited Edition (LE) 8GB
- ASUS RX 570 ROG Strix Gaming OC 4GB
Software and Games List
- 3DMark Fire Strike & Fire Strike Ultra (DX11 Synthetic)
- 3DMark Time Spy (DX12 Synthetic)
- Deus Ex: Mankind Divided (DX12)
- Far Cry 5 (DX11)
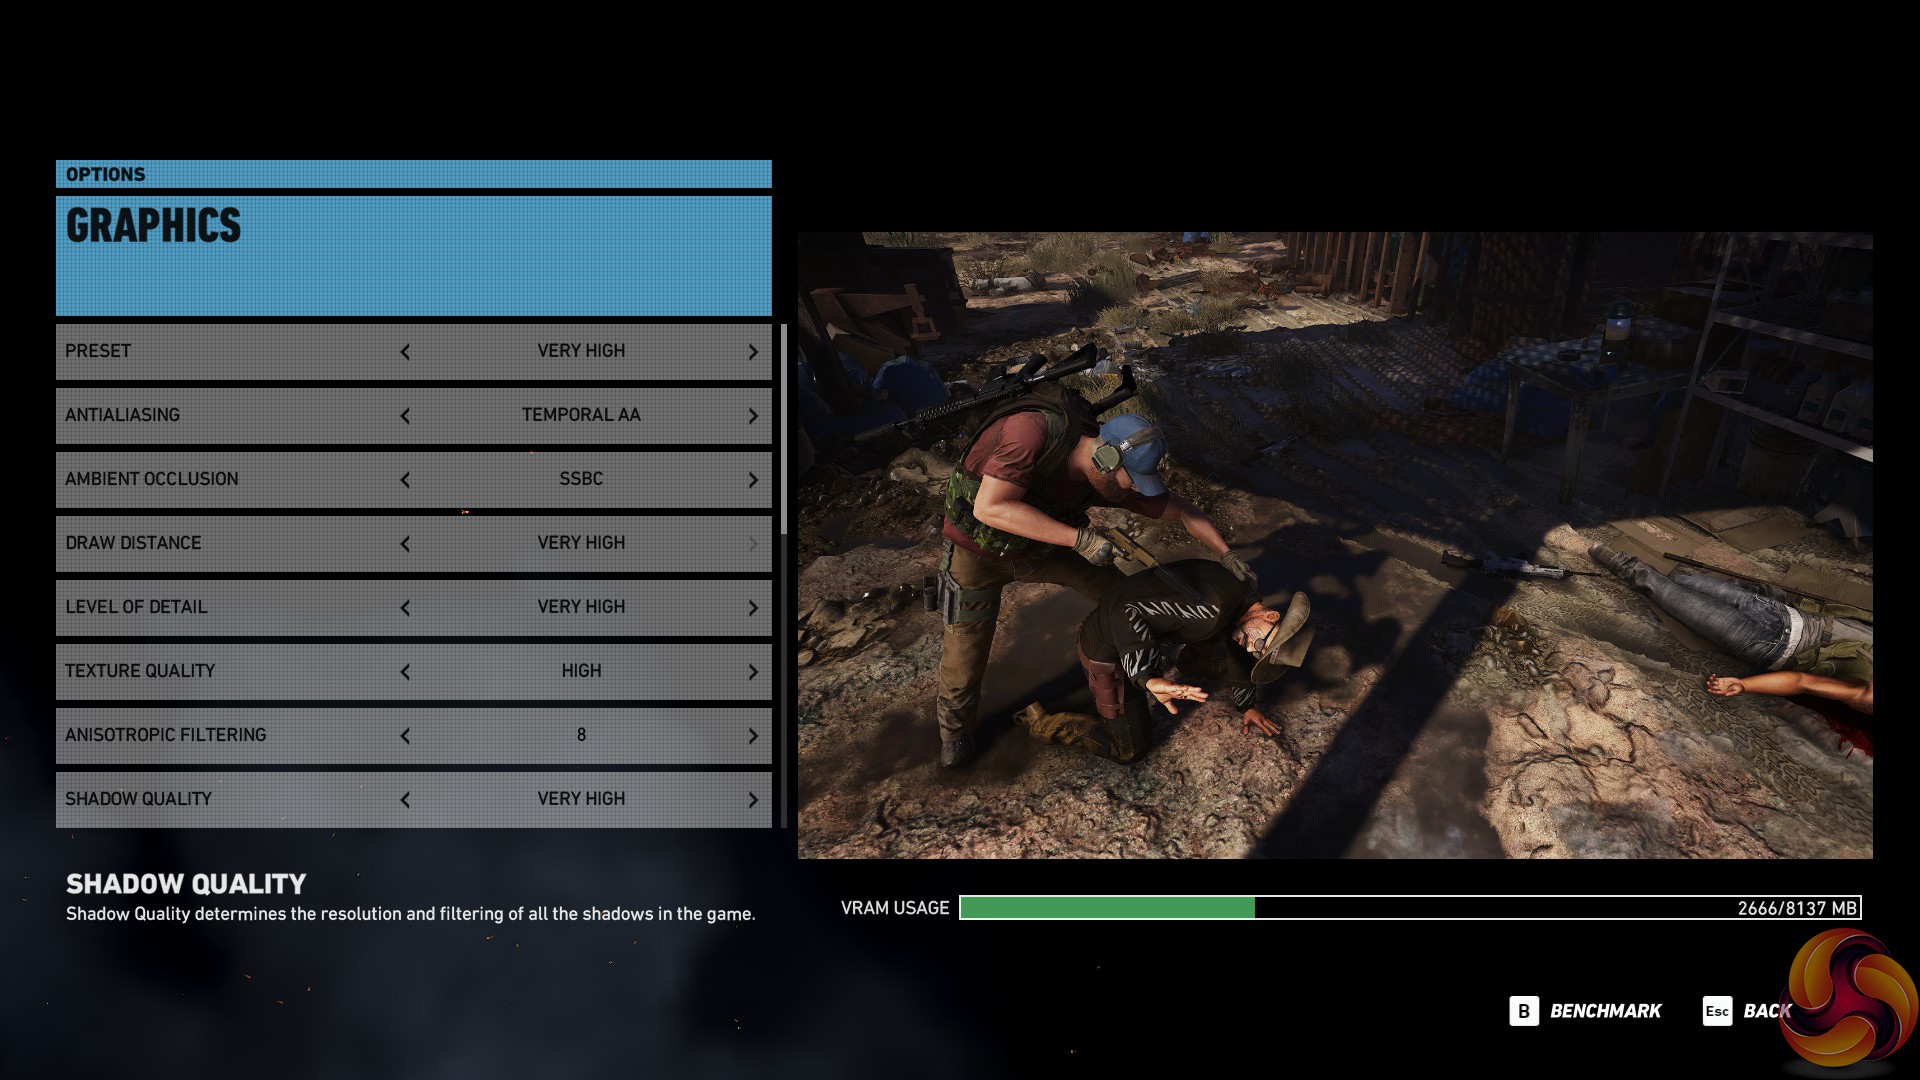
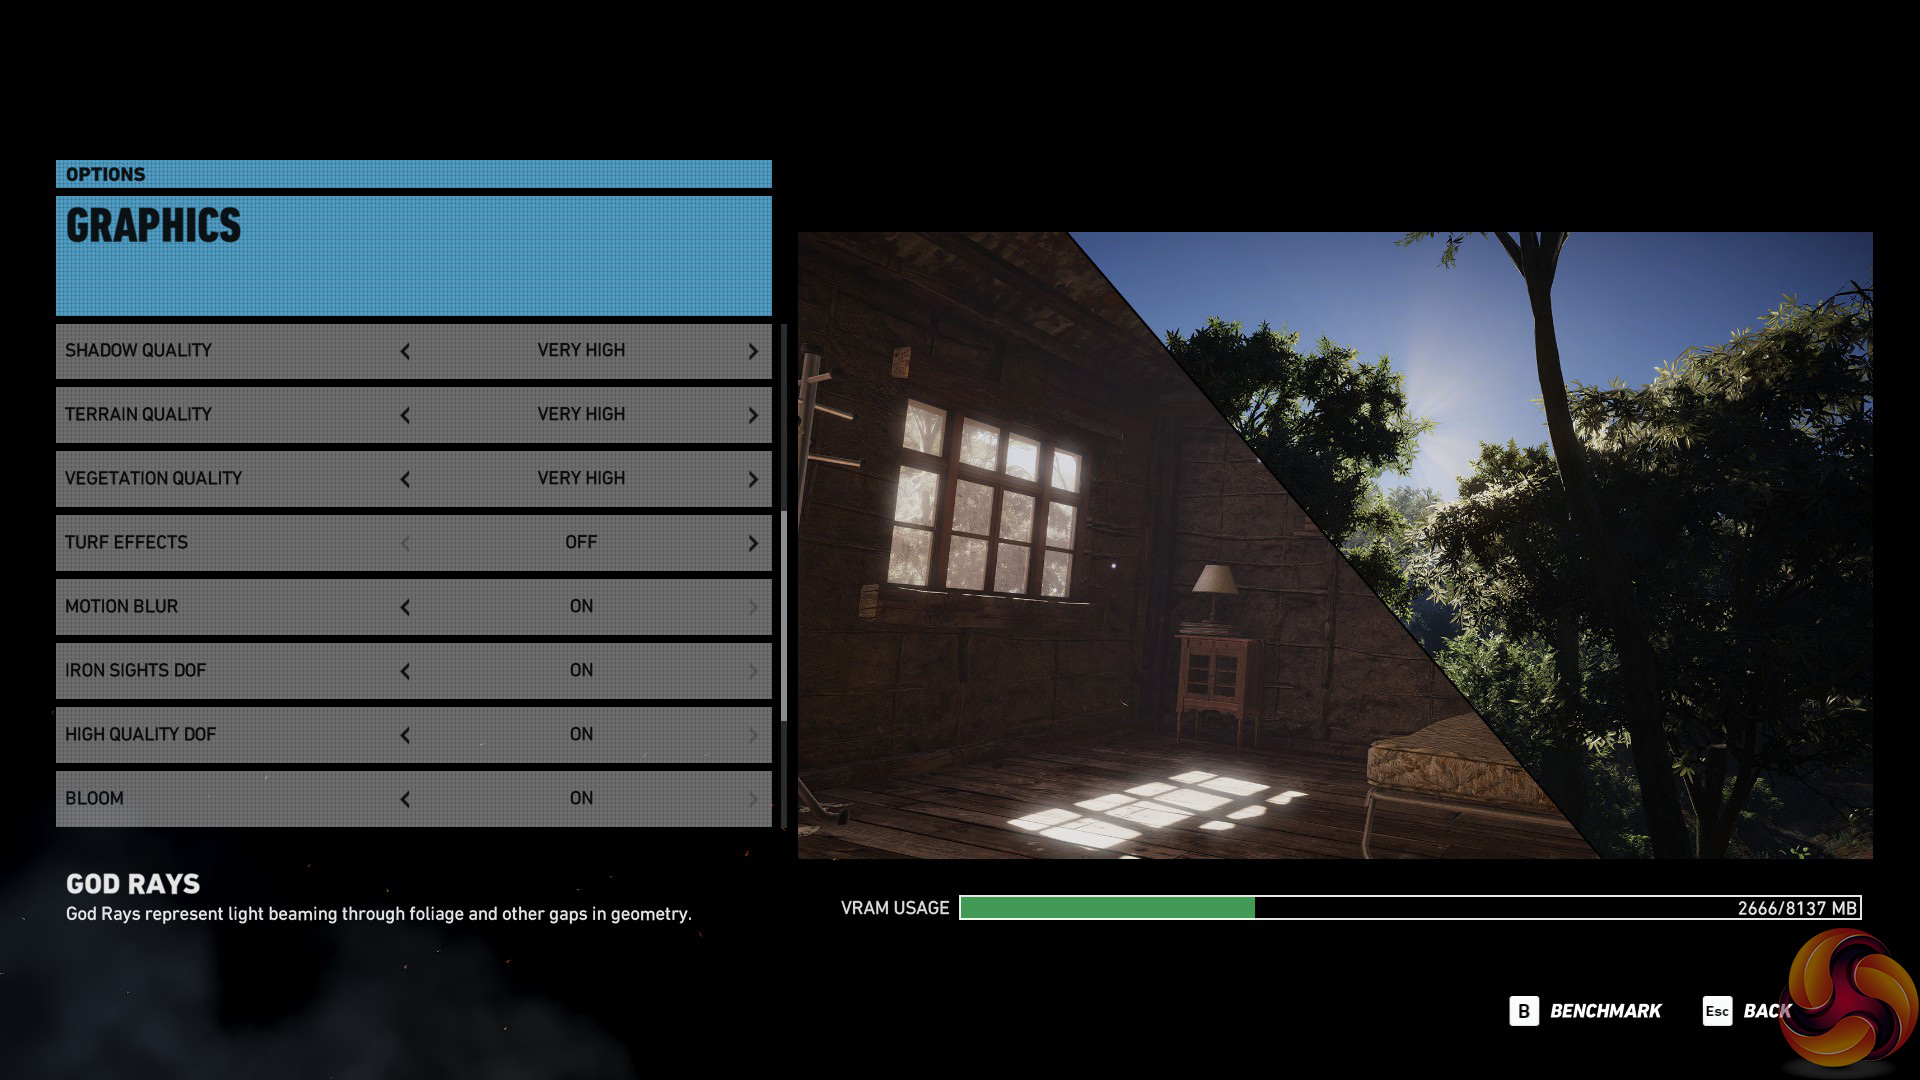
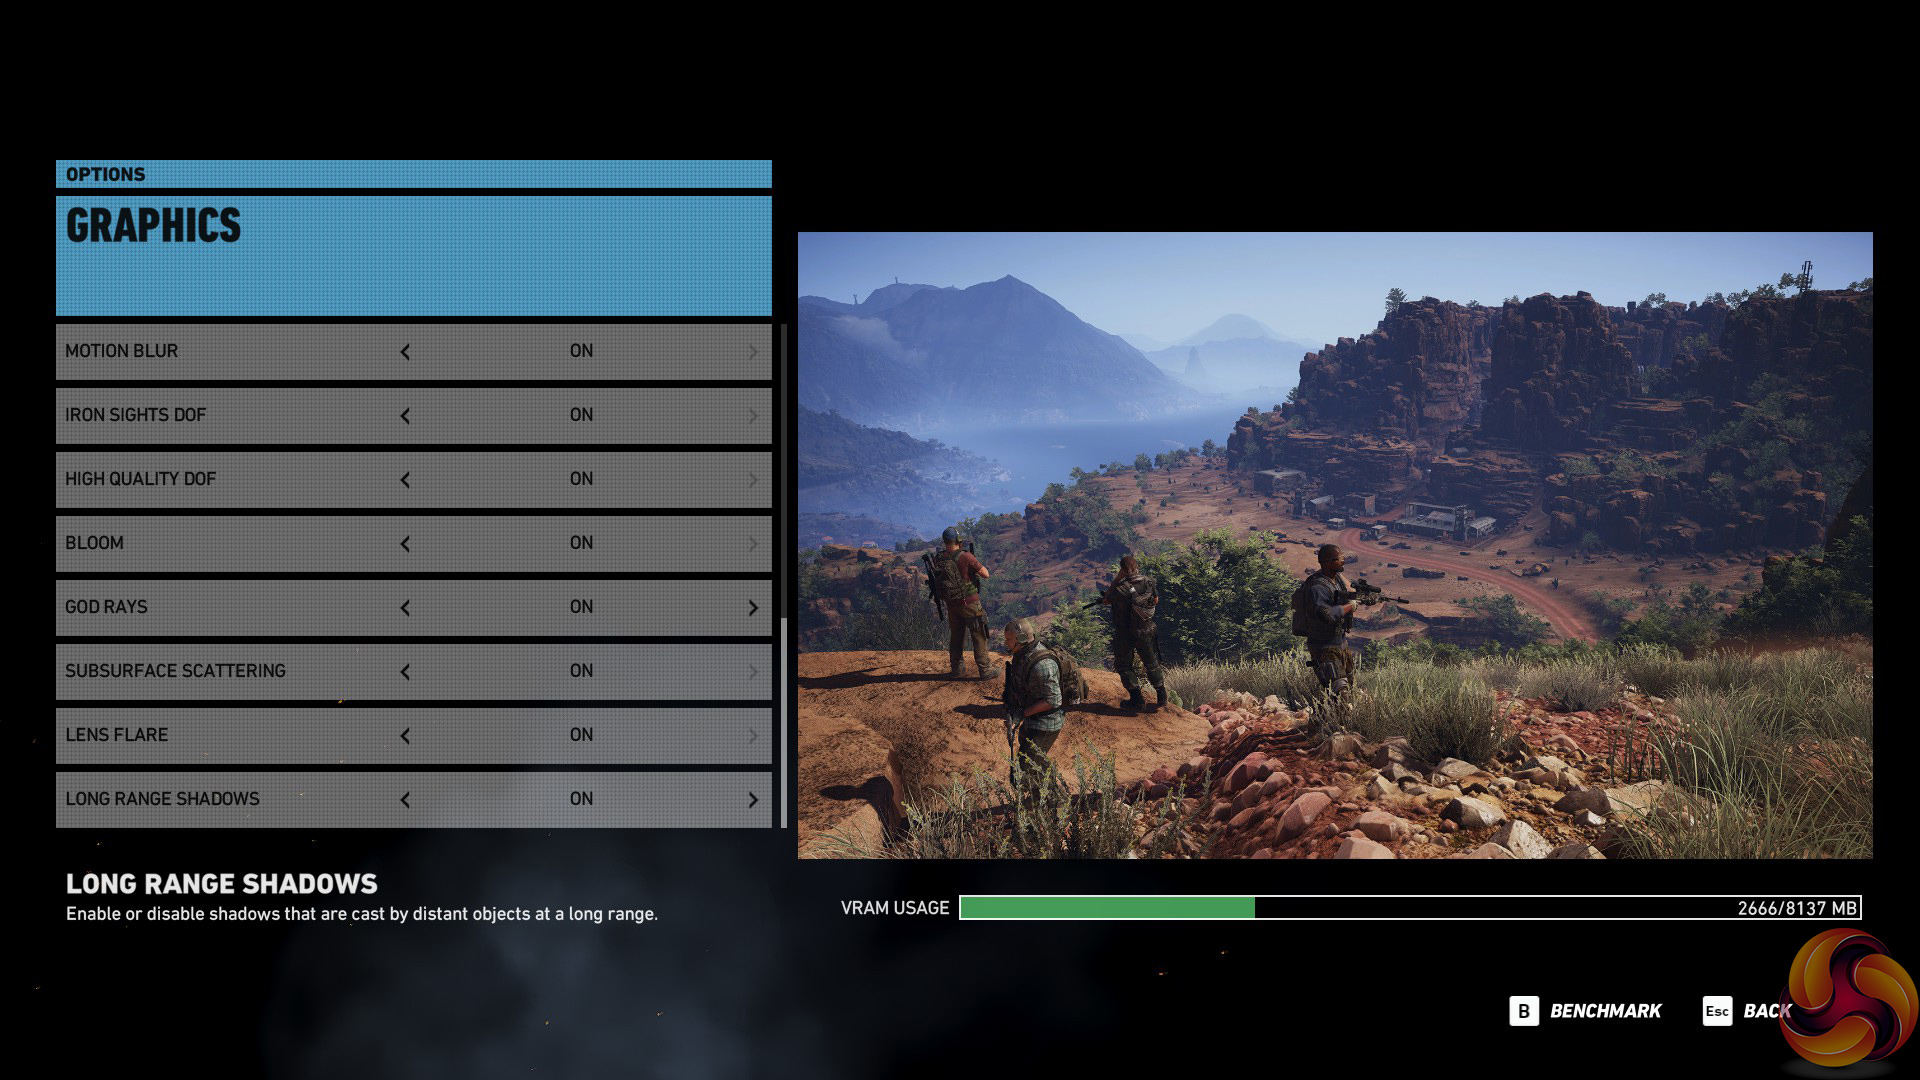
- Tom Clancy’s Ghost Recon: Wildlands (DX11)
- Middle Earth: Shadow of War (DX11)
- Shadow of the Tomb Raider (DX12)
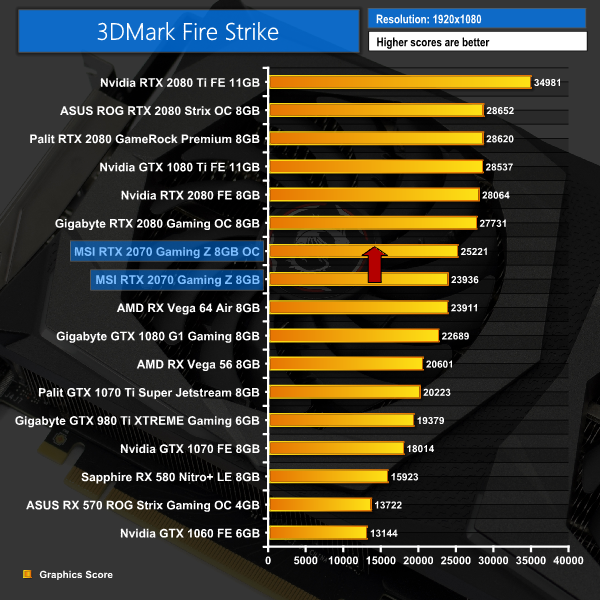
We run each benchmark/game three times, and present averages in our graphs.3DMark Fire Strike is a showcase DirectX 11 benchmark designed for today’s high-performance gaming PCs. It is our [FutureMark’s] most ambitious and technical benchmark ever, featuring real-time graphics rendered with detail and complexity far beyond what is found in other benchmarks and games today.
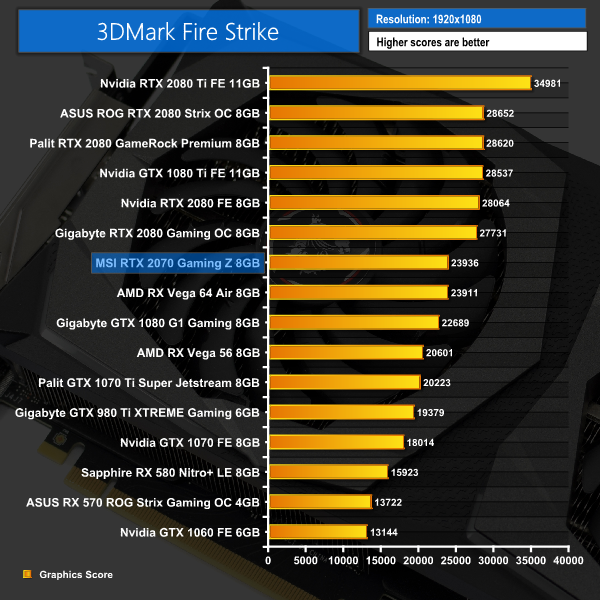
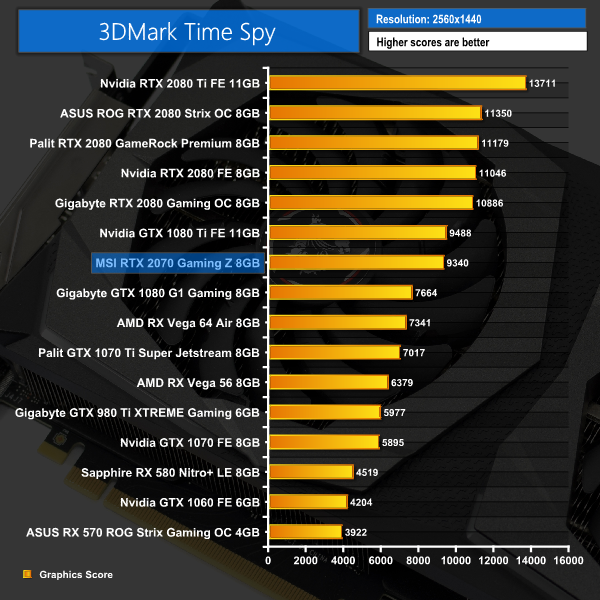
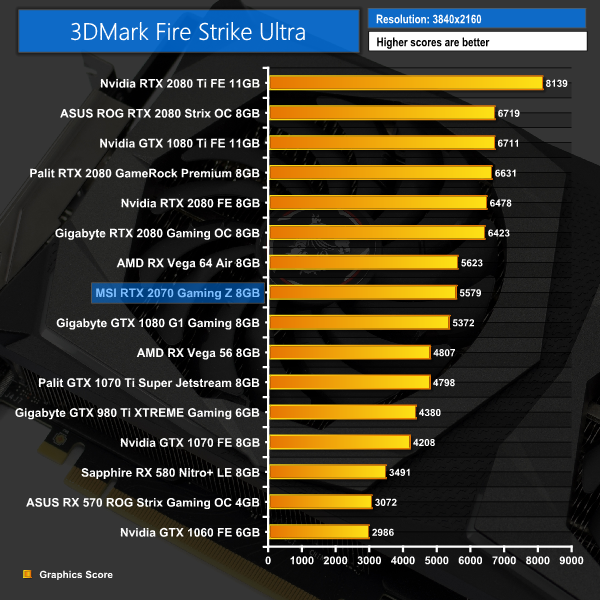
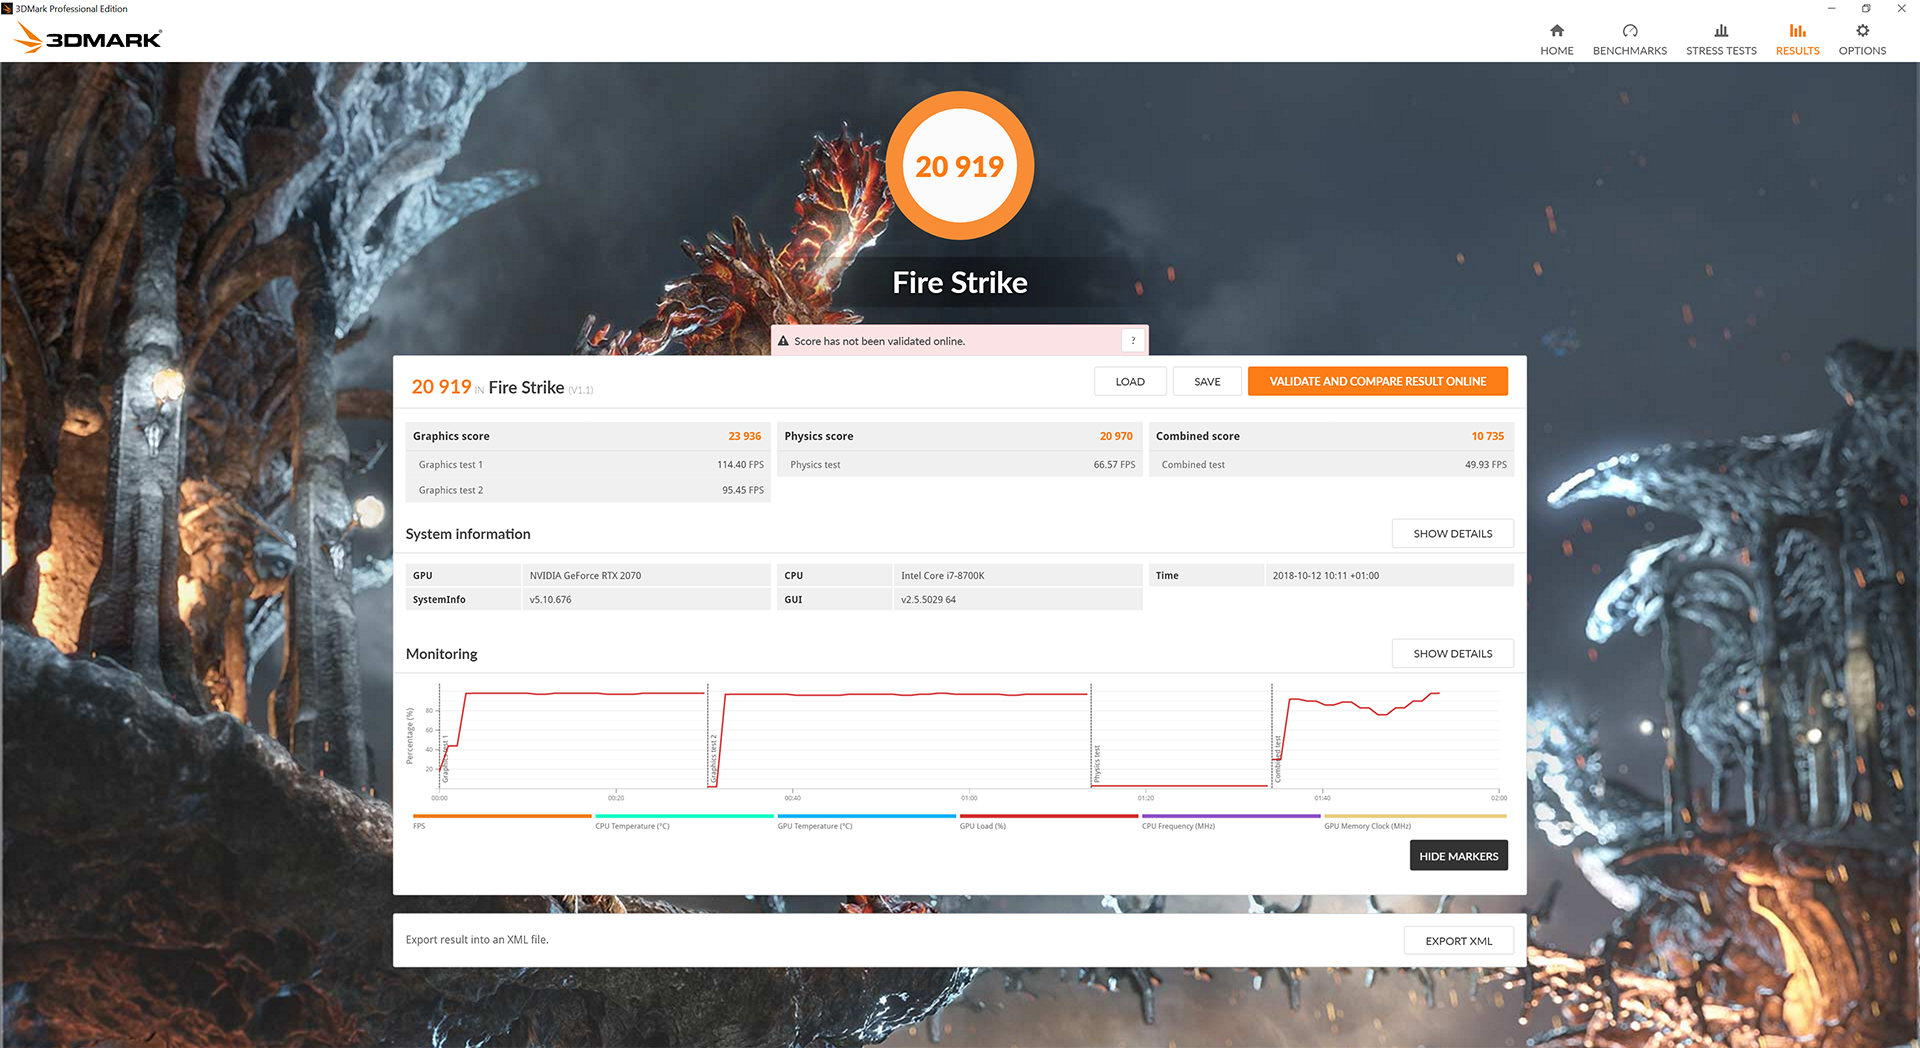
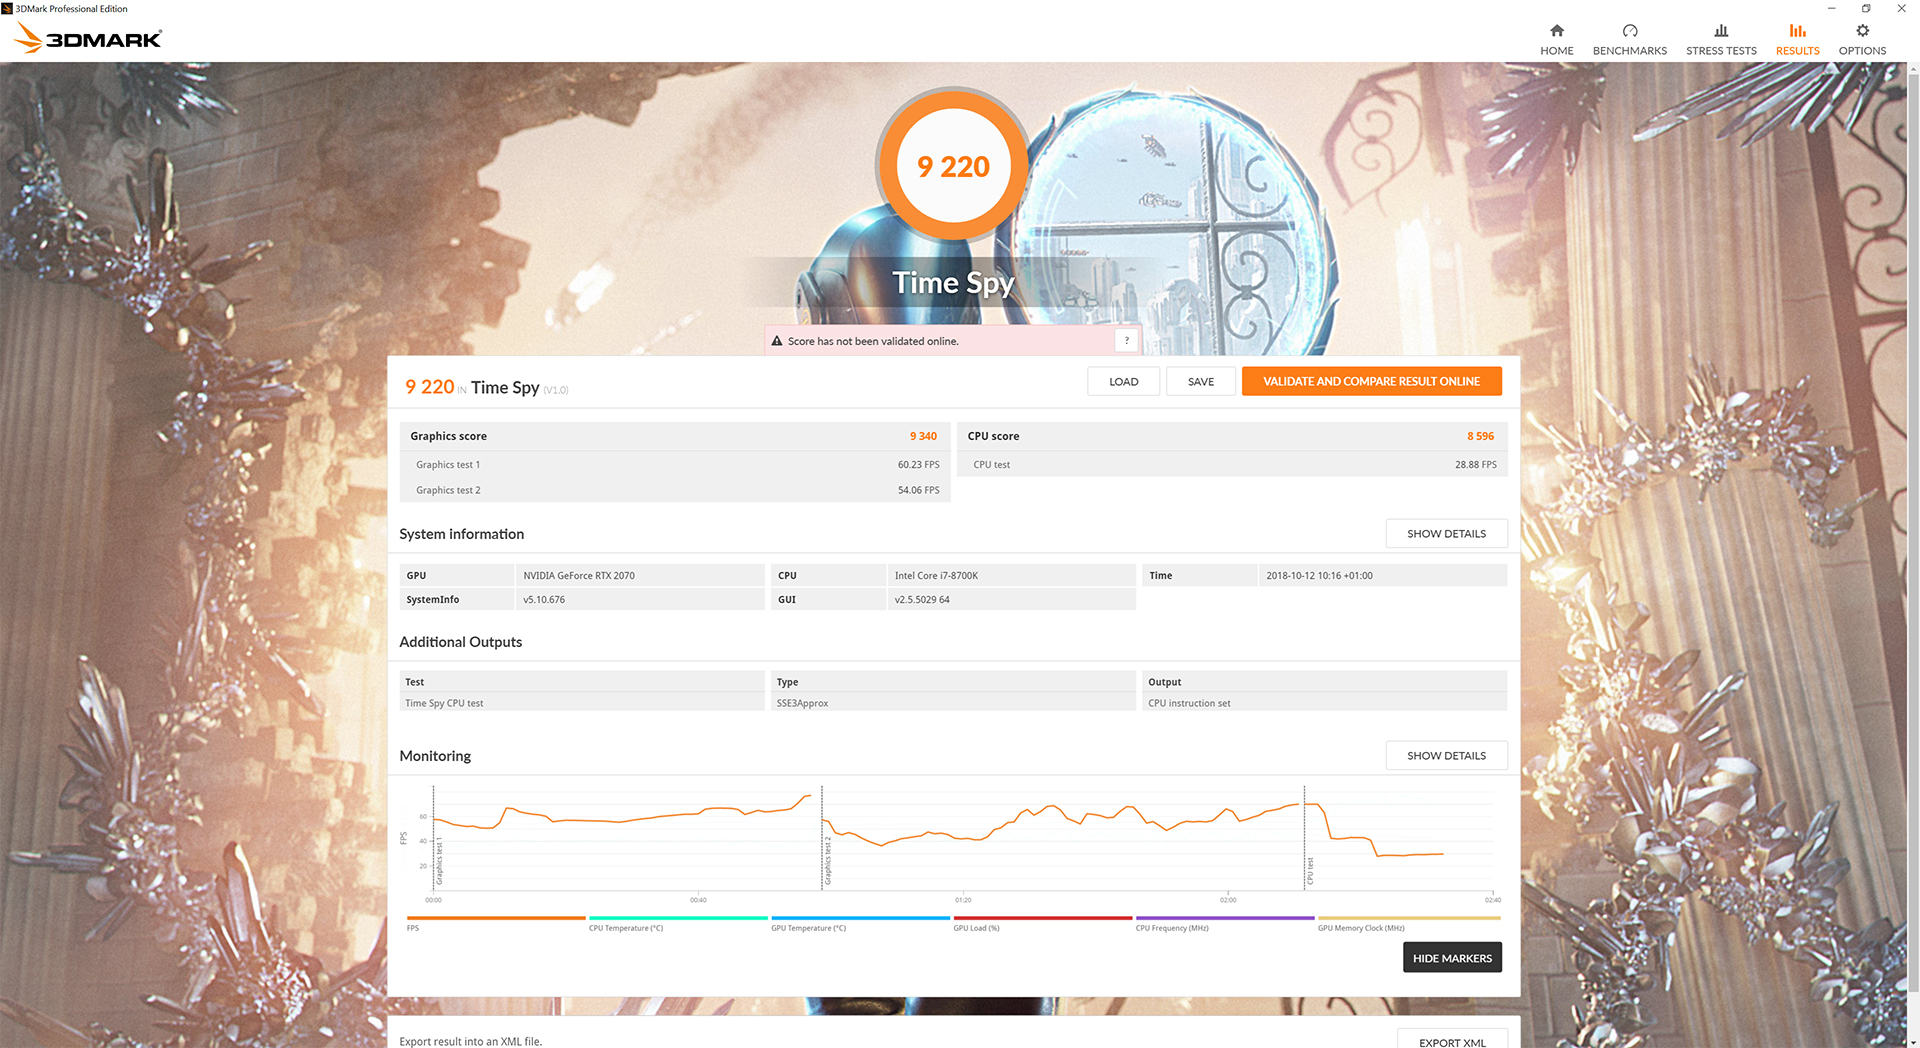
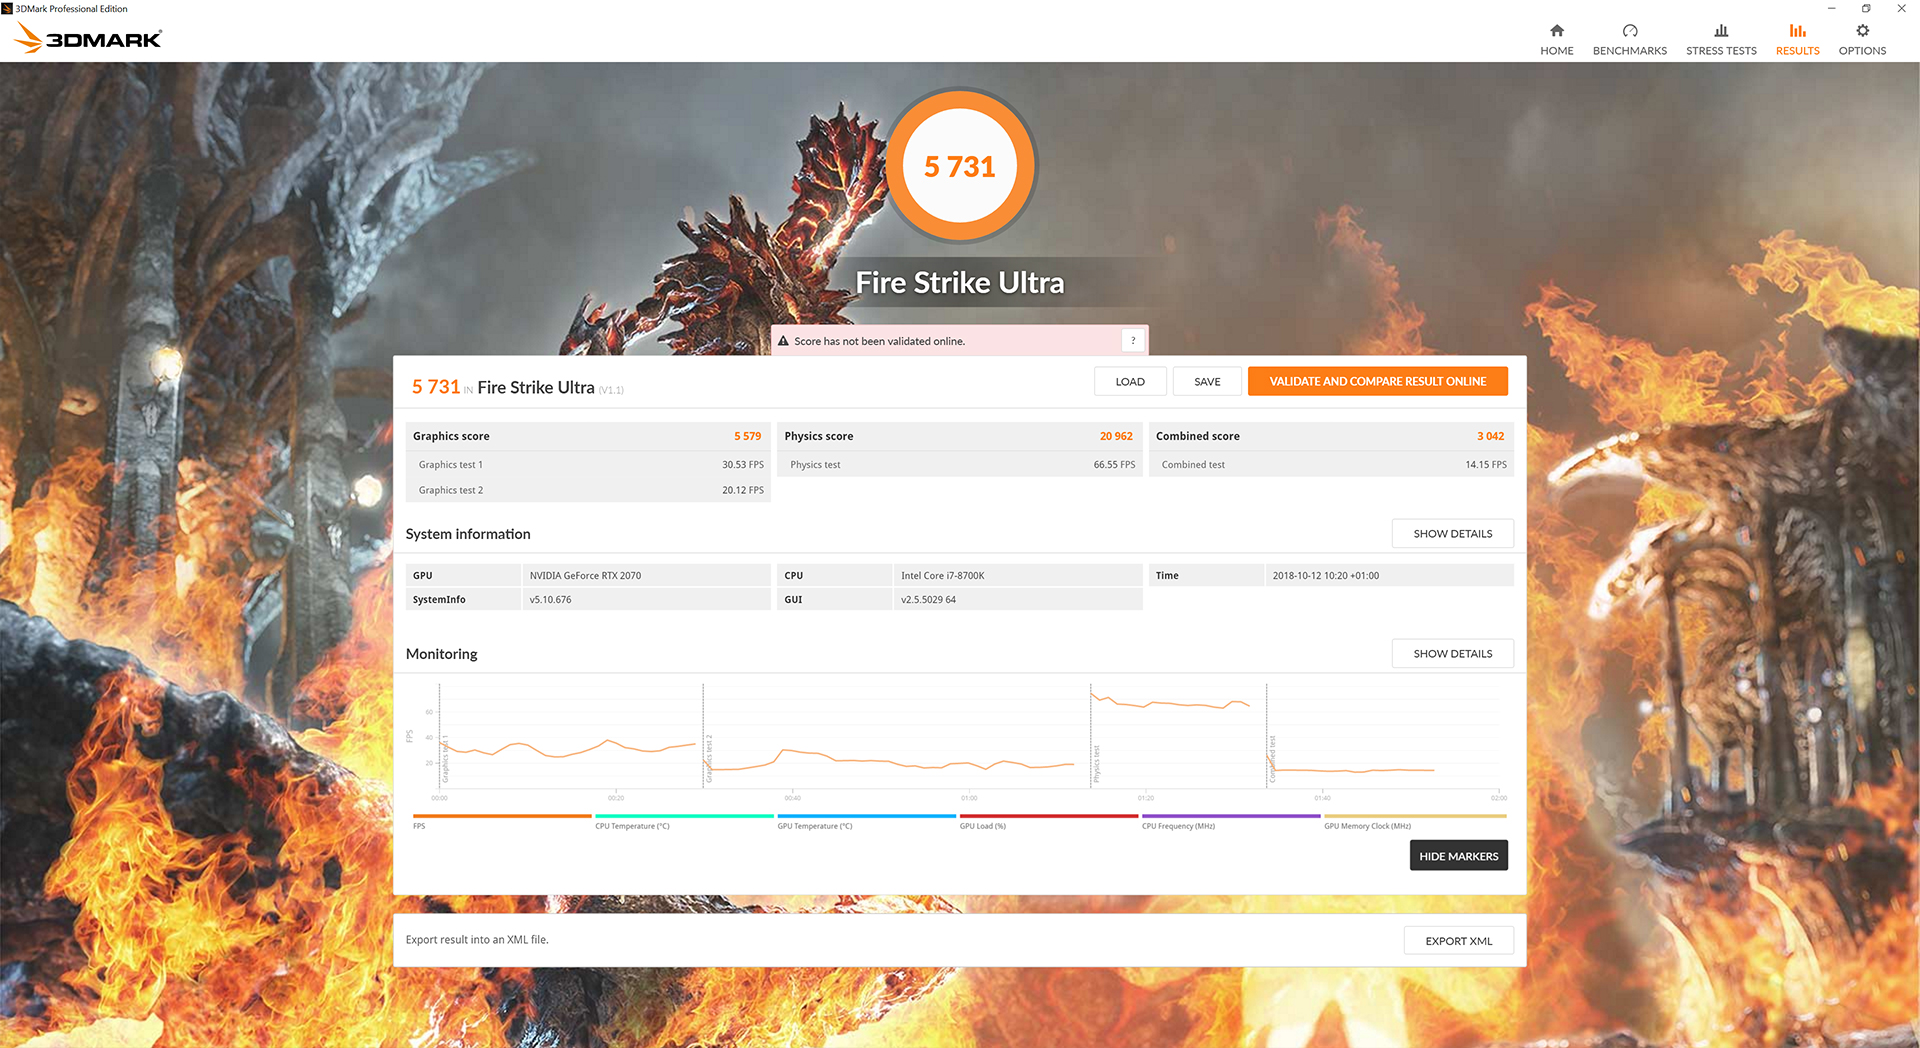
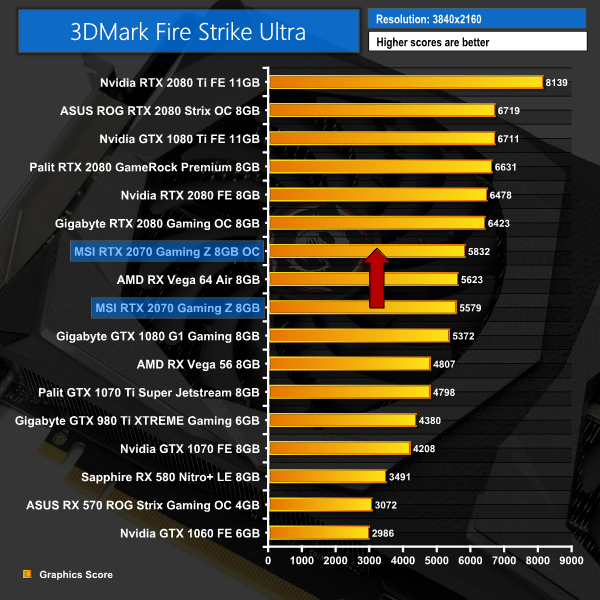
Starting off with our 3DMark testing, there is a little bit of variance across the three tests but we can see that the RTX 2070 Gaming Z is safely faster than the GTX 1080. It pulls a lot closer to the GTX 1080 Ti in Time Spy (a DX12 benchmark) but falls further behind in the DX11 Fire Strike and Fire Strike Ultra benchmarks.Deus Ex: Mankind Divided is set in the year 2029, two years after the events of Human Revolution and the “Aug Incident”—an event in which mechanically augmented humans became uncontrollable and lethally violent. Unbeknownst to the public, the affected augmented received implanted technology designed to control them by the shadowy Illuminati, which is abused by a rogue member of the group to discredit augmentations completely. (Wikipedia).
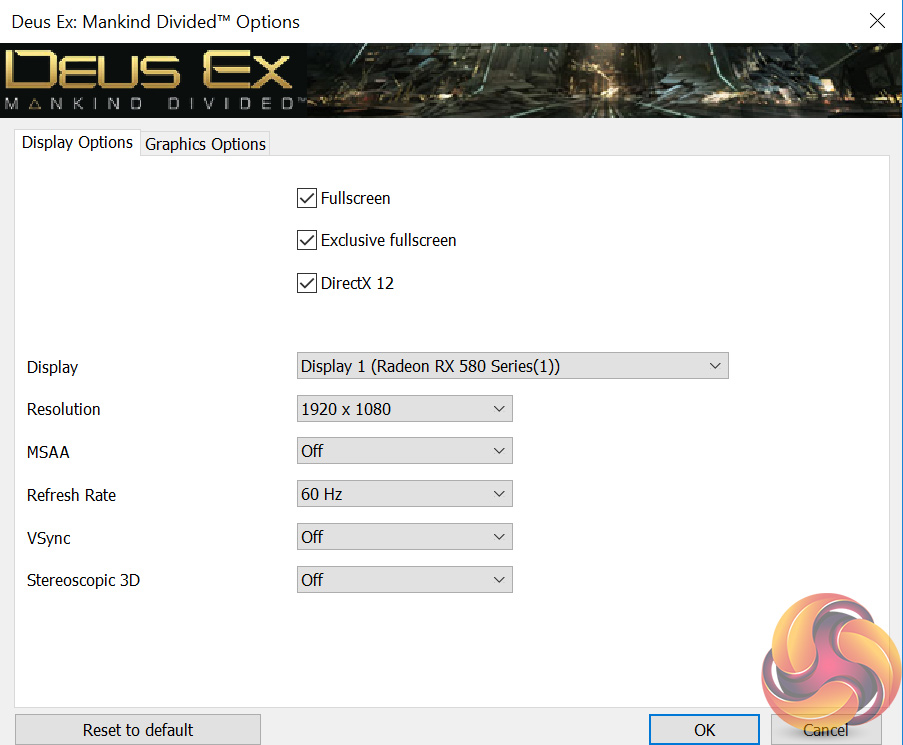
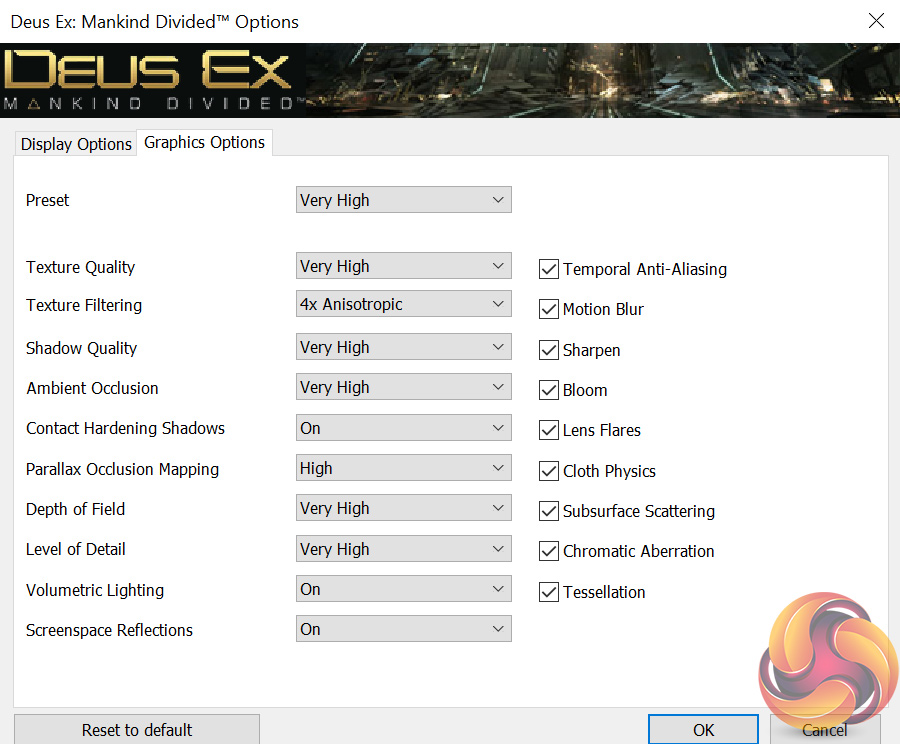
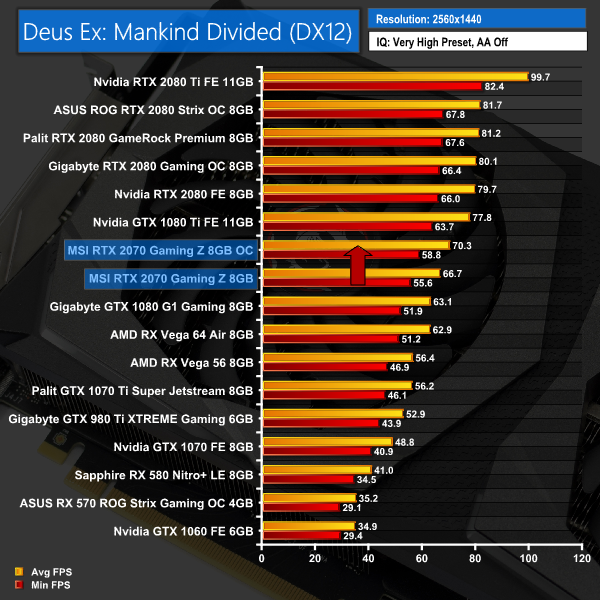
We test using the Very High preset, with MSAA disabled. We use the DirectX 12 API.
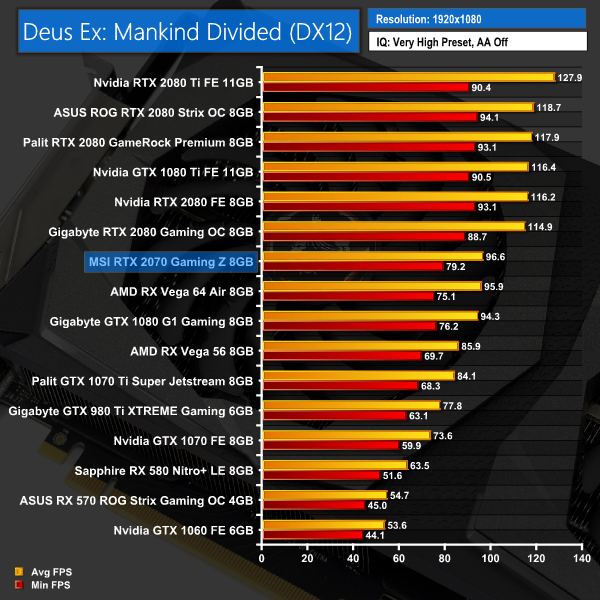
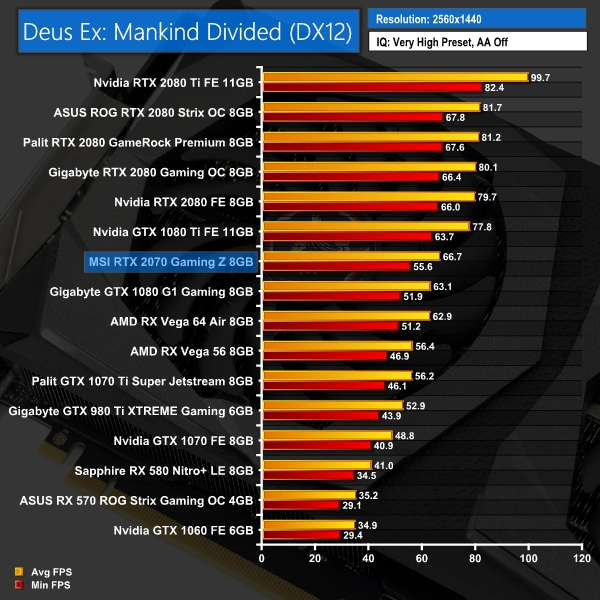
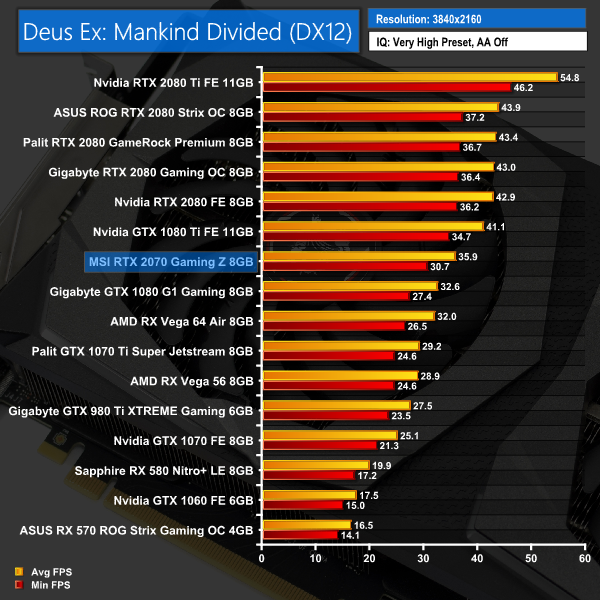
Deus Ex: Mankind Divided paints a clearer picture than the 3DMark tests – we can see the RTX 2070 sandwiched between the GTX 1080 and the 1080 Ti. The 1080, however, is not much slower at all across these three tests – with the biggest gap being just 3.6FPS at 1440p.Far Cry 5 is an action-adventure first-person shooter game developed by Ubisoft Montreal and Ubisoft Toronto and published by Ubisoft for Microsoft Windows, PlayStation 4 and Xbox One. It is the eleventh entry and the fifth main title in the Far Cry series, and was released on March 27, 2018.
The game takes place in the fictional Hope County, Montana, where charismatic preacher Joseph Seed and his cult Project at Eden’s Gate holds a dictatorial rule over the area. The story follows an unnamed junior deputy sheriff, who becomes trapped in Hope County and works alongside factions of a resistance to liberate the county from Eden’s Gate. (Wikipedia).
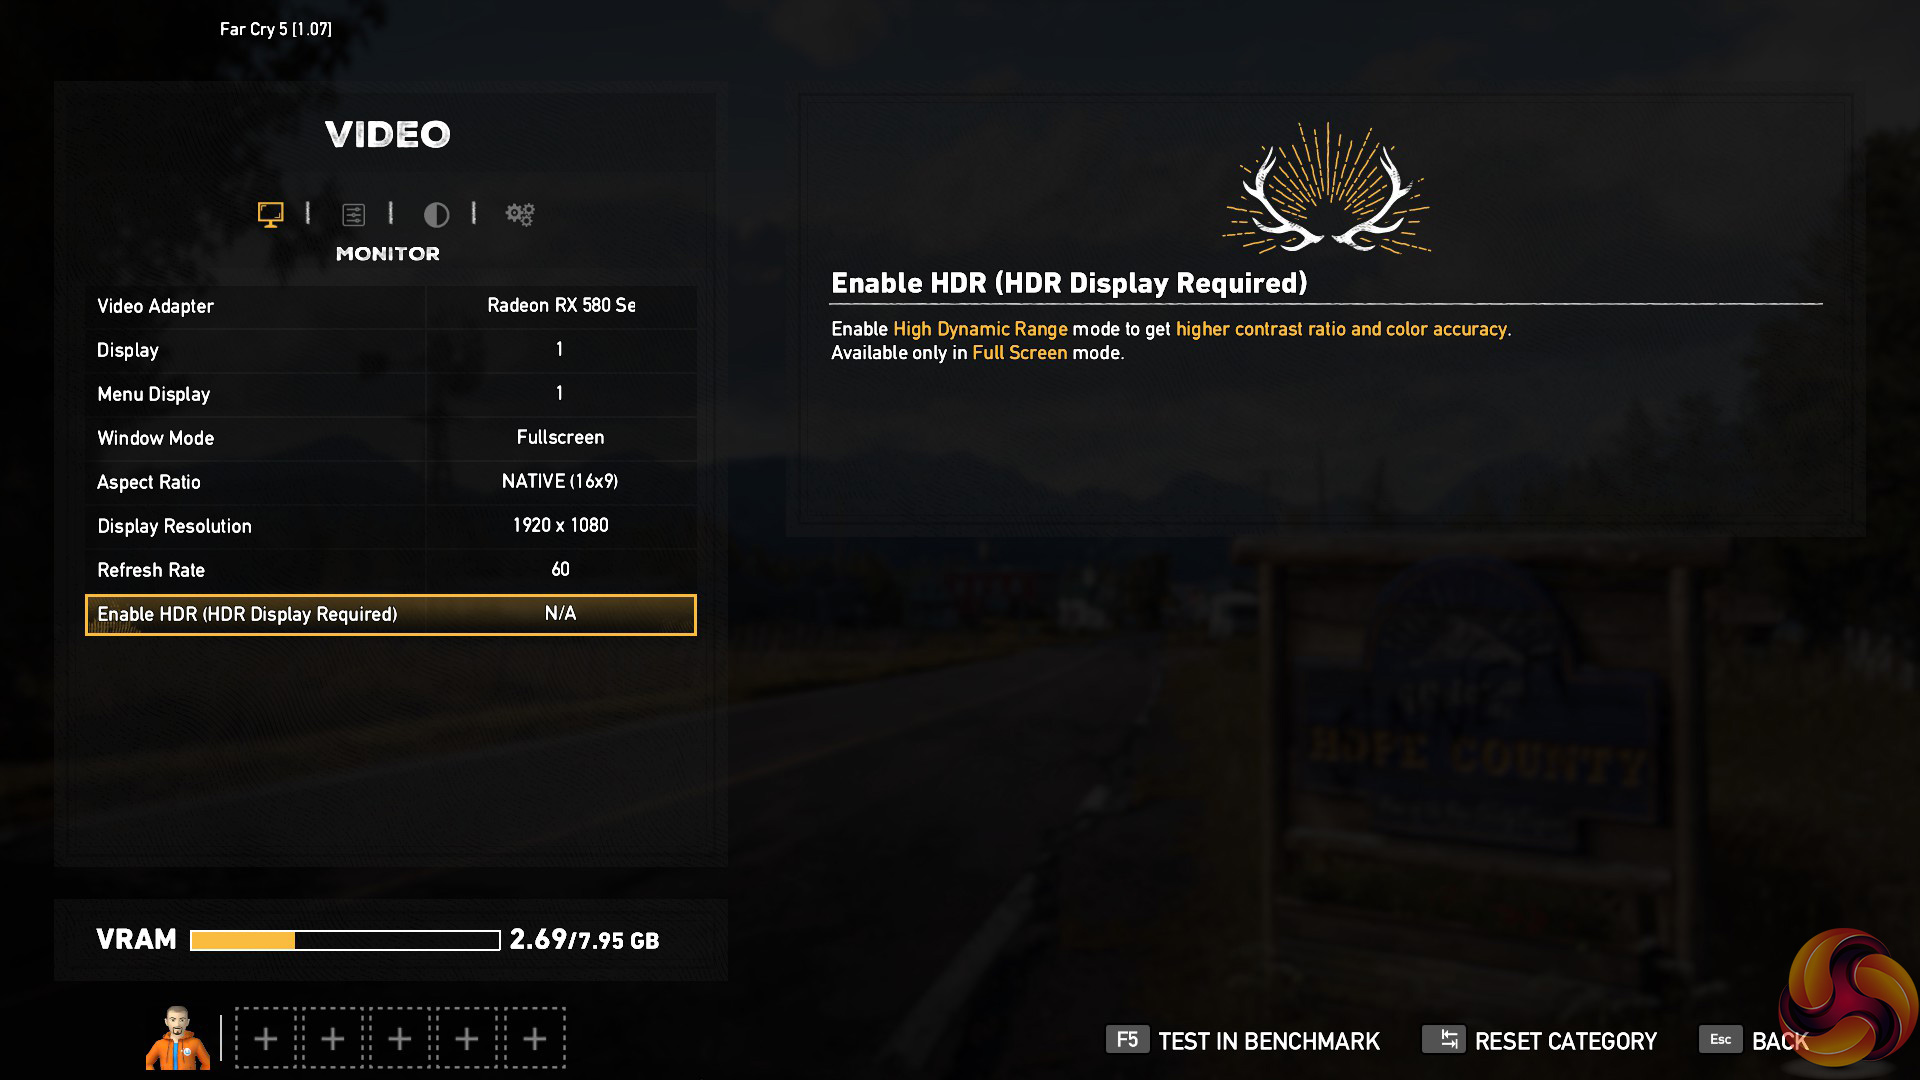
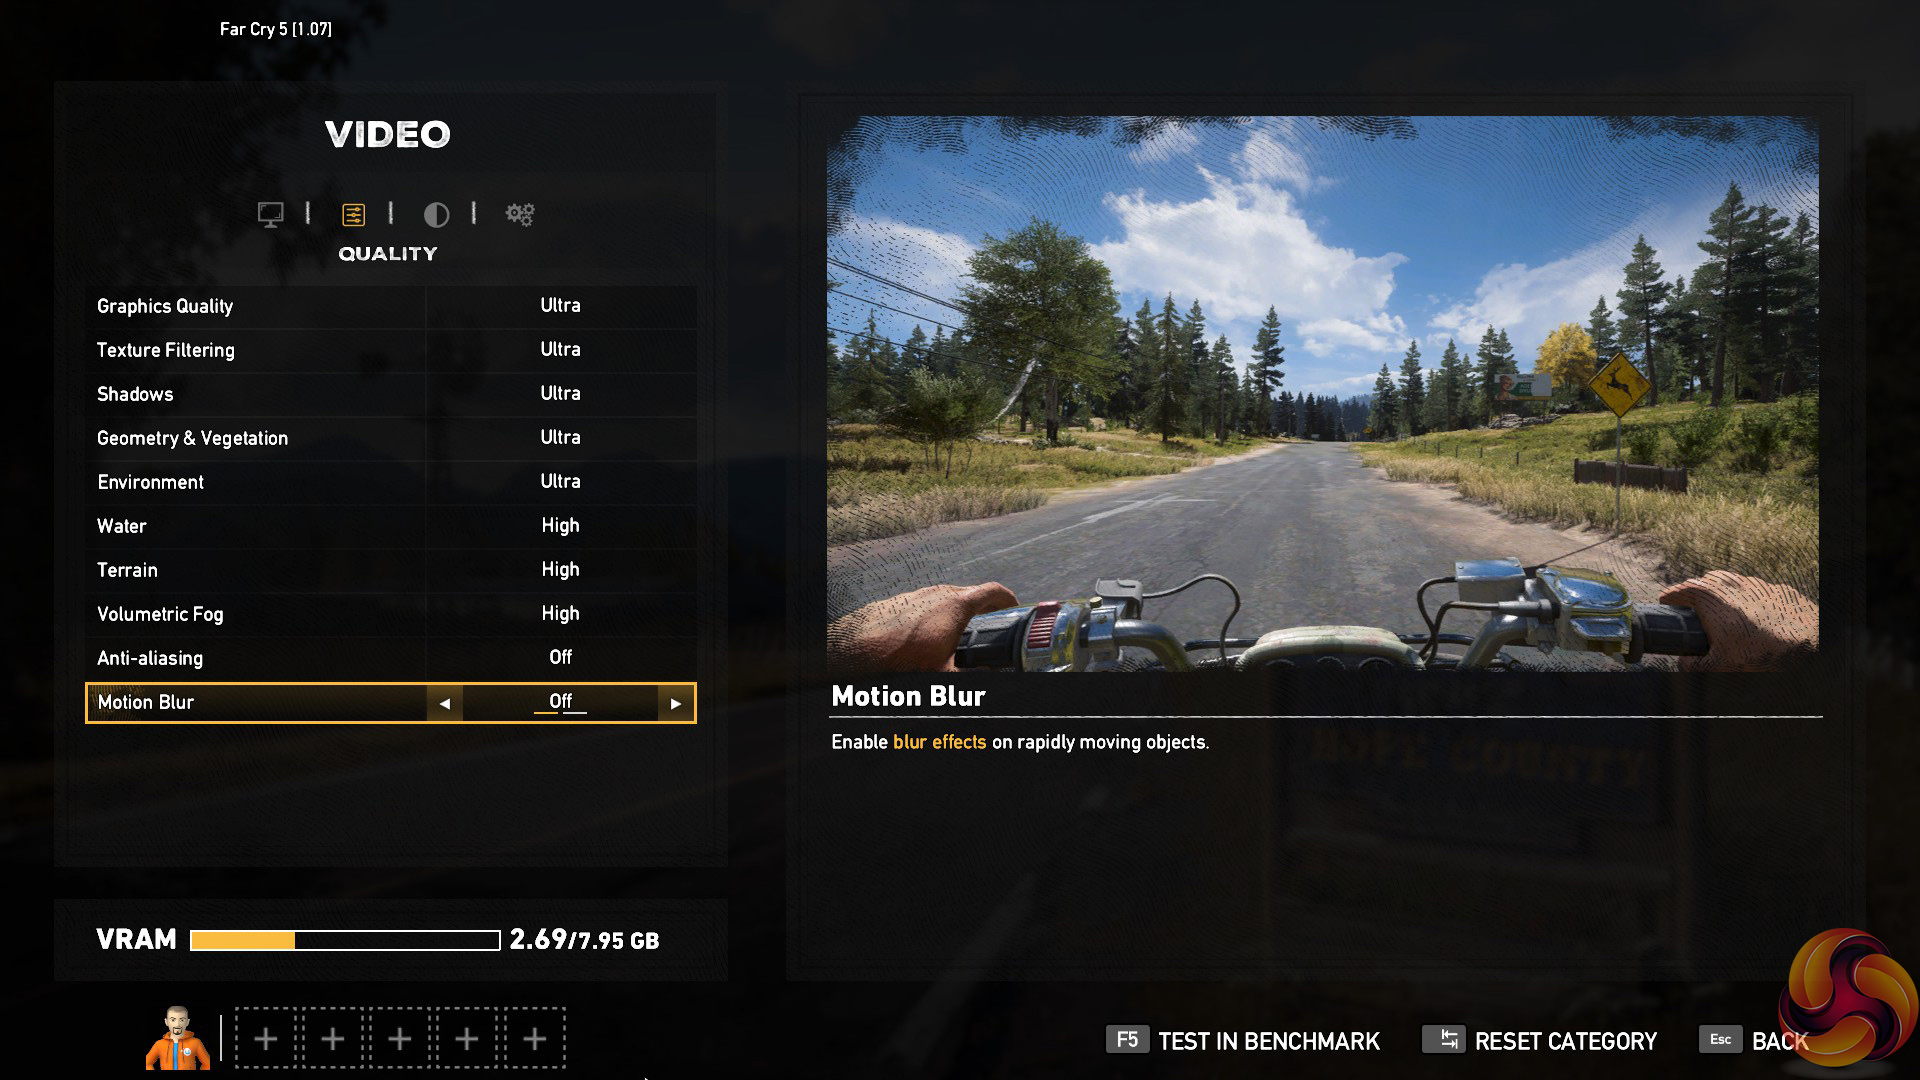
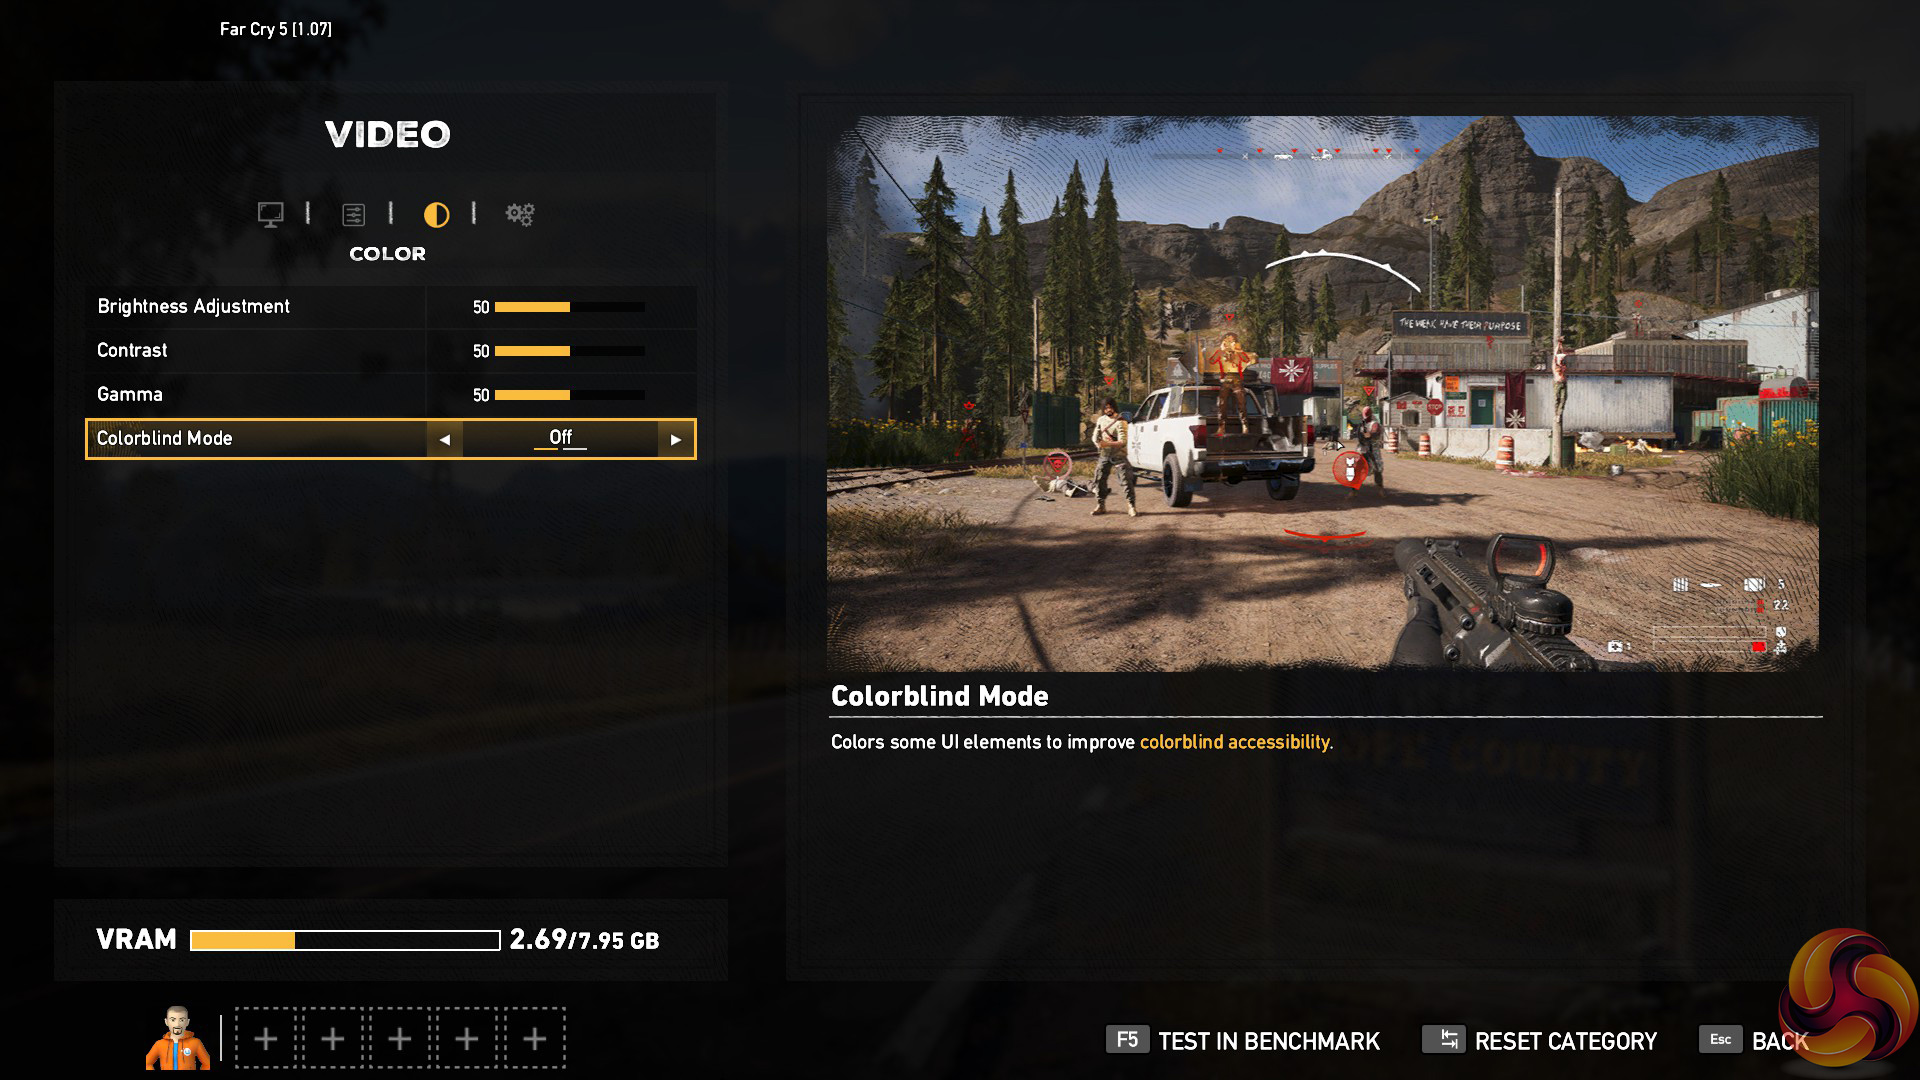
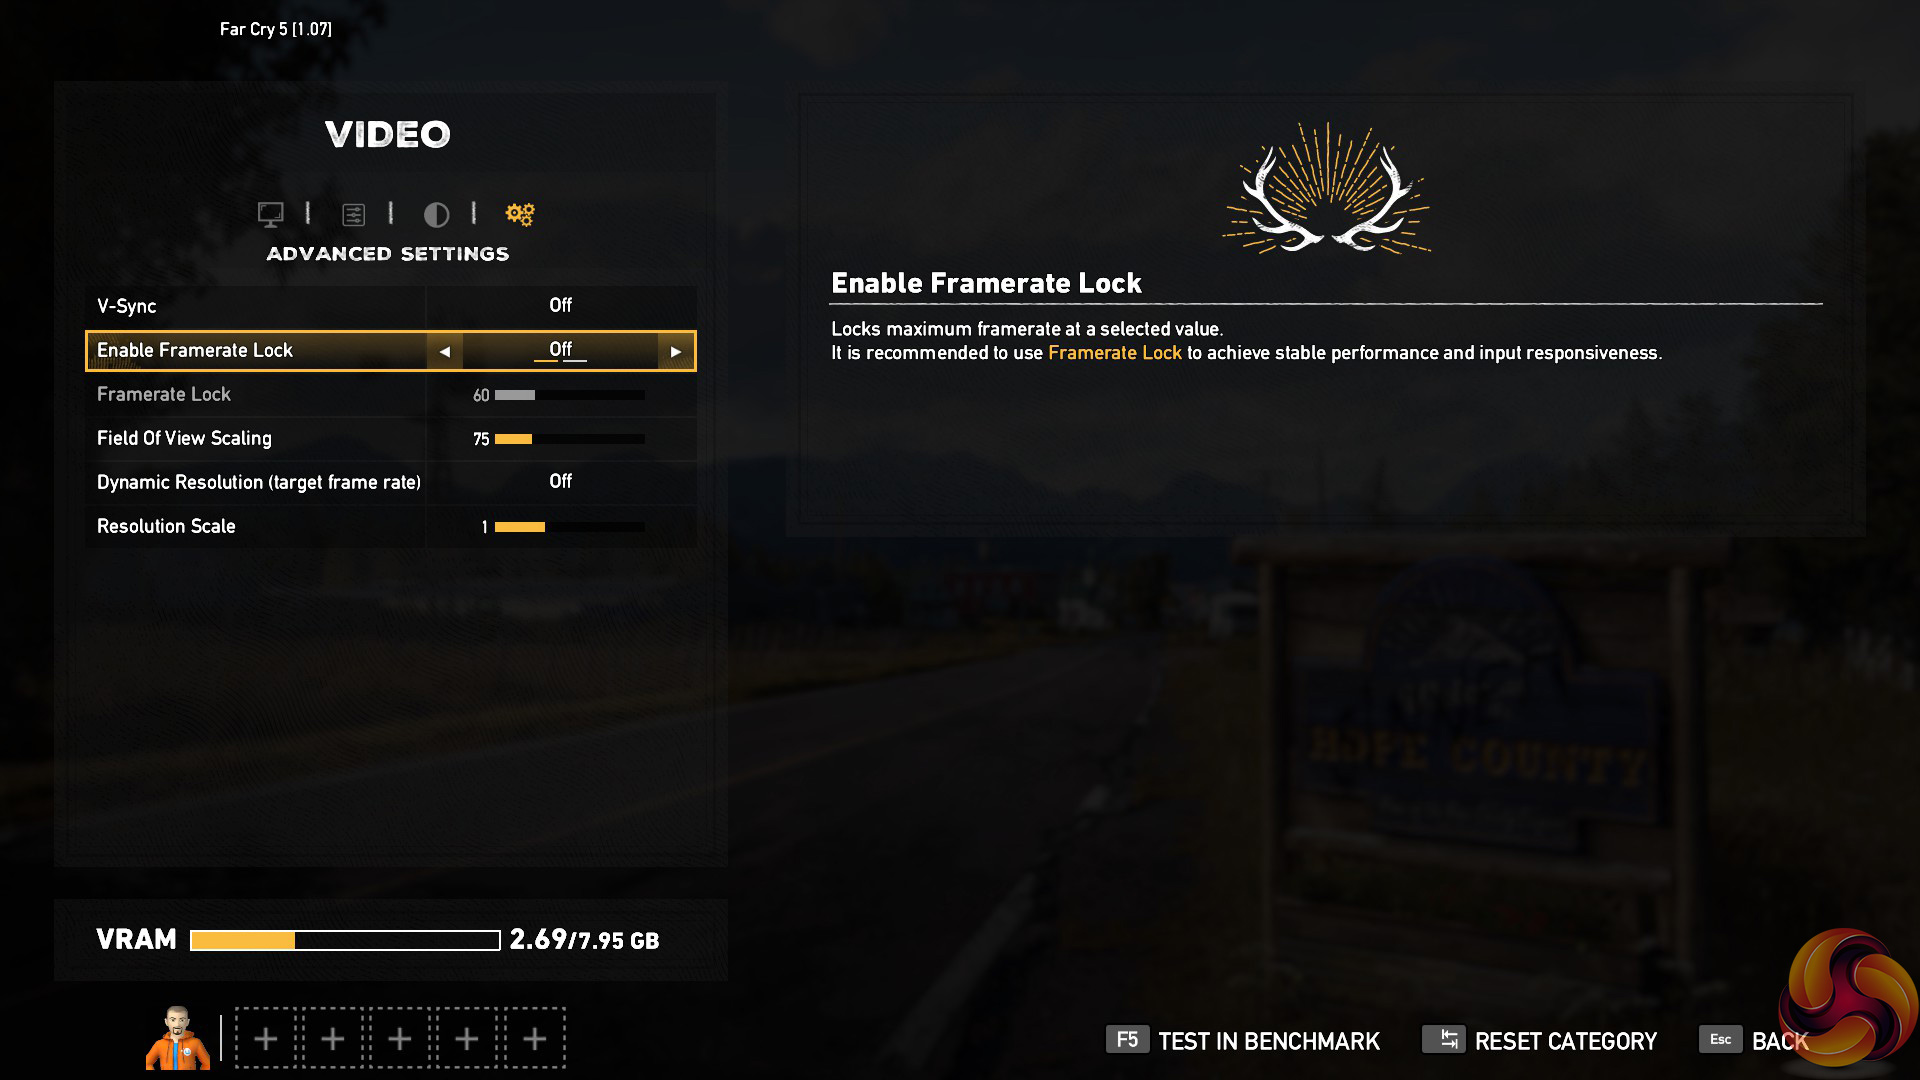
We test using the Ultra preset, with AA and motion blur disabled.
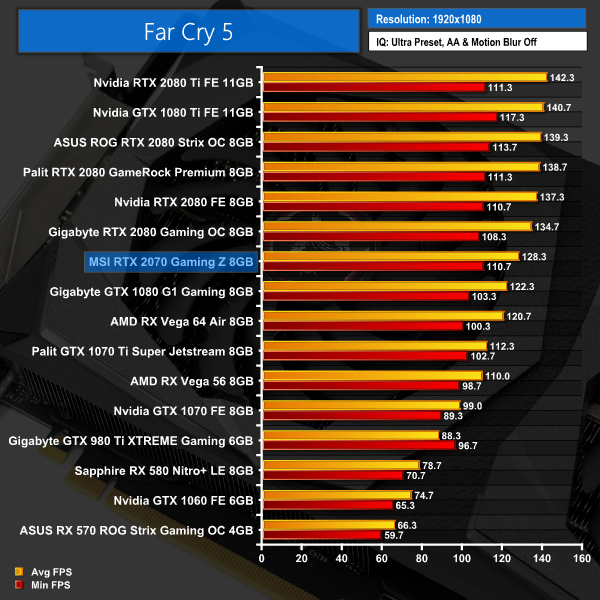
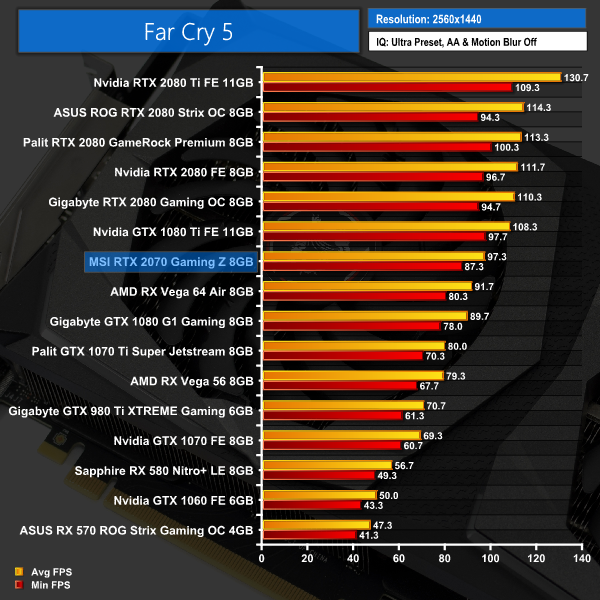
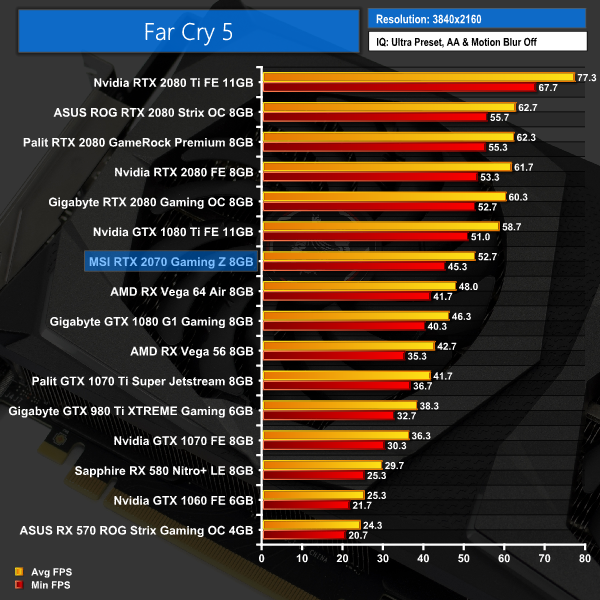
Far Cry 5 again has the RTX 2070 between the GTX 1080 and 1080 Ti, though the difference between the 2070 and 1080 is larger here. The 2070 is still 11FPS behind the GTX 1080 Ti at 1440p, however.Tom Clancy’s Ghost Recon Wildlands is a tactical shooter video game developed by Ubisoft Paris and published by Ubisoft. It was released worldwide on March 7, 2017, for Microsoft Windows, PlayStation 4 and Xbox One, as the tenth installment in the Tom Clancy’s Ghost Recon franchise and is the first game in the Ghost Recon series to feature an open world environment. (Wikipedia).
We test using the Very High preset.
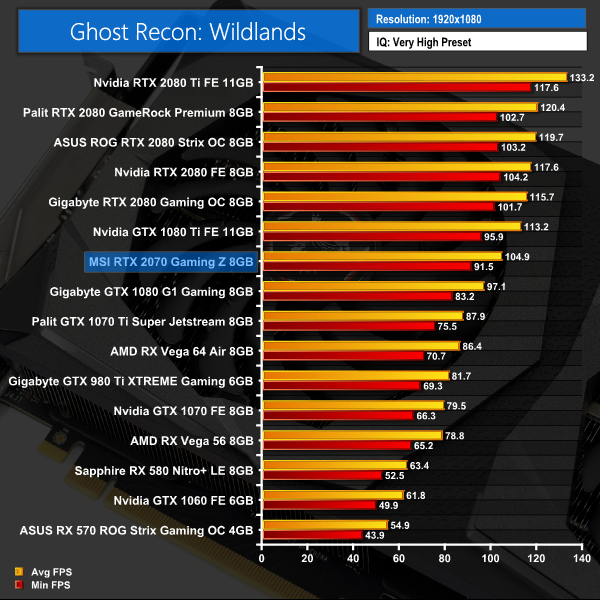

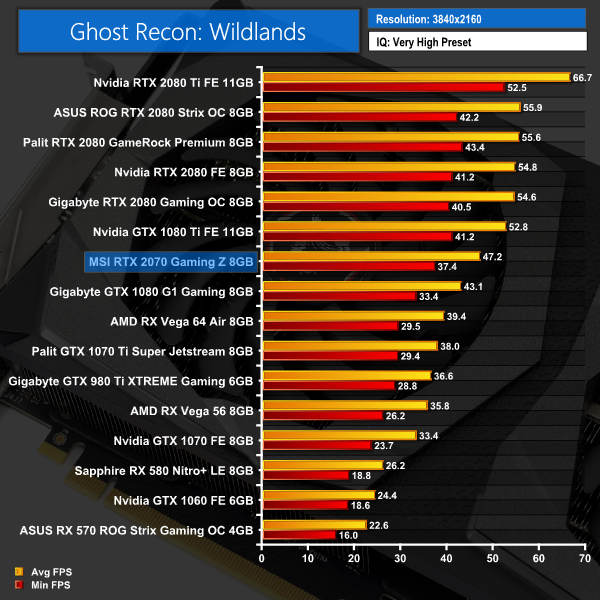
We now have a well-established trend – the RTX 2070 slots in almost perfectly right between the GTX 1080 and the 1080 Ti. This is best demonstrated by the 1440p results, where the 2070 is roughly 6FPS faster than the 1080, but about 6FPS slower than the 1080 Ti as well.Middle-earth: Shadow of War is an action role-playing video game developed by Monolith Productions and published by Warner Bros. Interactive Entertainment. It is the sequel to 2014’s Middle-earth: Shadow of Mordor, and was released worldwide for Microsoft Windows, PlayStation 4, and Xbox One on October 10, 2017. (Wikipedia).
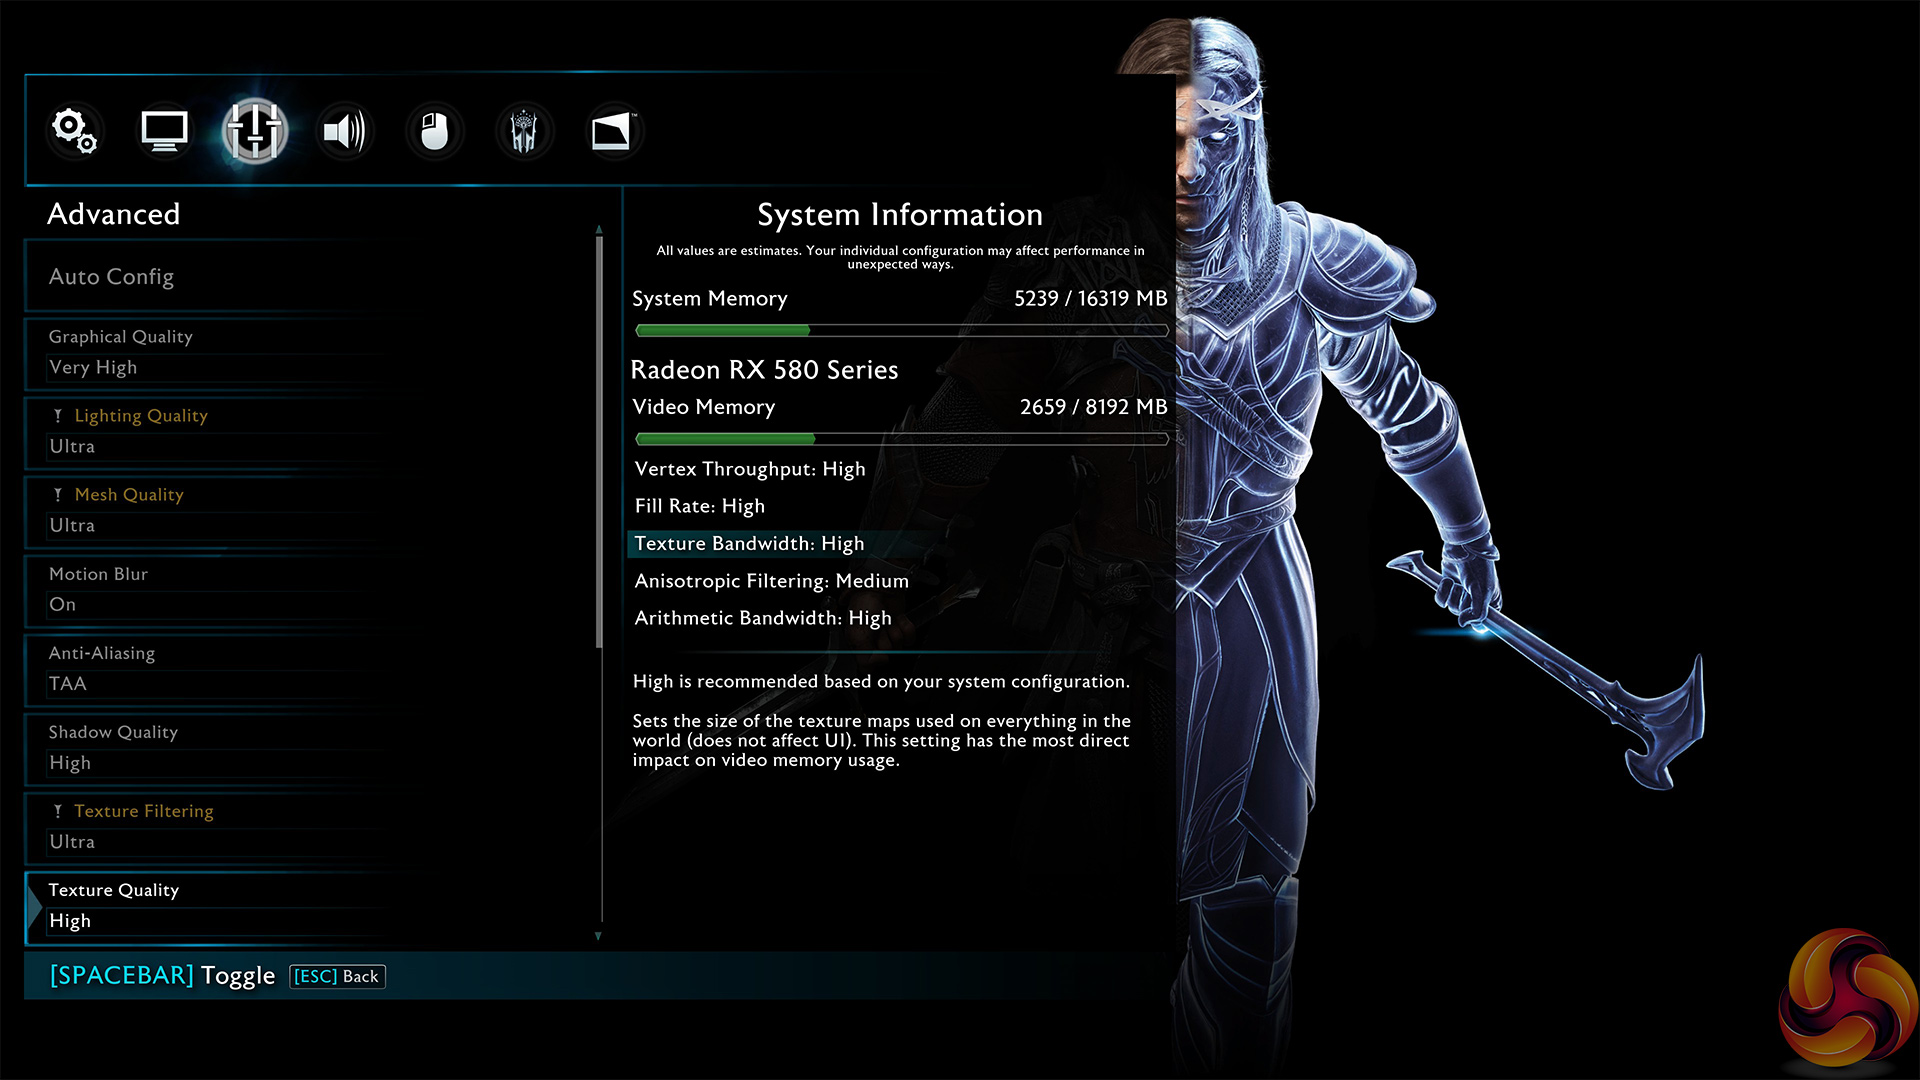
We test using the Very High preset.

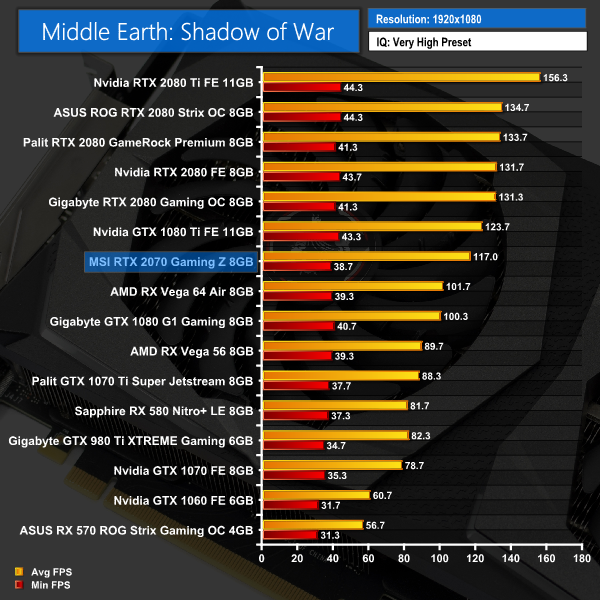
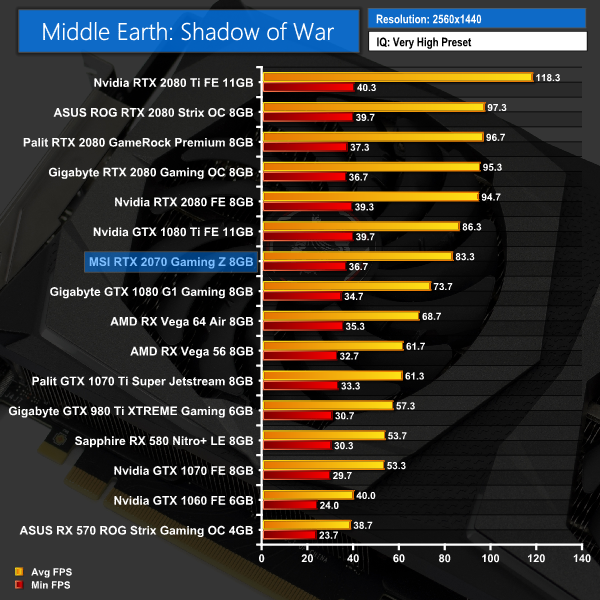
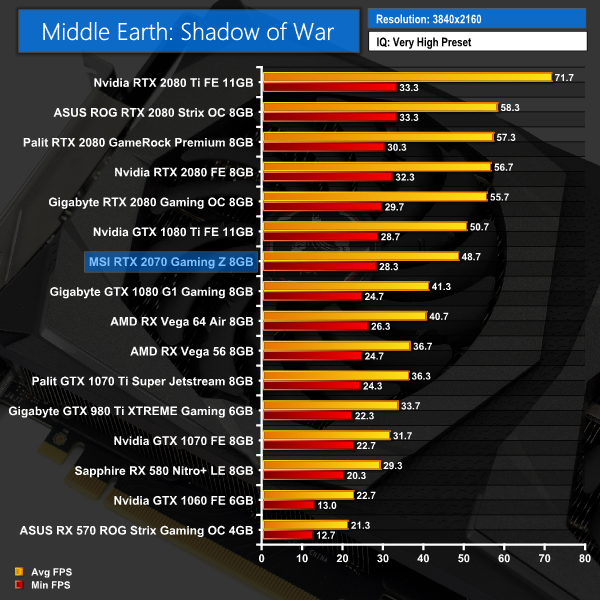
Middle Earth: Shadow of War has the RTX 2070 a lot closer to the performance of the GTX 1080 Ti than the other titles we've tested so far. For instance, it's only 6.7FPS slower at 1080p, but that makes it almost 17FPS faster than a GTX 1080.Shadow of the Tomb Raider is an action-adventure video game developed by Eidos Montréal in conjunction with Crystal Dynamics and published by Square Enix. It continues the narrative from the 2013 game Tomb Raider and its sequel Rise of the Tomb Raider, and is the twelfth mainline entry in the Tomb Raider series. The game released worldwide on 14 September 2018 for Microsoft Windows, PlayStation 4 and Xbox One. (Wikipedia).
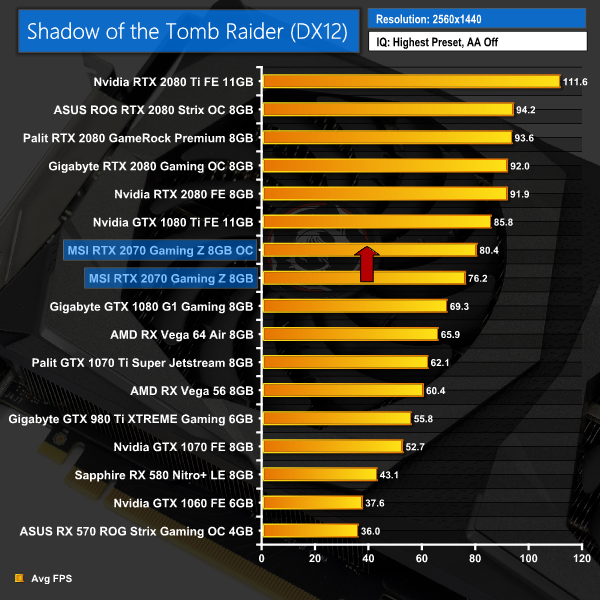
We test using the Highest preset, with AA disabled. We test using the DX12 API.
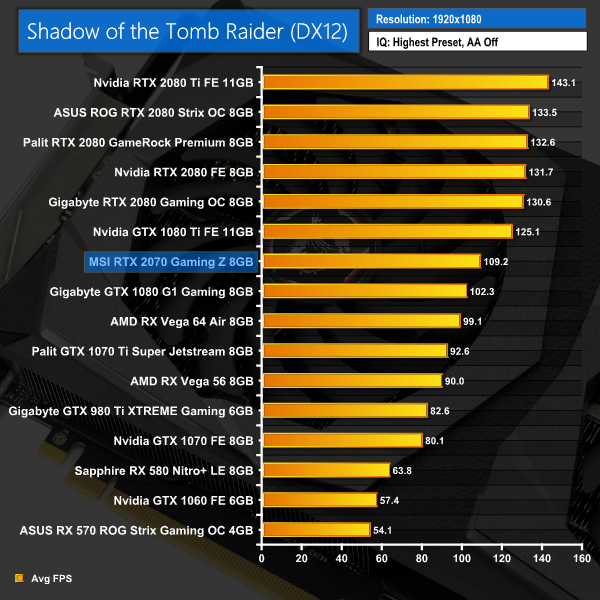
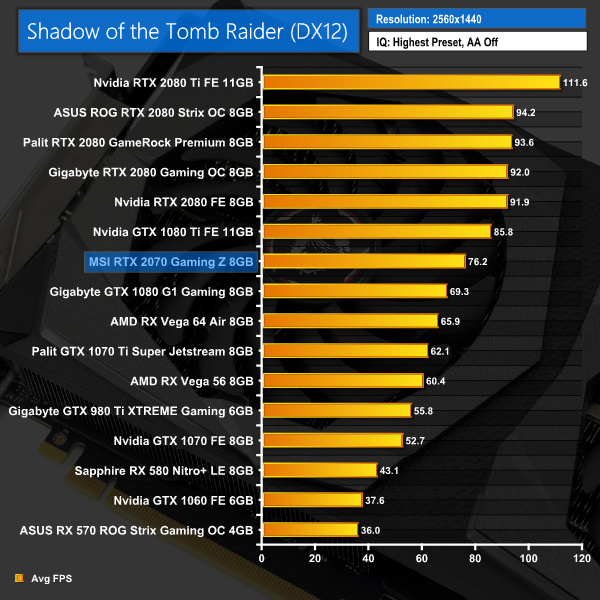
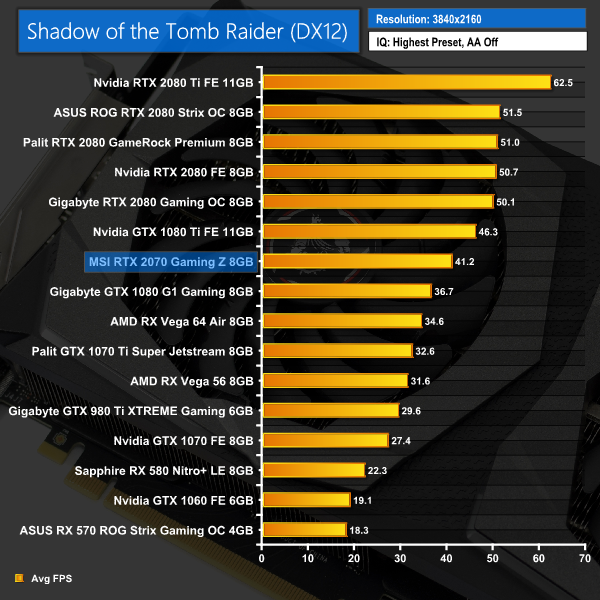
Rounding off our game tests, Shadow of the Tomb Raider again has the 2070 performing smack-bang in the middle of the GTX 1080 and 1080 Ti cards. It's about 6FPS faster than the GTX 1080 at 1440p, but close to 10FPS slower than the 1080 Ti at the same resolution.
As you are likely aware, while Microsoft's DXR update has now started rolling out, we are still waiting for games to implement real-time ray tracing so we can test the real-world performance of a ray traced game. Nvidia did release one demo for the press to use when testing the ray tracing capabilities of the Turing GPUs, however – it’s named ‘Reflections’ and you will likely have seen it plenty of times, it’s the short clip showing two stormtroopers mocking Captain Phasma. You can watch it on YouTube HERE.
While this demo shows an FPS counter while it is running, there is sadly no way to record average and minimum frame rates. The difference in frame rate is noticeable when run with different cards, though, so without being able to provide any exact benchmark figures, we filmed a short video to show you how the ray tracing demo performs with different GPUs:
As we can observe from the video, here are the trends exhibited by our five test cards:
- GTX 1080: The slowest card, the GTX 1080 ran the demo at 6-8FPS, with one or two moments where it jumped to 10FPS but no higher. It also dipped to 5FPS during the elevator scene.
- GTX 1080 Ti: This card ran the demo at between 8-10FPS. It did occasionally peak above 10FPS, but also dipped as low as 6FPS during the elevator scene. It did not look very smooth.
- RTX 2070: MSI's RTX 2070 Gaming Z ran the demo typically around the 33-38FPS mark, and would hit around 43FPS at its peak. In the elevator scene we saw the frame rate dip to around 29FPS.
- RTX 2080: A much better experience here, the RTX 2080 ran the demo between 43-48FPS, with some peaks into the mid 50s. It did drop down to 35FPS during the intensive elevator scene, but overall a smooth viewing experience.
- RTX 2080 Ti: Proving even better still, the RTX 2080 Ti ran the demo around the 55-60FPS mark, with peaks almost at 70FPS. It again dipped to 46FPS, but the trend is clear to see.
Looking at the RTX 2070's performance in this demo, we saw about 4 times the FPS compared to a GTX 1080 Ti – so even though the 2070 has less RT cores than the 2080 and 2080 Ti, it still has a clear advantage over the 1080 Ti.
We can't yet say how this will translate into real-world game performance, however – but all the signs are there that the Turing cards will be able to deal with ray traced games significantly better than Pascal.We are in a similar situation with Deep Learning Super Sampling (DLSS) that we are with ray tracing – no game on the market currently supports it, though that should hopefully change soon. It is a Turing-specific feature, though, so it won’t be available to those with Pascal (or older) GPUs.
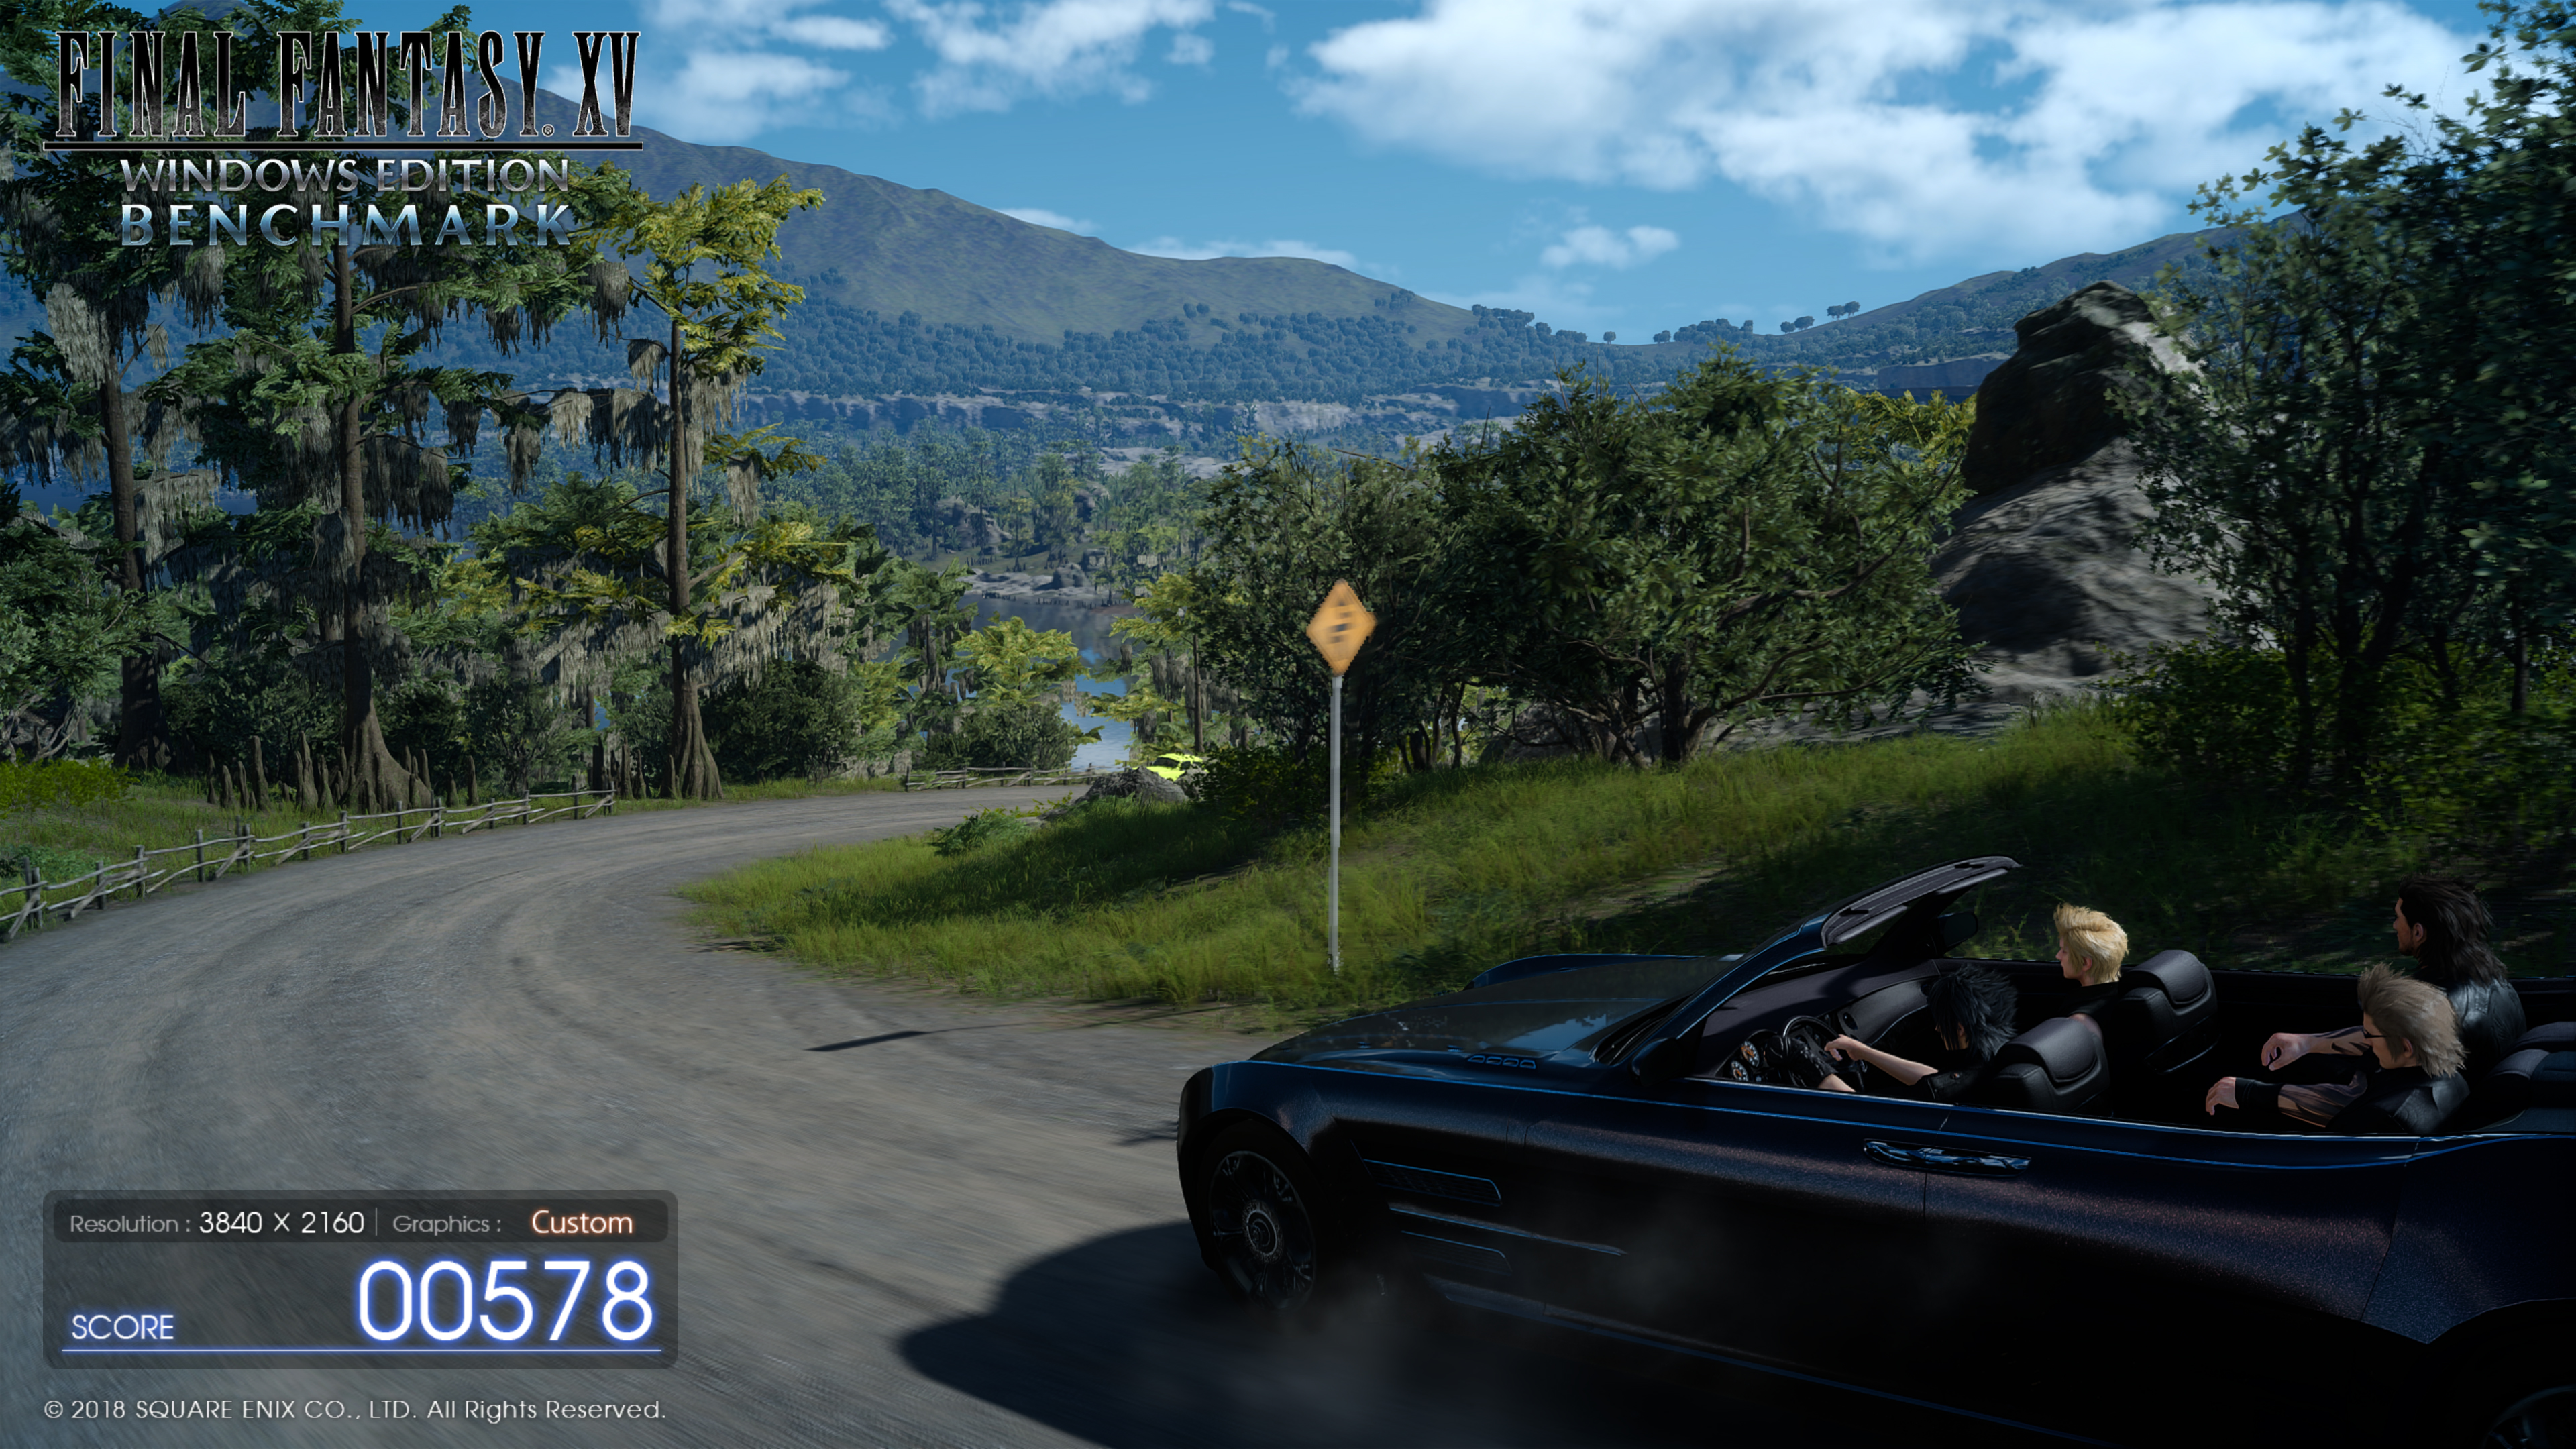
Nvidia supplied another demo for the purposes of this review – this time from Final Fantasy XV. We were able to run the demo at 4K with both TAA and DLSS anti aliasing solutions. We used FRAPS to extract minimum and average FPS figures, after a 1-minute run.
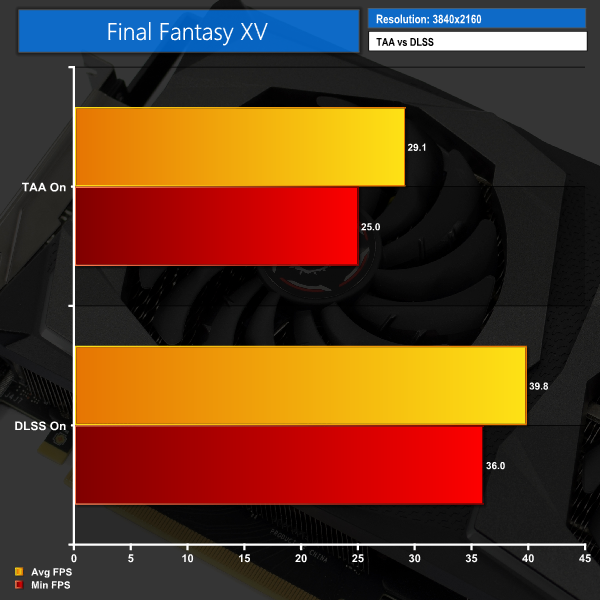
DLSS certainly helps performance with Turing GPUs – we can see the average frame rate rose by 36.7% when running TAA vs DLSS on the MSI Gaming Z RTX 2070. The minimum frame rate rose by a full 44%.
So, that’s the performance from the demo, what about visual fidelity?
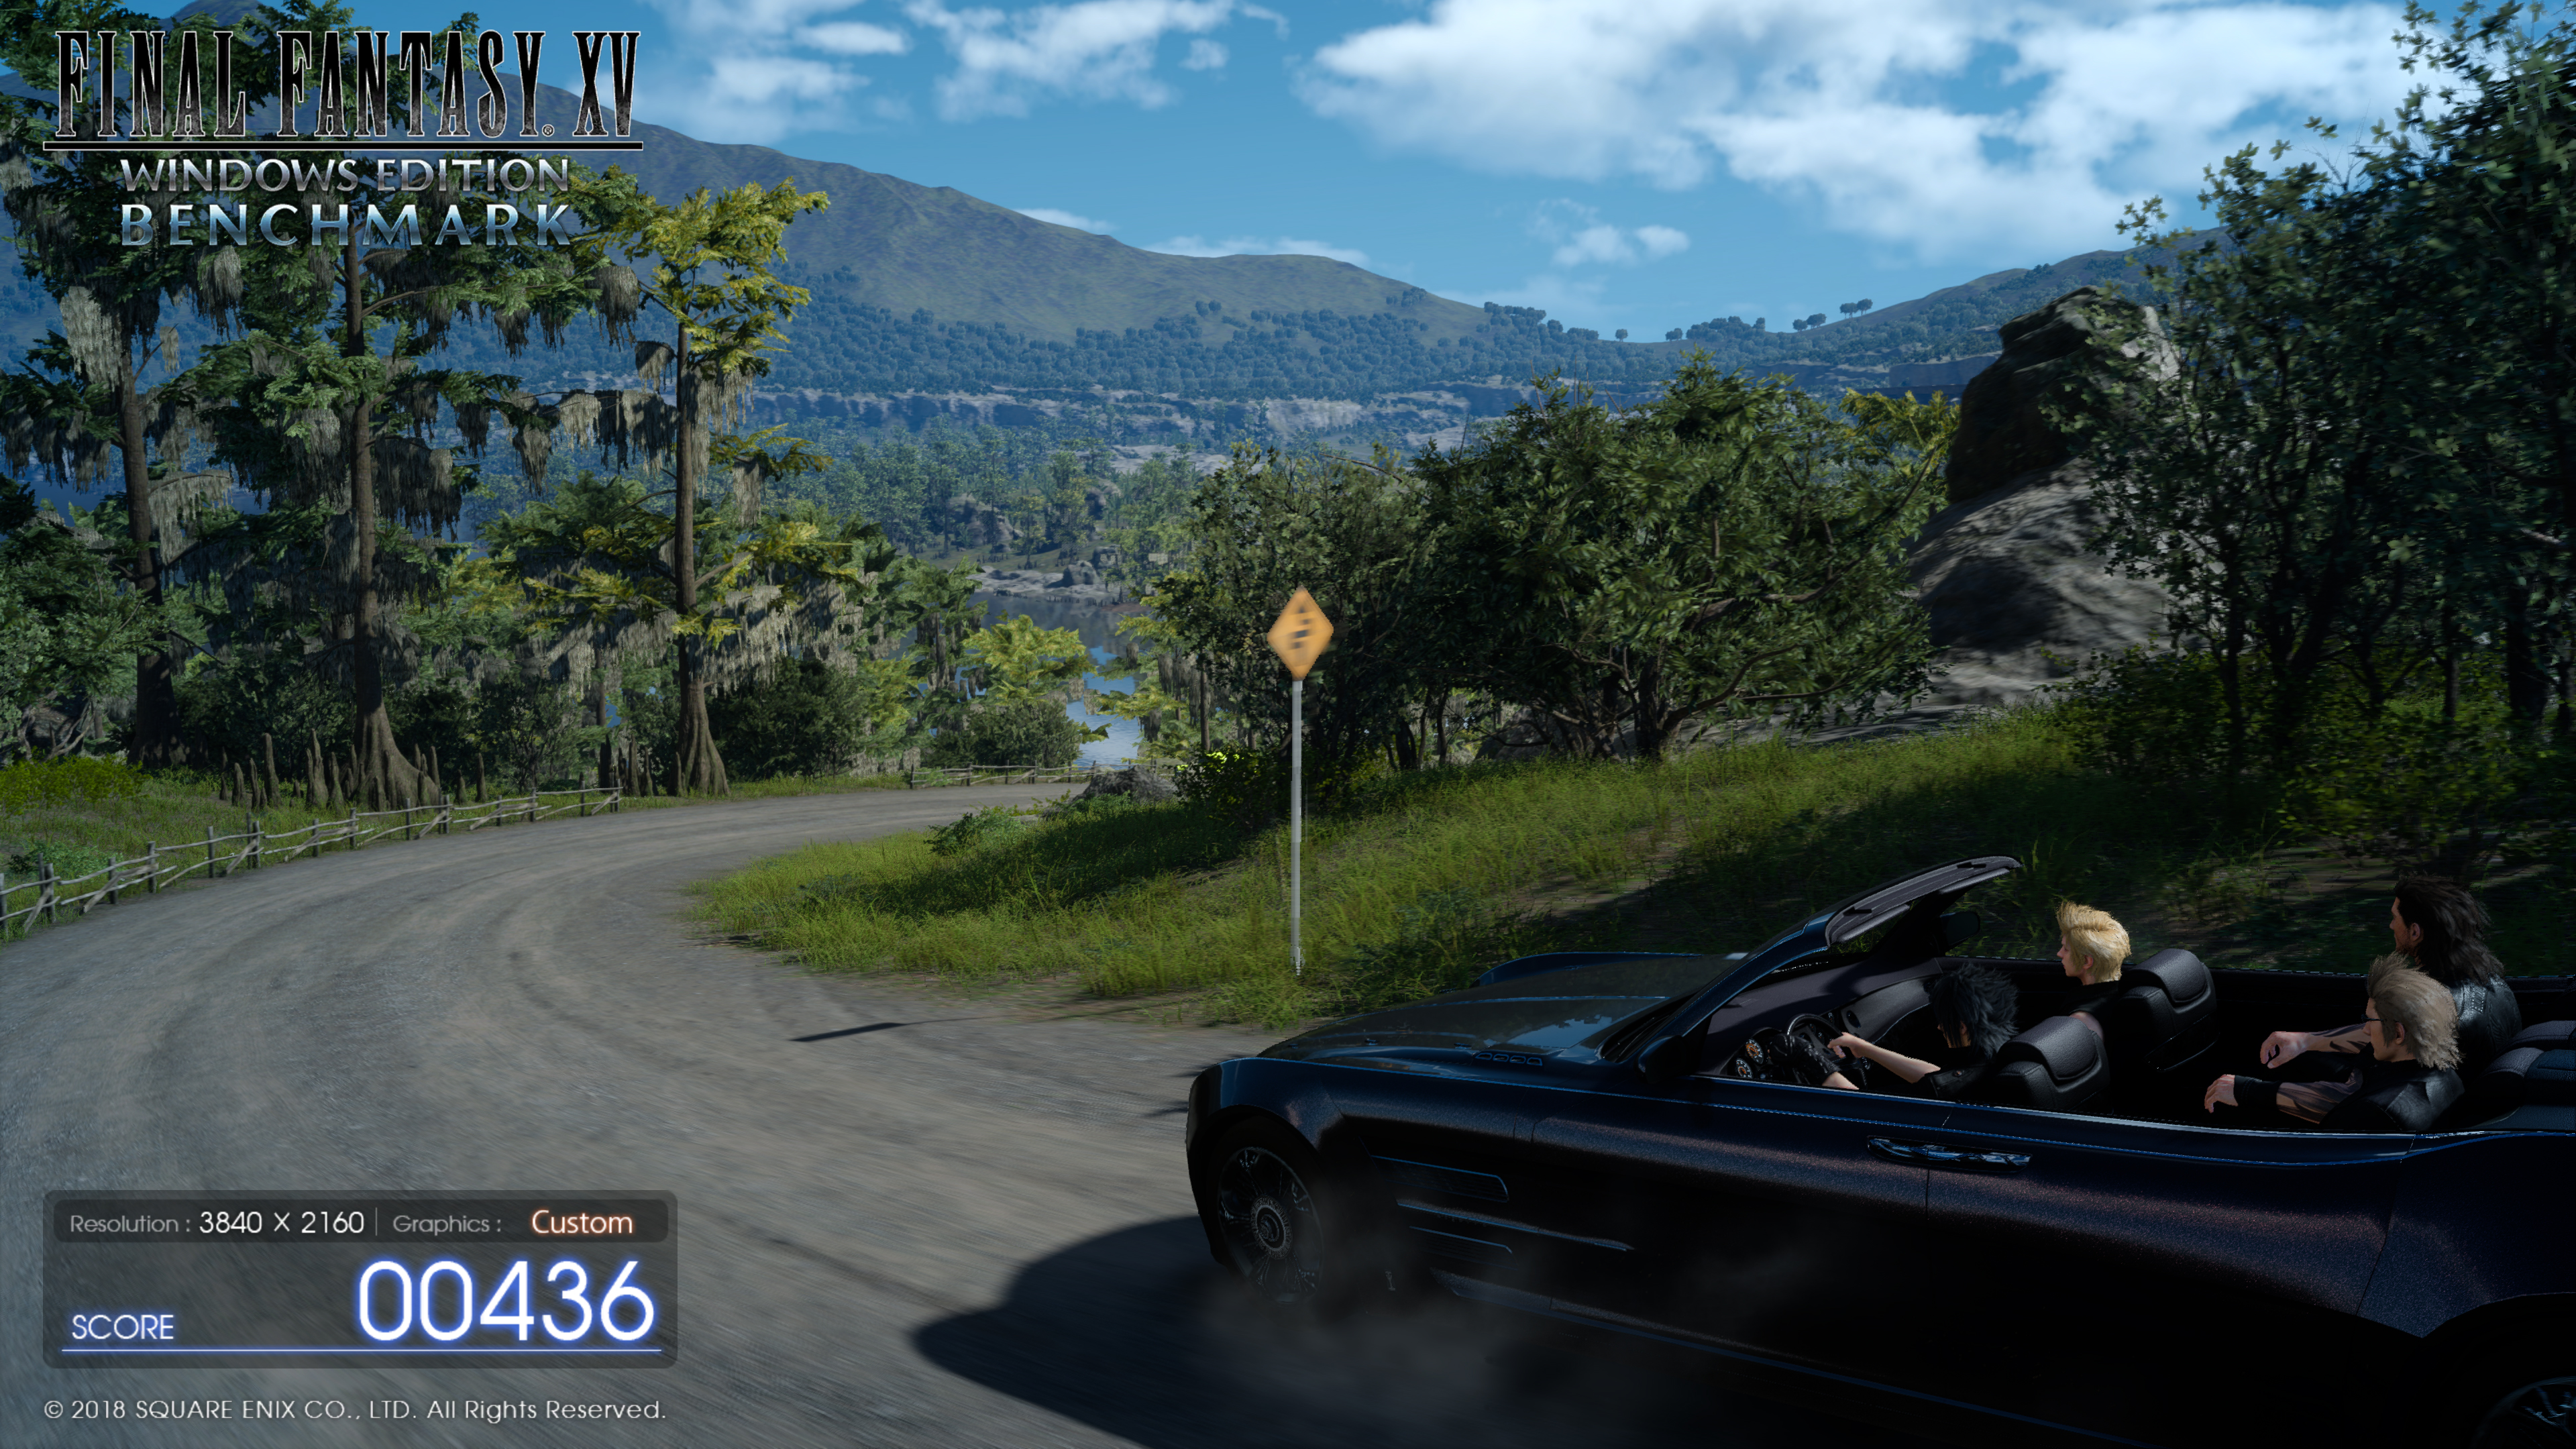
TAA on, left, versus DLSS on, right
The above screenshots were taken directly from the FFXV demo running DLSS vs TAA. On the left we have the demo running 4K TAA on, and on the right the demo is at 4K with DLSS on instead. From this big-picture view, it may not look like there is much between the two.
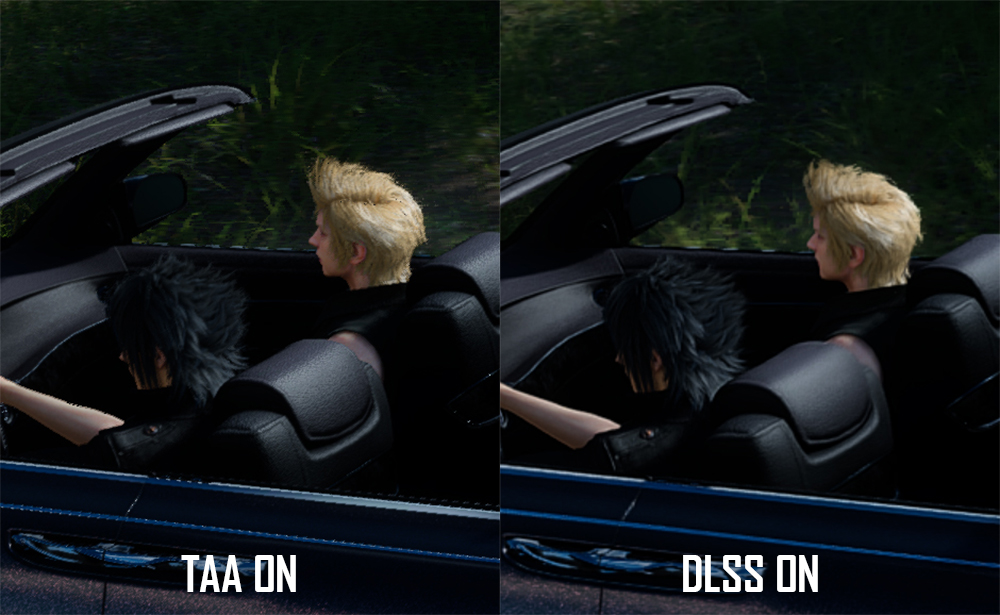
When we really crop in close, however, I think the difference is clear to see. TAA has noticeably more ‘jaggies’, while there are also some artifacts around the blonde hair. DLSS does look overall a bit softer, but it is noticeably smoother and overall a better-looking image.
I look forward to testing this further in a real-world in-game environment. This demo certainly paints a promising picture, and we expect Shadow of the Tomb Raider to be the first mainstream game to implement DLSS – but for now, this demo will have to do.
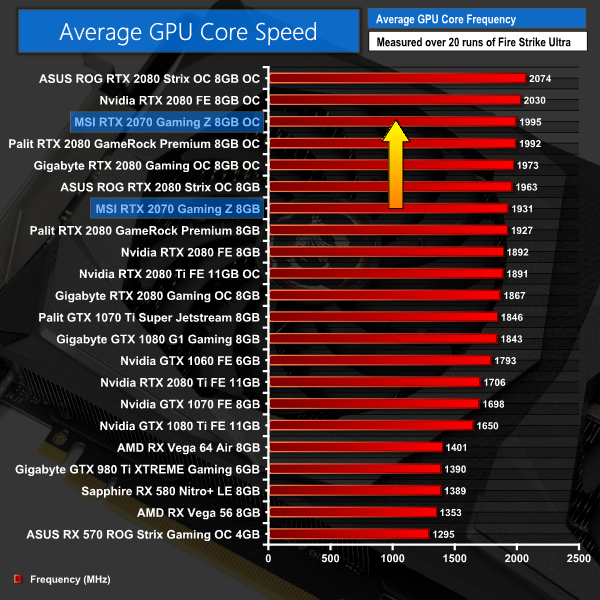
Here we present the average clock speed for each graphics card while running the 3DMark Fire Strike Ultra stress test 20 times. We use GPU-Z in tandem with the Powenetics Project to record the GPU core frequency during the Fire Strike Ultra runs – at the end, we are left with around 4300 data entries.
We calculate the average core frequency during the entire 20-run test to present here.
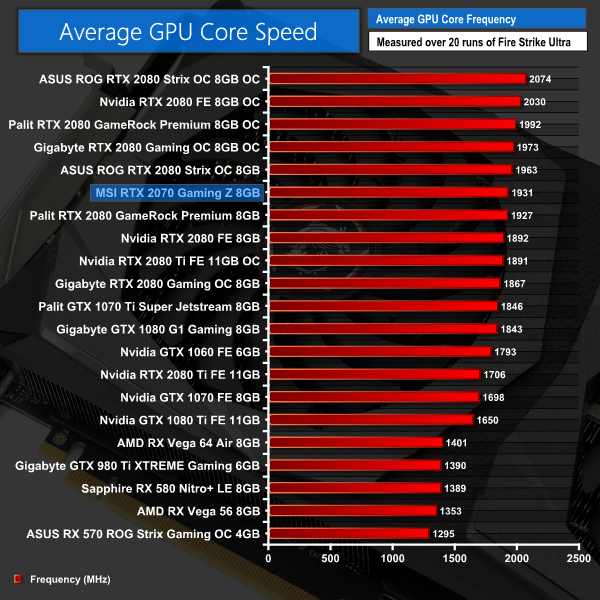
Despite the Gaming Z's rated boost clock being 1830MHz, we saw it average 1931MHz right out of the box. The card was remarkably consistent in its frequency, too – usually we see lots of fluctuations, but the Gaming Z held between 1920-1935MHz for almost the entire duration of the 3DMark stress test.
Obviously this is our first RTX 2070 card so we don't yet have any direct comparison data – but I would expect this to be one the highest clocked, if not the highest, RTX 2070 cards thanks to its hefty factory overclock.For our temperature testing, we measure the peak GPU core temperature under load, as well as the GPU temperature with the card idling on the desktop. A reading under load comes from running the 3DMark Fire Strike Ultra stress test 20 times. An idle reading comes after leaving the system on the Windows desktop for 30 minutes.
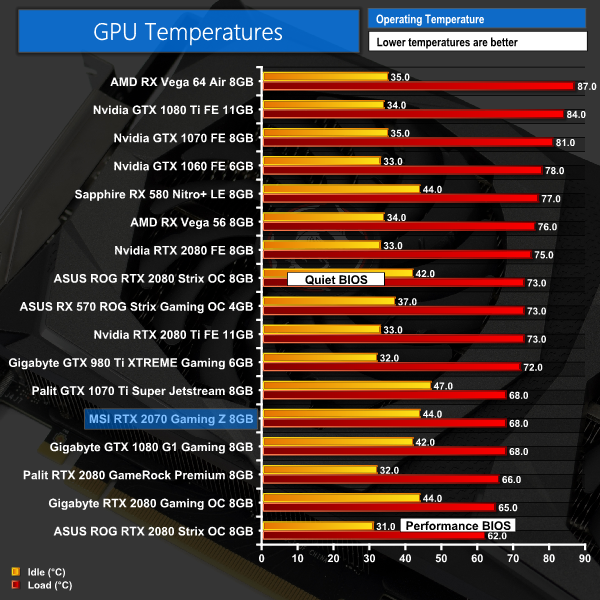
A peak of 68C is a very good result for an aftermarket card – we can't say how much cooler than the Founders 2070 this would be, but you can clearly see it is one of the coolest-running cards we have tested so far. The idle temperature is relatively high at 44C, but this is because the fans stop spinning once the card drops below 60C – so it doesn't idle as cool as a card that keeps the fans spinning at all times.
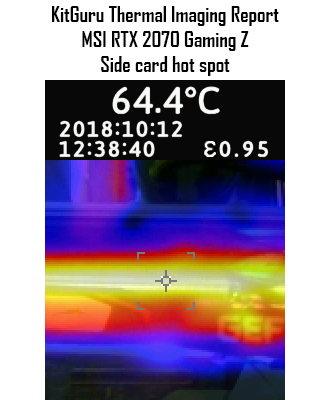
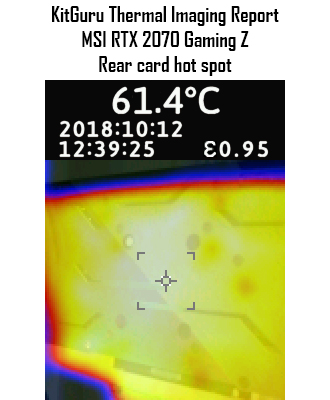
Our thermal gun shows excellent results as well, with a peak of just 64.4C on the front of the card, and 61.4C on the back – not surprisingly, this reading was taken from the area directly behind the GPU core. Still, both results are fantastic and show the 7th gen Twin Frozr cooler is certainly up to the task.We take our noise measurements with the sound meter positioned 1 foot from the graphics card. I measured the sound floor to be 34 dBA, thus anything above this level can be attributed to the graphics cards. The power supply is passive for the entire power output range we tested all graphics cards in, while all CPU and system fans were disabled.
A reading under load comes from running the 3DMark Fire Strike Ultra stress test 20 times. An idle reading comes after leaving the system on the Windows desktop for 30 minutes.
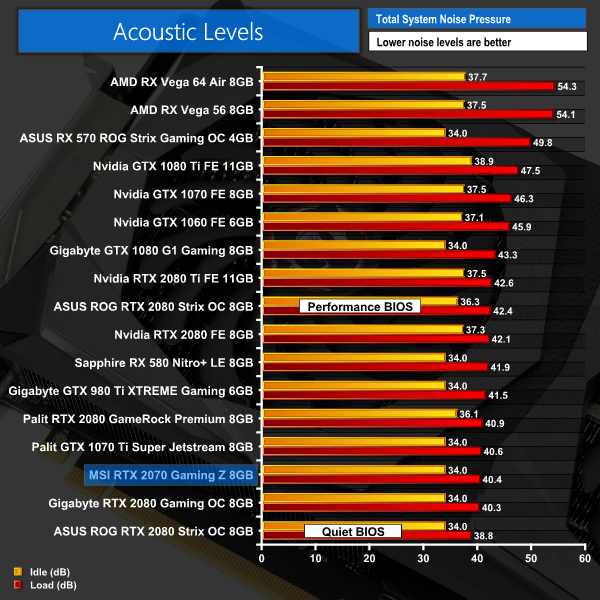
We've already seen that the Gaming Z is a cool-running card – but it is very quiet as well. In fact, it is the third-quietest card I've tested to-date – and one of those results came from running a BIOS specifically optimised for silence, so that only makes the MSI look even more impressive.
We already mentioned the fans stop spinning once the core temperature drops below 60C, and this obviously means silent operation when performing lights tasks or just idling on the desktop. It's overall very impressive.We have recently revamped our GPU power consumption testing. Previously we would measure the total system power draw with each graphics card installed. Given that the rest of the components did not change, this gave us an idea of the relative power consumption of each graphics card, but we could not be more specific than that.
Now, however, thanks to Cybenetics Labs and its Powenetics Project, we are able to measure the power consumption of the graphics card alone, giving much more precise and accurate data. Essentially, this works by installing sensors in the PCIe power cables, as well as the PCIe slot itself thanks to a special riser card. This data is recorded using specialist software provided by Cybenetics Labs and given it polls multiple times a second (between 6 and 8 times a second, based on my observations) we can track the power consumption in incredible detail over any given amount of time.
You can read more about the Powenetics Project over HERE.
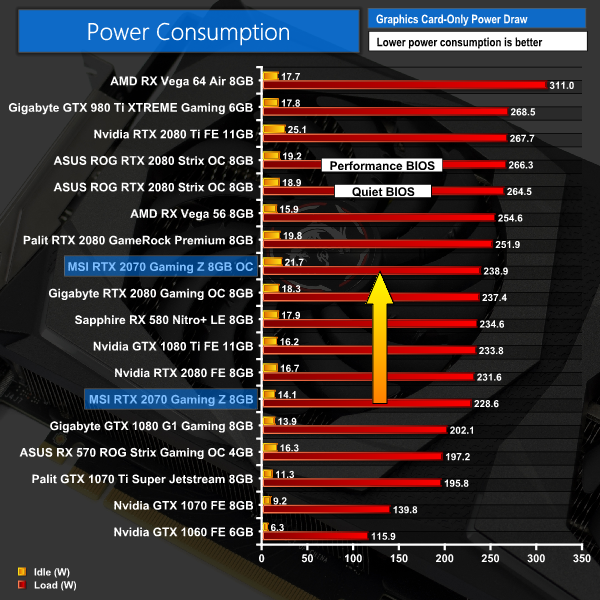
As with previous testing, a reading under load comes from running the 3DMark Fire Strike Ultra stress test 20 times. An idle reading comes after leaving the system on the Windows desktop for 30 minutes. This stress test (20 runs) produces approximately 4300 data entries in the Powenetics software, which we can then export to an Excel file and analyse further. Here we present the average continuous power consumption of each graphics card across the entire 20 run test.
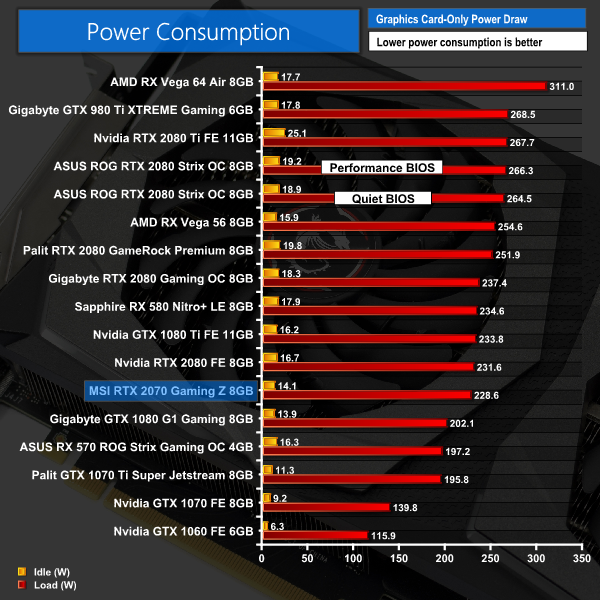
With power consumption averaging just over 228W, this means the RTX 2070 Gaming Z is only slightly more frugal than the RTX 2080 Founders Edition. Power consumption for Nvidia's Founders 2070, however, is rated at 185W so we can certainly attribute a fair amount of the Gaming Z's extra power draw to its increased clock speed – after all, it was running at 1931MHz out of the box.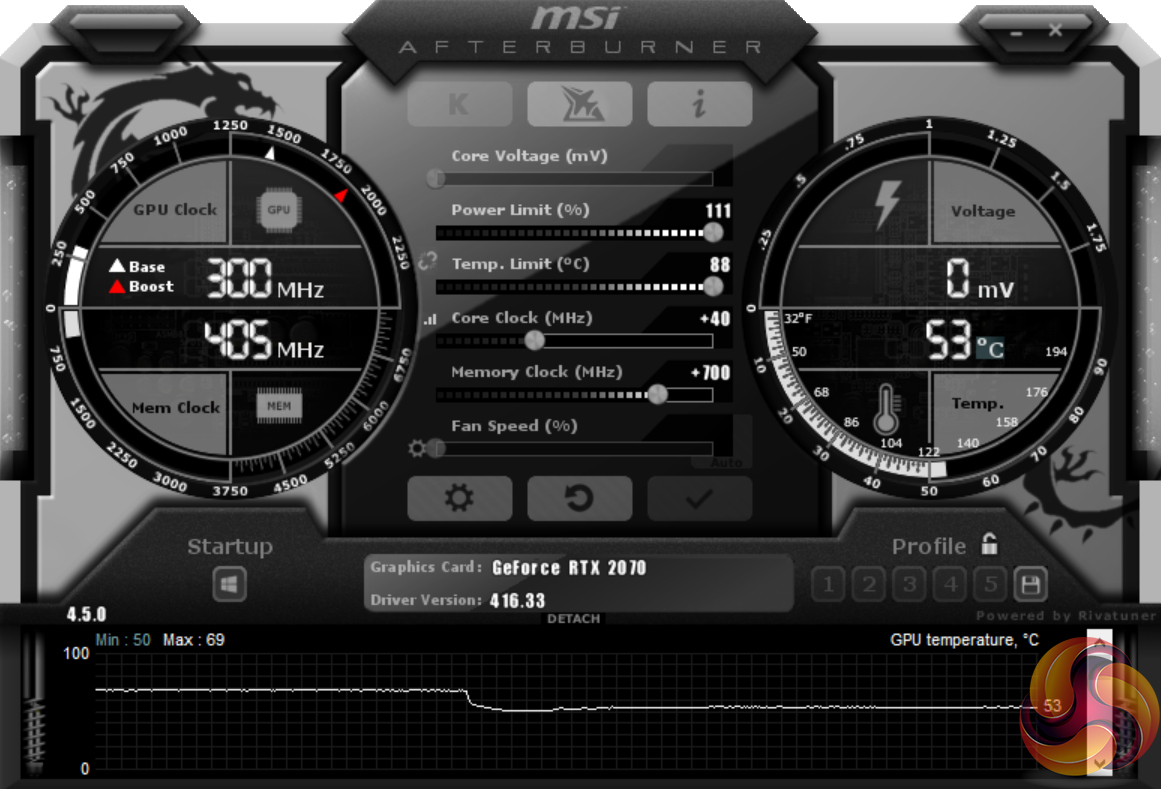
To overclock the Gaming Z, we used MSI Afterburner. We maximised the power limit and temperature target sliders, before adding +40MHz to the core and +700MHz to the memory. This isn't a whole lot of extra clock speed – but we do have to remember the Gaming Z ships with a fairly aggressive factory overclock in the first place, so manual overclocking headroom is limited.
3DMark and Games Testing

This overclock – even if not hugely significant – still brought some decent gains. We saw our frame rate jump up by about 4FPS when gaming at 1440p, while our Fire Strike score also rose over 1200 points – a 5.4% increase.Here, we take a further look at the impact of our overclock, looking at the increased temperatures, acoustics, power draw, and lastly, the effect had on the average clock speed.
Temperatures

Acoustics

Power consumption
Average clock speed under load
Overview
Looking at the thermals, it is impressive to see the Gaming Z only ran 1C hotter when overclocked – its noise levels barely rose as well, meaning there's very little reason not to run the overclock. Power consumption rose about 10W, which is again going to make very little difference in the real world.
In terms of the clock speed, we saw the Gaming Z run at 1995MHz when overclocked, so a total of 64MHz faster than its stock frequency. As we mentioned, it is not a huge leap as overclocking headroom is limited, but almost 2GHz on the core is impressive nonetheless. It will be interesting to see how other RTX 2070 solutions compare in the coming weeks and months.With the launch of Nvidia's RTX 2070 cards, today we have analysed the custom cooled MSI RTX 2070 Gaming Z 8G.
We'll start with the card itself, and I have to say this is the best-looking aftermarket RTX card I have seen so far. I love the gunmetal grey and black shroud, while the two-tone brushed metal backplate looks fantastic. RGB fanatics will also find a lot to like with MSI's LED implementation.
On top of its good looks, the Gaming Z runs very cool – we saw it peak at just 68C. This makes it one of the coolest-running cards we've tested over the last 6 months. Considering it is very quiet as well – you would be very hard pressed to hear it once installed in a case – we think MSI has done a very good job with its 7th generation Twin Frozr cooling solution.
We did see power consumption figures about 40W higher than what Nvidia's Founders Edition card is rated for, but we have to remember the Gaming Z is clocked 120MHz faster than that card and thus it is going to draw more power as well. It is unlikely to bother anyone spending £500+ on a graphics card.
The big question mark, however, has always been about how the RTX 2070 performs in games – Nvidia has stayed very quiet on the matter. Before diving into a breakdown of the performance, you do have to remember the Gaming Z is a top-end RTX 2070 with a custom PCB and factory overclock. So it is essentially a best-case scenario for the RTX 2070.
With that being said, we'll start by comparing it to the GTX 1080. At 1440p, we saw the 2070 perform on average 9% faster than the 1080, and at 4K it was closer to 13% faster than a 1080. The GTX 1080 Ti, however, is on average 11% faster than the 2070 at both 1440p and 4K resolutions.
Those figures are taken from games you can go out and play today – so we don't yet know how ray tracing and DLSS will affect actual games. The test demos we've seen – provided by Nvidia – are obviously promising and do show that Turing is several times better at ray tracing than Pascal. Even then, though, we don't know how that will translate into actual gameplay, especially when the first games with ray tracing support will use a hybrid method of rendering – Shadow of the Tomb Raider, for instance, will have ray traced shadows but rely on rasterisation for the rest of the image. How Turing will perform in that situation, we just don't know.
Pricing is also tricky for the RTX 2070. Nvidia's Founders Edition will cost £569 – and while we have not yet been able to find an actual retail price, the MSRP for the MSI Gaming Z is £605.99. Nvidia has told us to expect more reference-clocked RTX 2070 cards, with a ‘suggested MSRP' of £459 here in the UK, but I can only judge what I have tested, and that is this MSI card for £605.
Looking on Overclockers UK, the cheapest GTX 1080 Ti is a custom card from Gigabyte, priced at £639 – over the weekend it was even lower at £599. That means, for just an extra £34, you could get a 1080 Ti instead of the RTX 2070, and that will perform about 11% faster than the 2070 in games you can actually play today. Even if we compare with a GTX 1080, custom solutions now start at £499 – meaning you will pay £105 more for this 2070 than the cheapest 1080, and get a performance increase of between 9-13%.
For me, I have to say the RTX 2070 at £600 is a tough sell. Matters are not helped by the fact that the xx70 series cards have traditionally been bang-for-buck favourites – both the GTX 970 and 1070 cards were immensely popular with gamers because they offered a sensible middle ground between price and performance. I don't feel like the MSI Gaming Z 2070 is appealing in the same way.
Of course, we are looking at a flagship 2070 card here – cheaper cards at Nvidia's £459 MSRP could well offer better value, especially if we can actually see some ray tracing benchmarks for games you can go out and play today. Until I can review RTX 2070 cards at that price, however, I can't say what they would be like.
For now, though, the MSI RTX 2070 Gaming Z 8G is undoubtedly a fine card – it is cool, quiet, and ships with a hefty factory overclock. Until we actually know what ray tracing is going to be like in games, though, I can't help but feel those spending £600 on a graphics card would be better served with a GTX 1080 Ti.
At the time of writing, we are still waiting for retailers to list RTX 2070 cards – we will update this review when we have a buy link.
Pros
- Very good-looking with stylish backplate.
- Cool and quiet.
- Runs very fast out of the box.
Cons
- Just £35 cheaper than GTX 1080 Ti – which is 11% faster.
- We still don't know how ray tracing will perform in real games.
KitGuru says: The MSI RTX 2070 Gaming Z 8GB is a great card. Its highly clocked, performs well in games and runs cool. Sadly without Ray tracing games available right now it is a tough sell against the slightly more expensive GTX 1080 ti.

Be sure to check out our sponsors store EKWB here