
Samsung has updated its hugely popular SSD 970 EVO series with the company's latest 5th generation V-NAND TLC memory to produce the 970 EVO Plus. Does it make any difference to real world performance, and is it worth the £240 asking price?
Samsung's 5th generation V-NAND 3-bit MLC, or TLC V-NAND to you and me, sees the layer count rise up from the 64-layer of the previous generation to ‘9*-layer'. as stated by Samsung. This is a surprising move by Samsung as they are usually keen to let everyone know how exactly many layers their NAND has.
At launch the M.2 2280 970 EVO Plus range consisted of three capacities; 250GB, 500GB and the flagship 1TB model which we are looking at here.
The latest NAND and firmware updates to the Samsung Phoenix controller gives the 970 EVO Plus some pretty good performance improvements over the good old 970 EVO. The 1TB SSD 970 EVO Plus is official rated at up to 3,500MB/s for Sequential reads and up to 3,300MB/s for writes compared to up to 3,400MB/s and 2,500MB/s for read/writes respectively for the SSD970 EVO.
Samsung quote two queue depth figures for 4K random performance of the new drive. At QD1 the drive is rated as up to 19,000 IOPS for reads and 60,000 IOPS for writes which is up from the 15,000 IOPS and 50,000 IOPS figures respectively for the 970 EVO. At a much deeper QD of 32 the drive is rated as up to 600,000 IOPS for reads and 550,000 IOPS for writes. Again this is an improvement over the original 970 EVO drive which has a read rating of up to 500,000 IOPS and 450,000 IOPS for writes.
Endurance for the 1TB SSD970 Plus is quoted as 600 TBW (the same as the original SSD970 EVO) and Samsung backs the drive with a 5-year warranty.
Physical Specifications:
Usable Capacities: 1TB.
NAND Components: Samsung 9*-layer TLC V-NAND.
NAND Controller: Samsung Pheonix.
Cache: 1GB LPDDR4.
Interface: PCIe Gen 3.0 x4, NVMe 1.3.
Form Factor: M.2 2280.
Dimensions: 80.15 x 22.15 x 2.38mm
Drive Weight: 8g
Firmware Version: 1B2Q
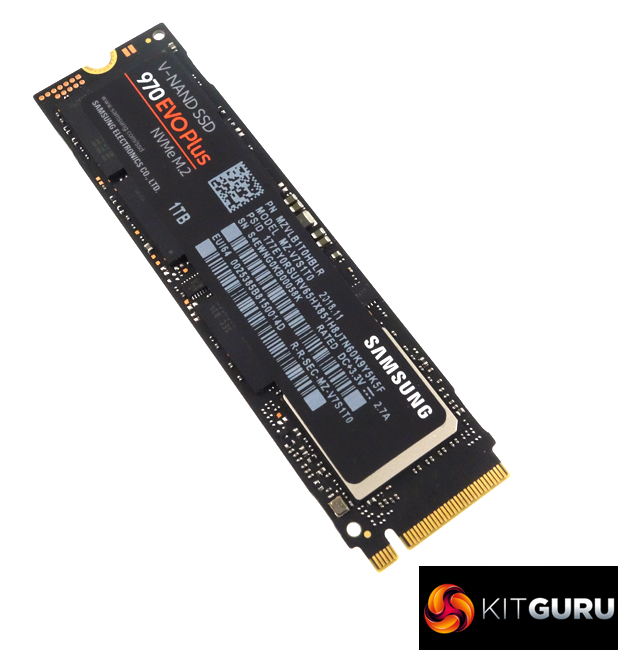
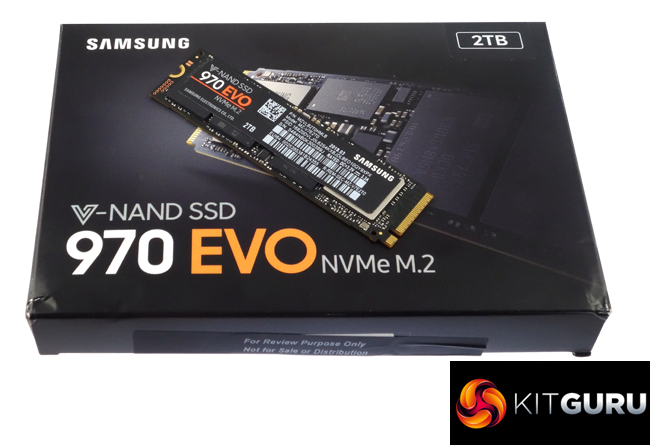
Samsung’s SSD970 EVO Plus comes in a compact black box with a large image of the drive on the front. On the top right hand side of the box we find a sticker displaying the drive’s 1TB capacity.
The rear of the box has a multilingual information panel giving the web address for more detailed warranty information. To the right of this is a reminder that the drive has a 5-year limited warranty.
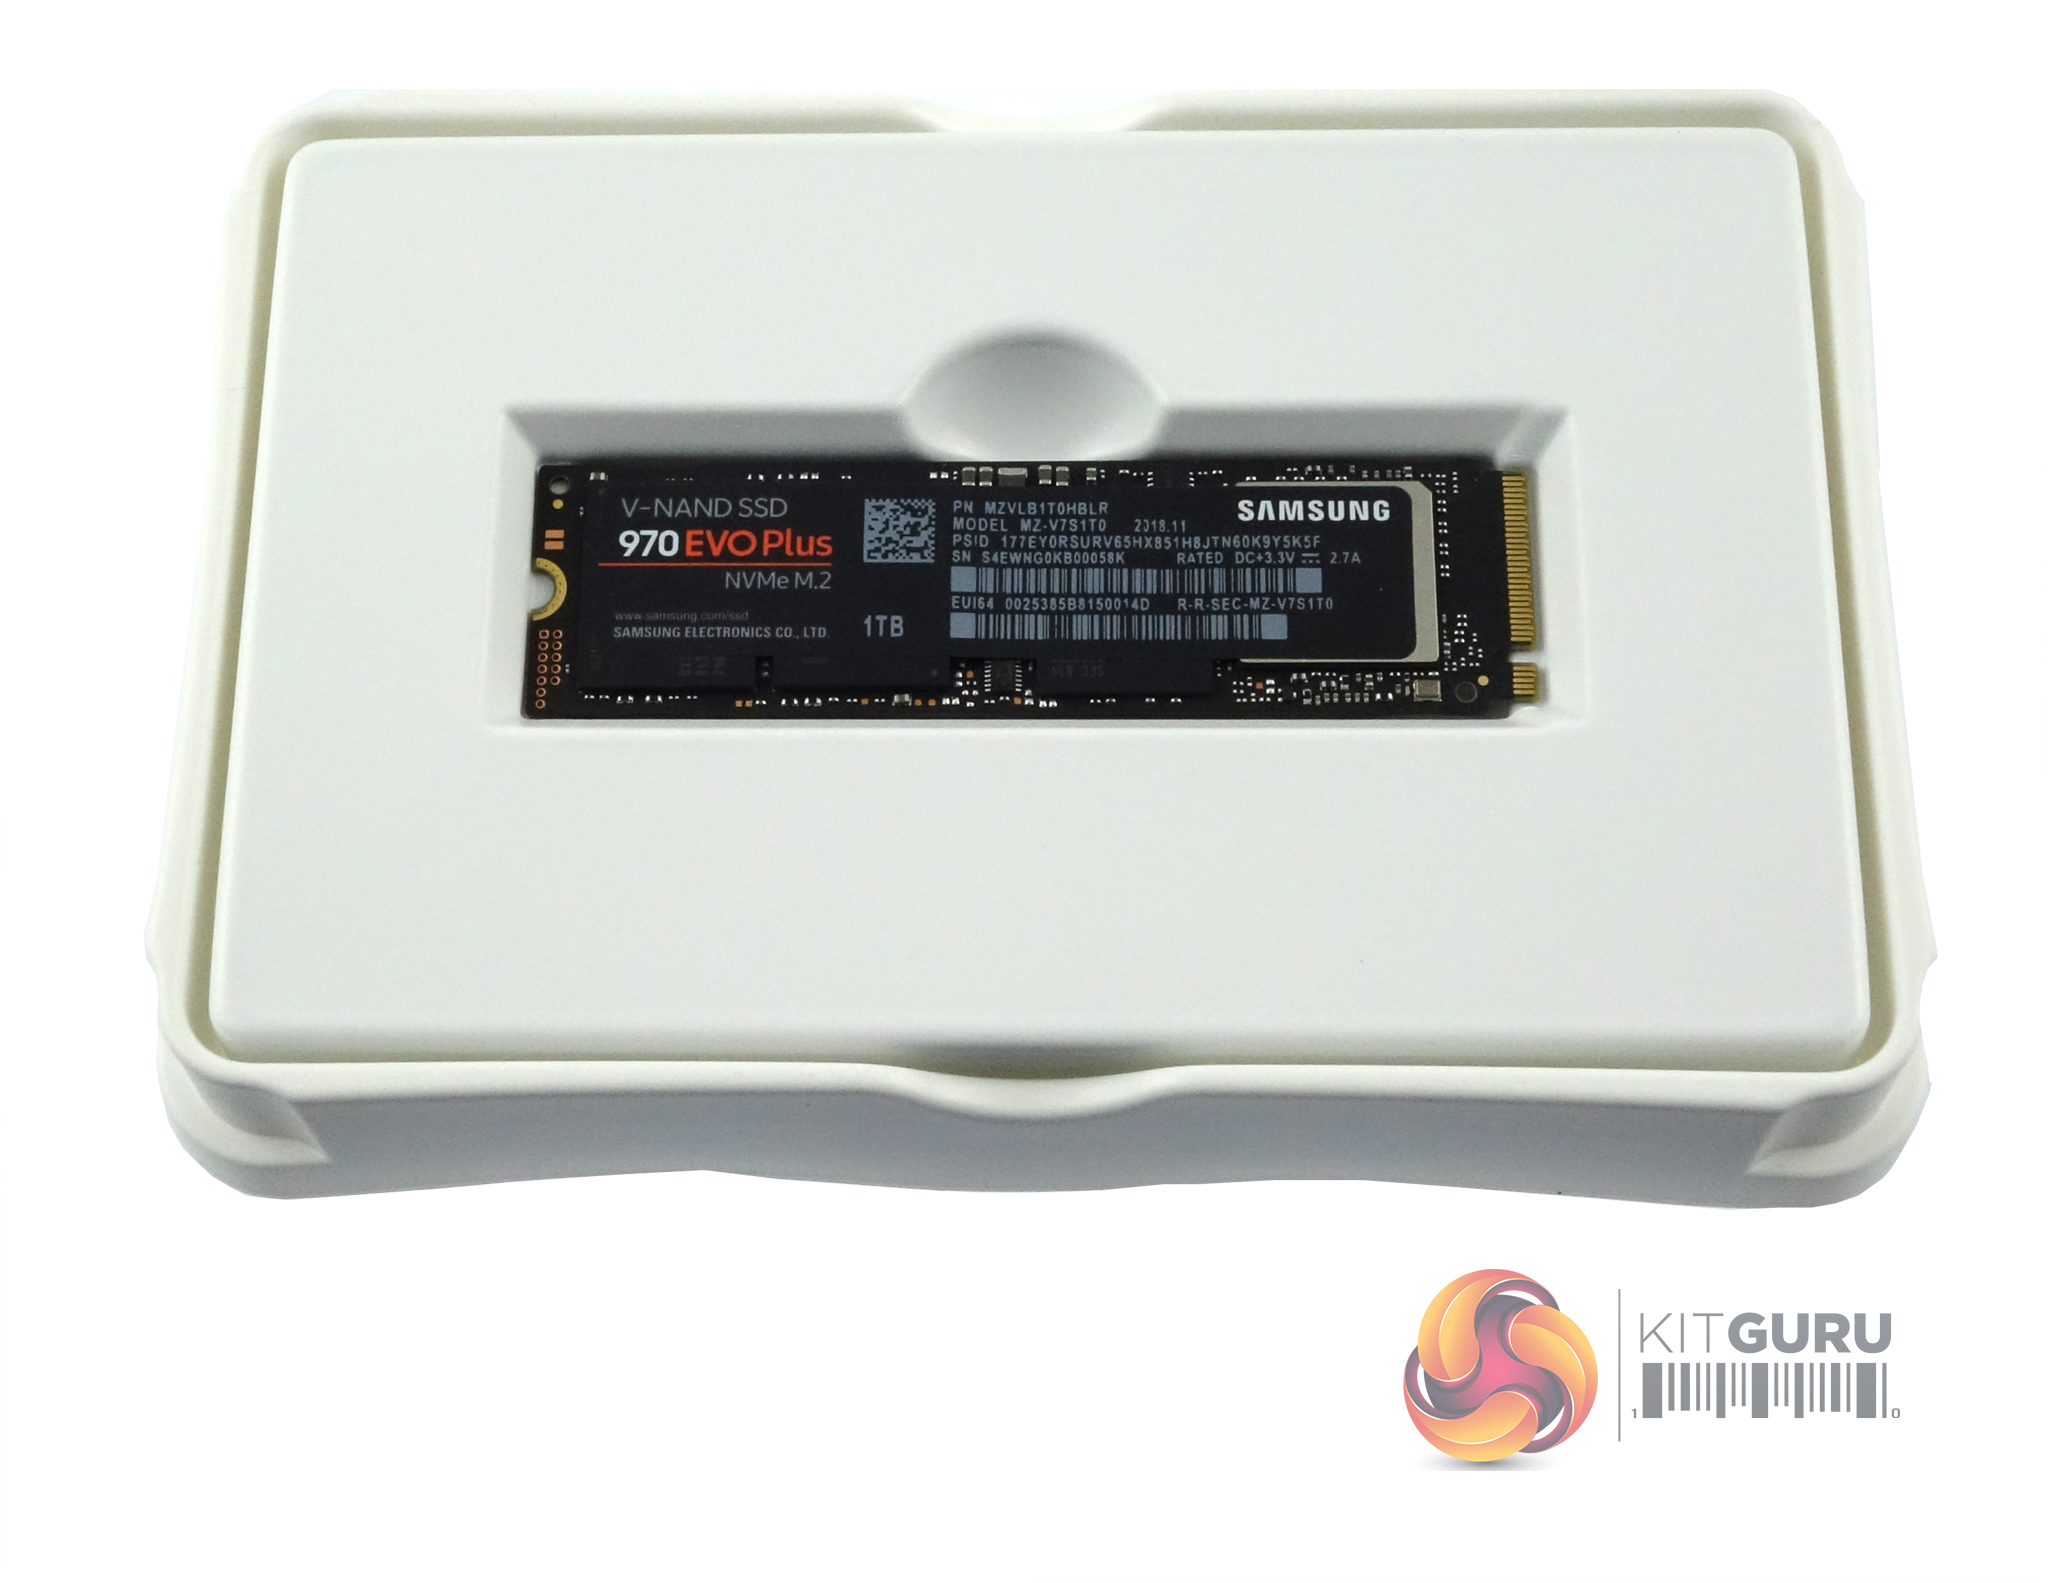
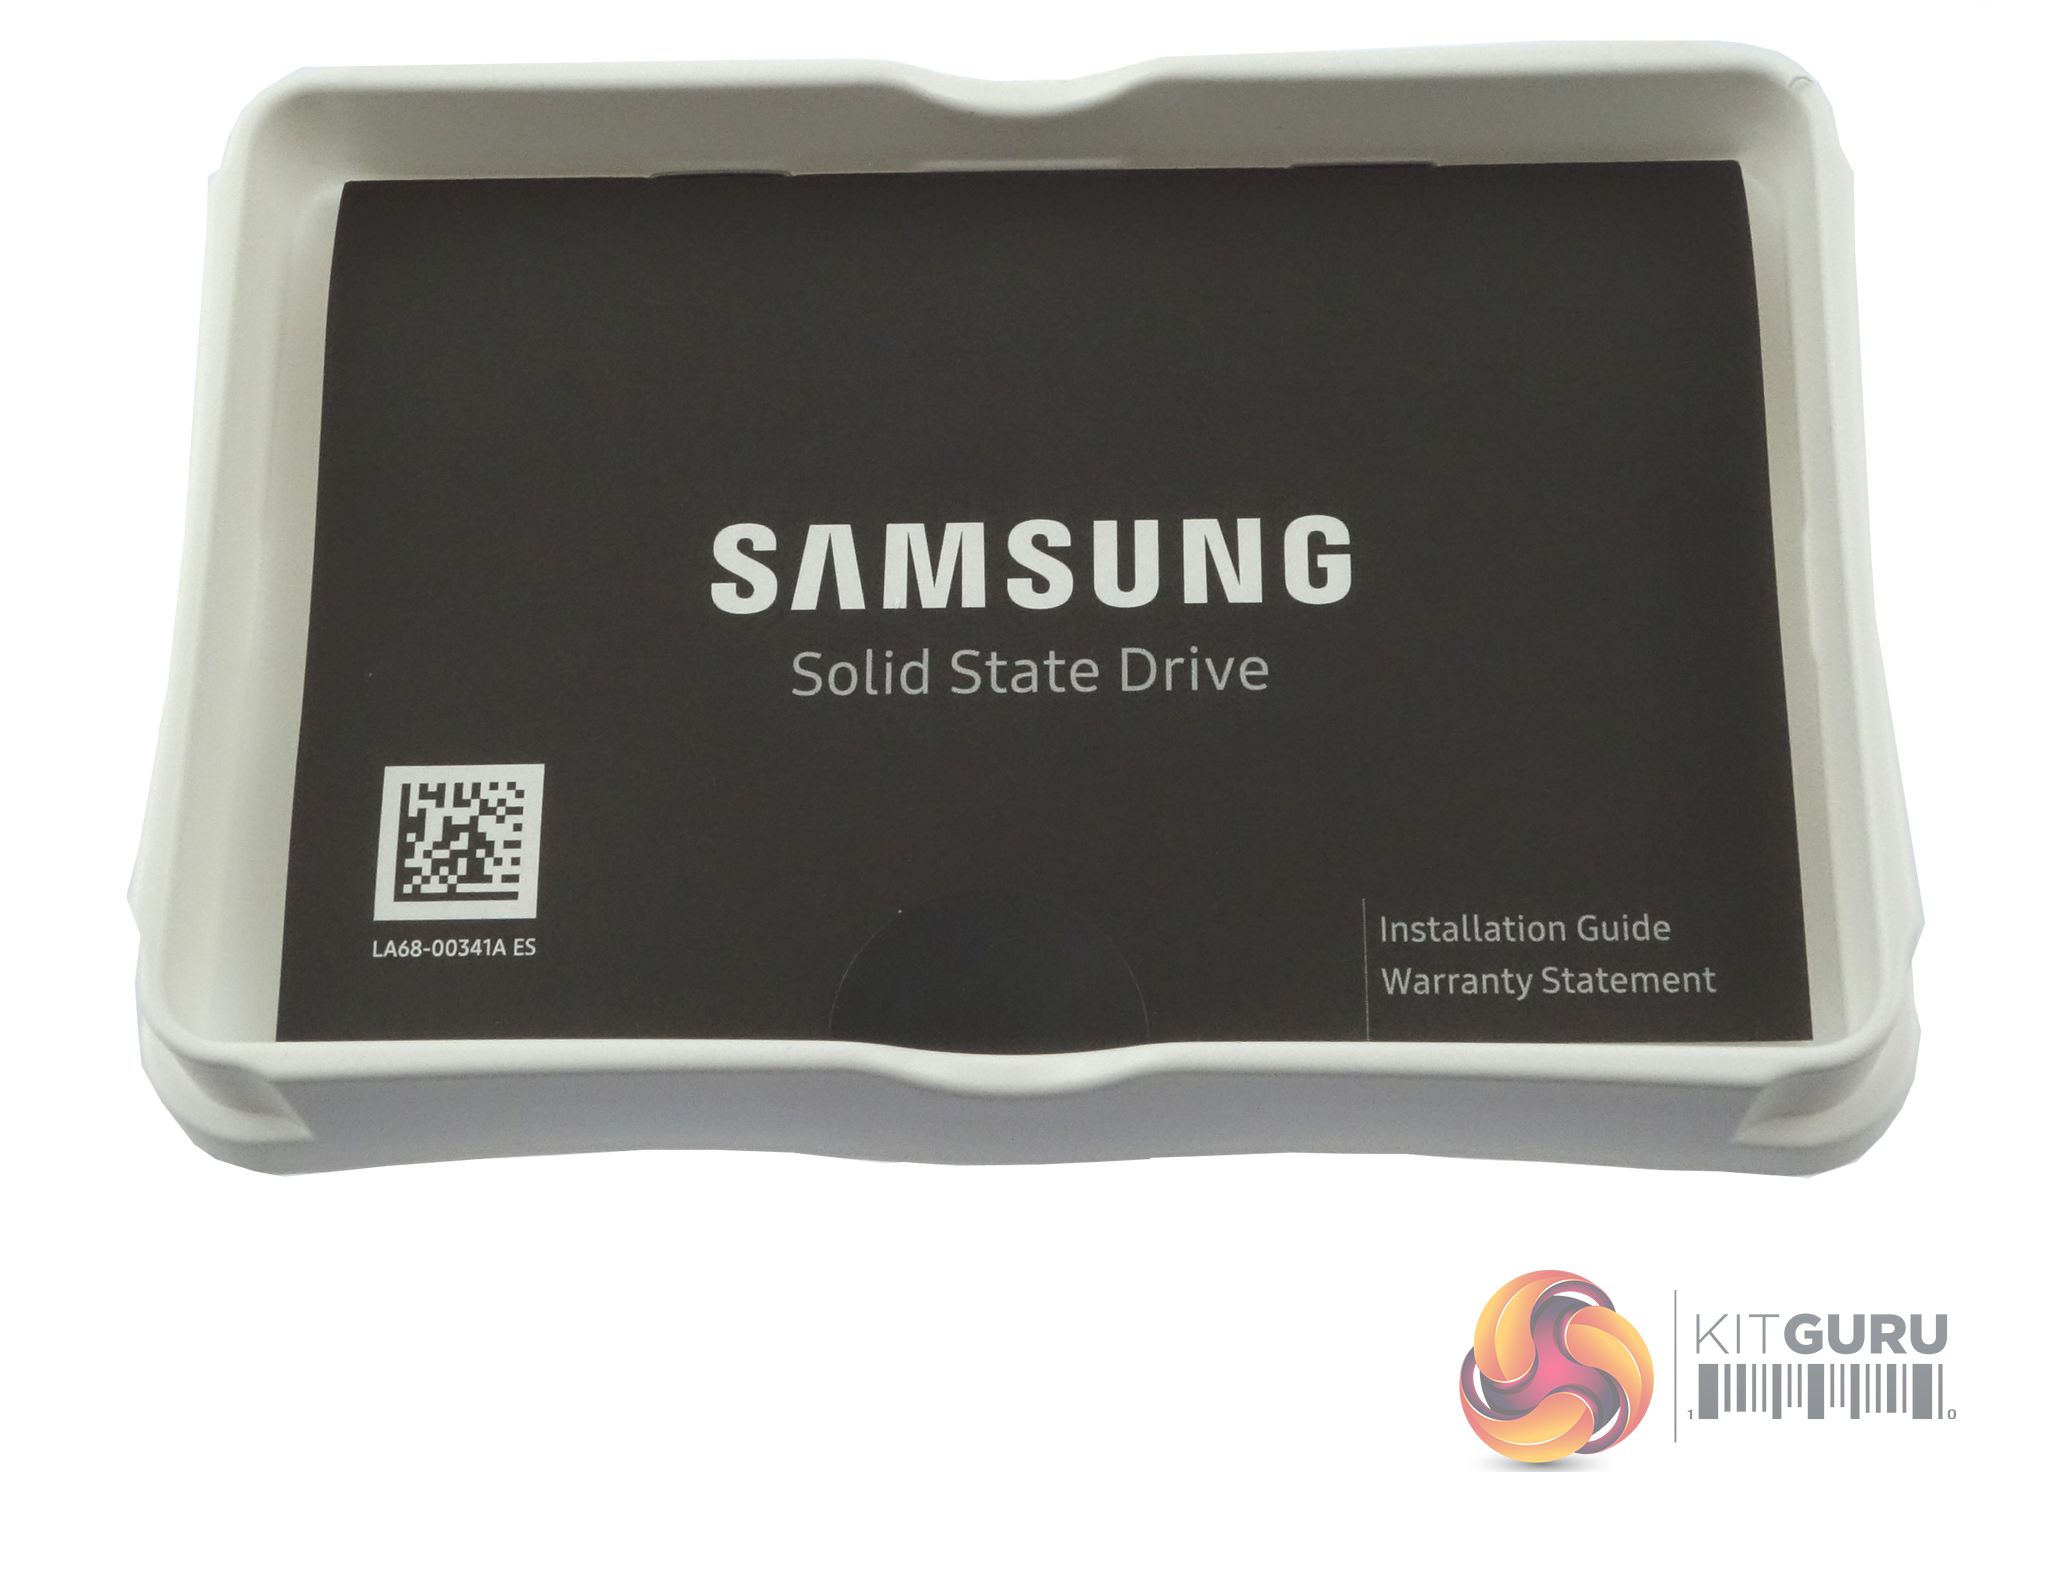
The drive itself comes in a plastic shell for extra protection. This outer shell fits into another piece of plastic which is home to the installation/warranty guide.
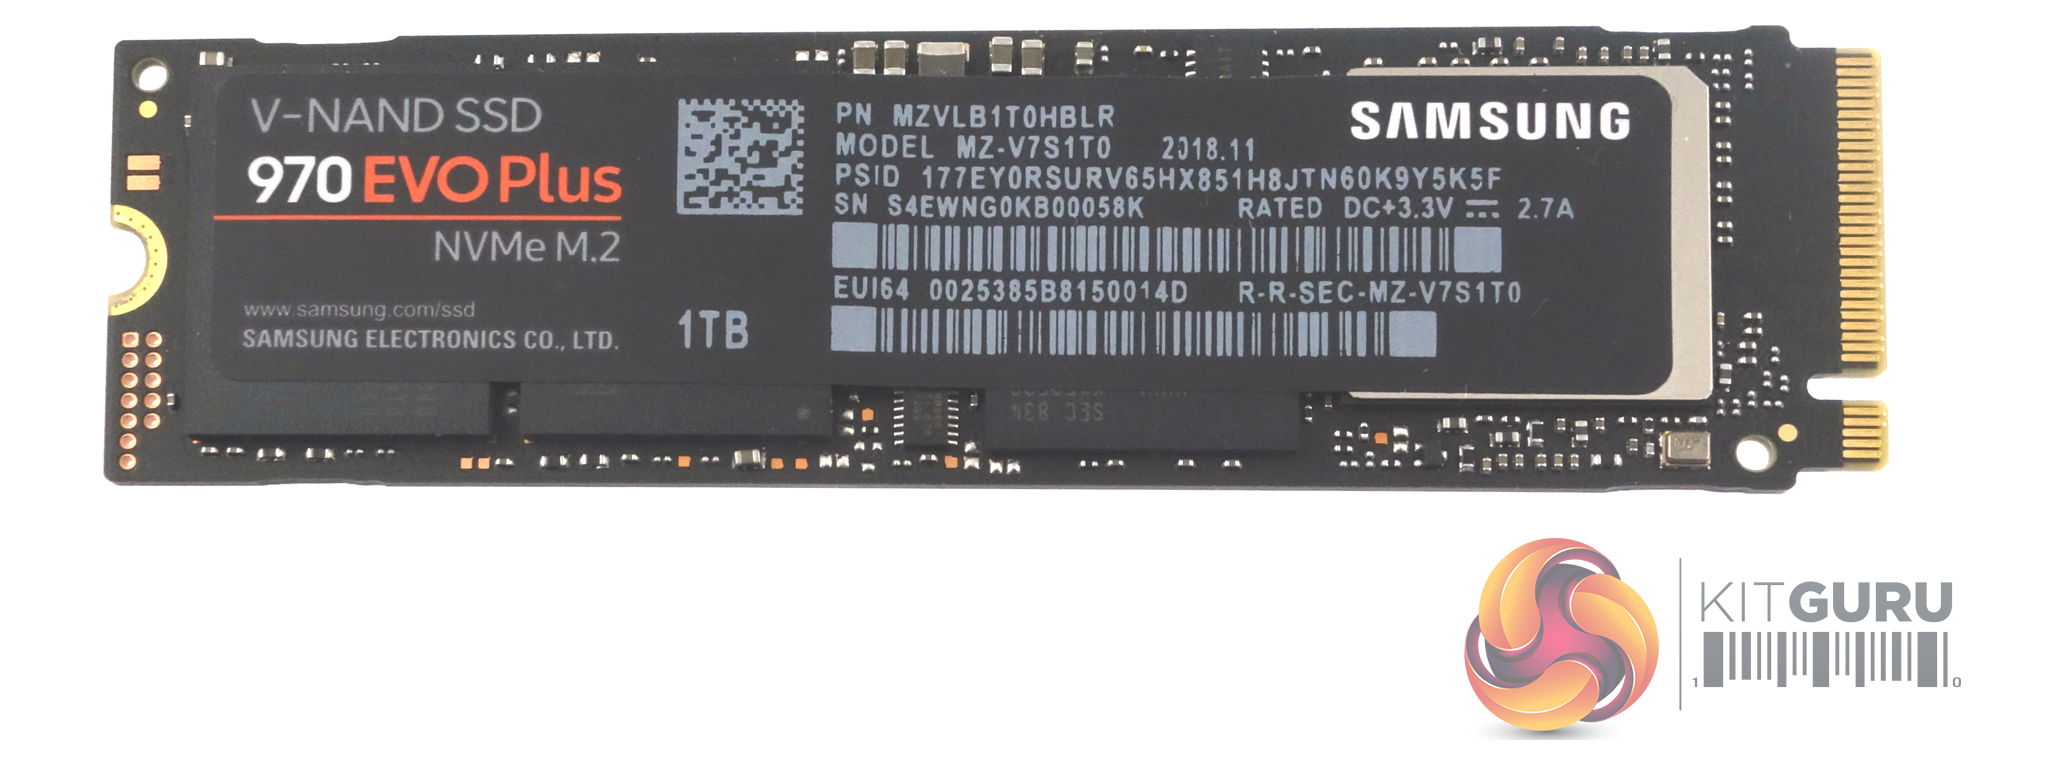

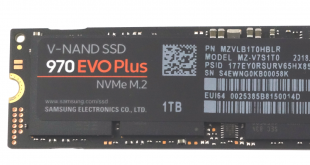
The SSD970 EVO Plus is built on a single sided M.2 2280 format PCB. The sticker on the rear of the drive has a built in copper layer to aid heat dissipation.
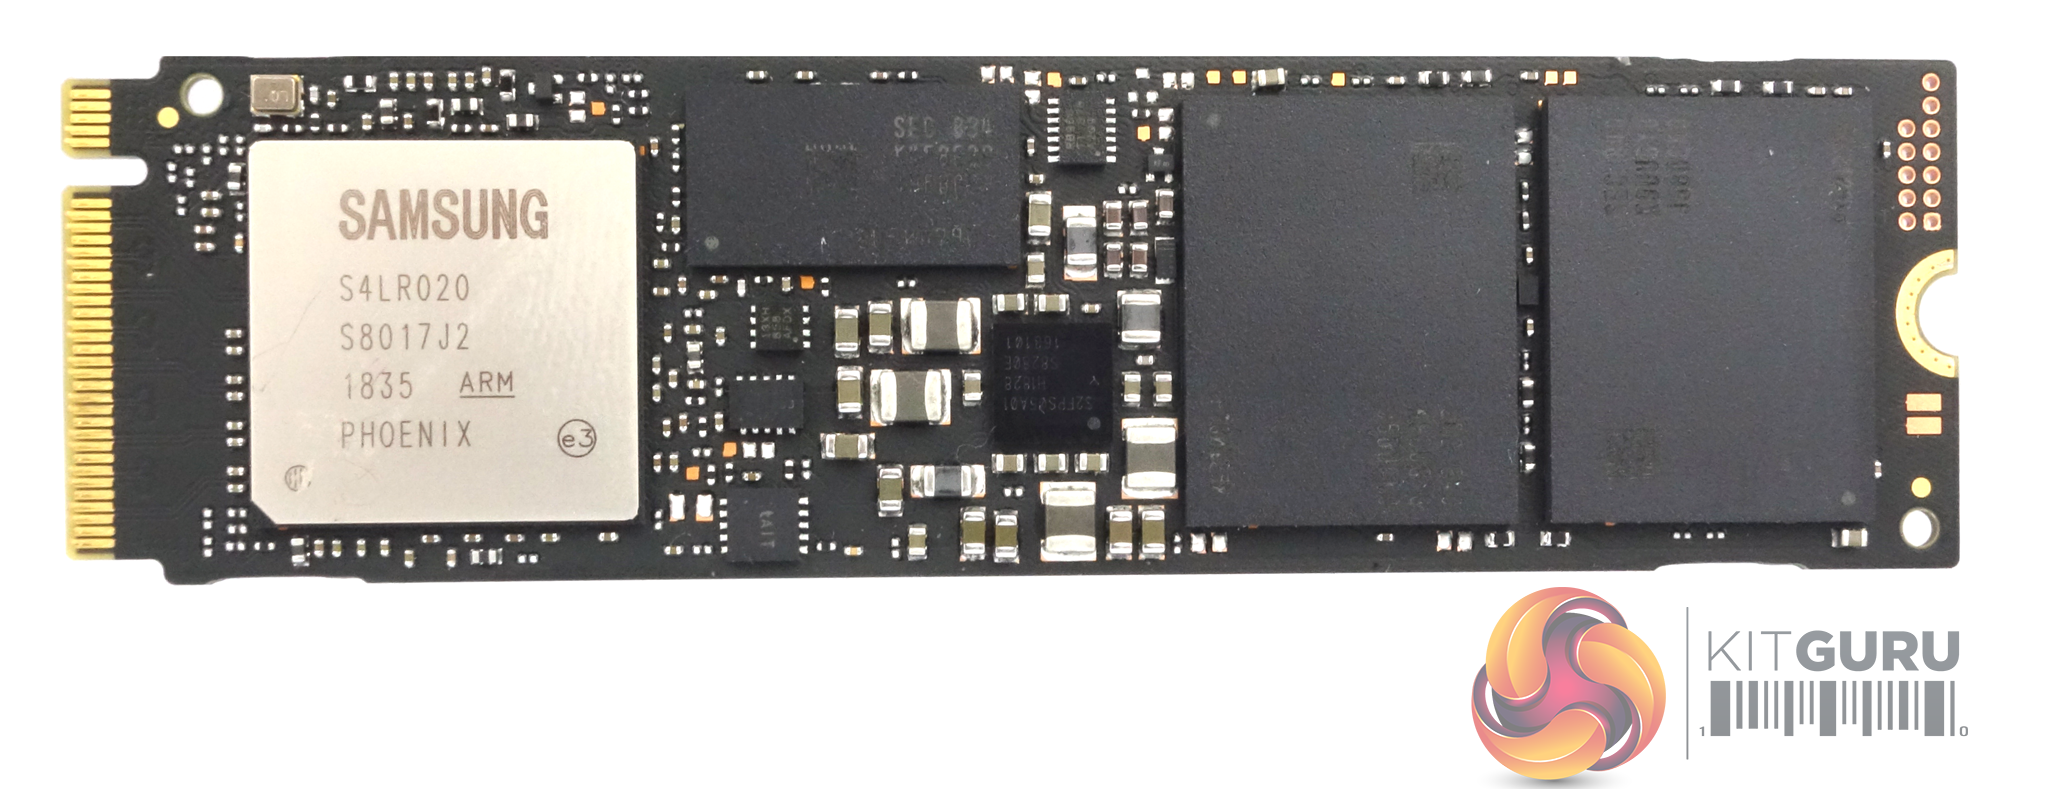
At one end of the PCB sits the Phoenix controller, while sitting at the other end of the PCB are two 256Gb die 9*-layer V-NAND TLC NAND packages. In between the NAND and the controller there is a 1GB LPDDR4 DRAM IC to take care of caching duties.
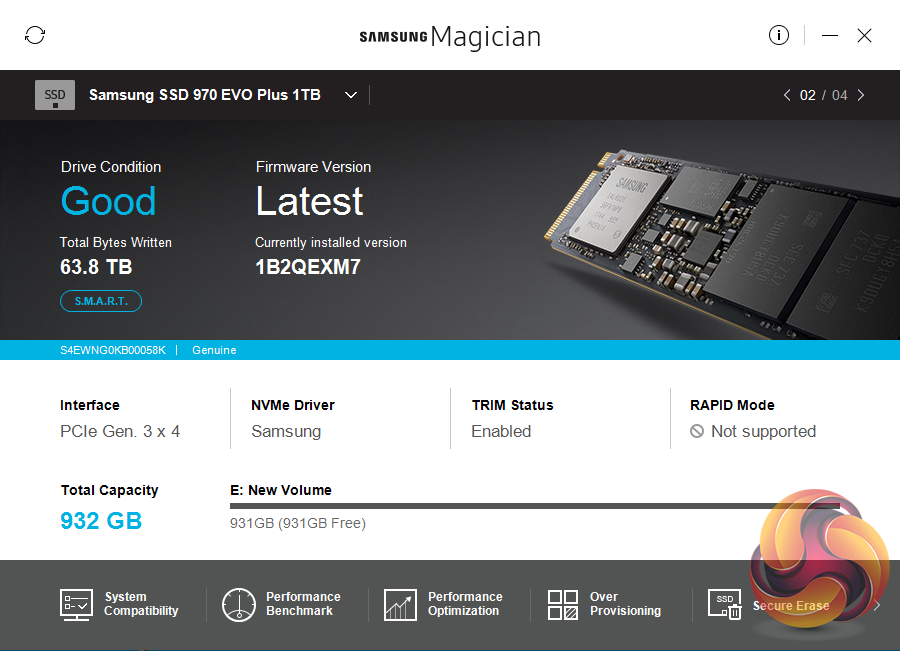
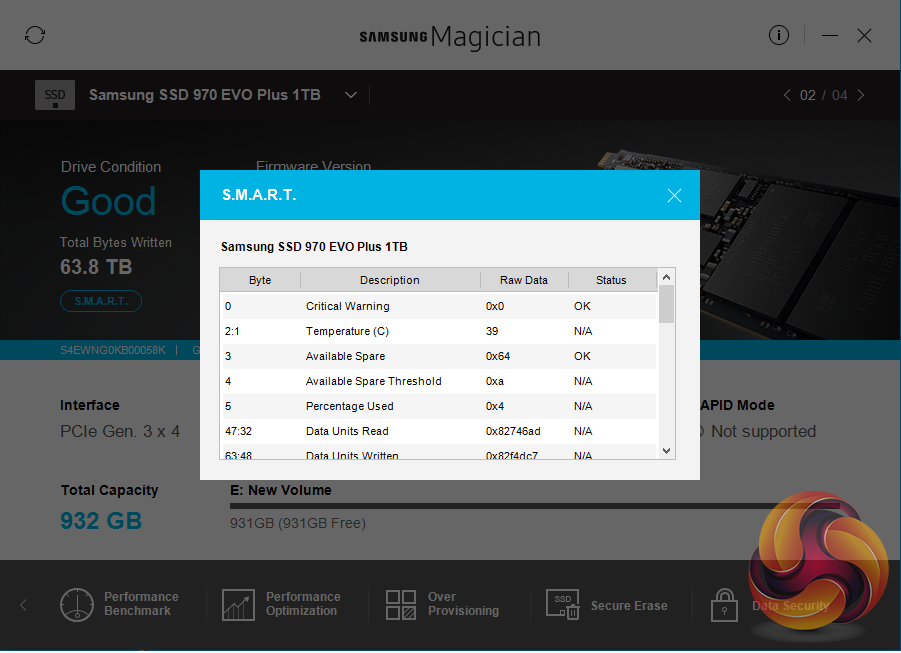
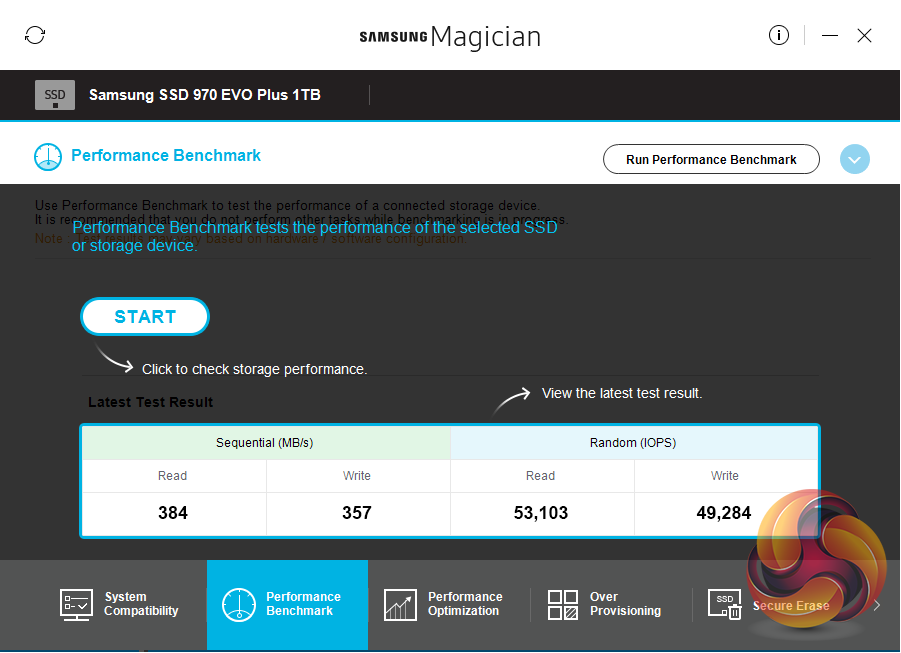
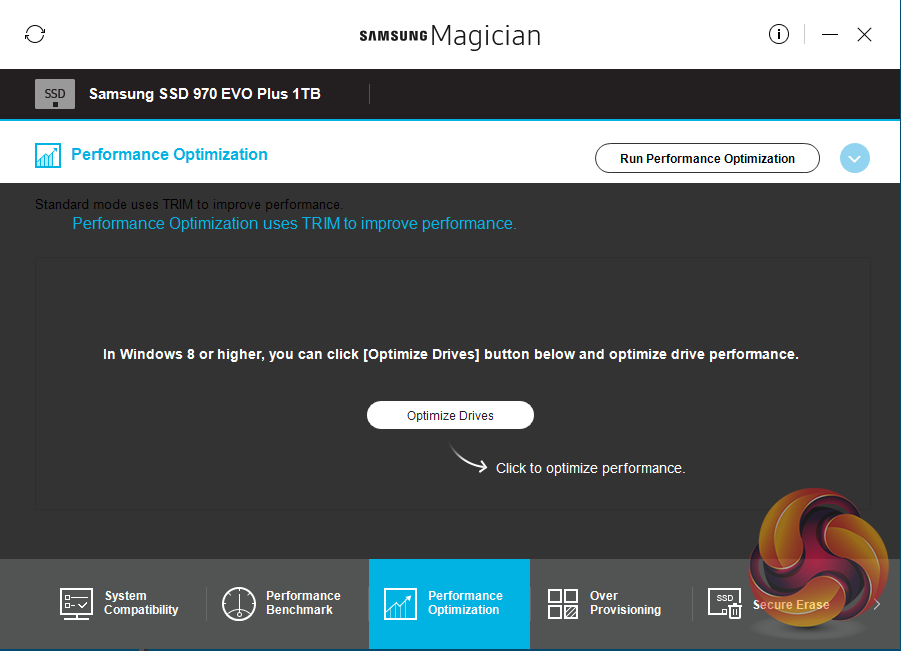
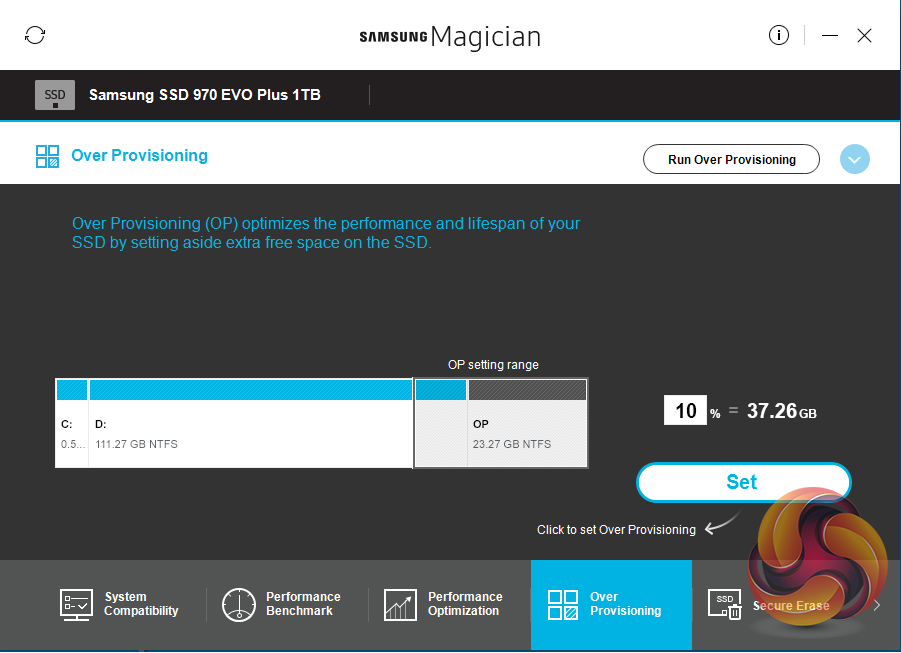
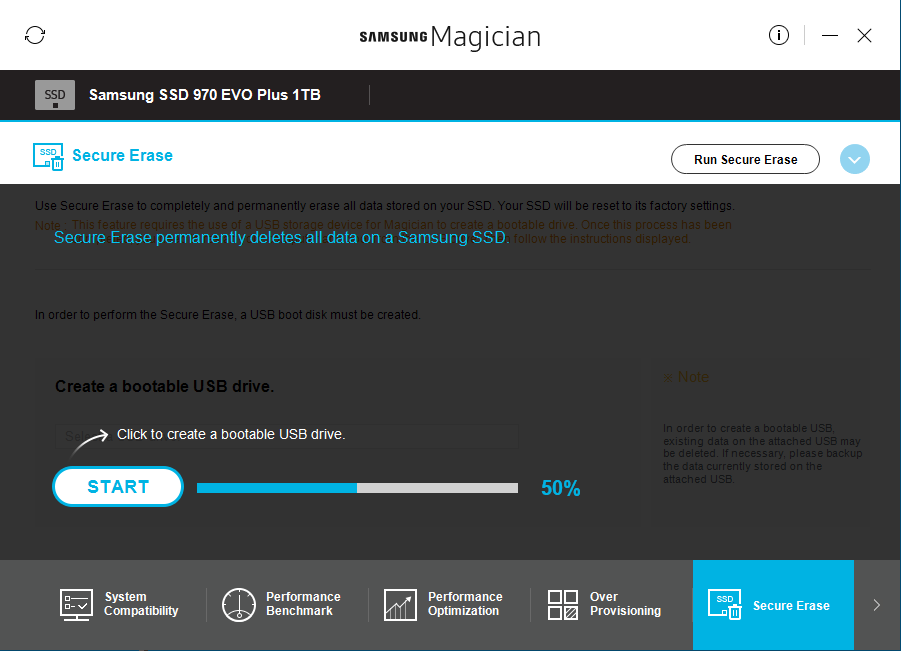
Samsung’s SSD management utility goes by the name of Magician and can be downloaded from Samsung’s website. The latest v5.3.0 version brings support for the SSD 970 EVO Plus series.
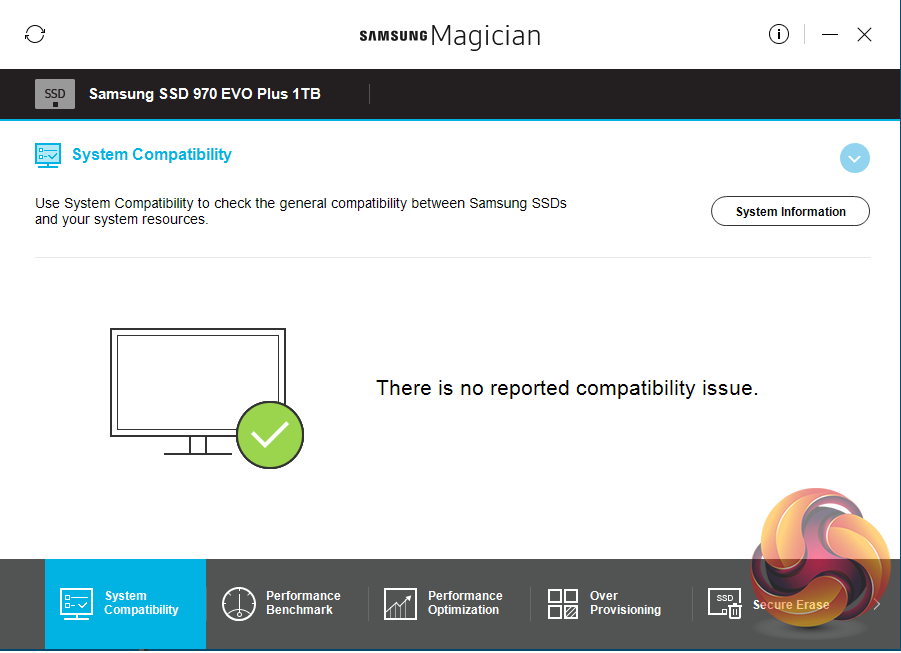
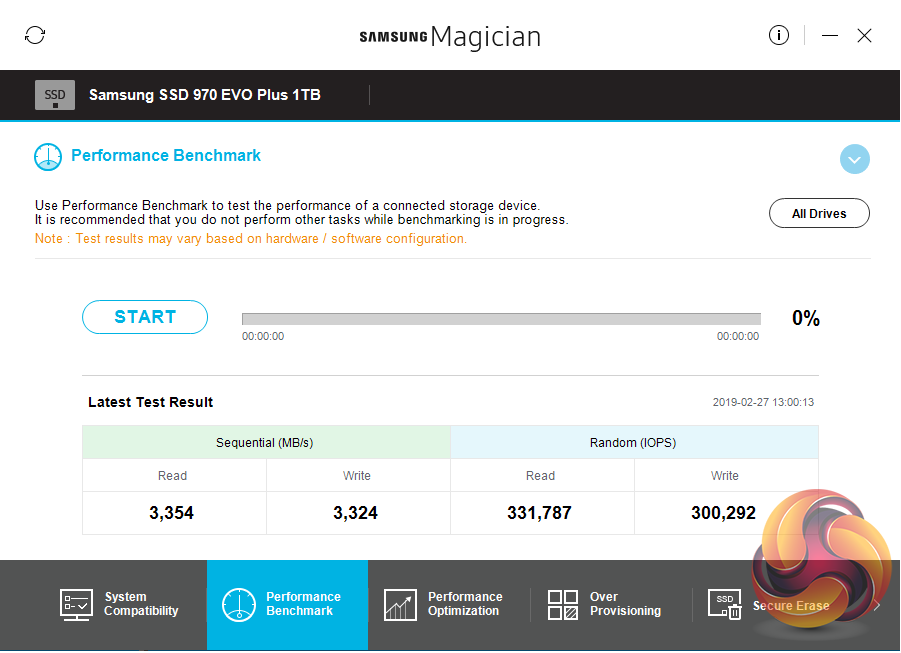
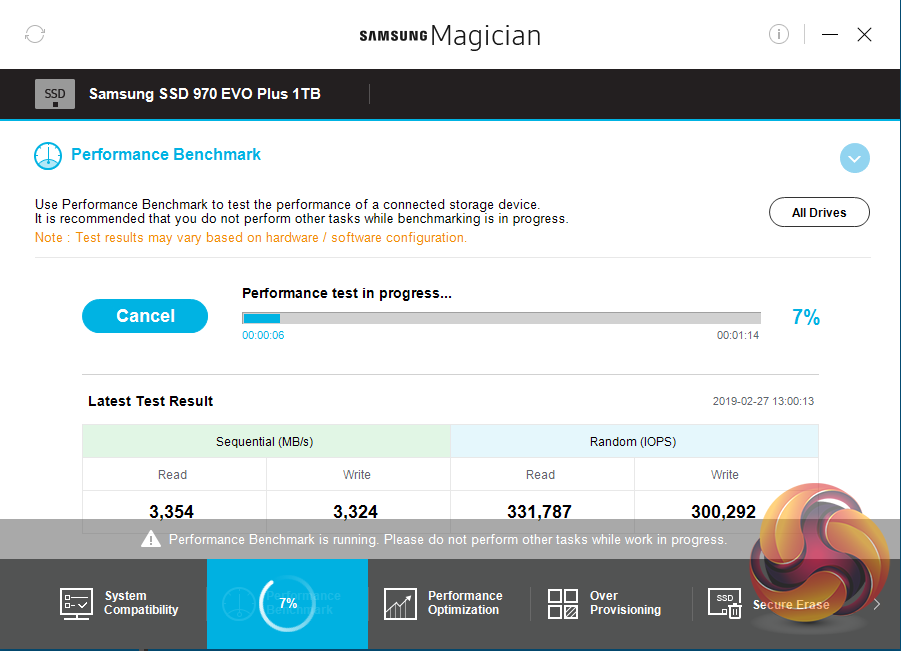
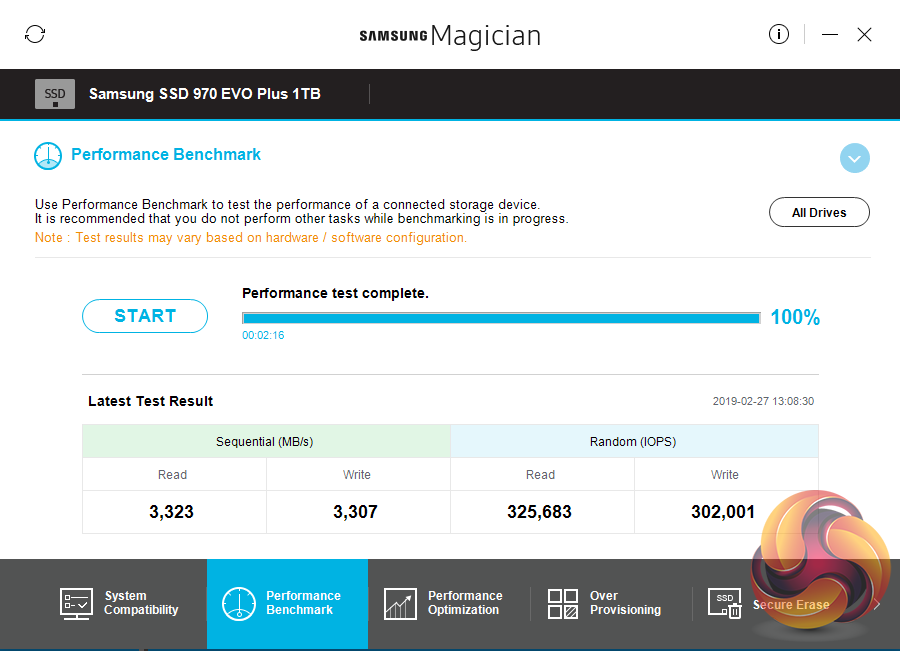
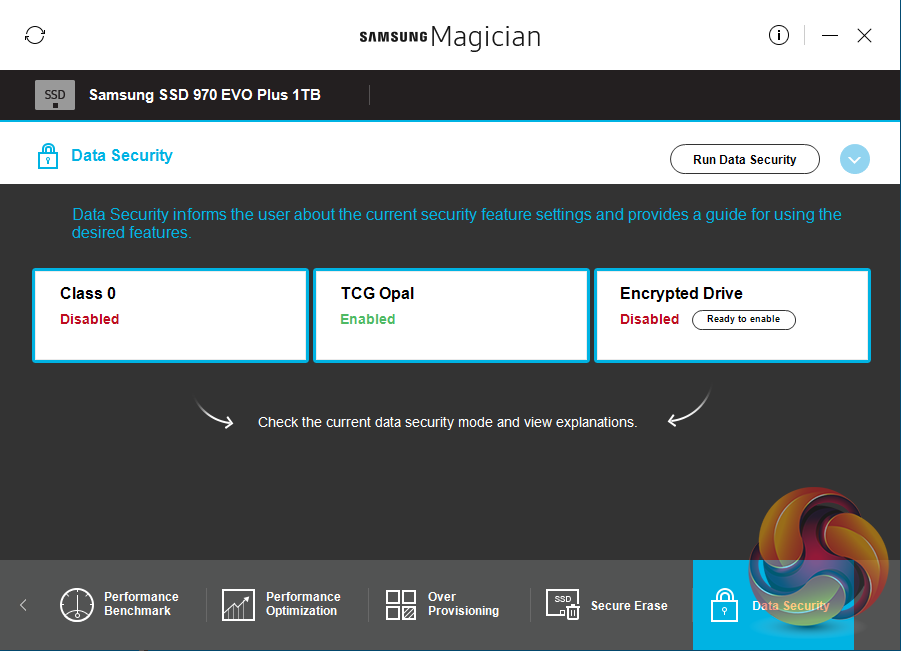
Magician allows you to do most maintenance jobs you may need to do with a SSD; updating firmware, optimise performance, adjust the Over Provisioning, enable data security (the drive supports AES 256-bit full disk encryption, TCG/Opal V2.0, and Encrypted Drive -IEEE1667 (MS eDrive ) ) and securely erase the drive. Magician also features a built-in benchmark tool.
The one thing missing from Magician is any form of integrated data migration tool but you can download a separate data migration tool from Samsung’s website.
For testing, the drives are all wiped and reset to factory settings by HDDerase V4. We try to use free or easily available programs and some real world testing so you can compare our findings against your own system.
This is a good way to measure potential upgrade benefits.
Main system:
Intel Core i7-7700K with 16GB of DDR4-3200 RAM, Sapphire R9 390 Nitro and an Asus Prime Z270-A motherboard.
Other drives
Corsair Force MP500 480GB
Corsair Force MP510 960GB
Crucial P1 1TB
Intel Optane SSD900P 480GB
Intel Optane SSD905P 480GB
Intel SSD760p 512GB
Kingston A1000 480GB
Plextor M9Pe(Y) 512GB
Plextor M8PeG 512GB
PNY CS2030 240GB
Samsung SSD970 EVO 2TB
Samsung SSD970 PRO 1TB
Samsung SSD960 PRO 2TB
Samsung SSD960 EVO 1TB
Toshiba XG6 1TB
Toshiba OCZ RD400 512GB
Western Digital Black SN750 1TB
Western Digital Black NVMe 1TB
Western Digital Black PCIe 512GB
Software:
Atto Disk Benchmark. 3.5
CrystalMark 6.0.0.
AS SSD 2.0.
IOMeter.
Futuremark PC Mark 8
All our results were achieved by running each test five times with every configuration this ensures that any glitches are removed from the results. Trim is confirmed as running by typing fsutil behavior query disabledeletenotify into the command line. A response of disabledeletenotify =0 confirms TRIM is active.
CrystalDiskMark is a useful benchmark to measure theoretical performance levels of hard drives and SSD’s. We are using v6.0. to test NVMe drives.
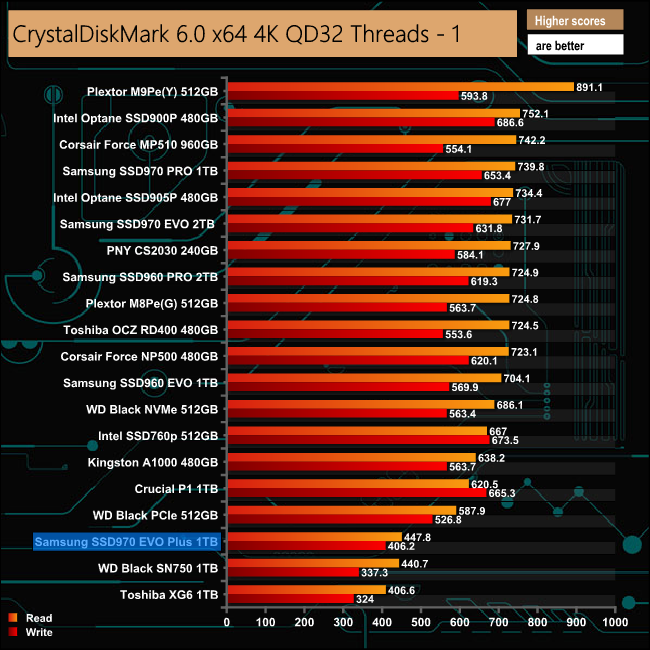
The SSD970 EVO Plus seems to struggle with the 4K QD32 test of CrystalDiskMark, falling way behind the original SSD970 EVO for both reads and writes.
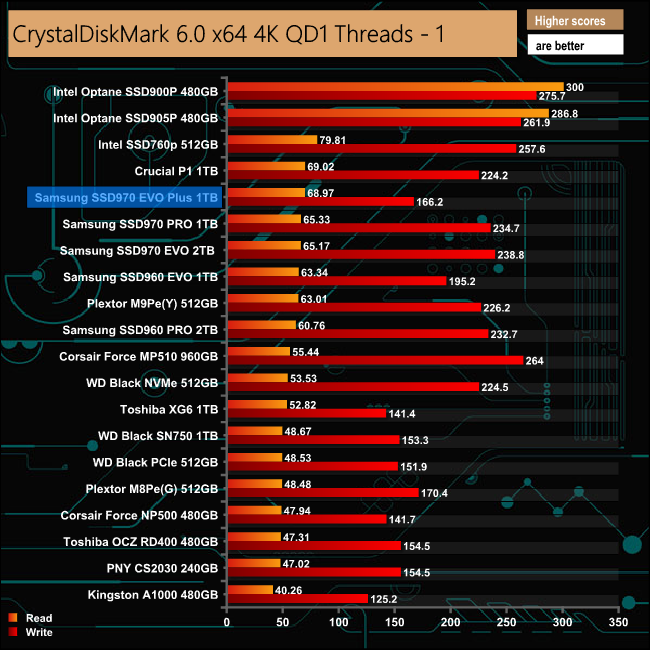
However, shallowing the QD to 1 saw the drive climb above the SSD970 EVO with its read performance, although the write performance still lagged behind the older drive.
The ATTO Disk Benchmark performance measurement tool is compatible with Microsoft Windows. Measure your storage systems performance with various transfer sizes and test lengths for reads and writes. Several options are available to customize your performance measurement including queue depth, overlapped I/O and even a comparison mode with the option to run continuously.
Use ATTO Disk Benchmark to test any manufacturers RAID controllers, storage controllers, host adapters, hard drives and SSD drives and notice that ATTO products will consistently provide the highest level of performance to your storage.
We are using version 3.5 for our NVMe disk tests.
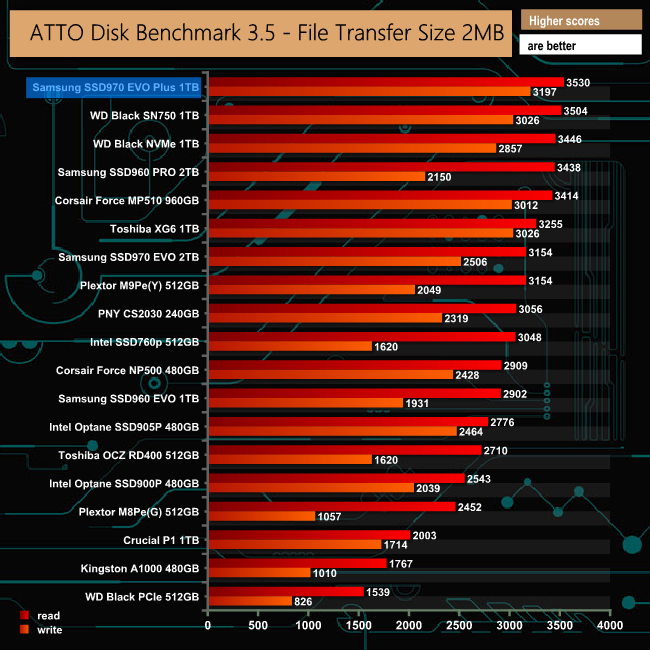
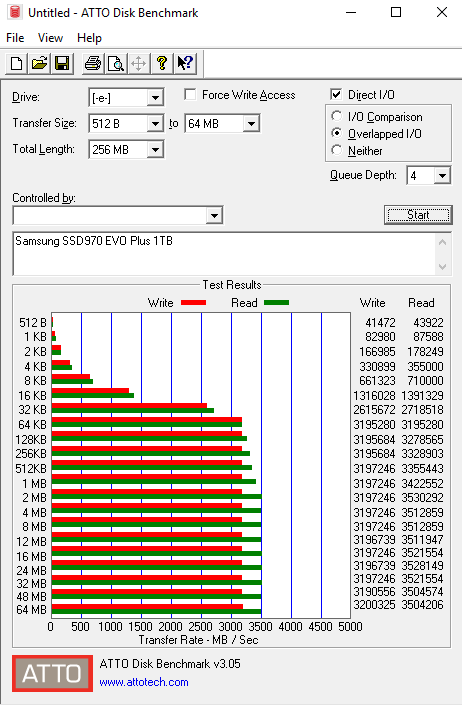
Samsung rates the Sequential performance of the 1TB SSD970 EVO Plus as up to 3,500MB/s for reads and up to 3,300MB/s for writes. When tested with the ATTO benchmark, the review drive matched the official read figure with 3,530MB/s while not quite getting to the top end write figure at 3,197MB/s. Both those figures however, allow it to take top spot on the chart from WD's latest Black SN750 drive.
AS SSD is a great free tool designed just for benching Solid State Drives. It performs an array of sequential read and write tests, as well as random read and write tests with sequential access times over a portion of the drive.
AS SSD includes a sub suite of benchmarks with various file pattern algorithms but this is difficult in trying to judge accurate performance figures.
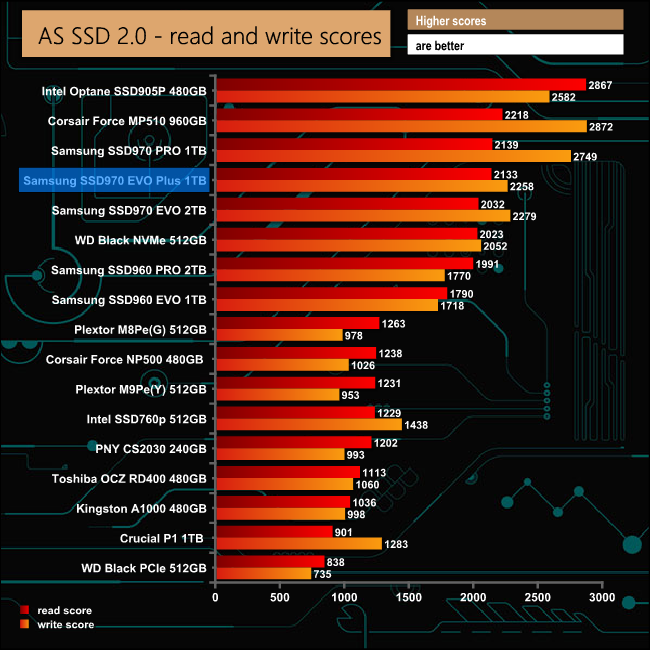
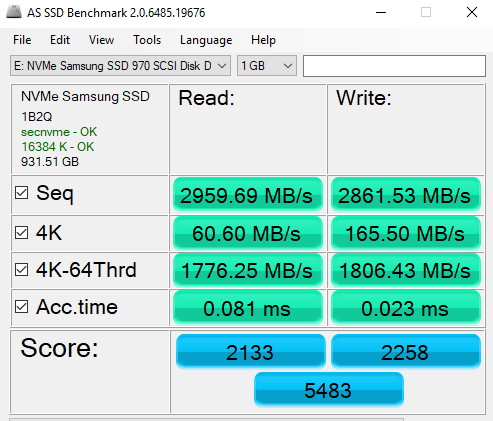
In the AS SSD benchmark, the SSD970 EVO Plus produced a read score of 2133 which gave it an edge over the 2032 scored by the 2TB 970 EVO. However, its write score of 2258 is a little shy of the 2279 scored by the older drive.
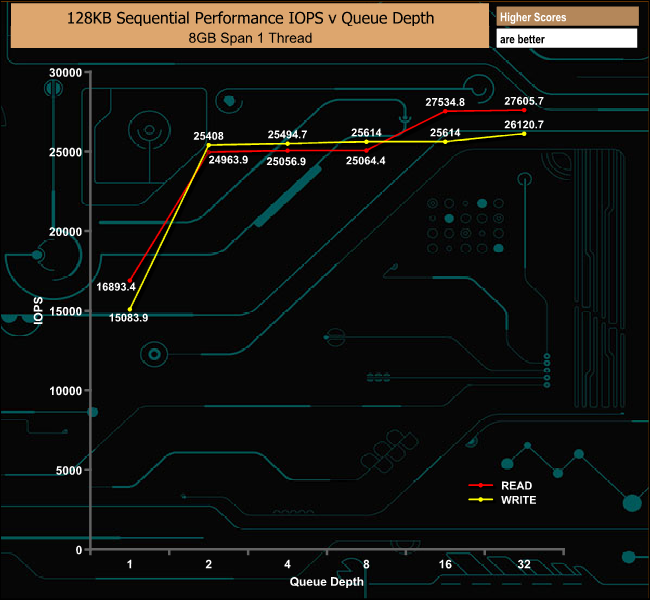
IOMeter is another open source synthetic benchmarking tool which is able to simulate the various loads placed on hard drive and solid state drive technology. There are many ways to measure the IOPS performance of a Solid State Drive, so our results will sometimes differ from manufacturer’s quoted ratings. We do test all drives in exactly the same way, so the results are directly comparable.
We test 128KB Sequential read and write and random read and write 4k tests. The test setup’s for the tests are listed below. Each is run five times.
128KB Sequential Read / Write.
Transfer Request Size: 128KB Span: 8GB Thread(s): 1, Outstanding I/O: 1-32 Test Run: 20 minutes per test
4K Sustained Random Read / Write.
Transfer Request Size: 4KB Span: 80GB Thread(s): 4, Outstanding I/O: 1-32 Test Run: 20 minutes per test
4K Random 70/30 mix Read/Write.
Transfer Request Size: 4KB Span: 80GB Reads: 70% Writes: 30% Thread(s): 4 Outstanding I/O: 2 – 32 Test Run: 20 minutes
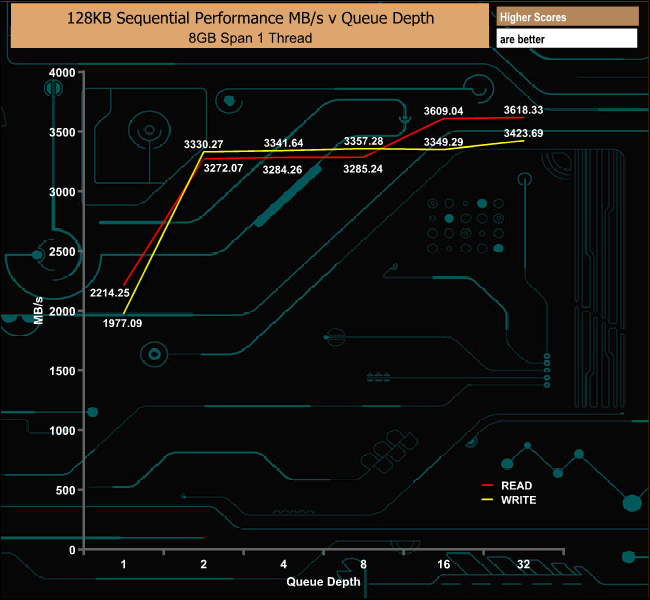
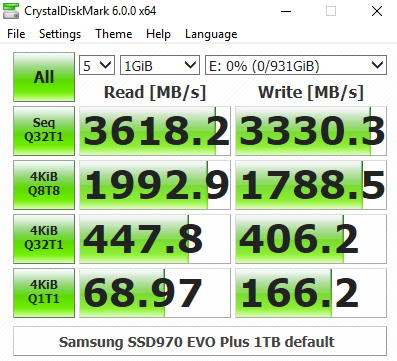
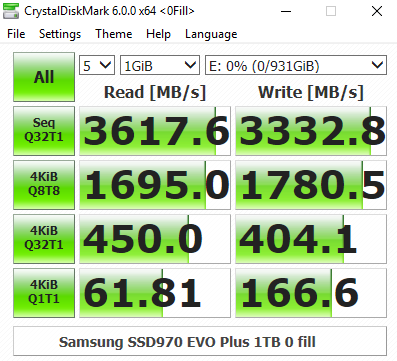
In our 128KB Sequential tests the drive produced read and write figures that both bettered the official drive ratings. The read test gave a figure of 3,618MB/s against the official 3,500MB/s while the write figure of 3,423MB/s was an improvement over the official 3,300MB/s.
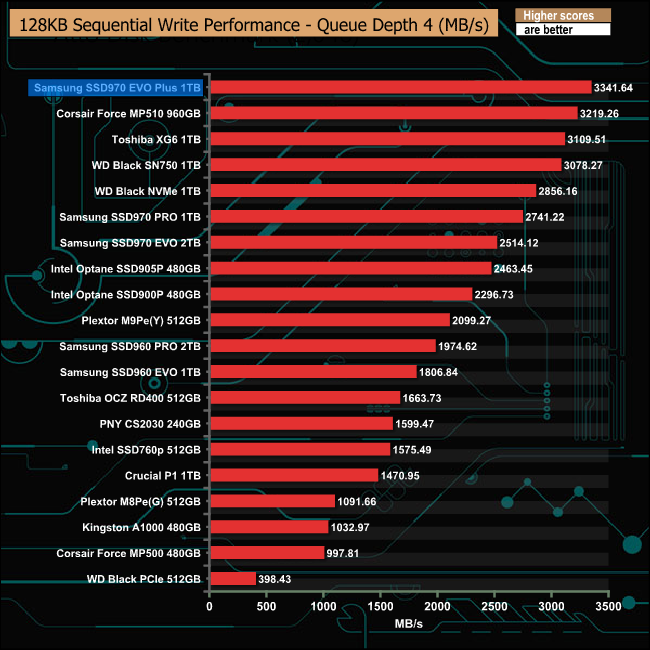
128KB Sequential Read Performance Compared
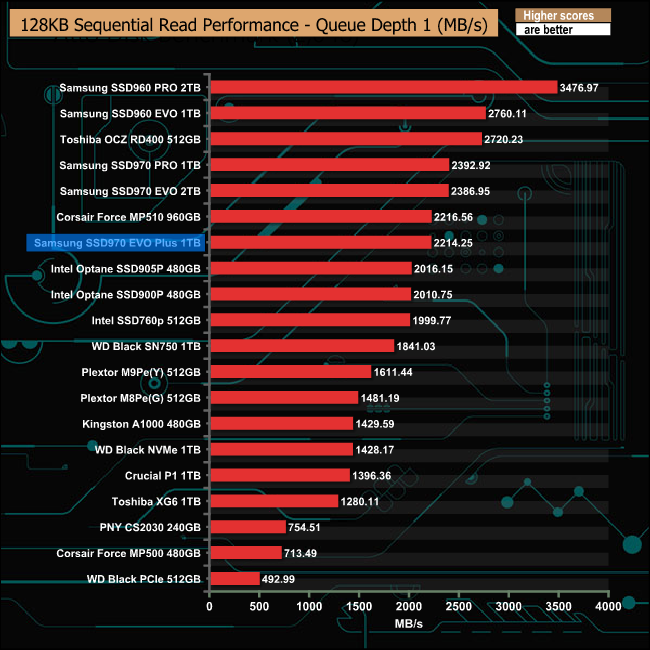
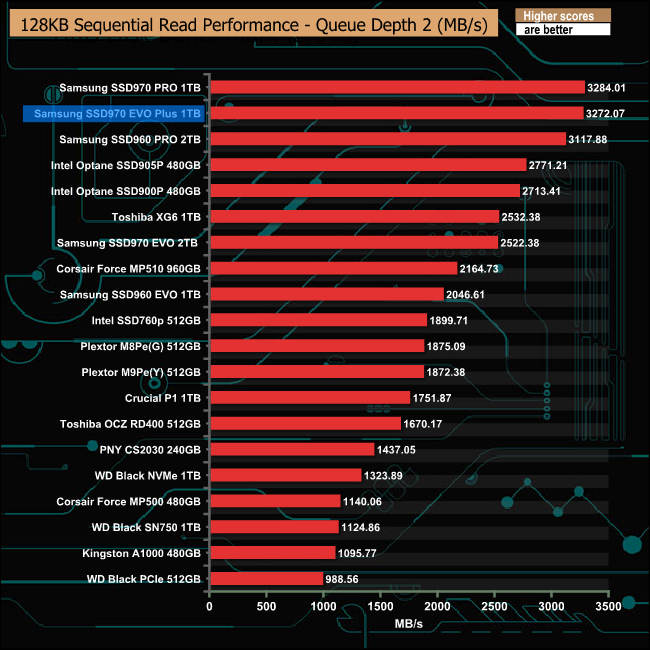
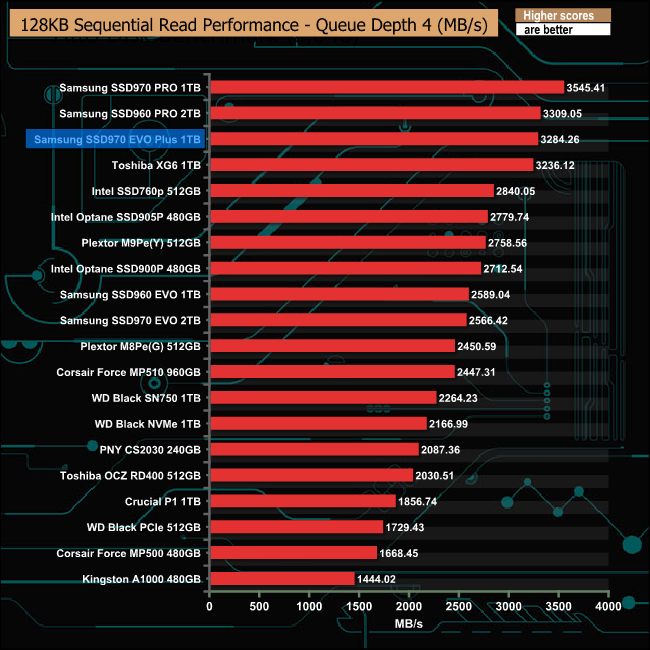
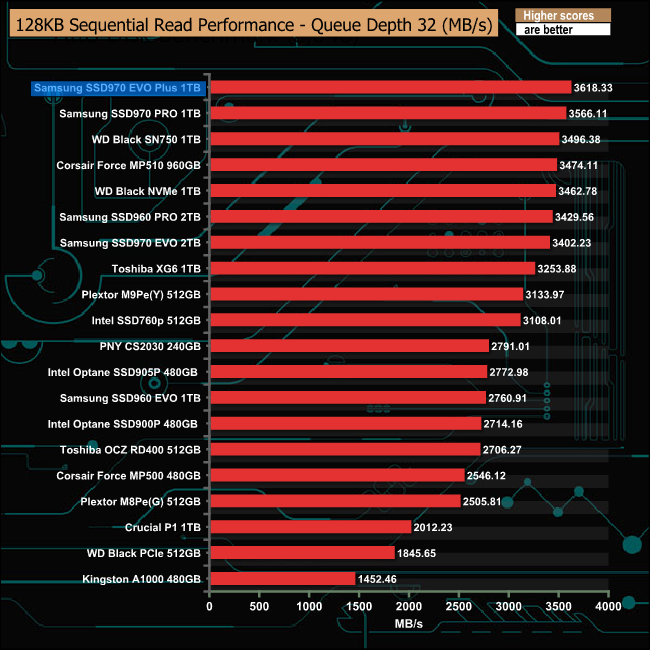
At a QD of 1, the 970 EVO Plus sits below the original 970 EVO in the Sequential read results chart, but as the queue depth deepens the new drive pulls away from the older drive until finally at a QD of 32 it sits firmly in the top spot on the chart, even beating Samsung's own mighty 970 PRO.
128KB Sequential Write Performance Compared
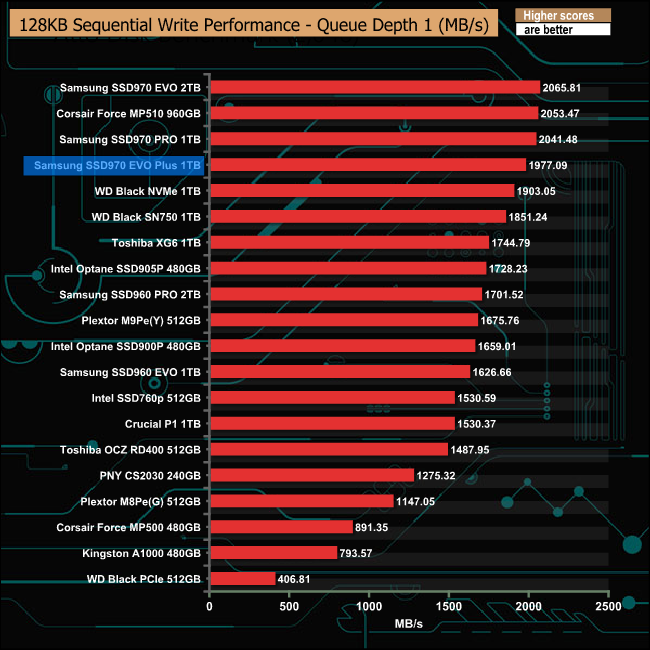
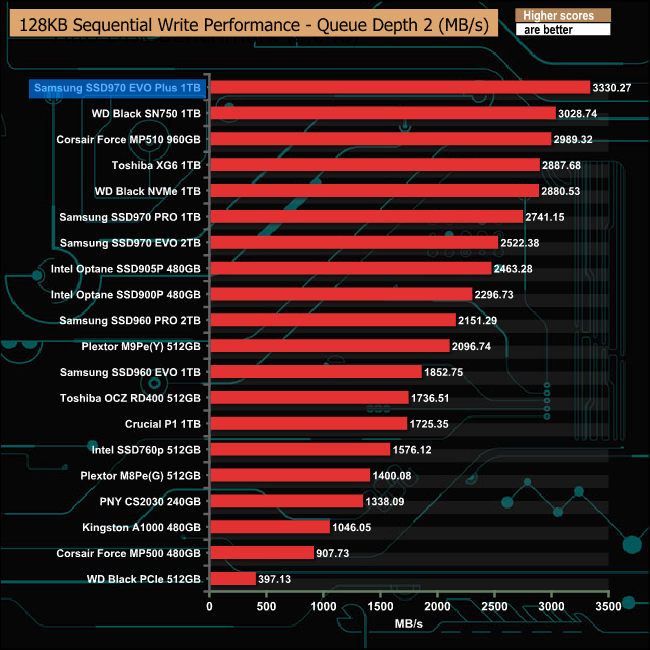
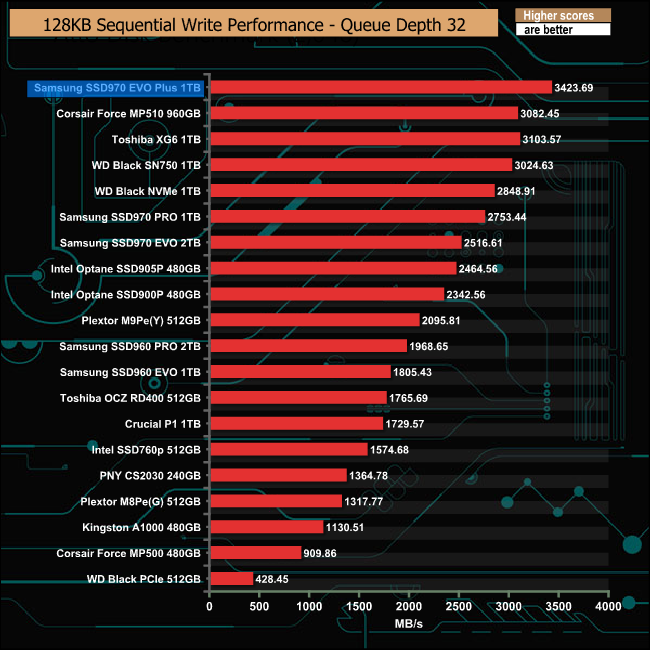
It's a similar story when it comes to Sequential writes. At a QD of 1, the new drive isn't as quick as the old drive but as the queue depth deepens, the new drive quickly pulls away. In fact, it tops the charts in queue depths 2, 4 and 32.
4K Random Read v QD Performance
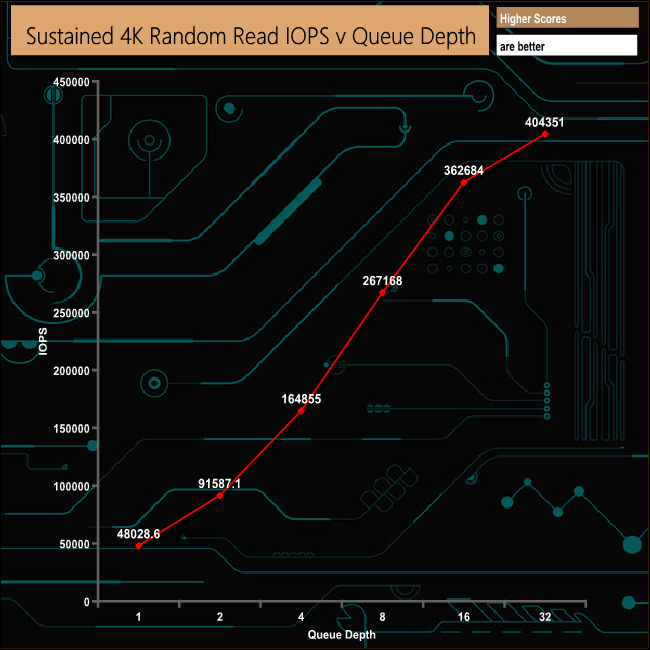
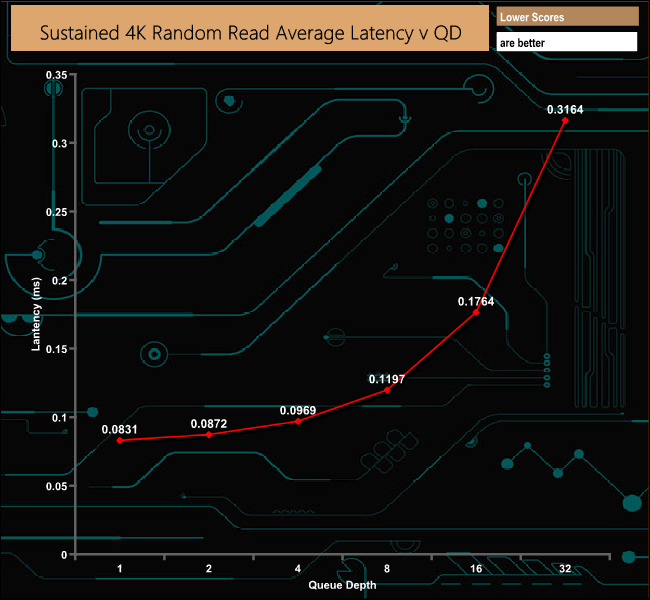
Samsung quotes two queue depth figures for 4K random read performance. At QD1 the drive is rated as up to 19,000 IOPS and at QD32 up to 600,000 IOPS. In our tests we comfortable beat the QD1 figure at 48,028 IOPS but the review drive fell well short of the maximum official figure, producing 404,351 IOPS when tested.
4K Random Read Performance Compared
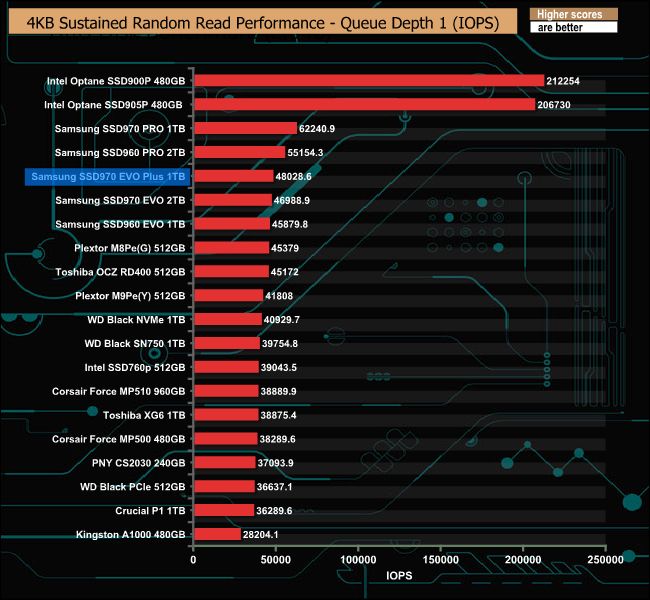
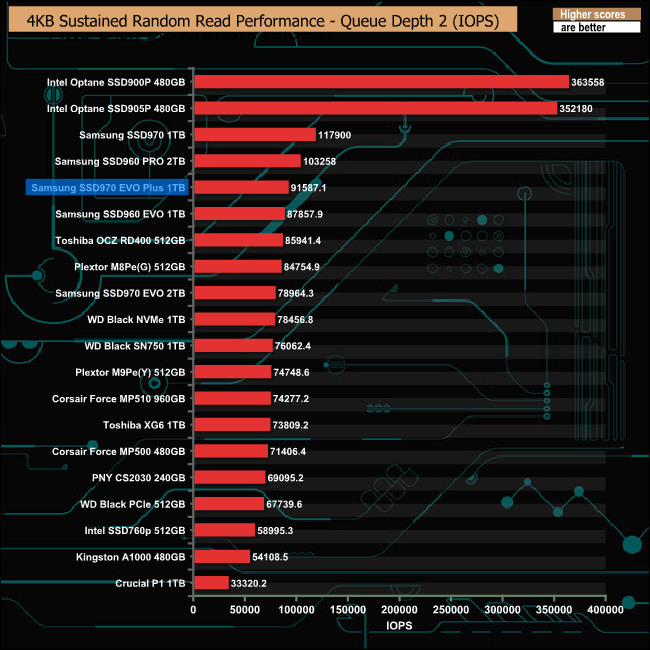
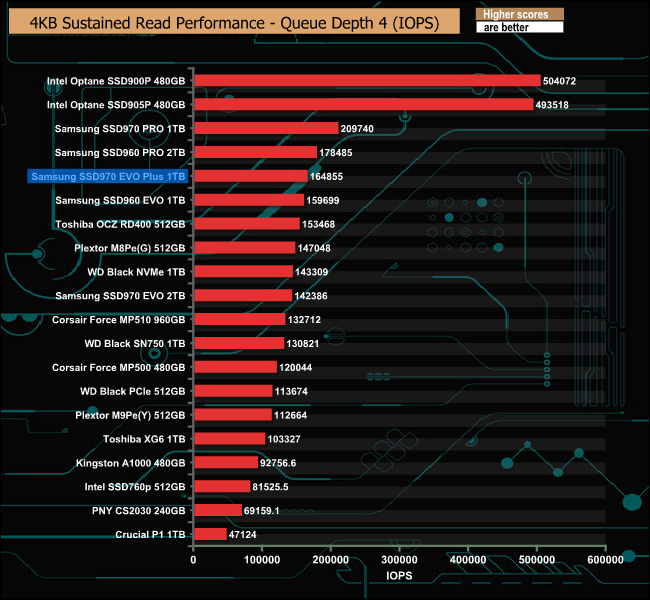
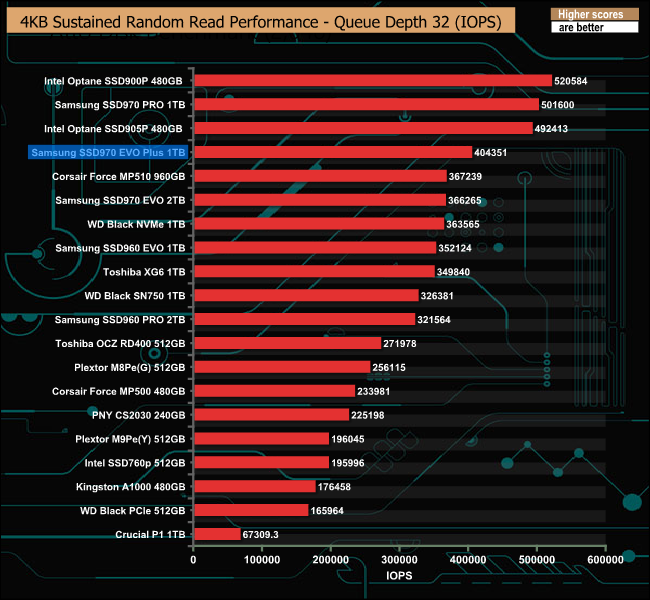
Throughout the tested queue depths, the new drive out-performed the 2TB version of the older SSD970 EVO.
4K Random Write v QD Performance

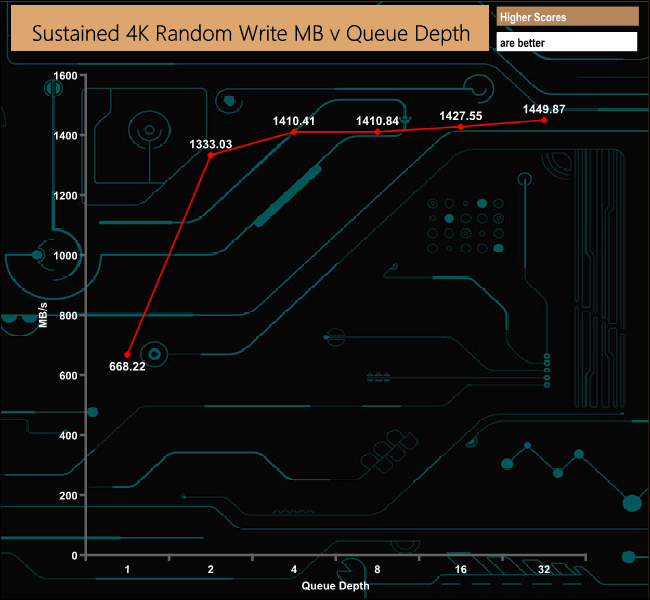
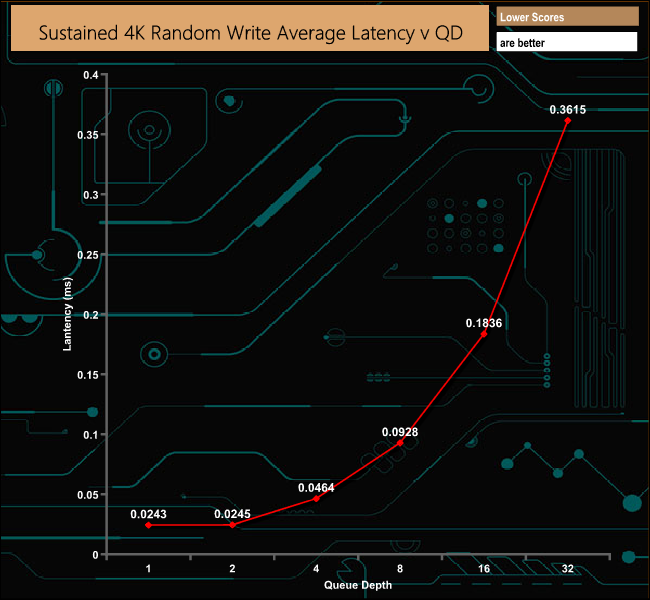
As with the 4K random read performance, Samsung quotes random write performance figures at two queue depths. At QD1 the drive is rated as up to 60,000 IOPS and at QD32, 550,000 IOPS. In our 4K testing the drive produced a QD1 figure 163,140 IOPS, much faster than the official figure. However, as with the random read test results, we fell well short of the official random write figure of 550,000 IOPS at 354,973 IOPS.
4K Random Write Performance Compared
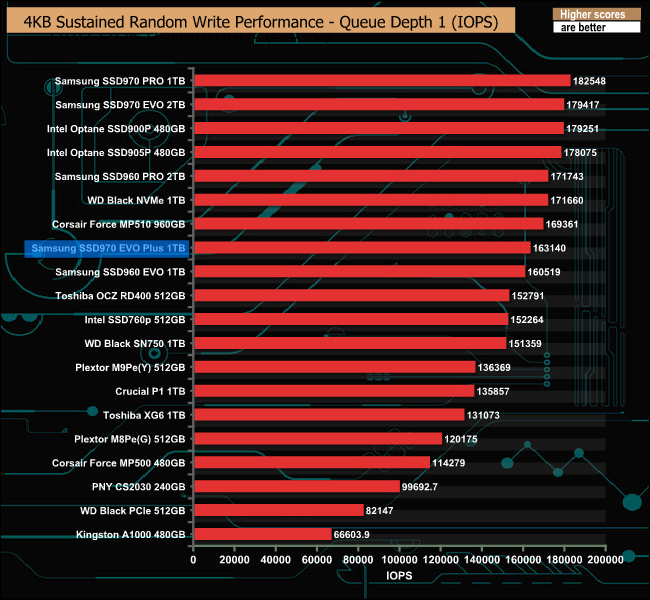
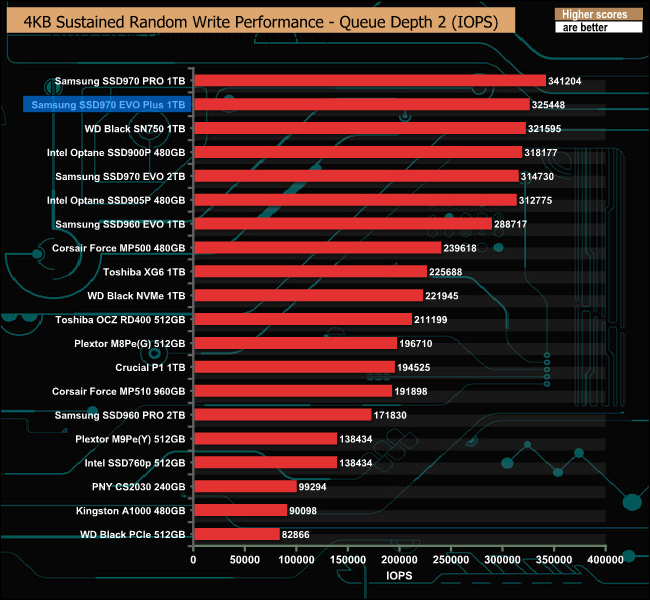
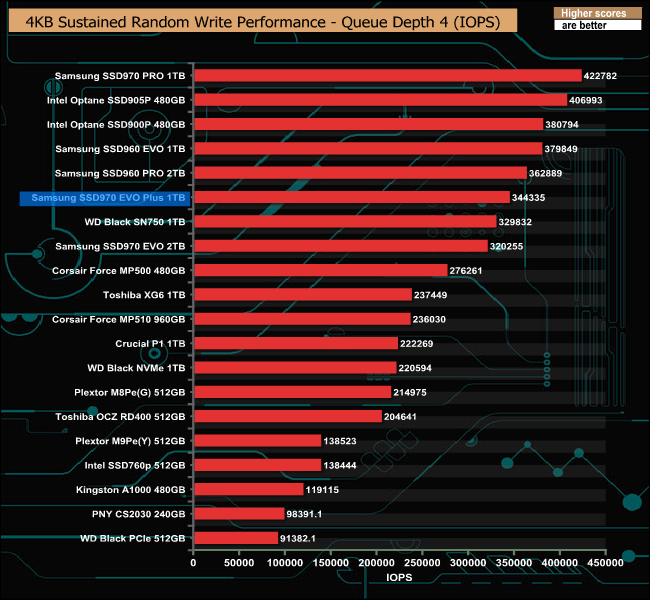
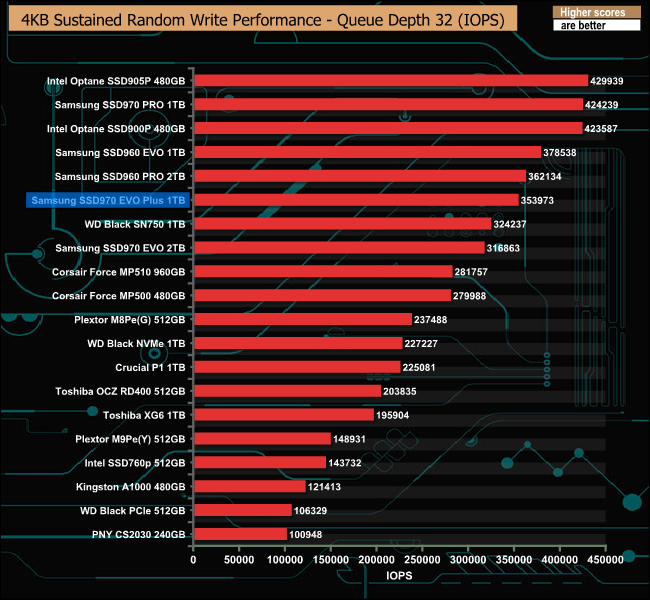
At QD1, the SSD970 EVO Plus sits someway off the 2TB SSD970 EVO, but for every other tested QD the new drive outpaces the older model.
4K 70/30 Mixed Performance
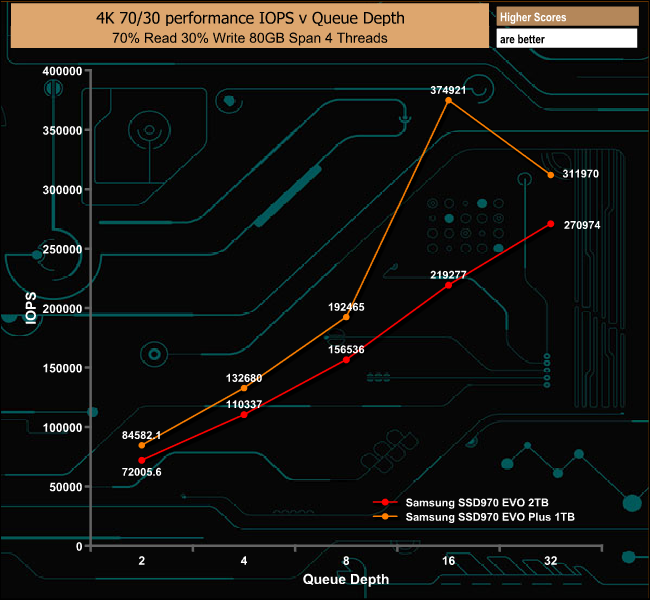
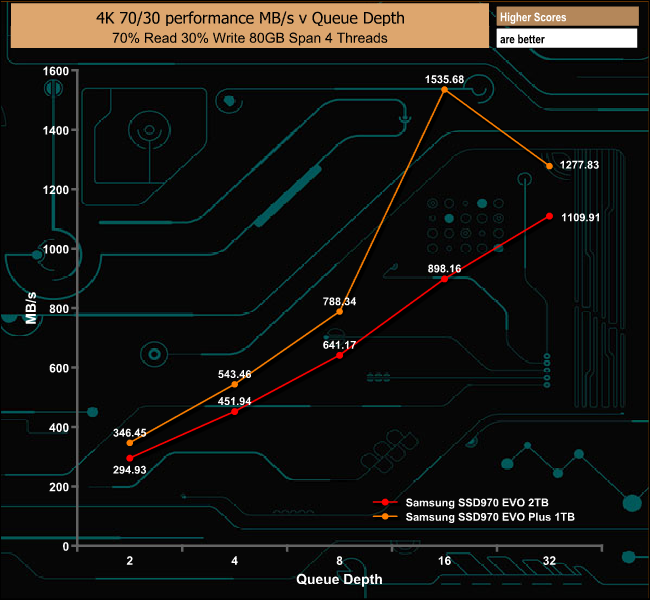
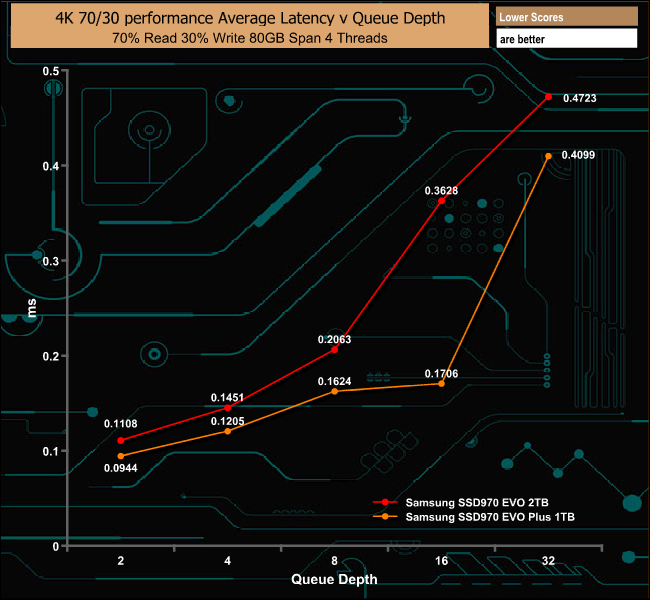
The SSD970 EVO Plus handles our 70/30 read/write mixed test better than the SSD970 EVO, with higher performance and lower latencies than the older drive. The performance of the drive SSD970 EVO Plus peaks at QD16 at 374,921 IOPS before dropping back to finish the test at QD32 at 311,970 IOPS.
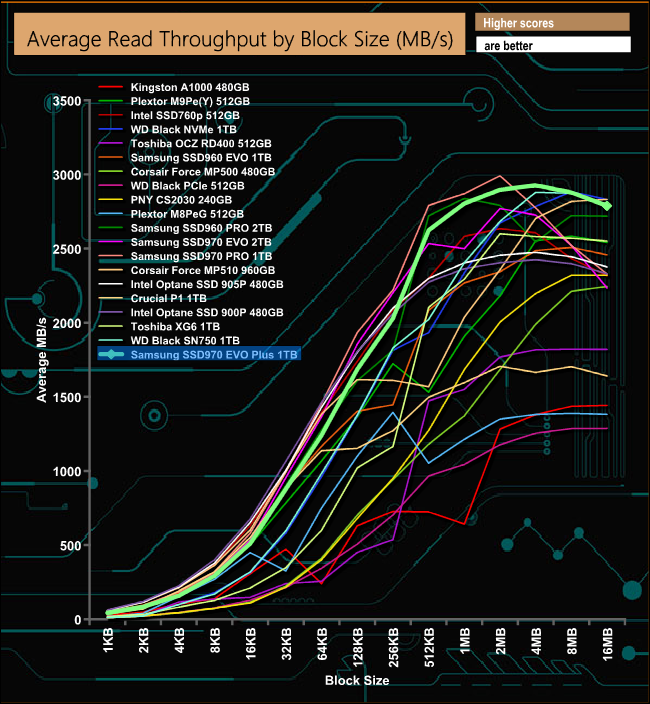
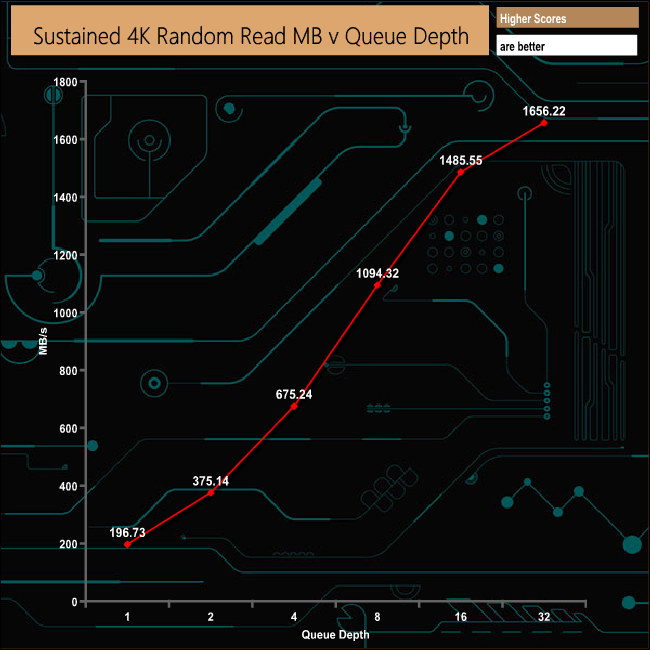
In our read throughput test the drive peaks at the 4MB block size at 2,926.71MB/s, a little way off the maximum official figure of 3,500MB/s.
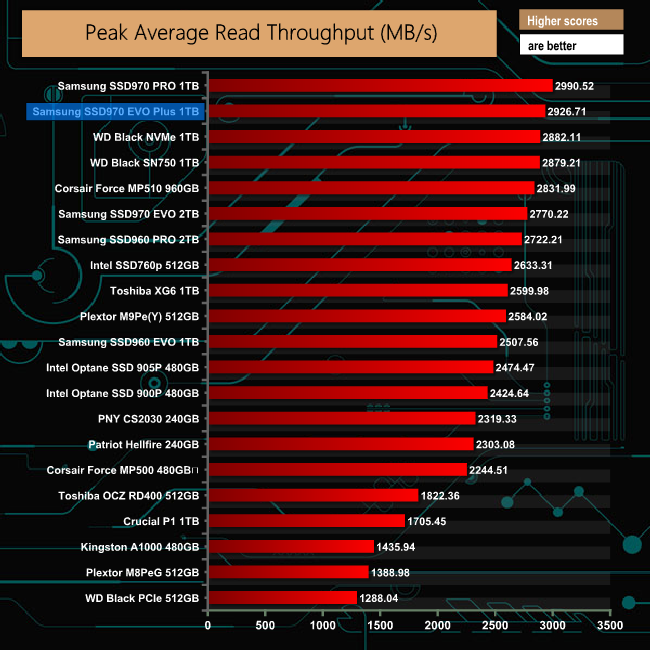
The new drive's peak read throughput figure of 2,926.71MB/s is some 156.69MB/s faster than the 2TB version of the SSD970 EVO.
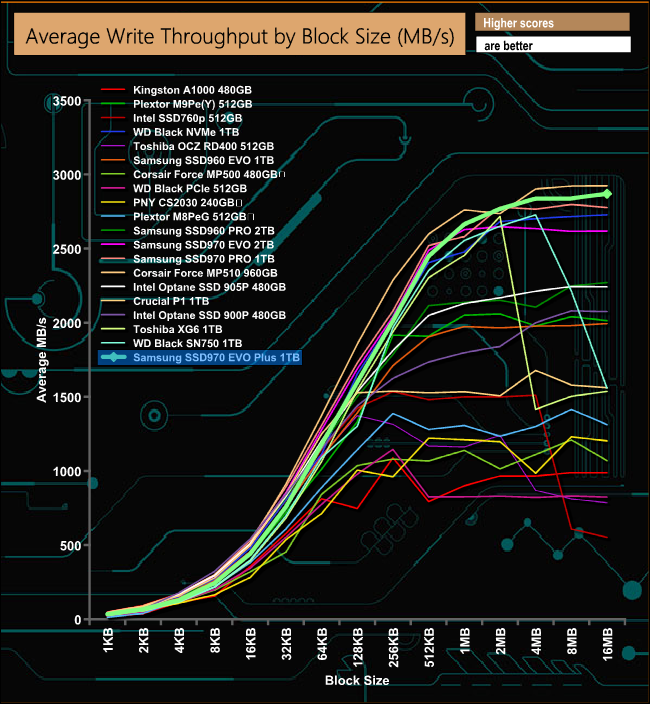
In our write throughtput test, the drive's peak performance came at the end of the test with a figure of 2,869.54MB/s.
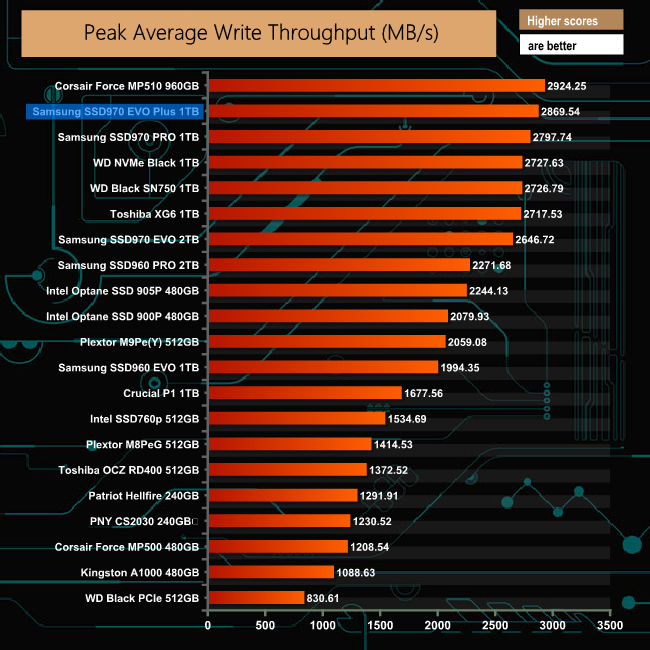
The 970 EVO Plus write throughput figure of 2,869.54MB/s is even faster than the figure we got out of the 970 PRO drive.
Futuremark’s PCMark 8 is a very good all round system benchmark but it’s Storage Consistency Test takes it to whole new level when testing SSD drives. It runs through four phases; Preconditioning, Degradation, Steady State, Recovery and finally Clean Up. During the Degradation, Steady State and Recovery phases it runs performance tests using the 10 software programs that form the backbone of PCMark 8; Adobe After Effects, Illustrator, InDesign, Photoshop Heavy and Photoshop Light, Microsoft Excel, PowerPoint, Word, Battlefield 3 and World of Warcraft. With some 18 phases of testing, this test can take many hours to run.
Preconditioning
The drive is written sequentially through up to the reported capacity with random data, write size of 256 × 512 = 131,072 bytes. This is done twice.
Degradation
Run writes of random size between 8 × 512 and 2048 × 512 bytes on random offsets for 10 minutes. It then runs a performance test. These two actions are then repeated 8 times and on each pass the duration of random writes is increased by 5 minutes.
Steady State
Run writes of random size between 8 × 512 and 2048 × 512 bytes on random offsets for final duration achieved in degradation phase. A performance test is then run. These actions are then re-run five times.
Recovery
The drive is idled for 5 minutes. Then a performance test is run. These actions are then repeated five times.
Clean Up
The drive is written through sequentially up to the reported capacity with zero data, write size of 256 × 512 = 131,072 bytes.
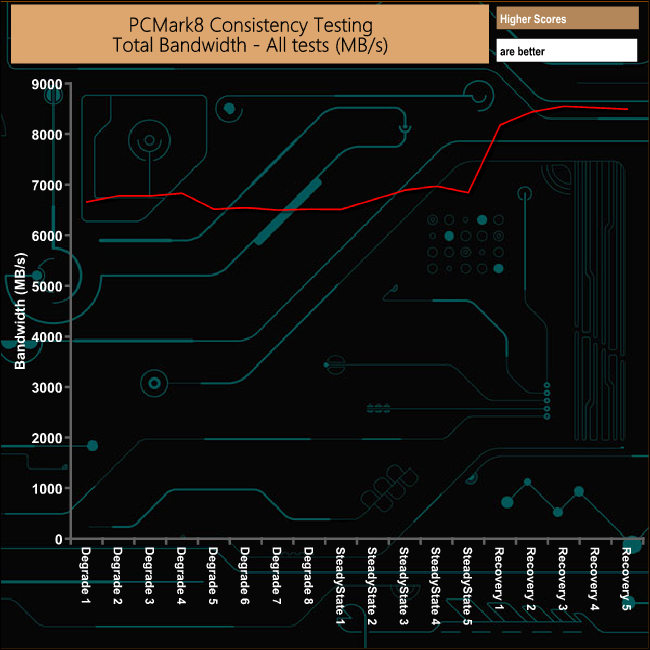
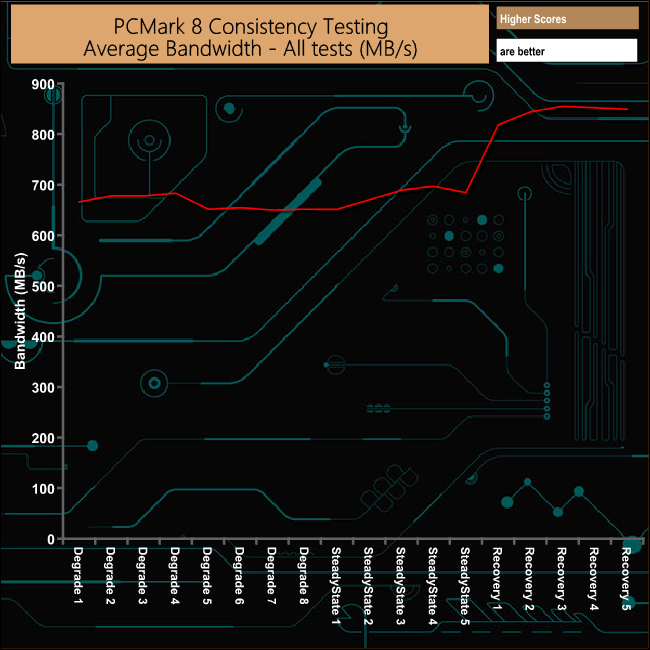
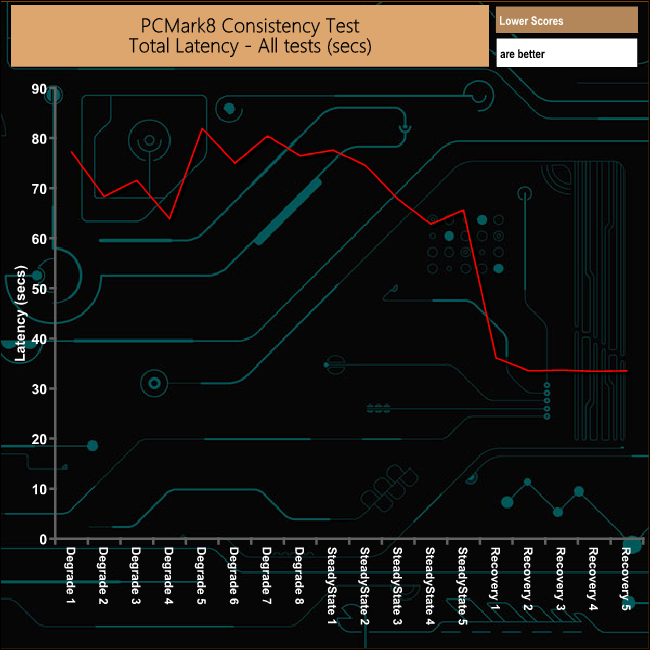
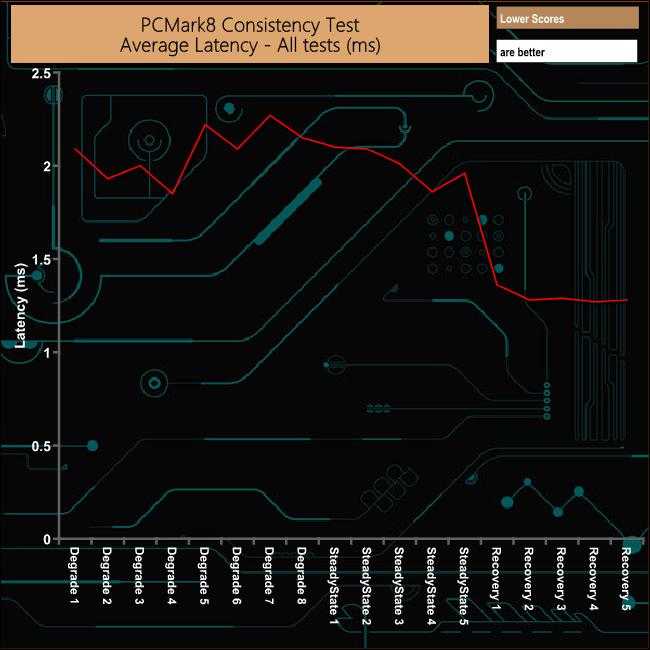
Overall the SSD970 EVO Plus deals with the rigours of the PCM8 Consistency test pretty well with consistent performance throughout the recovery phases.
PCMark 8’s Consistency test provides a huge amount of performance data, so here we’ve looked a little closer at how the Samsung SSD970 Plus performs in each of the benchmarks test suites.
Adobe Creative Cloud
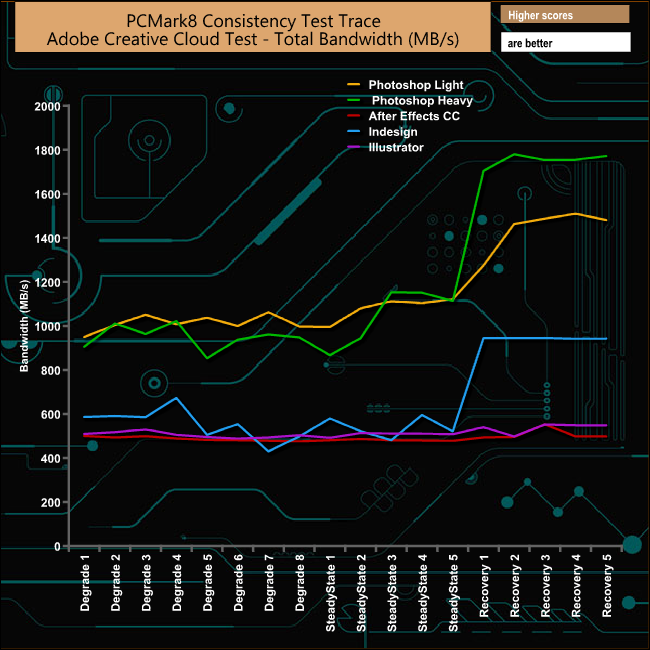
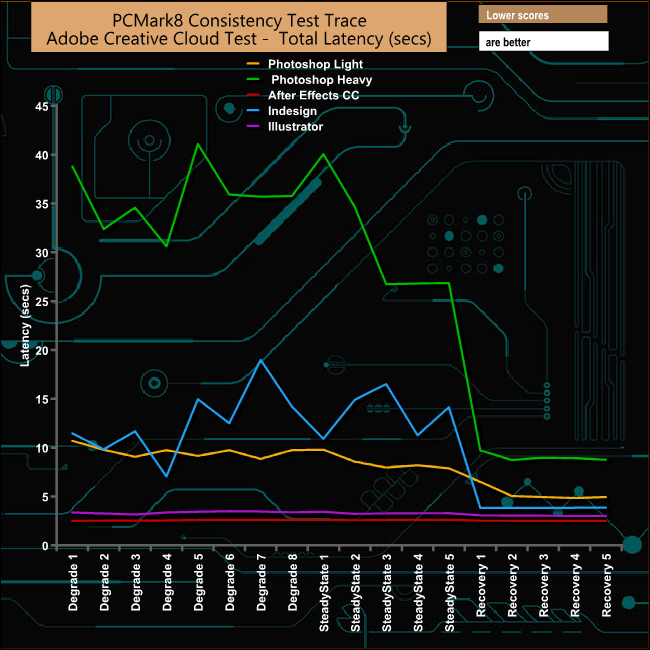
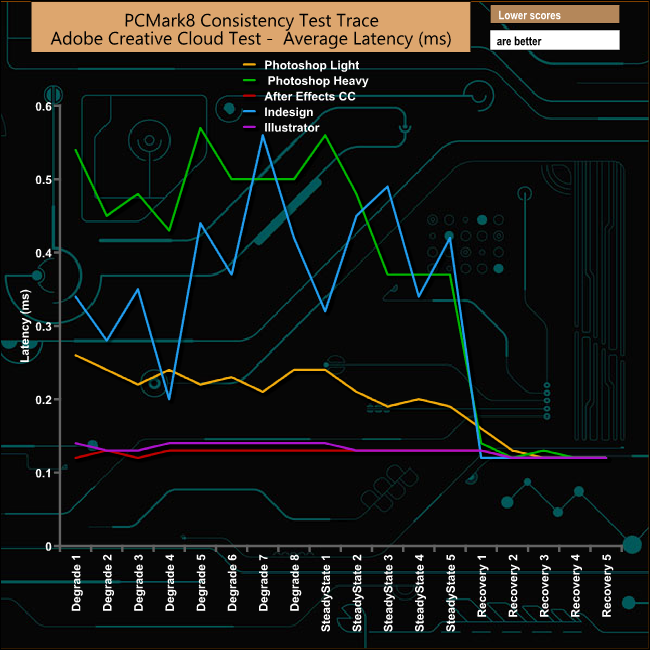
The drive handles the Adobe CC test suite quite well with no major dips in bandwidth during the test. The drive recovers very well in all the test traces.
Microsoft Office
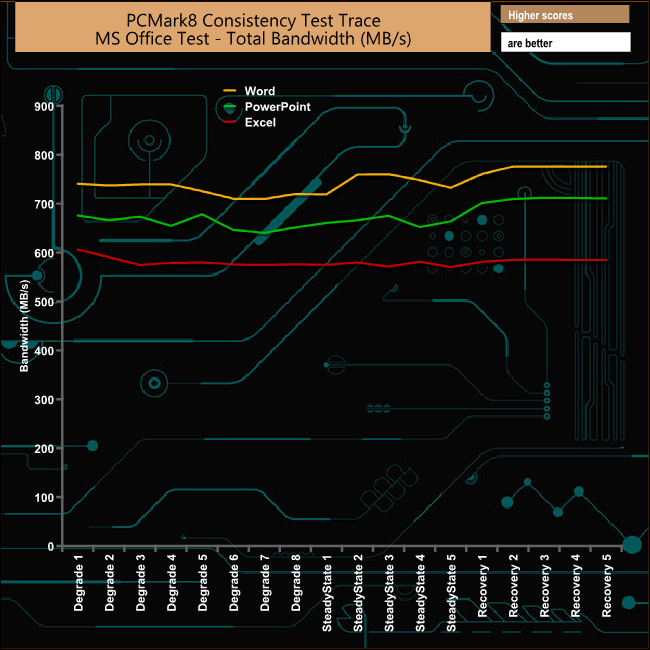
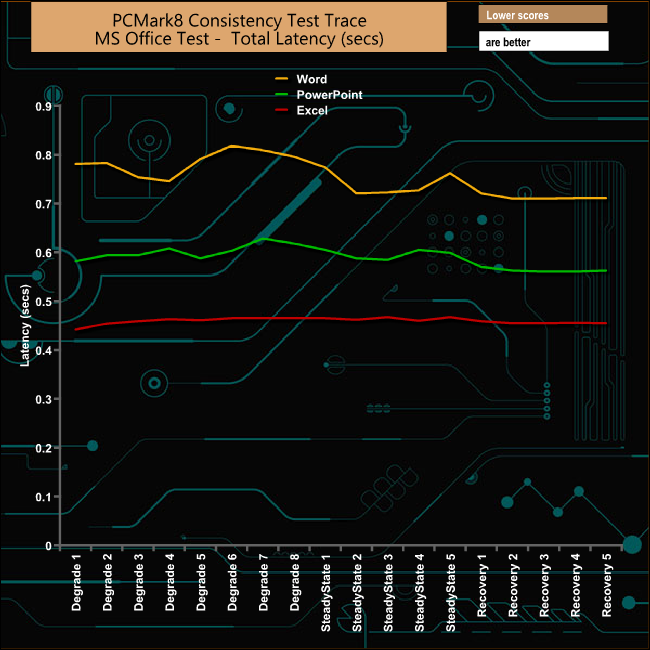
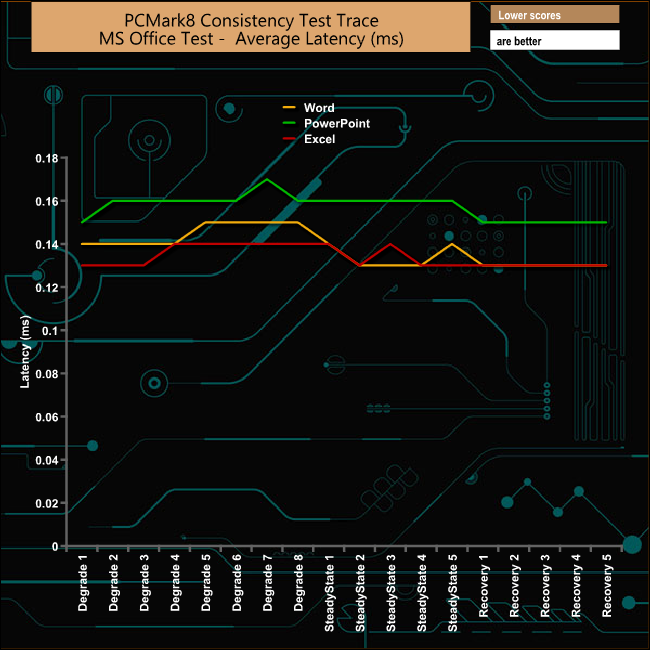
The drive shows no real sign of stress during the MS Office part of the benchmark run. Even the MS Word trace, which usually is the one that hits drives hard, is dealt with very efficiently.
Casual Gaming
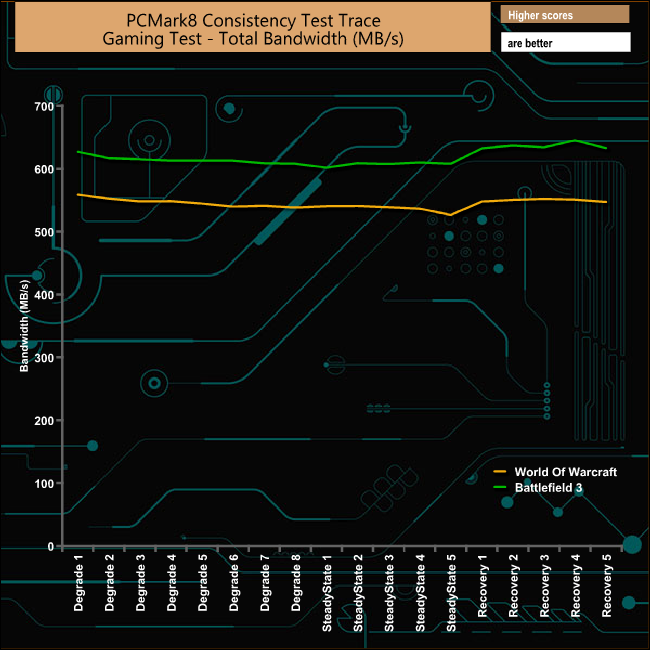
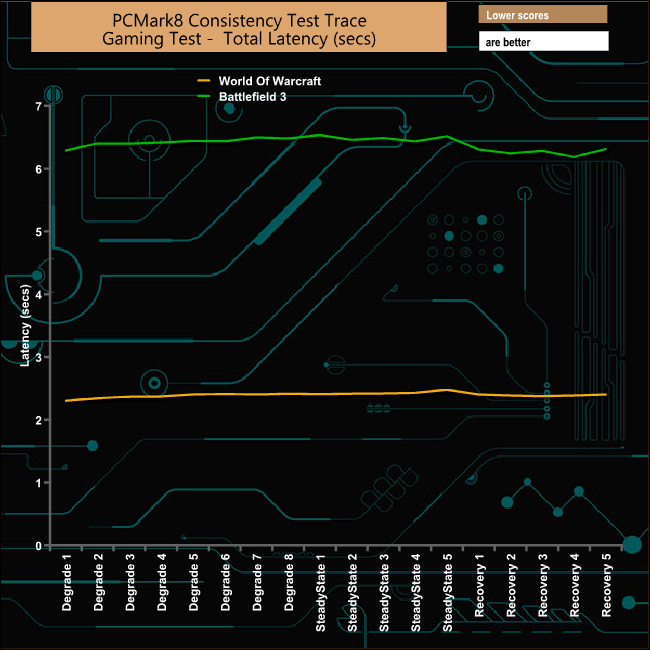
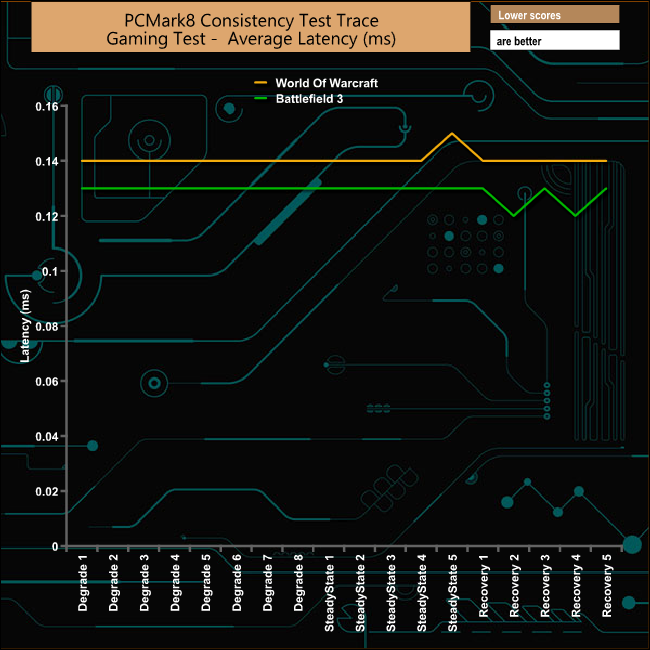
As with the MS Office tests, the casual gaming test suite is dealt with very well without any major alarms for either game test trace during the benchmark run.
Just like the Consistency test, PCMark 8’s Standard Storage test also saves a large amount of performance data. The default test runs through the test suite of 10 applications three times. Here we show the total bandwidth performance for each of the individual test suites for the third and final benchmark run.
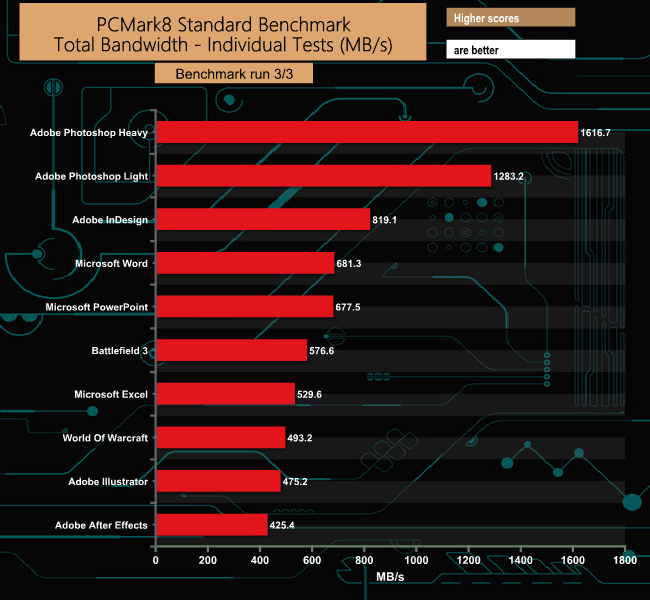
The 970 EVO Plus performs very well in the Standard PCMark 8 Storage test, with excellent bandwidth figures for both of the Adobe Photoshop tests in particular.
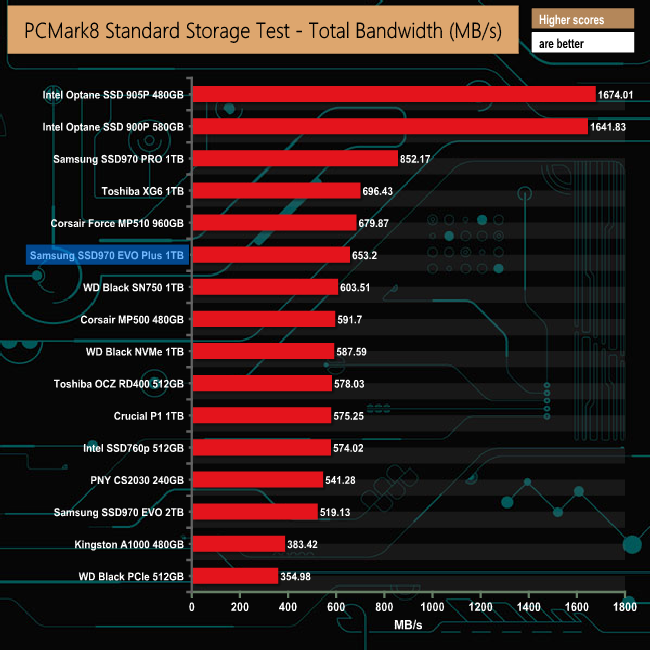
In PCMark 8's Standard Storage test, the SSD970 EVO Plus produces an overall bandwidth figure of 653.2MB/s which is an improvement over the 519.13MB/s figure produced by the previous generation SSD970 EVO.
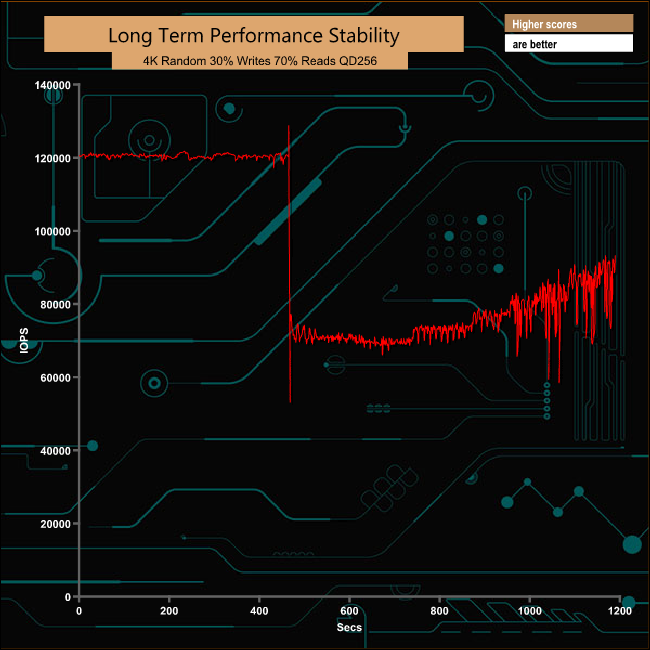
For the long term performance stability test, we set the drive up to run a 20-minute 4K random test with a 30% write, 70% read split, at a Queue Depth of 256 over the entire disk. The 1TB Samsung SSD970 EVO Plus averaged 93,253 IOPS for the test with a performance stability of 76.76% which is very good for a consumer-focused drive.
To test real life performance of a drive we use a mix of folder/file types and by using the FastCopy utility (which gives a time as well as MB/s result) we record the performance of drive reading from & writing to a 256GB Samsung SSD850 PRO.
We use the following folder/file types:
- 100GB data file.
- 60GB ISO image.
- 60GB Steam folder – 29,521 files.
- 50GB File folder – 28,523 files.
- 12GB Movie folder – 24 files (mix of Blu-ray and 4K files).
- 10GB Photo folder – 621 files (mix of png, raw and jpeg images).
- 10GB Audio folder – 1,483 files (mix of mp3 and .flac files).
- 5GB (1.5bn pixel) photo.
![]()
The drive handles large file sizes a lot more effectively than smaller ones, as can be seen by the 500MB/s+ figures for the tests made up of larger files (ISO image, Blu Ray movie etc).
To get a measure of how much faster PCIe NVMe drives are than standard SATA SSDs, we use the same files but transfer to and from a 512GB Toshiba OCZ RD400.
![]()
To give a better idea of just how much faster going from NVMe to NVMe drive is, as opposed to going from a standard SATA SSD, the 1000GB data file took 3m 13s to transfer from the SATA SSD to the SSD970 EVO Plus and 3m 40s to go the other way. When the same file was written to the NVMe drive from the SSD970 EVO Plus it took a mere 52s to read and just 1m 11s to write to the Samsung drive.
The 970 EVO Plus sees the introduction of Samsung's latest generation of NAND, its 5th gen design, which increases the layer count of their 3-bit MLC V-NAND (TLC V-NAND) from the 64-layer of the fourth generation to 9*-layer for this new memory. Unusually for Samsung, they haven't said how many layers the NAND uses, but it's a pretty safe assumption to believe it is 96-layer.
A combination of shiny new NAND and firmware improvements in the Samsung Phoenix controller, sees the 970 EVO Plus get some decent performance lifts over the previous generation SSD970 EVO. Samsung quotes Sequential read/writes for the 1TB drive as up to 3,500MB/s and 3,300MB/s respectively, which is a 100MB/s increase for reads over the 1TB 970 EVO, but a much more impressive 800MB/s increase in writes.
We could confirm the official figures with our sequential tests, the review drive peaking at 3,618MB/s for reads and 3,423MB/s for writes.
Random performance has also been improved with the new NAND and updates within the controller. At a QD of 1, the 1TB SSD970 EVO Plus is rated at up to 19,000 IOPS and 60,000 IOPS for reads/writes respectively, a rise of 4,000 IOPS for reads and 10,000 IOPS for writes over the 1TB 970 EVO.
At a much deeper queue depth of 32, the SSD970 EVO Plus is rated at 600,000 IOPS for reads, and increase of 100,000 IOPS over the previous generation drive with writes up from 450,000 IOPS to 550,000 IOPS. With our 4K tests we couldn't get close to those maximum figures. However, the new drive comfortably outpaced the older drive in all bar one of our 4K queue depth tests.
The 970 EVO Plus also uses the company's TurboWrite technology to aid write performance. TurboWrite basically uses a portion of the NAND as an SLC write buffer to boost write performance. The 1TB drive has a default TurboWrite region of 6GB but if the drive is being asked to write more than 6GB, the 1TB 970 EVO Plus can use up to 36GB of dynamic SLC buffer to give a total SLC buffer of 42GB. This dynamic SLC buffer takes advantage of idle capacity so will not work if there isn't enough free space.
Samsung's SSD970 EVO drive has been a popular and fast performing drive ever since its launch but recently it has been out performed by newer drives to the market segment like Corsair's Force MP510 and in particular WD's latest Black SN750 drive. By using the latest NAND technology, Samsung has given the 970 EVO Plus the ability to redress the balance.
![]()
We found the 1TB Samsung SSD970 Plus on Overclockers UK for £239.99 (inc VAT) HERE
Pros
- 9*-layer V-NAND technology.
- Overall Performance.
- 5 year warranty.
Cons
- We couldn’t match Samsung’s quoted maximum 4K random figures.
KitGuru says: Samsung's 970 EVO was a very successful and popular drive and now it has been given a new lease of life with the latest NAND technology in the form of the 970 EVO Plus. It is safe to say the new NAND gives it a healthy performance boost over the previous generation drive.

Be sure to check out our sponsors store EKWB here