
CrystalDiskMark is a useful benchmark to measure theoretical performance levels of hard drives and SSD’s. We are using v8.0.5.
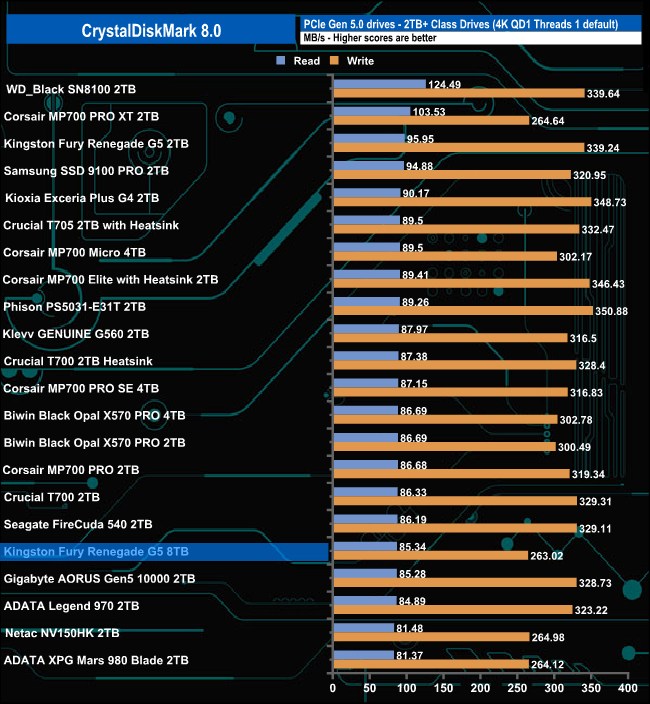
Using the CrystalDiskMark 8 4K QD1 T1 test, the 8TB version of the Fury Renegade G5 produces a read result of 85.34MB/s, 10MB/s slower than the 2TB version. The write result of 263MB/s is also slower.
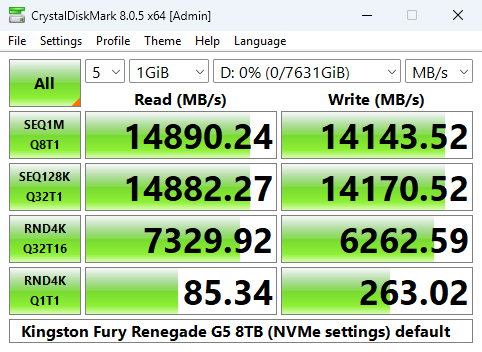
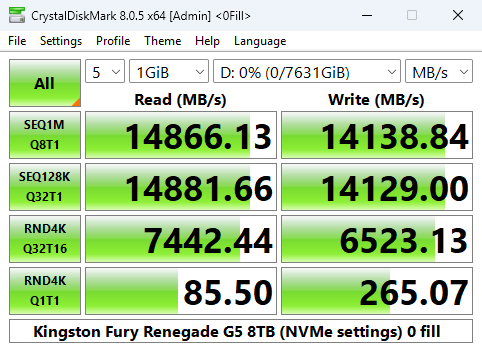
A glance at the benchmark result screens shows that we could confirm the official Sequential ratings of up to 14,800MB/s for reads and up to 14,000MB/s for writes, with test results of 14,890MB/s and 14,143MB/s for reads and writes, respectively.
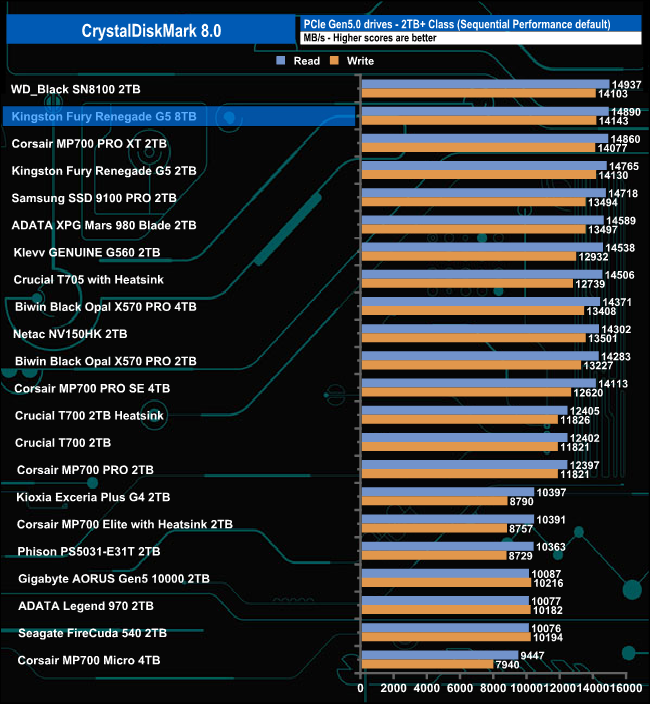
That 14,890MB/s read result places the 8TB Fury Renegade G5 into second place on the results chart, 125MB/s faster than the 2TB model, while its write score of 14,143MB/s is just 13MB/s faster.
Peak Performance profile
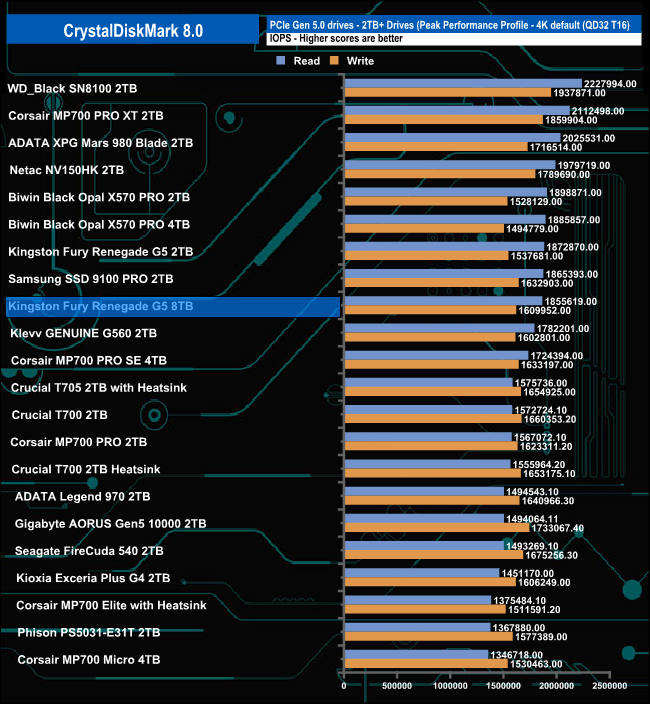
The 8TB Fury Renegade G5 is officially rated as up to 2,200K IOPS for random reads and random writes. Using the Peak Performance profile test in CrystalDiskMark 8, we couldn't reach those official maximums. The best read result we saw was 1,855,619 IOPS, slightly down on the 2TB model, with the best write figure at 1,609,952 IOPS, which is up on the 2TB Fury Renegade G5.

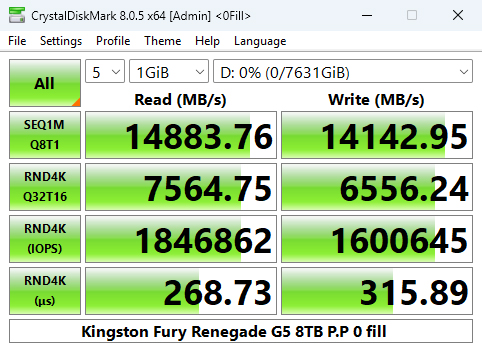
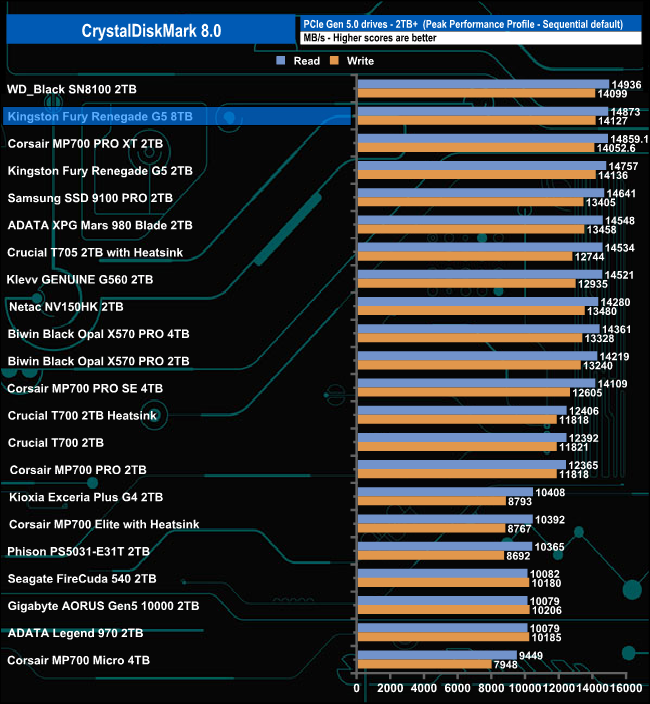
Once again, we can confirm the official sequential figures with Peak Performance profile test results of 14,873MB/s for reads and 14,127MB/s for writes, which put the drive in second place in the results chart.
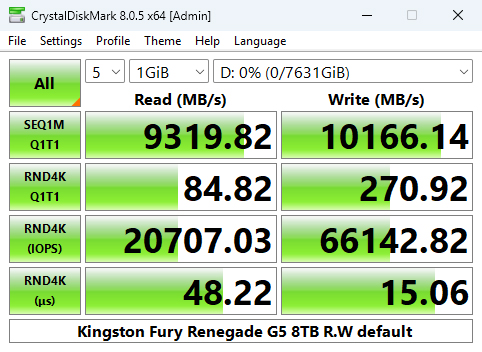
Real World Profile
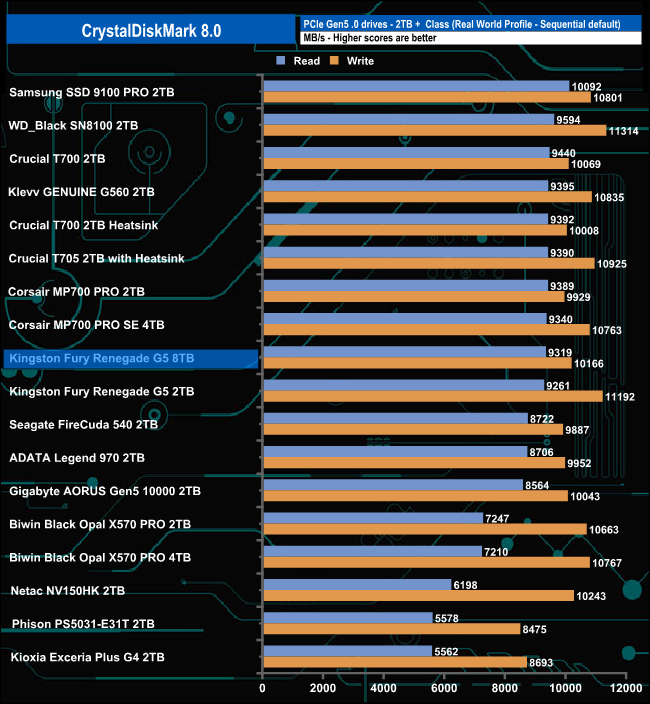
The 8TB Kingston Fury Renegade G5‘s read score in the CrystalDiskMark 8 Real World benchmark sees the drive in a mid-table position, slightly faster than the 2TB version. Its write test result of 10,166MB/s is 1,0256MB/s slower than the 2TB model.