
After getting our first look at RDNA 2 when the RX 6800 XT and RX 6800 both launched on November 18th, today our attention turns to AMD's new flagship GPU – the RX 6900 XT. Priced at $999, or £899.99 here in the UK, the RX 6900 XT comes with 80 Compute Units, giving a total of 5120 stream processors. Designed to take the fight to Nvidia in the ultra high-end market, let's find out if this GPU really is the RTX 3090 killer.
With the RX 6800 XT, AMD has a highly competitive product that can really challenge the RTX 3080 with its £600 MSRP. Now, AMD has set its sights higher with the RX 6900 XT, with its marketing materials suggesting this new flagship will offer similar performance to Nvidia's RTX 3090, but at several hundred pounds less.
Of course, we need to find out just how true those claims are, so today we look at the RX 6900 XT's performance across 14 games, while also looking at power draw, thermals, overclocking and more.
| RX 6900 XT | RX 6800 XT | RX 6800 | RX 5700 XT | RX 5700 | |
| Architecture | RDNA 2 | RDNA 2 | RDNA 2 | RDNA | RDNA |
| Manufacturing Process | 7nm | 7nm | 7nm | 7nm | 7nm |
| Transistor Count | 26.8 billion | 26.8 billion | 26.8 billion | 10.3 billion | 10.3 billion |
| Die Size | 519 mm² | 519 mm² | 519 mm² | 251 mm² | 251mm² |
| Ray Accelerators | 80 | 72 | 60 | n/a | n/a |
| Compute Units | 80 | 72 | 60 | 40 | 36 |
| Stream Processors | 5120 | 4608 | 3840 | 2560 | 2304 |
| Game GPU Clock | Up to 2015MHz | Up to 2015MHz | Up to 1815MHz | Up to 1755MHz | Up to 1625MHz |
| Boost GPU Clock | Up to 2250MHz | Up to 2250MHz | Up to 2105MHz | Up to 1905MHz | Up to 1725MHz |
| Peak SP Performance | Up to 23.04 TFLOPS | Up to 20.74 TFLOPS | Up to 16.17 TFLOPS | Up to 9.75 TFLOPS | Up to 7.95 TFLOPS |
| Peak Half Precision Performance | Up to 46.08 TFLOPS | Up to 41.47 TFLOPS | Up to 32.33 TFLOPS | Up to 19.5 TFLOPS | Up to 15.9 TFLOPS |
| Peak Texture Fill-Rate | Up to 720 GT/s | Up to 648.0 GT/s | Up to 505.2 GT/s | Up to 304.8 GT/s | Up to 248.4 GT/s |
| ROPs | 128 | 128 | 96 | 64 | 64 |
| Peak Pixel Fill-Rate | Up to 288.0 GP/s | Up to 288.0 GP/s | Up to 202.1 GP/s | Up to 121.9 GP/s | Up to 110.4 GP/s |
| AMD Infinity Cache | 128MB | 128MB | 128MB | n/a | n/a |
| Memory | 16GB GDDR6 | 16GB GDDR6 | 16GB GDDR6 | 8GB GDDR6 | 8GB GDDR6 |
| Memory Bandwidth | 512 GB/s | 512 GB/s | 512 GB/s | 448 GB/s | 448 GB/s |
| Memory Interface | 256-bit | 256-bit | 256-bit | 256-bit | 256-bit |
| Board Power | 300W | 300W | 250W | 225W | 185W |
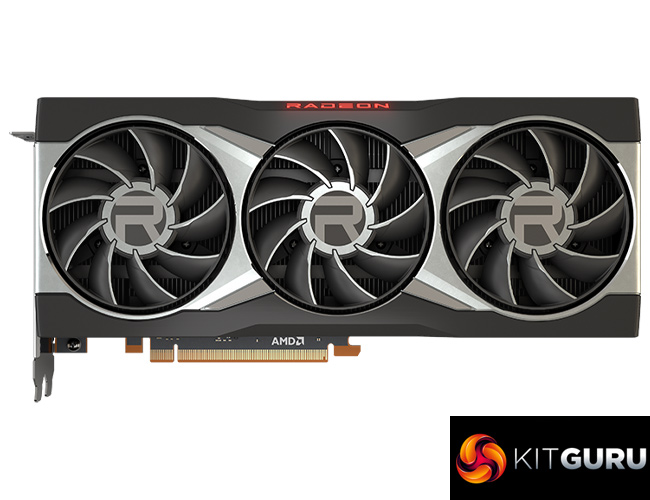
While the RX 6900 XT is a new model, it has many similarities with the RX 6800 XT. Still fabricated on TSMC’s 7nm process node, it uses the same Navi 21 GPU, measuring 519 mm². The key difference is that the RX 6900 XT silicon is fully populated, with 80 Compute Units (CUs) compared to 72 for the 6800 XT. This means the new flagship has an extra 512 Stream Processors, giving a grand total of 5120 shaders.
Rated clock speed is also identical between these two RDNA 2 GPUs. This means the RX 6900 XT has a rated game clock of 2015MHz and a rated boost clock of up to 2250MHz. To put that into perspective, the RX 5700 XT has a rated game clock of 1755MHz.
AMD has also increased the memory capacity, with 16GB of GDDR6 memory found on every RX 6000 SKU (so far). The memory is clocked at 16Gbps, and operates over a 256-bit memory interface for total bandwidth of 512 GB/s. However, AMD has also implemented a 128MB Infinity Cache on the Navi 21 GPU, to significantly increase effective memory bandwidth without excess power draw.
Speaking of power, the RX 6900 XT has a rated total board power (TBP) of 300W, and this is exactly the same as the RX 6800 XT – despite having 512 more cores. From what we were told in a press briefing, it sounds like AMD has binned the 6900 XT parts for efficiency, which lets them keep to the same 300W mark while increasing core count.
The AMD RX 6900 XT ships in identical packaging to the RX 6800 XT, with a large image of the graphics card visible from the front. The back of the box is mostly left bare, except for some text in the top left corner advising customers to download the user manual.
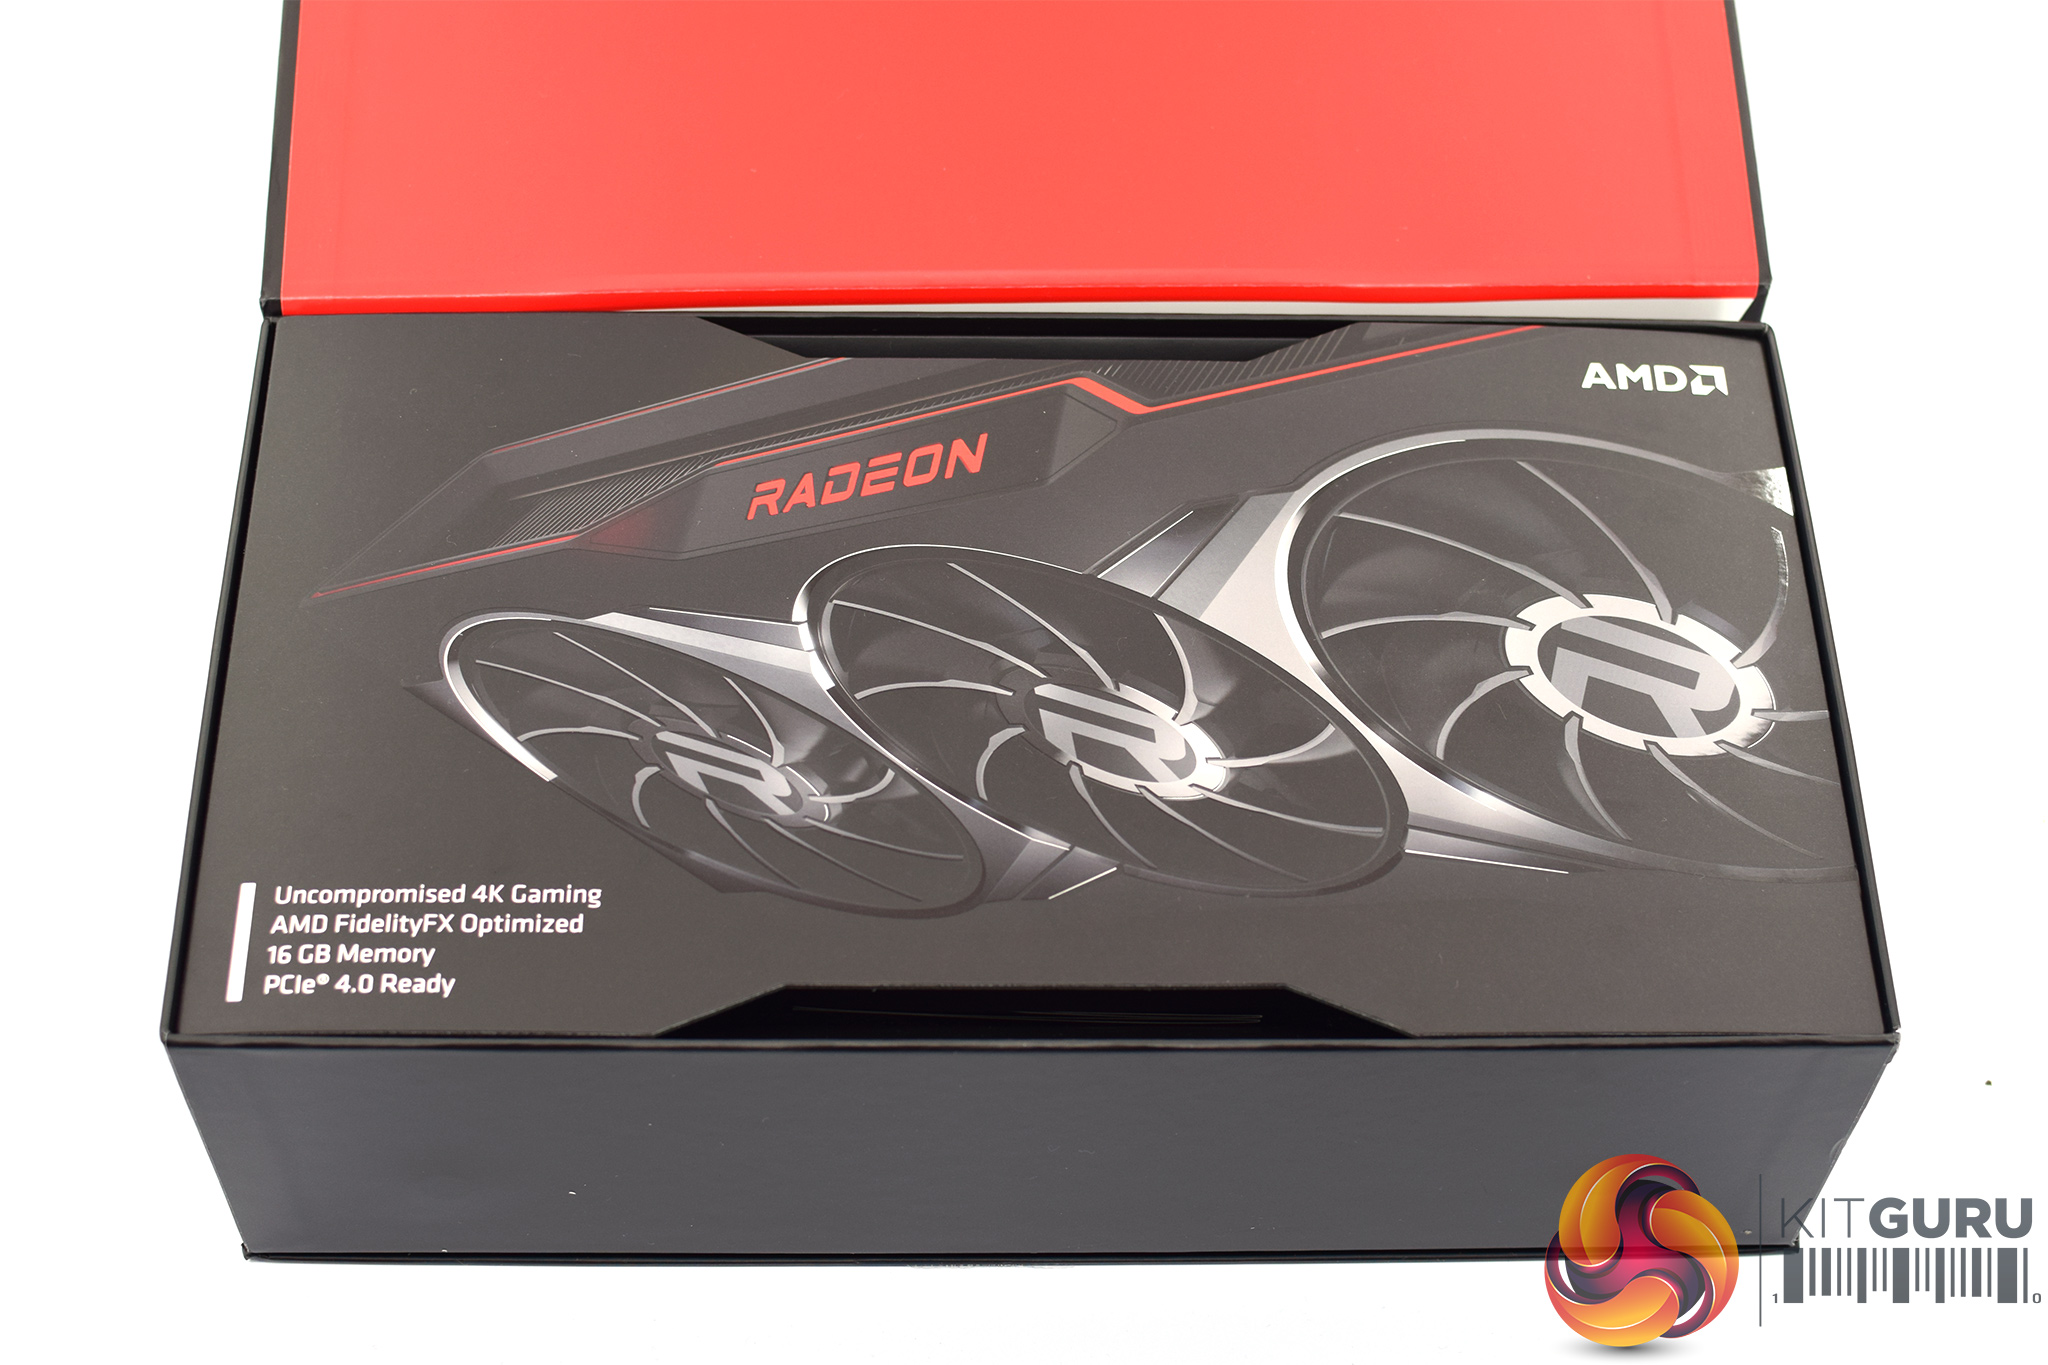
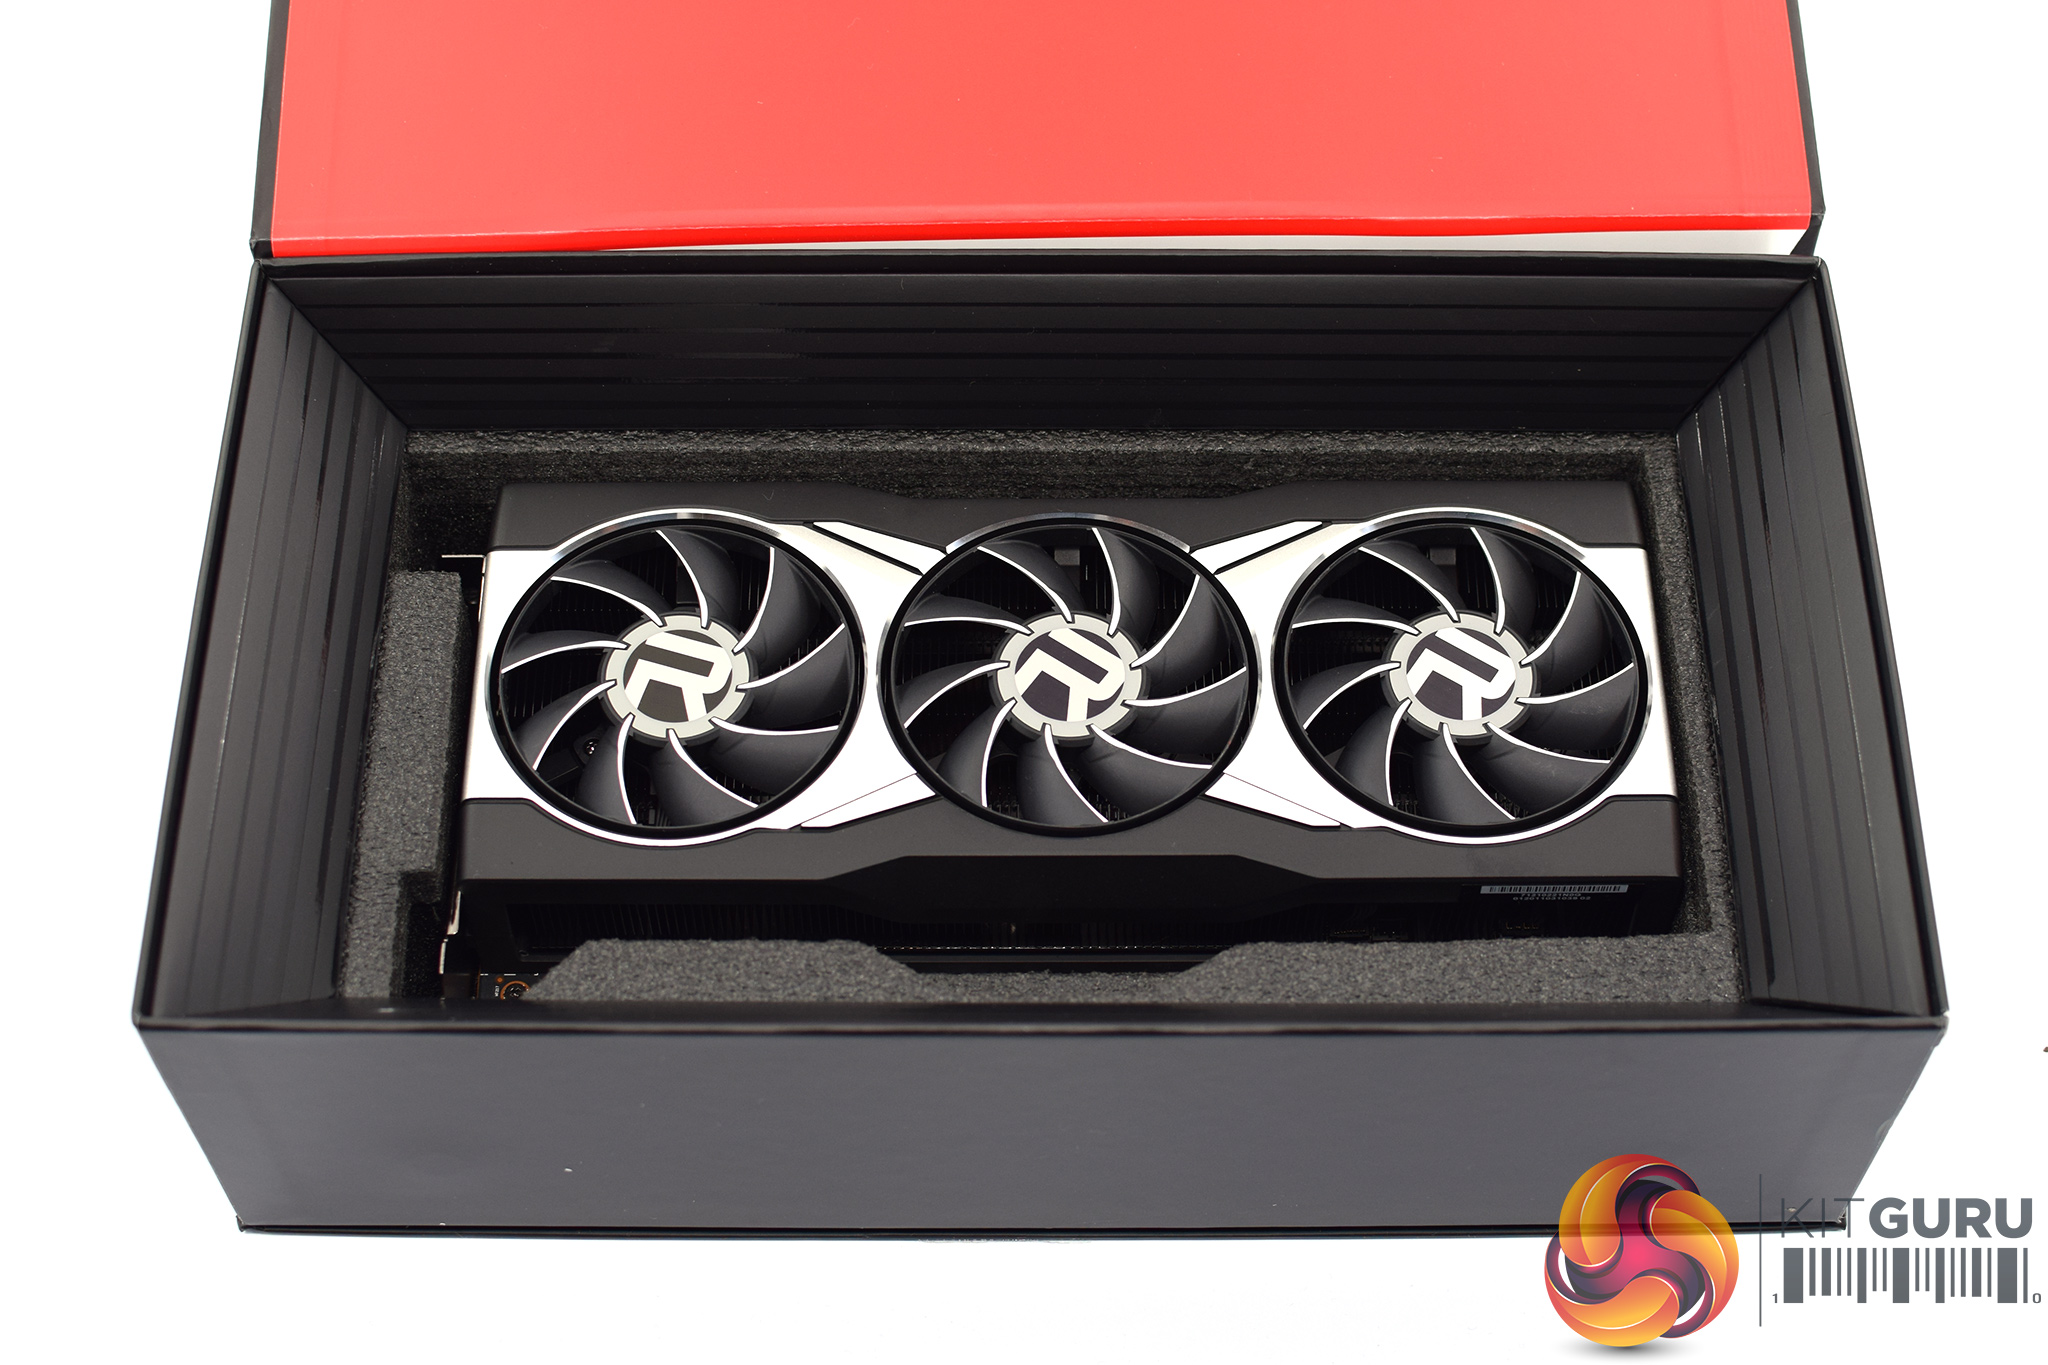
The box opens to reveal an insert, and the card itself sits below this, surrounded by stiff foam.
The 6900 XT also comes with an AMD-branded mouse mat, as well as a Radeon keycap.
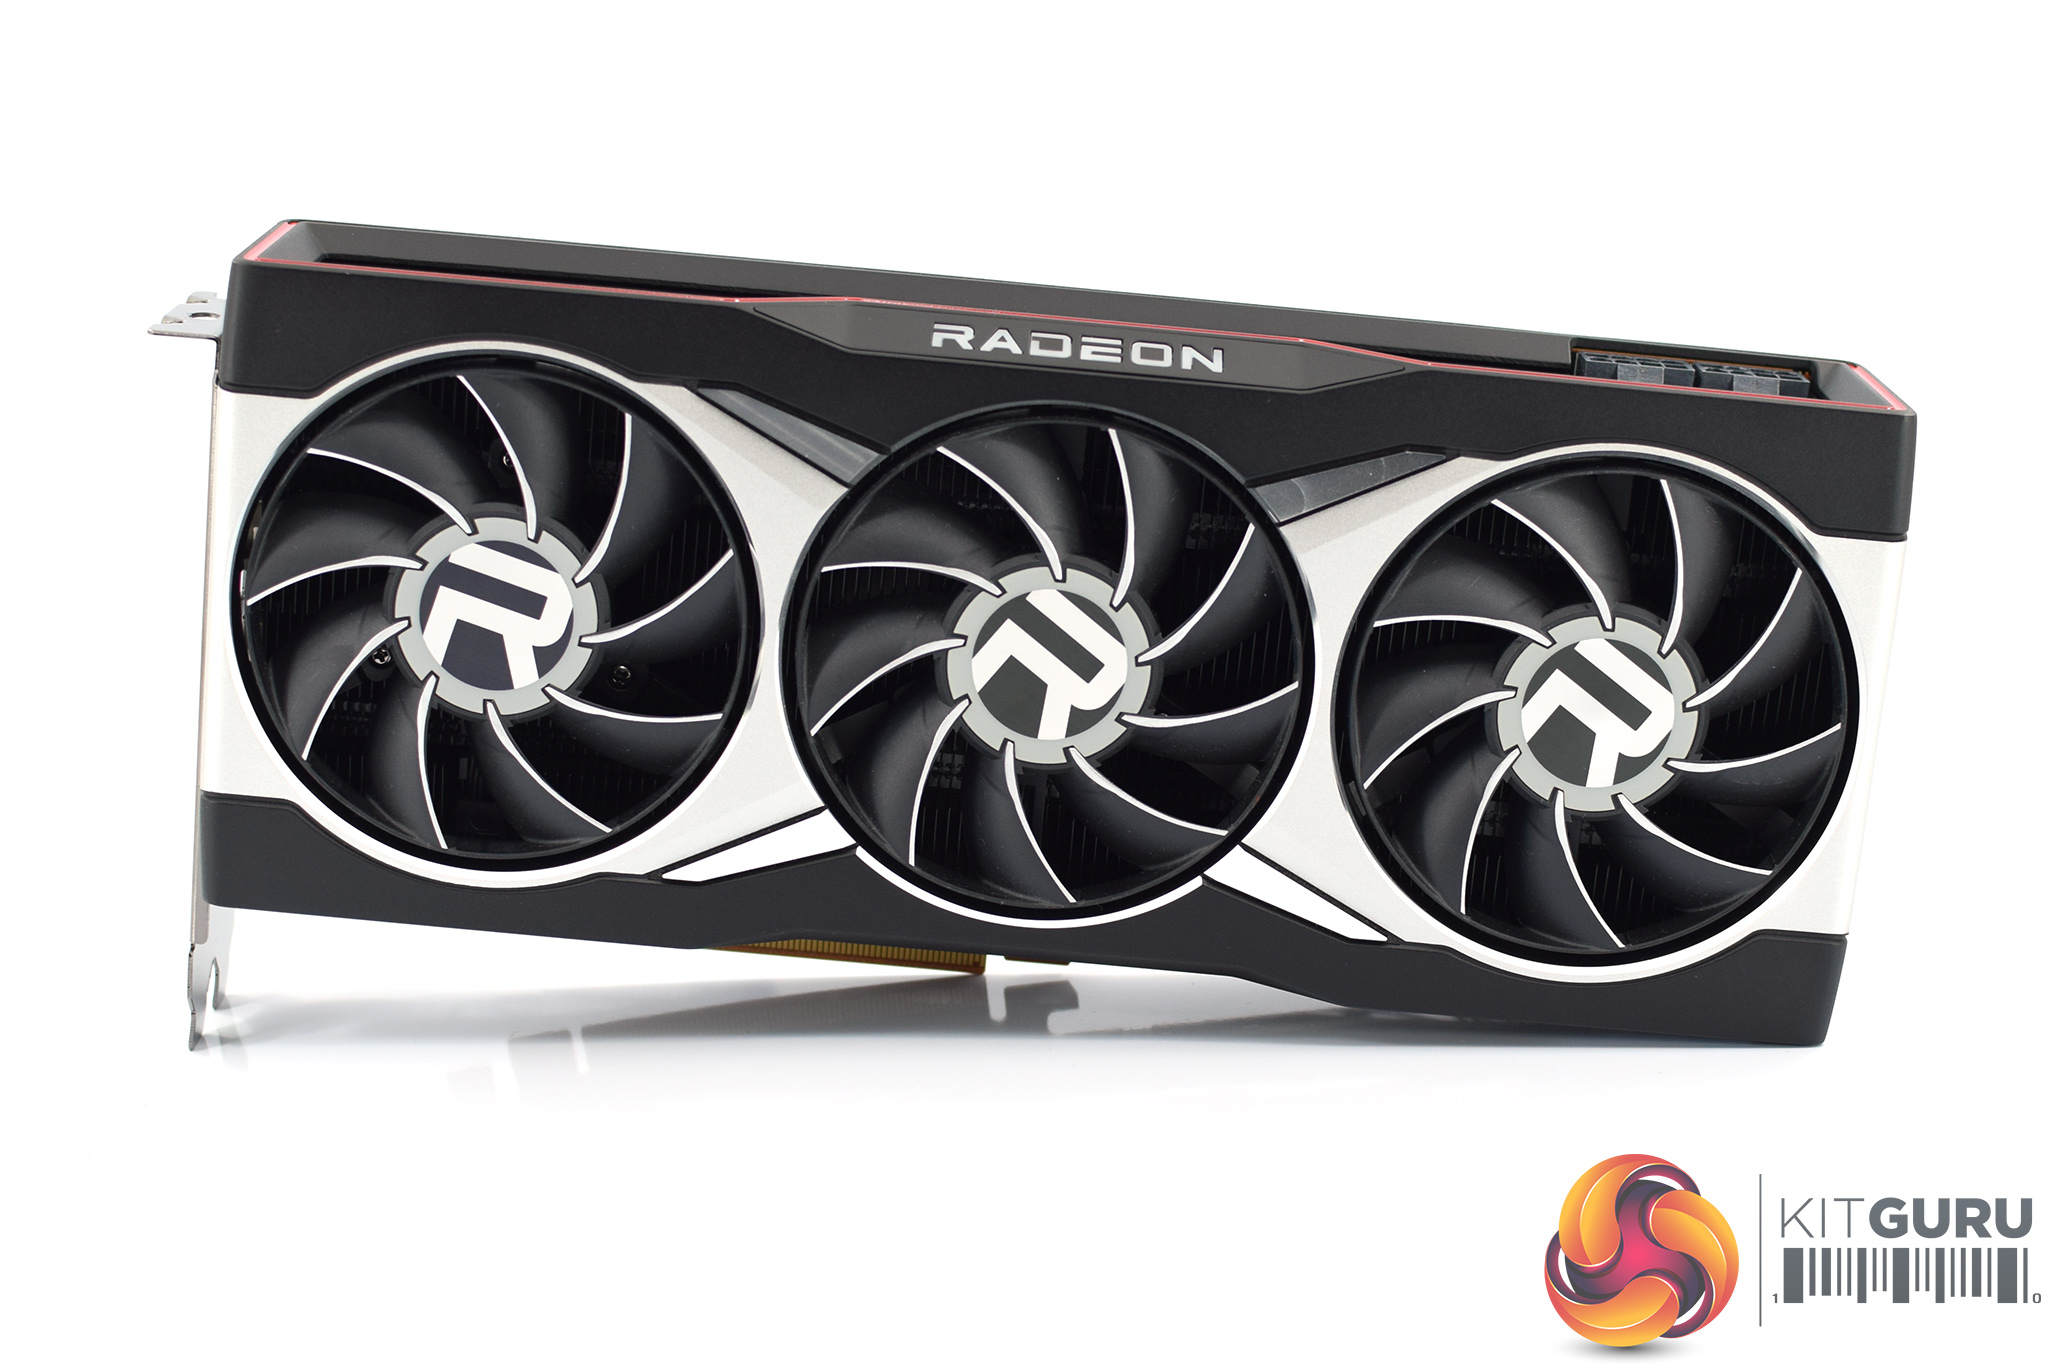
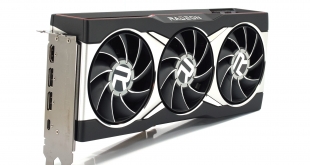
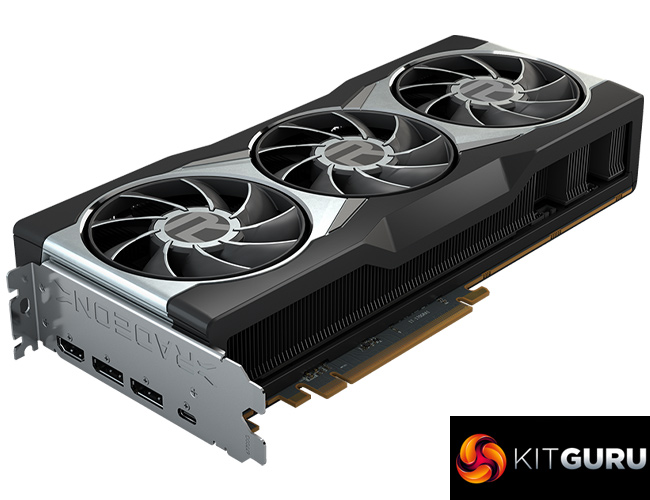
Taking a look at the RX 6900 XT itself, it uses the exact same cooler as the RX 6800 XT, so the two look identical. This means we once more have a premium-feeling die-cast aluminium shroud, which is mostly black but with some prominent silver sections.
It also uses the same triple-fan arrangement, with three 80mm axial fans – the blower-style coolers of old are now a thing of the past. Each fan sports the ‘R' Radeon logo on the central hub.
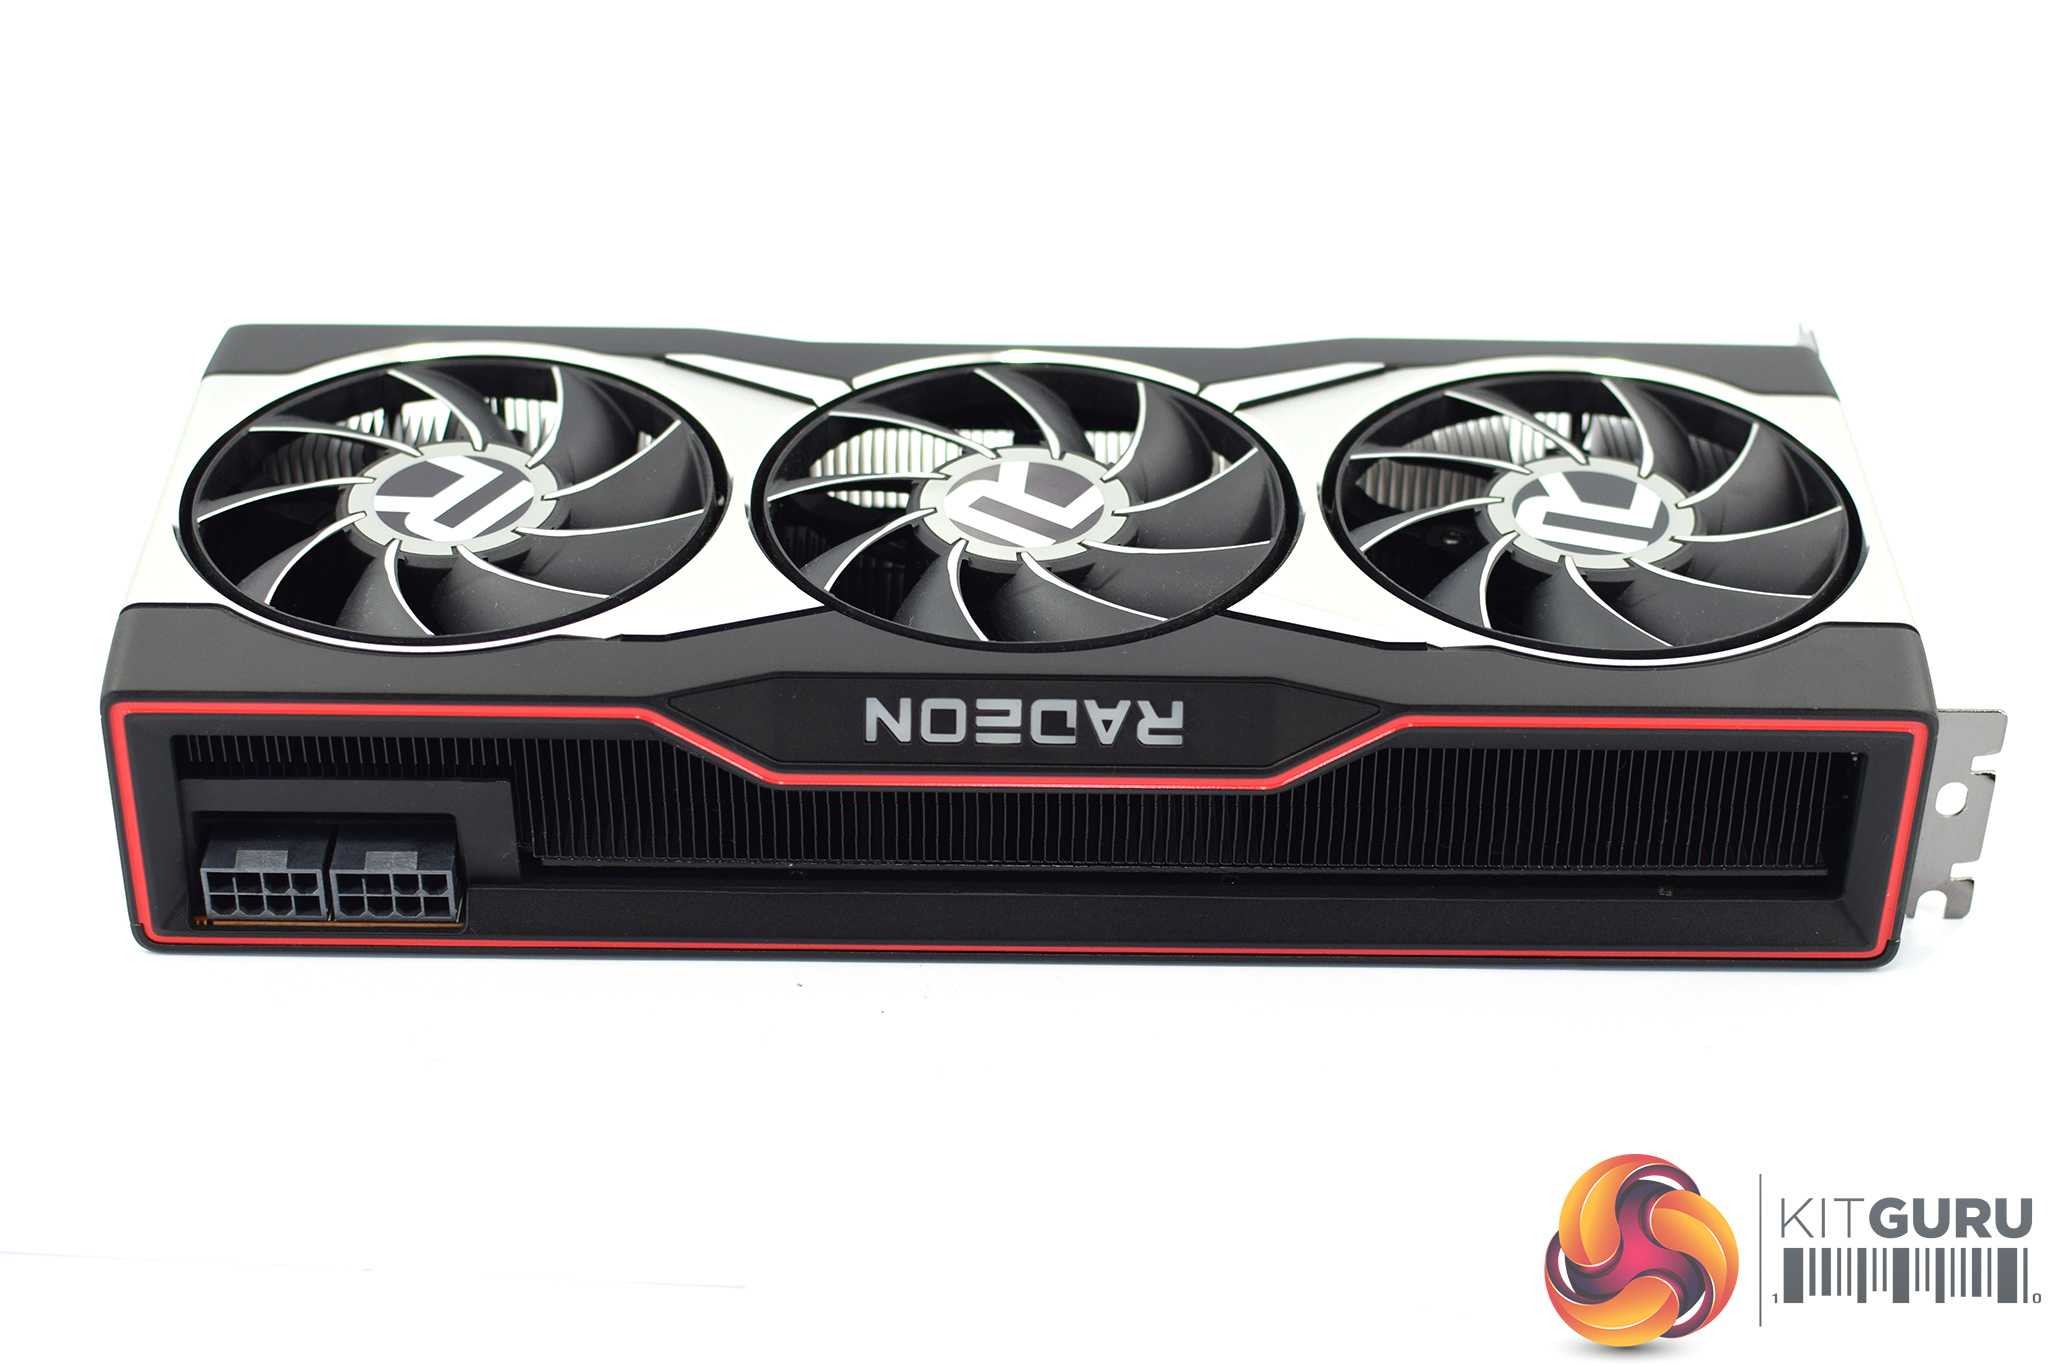
In terms of its dimensions, the card measures 267 x 115mm, and it is a 2.5-slot thickness. This is exactly the same as the RX 6800 XT, and while the RX 6800 looks the same, that card is a dual-slot thickness.
The front side of the card is home to the Radeon logo, and here we are in for a slight surprise – this logo is actually RGB! AMD provided us with an RGB control software, so be sure to check that out in the video.
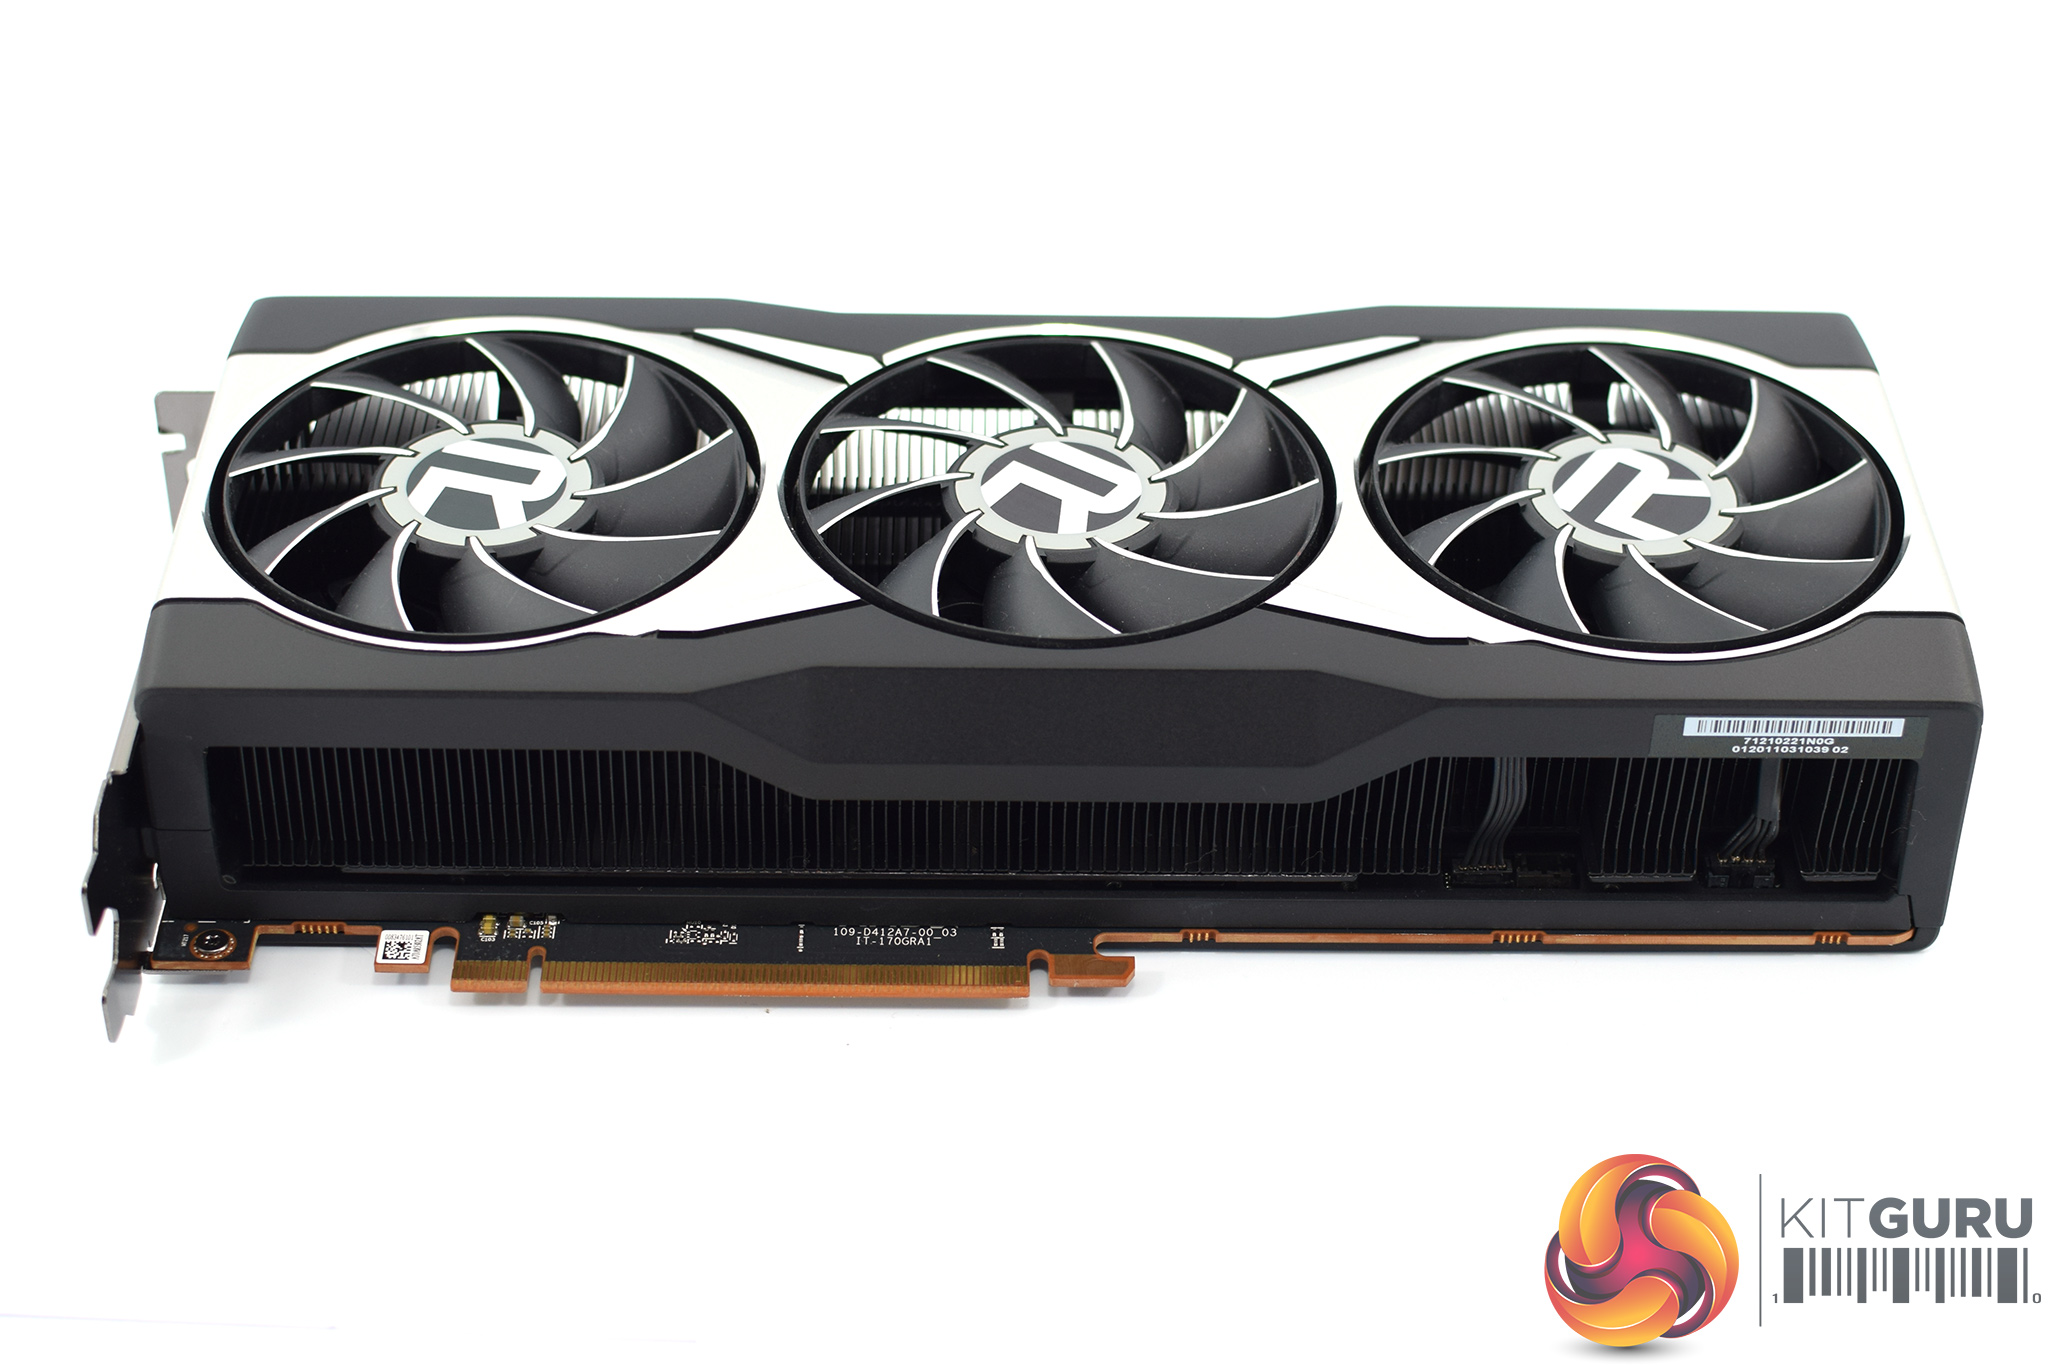
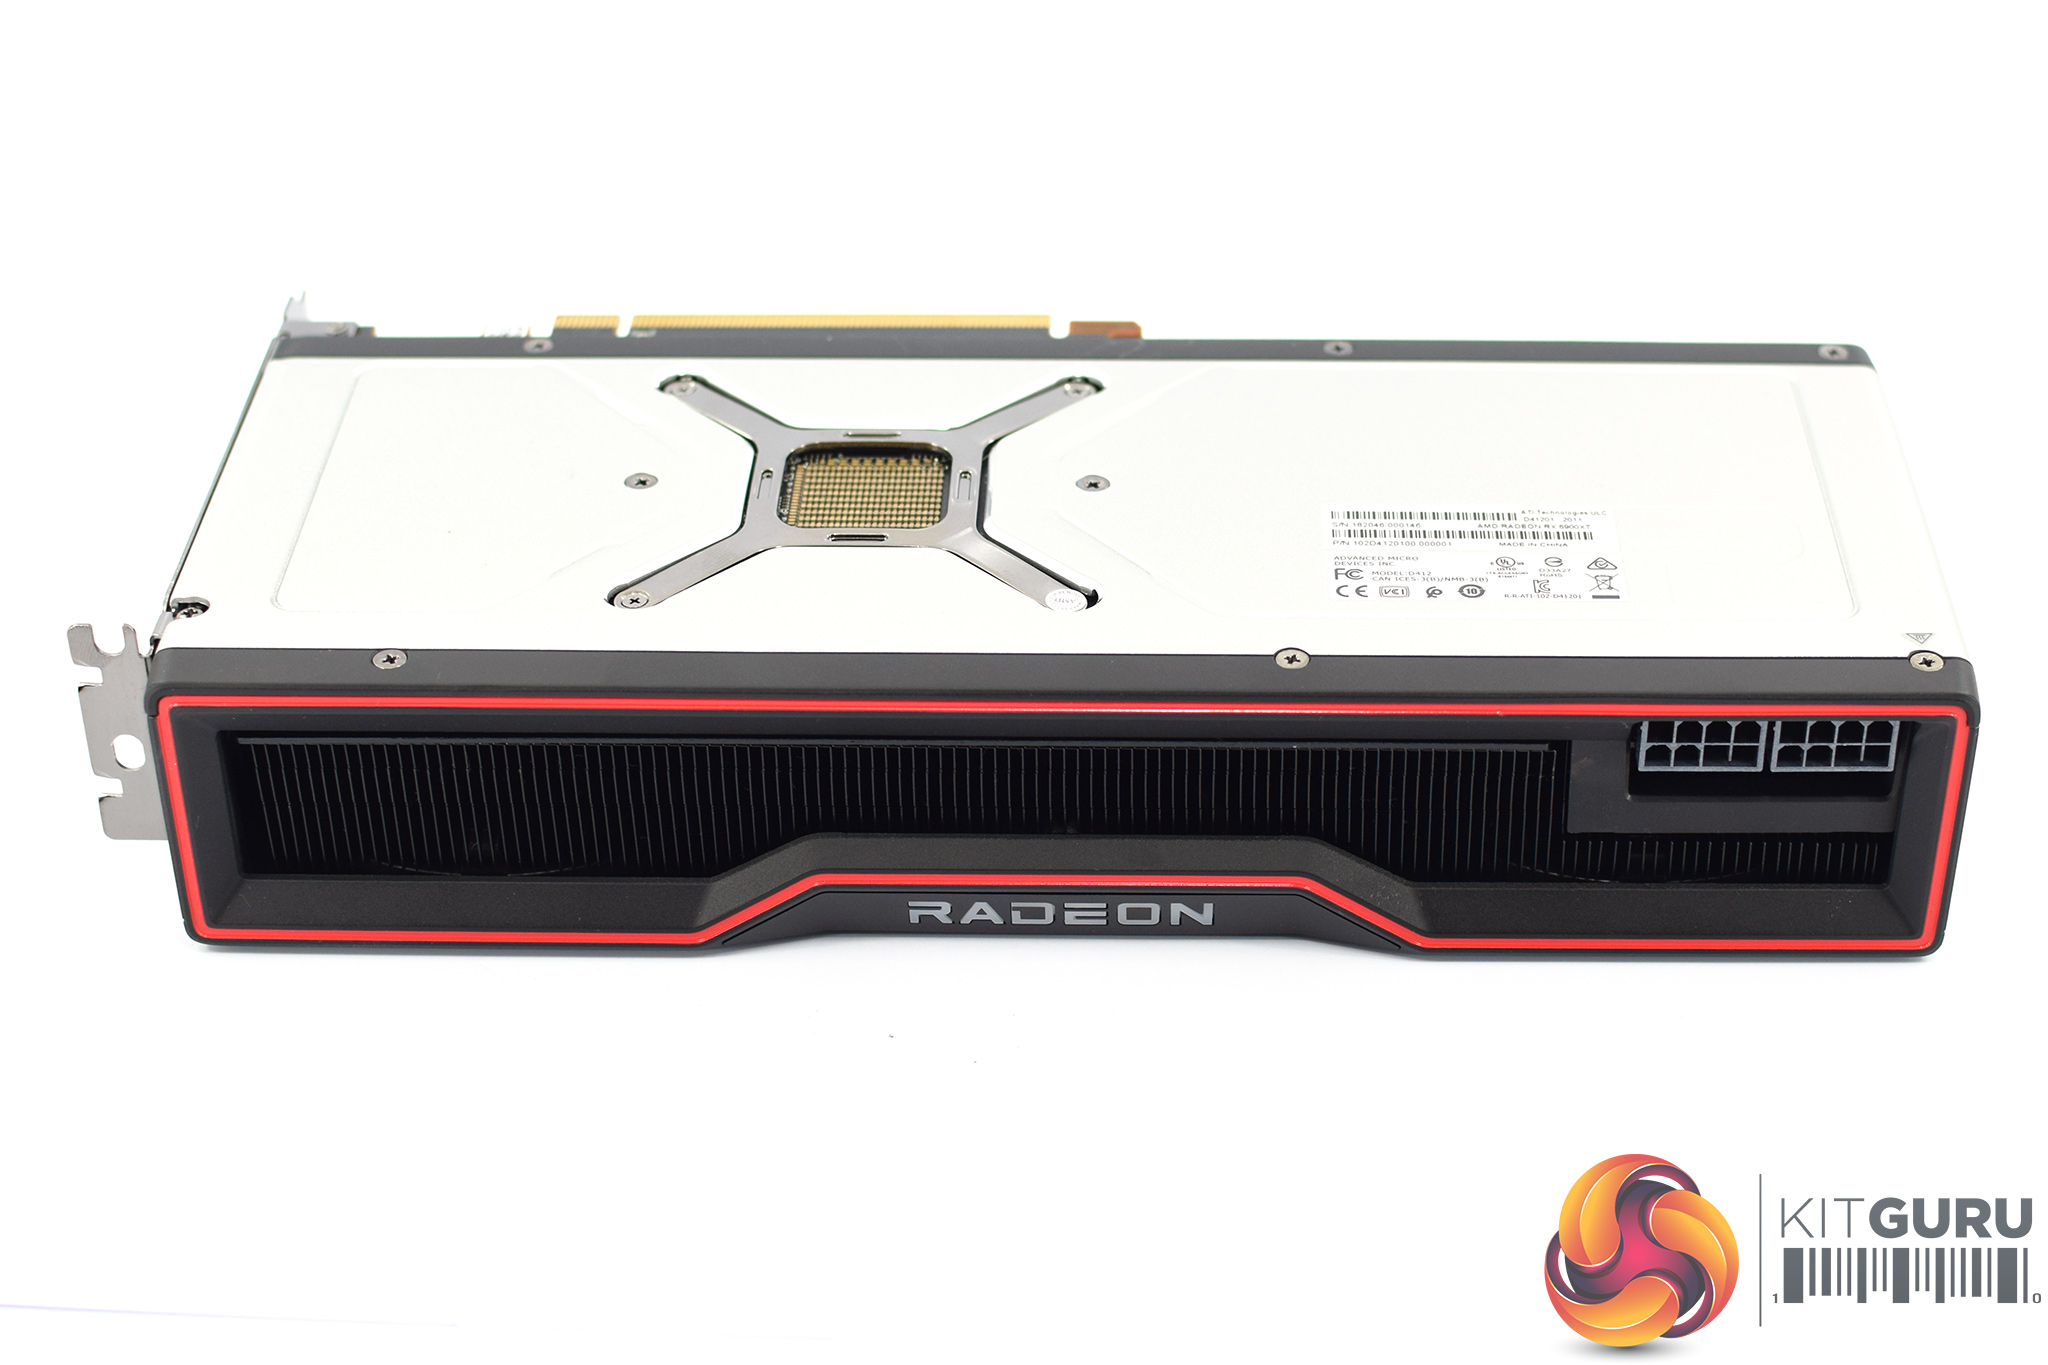
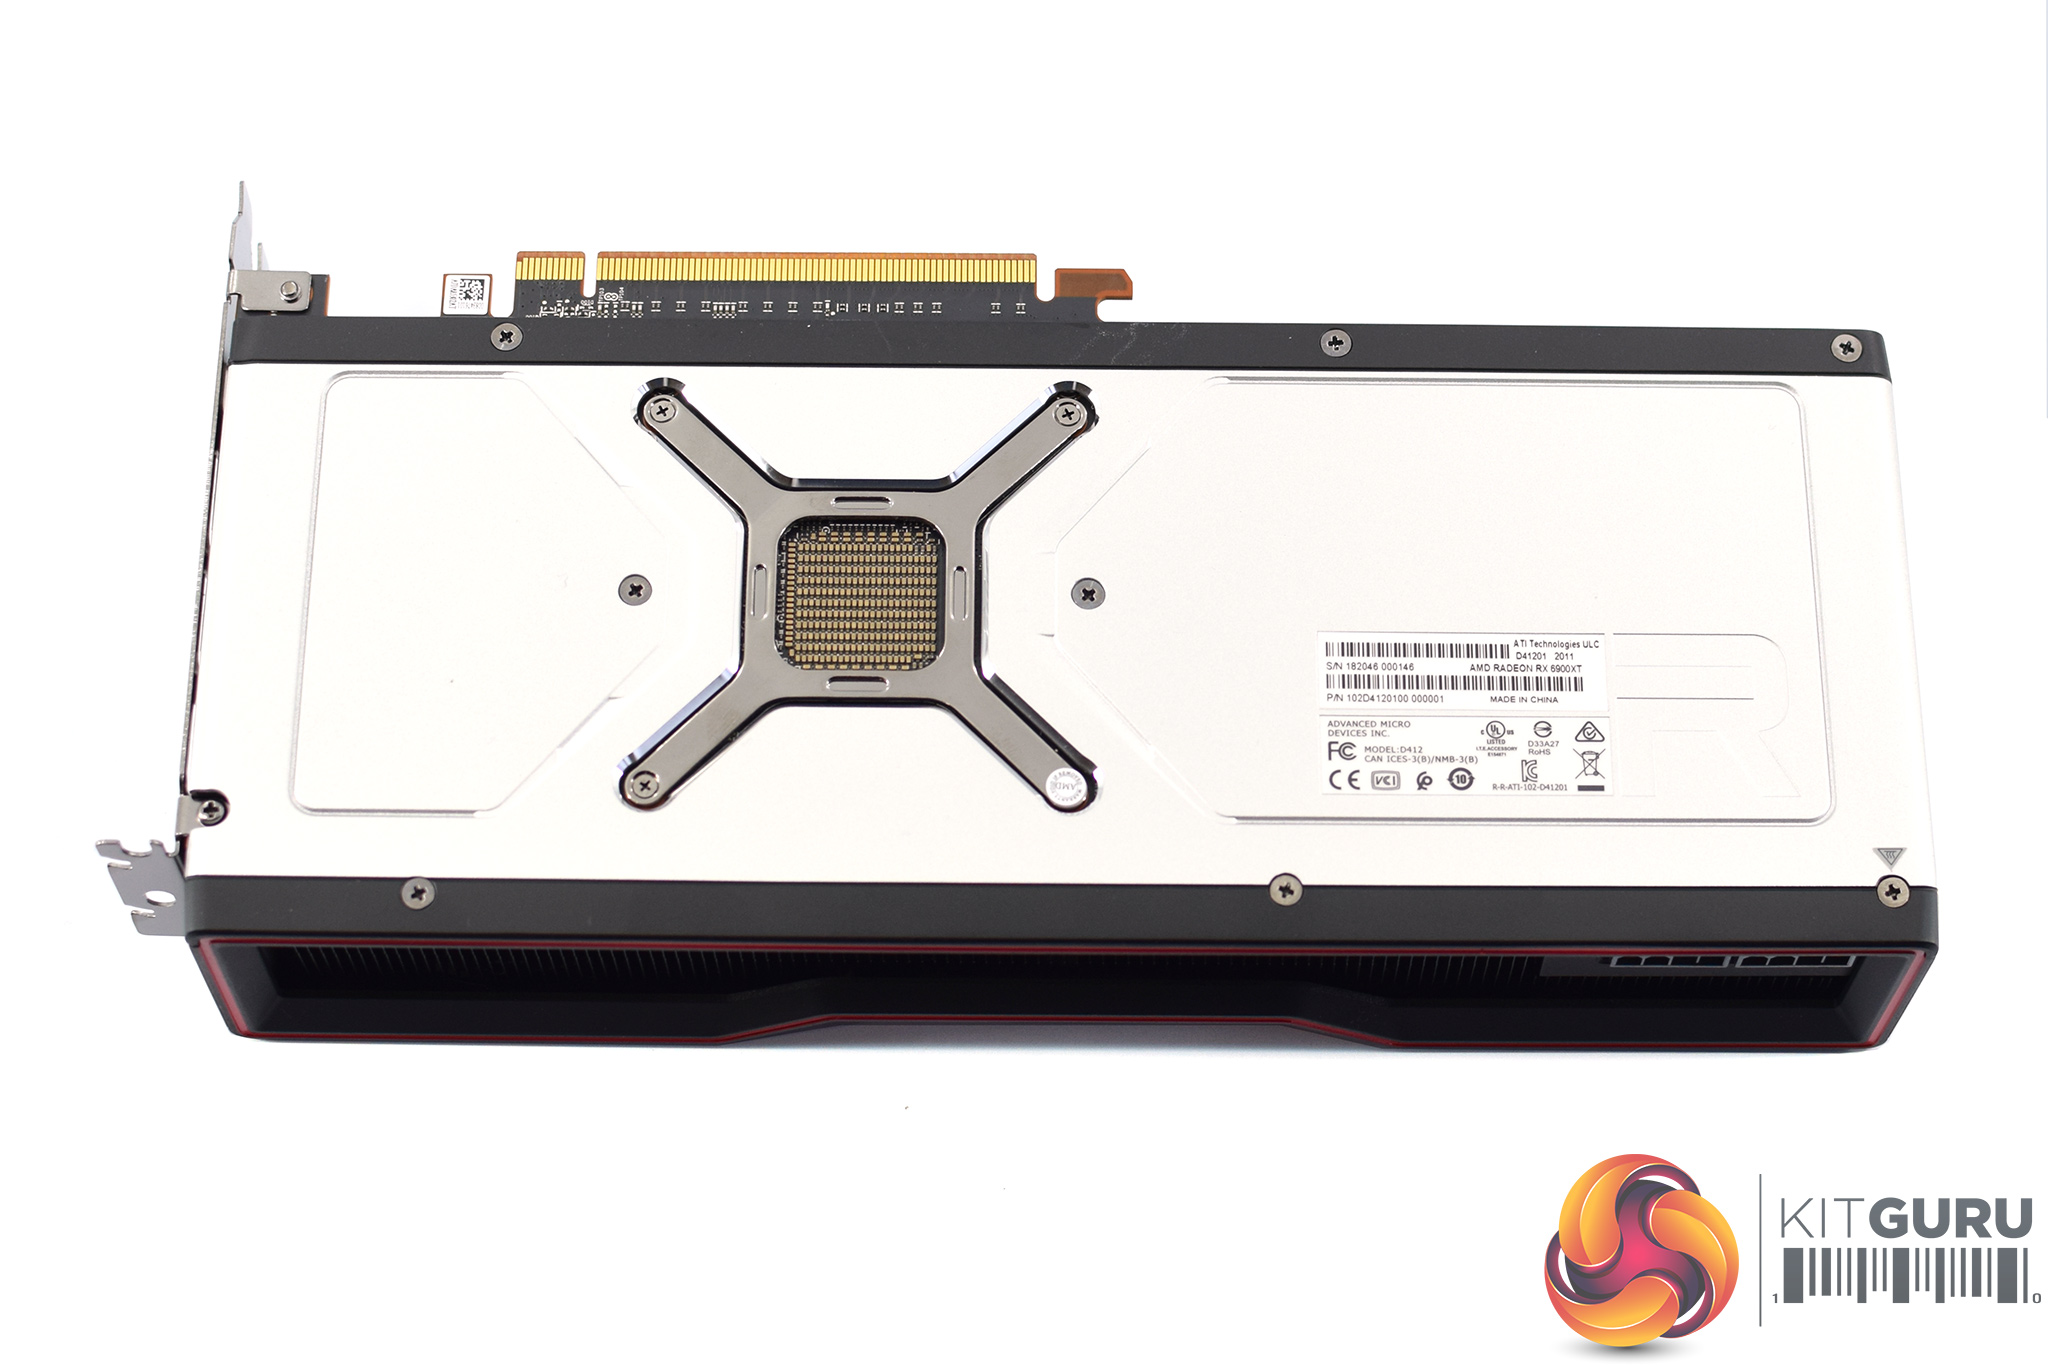
As for the backplate, this is almost entirely silver, and it stretches the length of the card. There’s a cut-out behind the GPU core, but other than that it is entirely solid.
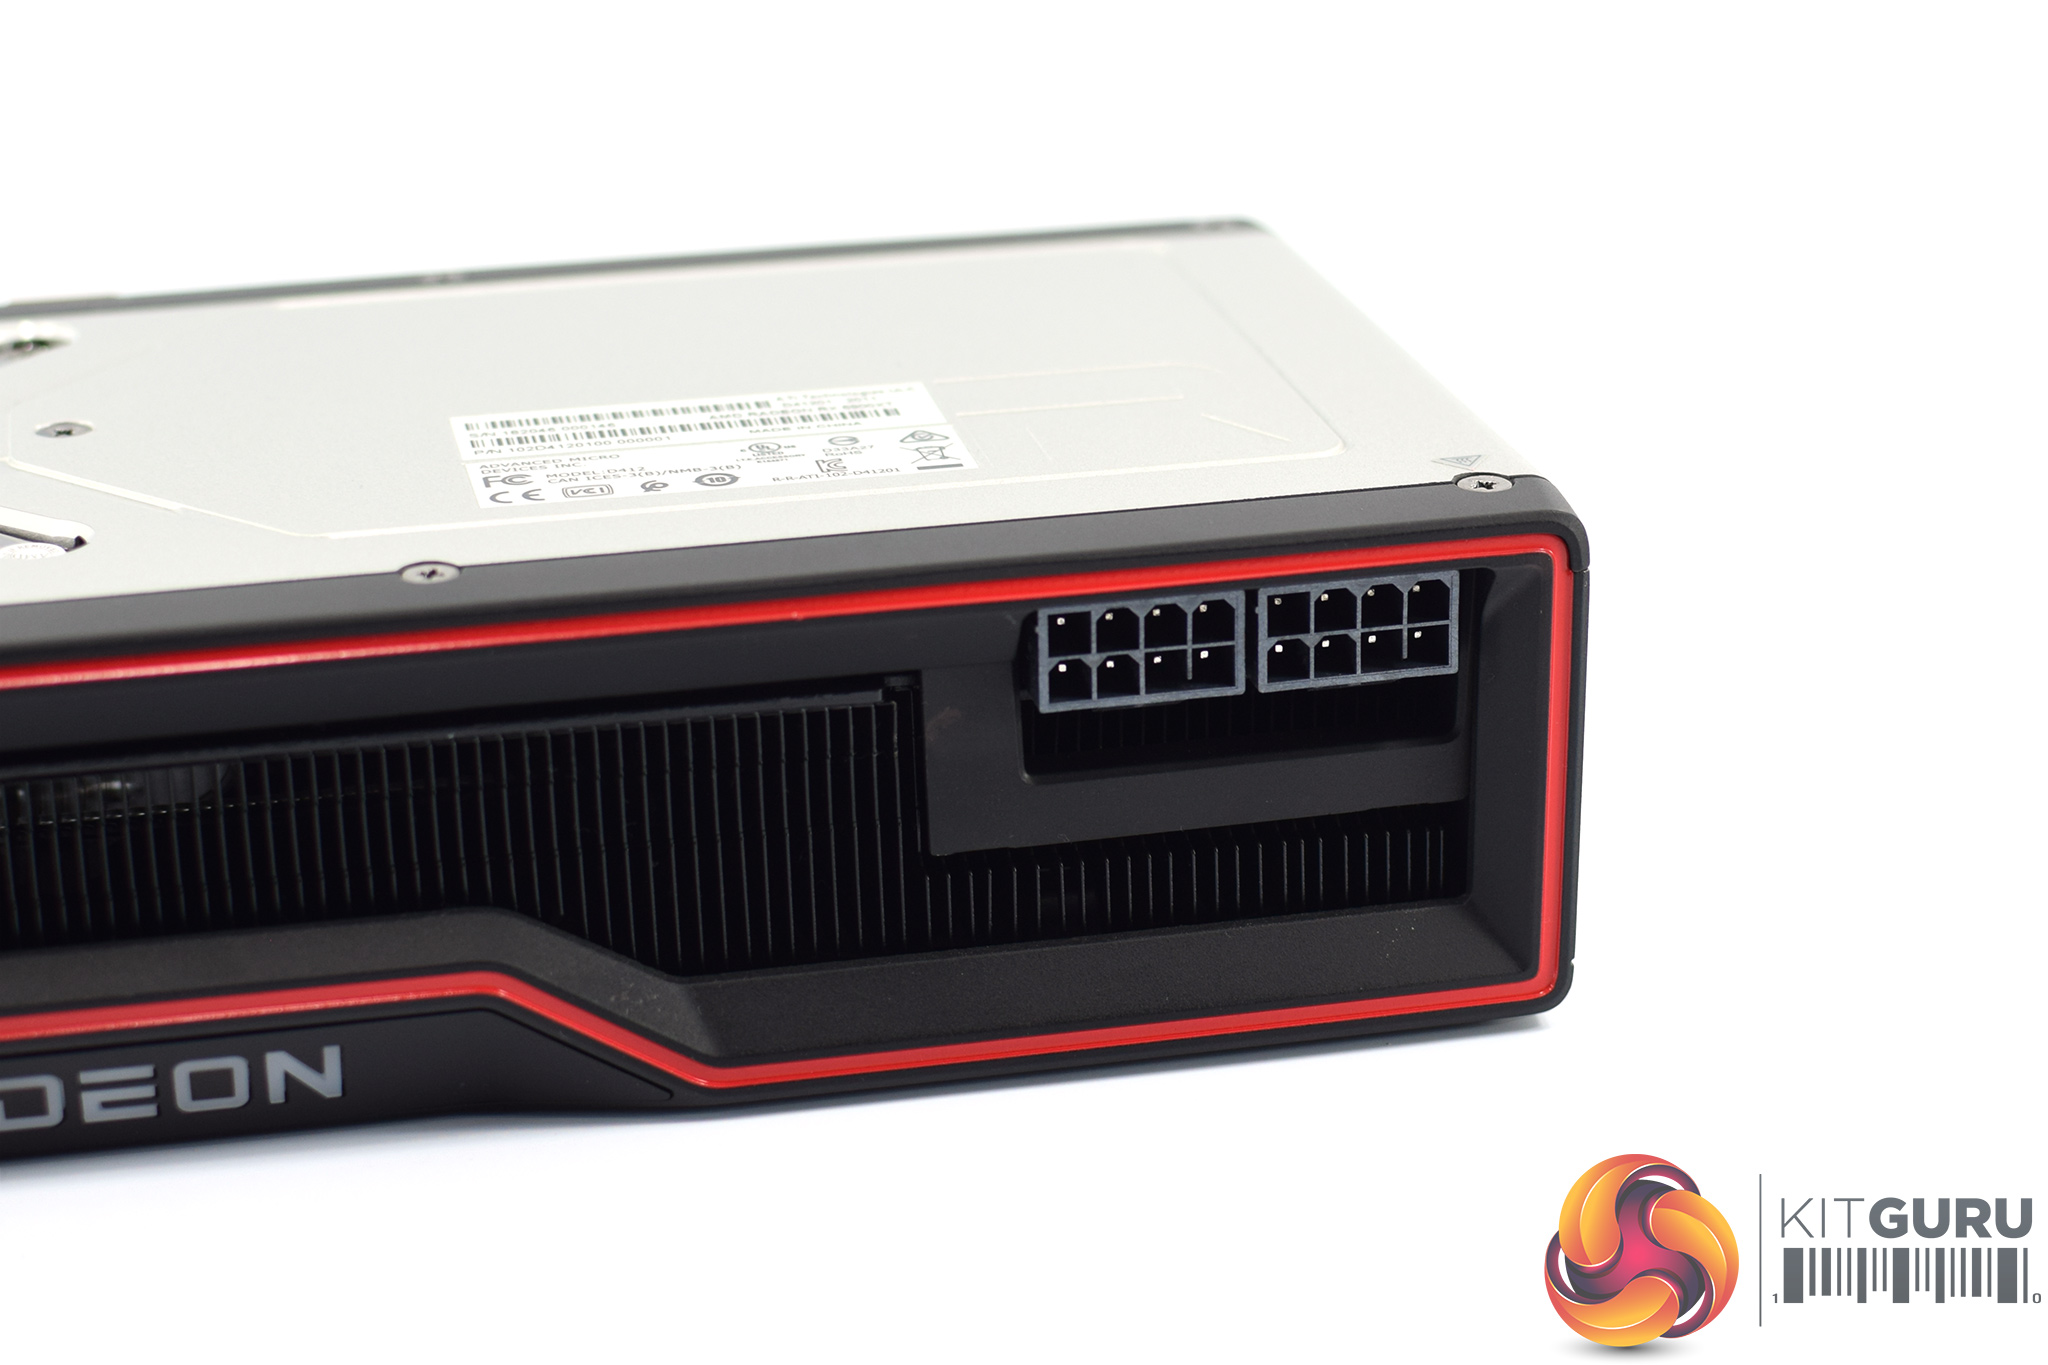
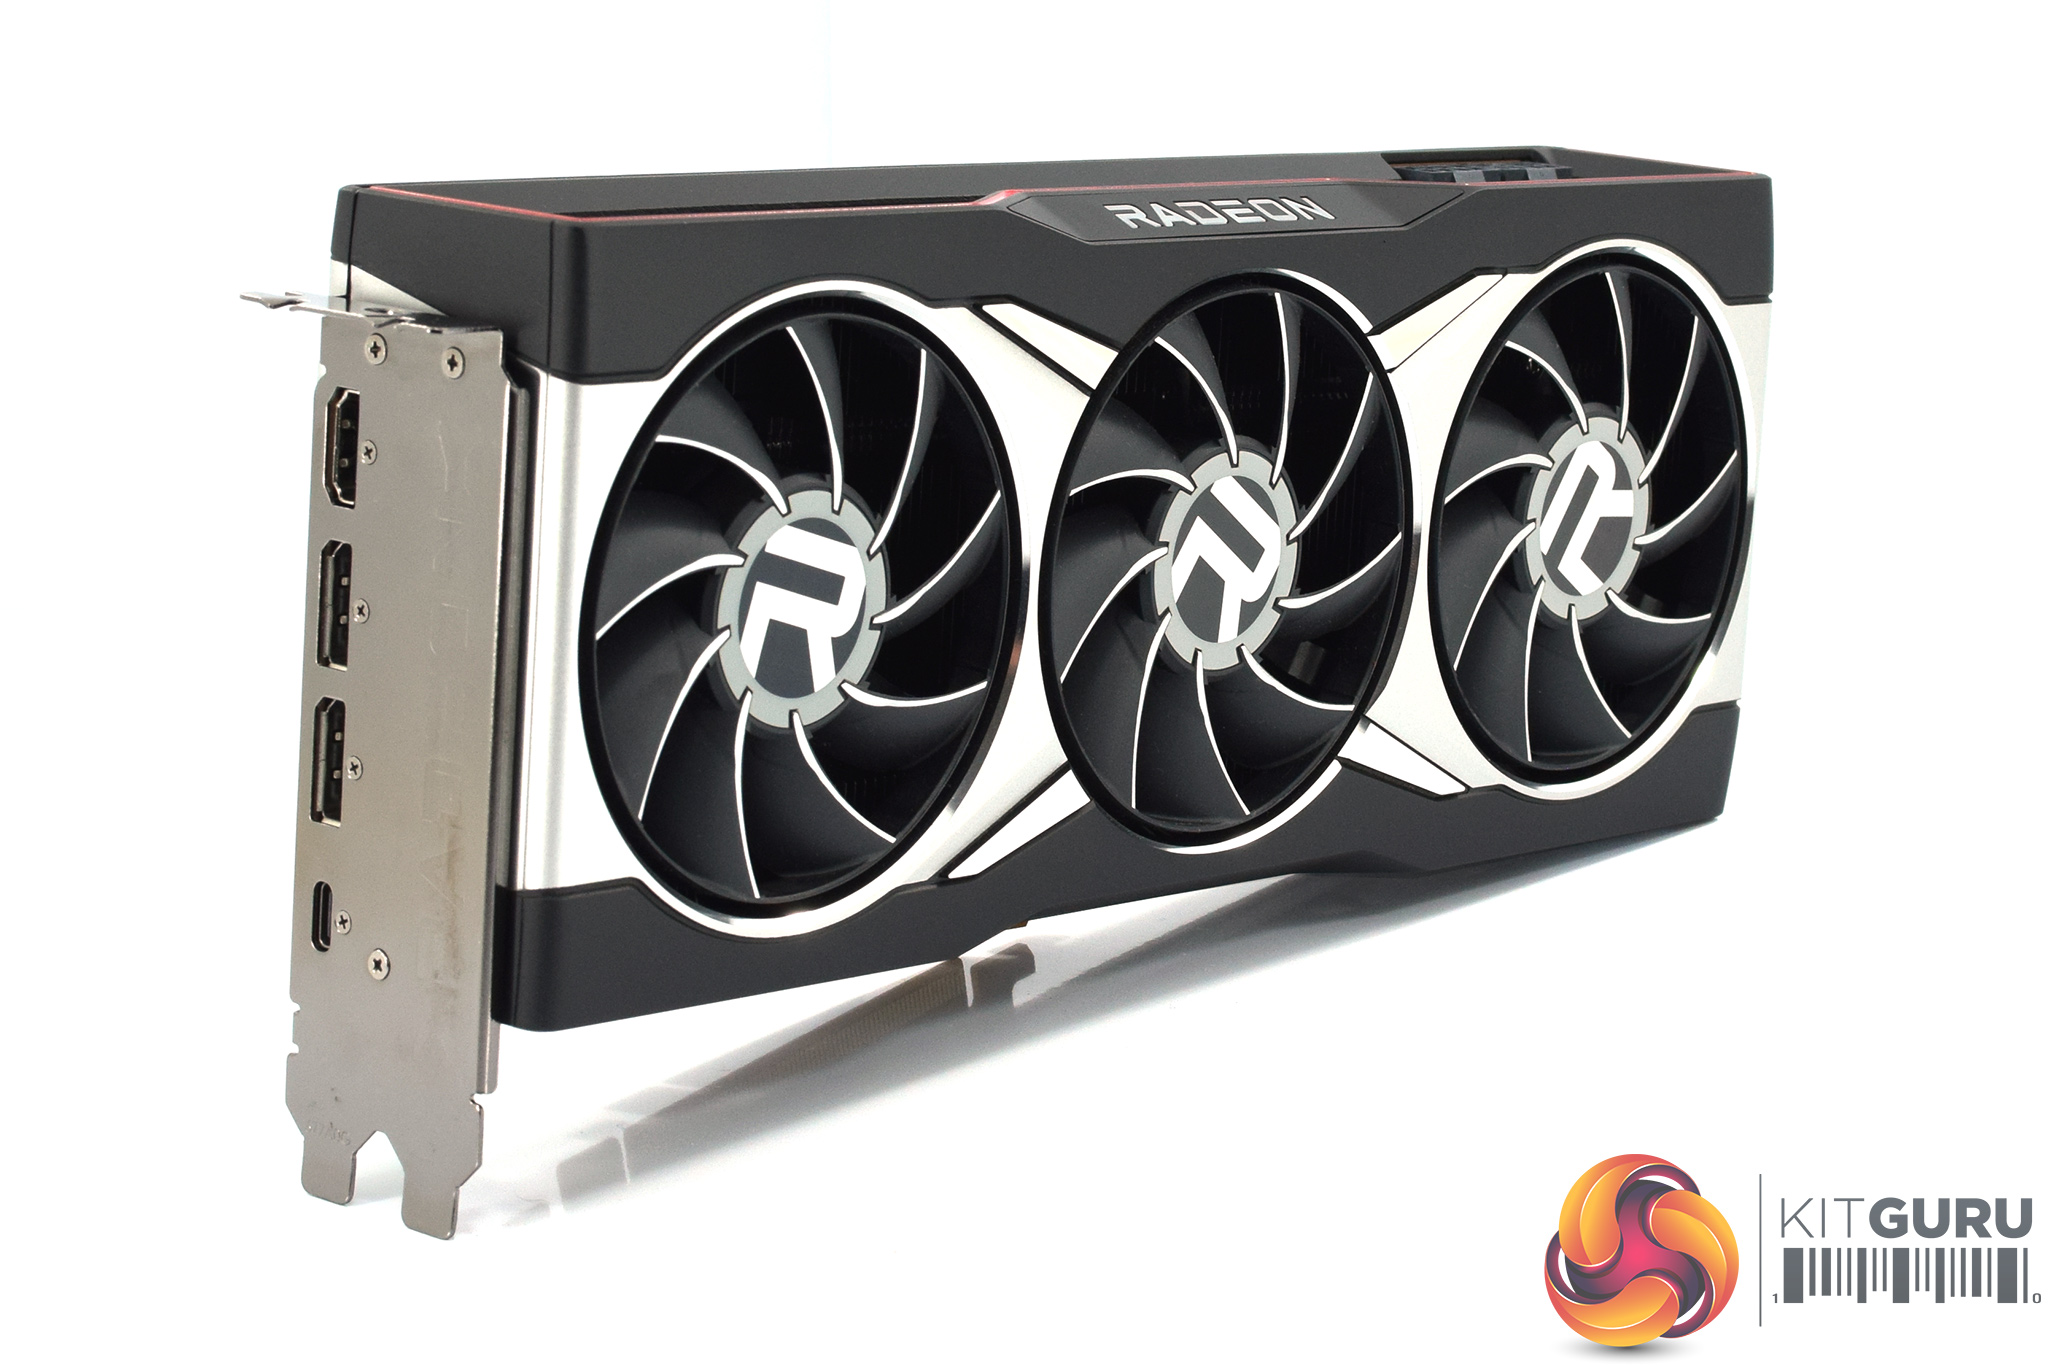
Just like the RX 6800 XT, power requirements consist of two 8-pin power connectors. AMD makes a point of referring to these as ‘industry standard’ connectors, in a thinly-veiled jibe at Nvidia’s new 12-pin connector.
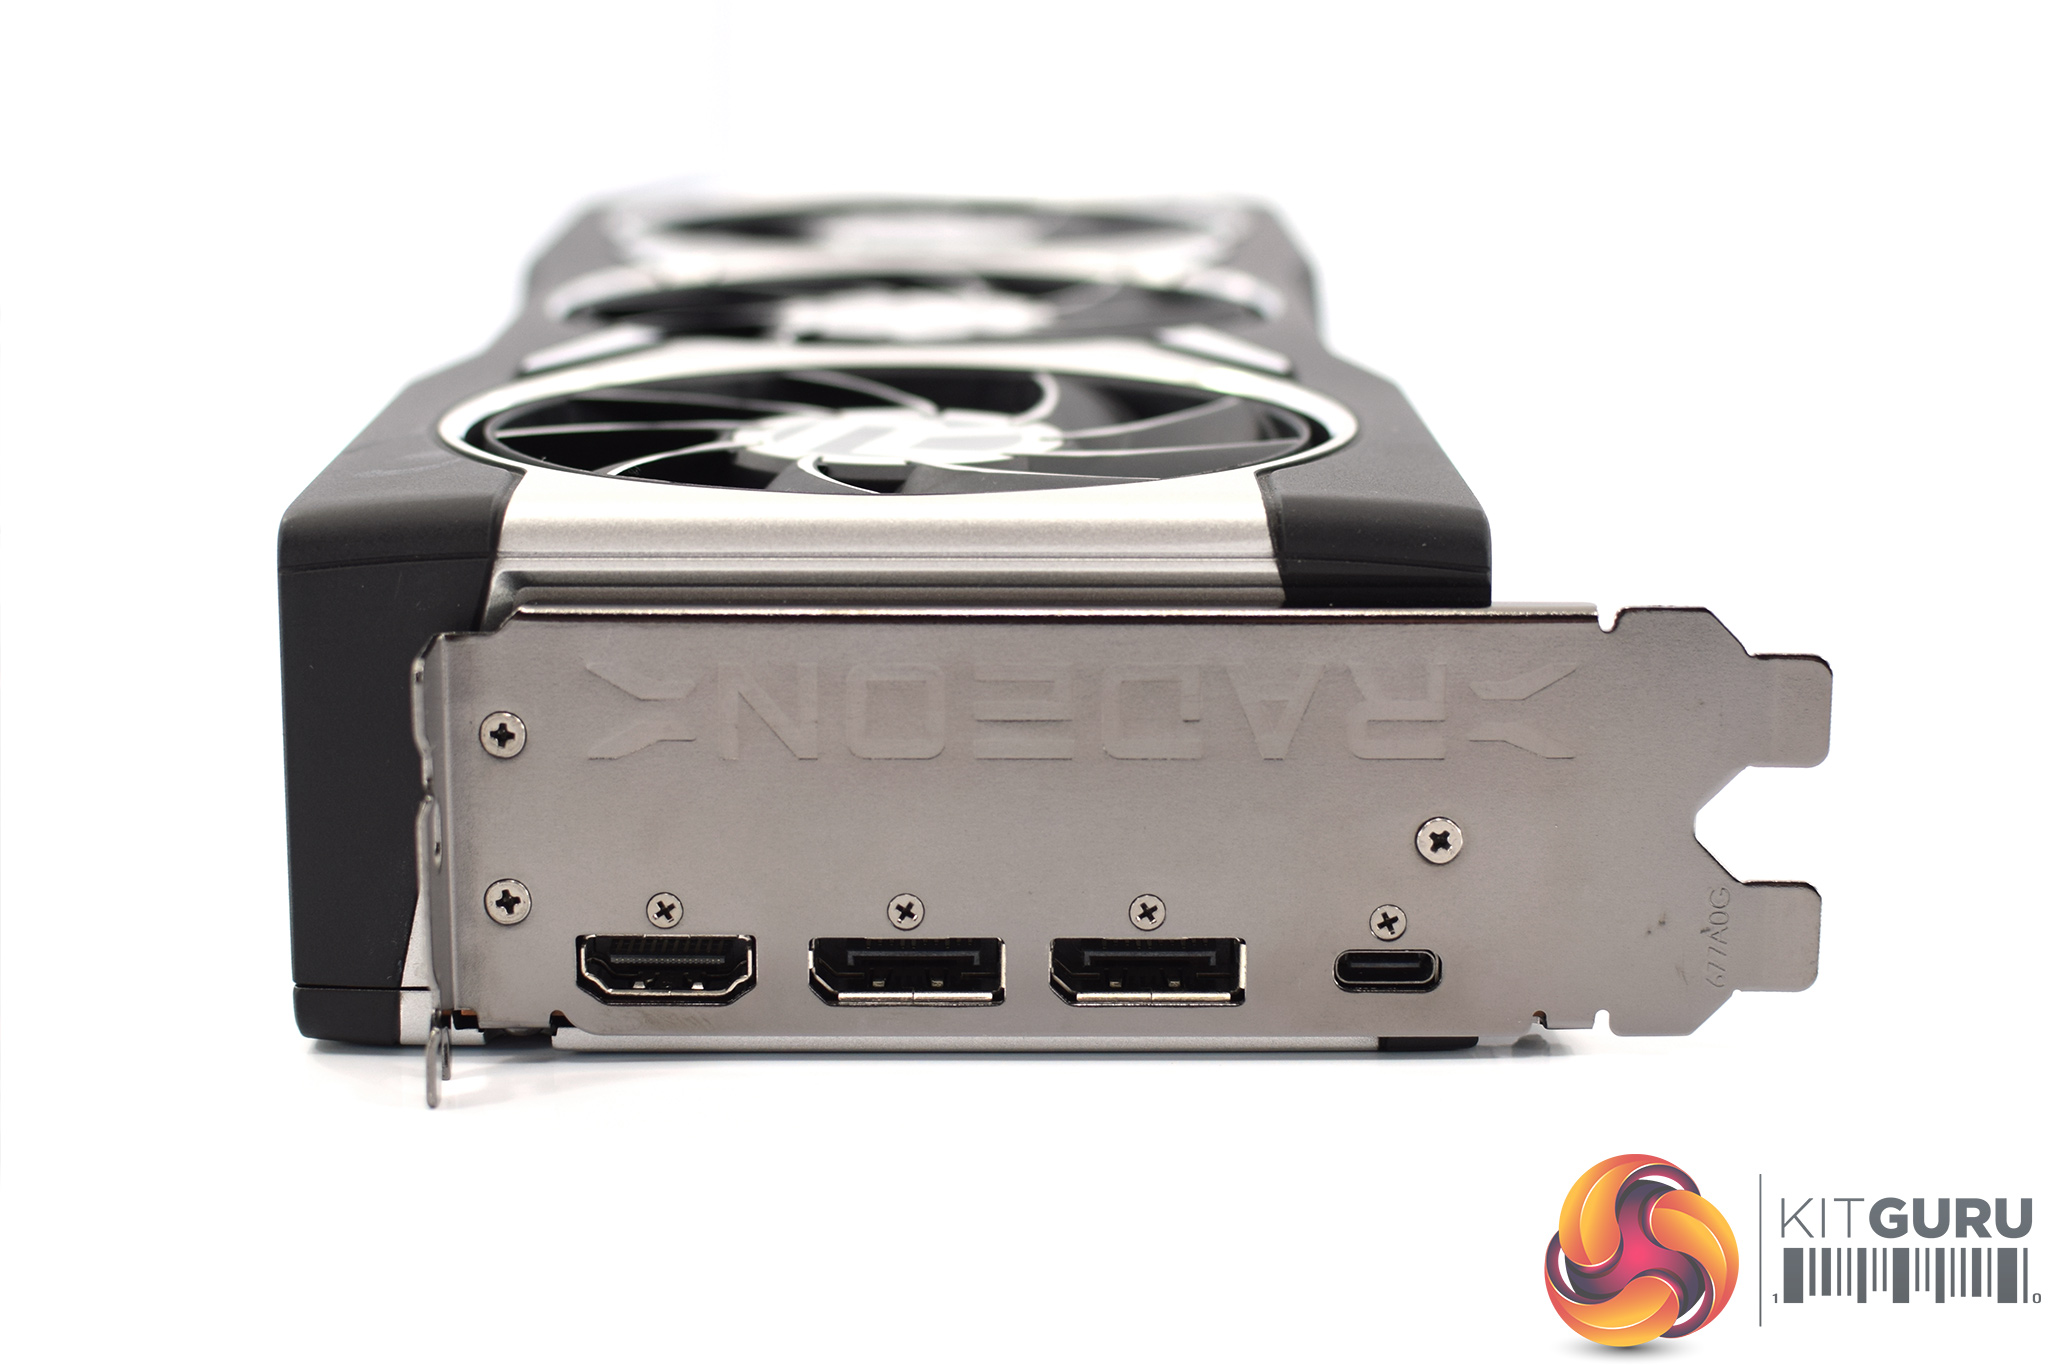
For display connectors, there’s 2x DisplayPort, 1x HDMI 2.1, and 1x USB-C.
Driver Notes
- All Nvidia GPUs (except RTX 3060 Ti) were benchmarked with the 457.09 driver.
- RTX 3060 Ti was benchmarked with the 457.40 driver supplied to press.
- All AMD GPUs (except RX 6000) were benchmarked with the Adrenalin 20.11.1 driver.
- RX 6800 and RX 6800 XT were benchmarked with the Adrenalin 20.45.12.1 driver supplied to press.
- RX 6900 XT was benchmarked with the Adrenalin 20.45.01.14 driver supplied to press.
Test System
We test using the a custom built system from PCSpecialist, based on Intel's latest Comet Lake-S platform. You can read more about it over HERE, and configure your own system from PCSpecialist HERE.
| CPU |
Intel Core i9-10900K
Overclocked to 5.1GHz on all cores |
| Motherboard |
ASUS ROG Maximus XII Hero Wi-Fi
|
| Memory |
Corsair Vengeance DDR4 3600MHz (4 X 8GB)
CL 18-22-22-42
|
| Graphics Card |
Varies
|
| System Drive |
500GB Samsung 970 Evo Plus M.2
|
| Games Drive | 2TB Samsung 860 QVO 2.5″ SSD |
| Chassis | Fractal Meshify S2 Blackout Tempered Glass |
| CPU Cooler |
Corsair H115i RGB Platinum Hydro Series
|
| Power Supply |
Corsair 1200W HX Series Modular 80 Plus Platinum
|
| Operating System |
Windows 10 2004
|
Comparison Graphics Cards List
- Gigabyte RTX 3090 Eagle OC
- Nvidia RTX 3080 FE 10GB
- Nvidia RTX 3070 FE 8GB
- Nvidia RTX 3060 Ti FE 8GB
- Nvidia RTX 2080 Ti FE 11GB
- Nvidia RTX 2080 Super FE 8GB
- Nvidia RTX 2080 FE 8GB
- Nvidia RTX 2070 Super FE 8GB
- Nvidia RTX 2060 Super FE 8GB
- AMD Radeon VII 16GB
- AMD RX 5700 XT 8GB
- AMD RX Vega 64 8GB
Software and Games List
- 3DMark Fire Strike & Fire Strike Ultra (DX11 Synthetic)
- 3DMark Time Spy (DX12 Synthetic)
- 3DMark Raytracing Feature Test (DXR Synthetic)
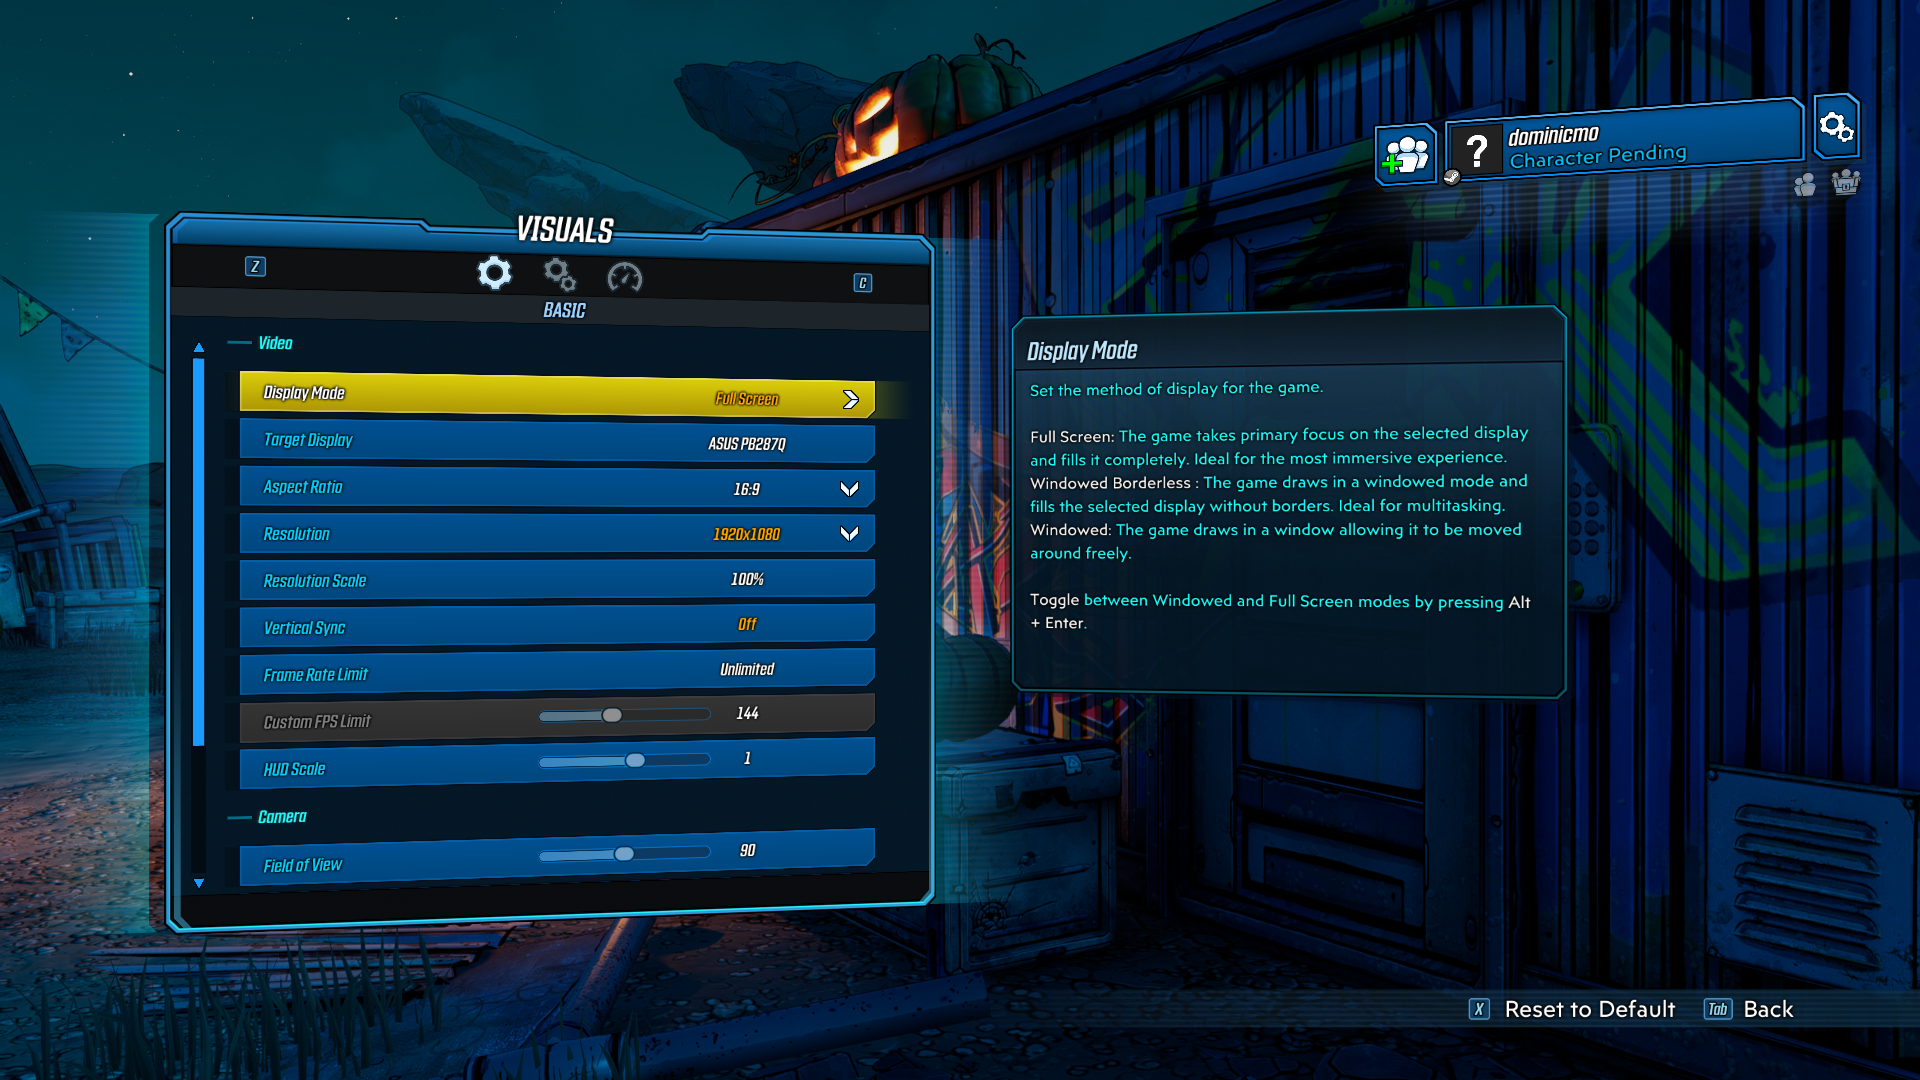
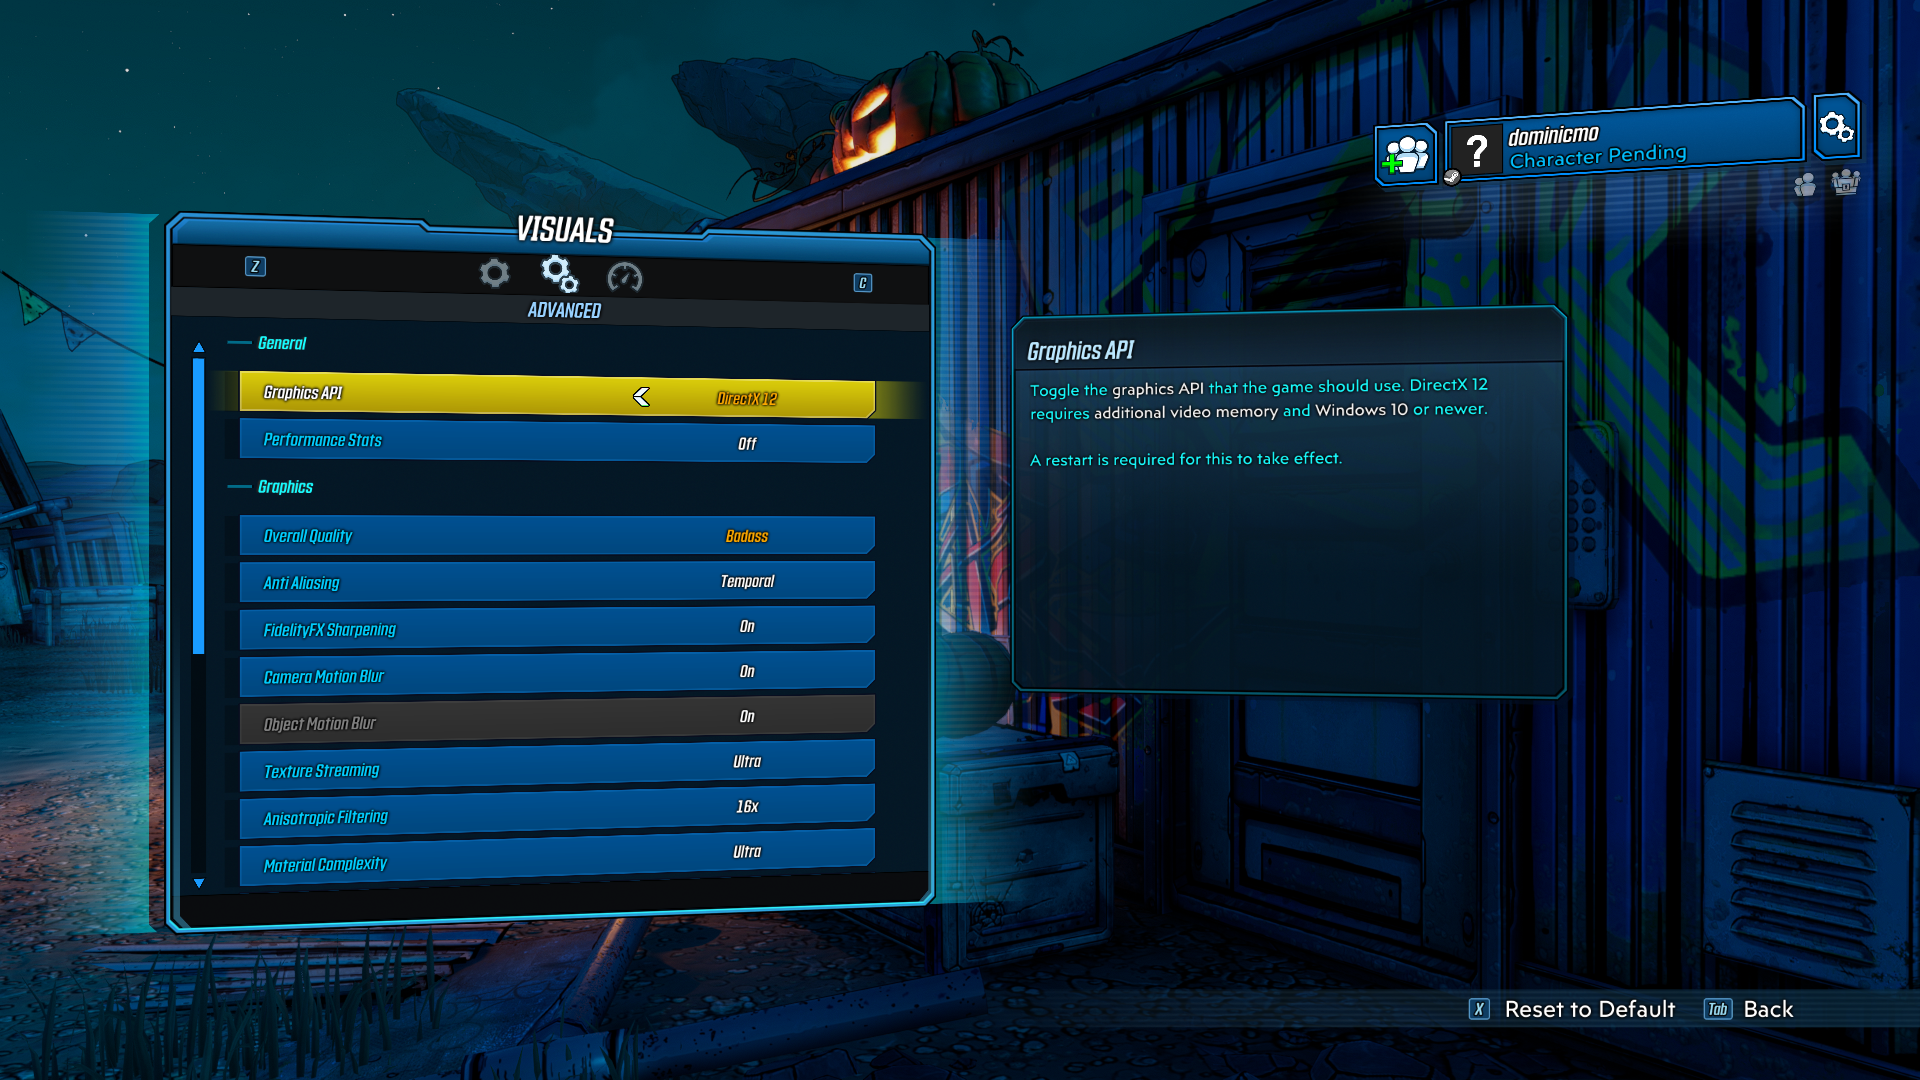
- Borderlands 3 (DX12)
- Control (DX12)
- Death Stranding (DX12)
- The Division 2 (DX12)
- F1 2020 (DX12)
- Far Cry New Dawn (DX11)
- Gears 5 (DX12)
- Ghost Recon: Breakpoint (Vulkan)
- Metro: Exodus (DX12)
- Middle Earth: Shadow of War (DX11)
- Red Dead Redemption 2 (Vulkan)
- Shadow of the Tomb Raider (DX12)
- Total War Saga: Troy (DX11)
- Watch Dogs: Legion (DX12)
We run each benchmark/game three times, and present mean averages in our graphs. We use OCAT to measure average frame rates as well as 1% low values across our three runs.
Fire Strike is a showcase DirectX 11 benchmark for modern gaming PCs. Its ambitious real-time graphics are rendered with detail and complexity far beyond other DirectX 11 benchmarks and games. Fire Strike includes two graphics tests, a physics test and a combined test that stresses the CPU and GPU. (UL).
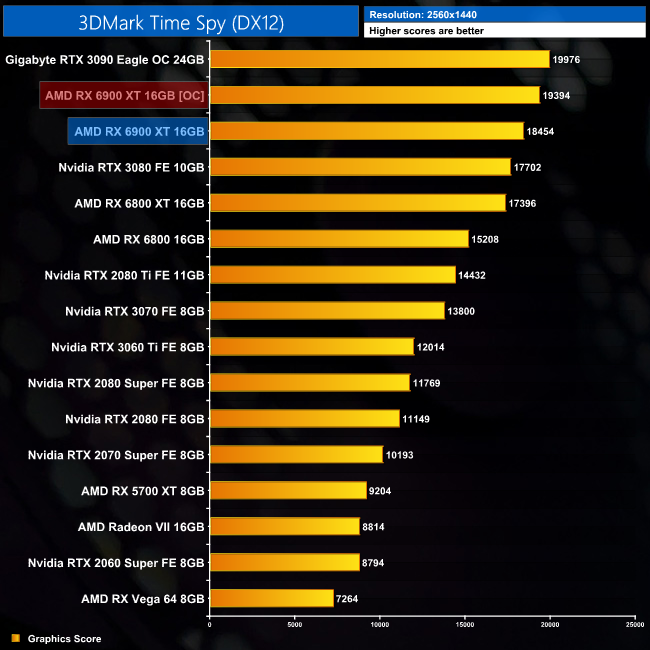
3DMark Time Spy is a DirectX 12 benchmark test for Windows 10 gaming PCs. Time Spy is one of the first DirectX 12 apps to be built the right way from the ground up to fully realize the performance gains that the new API offers. With its pure DirectX 12 engine, which supports new API features like asynchronous compute, explicit multi-adapter, and multi-threading, Time Spy is the ideal test for benchmarking the latest graphics cards. (UL).
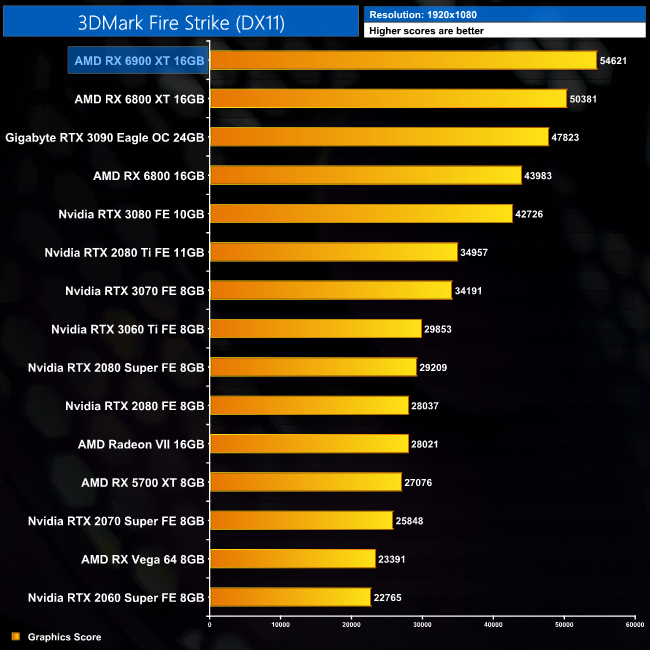
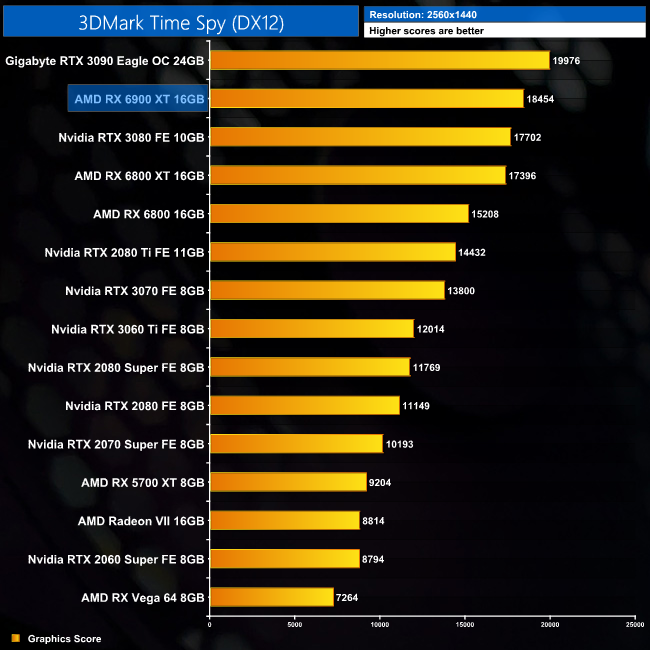
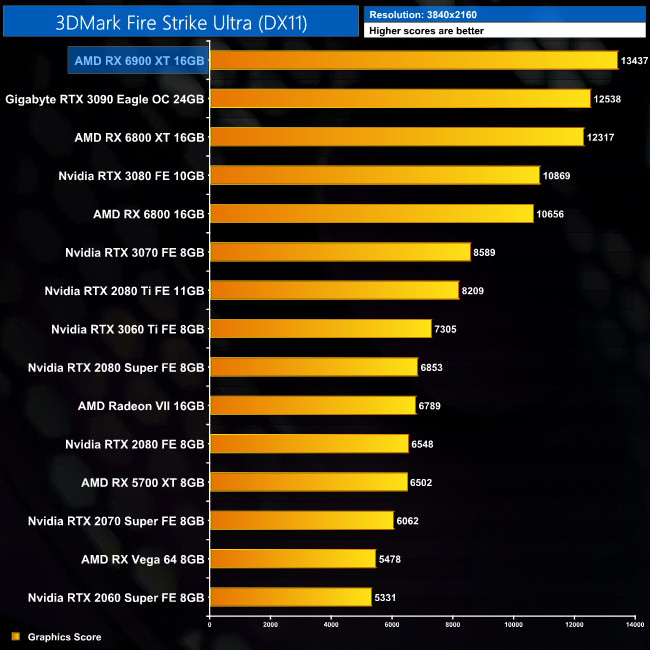
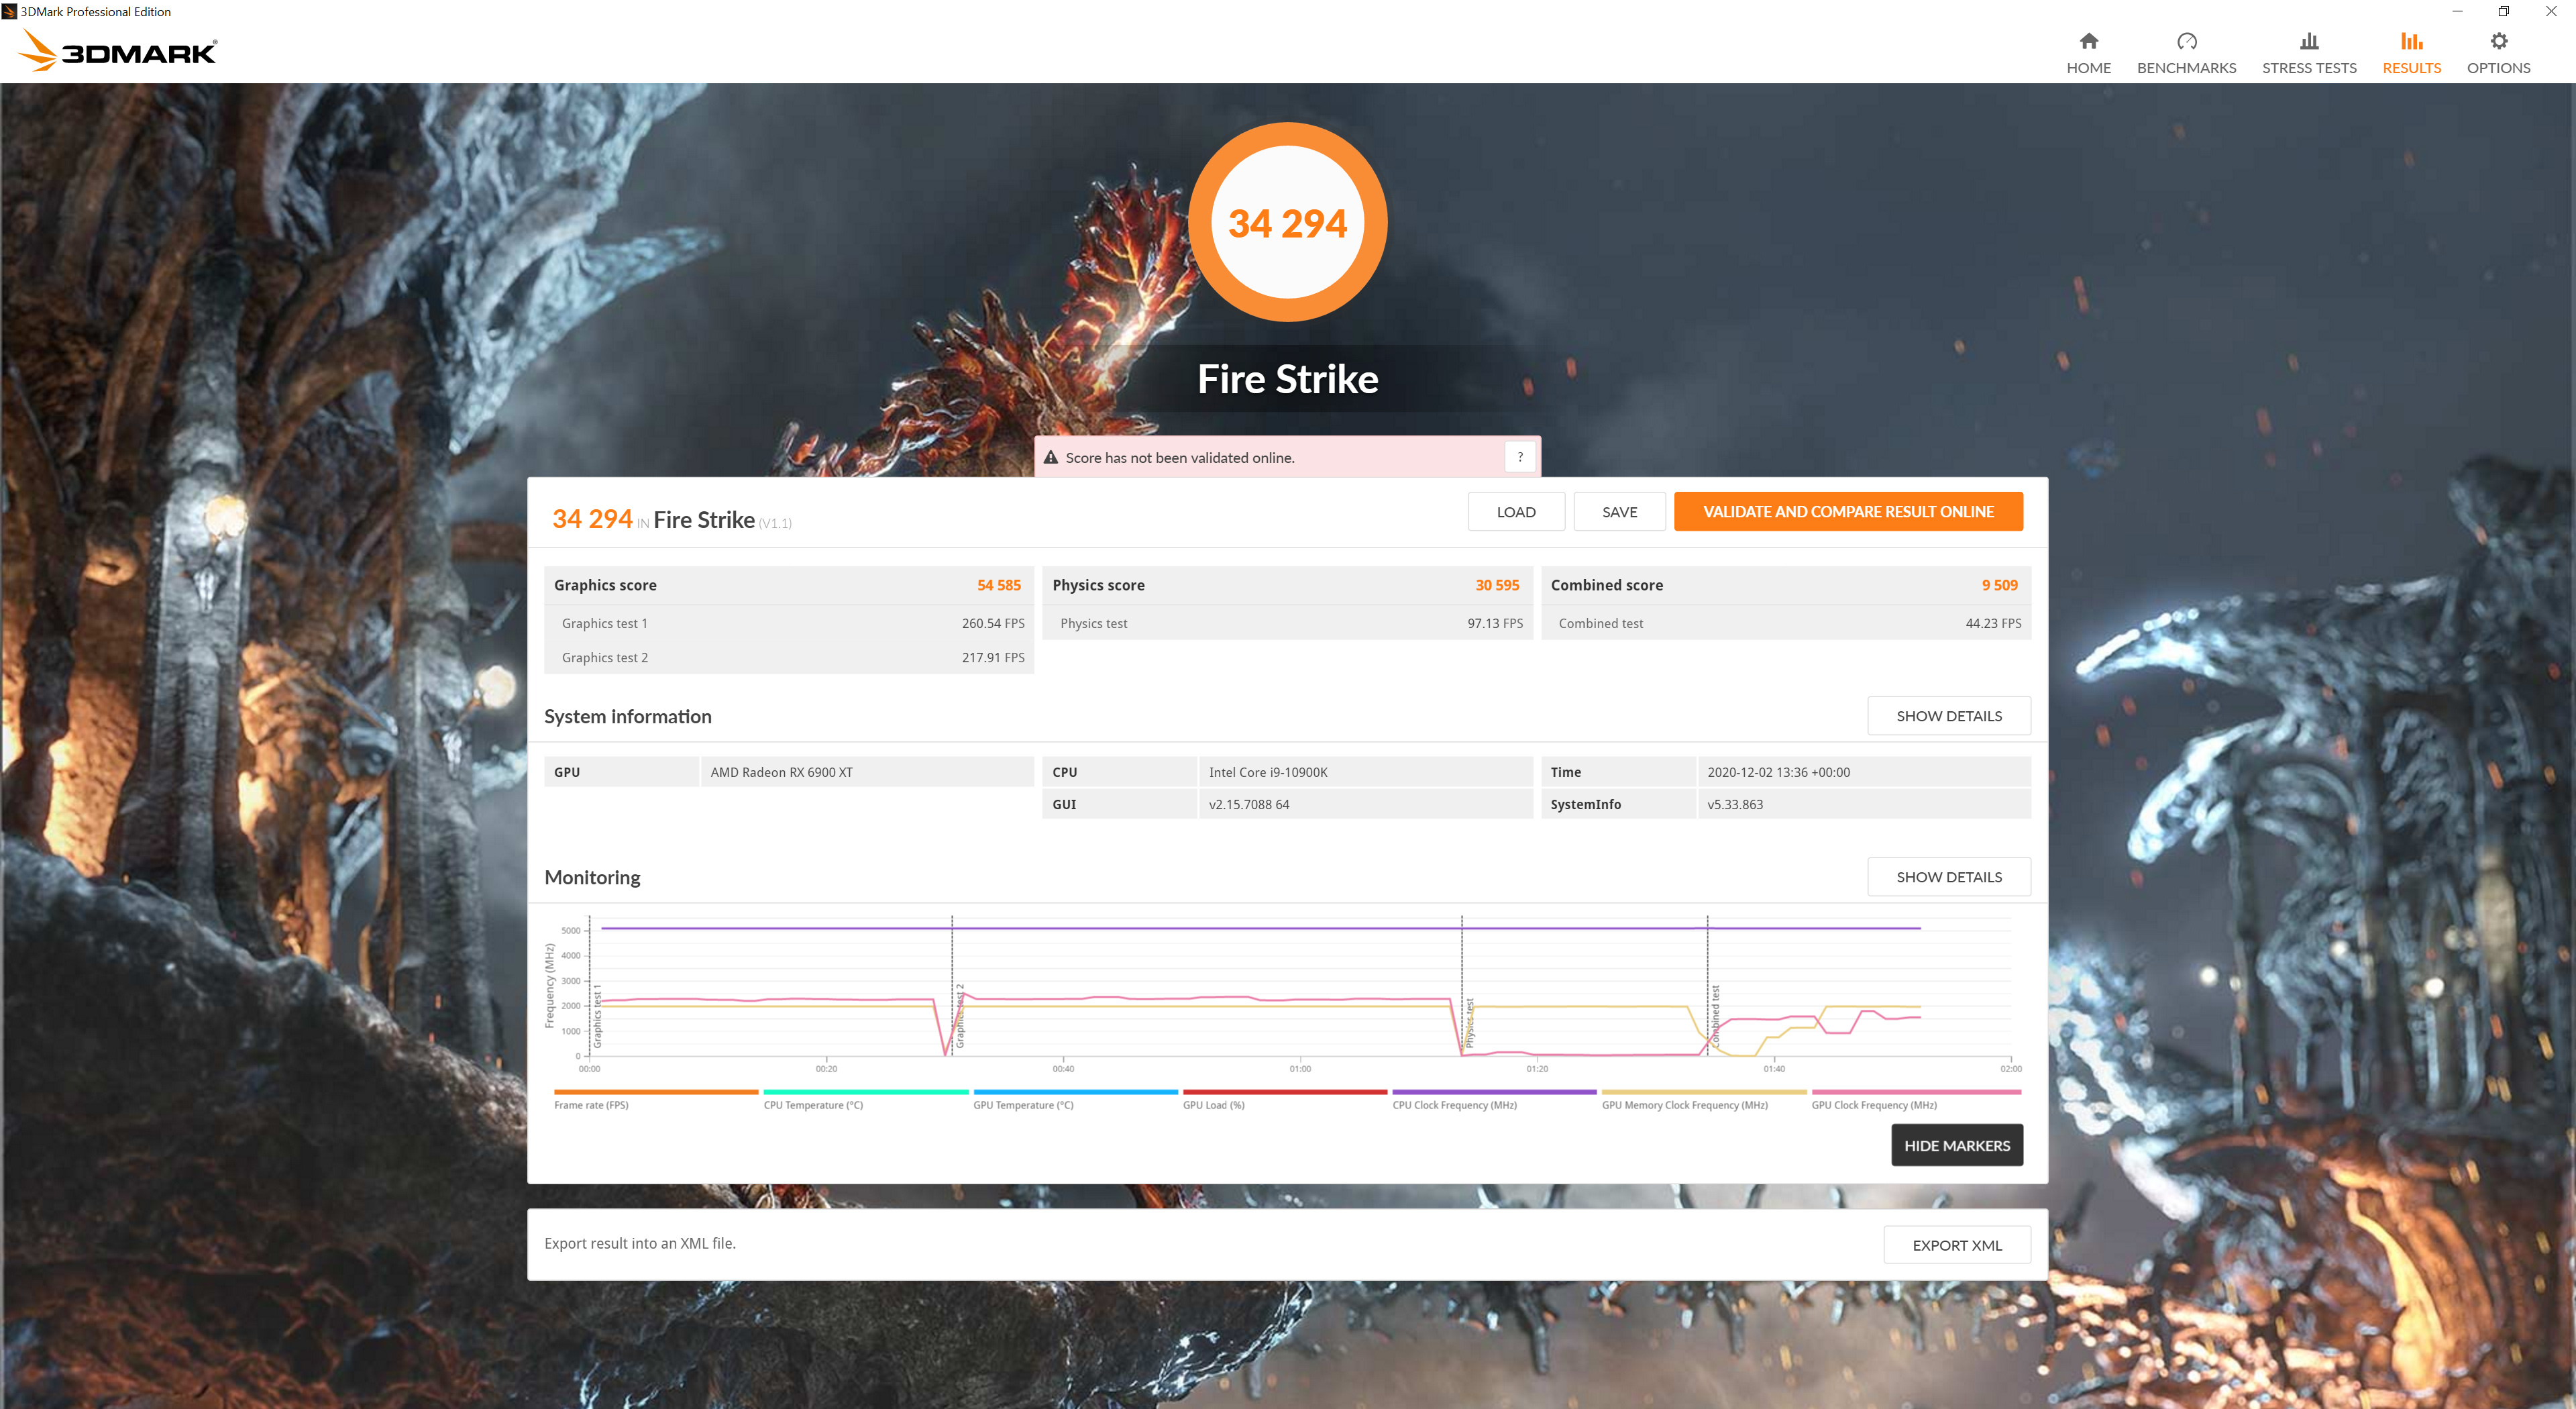
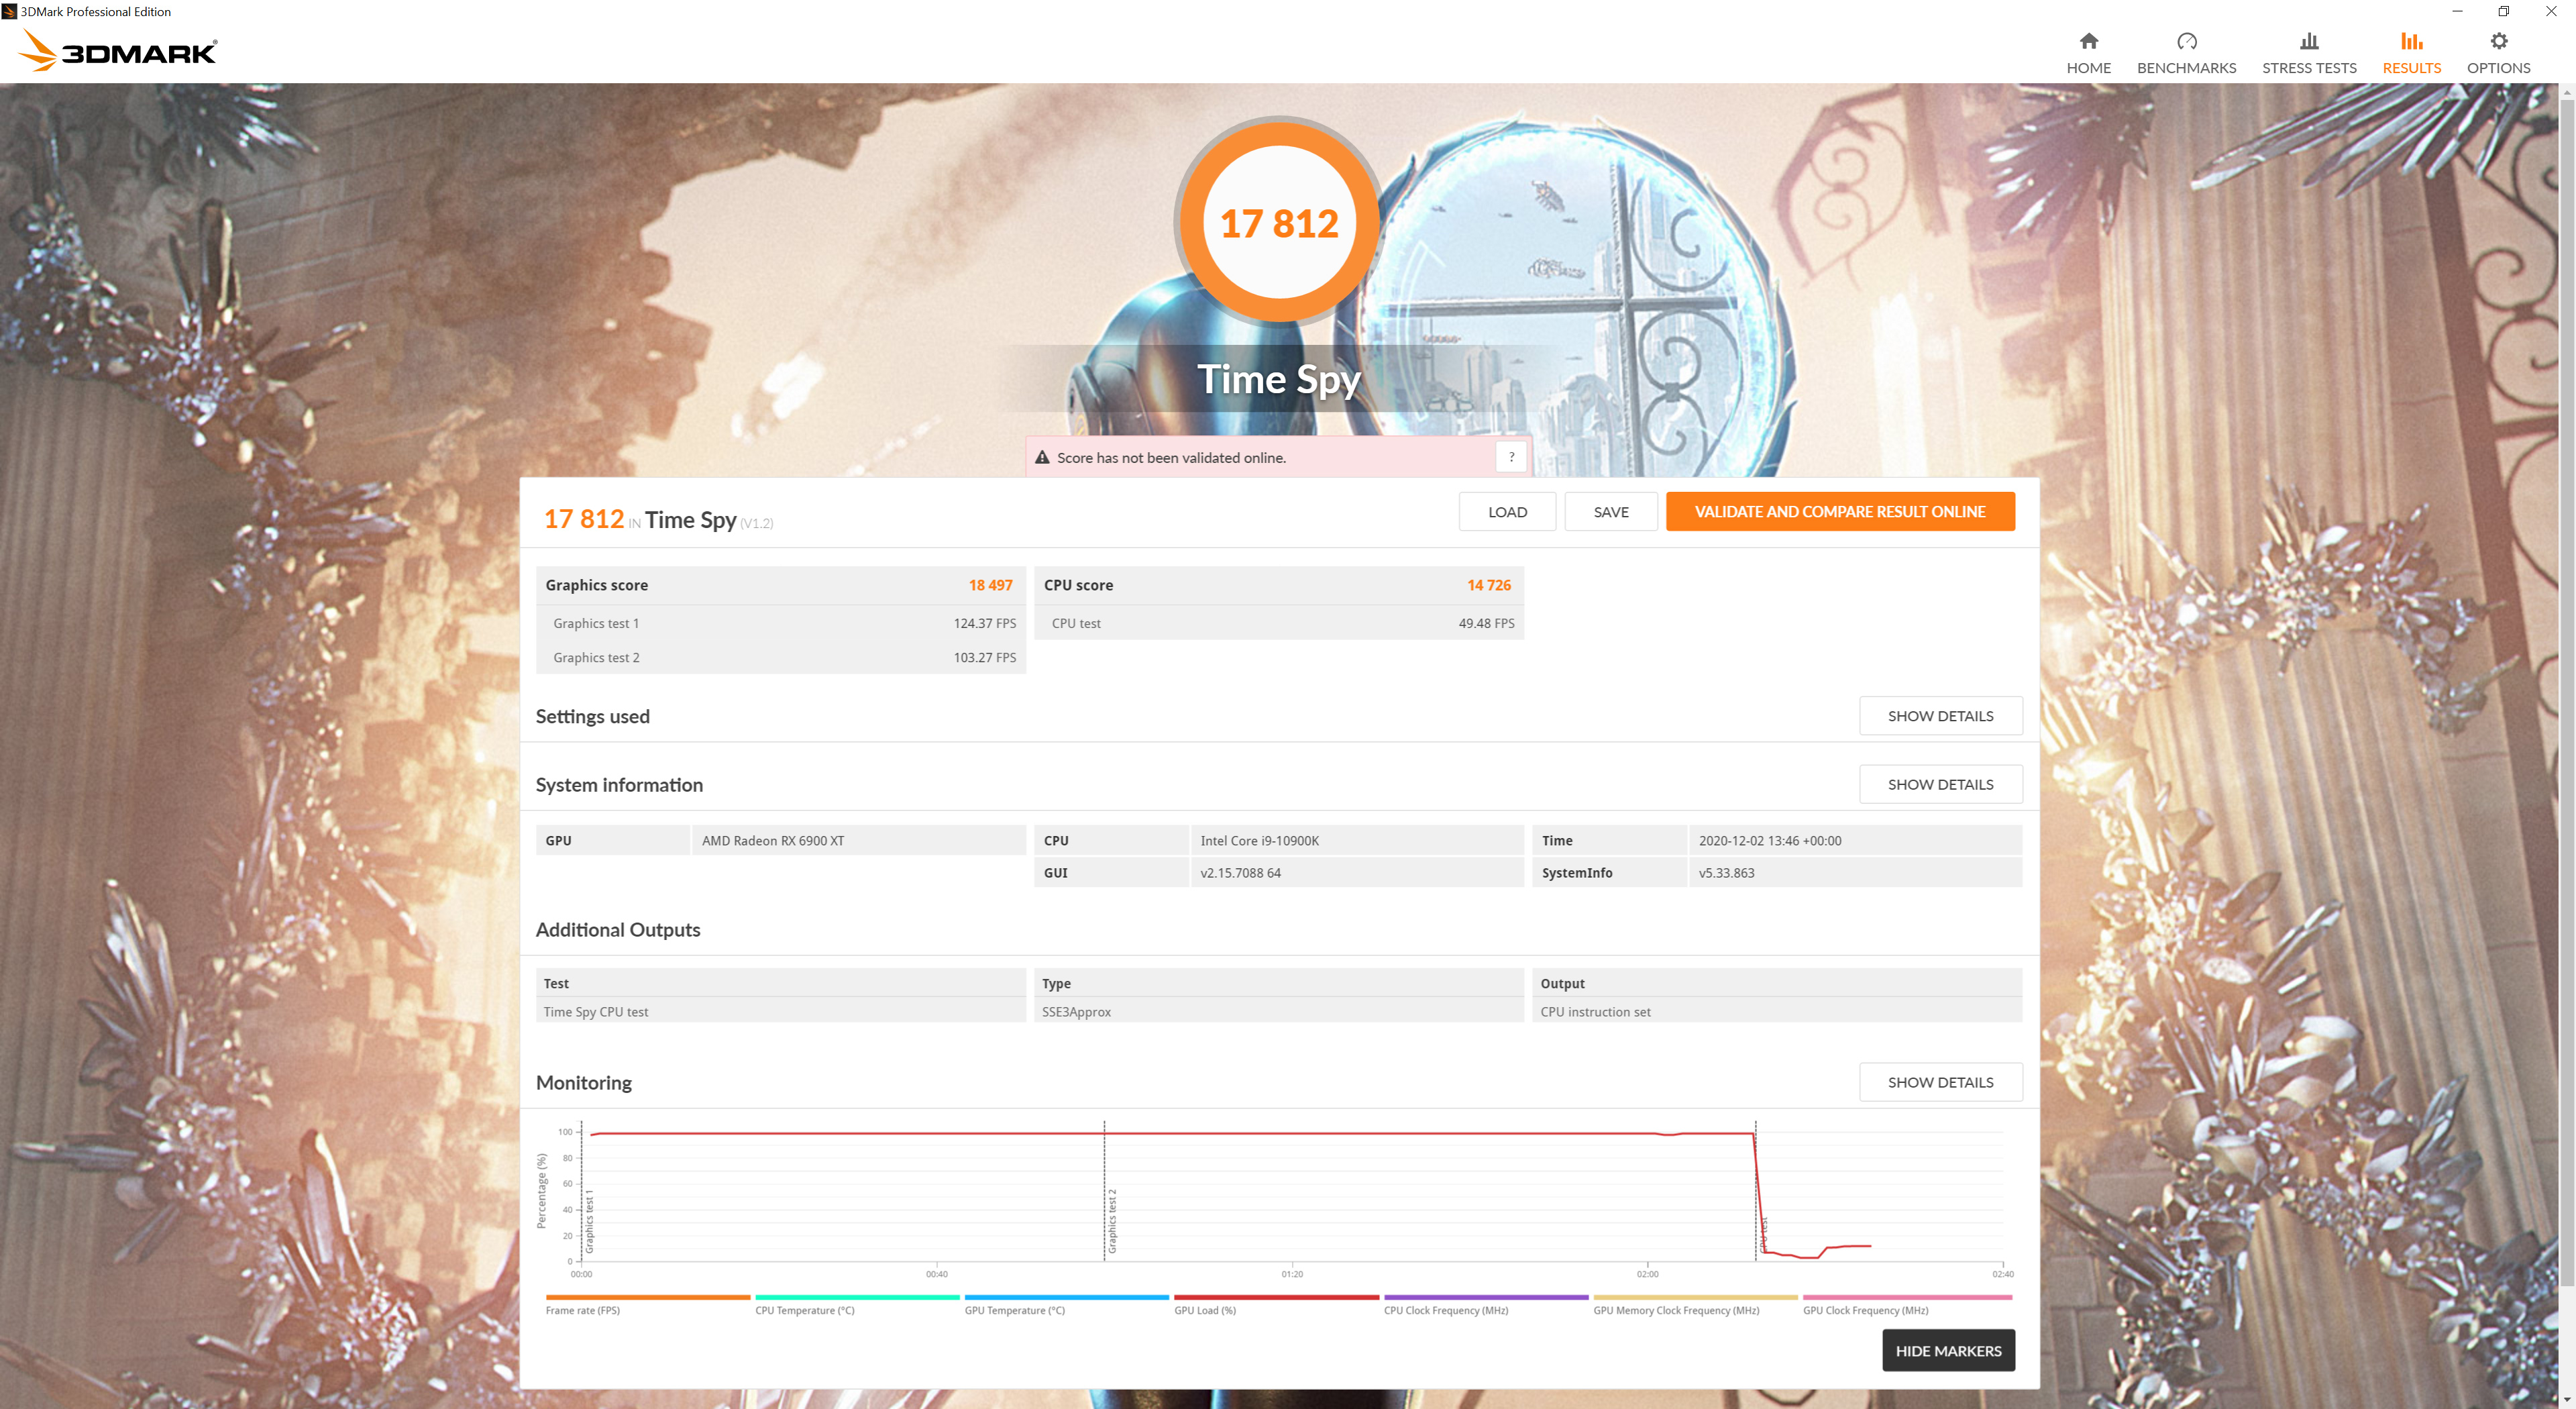
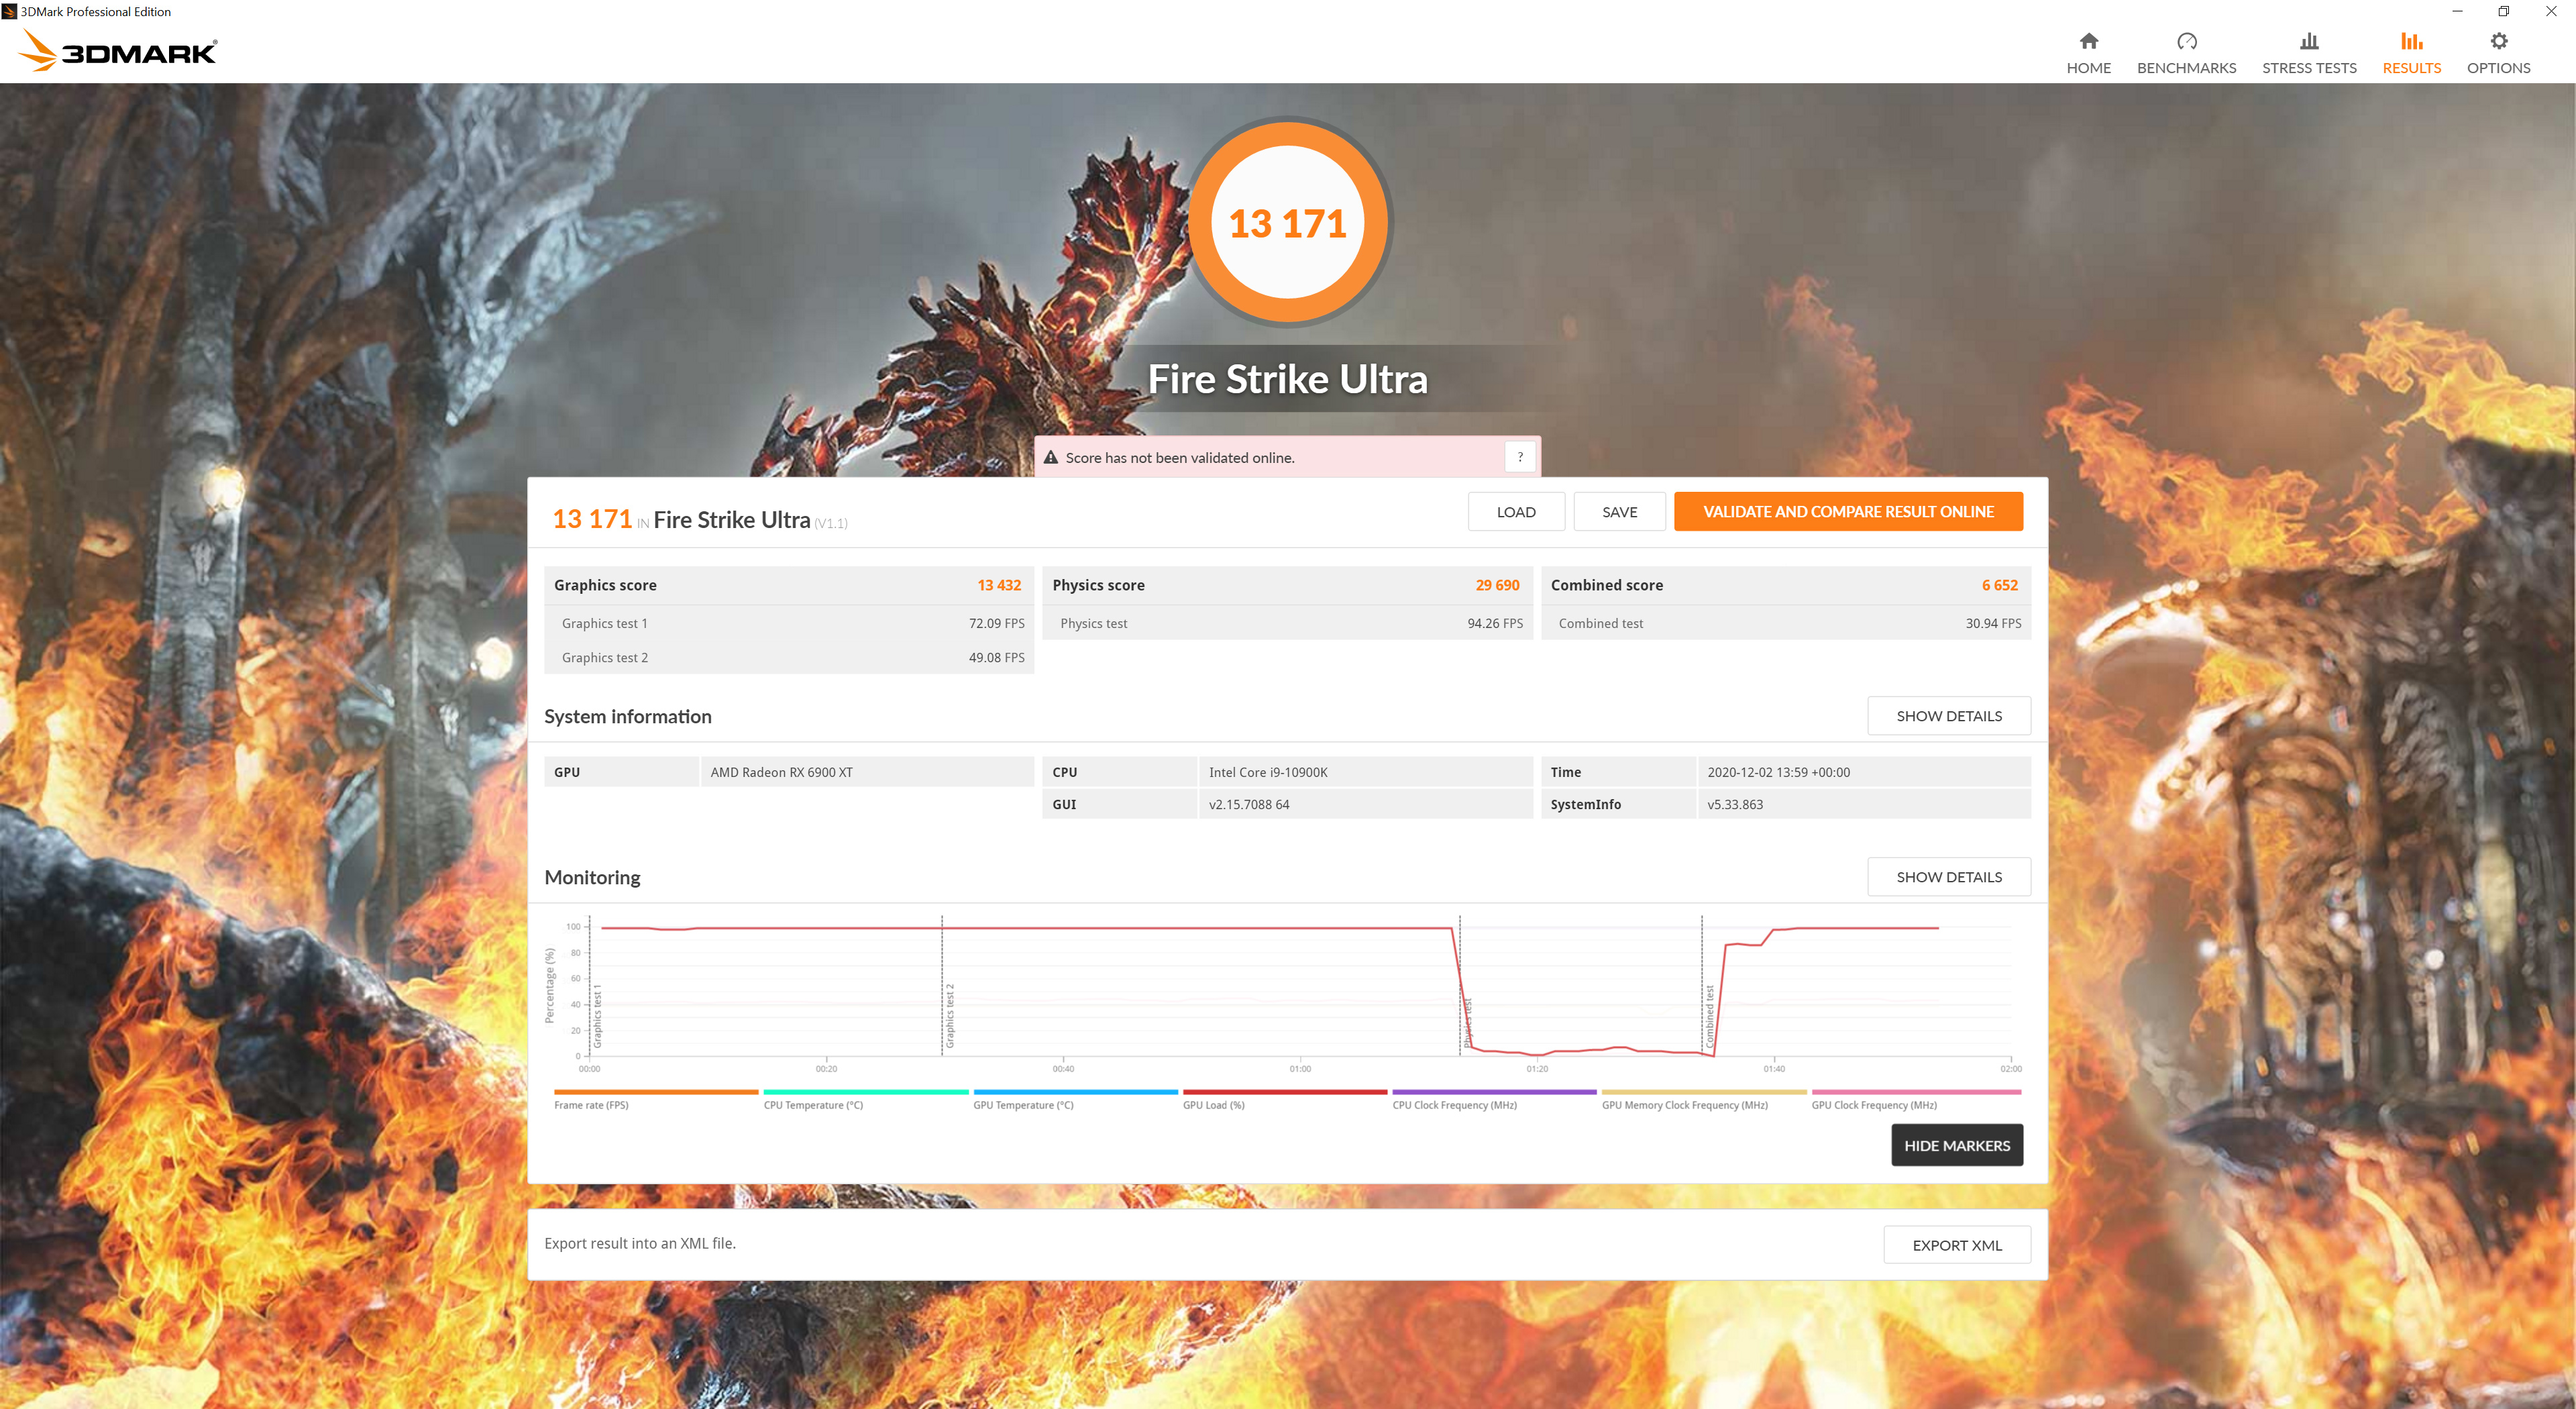
Starting with the 3DMark scores, we already saw chart-topping performance from the RX 6800 XT in Fire Strike, and the RX 6900 XT extends AMD's lead by another 8%, delivering a score of almost 55,000. The gains are smaller in Time Spy, where the 6900 XT scores just 6% higher than the 6800 XT, but in Fire Strike Ultra it is 7% faster than even the RTX 3090.
Real-time ray tracing is incredibly demanding. The latest graphics cards have dedicated hardware that’s optimized for ray-tracing. The 3DMark DirectX Raytracing feature test measures the performance of this dedicated hardware. Instead of using traditional rendering techniques, the whole scene is ray-traced and drawn in one pass. The result of the test depends entirely on ray-tracing performance. (UL).
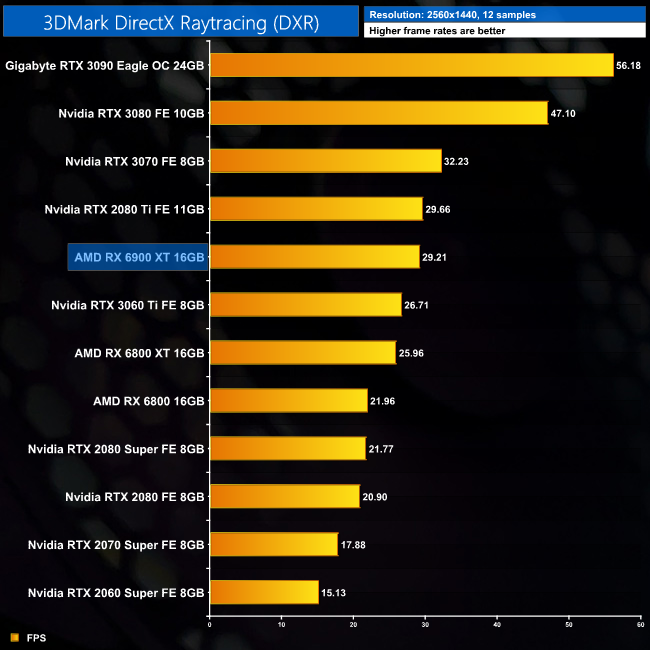
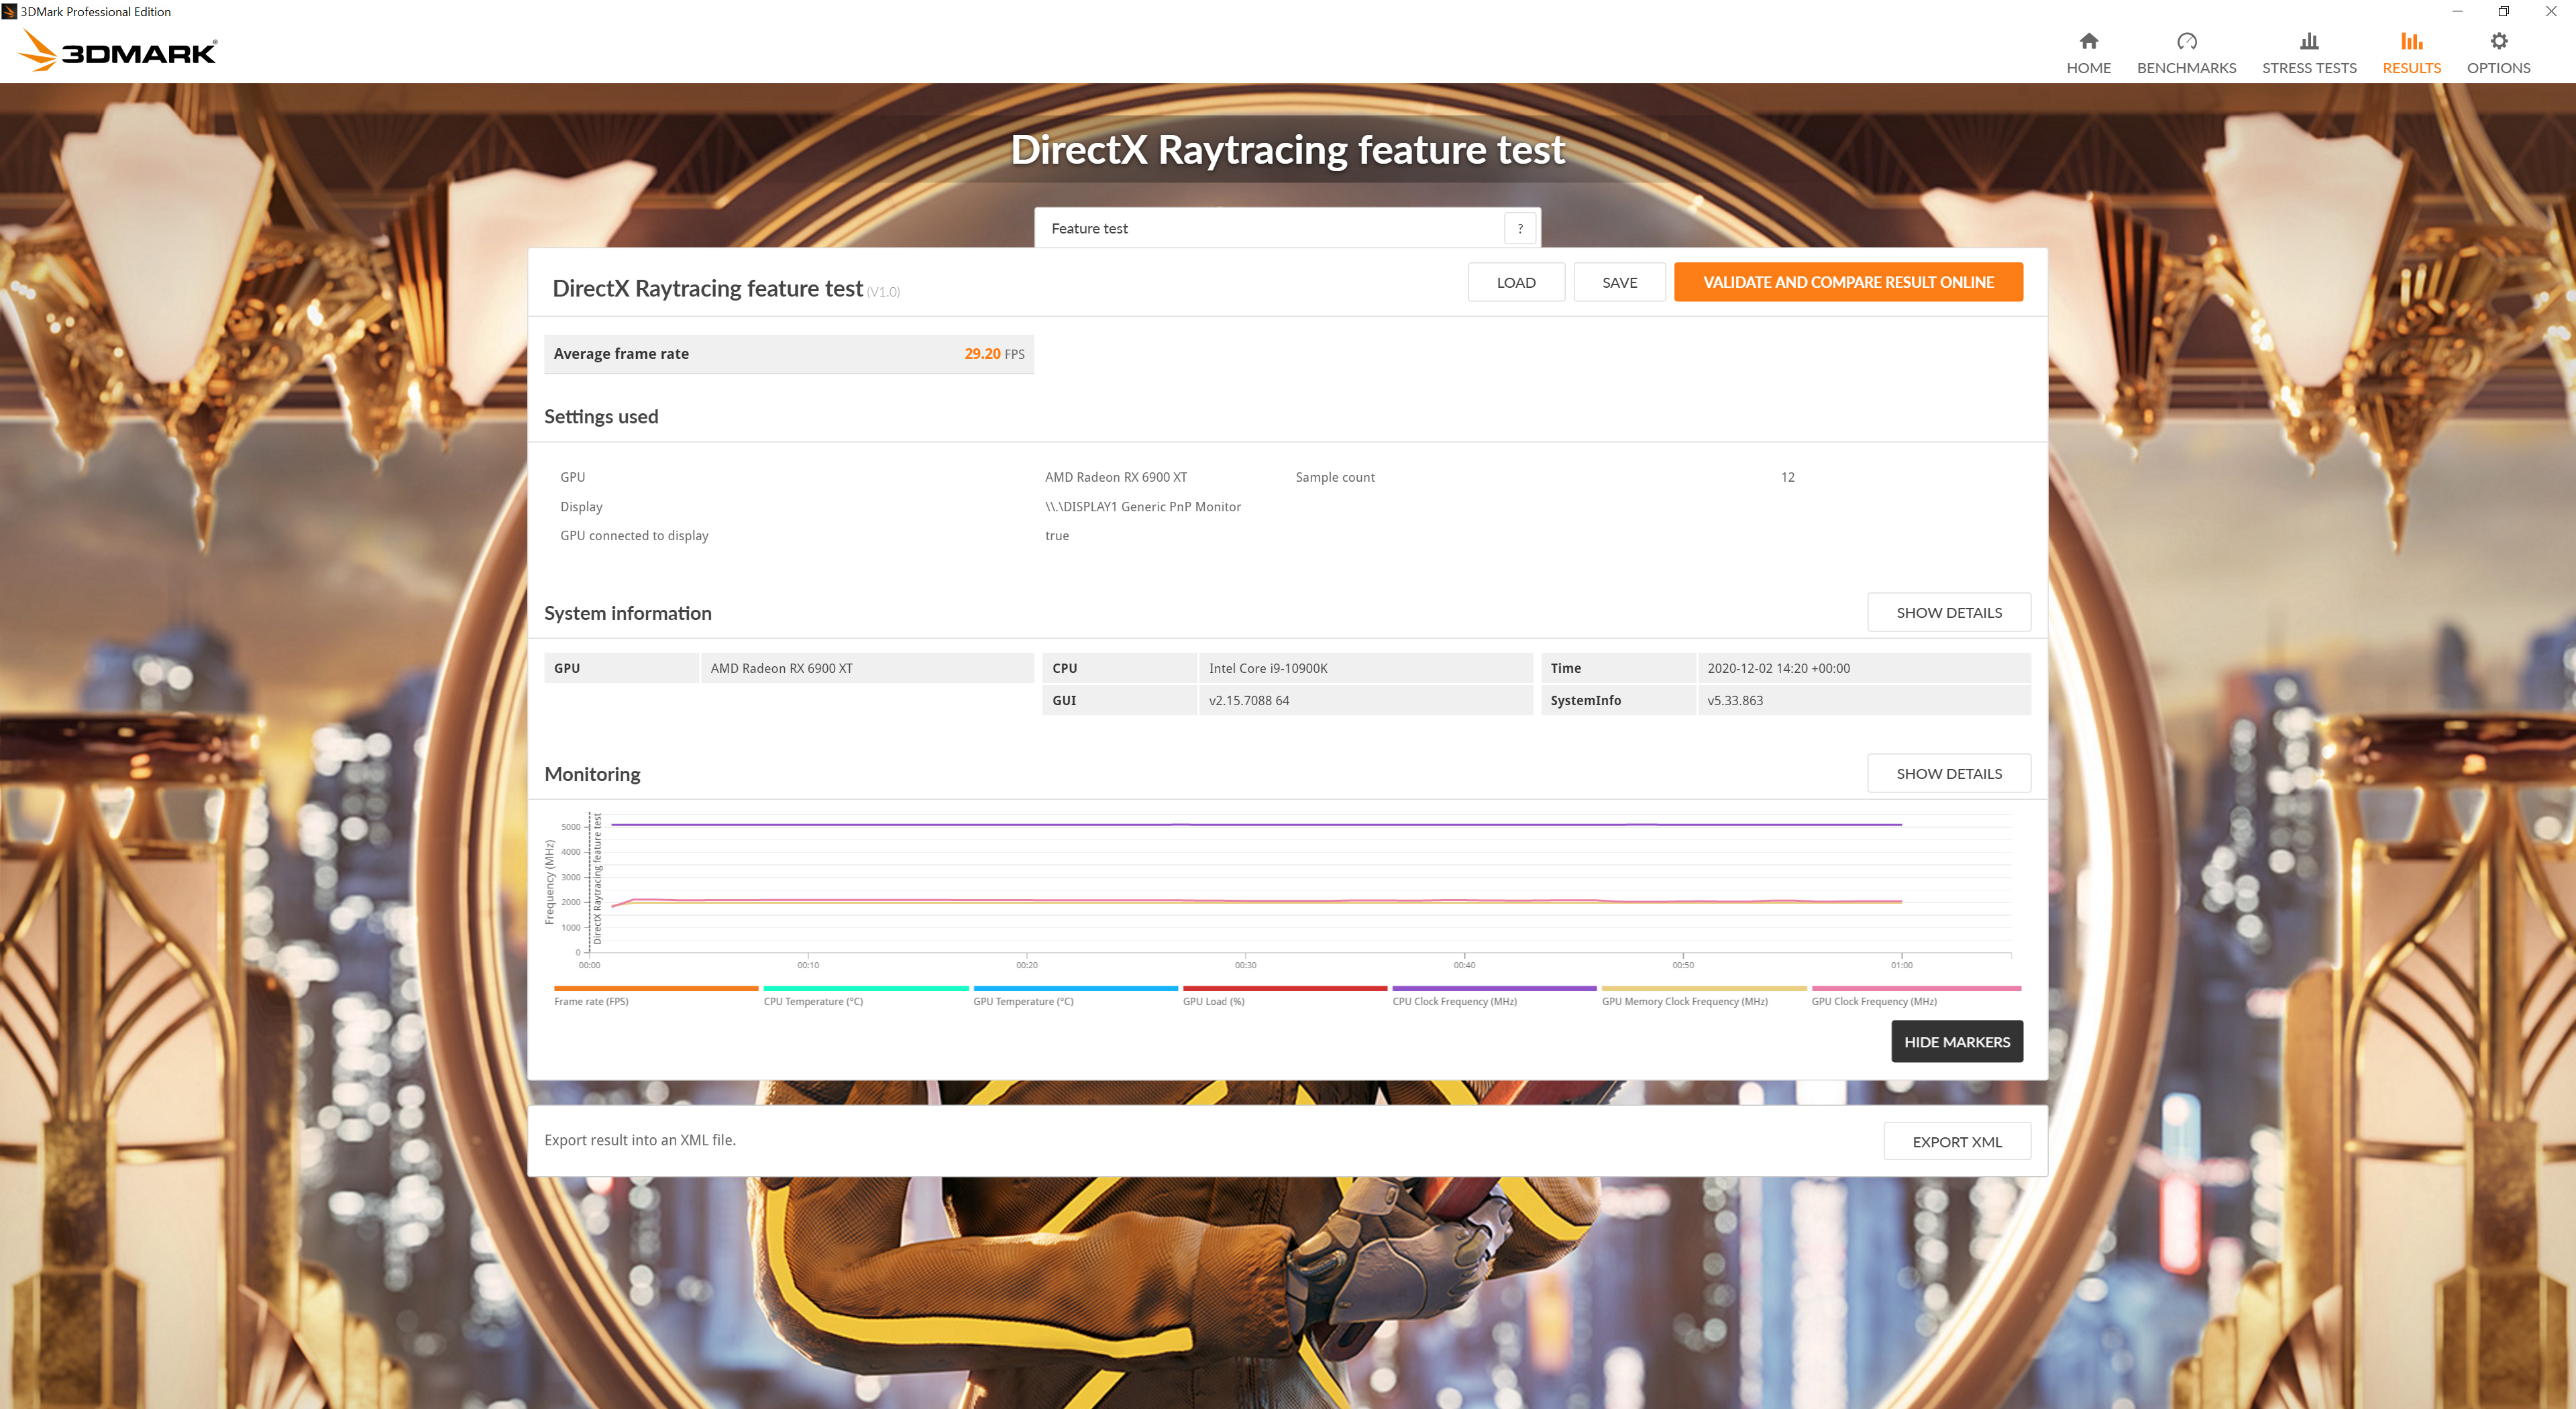
In a test of the GPU's ray tracing performance, the 3DMark DXR feature test sees the RX 6900 XT effectively matching the RTX 2080 Ti. This puts it 13% ahead of the RX 6800 XT, but 38% behind the RTX 3080.
Borderlands 3 is an action role-playing first-person shooter video game developed by Gearbox Software and published by 2K Games. It is a sequel to 2012's Borderlands 2, and the fourth entry in the main Borderlands series. Borderlands 3 was released on 13 September 2019 for Microsoft Windows, PlayStation 4, Xbox One. (Wikipedia).
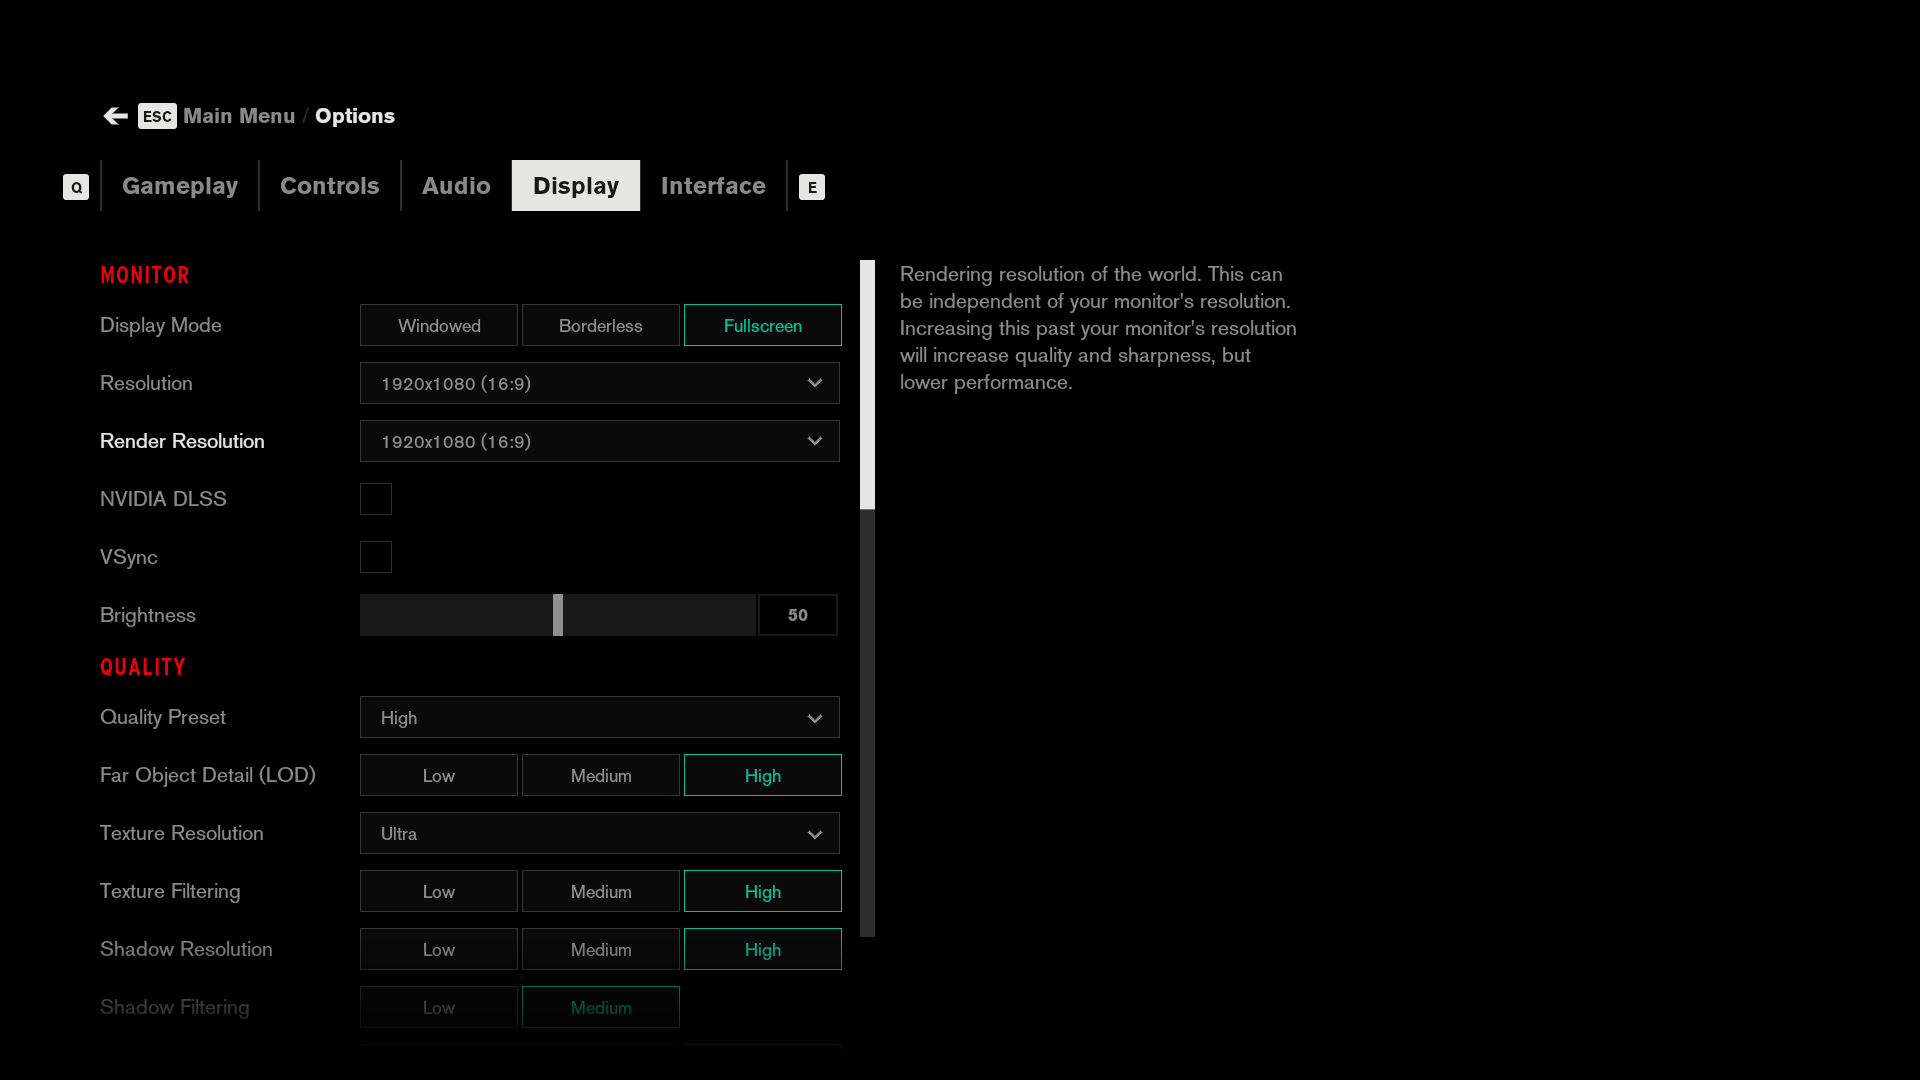
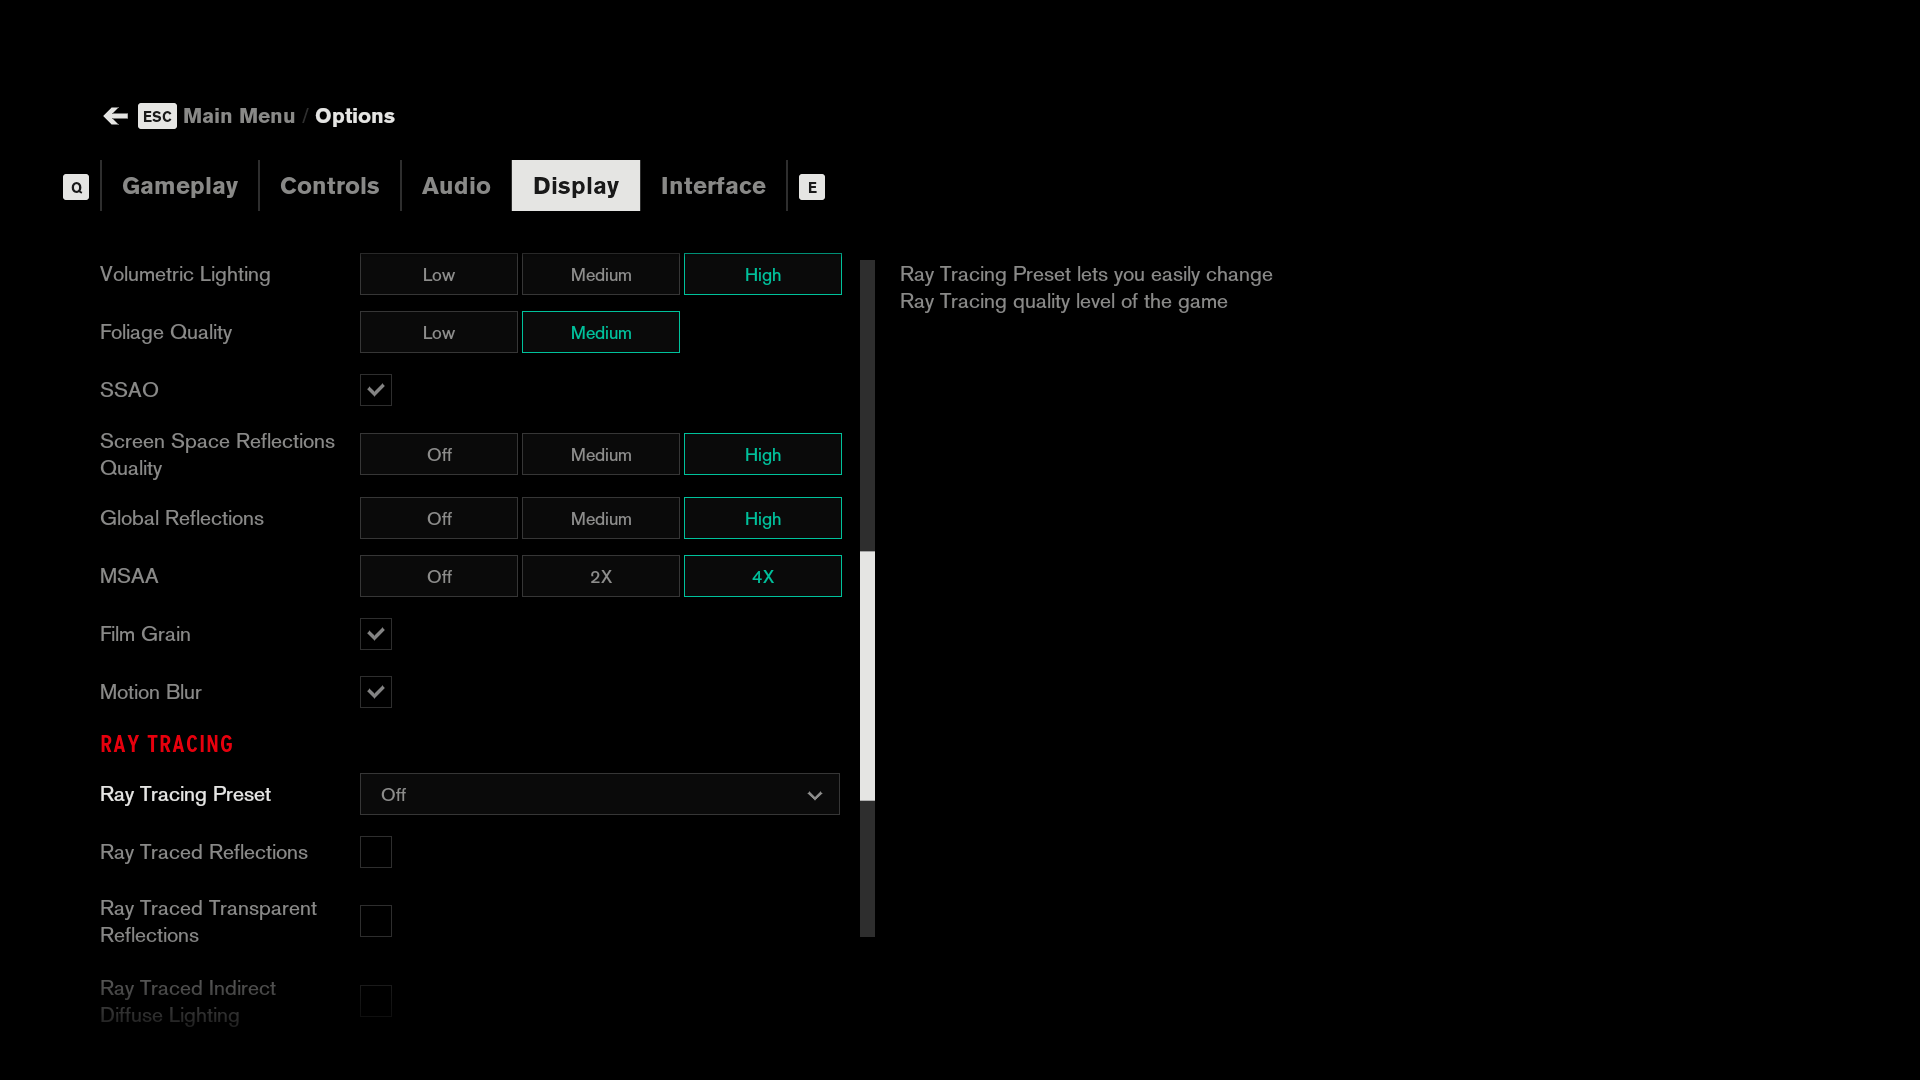
Engine: Unreal Engine 4. We test using the Badass preset, DX12 API.
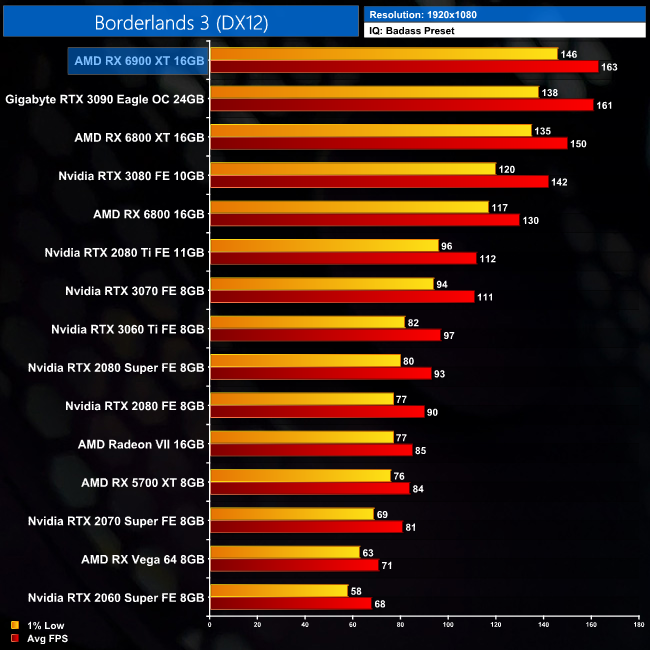
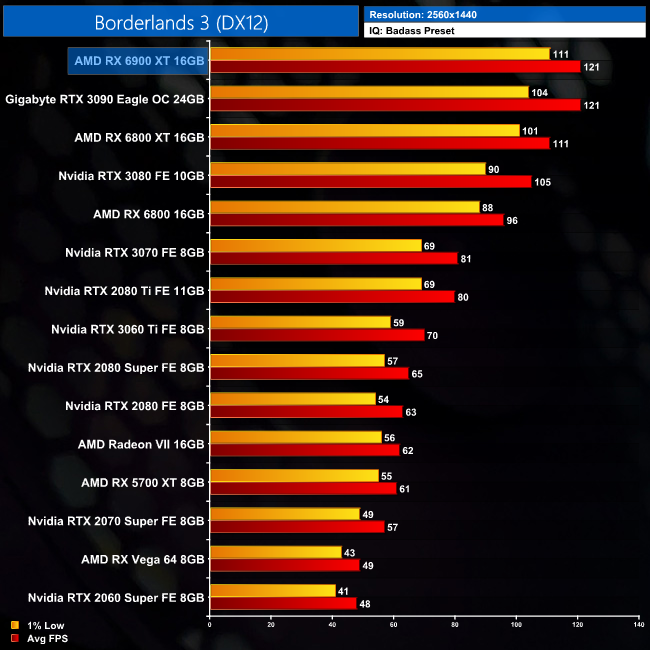
Our first game of the day is Borderlands 3, with the RX 6900 XT delivering some excellent results in this AMD title. At 1440p, it delivers an average frame rate of 121FPS, which is exactly equal to the RTX 3090, but the AMD GPU does do a bit better in terms of the 1% lows. This result puts it 15% ahead of the RTX 3080 and 9% ahead of the RX 6800 XT.
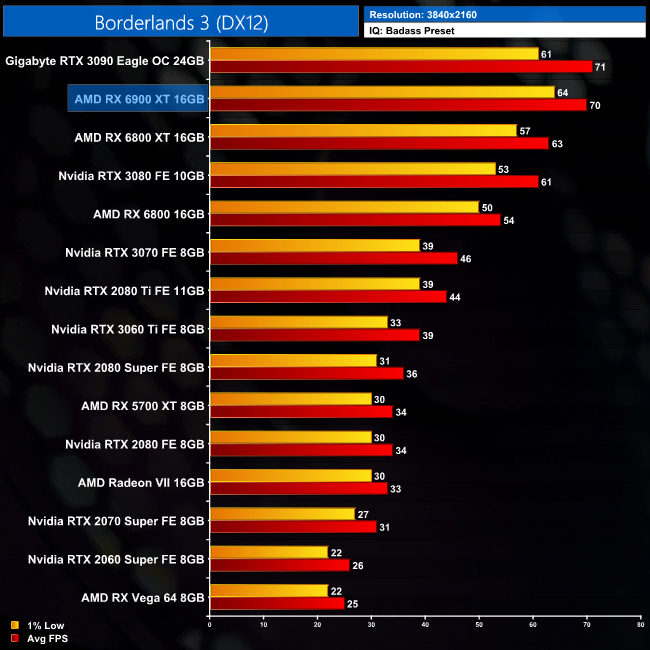
At 4K, it is still neck and neck with the RTX 3090, but again the 1% lows are a little better. We can also see the 6900 XT is still 15% faster than the RTX 3080, and now 11% ahead of the 6800 XT.
Control is an action-adventure video game developed by Remedy Entertainment and published by 505 Games. Control was released on 27 August 2019 for Microsoft Windows, PlayStation 4, and Xbox One. (Wikipedia).
Engine: Northlight Engine. We test using the High preset, with 4x MSAA, DX12 API.
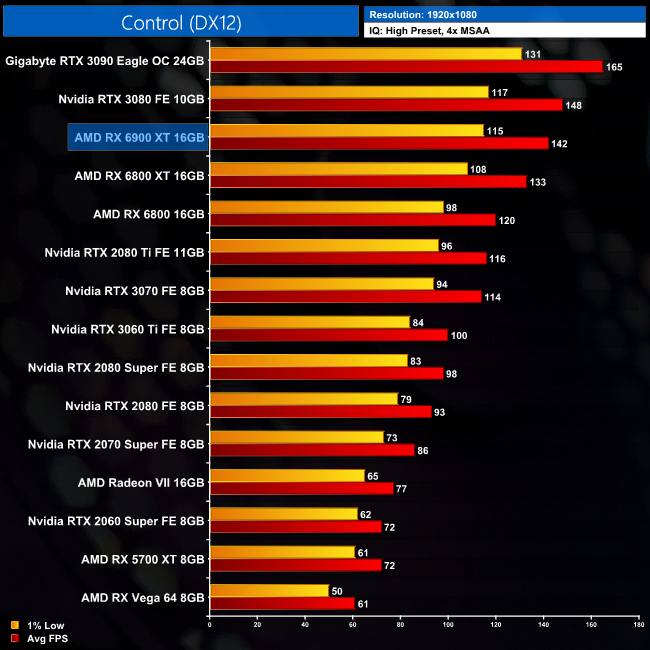
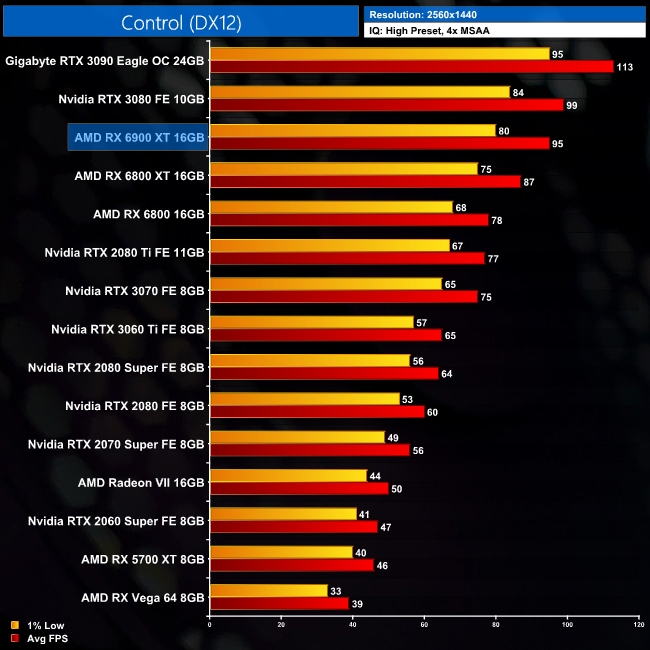
Our next game is Control, an Nvidia title and accordingly we see stronger performance from Team Green. At 1440p, the 6900 XT delivers 95FPS on average, putting it 9% ahead of the 6800 XT, but still 4% slower than the RTX 3080 and 16% slower than the RTX 3090.
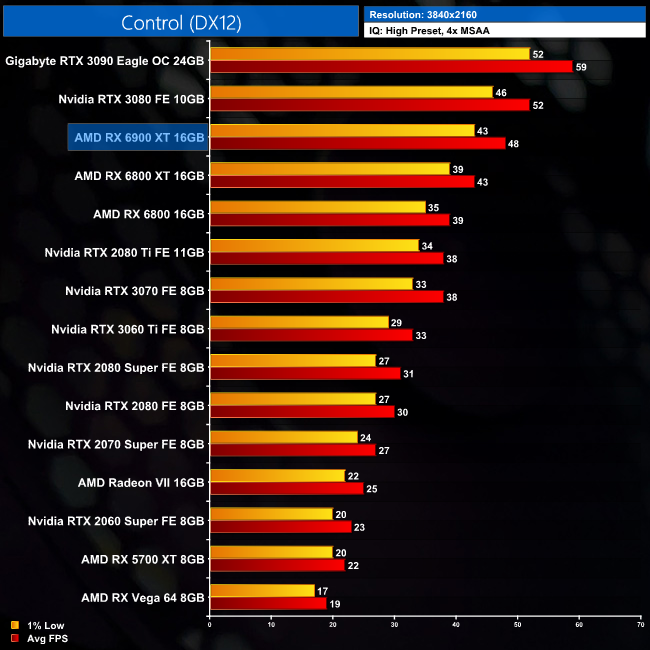
At 4K, the average frame rate drops to 48FPS, which sees the 6900 XT fall 8% behind the RTX 3080 and 19% behind the RTX 3090. Compared to the 6800 XT though, it's 12% faster.
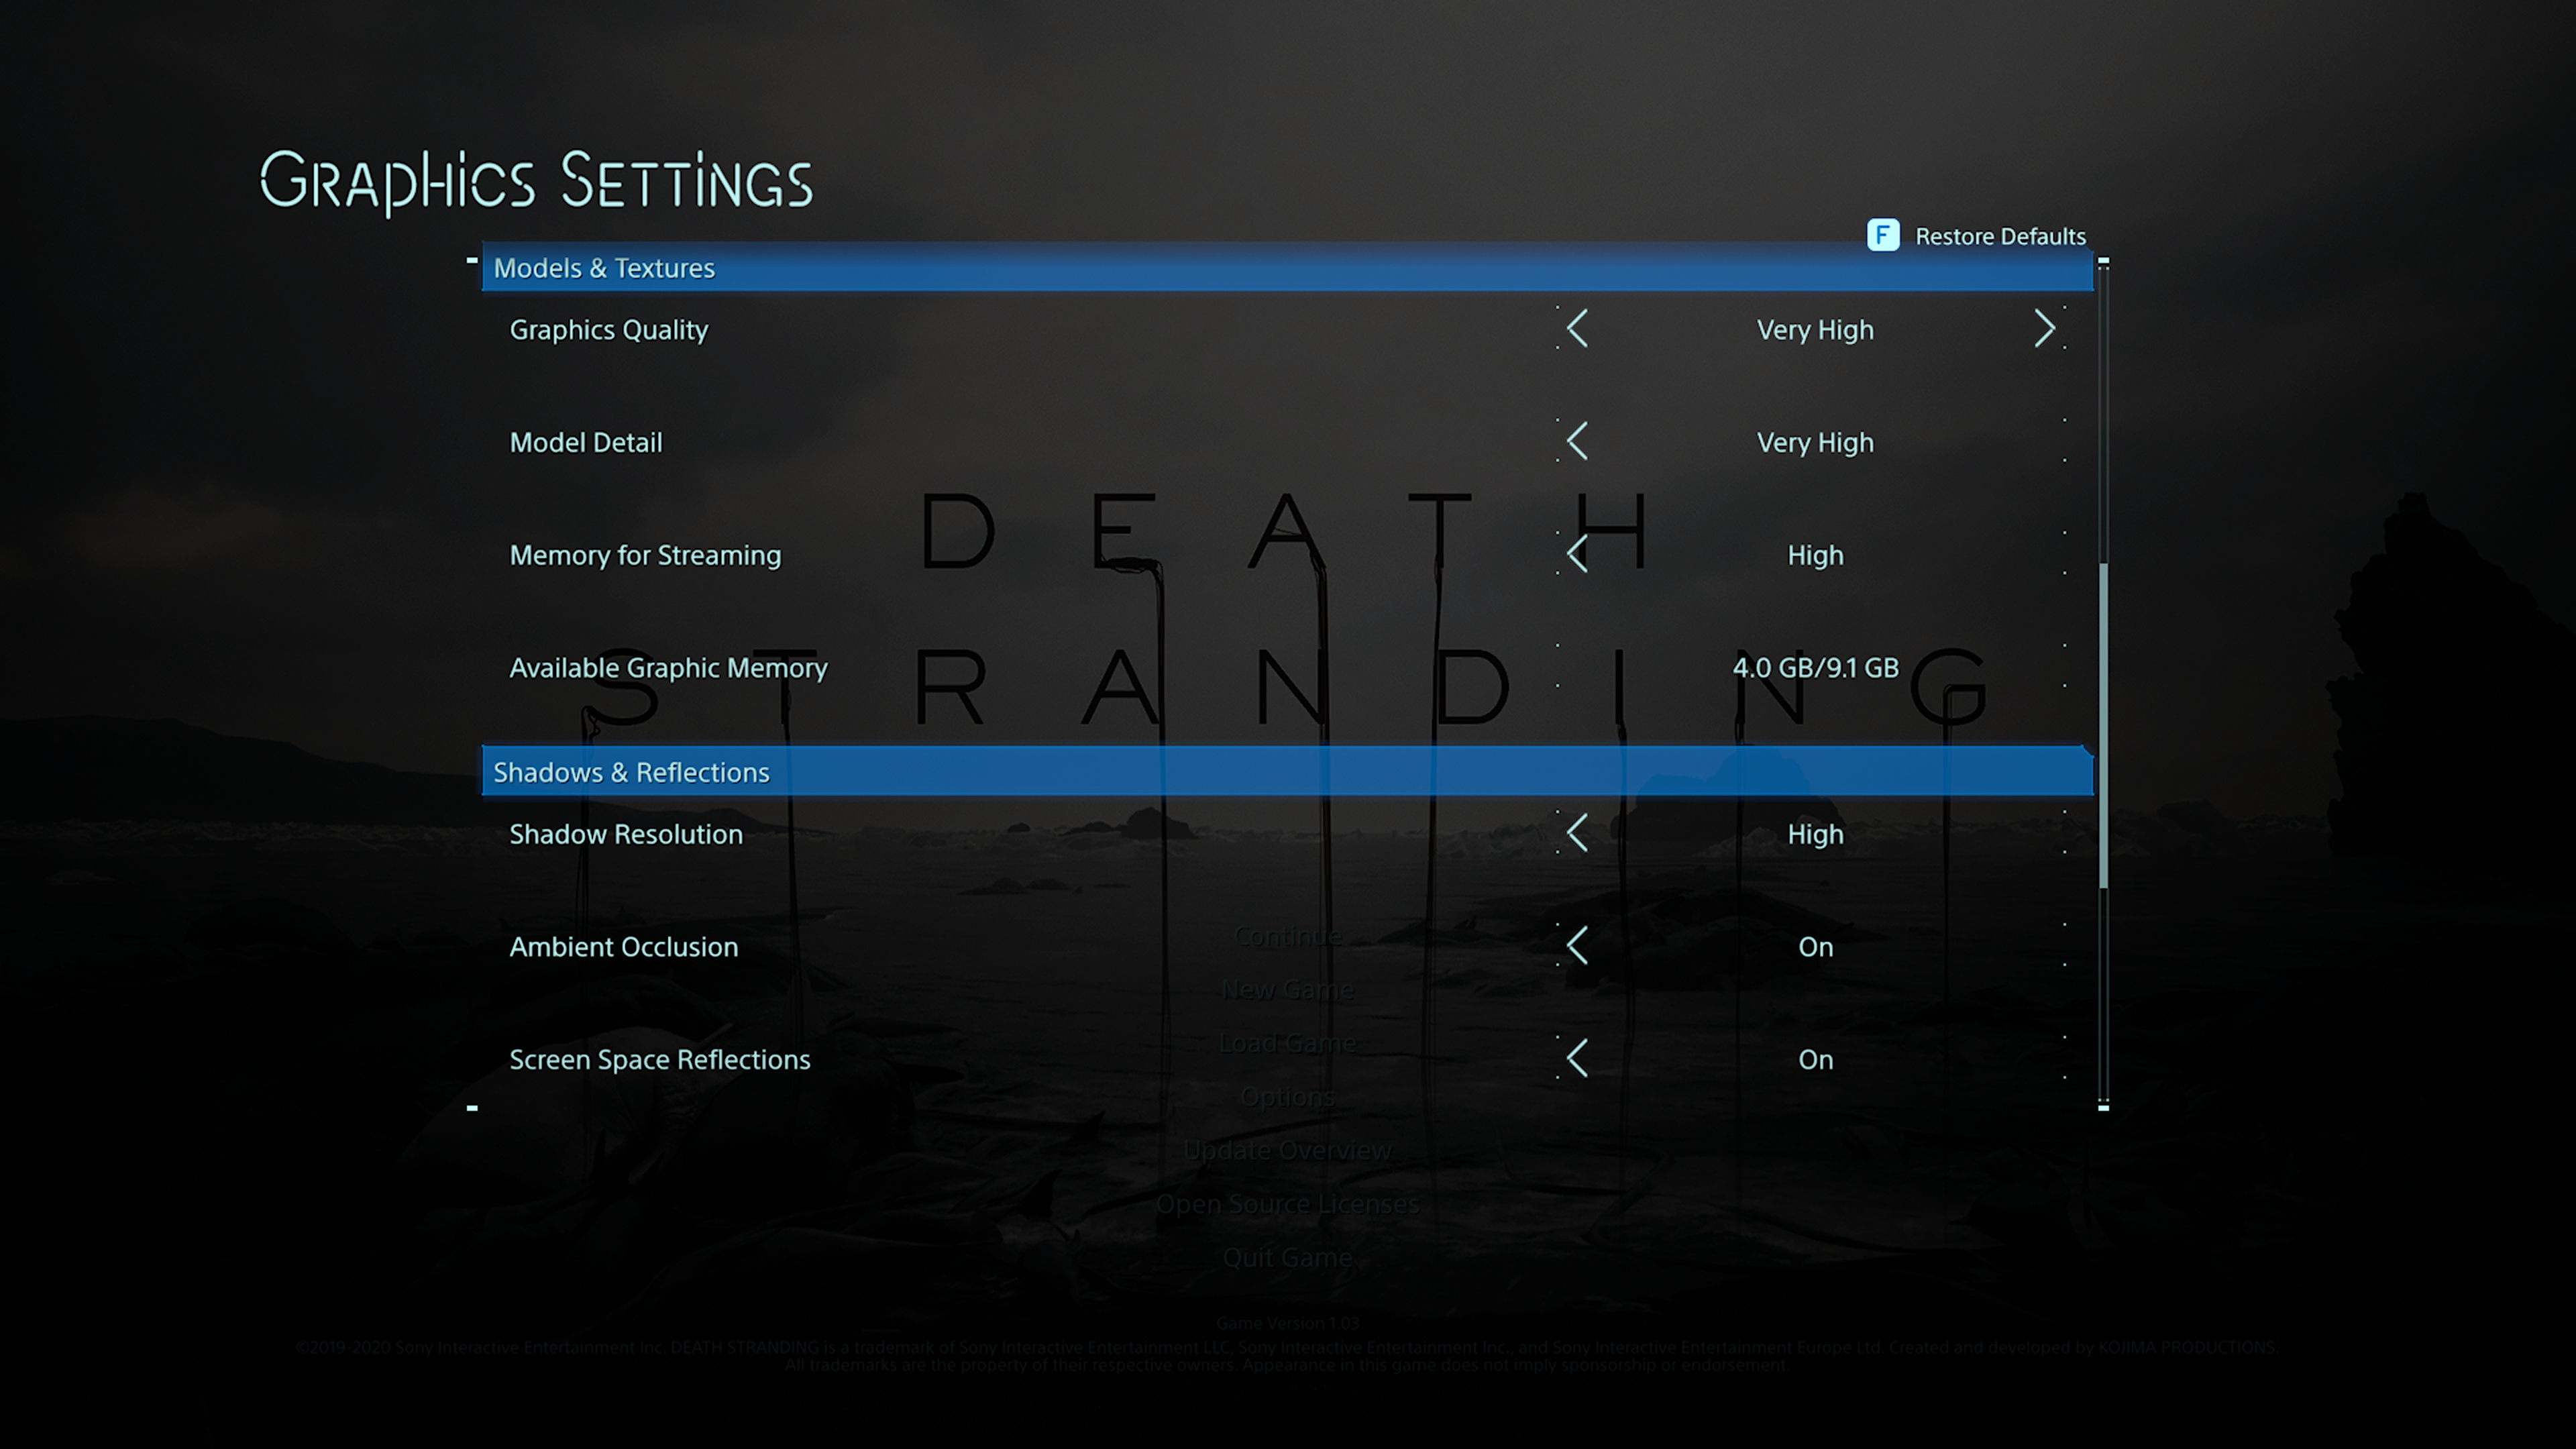
Death Stranding is an action game developed by Kojima Productions. It is the first game from director Hideo Kojima and Kojima Productions after their split from Konami in 2015. It was released by Sony Interactive Entertainment for the PlayStation 4 in November 2019 and by 505 Games for Windows in July 2020. (Wikipedia).
Engine: Decima. We test using the Very High preset, with TAA, DX12 API.
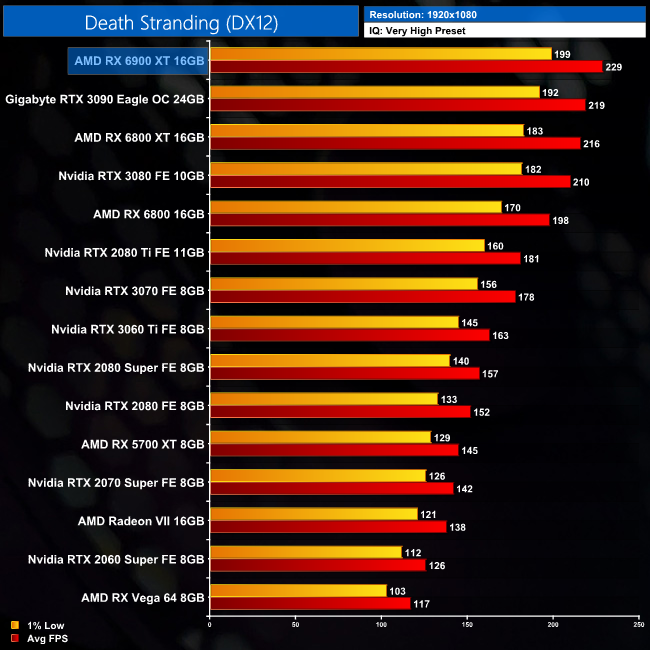
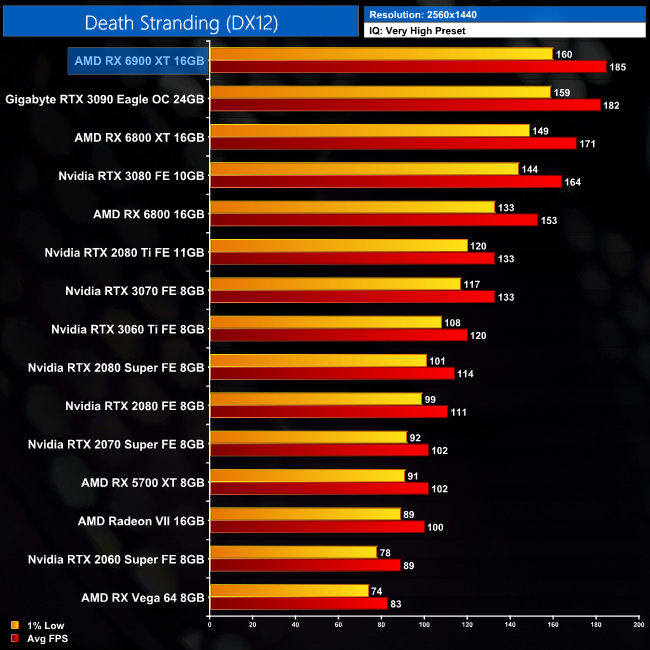
Moving onto Death Stranding, once more we see the 6900 XT at the top of the chart, delivering 185FPS at 1440p, giving it a 2% lead over the RTX 3090. This isn't miles ahead of the 6800 XT though, as it's 8% faster, but it's also 13% faster than the RTX 3080.
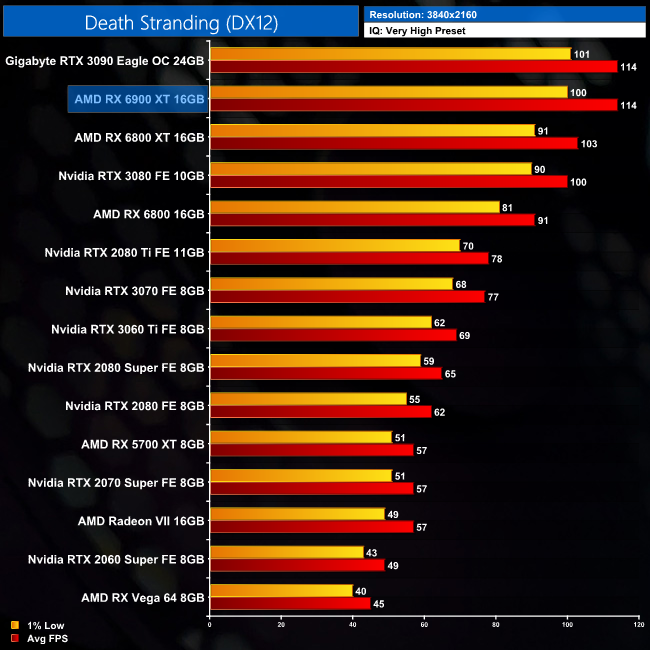
Increasing the resolution to 4K sees the 6900 XT perform identically to the RTX 3090, while it's 11% faster than the 6800 XT and 14% faster than the RTX 3080.
Tom Clancy's The Division 2 is an online action role-playing video game developed by Massive Entertainment and published by Ubisoft. The sequel to Tom Clancy's The Division (2016), it is set in a near-future Washington, D.C. in the aftermath of a smallpox pandemic, and follows an agent of the Strategic Homeland Division as they try to rebuild the city. (Wikipedia).
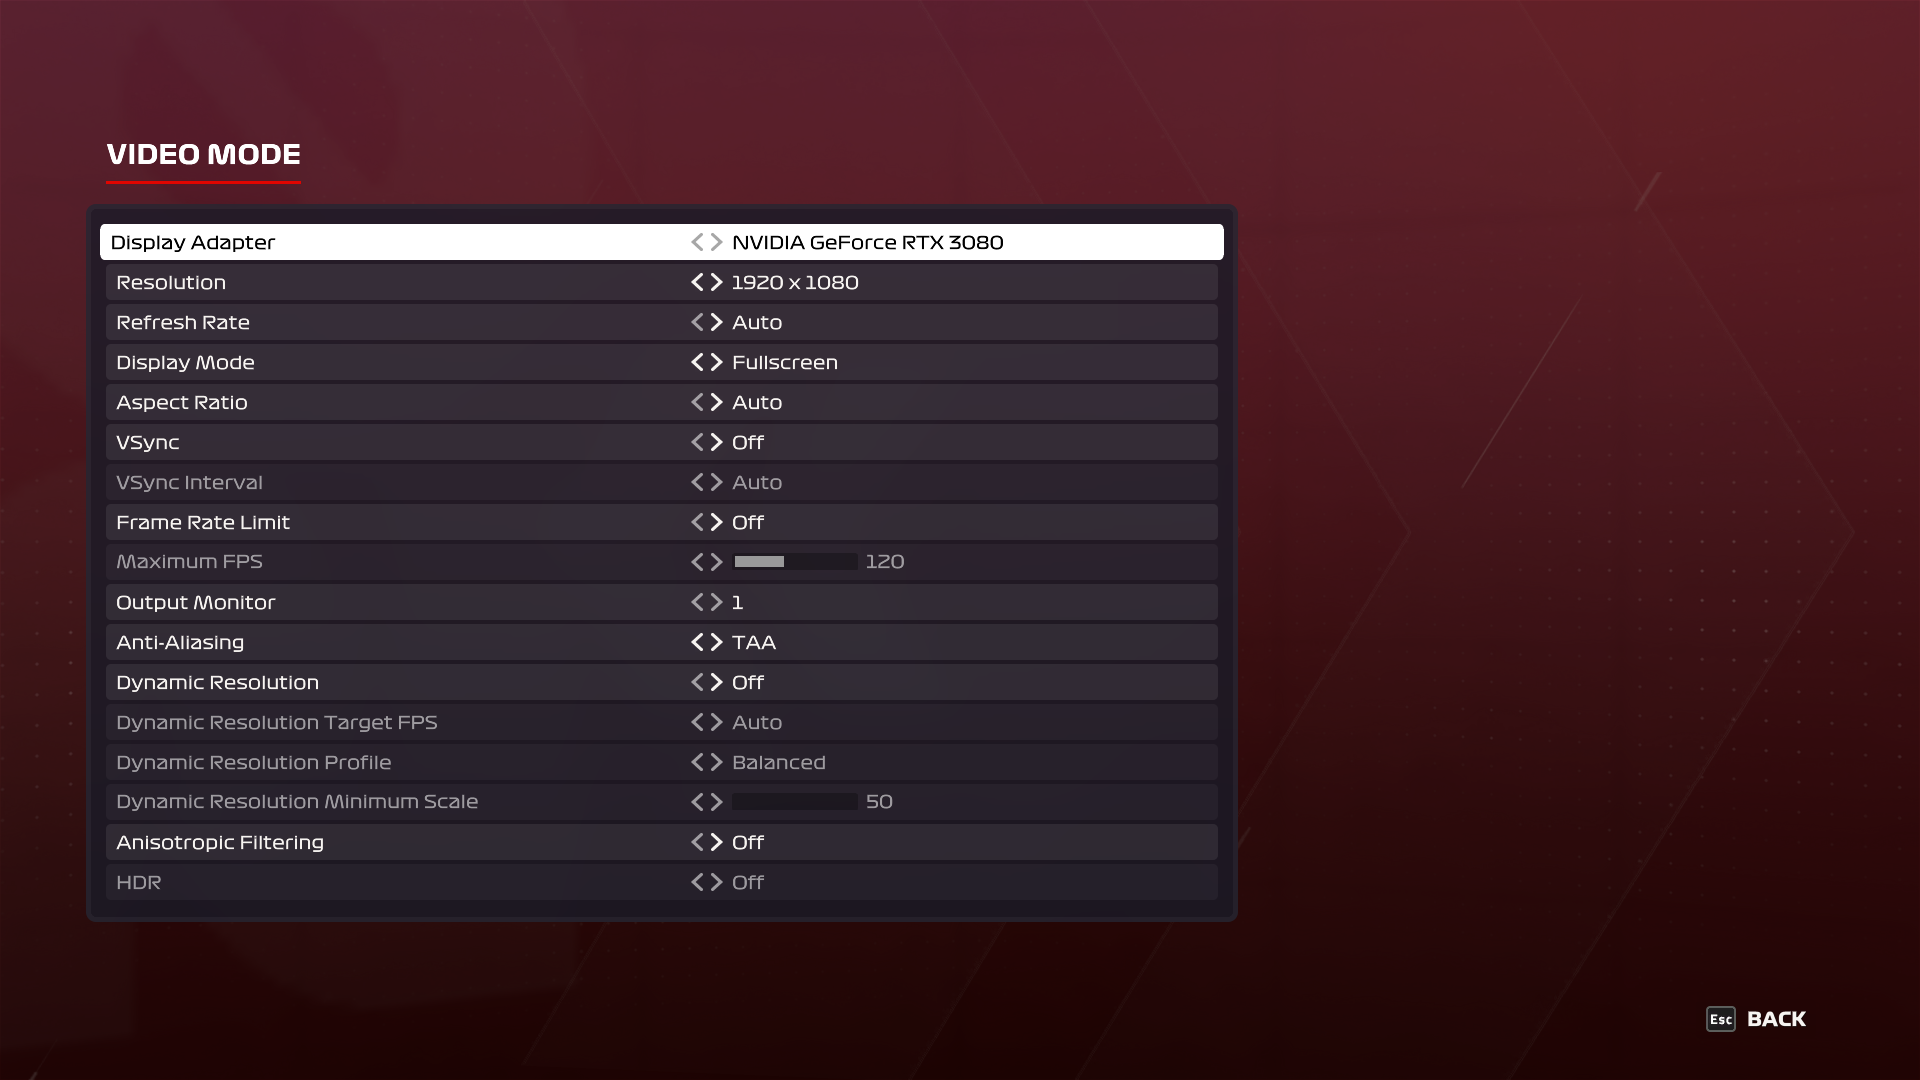
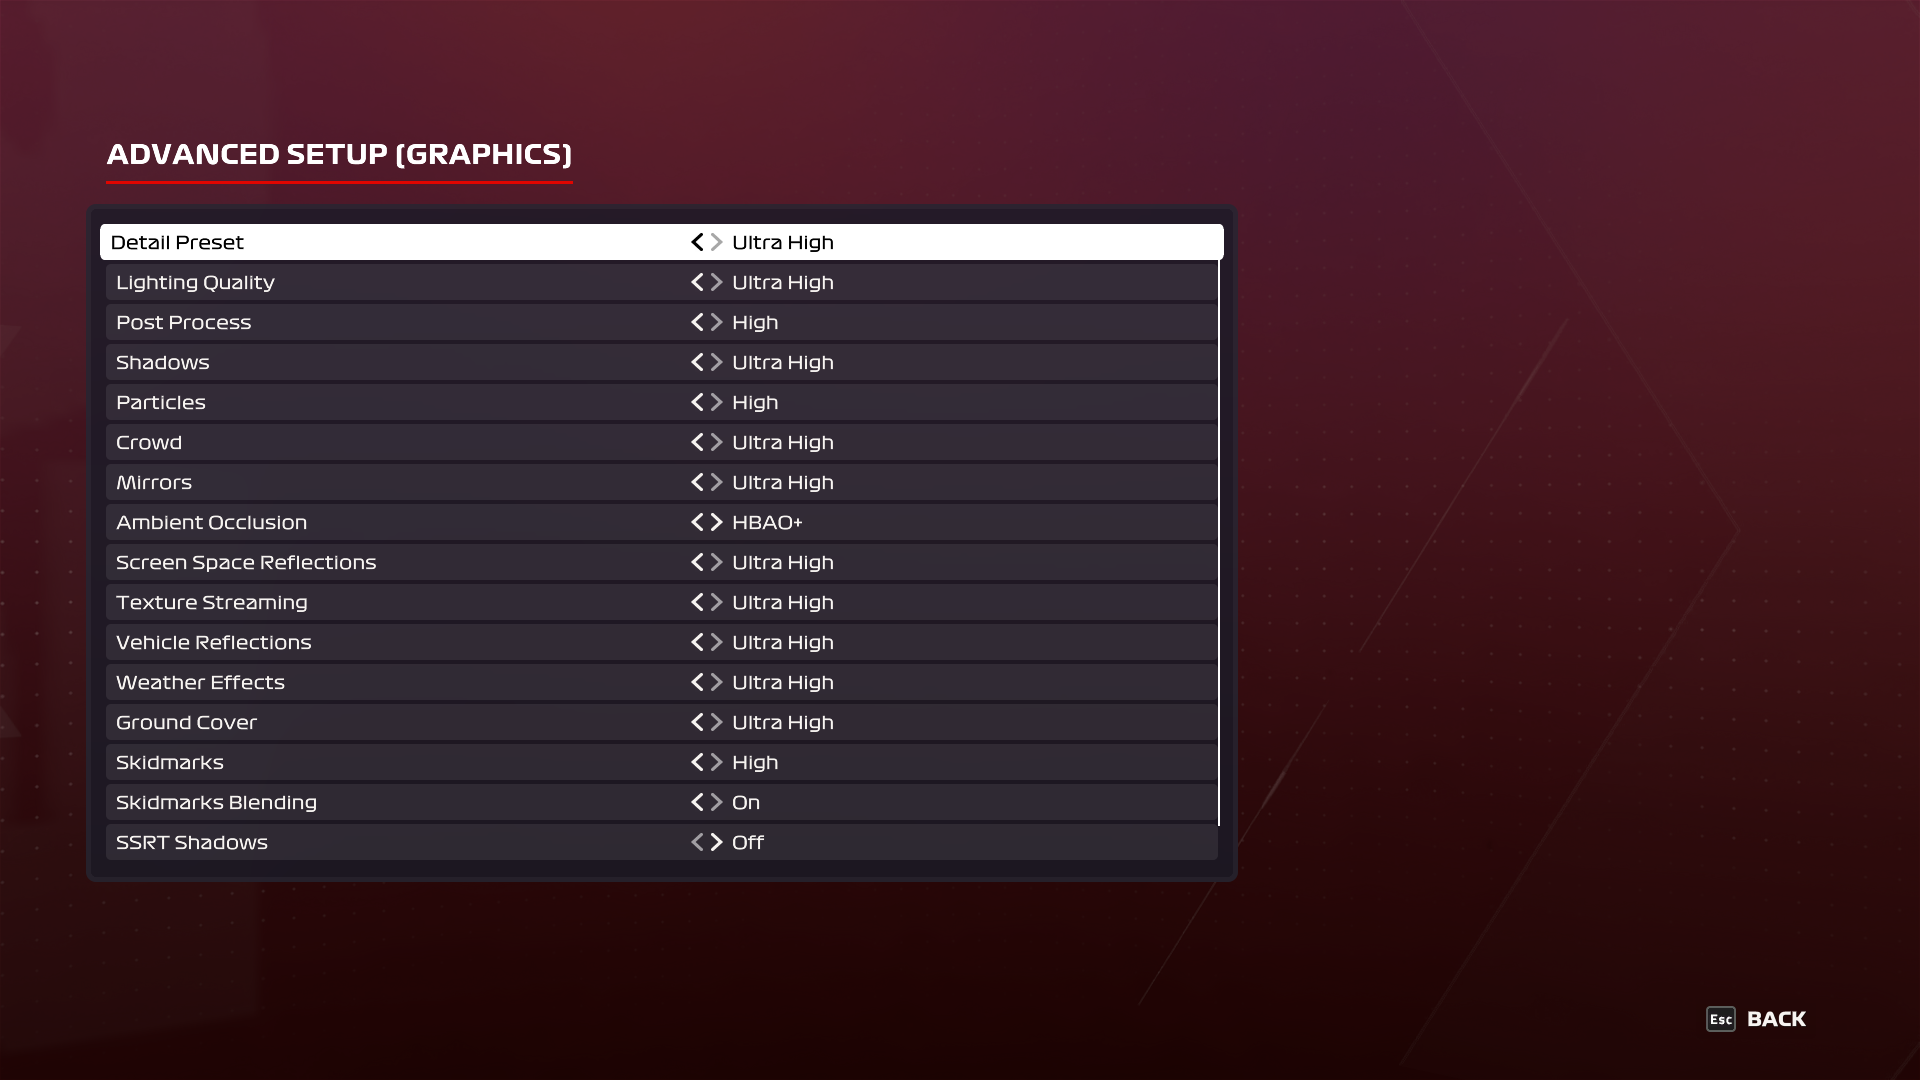
Engine: Snowdrop. We test using the Ultra preset, but with V-Sync disabled, DX12 API.
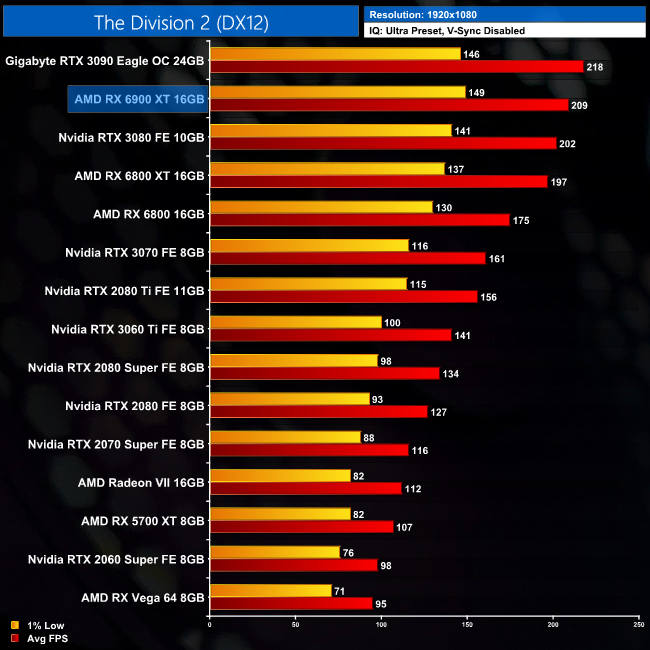
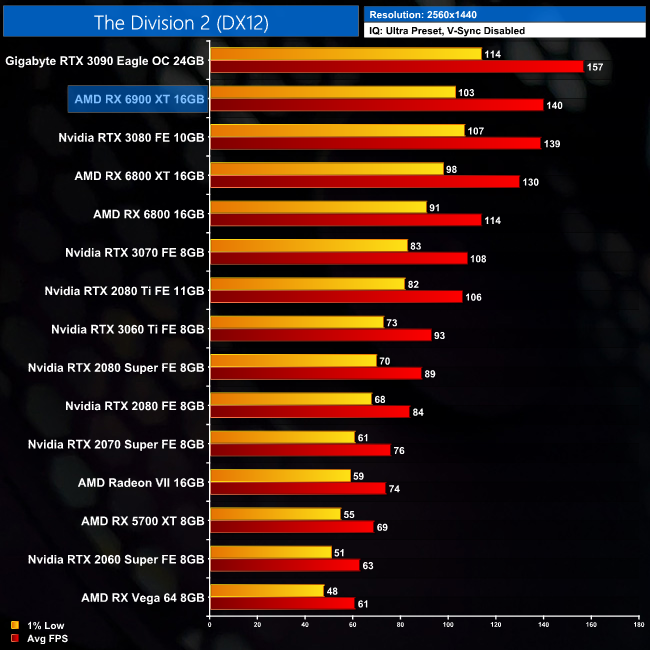
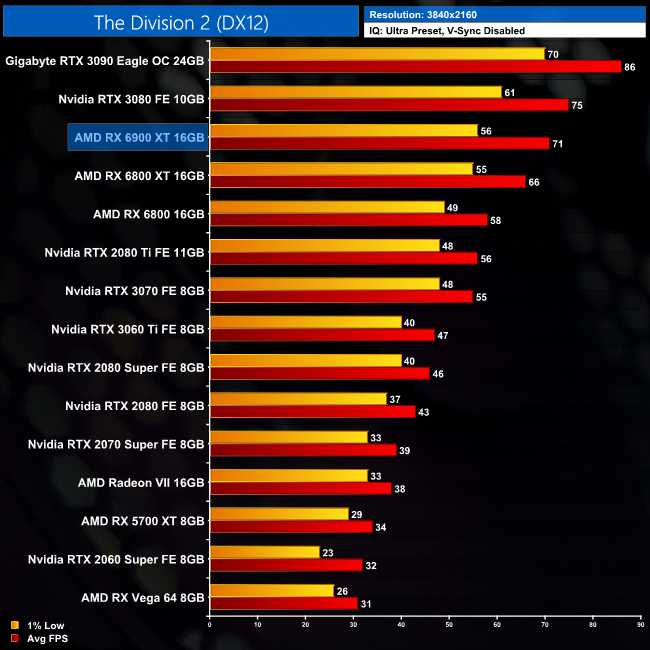
As for The Division 2, we've noted how well Ampere performs in this game, and at 1440p we can see the RTX 3080 is on par with the RX 6900 XT, both delivering around 140FPS on average. Compared to the RTX 3090 however, we see the 6900 XT come in 11% slower.
At 4K, the Nvidia GPUs come on strong and pull away somewhat. Here, the 6900 XT is 5% slower than the RTX 3080 and 17% slower than the RTX 3090. Compared to the RX 6800 XT, it delivers an 8% boost to frame rates.
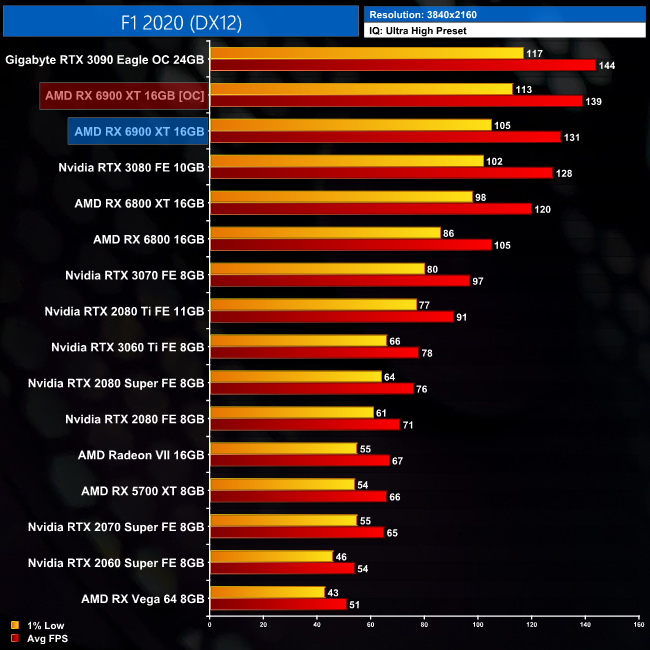
F1 2020 is the official video game of the 2020 Formula 1 and Formula 2 Championships developed and published by Codemasters. It is the thirteenth title in the Formula 1 series developed by the studio and was released on 7 July 2020 for pre-orders of the Michael Schumacher Edition and 10 July 2020 for the Seventy Edition on Microsoft Windows, PlayStation 4, Xbox One. (Wikipedia).
Engine: EGO. We test using the Ultra High preset, DX12 API.
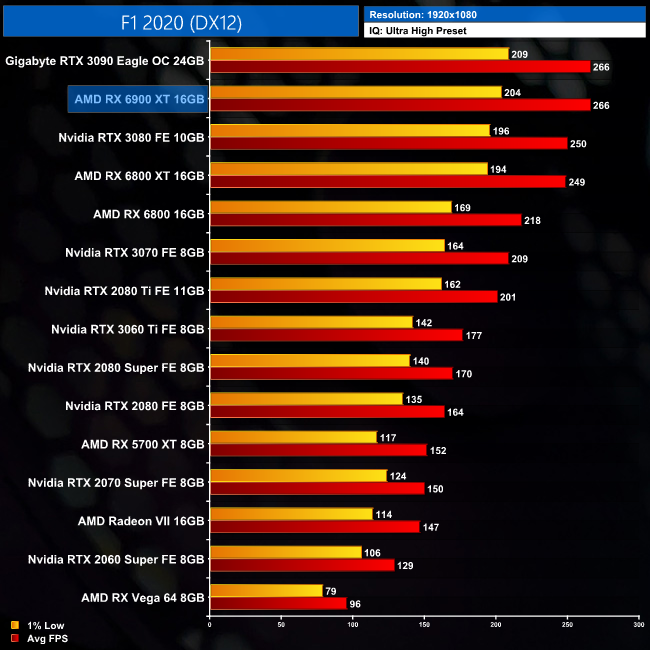
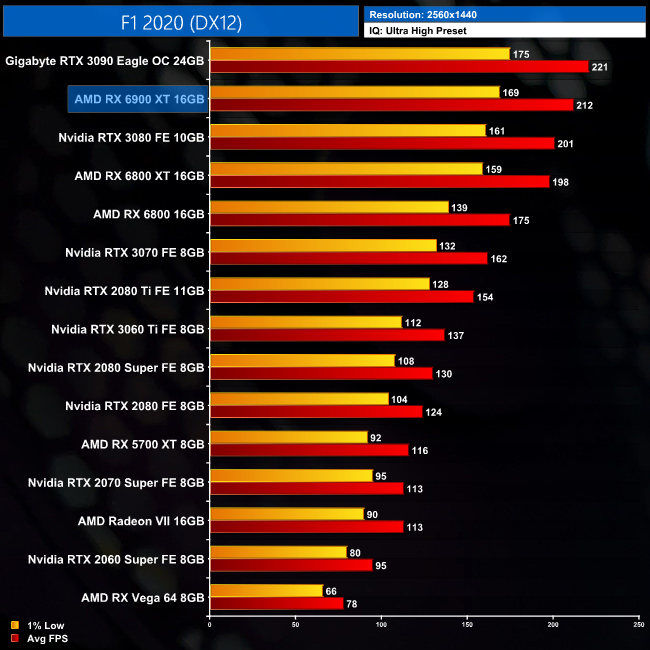
Next we come to F1 2020, and it's no surprise to see the 6900 XT pushing over 200FPS in this title when looking at the 1440p data. That puts it pretty neatly in between the RTX 3080 and 3090, as it is 5% faster than the 3080 but 4% behind the 3090.
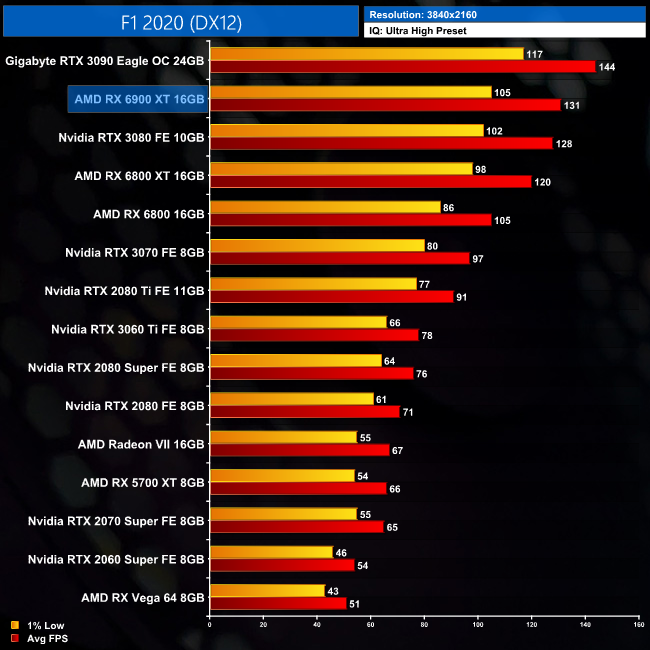
As for 4K, here the 6900 XT is 9% faster than the 6800 XT, but its lead over the RTX 3080 has been cut to just 2%. We can also see it has fallen 9% behind the RTX 3090.
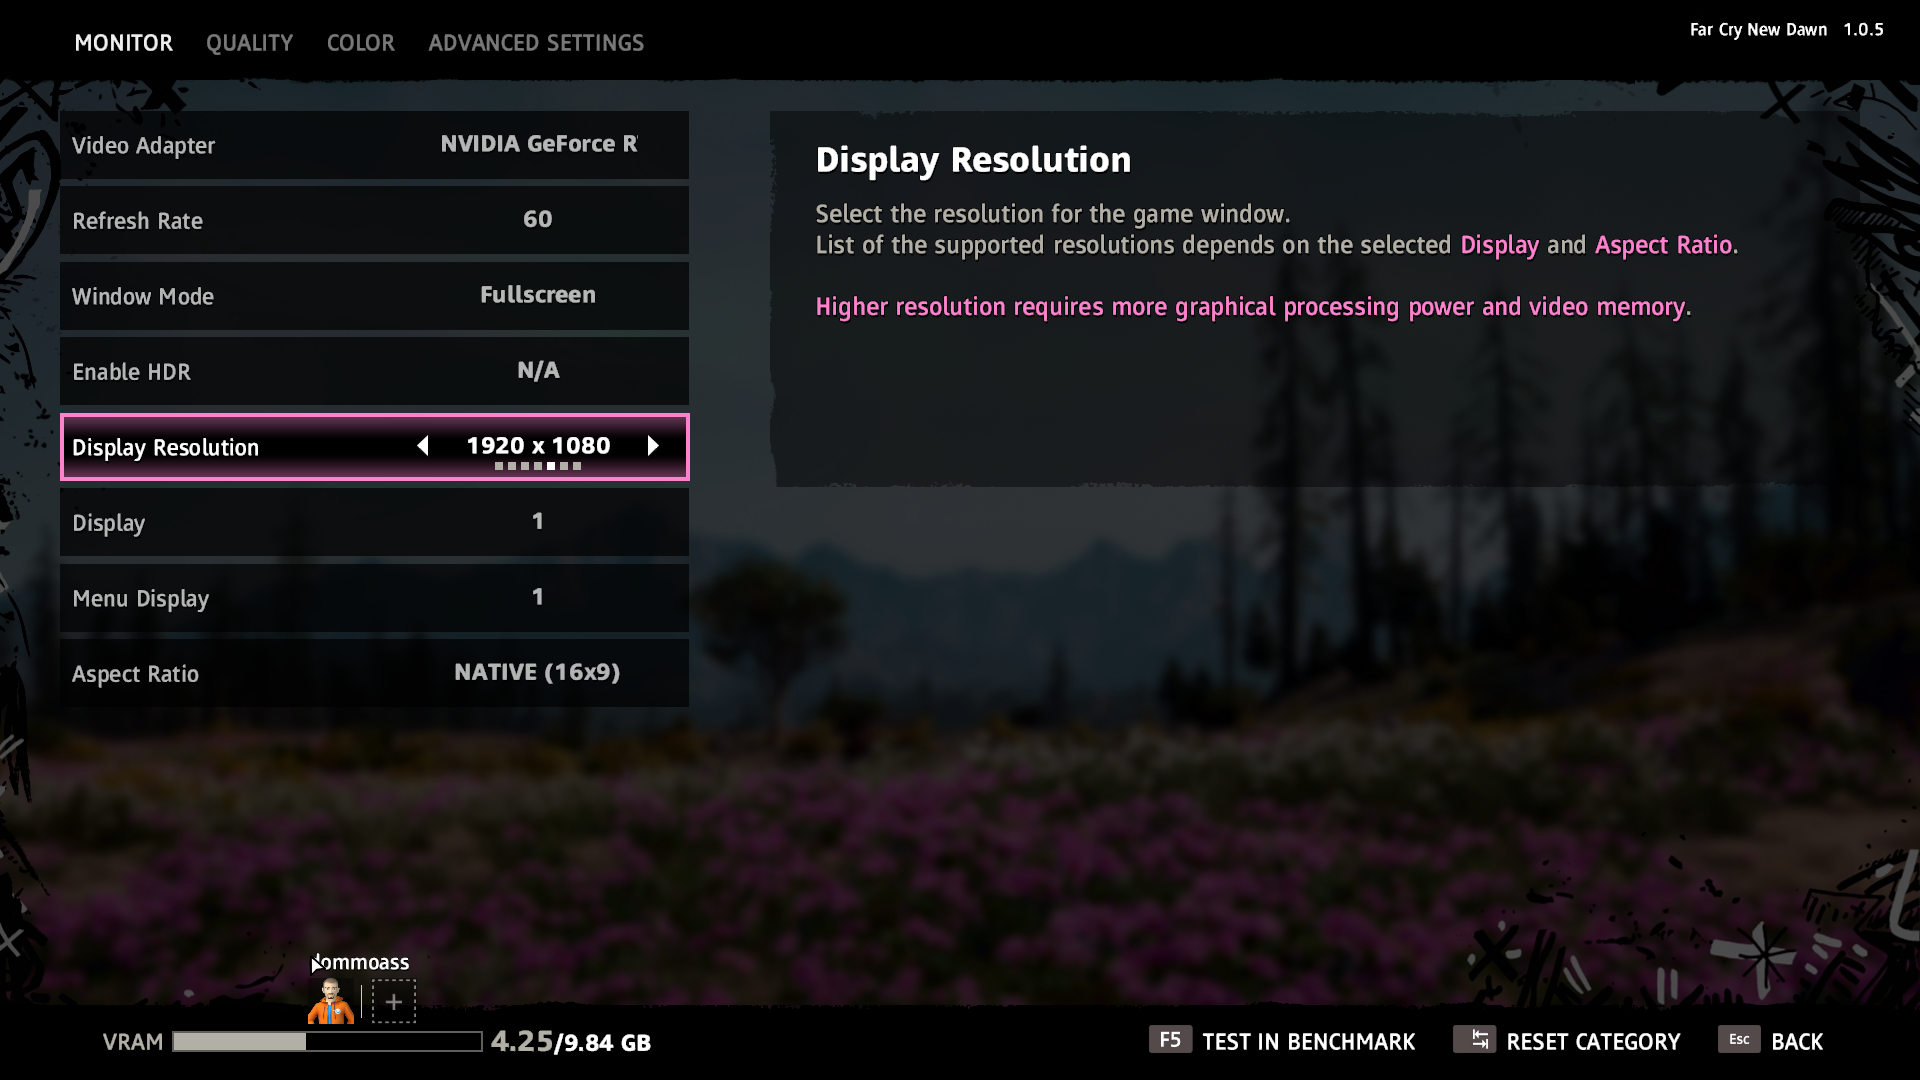
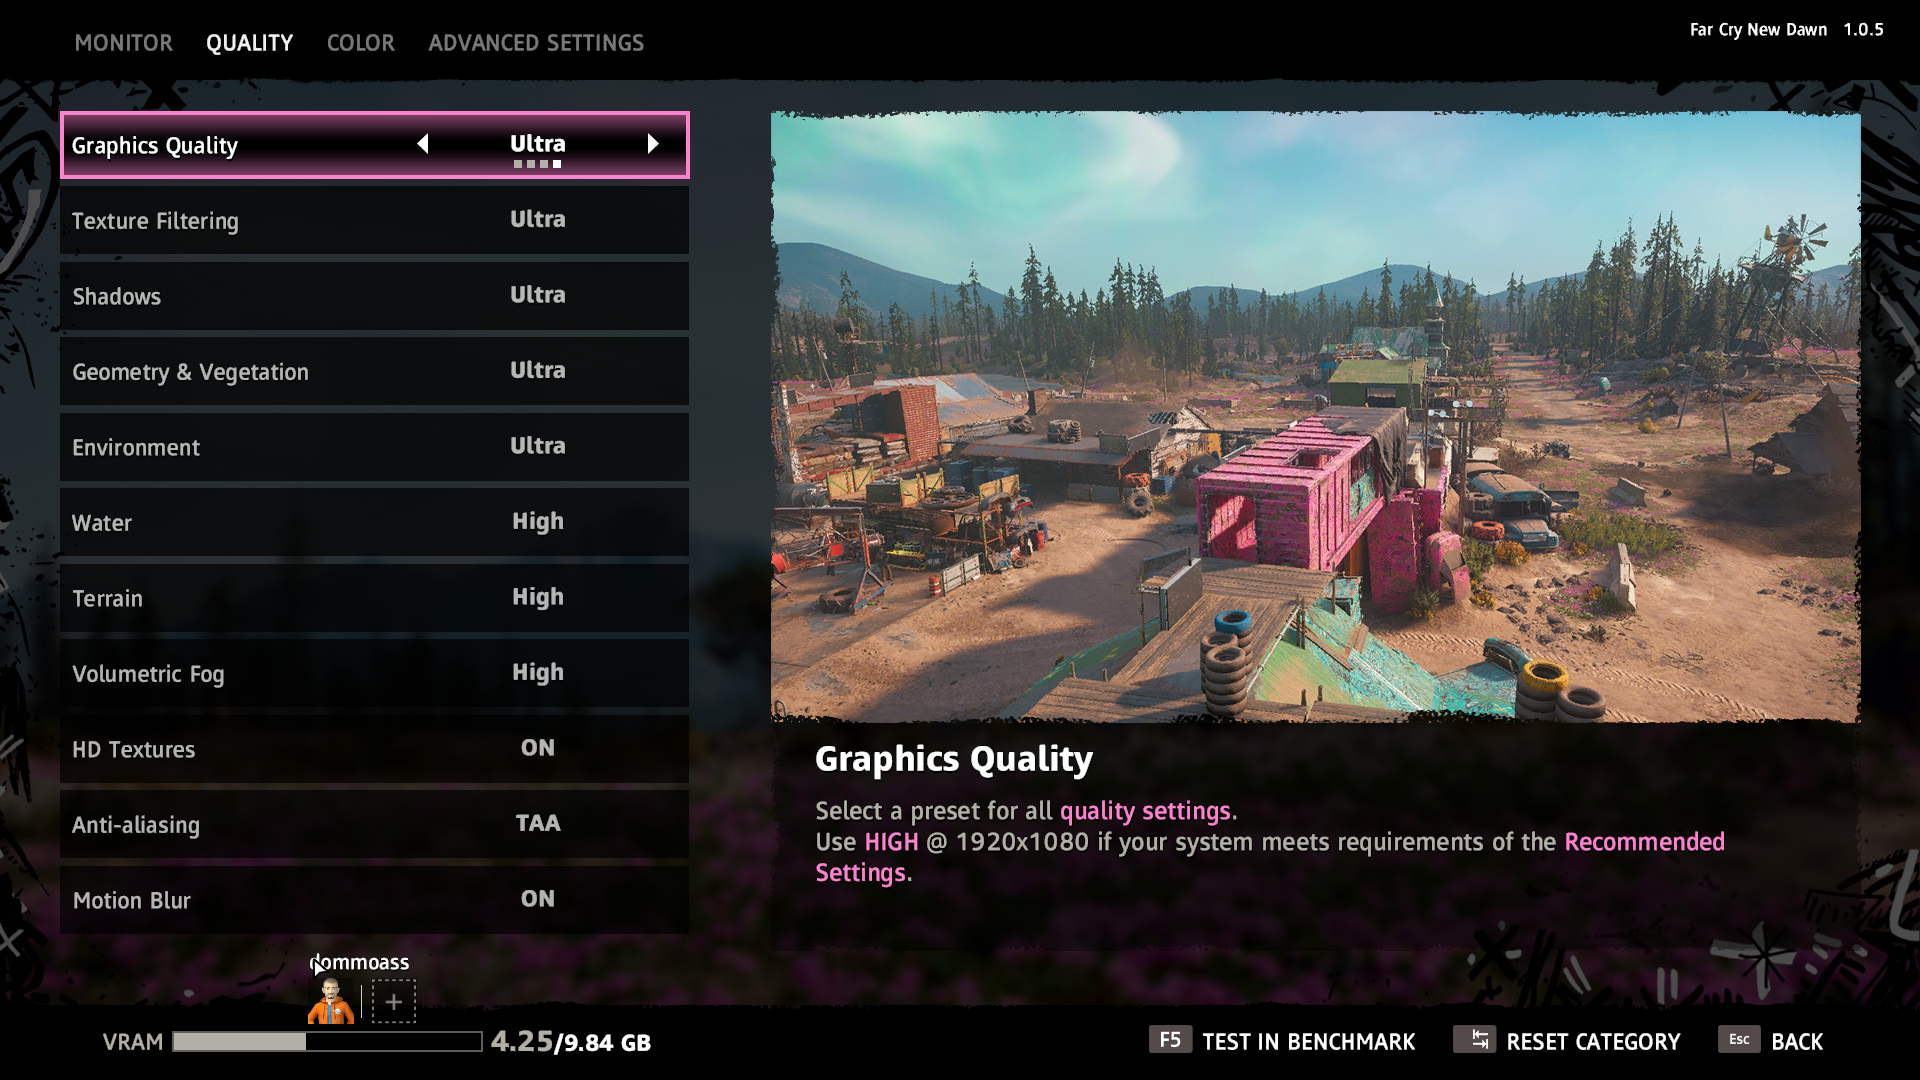
Far Cry New Dawn is an action-adventure first-person shooter developed by Ubisoft Montreal and published by Ubisoft. The game is a spin-off of the Far Cry series and a narrative sequel to Far Cry 5. It was released for Microsoft Windows, PlayStation 4 and Xbox One on February 15, 2019. (Wikipedia).
Engine: Dunia 2. We test using the Ultra preset, with the HD Textures pack, DX11 API.
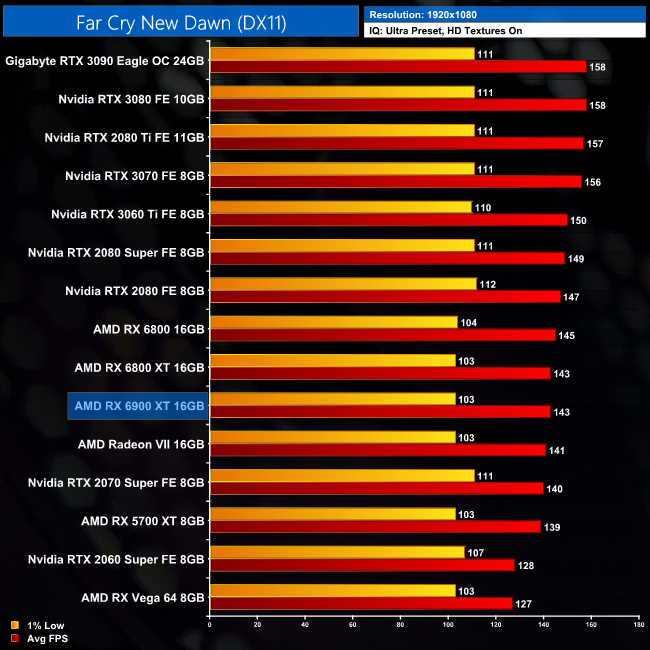
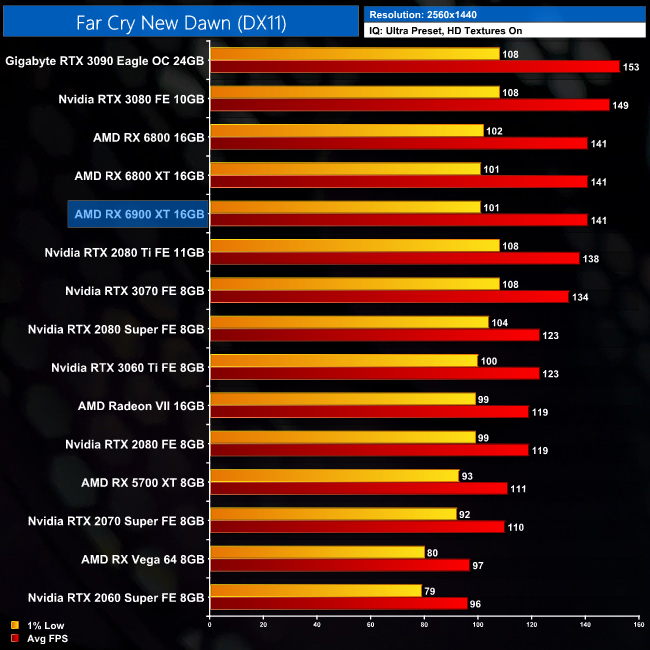
Looking at Far Cry New Dawn, even at 1440p there is a clear system bottleneck going on, as all three of AMD's RDNA 2-based GPUs are delivering identical performance.
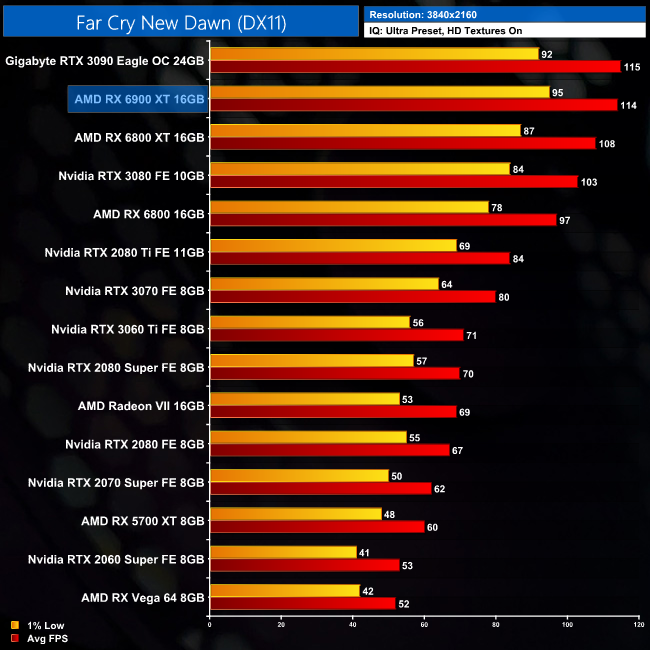
Stepping quickly up to 4K does paint a clearer picture, and it's a strong result for the 6900 XT. It averages 114FPS, just 1FPS behind the RTX 3090, so it's effectively tie. The AMD GPU is also 11% ahead of the RTX 3080 here.
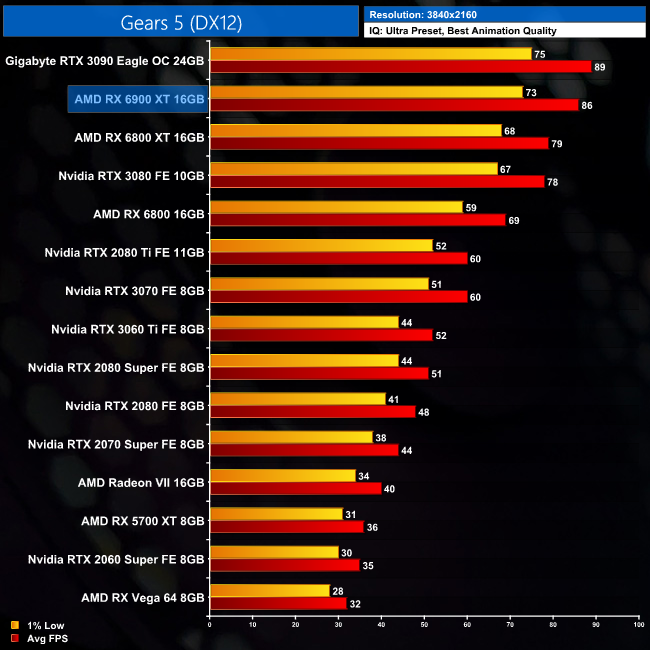
Gears 5 is a third-person shooter video game developed by The Coalition and published by Xbox Game Studios for Xbox One, Microsoft Windows and Xbox Series X. It is the fifth installment of the Gears of War series and the sequel to Gears of War 4. The ultimate edition was released on September 6, 2019, while the standard edition of the game was released worldwide on September 10, 2019. (Wikipedia).
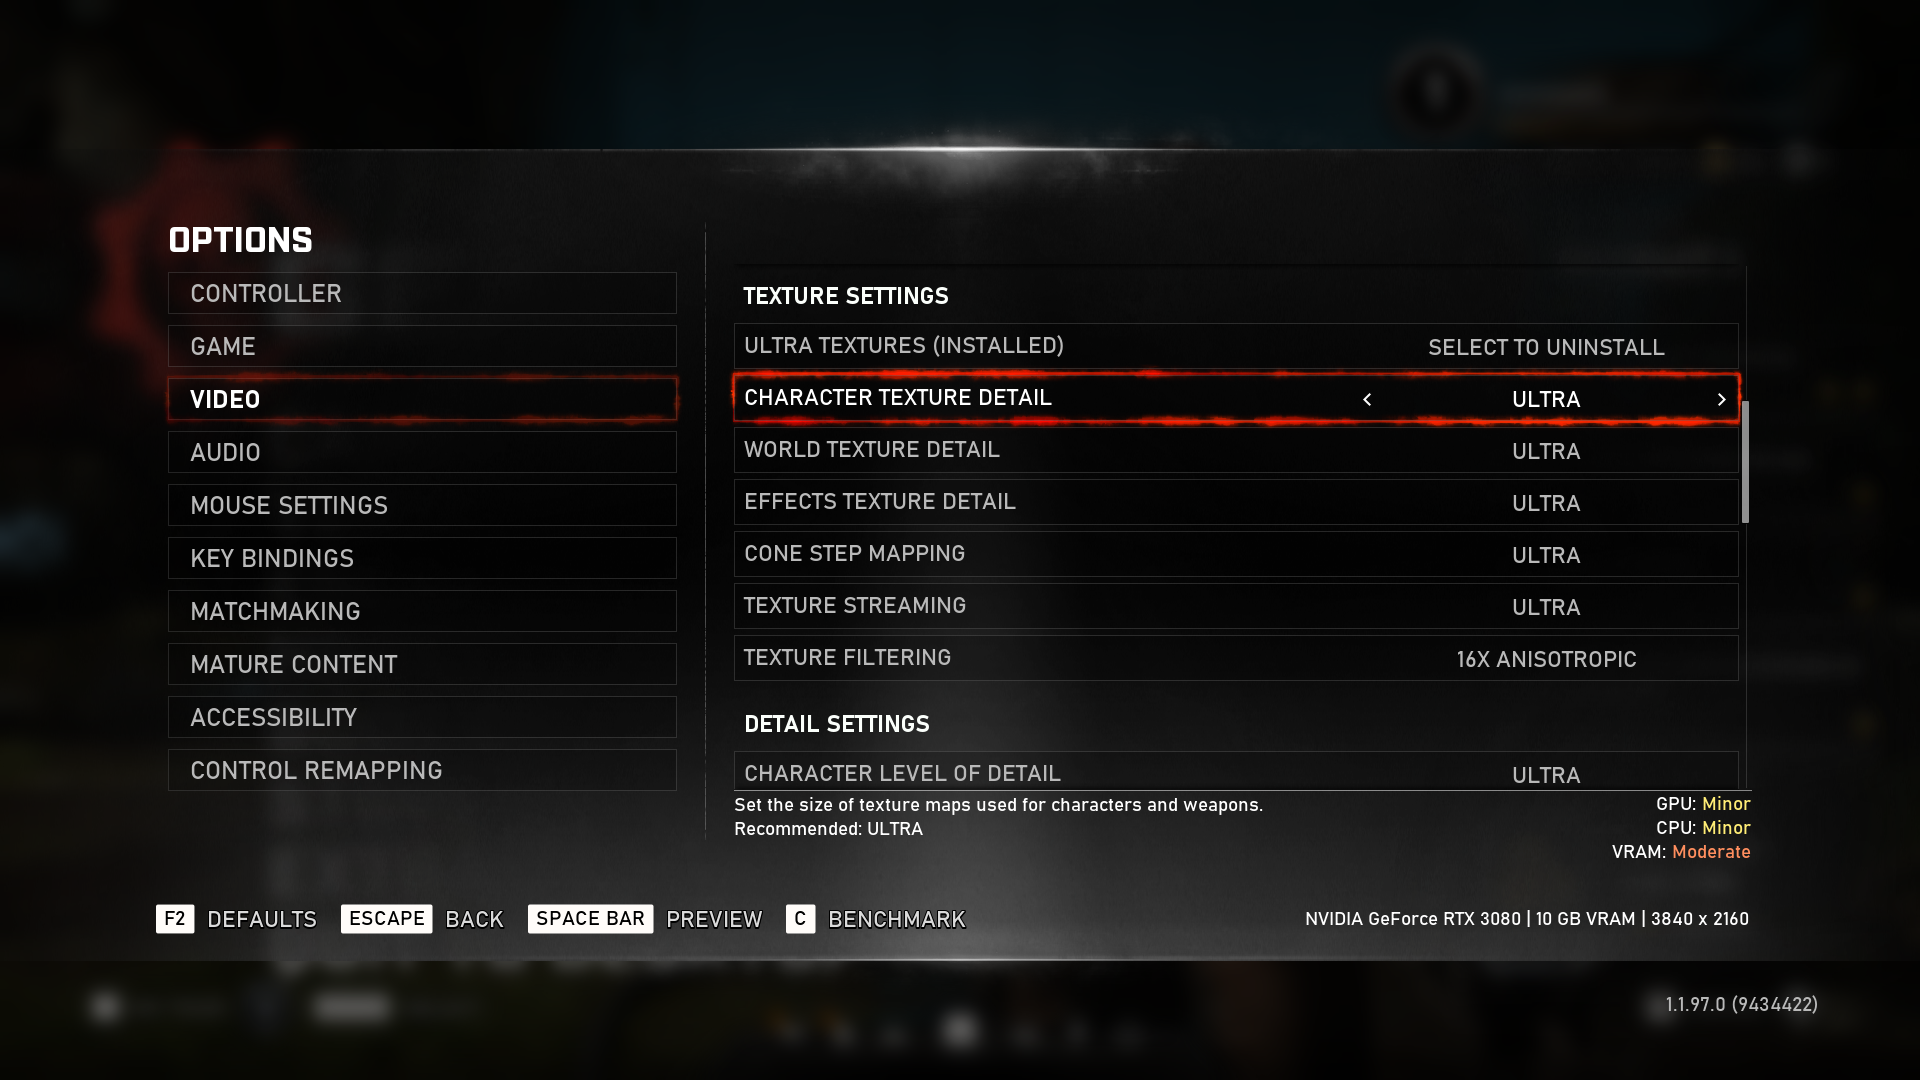
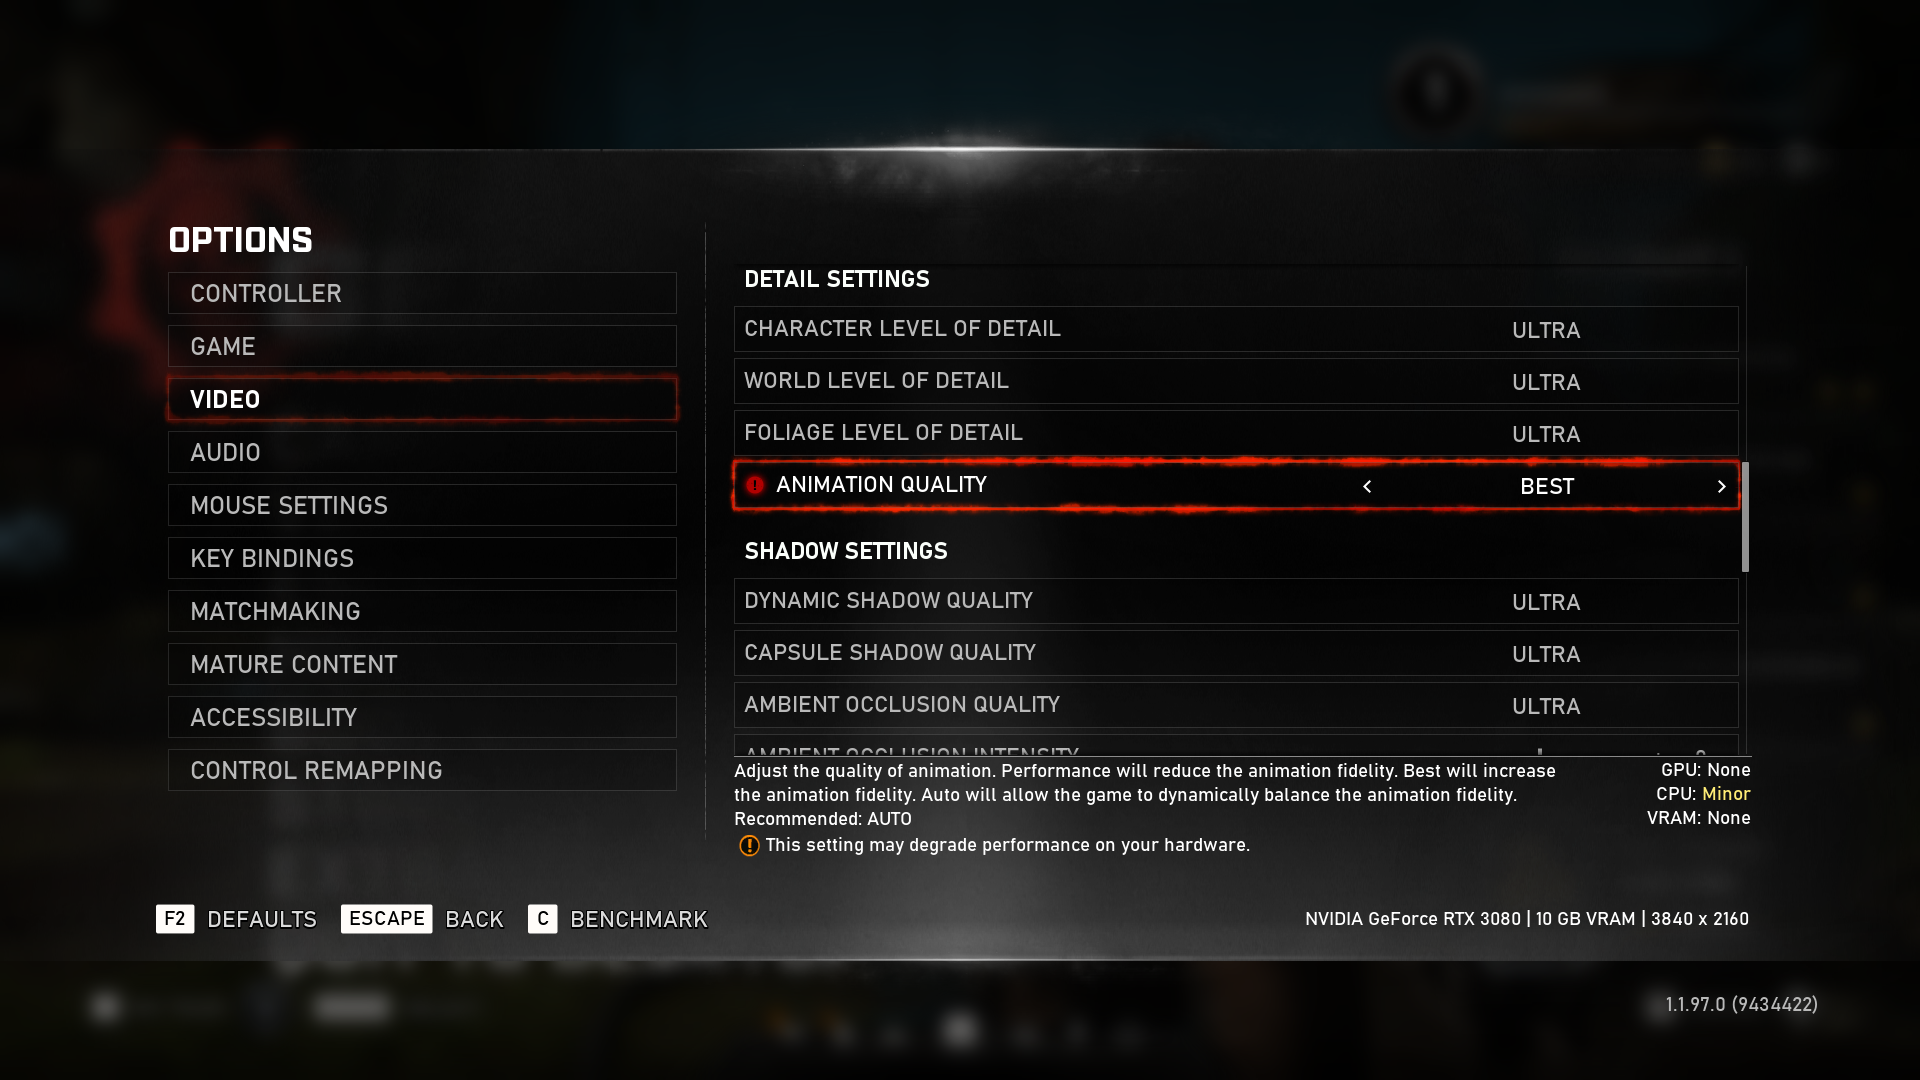
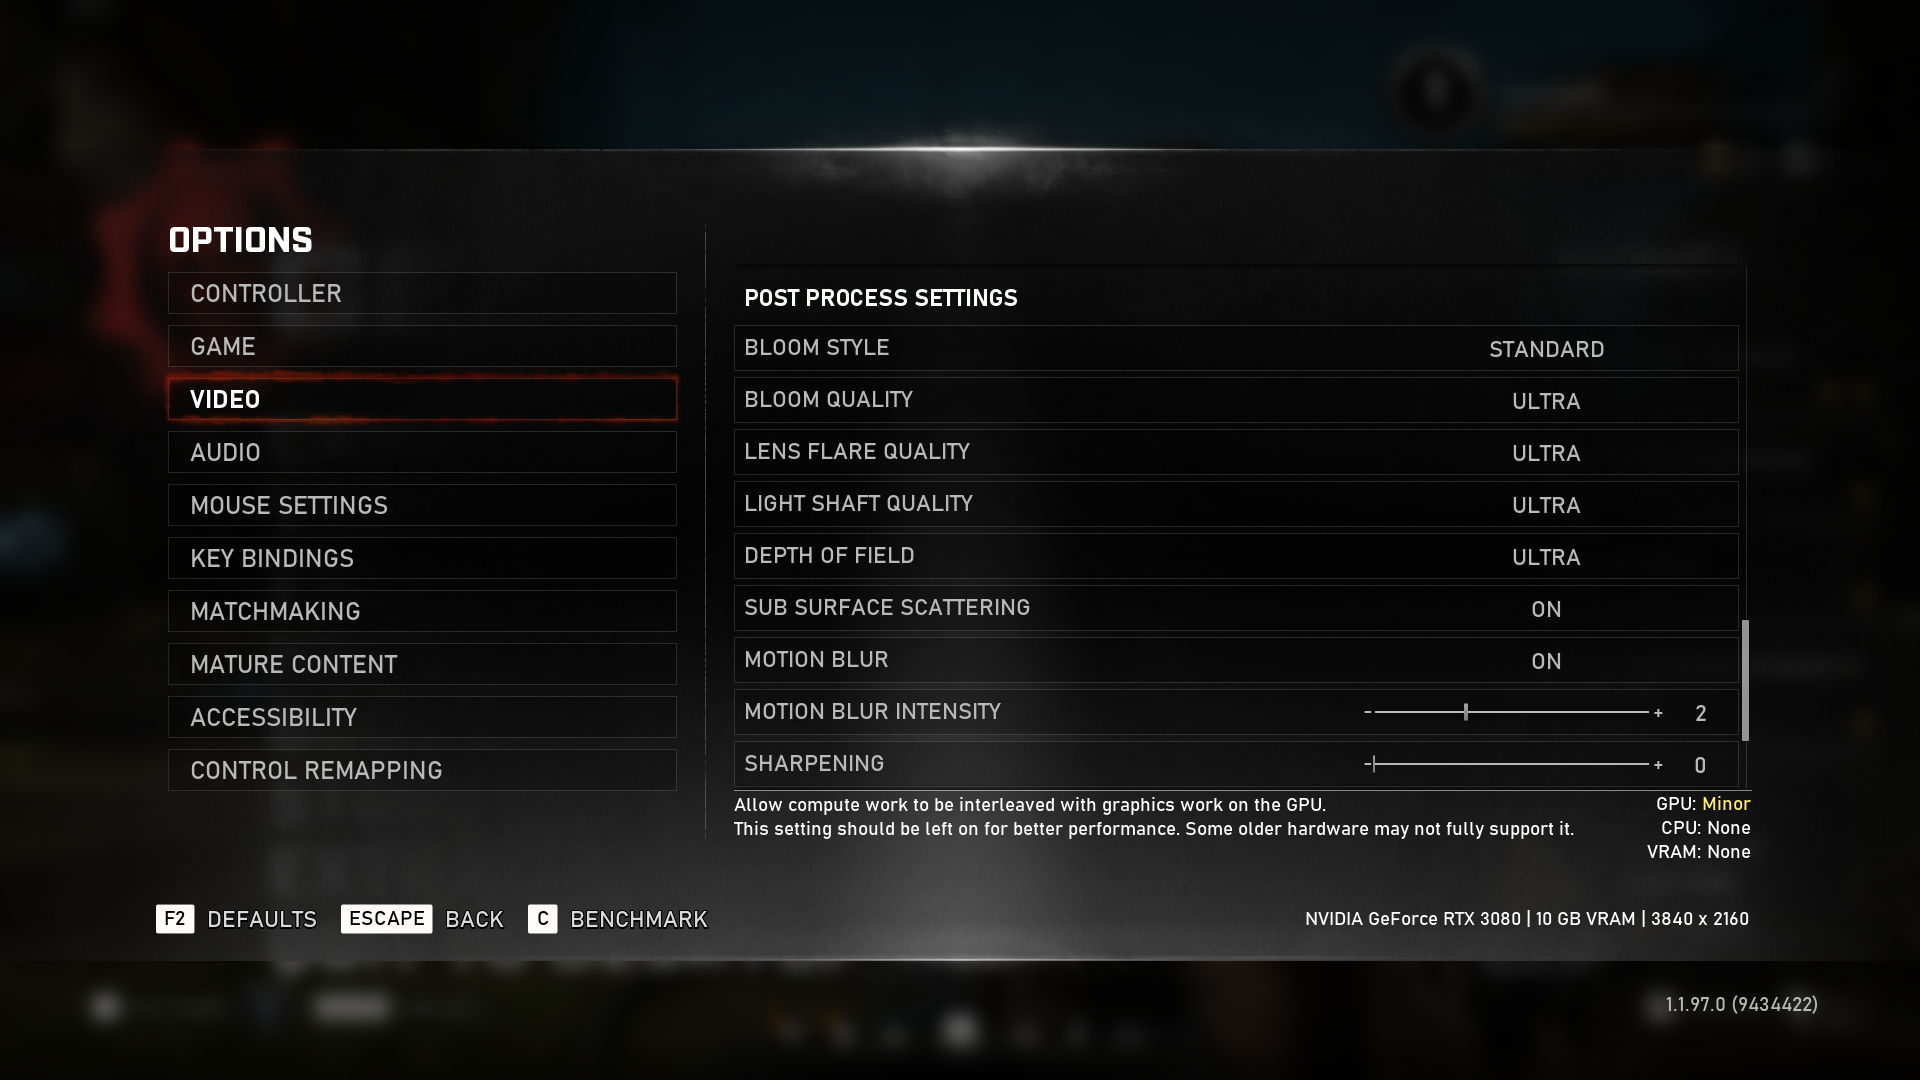
Engine: Unreal Engine 4. We test using the Ultra preset, with Best Animation Quality (instead of Auto), DX12 API.
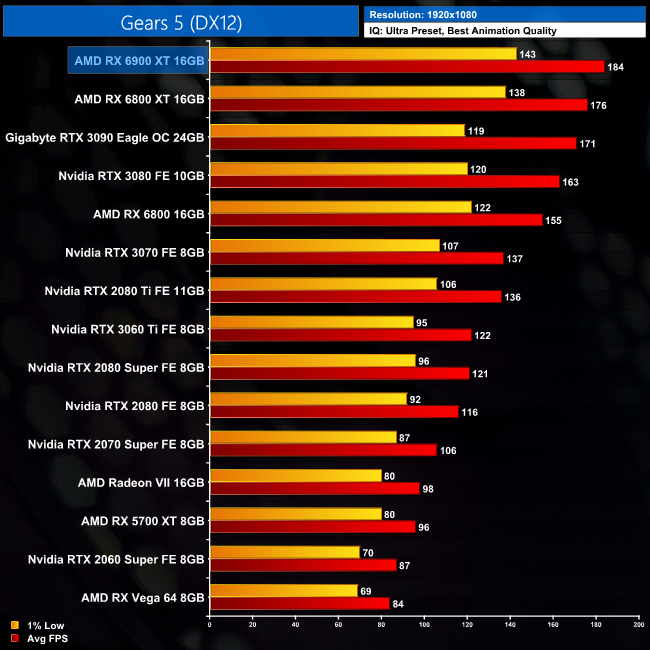
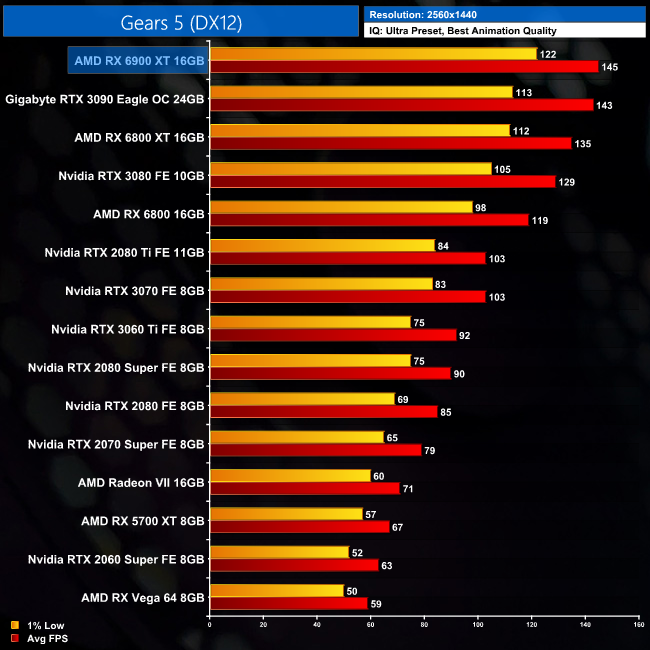
Next up, we come to Gears 5. The RX 6900 XT is topping the chart at 1440p, and while it's barely 1% faster than the RTX 3090 in terms of the average frame rate, its 1% low performance is 8% better than the 3090.
At 4K however, the 6900 XT drops back a bit, where it is now 3% behind the RTX 3090. That still puts it 9% ahead of the 6800 XT, and 10% ahead of the RTX 3080.
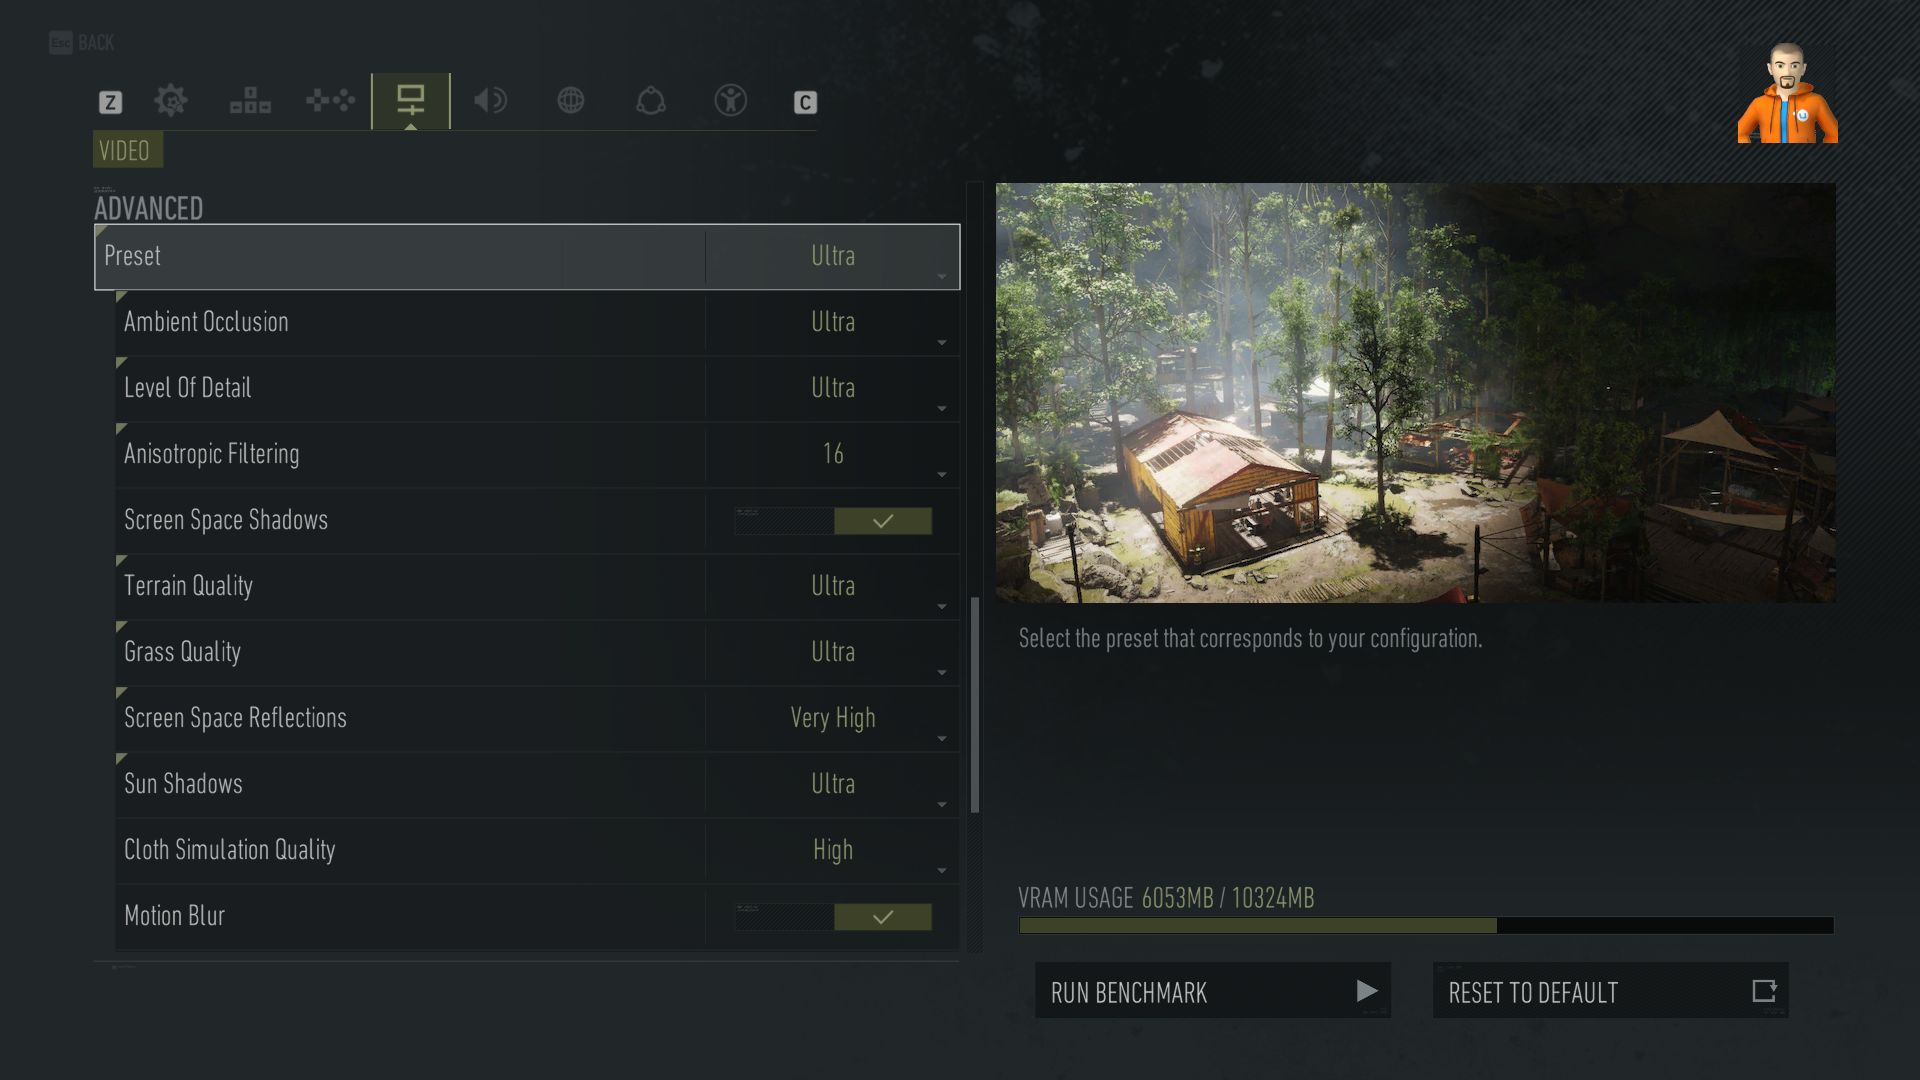
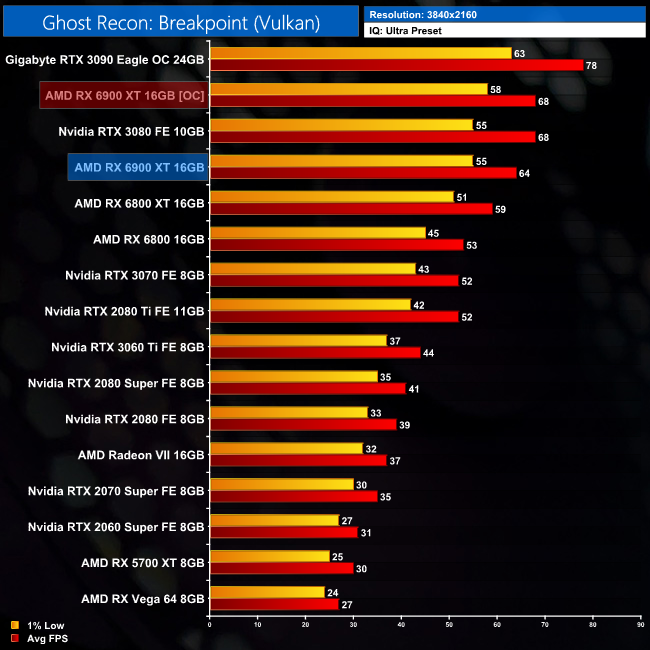
Tom Clancy's Ghost Recon Breakpoint is an online tactical shooter video game developed by Ubisoft Paris and published by Ubisoft. The game was released worldwide on 4 October 2019, for Microsoft Windows, PlayStation 4 and Xbox One, (Wikipedia).
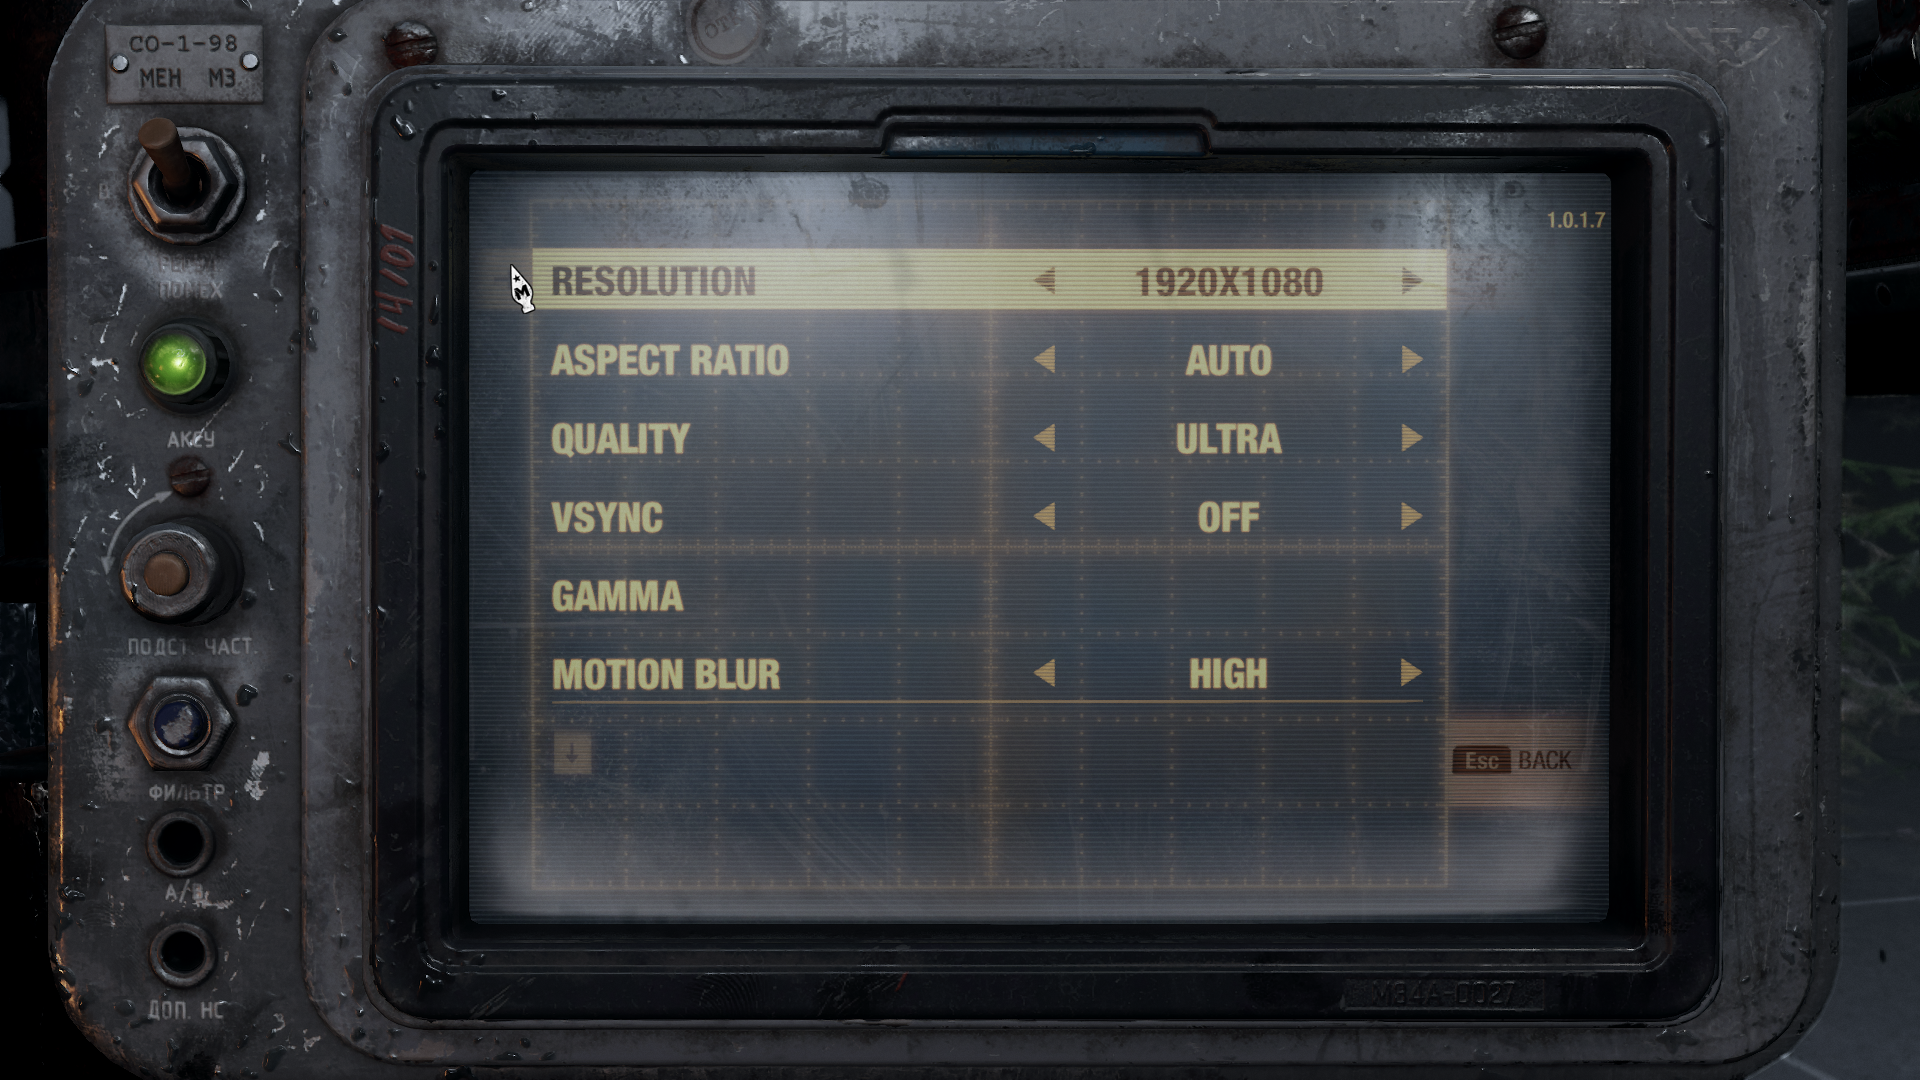
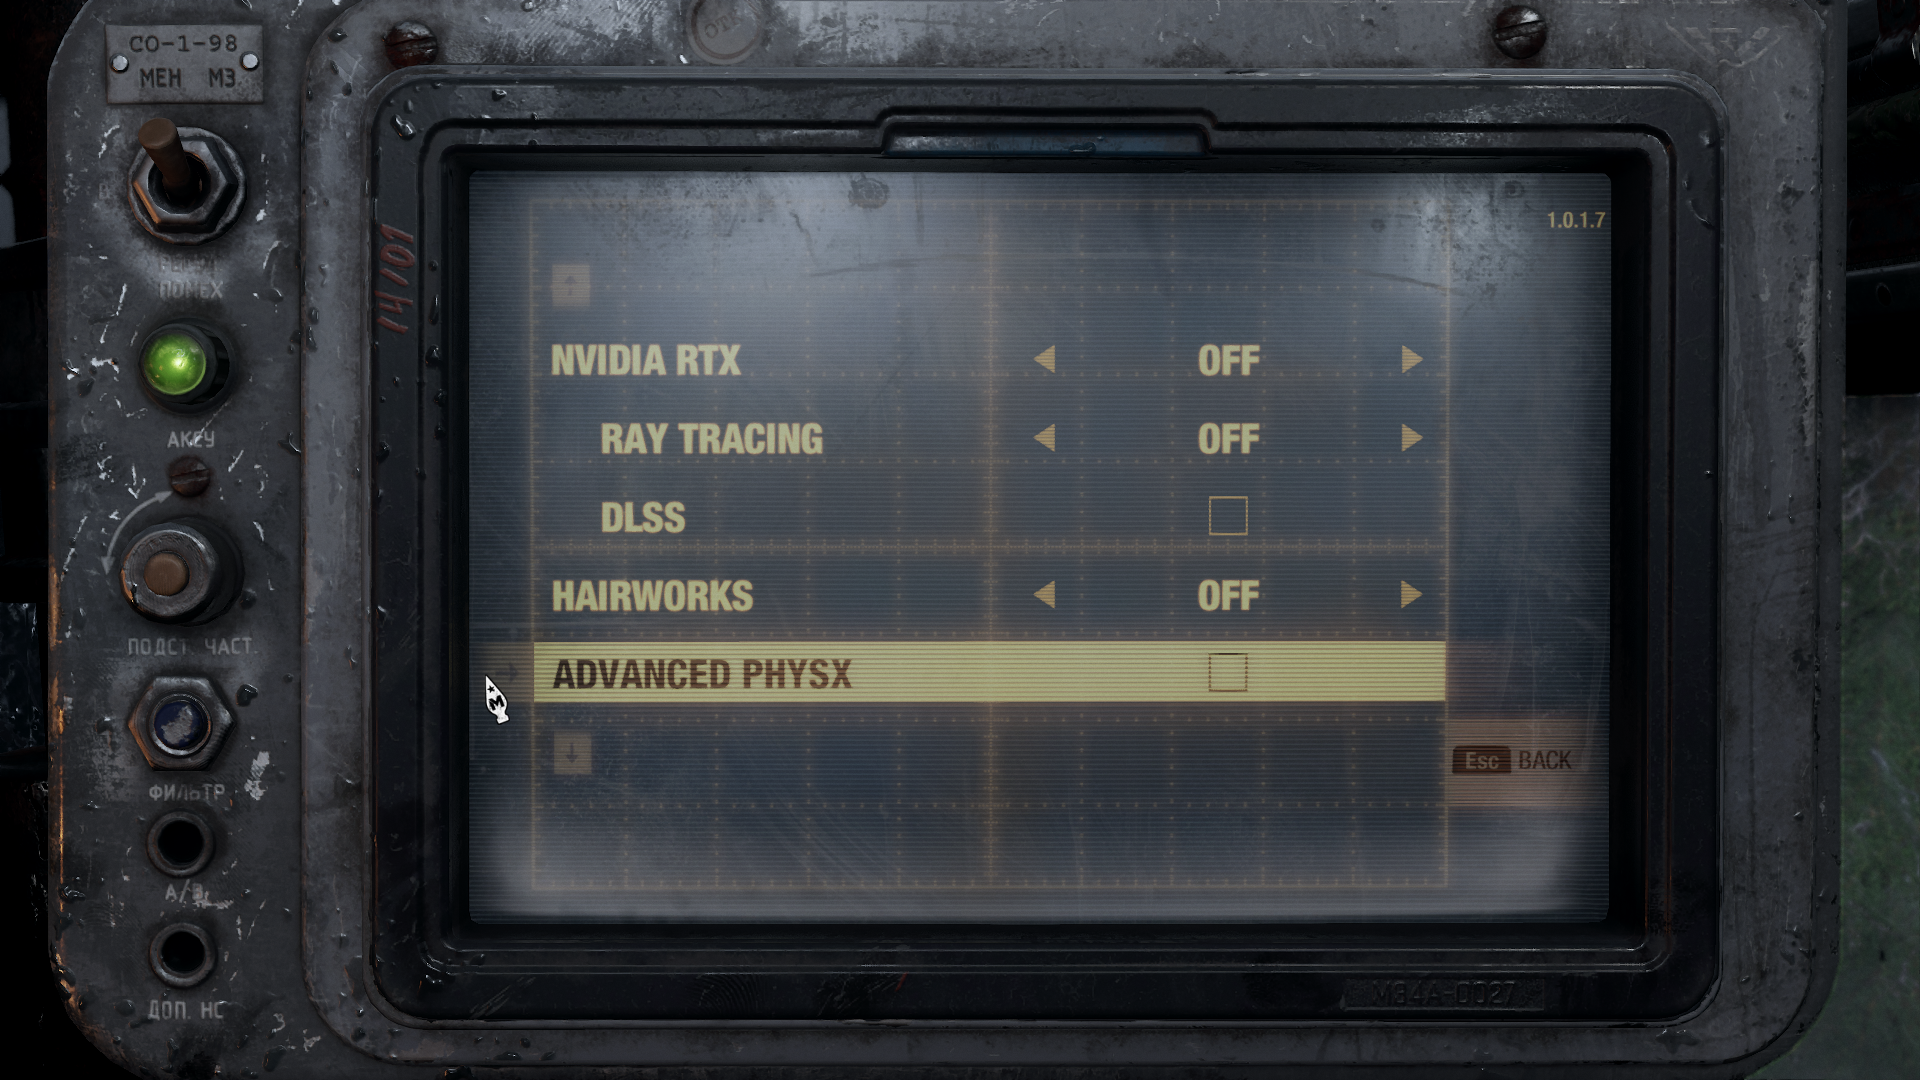
Engine: AnvilNext 2.0. We test using the Ultra preset, with AA disabled, Vulkan API.

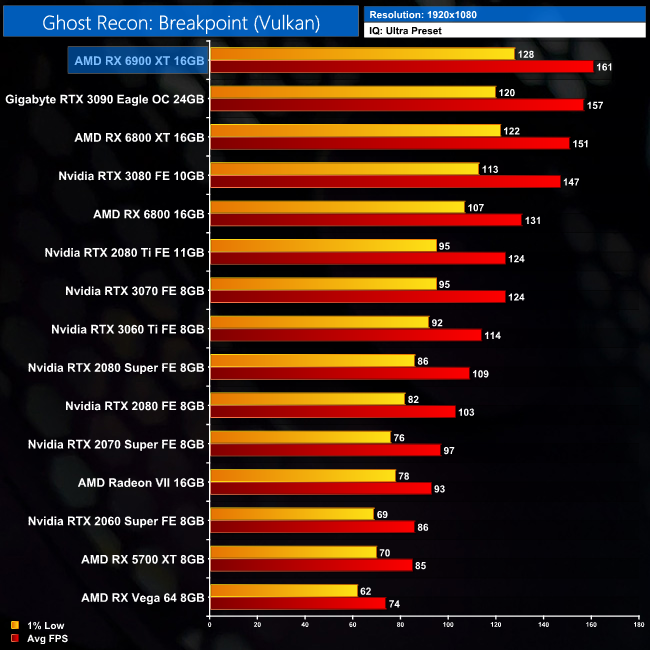
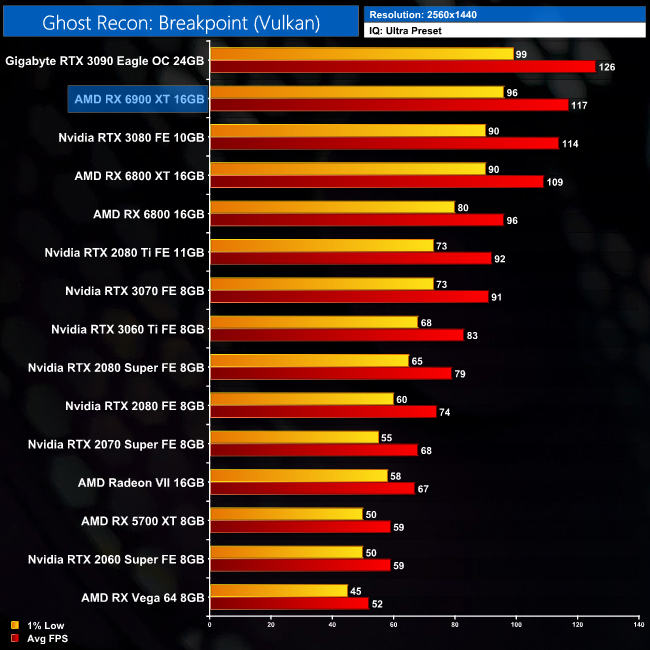
Now, Ghost Recon: Breakpoint is another AMD title, but Nvidia GPUs actually do pretty well in this one. At 1440p, the 6900 XT is just 3% faster than the RTX 3080, and it's 7% behind the RTX 3090.
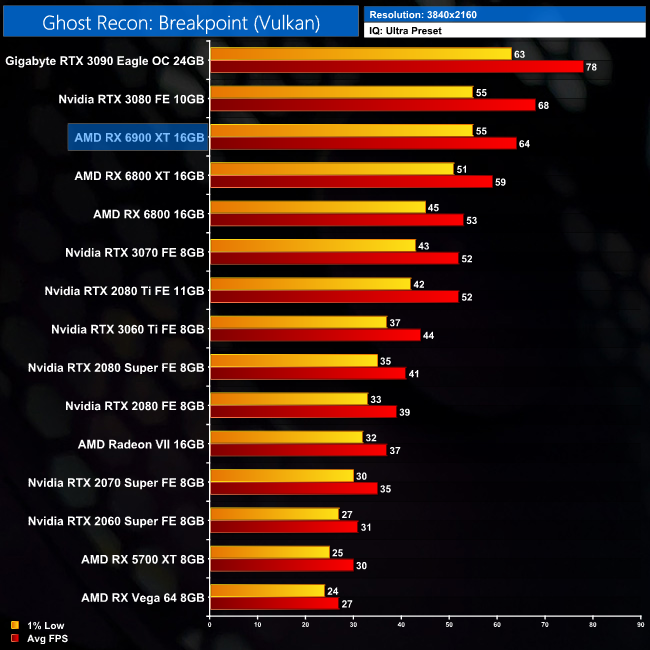
At 4K though, those Ampere GPUs do pull away, and the 6900 XT is 6% slower than the RTX 3080, and 18% slower than the RTX 3090. Compared to the 6800 XT, it's 8% faster.
Metro Exodus is a first-person shooter video game developed by 4A Games and published by Deep Silver in 2019. It is the third instalment in the Metro video game series based on Dmitry Glukhovsky's novels, following the events of Metro 2033 and Metro: Last Light. (Wikipedia).
Engine: 4A Engine. We test using the Ultra preset, but with Hairworks and Advanced PhysX turned off, DX12 API.
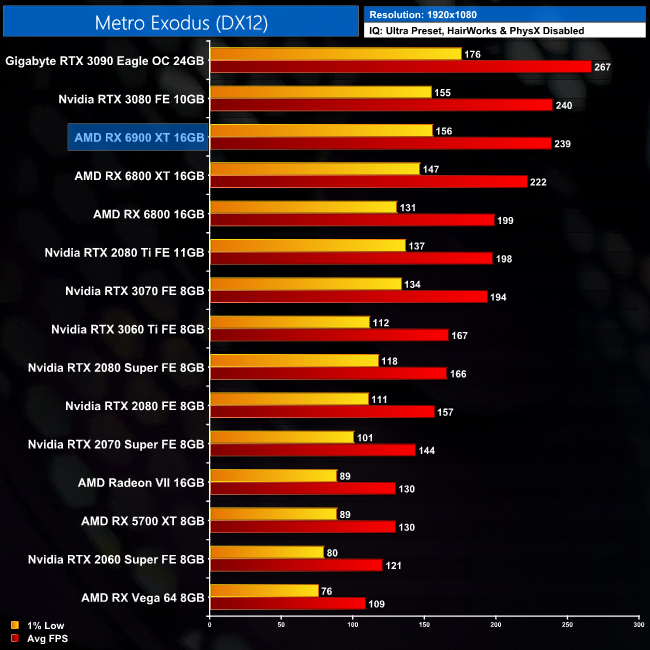
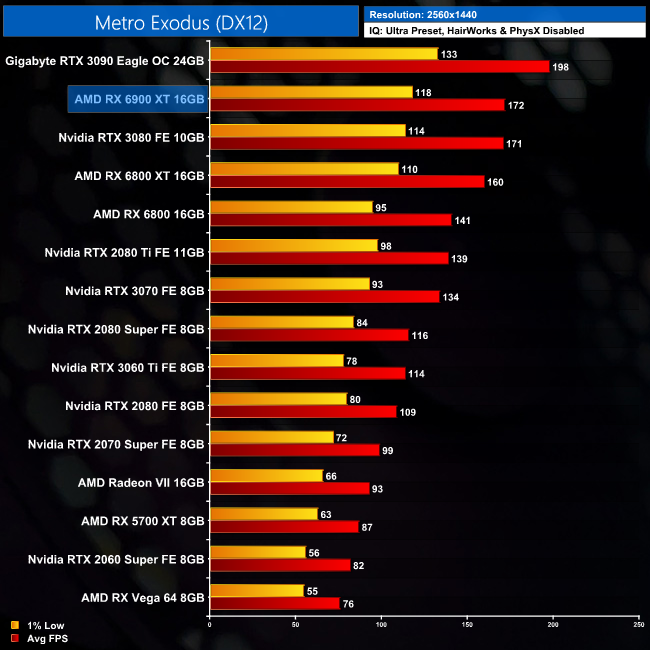
Looking at the 1440p data from Metro Exodus, we can see the 6900 XT is neck and neck with the RTX 3080, which means it is 8% faster than the 6800 XT, but still 13% slower than the RTX 3090.
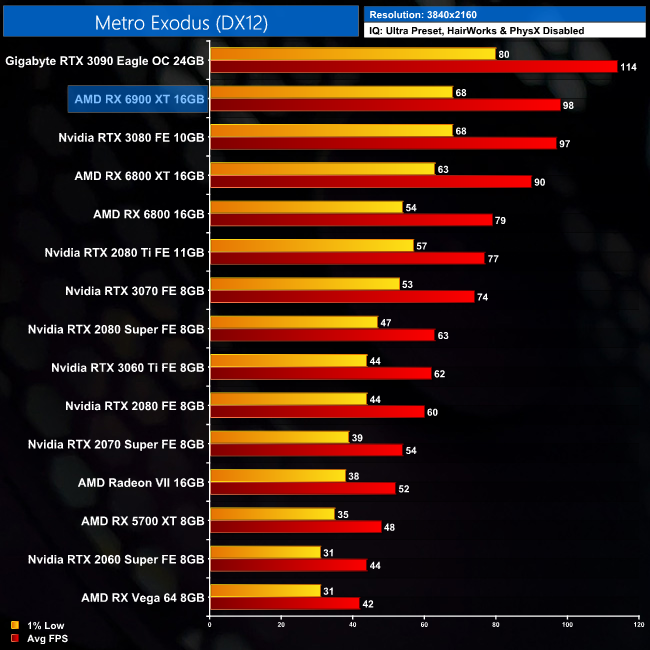
Up at 4K, the picture doesn't change. It's still a dead heat between the 6900 XT and RTX 3080, while the RTX 3090 is clearly the fastest GPU in this title, by a 14% margin.
Middle-earth: Shadow of War is an action role-playing video game developed by Monolith Productions and published by Warner Bros. Interactive Entertainment. It is the sequel to 2014’s Middle-earth: Shadow of Mordor, and was released worldwide for Microsoft Windows, PlayStation 4, and Xbox One on October 10, 2017. (Wikipedia).
Engine: LithTech Firebird. We test using the Very High preset, DX11 API.
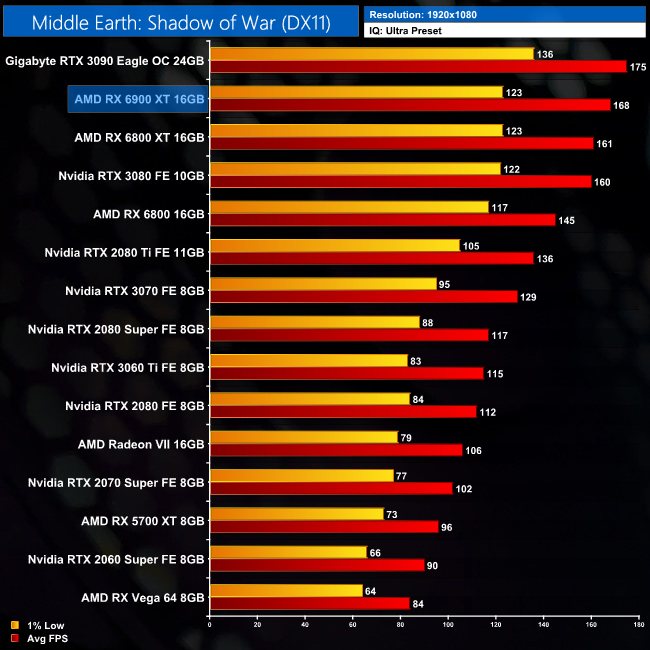

As for Middle Earth: Shadow of War, things look promising for the 6900 XT at 1440p, where it is 10% faster than the RTX 3080, and only 2% behind the RTX 3090.
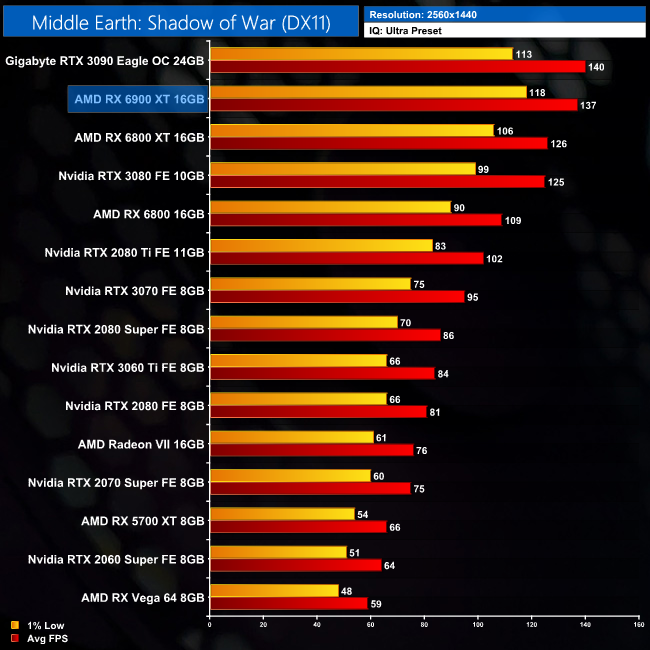
Things change pretty significantly at 4K however, and the 6900 XT is now on equal footing with the RTX 3080, so it's lead at 1440p has completely evaporated. Meanwhile, it's also 12% slower than the RTX 3090 here.
Red Dead Redemption 2 is a 2018 action-adventure game developed and published by Rockstar Games. The game is the third entry in the Red Dead series and is a prequel to the 2010 game Red Dead Redemption. Red Dead Redemption 2 was released for the PlayStation 4 and Xbox One in October 2018, and for Microsoft Windows and Stadia in November 2019. (Wikipedia).
Engine: Rockstar Advance Game Engine (RAGE). We test by manually selecting Ultra settings (or High where Ultra is not available), TAA, Vulkan API.


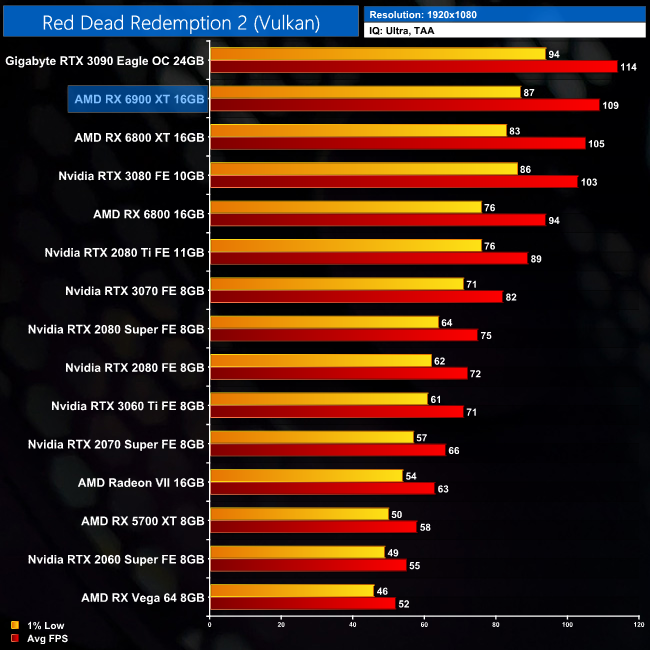
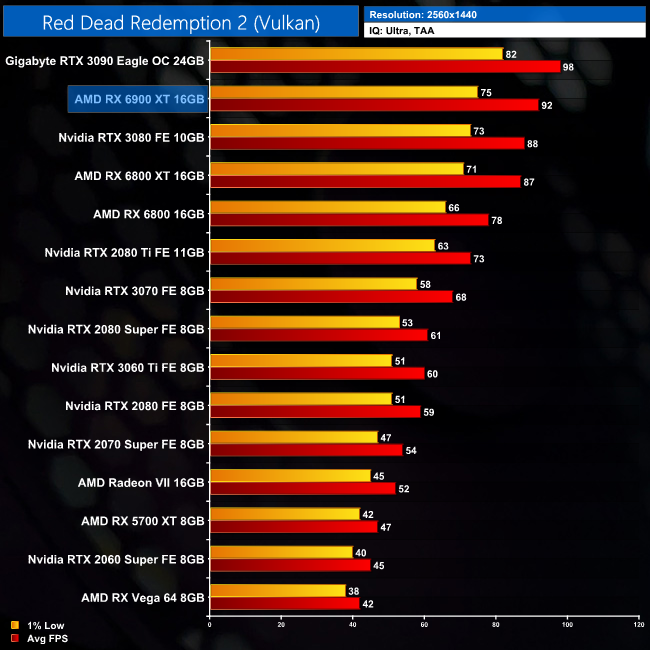
Read Dead Redemption 2 is always an interesting one to look at, and at 1440p the 6900 XT slots right between the RTX 3080 and 3090. It's 5% faster than the 3080, but 6% slower than the 3090.
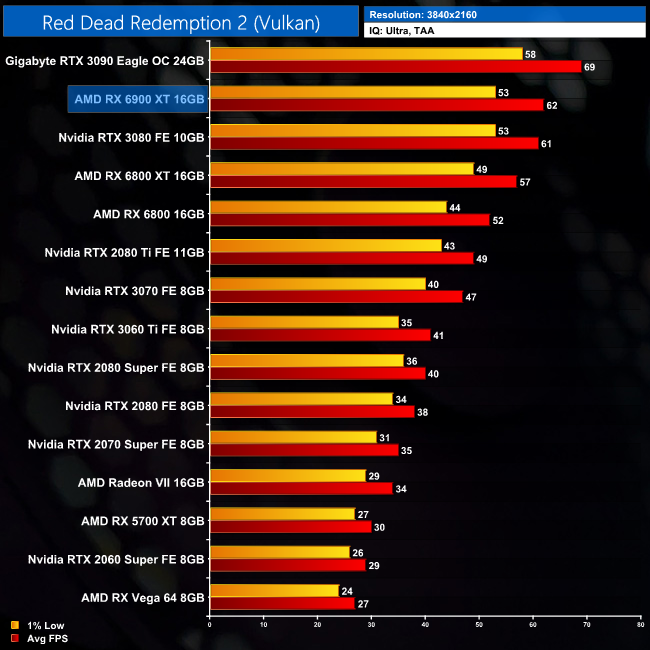
Stepping up to 4K sees Ampere come on strong, and the 6900 XT is now just 2% ahead of the RTX 3080, so that's pretty negligible. Compared to the RTX 3090, it is 10% slower, and we're looking at another 9% uplift from the 6800 XT.
Shadow of the Tomb Raider is an action-adventure video game developed by Eidos Montréal in conjunction with Crystal Dynamics and published by Square Enix. It continues the narrative from the 2013 game Tomb Raider and its sequel Rise of the Tomb Raider, and is the twelfth mainline entry in the Tomb Raider series. The game released worldwide on 14 September 2018 for Microsoft Windows, PlayStation 4 and Xbox One. (Wikipedia).
Engine: Foundation Engine. We test using the Highest preset, with TAA, DX12 API.
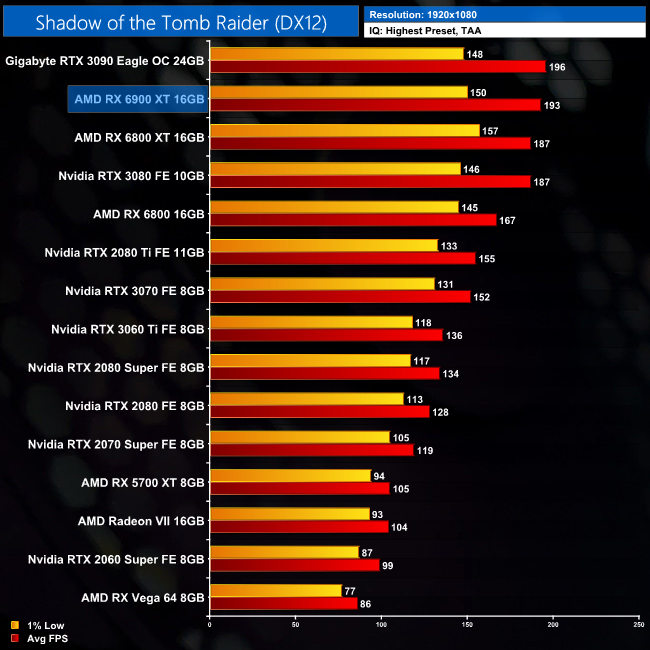
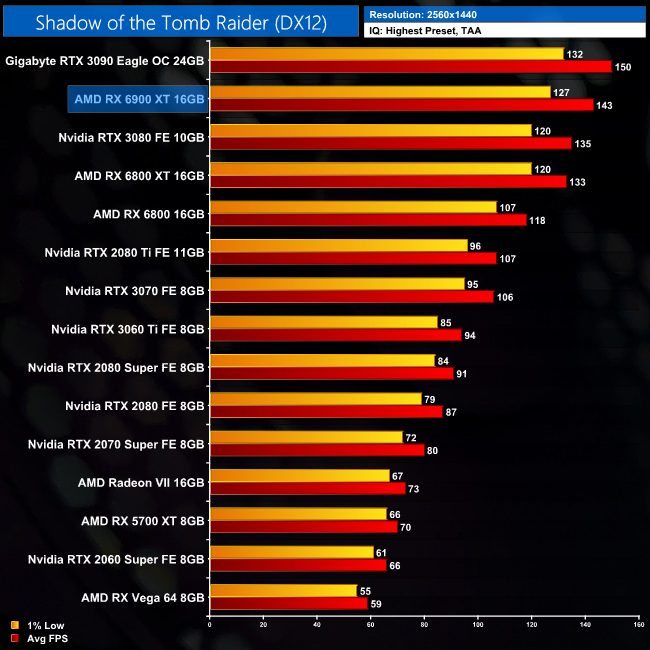
Looking at Shadow of the Tomb Raider, the overall trend here is pretty similar to Red Dead Redemption 2. At 1440p, the 6900 XT is 6% faster than the RTX 3080, but 5% slower than the RTX 3090.
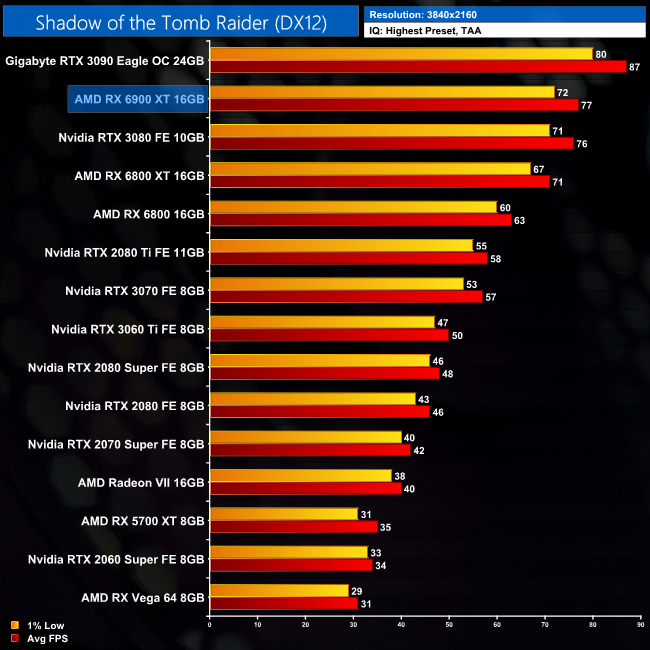
And then again at 4K, Ampere comes on strong, and we can see the RTX 3080 and 6900 XT are now effectively matched, delivering 76-77FPS on average. The 6900 XT is also 11% slower than the RTX 3090.
Total War Saga: Troy is a 2020 turn-based strategy video game developed by Creative Assembly Sofia and published by Sega. The game was released for Windows on 13 August 2020 as the second installment in the Total War Saga subseries, succeeding Thrones of Britannia (2018). (Wikipedia).
Engine: TW 3 Engine. We test using the Ultra preset, DX11 API.
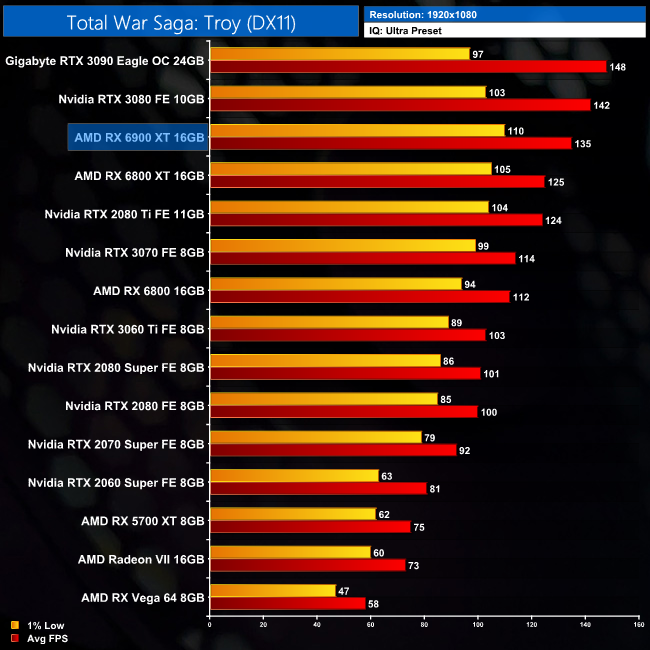
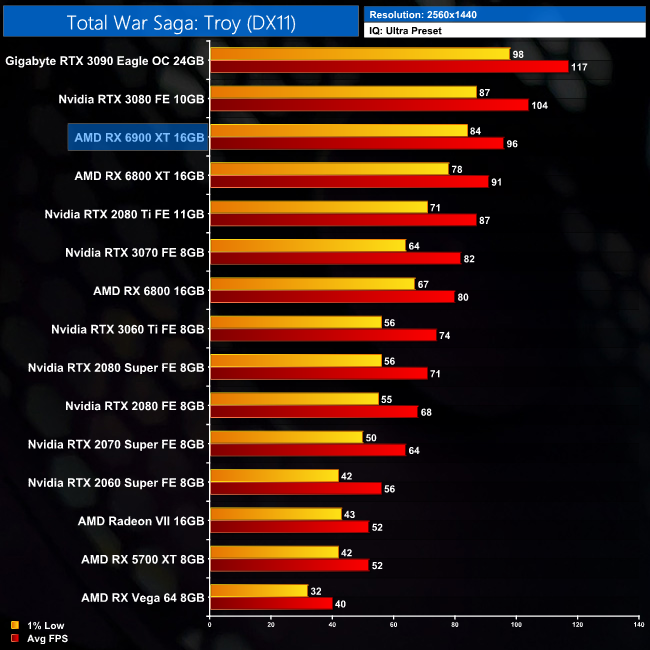
Total War games are well known to prefer Nvidia GPUs, and that is clearly on show in Total War Saga: Troy. At 1440p, the 6900 XT is 8% slower than the RTX 3080, and it's 18% behind the RTX 3090, which is, relatively speaking, one of its worst results from the 14 games we benchmarked.
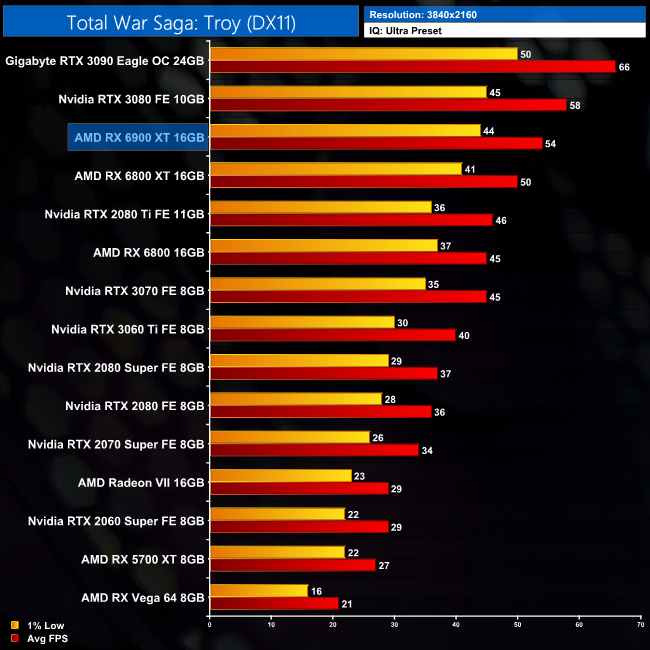
At 4K, that trend holds true, as the 6900 XT is still 18% behind the RTX 3090, and 7% slower than the RTX 3080. This means it is 8% faster than the 6800 XT.
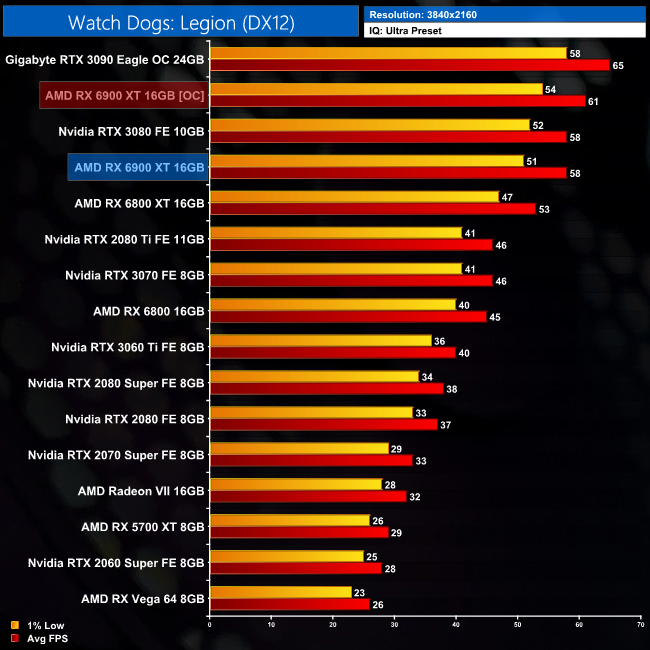
Watch Dogs: Legion is a 2020 action-adventure game published by Ubisoft and developed by its Toronto studio. It is the third instalment in the Watch Dogs series, and the sequel to 2016's Watch Dogs 2. Legion was released on October 29, 2020 for Microsoft Windows, PlayStation 4, Xbox One, and Stadia. (Wikipedia).
Engine: Disrupt. We test using the Ultra preset, DX12 API.

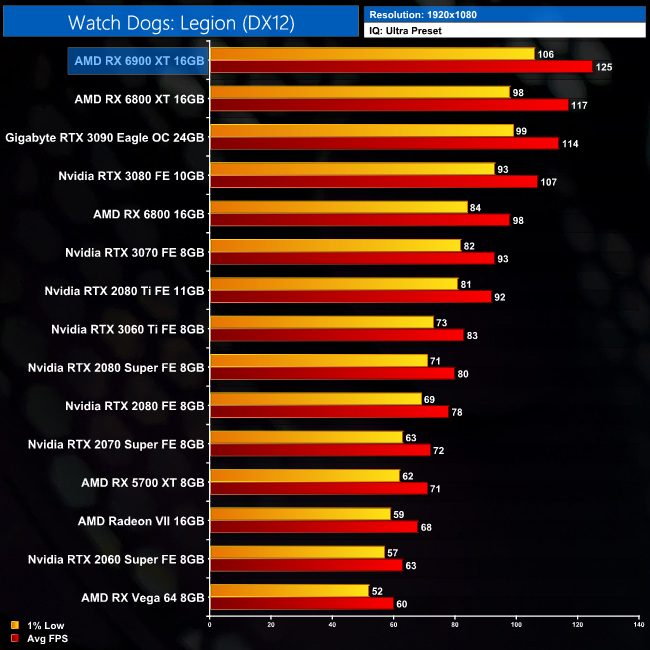

Our final game is Watch Dogs: Legion, and at 1440p the 6900 XT delivers an excellent result, hitting 97FPS on average. This puts it 11% ahead of the RTX 3080, while it is on par with the RTX 3090.
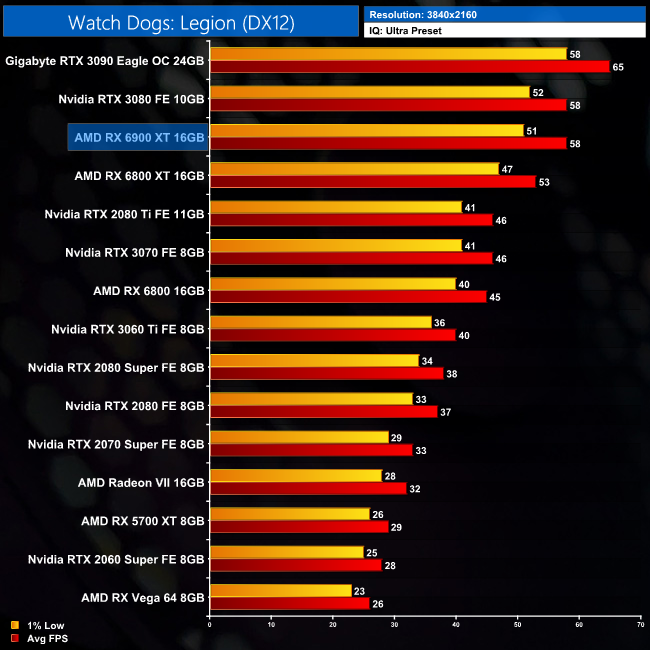
At 4K however, as we have come to expect, the Nvidia GPUs do catch up. Both the 6900 XT and RTX 3080 average 58FPS, so they're dead even, but the AMD GPU is now 11% slower than the RTX 3090.
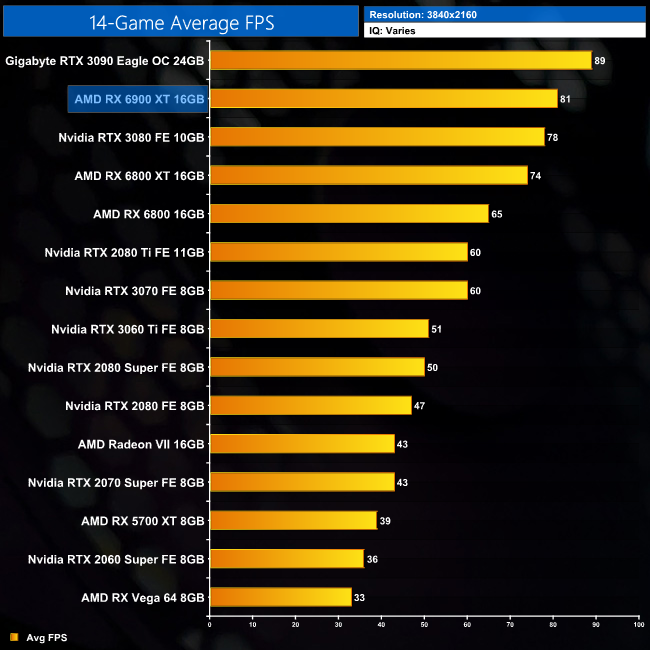
Here we present frame rate figures for each graphics card, averaged across all 14 games on test today. These figures can disguise significant variations in performance from game to game, but provide a useful overview of the sort of performance you can expect at each resolution tested.
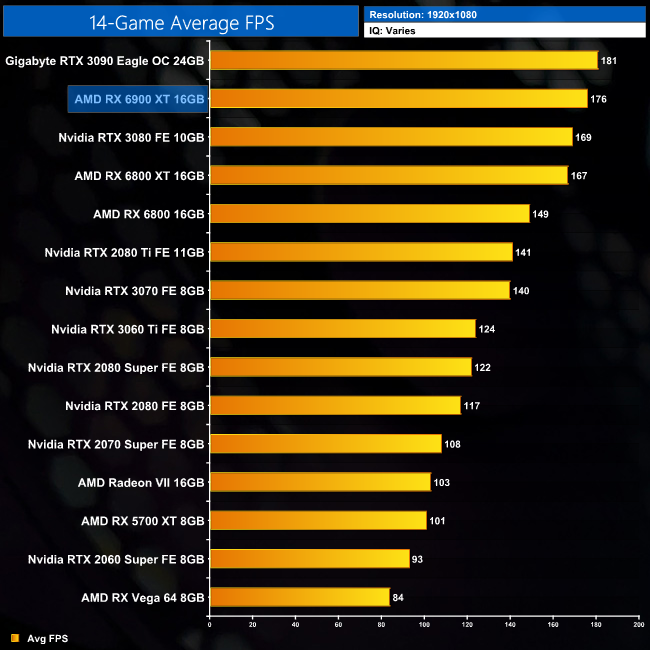
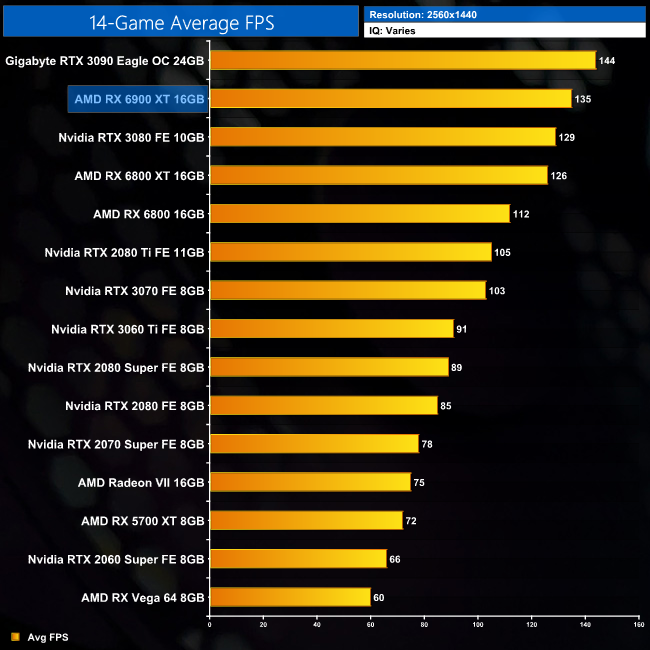
Looking at the big picture overview, there is a fair bit of variation through the different resolutions. At 1440p, the 6900 XT is on average 7% faster than its little brother, the 6800 XT, while it is 5% faster than the RTX 3080. Compared to the RTX 3090 however, it is 6% slower.
As for 4K, here the 6900 XT is on average 9% faster than the 6800 XT, but it's just 2% faster than the RTX 3080. It also falls 10% behind the RTX 3090 at this higher resolution.
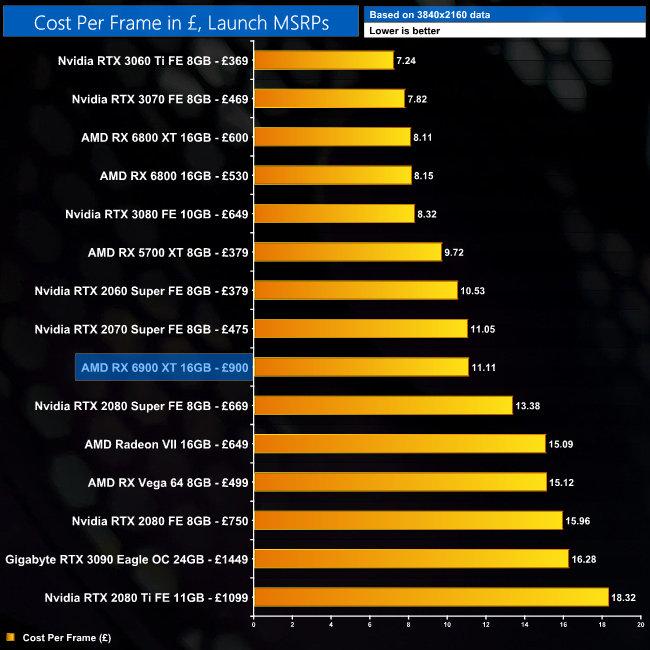
Using the average frame rate data presented on the previous page, here we look at the cost per frame using the UK MSRP launch prices for each GPU.

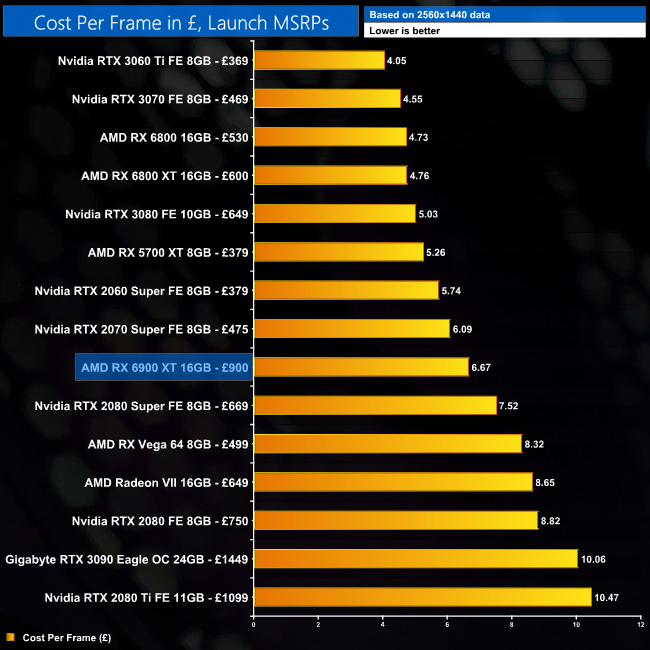
Let’s look at the cost per frame then, based on the UK MSRP of £900. Starting with the 1440p data, the RX 6900 XT comes in at £6.67 per frame, so it is significantly better value than the RTX 3090, being 34% cheaper per frame. Compared to the RTX 3080 however, it is 33% more expensive per frame.
As for the 4K data, we see a cost of £11.11 per frame. Again, this is a hefty saving of 32% per frame compared to the RTX 3090, but it’s the RTX 3080 causing problems as the 6900 XT is 34% more expensive per frame.
Here we revisit Control, this time testing with the in-game ray tracing effects set to their highest values.
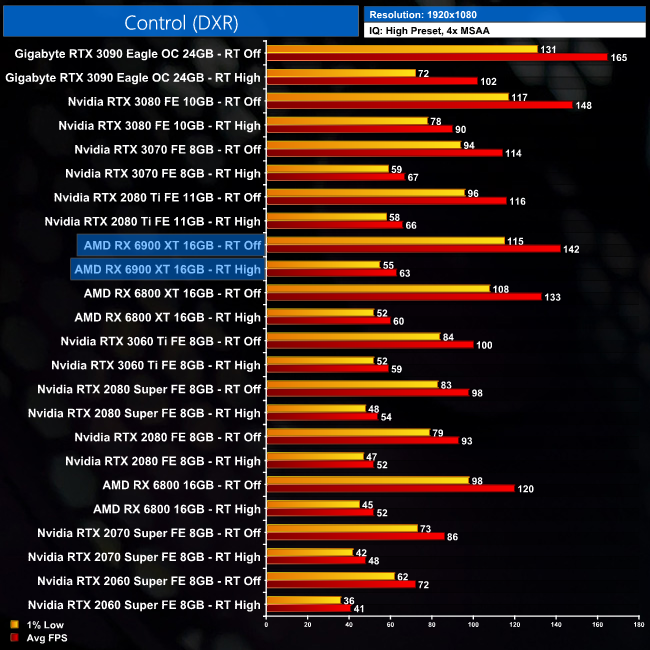
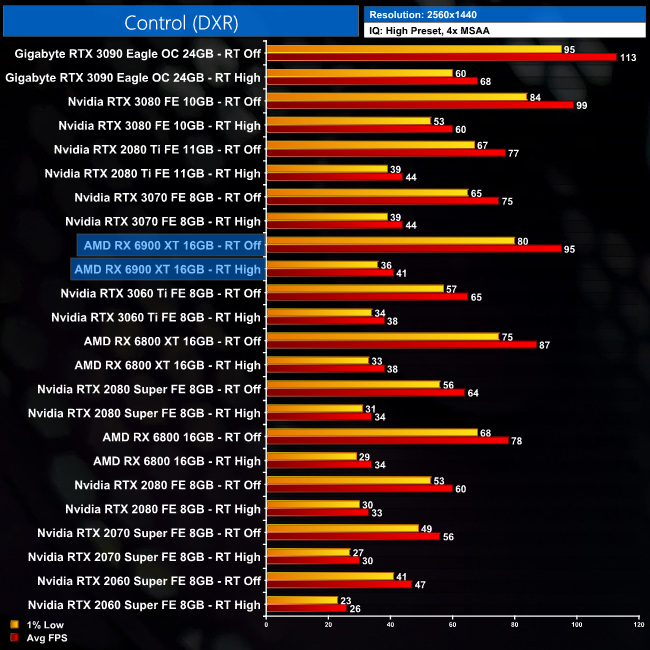
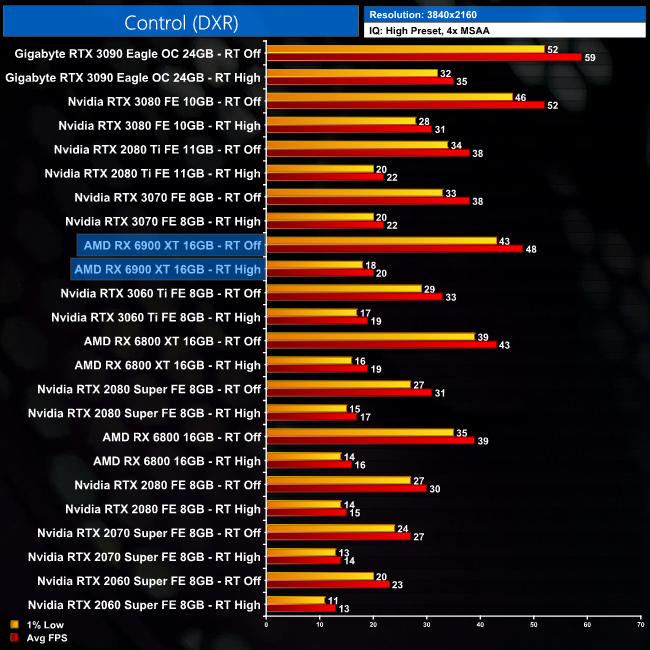
In terms of the 6900 XT's ray tracing performance, we start with Control. At 1080p, the 6900 XT delivers 63FPS with ray tracing set to its highest value, which means it's barely 7% faster than Nvidia's £369 RTX 3060 Ti. RTX 3080, meanwhile, is in another league entirely, as the 6900 XT is 30% slower.
As for 1440p, the average frame rate falls to 41FPS, and that's a 57% performance hit compared to playing with ray tracing disabled. The 6900 XT is now 32% slower than the RTX 3080.
Here we revisit Shadow of the Tomb Raider, this time testing with the in-game ray tracing effects set to their highest values.
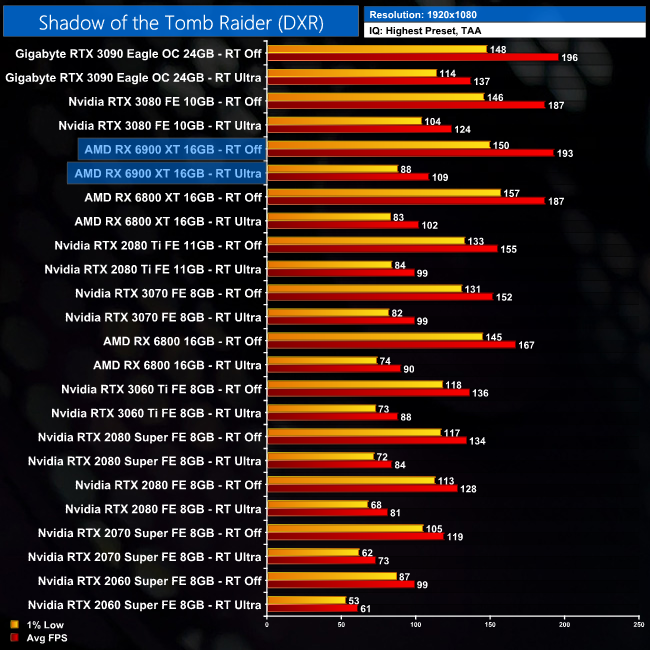
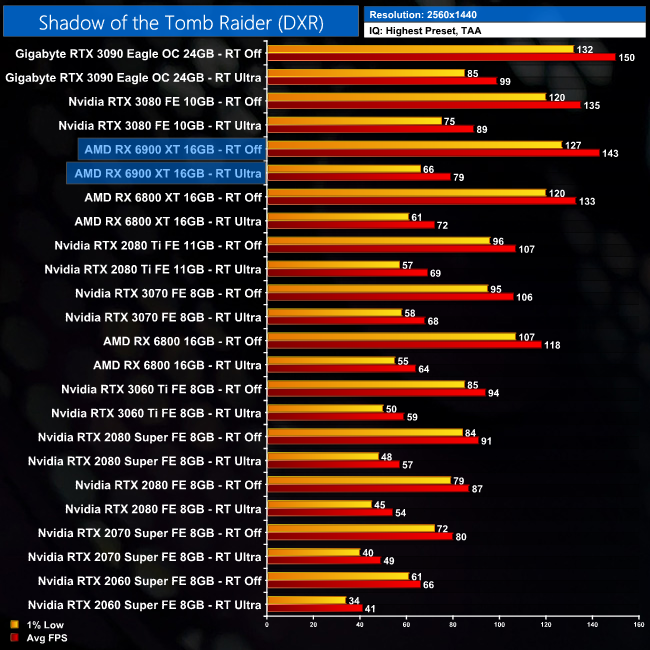
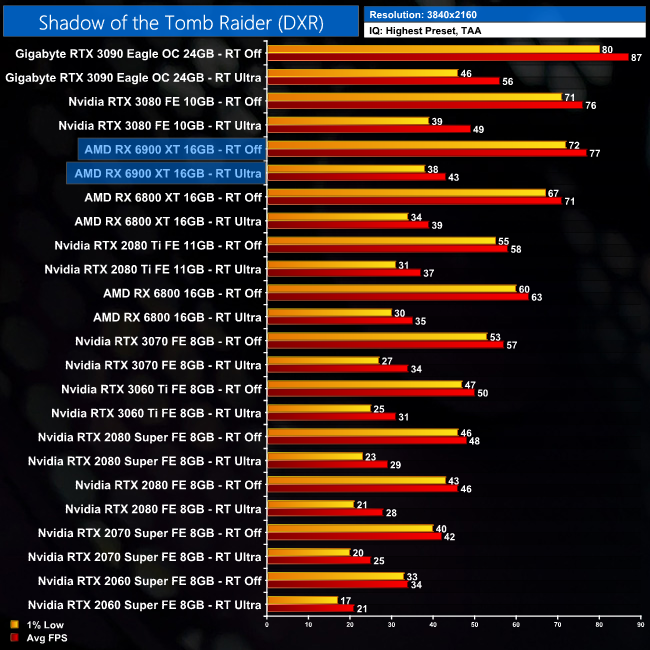
Next up, Shadow of the Tomb Raider only uses ray traced shadows, and this means the performance hit is less severe for the 6900 XT. At 1080p, it delivers 109FPS with ray tracing set to Ultra, putting it 12% behind the RTX 3080.
At 1440p, it can still hold over 60FPS with those ray traced shadows, and it's still about 11% behind the RTX 3080. Compared to ray tracing disabled, we're looking at a 45% hit for the 6900 XT here.
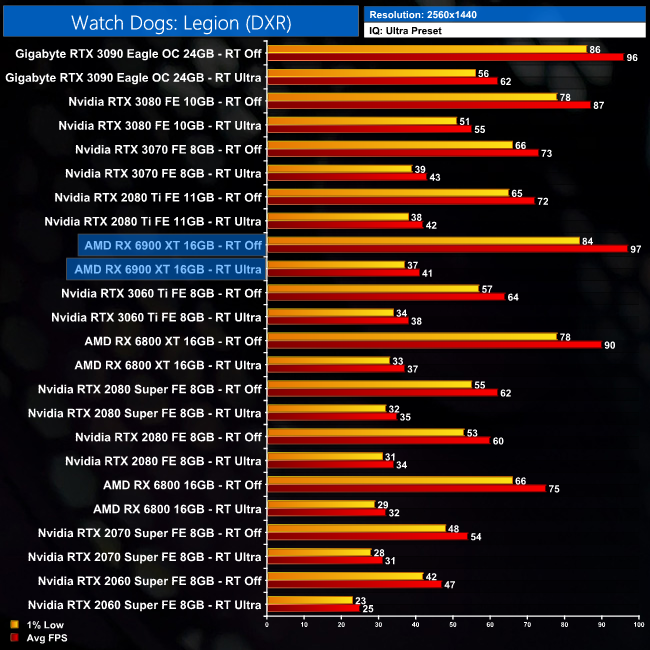
Here we revisit Watch Dogs: Legion, this time testing with the in-game ray tracing effects set to their highest values.
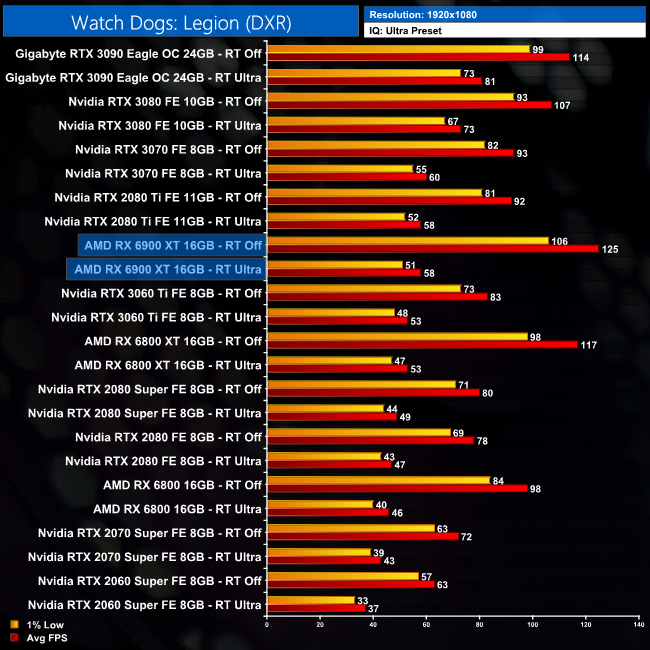
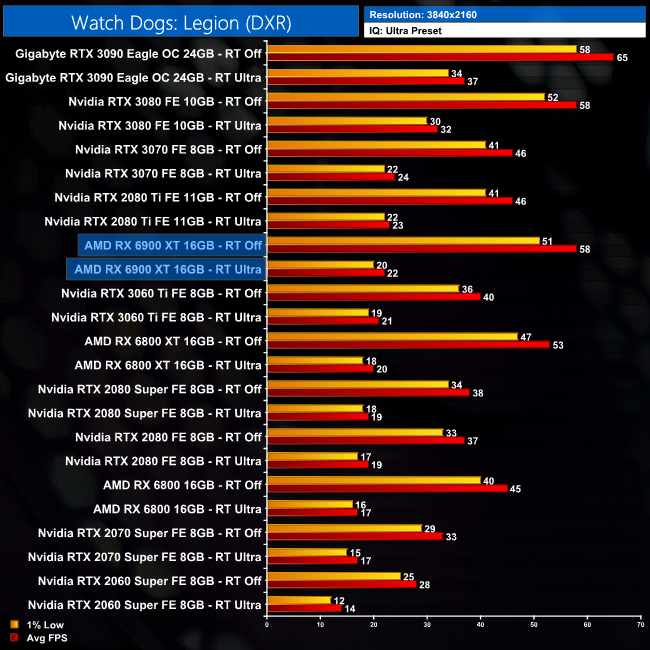
Lastly we also look at Watch Dogs: Legion, with its ray traced reflections. At 1080p, the 6900 XT delivers 58FPS on average, which is on par with the RTX 2080 Ti, and 9% ahead of the RTX 3060 Ti. Compared to the RTX 3080, AMD's GPU is 20% slower here.
As for 1440p, here the 6900 XT hits 41FPS on average, just 7% better than the 3060 Ti, and 25% behind the RTX 3080. We're also looking at a 58% performance hit for the 6900 XT, when turning on those ray traced reflections.
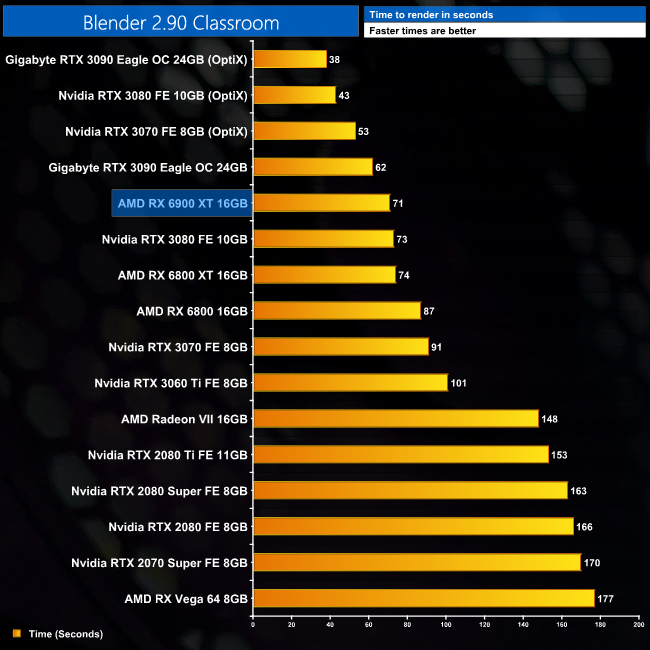
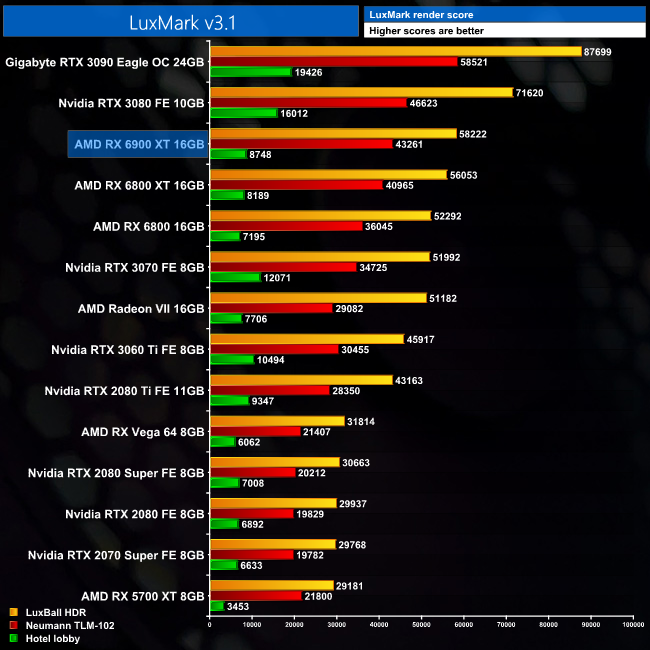
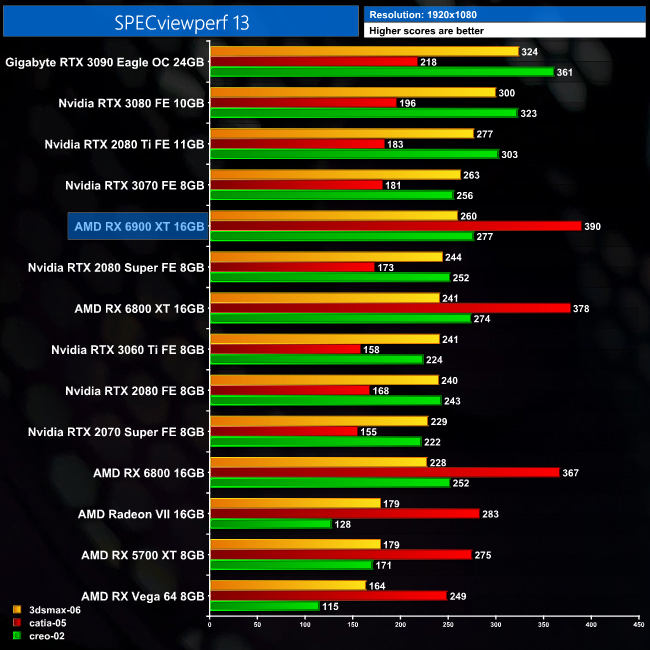
Here we present three productivity benchmarks for those interested – Blender 2.90 Classroom (CUDA/OpenCL), LuxMark 3.1, and SPECviewperf 13.
Here we present the average clock speed for each graphics card while running the 3DMark Time Spy stress test for 30 minutes. We use GPU-Z to record the GPU core frequency during the Time Spy runs. We calculate the average core frequency during the 30 minute run to present here.
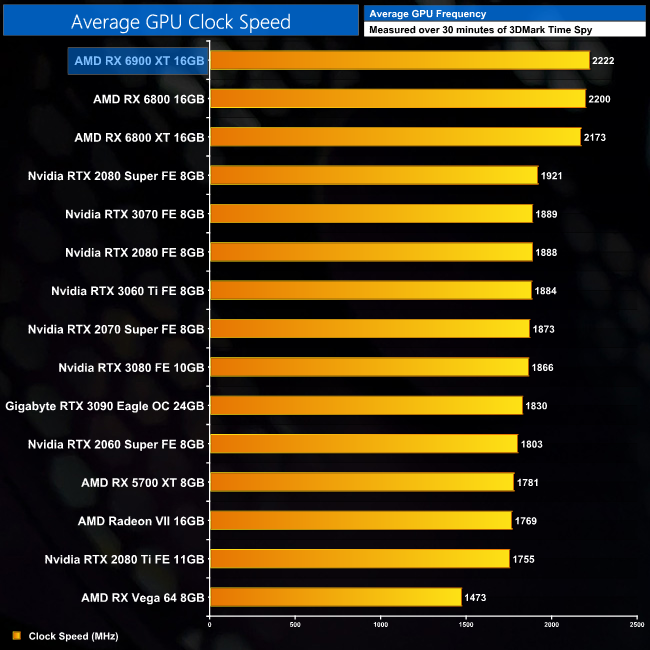
In terms of the clock speed behaviour of the RX 6900 XT, it's very similar overall to the 6800 XT, but we do see it trending slightly faster than the 6800 XT. Where the 6800 XT averaged 2200MHz across our 30 minute stress test, the 6900 XT averaged 2222MHz, so there's only a slight difference between the two GPUs, but it's not bad when we remember the 6900 XT has 512 more cores.
For our temperature testing, we measure the peak GPU core temperature under load. A reading under load comes from running the 3DMark Time Spy stress test for 30 minutes.
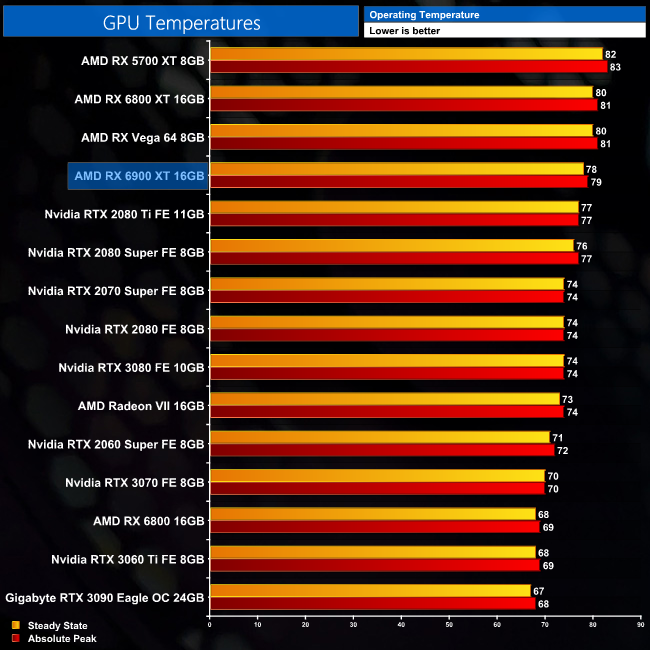
Looking at thermal performance, despite using the same cooler design as the 6800 XT, we saw the 6900 XT run fractionally cooler in terms of the edge temperature, hitting a peak of 79C, with a steady state of 78C, so it's a couple of degrees cooler than the 6800 XT.
This may be puzzling initially, as we'd expect the 6900 XT to be the GPU running a little hotter, but the answer comes down to the default fan curve. In our testing, the 6800 XT would typically run its fans about 200rpm slower, resulting in the higher temperatures we are seeing from that GPU.
We take our noise measurements with the sound meter positioned 1 foot from the graphics card. I measured the noise floor to be 32 dBA, thus anything above this level can be attributed to the graphics cards. The power supply is passive for the entire power output range we tested all graphics cards in, while all CPU and system fans were disabled. A reading under load comes from running the 3DMark Time Spy stress test for 30 minutes.
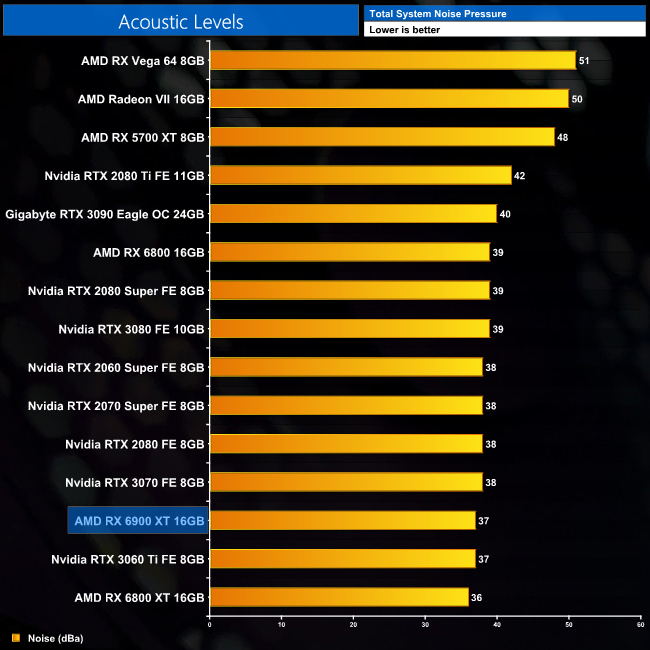
Of course, the fact that the 6900 XT runs its fans 200rpm or-so faster than the RX 6800 XT, means it is a tiny bit louder, with a reading of 37dBa on our sound meter. To my ear, the noise wasn't noticeably louder than the 6800 XT though, and it's still a terrific result overall.
I do have to mention there was a small amount of coil whine present with my sample, but it was only just audible over my case fans, so when gaming with speakers or a headset on, it simply wouldn't be noticeable.
Following on from our stock thermal and acoustic testing, here we re-test the operating temperature of the GPU, but with noise levels normalised to 40dBa. This allows us to measure the efficiency of the overall cooling solution as varying noise levels as a result of more aggressive fan curves are no longer a factor.
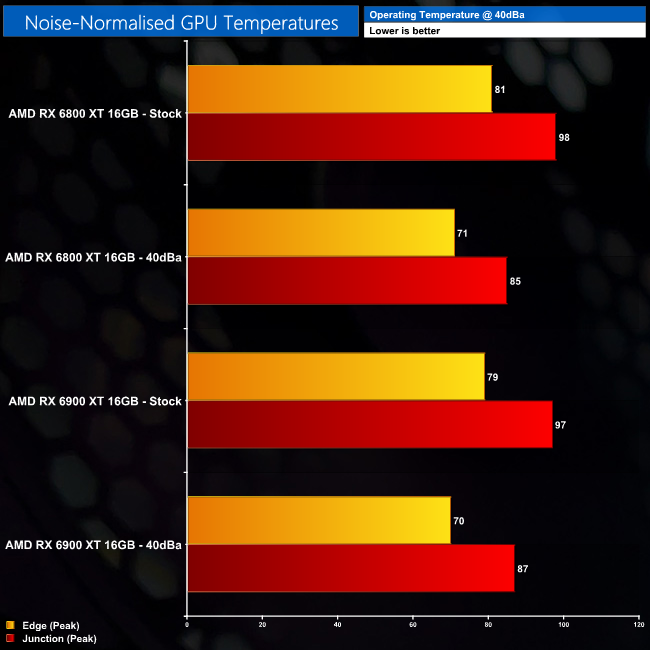
As the reference design of the 6900 XT is still very quiet, there is plenty of room to noise-normalise to 40dBa and see a reduction in operating temperature. Edge temperature dropped from 79C down to 70C, while the junction temperature also fell by 10C.
We also added the 6800 XT noise-normalised results to the chart, and as we'd expect given they use the same cooler and both are rated for 300W, the overall results are almost identical.
We measure system-wide power draw from the wall while running the 3DMark Time Spy stress test for 30 minutes.
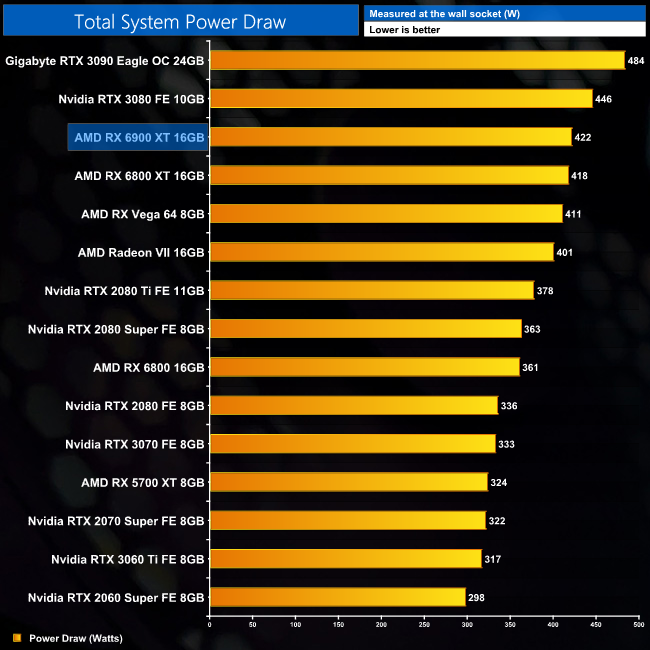
Total system power draw hovers about the 420W mark, so a negligible increase over the 6800 XT.
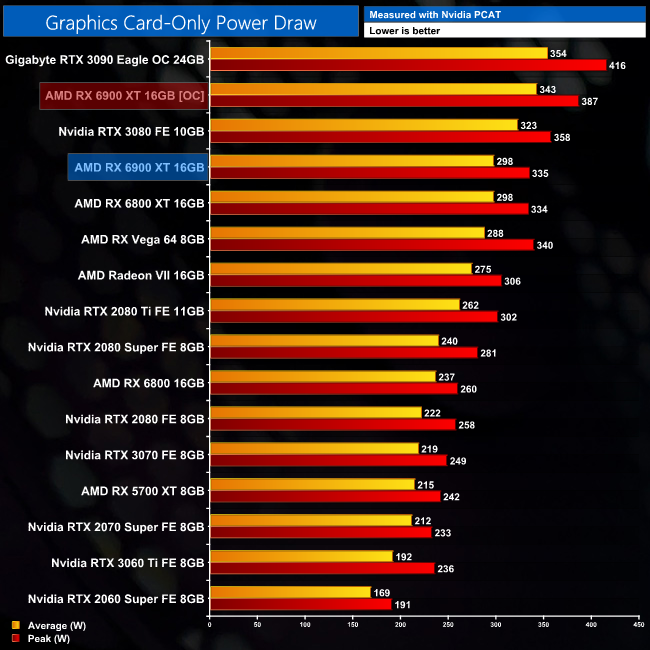
We also use Nvidia PCAT to measure power draw of the graphics card only, with readings from both the PCIe slot and the PCIe power cables combined into a single figure. This provides us with significantly more accurate data to work with as it is measuring only the GPU power, and not total system power which is a fundamentally imprecise measurement.
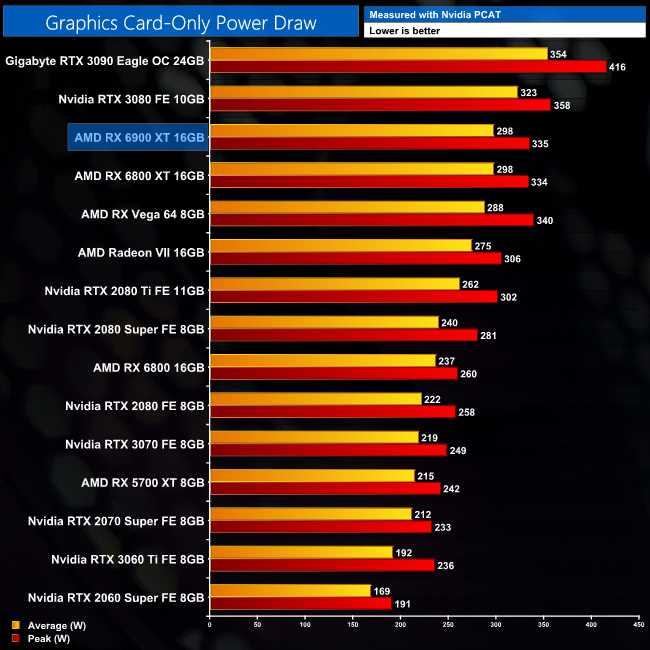
Looking at graphics card-only power draw shows the 6900 XT drawing exactly the same as the 6800 XT – at 298W average over our 30 minute stress test. This is quite remarkable considering the 6900 XT has an extra 512 cores, so it is a testament to the efficient architectural design of RDNA 2.
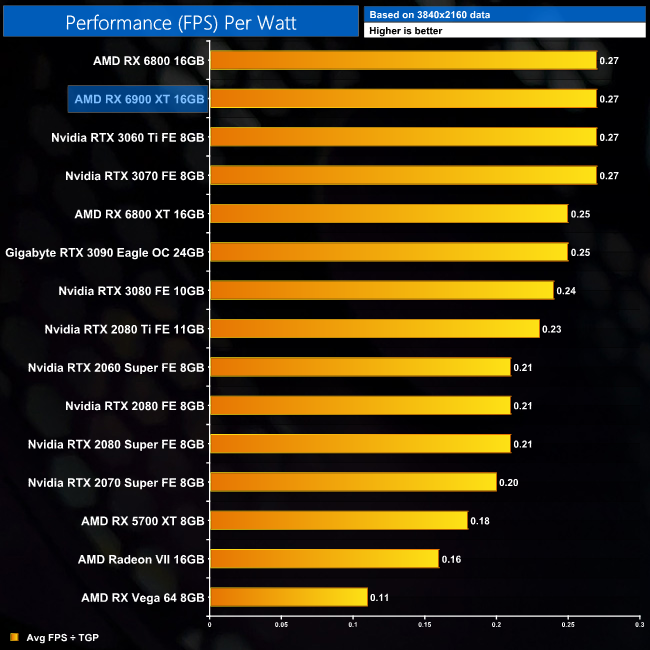
By using our GPU-only power data in conjunction with the 14-game average FPS data we presented earlier in this review, we can work out performance per Watt for each graphics card. This is presented as FPS per Watt.
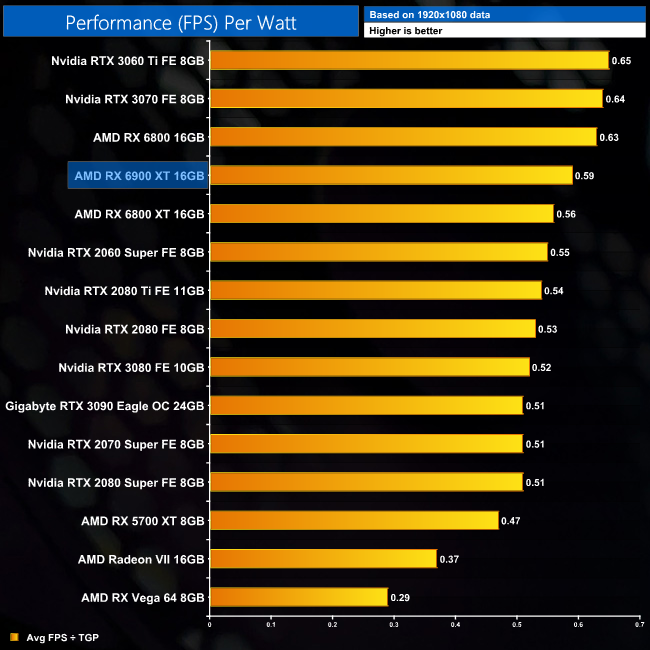
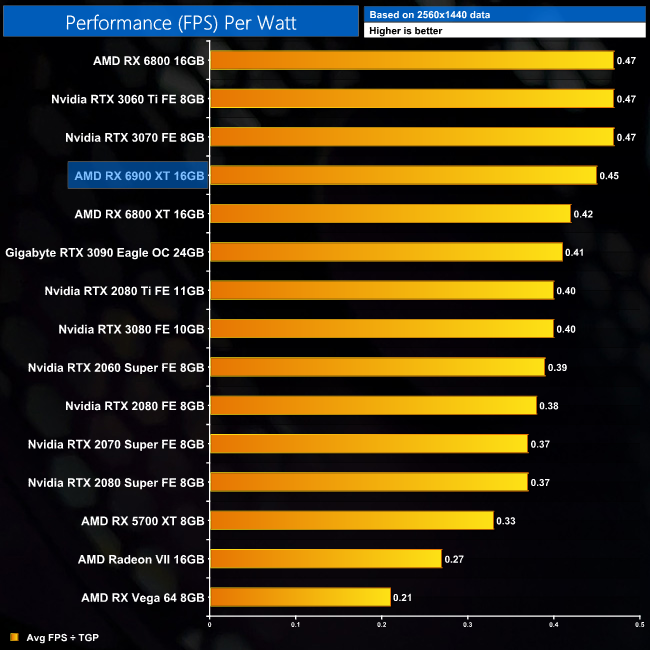
Considering the 6900 XT consumes the same power as the 6800 XT, but runs 7-9% faster on average, it's no surprise to see it delivers better performance per Watt across the board. At 1440p, for instance, it is 7% more efficient, and only just behind the RX 6800 and RTX 3060 Ti.
At 4K, it pulls to joint first, delivering 8% better performance per Watt compared to the 6800 XT, while it's also 13% ahead of the RTX 3080.
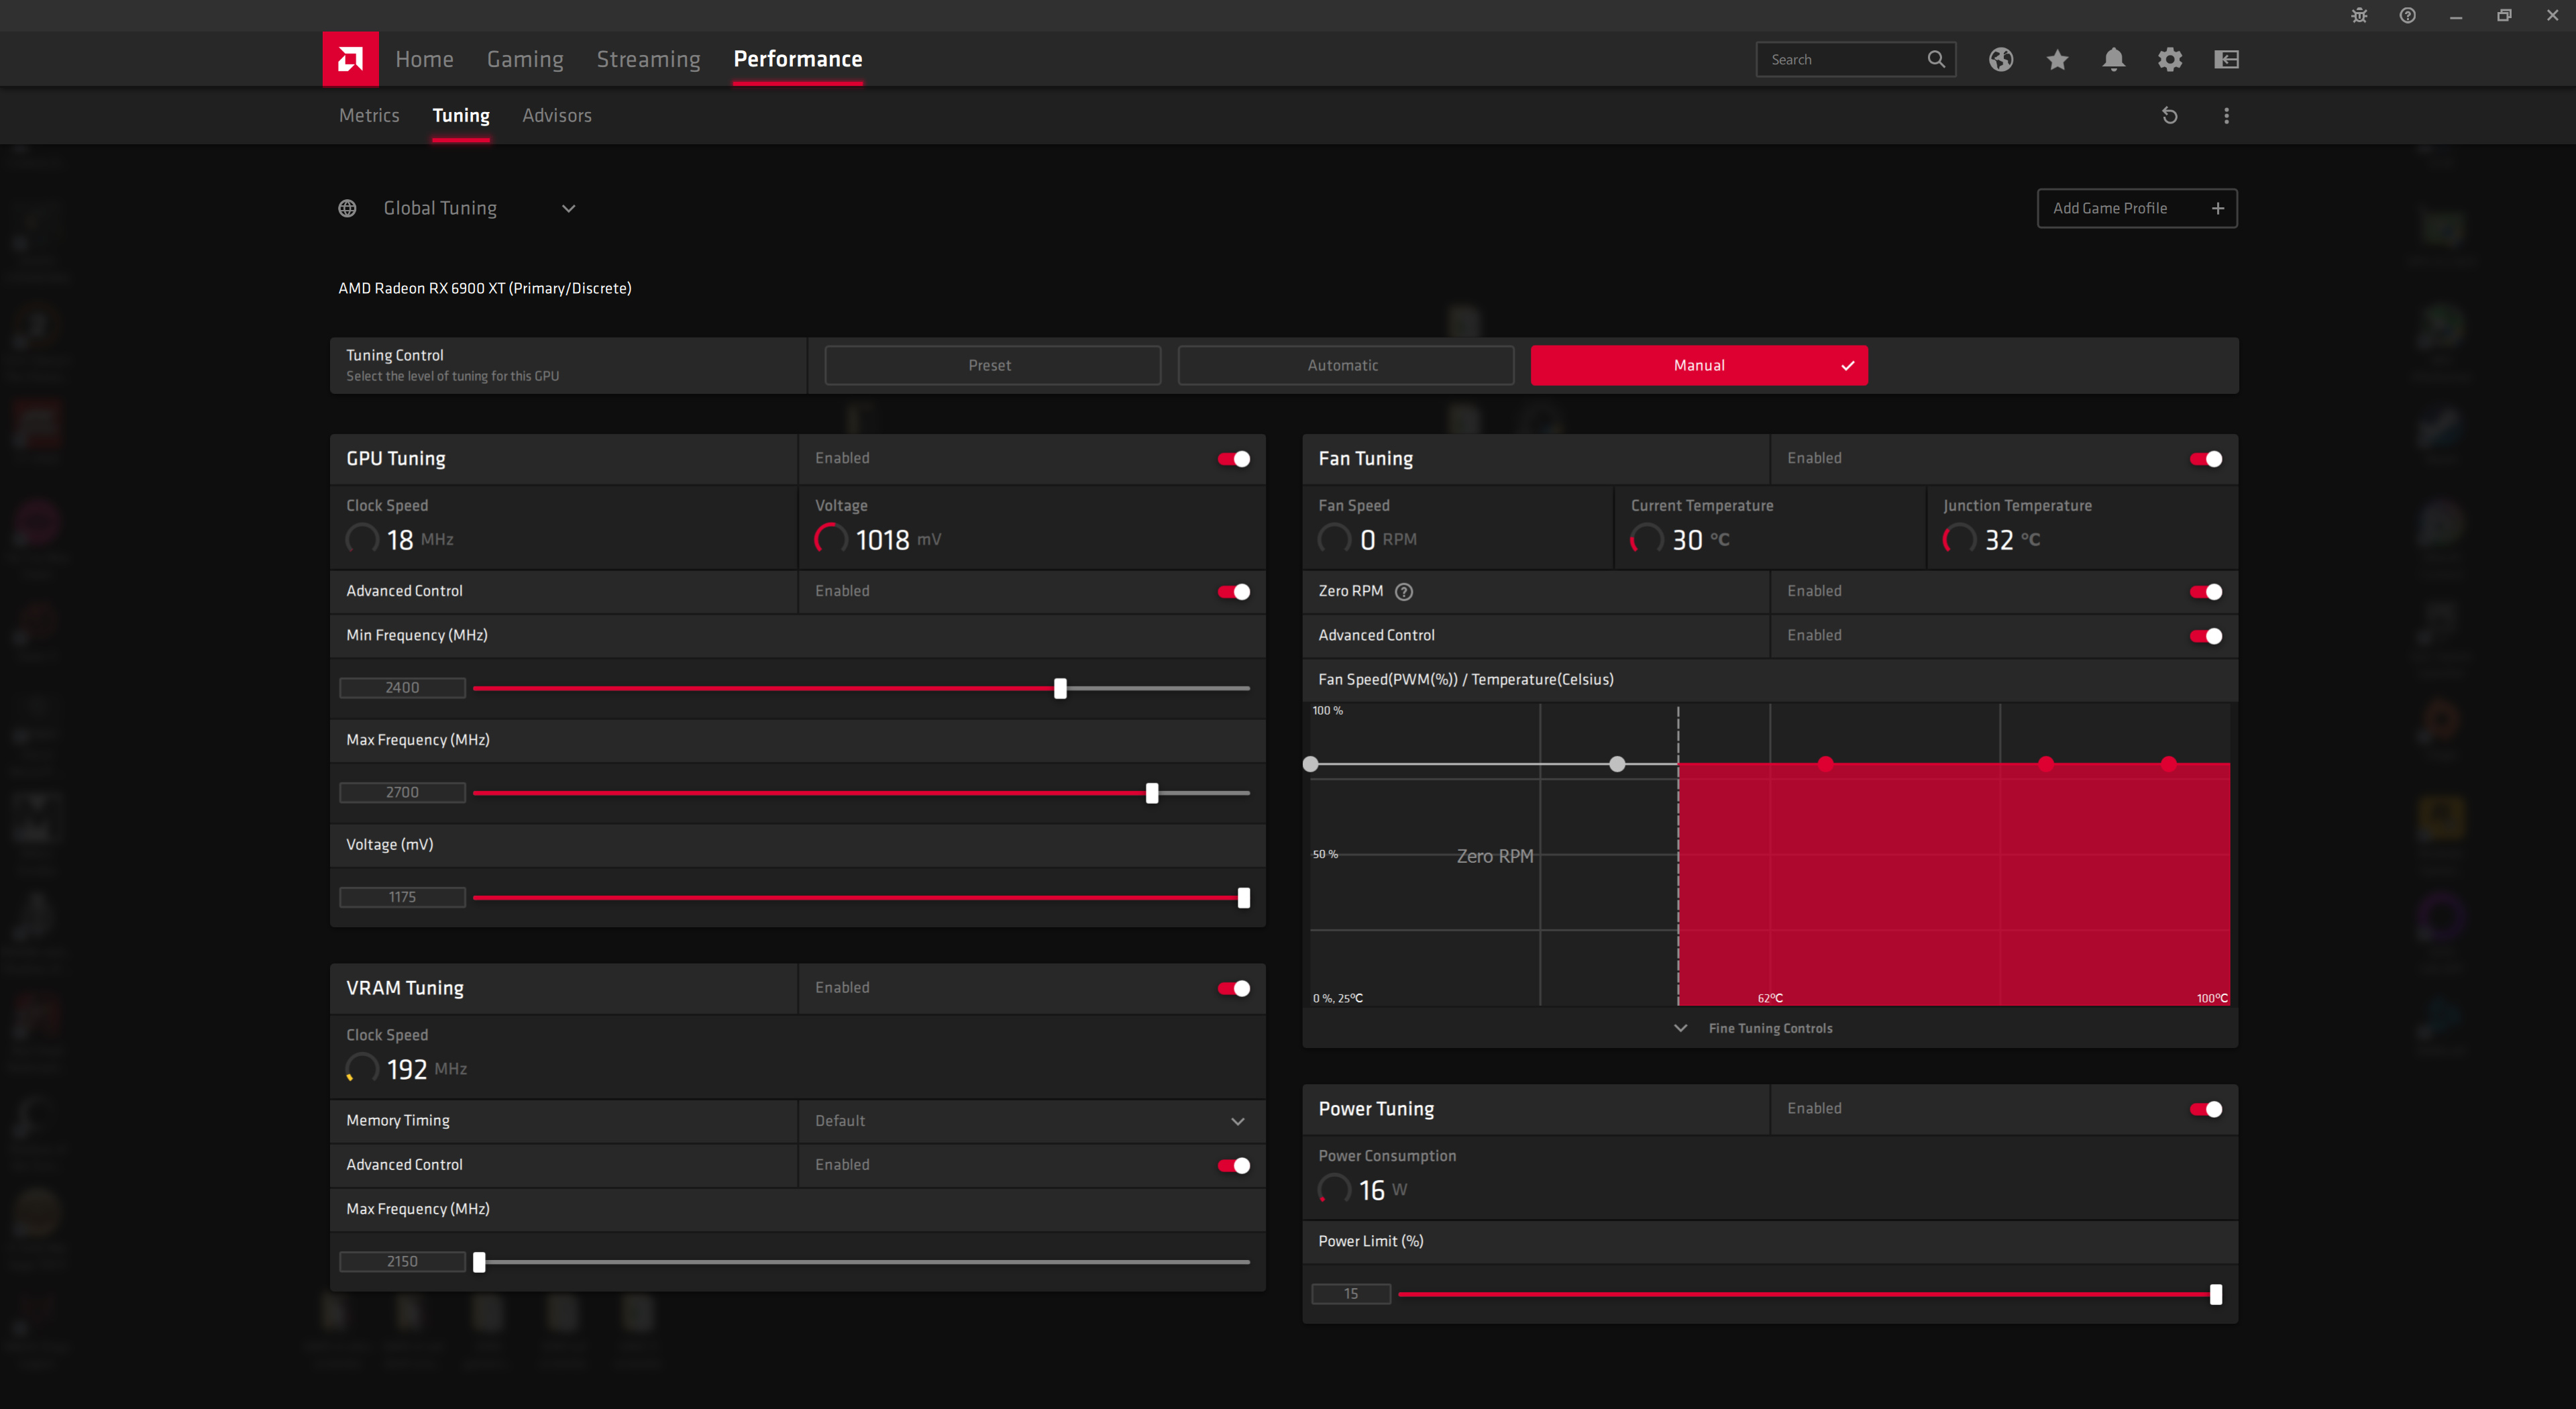
For manual overclocking, we used AMD Wattman. Our best result came with the power slider maximised, the memory frequency slider maximised at 2150MHz, and a GPU frequency set to 2400MHz minimum and 2700MHz maximum. In practice, this resulted in the GPU running around 2450MHz.
This overclock resulted in performance gains of between 5-6% in the games we re-tested at 4K. It's not huge, but we found the same with the reference 6800 XT, and custom cards like the PowerColor Red Devil and Sapphire Nitro+ did significantly better, so it's likely going to be the same for the 6900 XT.
Power draw, meanwhile, increased to 343W with this overclock, an increase of 15% over stock.
After getting our hands on the RX 6800 XT and RX 6800 XT last month, we've had to wait until now to test AMD's newest flagship GPU – the RX 6900 XT. Fundamentally, the 6900 XT is the same GPU as the 6800 XT, but with an extra 8 Compute Units and 512 stream processors, for which UK buyers are asked to pay £899.99.
Touching first on the raw performance of this graphics card, the extra core count means the 6900 XT is, on average, 7% faster than the 6800 XT at 1440p, and 9% faster at 4K. That may not sound like a particularly large improvement, but given the key difference between the two is 11% more cores for the 6900 XT, this matches up. It will also vary game-to-game – in Control, for instance, the 6900 XT is 12% faster at 4K, which was the biggest single difference between the two GPUs across all of our testing.
Compared to the RTX 3080, the 6900 XT is 5% faster at 1440p, and 2% faster on average at 4K, which clearly isn't much of a difference, especially when considering the price tag – but more on that in just a second. The final key comparison is to the RTX 3090, where the 6900 XT is 6% slower at 1440p, and 10% slower at 4K.
In a nutshell – and leaving value to one side for now – from an objective standpoint, it is a very capable graphics card, typically pushing 140-150FPS at 1440p. At 4K, it averaged above 60FPS in all but three of the games we tested.
There is also ray tracing performance to touch on. Here, there is no doubt Nvidia has the upper hand, and by quite a distance. The RTX 3080 can be anywhere from 10-45% faster when ray traced effects are set to their highest levels, with that margin seemingly at its widest when there is more ray tracing to be done. Shadow of the Tomb Raider, with its ray traced shadows, is much less demanding on the GPU, but in Watch Dogs: Legion and Control – the latter of which has a multitude of ray traced elements – the 6900 XT falls further behind. We also can't ignore the fact that Nvidia's RTX GPUs have the option to enable DLSS for a further boost to frame rates, which is a feature AMD currently has no answer to.
I wasn't too critical of the RX 6800 XT for its ray tracing performance, but for a £900 GPU, the RX 6900 XT is not that much faster than the £369 RTX 3060 Ti in ray traced workloads. It is clear to me that anyone who values ray tracing is better off with an Nvidia GPU, it really just depends how much of a priority this is for you.
Discussion also needs to be had around the value of the RX 6900 XT. There is no doubt it offers better value than the RTX 3090 – it may not be quite as fast, especially at 4K, but it is more than 30% cheaper in terms of the cost per frame at both 1440p and 4K resolutions.
The problem I have with that line of thinking is two-fold. First of all, I'm not sure it makes sense to look at the 6900 XT vs RTX 3090 in terms of value, as everything looks like terrific value up against the RTX 3090. For me, the RTX 3090 is very much a GPU for those who want the absolutely fastest thing going, and don't care how much it will cost.
Secondly, if you do choose to look at the relative value of the RX 6900 XT, then you also need to look at the RTX 3080, which itself is 25% cheaper per frame at 1440p and 4K. My opinion is that the vast majority of users looking at the RX 6900 XT would be better served with an RTX 3080, as it is really not much slower at all. As mentioned above, the RX 6900 XT is on average 5% faster at 1440p, and 2% faster at 4K, with the latter result being particularly negligible. But, for that small difference in performance, customers are asked to shell out an extra £250.
One area where the RX 6900 XT may appeal is for 1440p gaming, where relatively speaking, it performs at its best – at that resolution, it is 5% faster than the RTX 3080 and 6% slower than the RTX 3090. So if you were part of what would likely be a very small group of 1440p gamers who want something a little faster than an RTX 3080, who are happy to pay £900 for a GPU (but not £1400 for RTX 3090), then I guess you could make a case for it, but I think that is getting to be a pretty niche audience.
The other argument for the 6900 XT would be if you are a gamer who only plays certain titles where AMD GPUs do particularly well – like Gears 5 or Borderlands 3 for instance, as in those games the 6900 XT can match or even beat the RTX 3090, albeit by very fine margins. Nonetheless, in those use cases the 6900 XT can offer roughly equivalent performance to the RTX 3090 but for significantly less money.
Unfortunately for AMD though, games like that are outliers rather than the norm. The problem remains that, across the board, I don't think the RX 6900 XT is fast enough to justify its asking price, when the RTX 3080 is snapping at its heels (and outpacing it in ray traced workloads) for £250 less cash.
![]()
RX 6900 XT has a UK MSRP of £899.99. We expect custom cards to be available in the coming weeks and months at Overclockers UK.
Discuss on our Facebook page HERE.
Pros
- AMD's fastest GPU.
- Better value than RTX 3090.
- Excellent reference card.
- Highly efficient design.
Cons
- Significantly more expensive than RTX 3080 for minimal performance improvements.
- Nvidia offers clearly better ray tracing performance.
- No answer to DLSS.
KitGuru says: You can make a few arguments in favour of the RX 6900 XT, but we feel most gamers would be better served with an RTX 3080.