

Test Software
Maxon Cinebench R15
CrystalDiskMark
For this initial article, we have chosen to merely give a taste of the performance conclusions we will be making over the series. So we are only showing results with Maxon Cinebench R15, and CrystalDiskMark. The latter is included to show the slight variance in the Intel Core i7 and Xeon platforms for disk subsystem performance, although this has very little effect on graphics or rendering, which are the key areas of interest for 3D workstation users.
Maxon Cinebench R15
CINEBENCH R15 is a cross-platform testing suite that measures hardware performance and is the de facto standard benchmarking tool for leading companies and trade journals for conducting real-world hardware performance tests. With the new Release 15, systems with up to 256 threads can be tested.
CINEBENCH is available for both Windows and OS X and is used by almost all hardware manufacturers and trade journals for comparing CPUs and graphics cards.
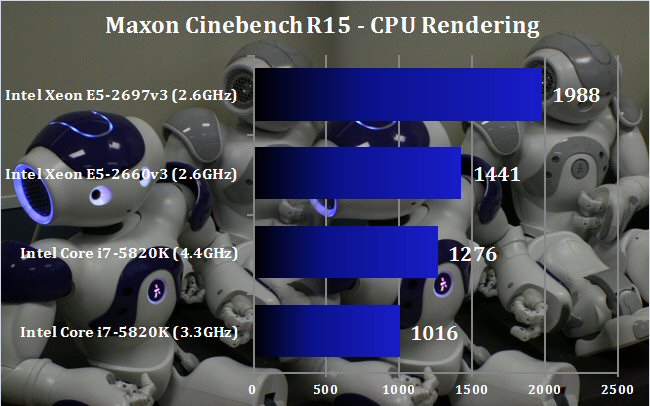
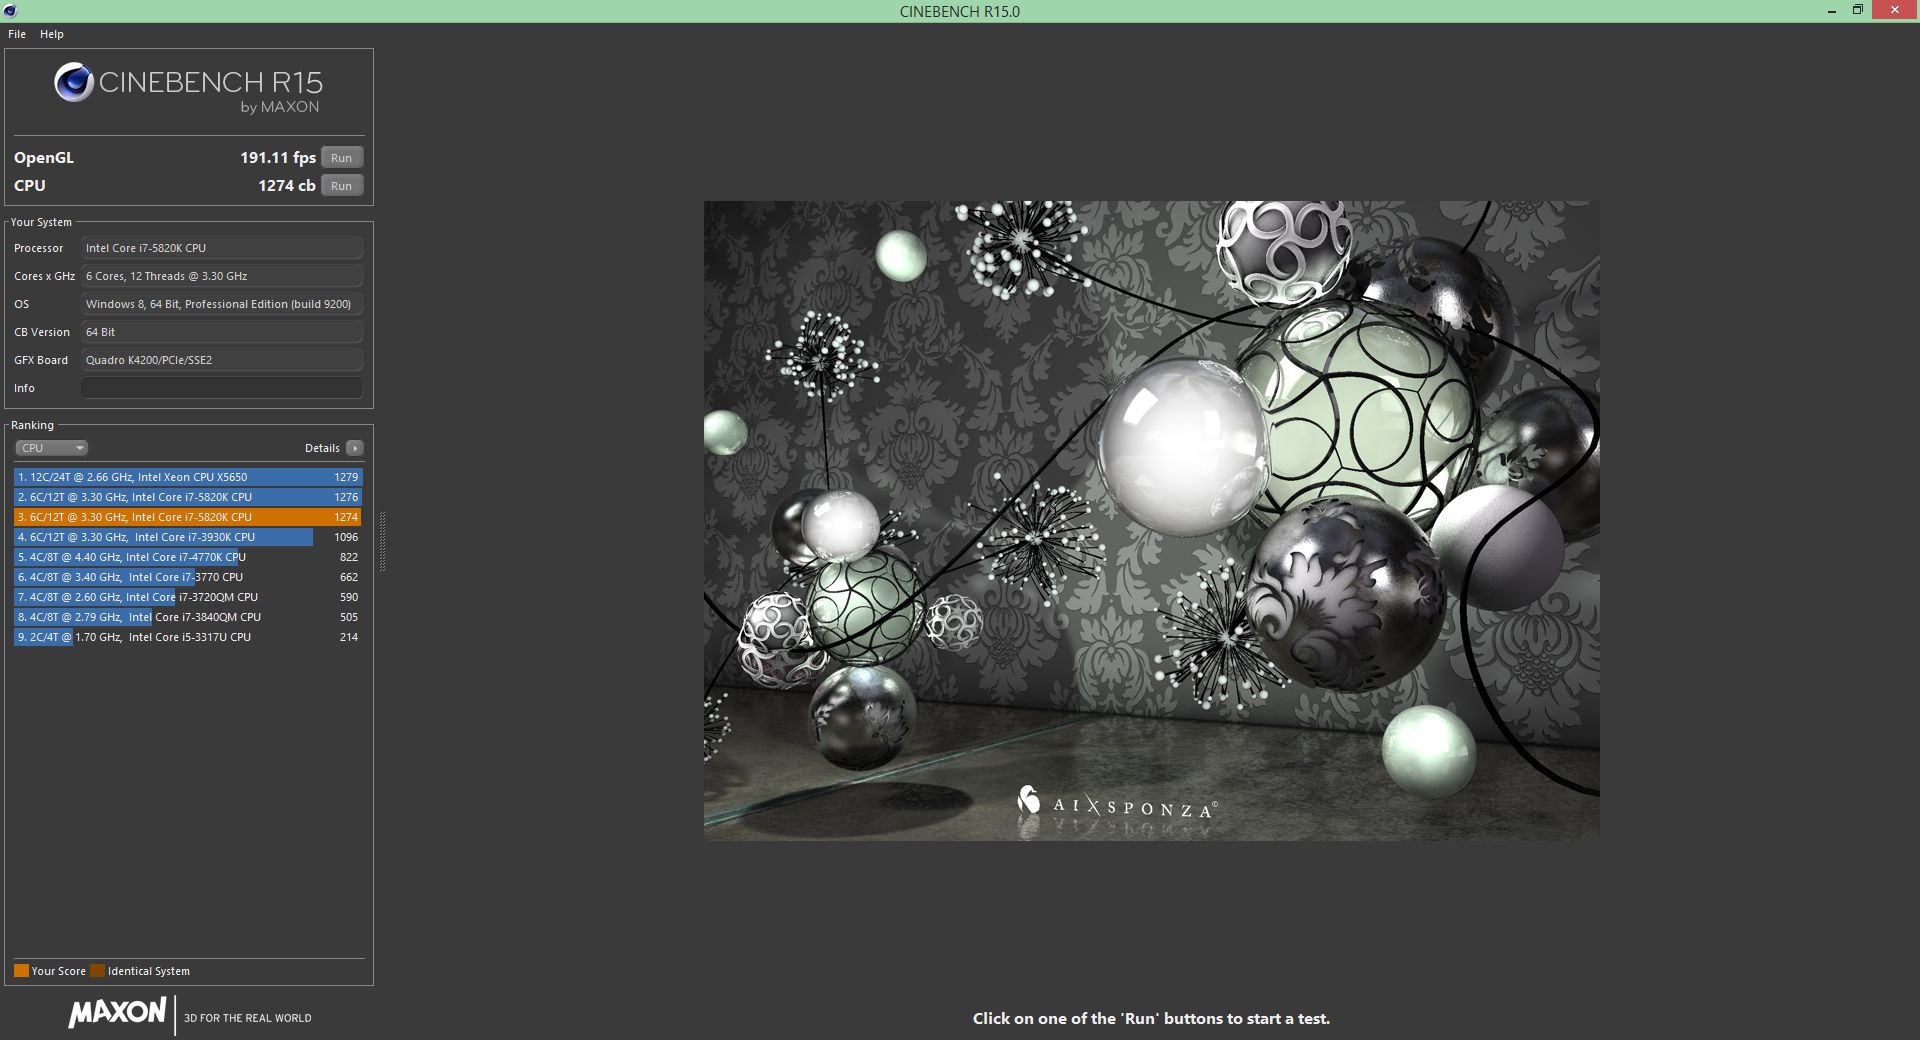
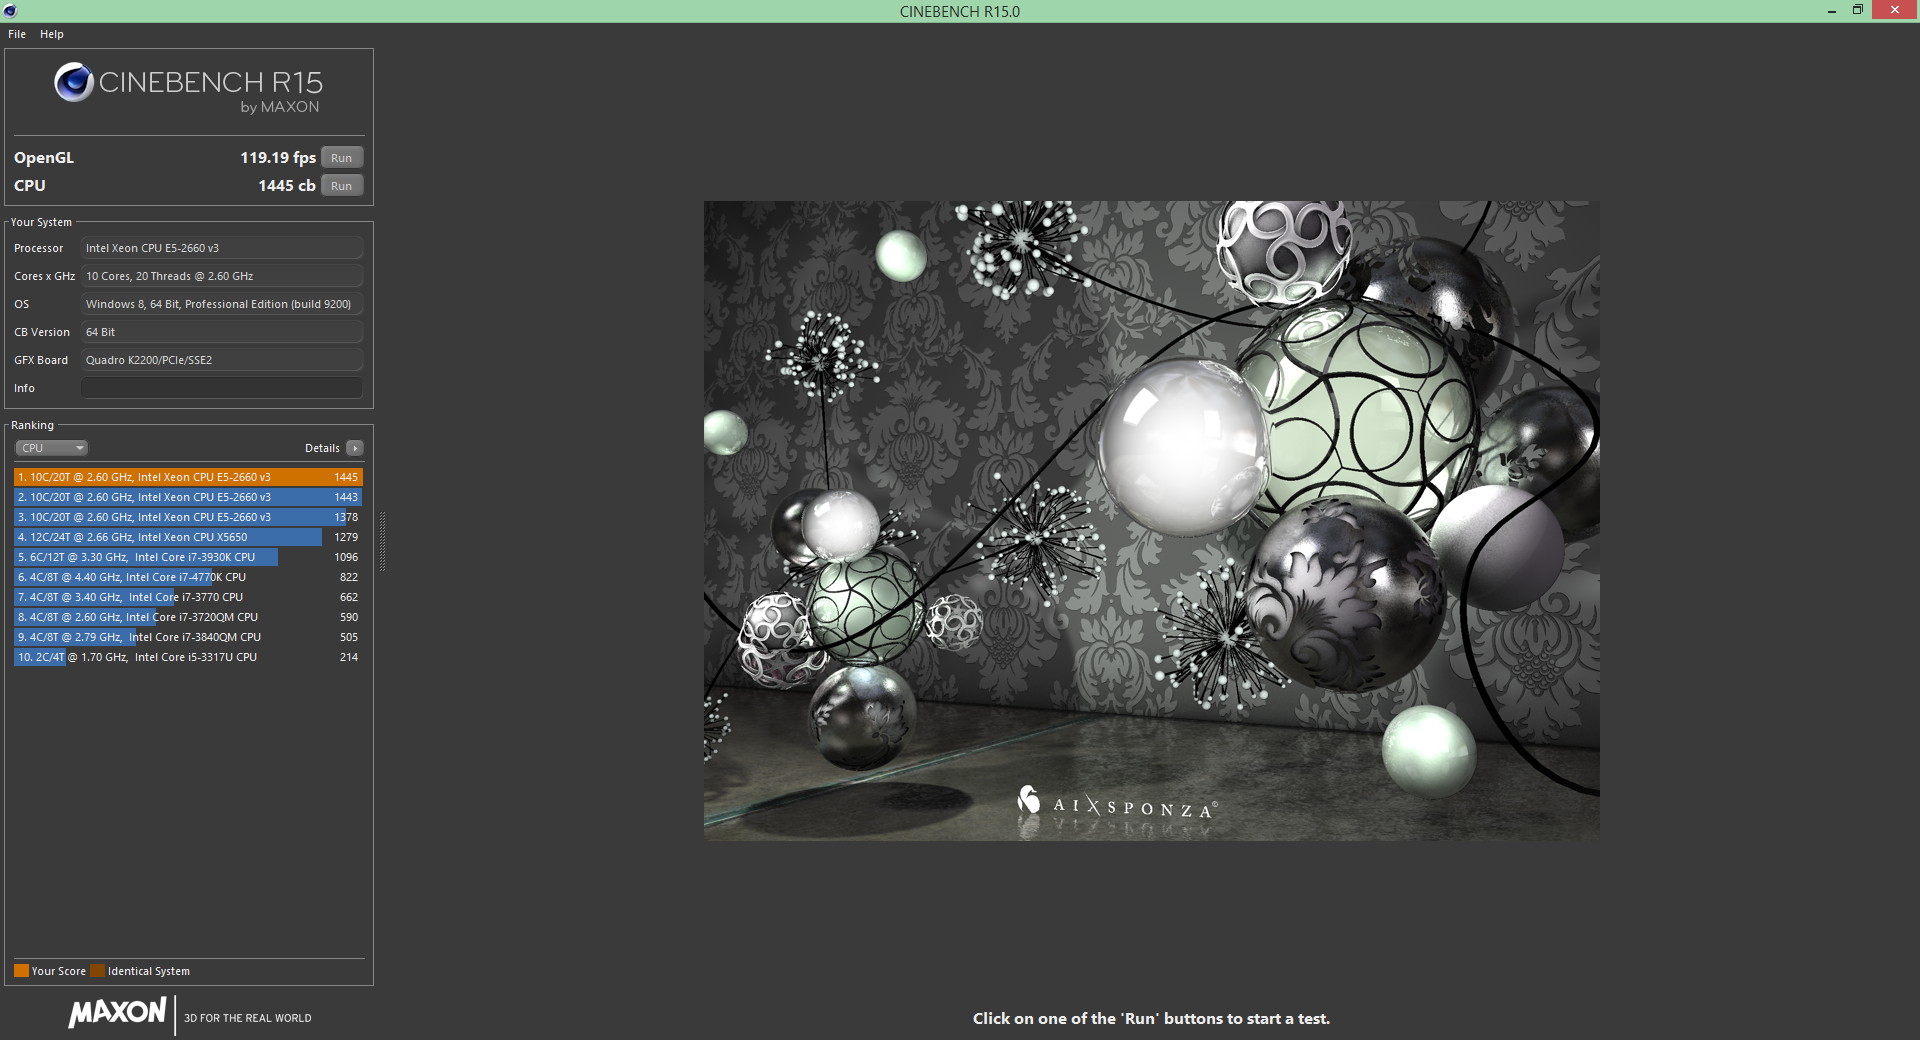
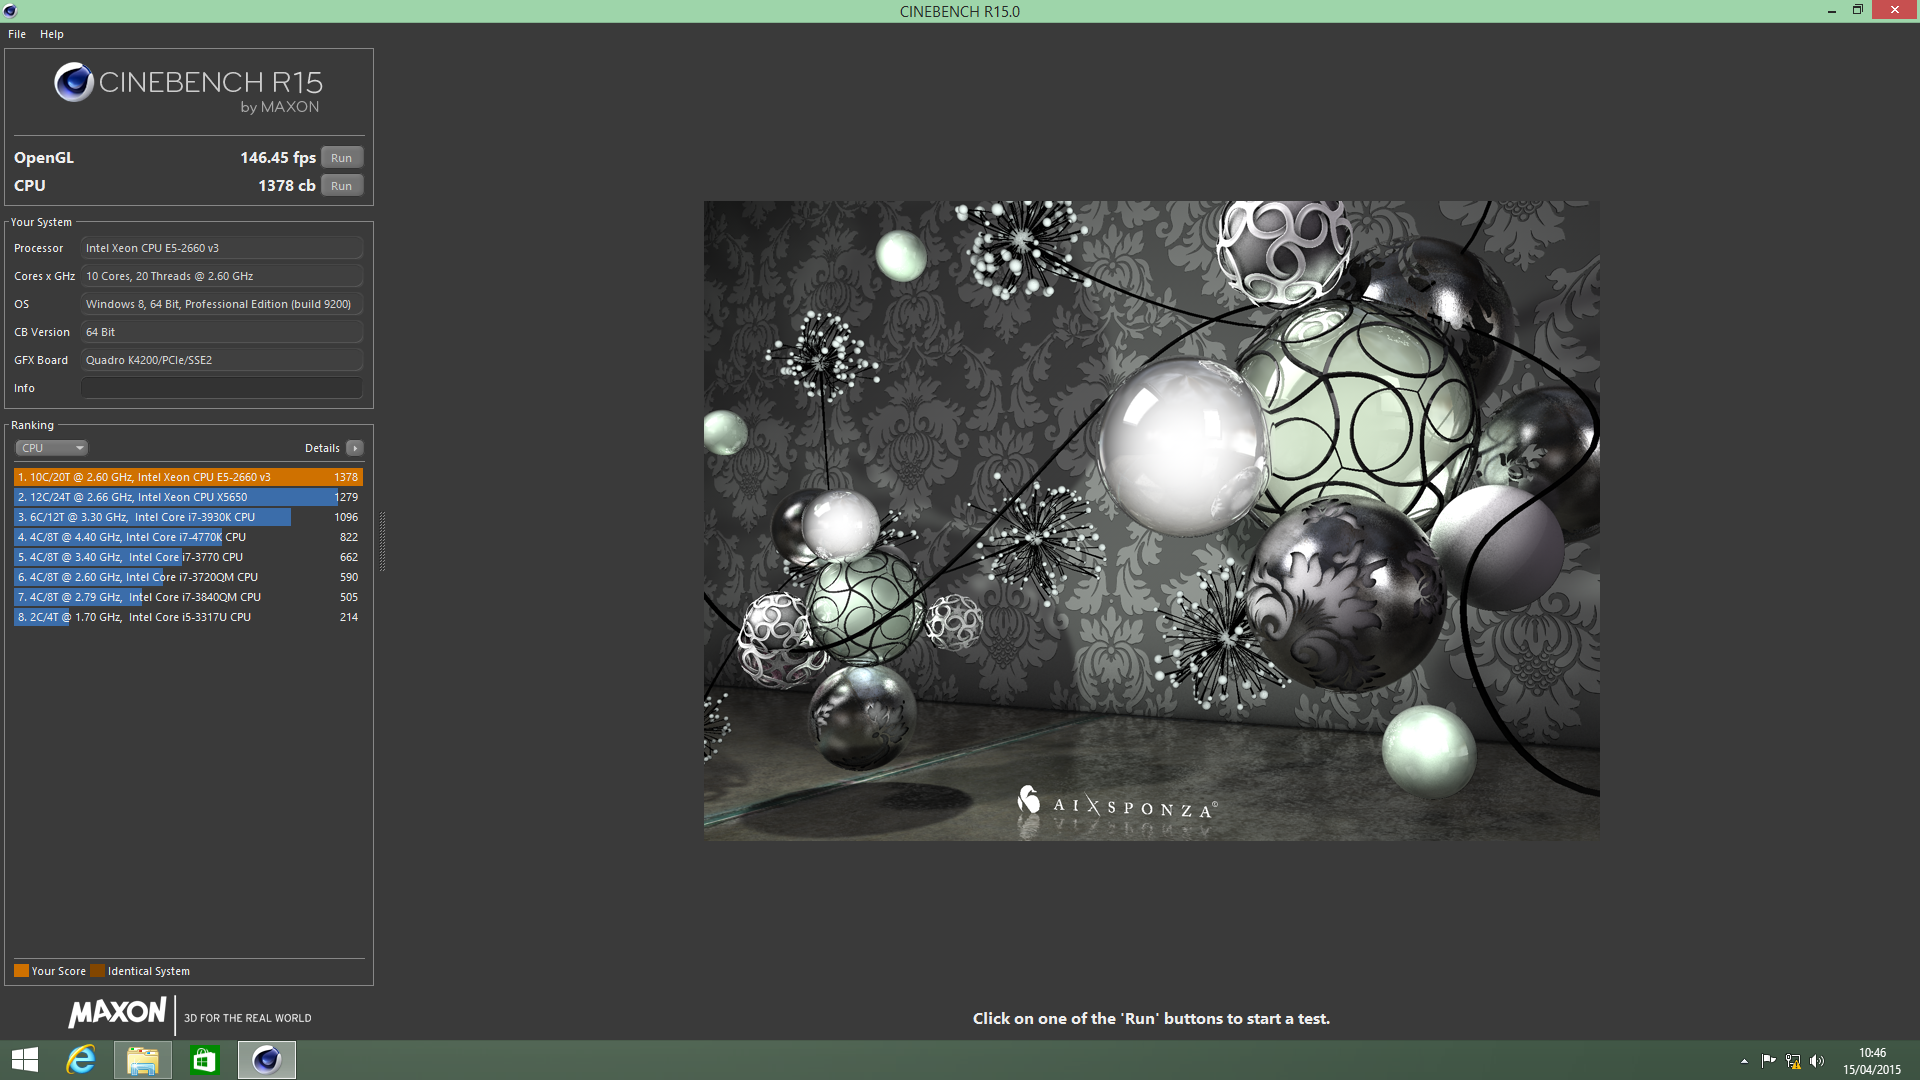
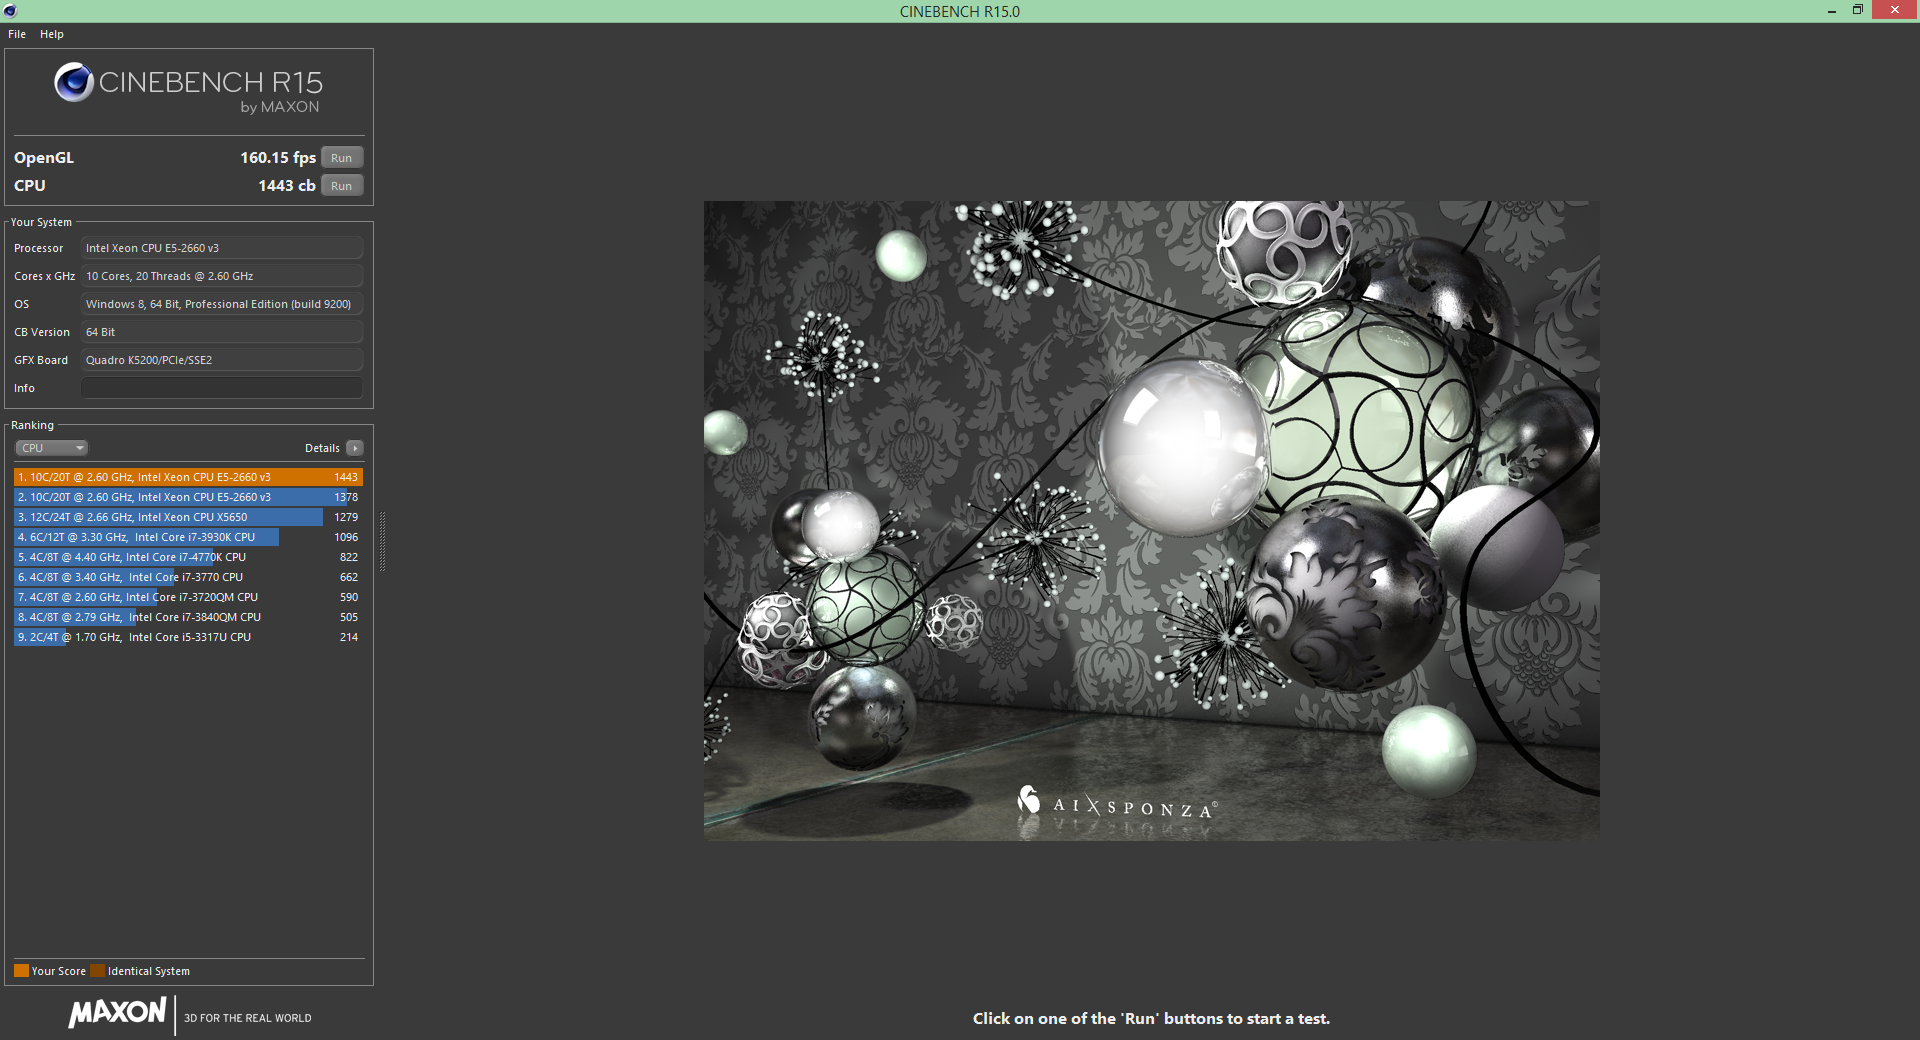
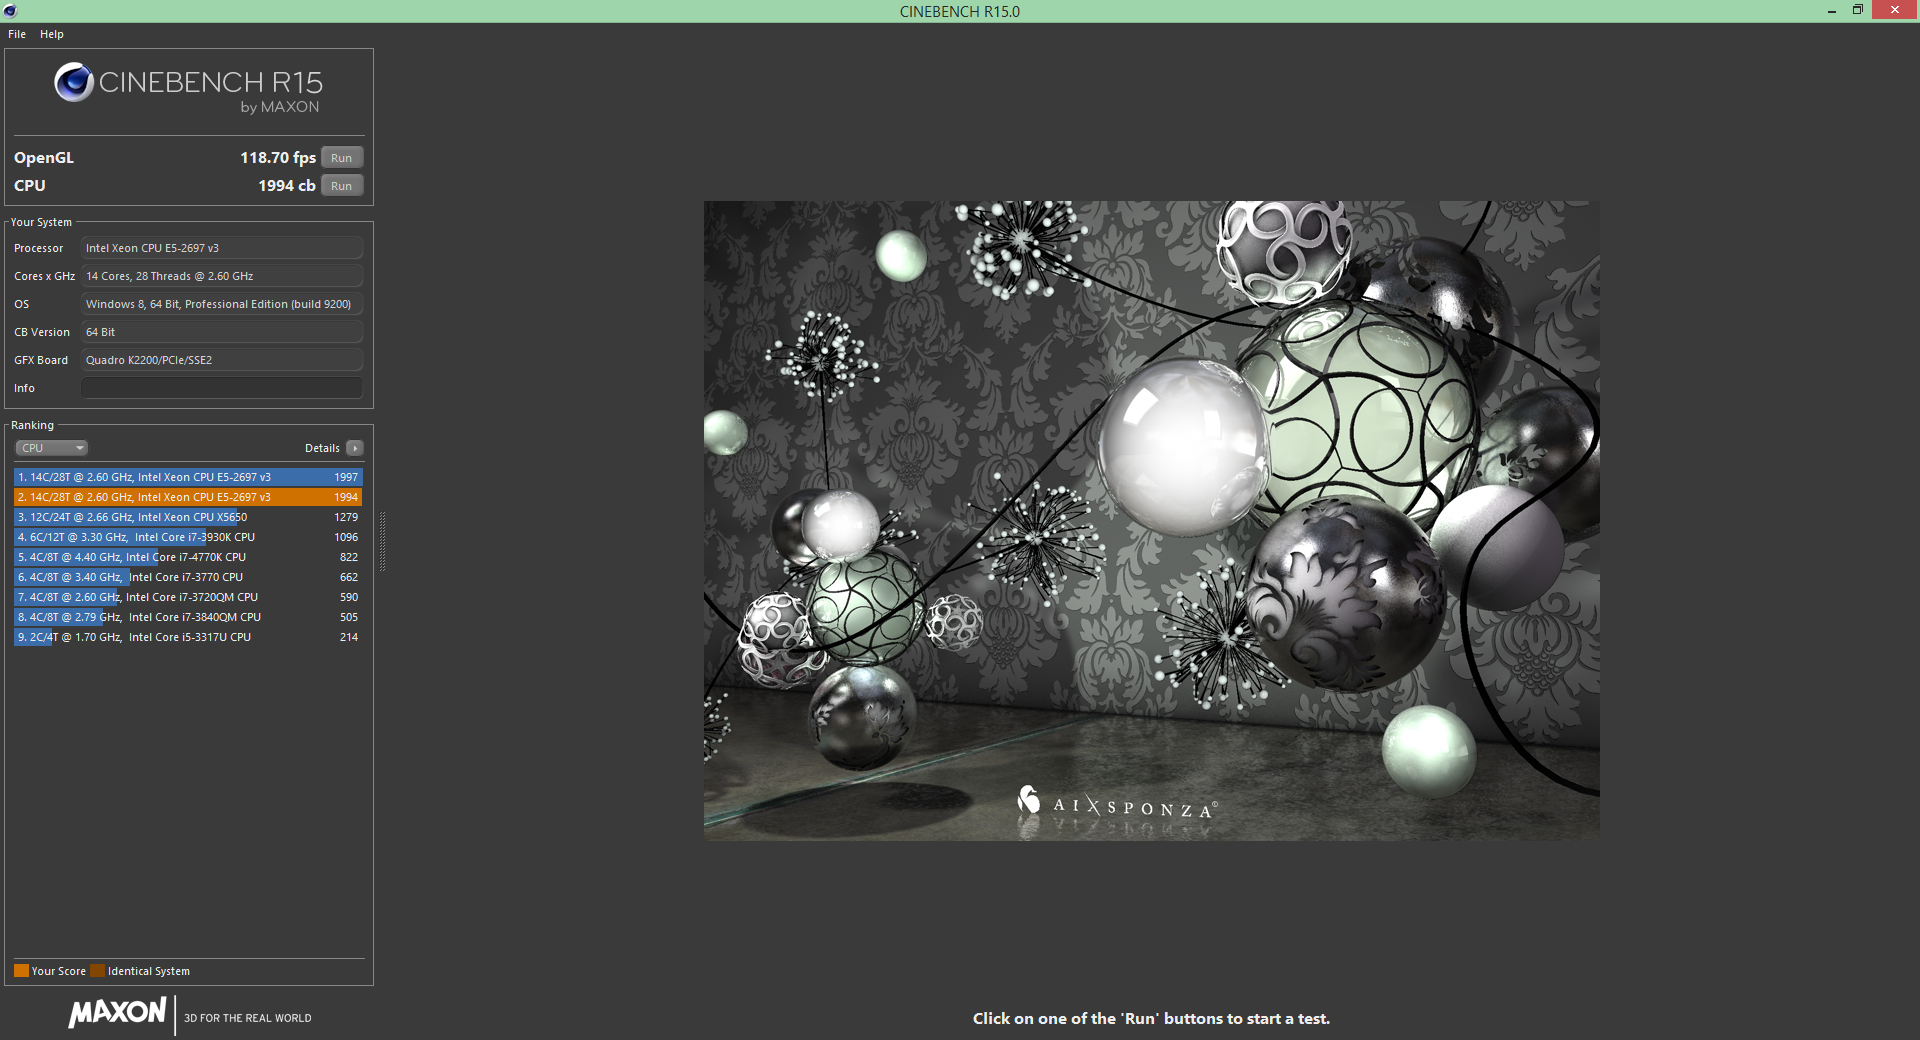
The Cinebench R15 CPU rendering test shows where the strength of the multi-core Intel Xeons lie. The 14-core E5-2697v3 rules the roost, with a rendering score almost twice that of the Intel Core i7-5820K when the latter is running at its stock 3.3GHz. However, when overclocked to 4.4GHz, the Core i7 gains over 25 per cent performance, showing the value of the higher frequency with this particular workload. Nevertheless, for rendering, cores are king, and the more of these you have the better.
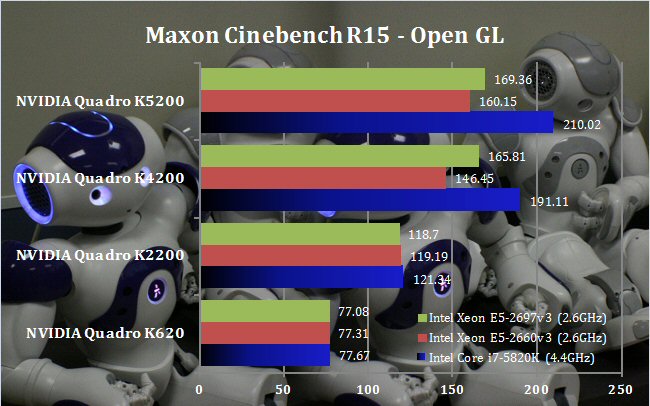
The OpenGL graphics modelling results show a much more interesting story than the rendering, and begin to illustrate why just buying an expensive Xeon is not necessarily the optimum choice for a workstation. It's clear from these graphs that the NVIDIA Quadro K620 is the limitation in systems that use it, as it gets the same result whatever the host CPU. The same is pretty much true with the Quadro K2200, although this is a significantly more powerful graphics card.
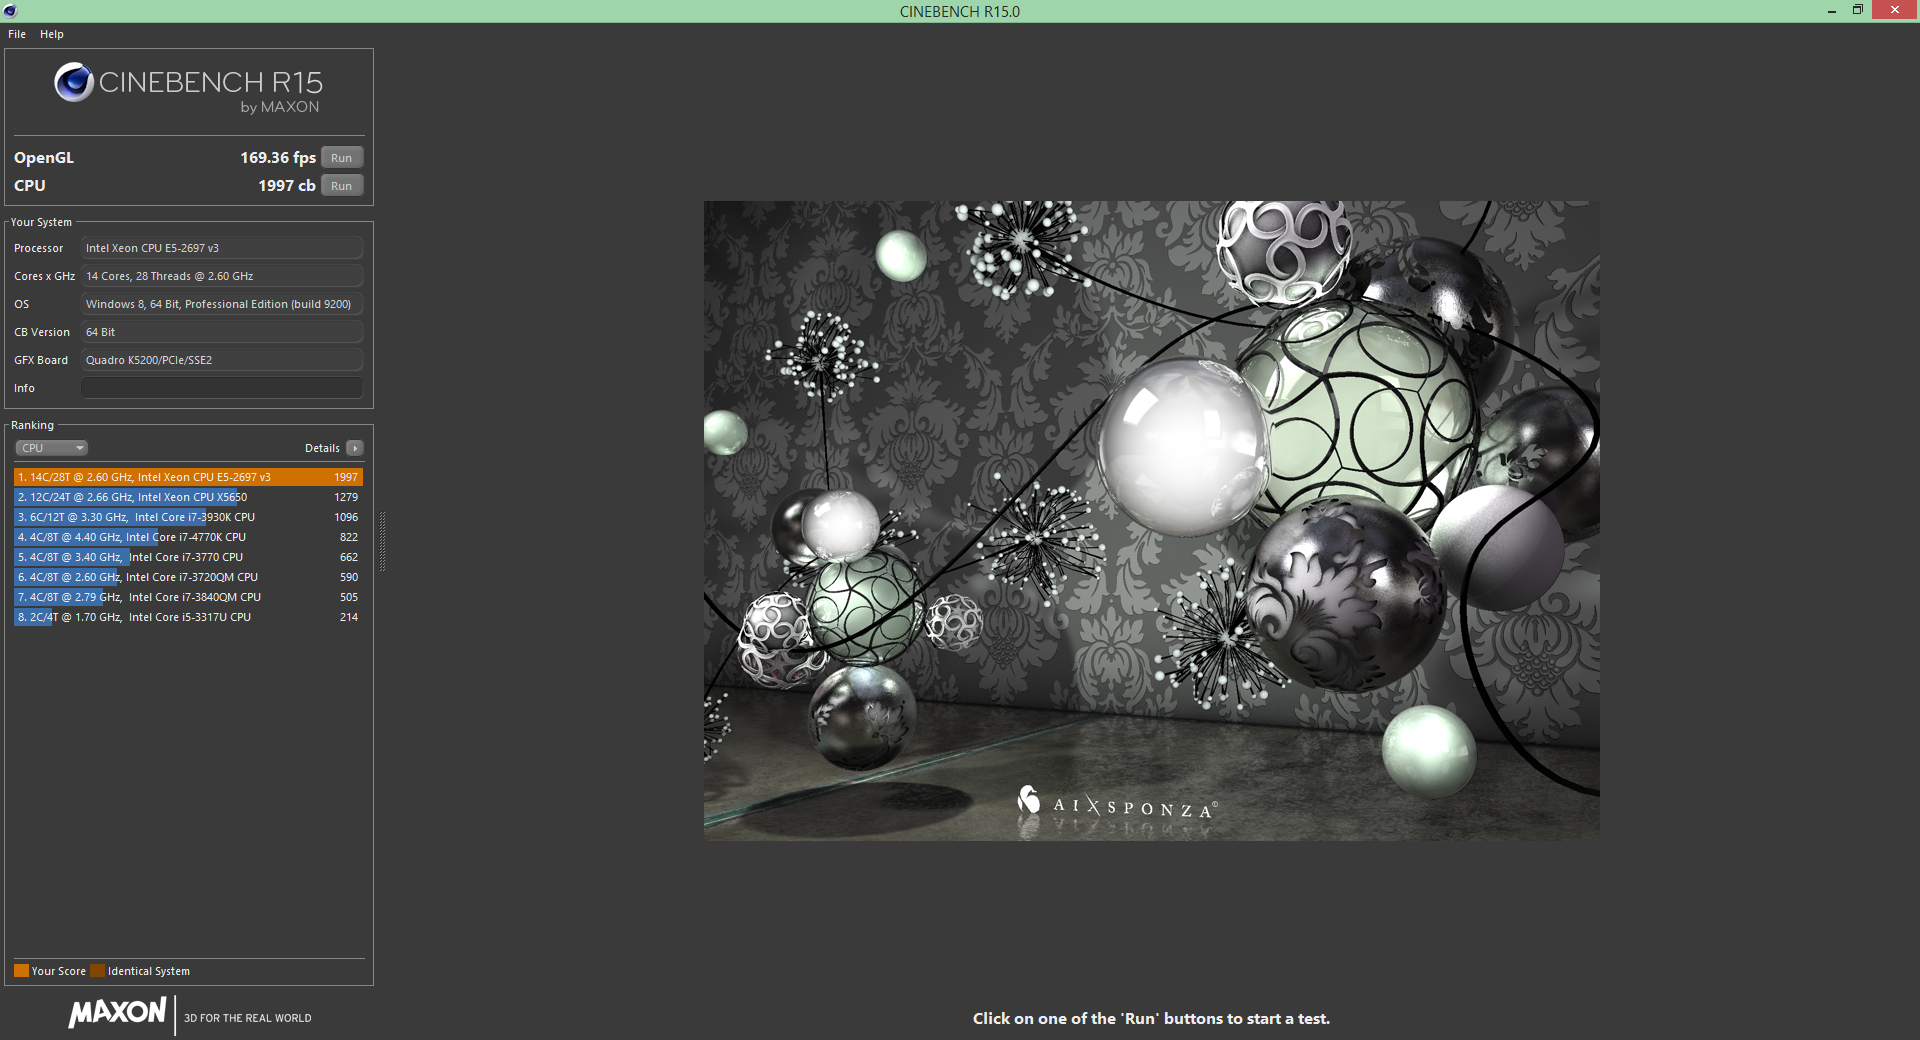
However, with the K4200 and K5200, the underlying CPU clock speed starts to come into play. Modelling applications are generally only using a single processor thread, so having more cores is usually irrelevant. More important is how fast a single core can run. The Xeon E5-2697v3 has a higher Turbo Boost mode (3.6GHz) than the Xeon E5-2660v3 (3.3GHz), so it achieves faster performance with the K4200 and K5200. However, the Intel Core i7-5820K's 4.4GHz clock speed conquers all, and in Maxon Cinebench R15 allows it to achieve significantly faster results. This may not be the case with every application, but if you're modelling (as opposed to rendering) with Maxon Cinema 4D, a fast Intel Core i7 with high-end graphics will give you the smoothest workflow experience, even if a multi-core Xeon will render out the results more quickly afterwards.
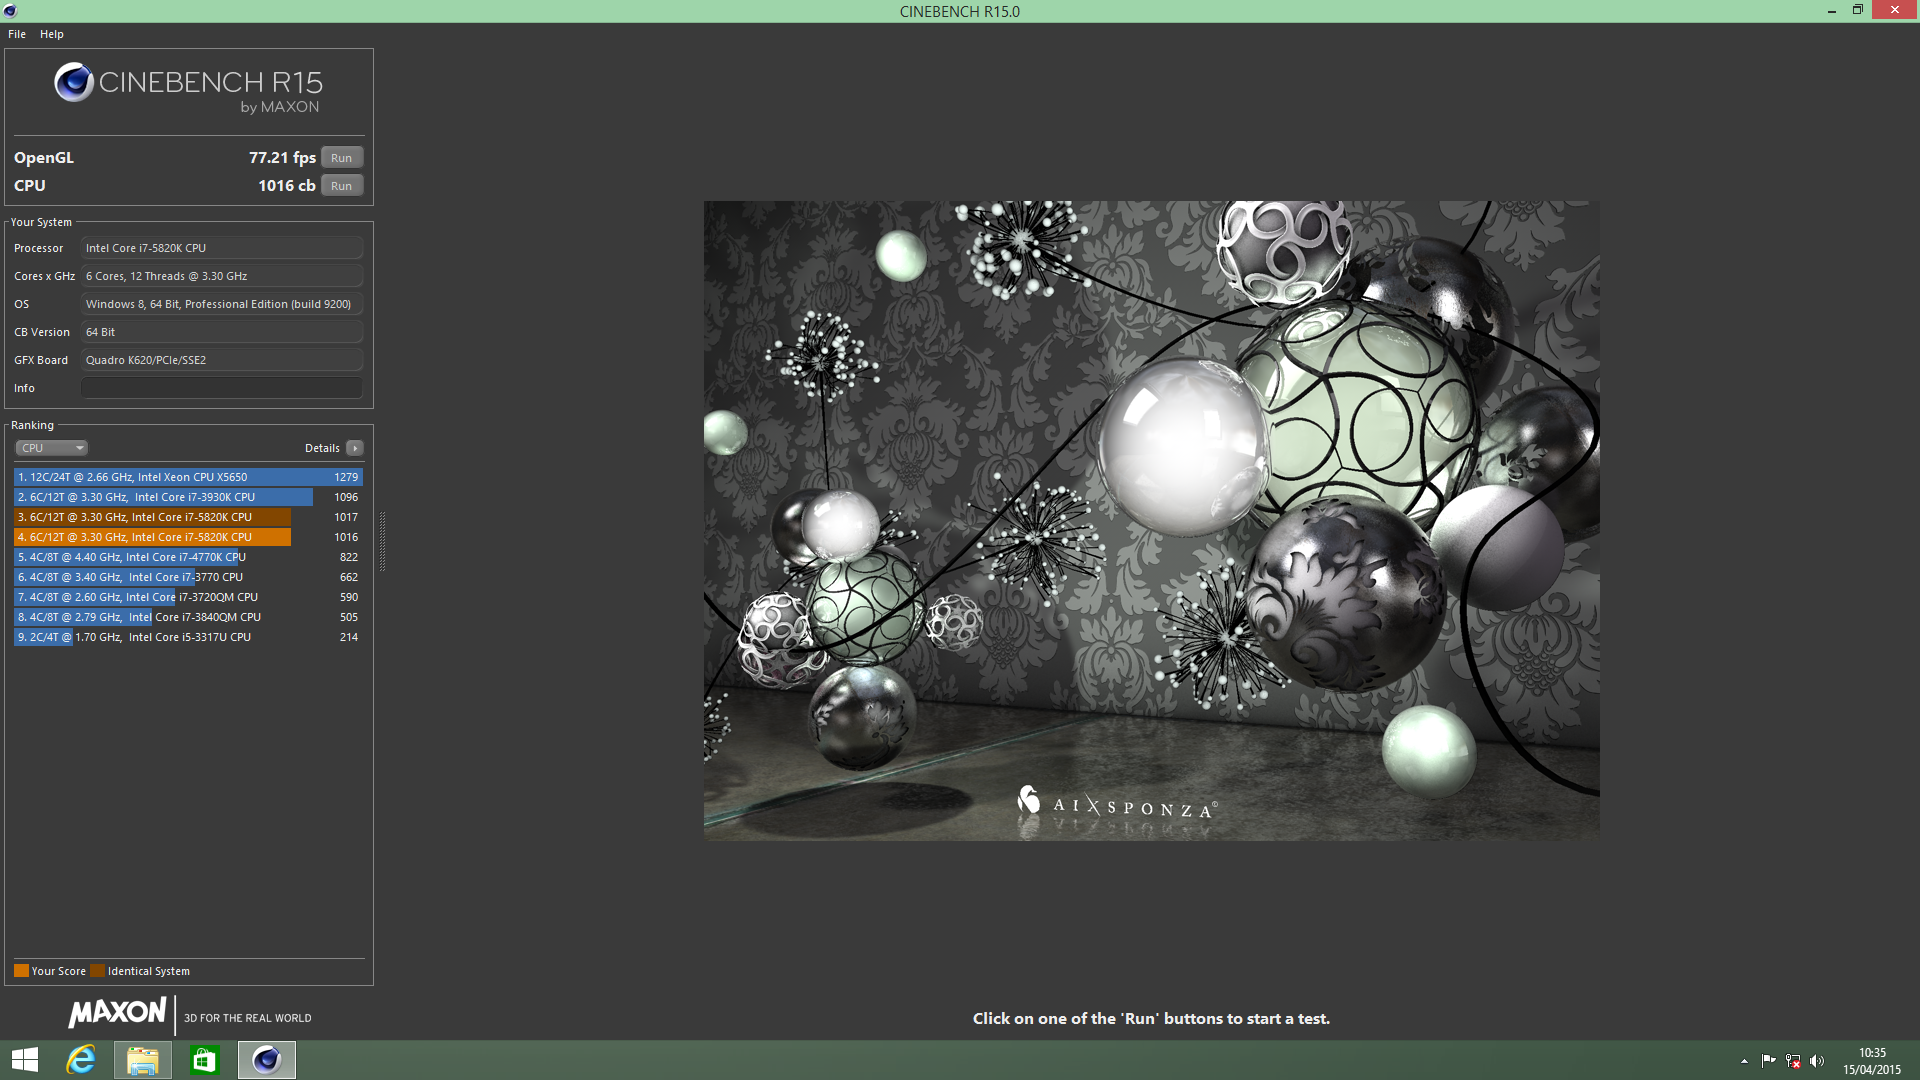
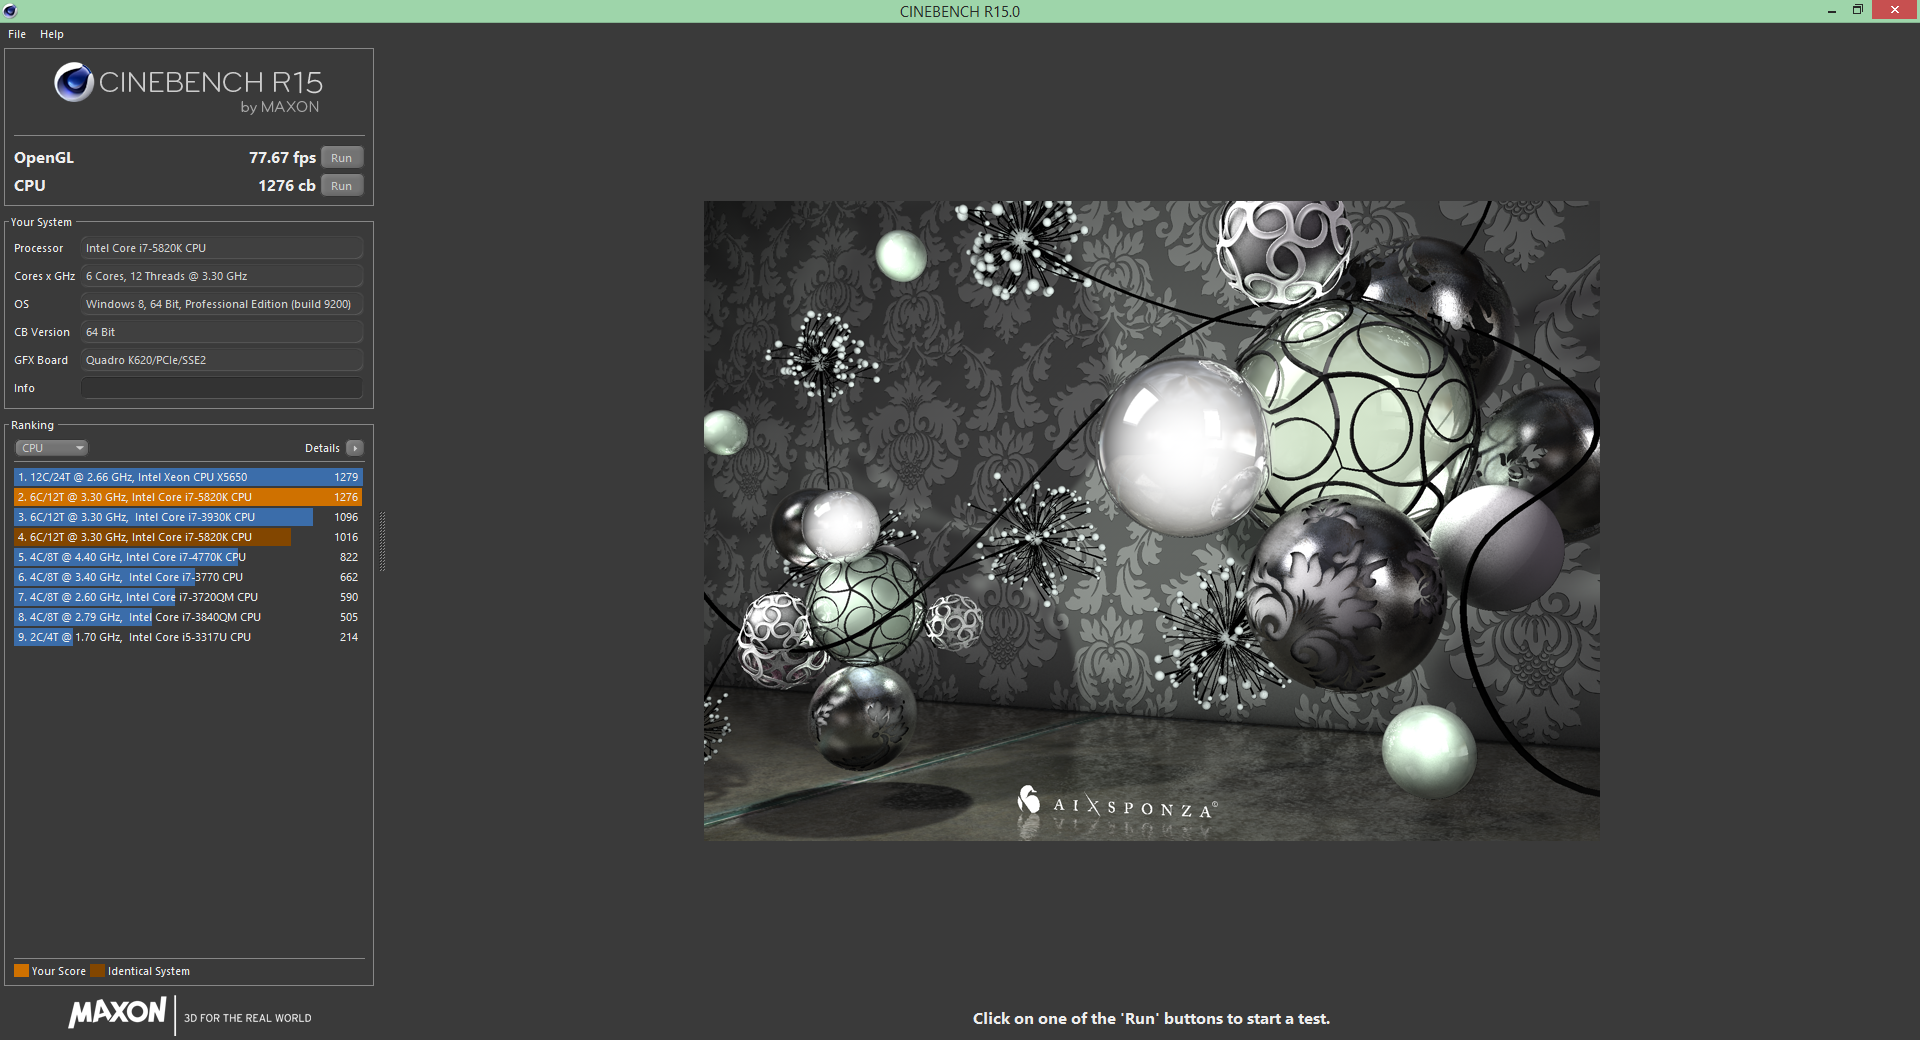
Below are all the screengrabs from the runs of Maxon Cinebench R15 we performed across the 13 different configurations:


CrystalDiskMark
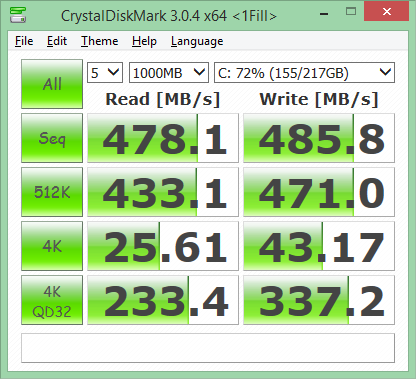
CrystalDiskMark is a useful benchmark to measure theoretical performance levels of hard drives and SSD’s. We are using V3.0.4 x64. We use this program to test the Kingston Solid State Drives in the three different base systems. Surprisingly, there was a variance in performance across the three configurations, despite the identical motherboards used. First up, the entry-level system, with its Intel Core i7-5820K:
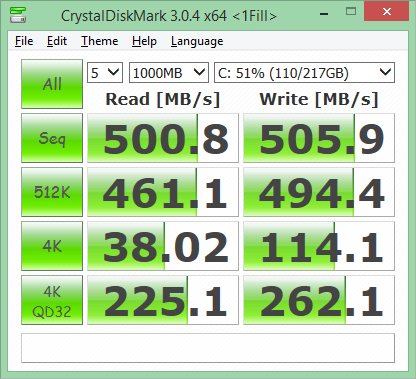
Surprisingly, the Core i7 ruled the roost in sequential, as well as 512K and 4K random reads and writes. The overclock PC Specialist had applied clearly increased the bus speed to the SSD, providing a few percent extra performance in these tests.
These are the results for the midrange Intel Xeon E5-2660v3 system:
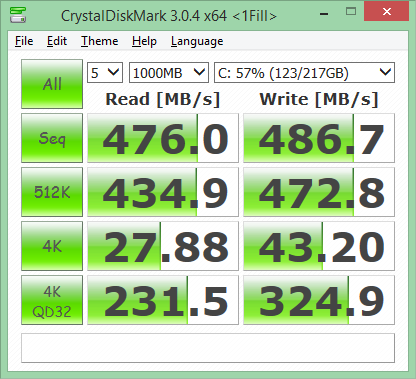
The sequential and random reads and writes are slower than for the Intel Core i7 system, but the QD32 test, which increases the Queue Depth, pushes things back in the Xeon's favour, particularly with writing.
Here are the results for the high-end Intel Xeon E5-2697v3 system:
Sequential and random read / write scores are very similar to the other Xeon, but the QD32 scores are even better. Again, we see a variance in abilities between the clock-oriented Core i7 and the core-count-oriented Xeons, with neither one an outright winner in every category, although the Core i7's clock speed provides benefits in most areas.
This reminds me of this : https://www.youtube.com/watch?v=U5Npt1BSF04
►►► $73.. per-hr @mi9//
,,
➨➨➨https://WorldStarHipHopHosts.com/skills/help…
☠☠☠☠—-.✉✉✉✉☠i like kitguru -in-law makes $86 /hr on the laptop . She has been out of work for 6 months but last month her paycheck was $14455 just working on the laptop for a few hours. check out the post right here > Find More
Good video!
So you havent done a single test in any of demanding programs like premiere, vegas, ae, maya, 3dmax or even blender? Why would I buy an quadro above gtx 780 (for example) the second one is cheaper and has more cores, Id love to see some actual benchmarks proving quadro is or is not actually better in such usage.