The latest drive to join Corsair's line-up of M.2 SSDs is the MP400, which thanks to its use of 96-layer 3D QLC technology, comes in some very useful capacities. Here we review the 2TB model, priced at £240. The MP400 range is made up of some very useful capacities thanks to using 3D QLC NAND; 1TB, 2TB and 4TB, while a mammoth flagship 8TB drive due to arrive very soon. Looking after the NAND is the E12S version of Phison's very popular PS5012 8-channel controller. The official Sequential read performance figure of 3,480MB/s covers all four drives in the range. Sequential write figures are up to 1,880MB/s for the 1TB drive and up to 3,000MB/s for the 2TB, 4TB and 8TB drives. Random 4K read performance is quoted as up to 190,000 IOPS for the 1TB drive, up to 380,000 IOPS for the 2TD drive while the 4TB and 8TB drives share the same up to 610,000 IOPS rating. When it comes to 4K random write ratings, the 2TB drive comes in at up to 560,000 IOPS, the 1TB drive up to 470,000 IOPS while once again the largest two drives share the same 710,000 IOPS figure. Corsair quote an average active power consumption figure of 5.5W for the 2TB drive. Power figures for the other drives in the range are; 4W for the 1TB model, 6.5W for the 4TB and 8TB drives. The 2TB version of the MP400 has an endurance rating of 400TBW and Corsair back the range with a 5-year warranty. Physical Specifications: Usable Capacities: 2TB. NAND Components: 3D QLC NAND. NAND Controller: Phison PS5012-E12S. Cache: Nanya DDR3-1866. Interface: PCIe 3.0 x4, NVMe 1.3. Form Factor: M.2 2280. Dimensions: 80 x 23 x 15mm. Drive Weight: 34g. Firmware Version: ECFM53.0 The drive comes in a fairly compact box with a clear image of the drive on the front. Under the image is a strip label with performance figures for Sequential and 4K performance as well as the drive’s capacity. The rear of the box has multilingual information about the drive's performance and the fact it uses 3D QLC NAND. The 2TB MP400 is built on a double-sided M.2 2280 format, although having said that, the only thing making it double-sided is the single DRAM chip (Nanya NT5CC256M16ER-EK, DDR3-1866) built on one side of the PCB. All the other major components are built on the other side of the PCB; Phison PS5012-E12S controller, four packages of 3D QLC NAND (coded IA7HG66AWA) and a second DRAM chip. Corsair’s SSD management utility is called SSD Toolbox. It provides drive information and S.M.A.R.T details and also supports firmware updates, secure wiping of the drive, drive optimisation and incorporates a disk cloning utility. For testing, the drives are all wiped and reset to factory settings by HDDerase V4. We try to use free or easily available programs and some real-world testing so you can compare our findings against your own system. This is a good way to measure potential upgrade benefits. Main system: AMD Ryzen 5 3600X, 16GB DDR4-2400, Sapphire R9 390 Nitro and an MSI MPG X570 Gaming Edge Wifi motherboard Other drives: Corsair Force MP510 960GB Crucial P1 1TB Kingston KC2000 1TB Kingston KC2500 1TB Patriot Viper VPR100 RGB 1TB Patriot Viper VPN100 1TB PNY CS3030 1TB Seagate FireCuda 510 1TB Samsung SSD970 PRO 1TB Samsung SSD960 EVO 1TB Samsung SSD960 EVO Plus 1TB Kioxia Exceria Plus 2TB Kioxia Exceria NVMe 1TB Kioxia BG4 1TB Kioxia XG6 1TB Western Digital Black SN750 1TB Western Digital Black SN750 1TB with Heatsink Western Digital Blue SN550 1TB Software: Atto Disk Benchmark 4. CrystalMark 6.0 & 7.0.0. AS SSD 2.0. IOMeter. Futuremark PC Mark 10 All our results were achieved by running each test five times with every configuration this ensures that any glitches are removed from the results. Trim is confirmed as running by typing fsutil behavior query disabledeletenotify into the command line. A response of disabledeletenotify =0 confirms TRIM is active. CrystalDiskMark is a useful benchmark to measure theoretical performance levels of hard drives and SSD’s. We are using v6.0. and v7.0. Corsair's 2TB MP400 performs well in CrystalDiskMark's deeper queue depth 4K test. From looking at the two benchmark result screens, it seems that the controller has a preference for handling compressible data. Using this type of data sees a big boost in the random read performance at queue depths 1 and 8. At a queue depth of 1, the MP400 performs well, sitting in the top ten of our results chart. The latest version of CrystalDiskMark, version 7, includes a couple of profiles that can be used for testing – Peak Performance and Real World. The result screens for these two profiles not only display MB/s results but also IOPS and latency. Looking at the Peak Performance results for Sequential read/write performance we could confirm both official Sequential performance figures. The drive is rated up to 3.480MB/s for reads, with the tested drive producing 3,462MB/s and up to 3,000MB/s for writes, with a test result of 2,994MB/s. When it comes to random performance the drive is rated as up to 380,000 IOPS for reads and up to 560,000 IOPS for writes but as you can see from the Peak Performance results, the best we saw from the drive in the CDM 7 benchmark was 323,721 IOPS for reads and 318,185 IOPS for writes. We also used CrystalDiskMark 7 to test the drive at lower queue depths (where most of the everyday workloads occur) using 1 to 4 threads. The read performance climbs smoothly throughout the tested queue depths and threads. In the write tests, the best overall performance comes from the three threaded tests which peak at the QD8 mark at 383,419 IOPS (1,570.49MB/s). The ATTO Disk Benchmark performance measurement tool is compatible with Microsoft Windows. Measure your storage systems performance with various transfer sizes and test lengths for reads and writes. Several options are available to customize your performance measurement including queue depth, overlapped I/O and even a comparison mode with the option to run continuously. Use ATTO Disk Benchmark to test any manufacturers RAID controllers, storage controllers, host adapters, hard drives and SSD drives and notice that ATTO products will consistently provide the highest level of performance to your storage. We are using version 4.0 for our NVMe disk tests. Officially the 2TB MP400 is rated as up to 3.480MB/s and up to 3,000MB/s respectively for Sequential read/write performance. Using the ATTO benchmark we couldn't quite make those maximum figures with the tested drive producing a read figure of 3,190MB/s and 2,830MB/s for writes. AS SSD is a great free tool designed just for benching Solid State Drives. It performs an array of sequential read and write tests, as well as random read and write tests with sequential access times over a portion of the drive. AS SSD includes a sub suite of benchmarks with various file pattern algorithms but this is difficult in trying to judge accurate performance figures. In the ASSSD benchmark, the read score of 2119 is enough to place the 2TB MP400 into the top ten of 1TB+ NVMe drives we've tested. However the write score of 2669 is good enough to put the drive into the top 5 tested drives. IOMeter is another open-source synthetic benchmarking tool which is able to simulate the various loads placed on the hard drive and solid-state drive technology. There are many ways to measure the IOPS performance of a Solid State Drive, so our results will sometimes differ from the manufacturer’s quoted ratings. We do test all drives in exactly the same way, so the results are directly comparable. We test 128KB Sequential read and write and random read and write 4k tests. The test setup’s for the tests are listed below. Each is run five times. 128KB Sequential Read / Write. Transfer Request Size: 128KB Span: 8GB Thread(s): 1, Outstanding I/O: 1-32 Test Run: 20 minutes per test. 4K Sustained Random Read / Write. Transfer Request Size: 4KB Span: 80GB Thread(s): 4, Outstanding I/O: 1-32 Test Run: 20 minutes per test. 4K Random 70/30 mix Read/Write. Transfer Request Size: 4KB Span: 80GB Reads: 70% Writes: 30% Thread(s): 4 Outstanding I/O: 2 – 32 Test Run: 20 minutes. The official Sequential read/write performance figures for the 2TB version of the MP400 are up to 3,480MB/s and up to 3,000MB/s respectively. With our own Sequential tests we could confirm both maximums with a read figure of 3,496.76MB/s with writes coming in at 3,010.18MB/s. 128KB Sequential Read Performance v QD Compared. The MP400 sits in the lower part of the results charts through queue depths 1 to 4 but at a queue depth of 32, it climbs to fourth place in the charts with its 3,496.76MB/s result. 128KB Sequential Write Performance v QD Compared. At a queue depth of 1, the MP400 is the fastest drive in this category we have tested to date when it comes to Sequential writes. However, as the queue depth deepens the performance drops back down the tables. The MP400 is official rated as up to 380,000 IOPS for 4K random reads. Using our standard 4-threaded test, the best figure we saw was 161,171 IOPS at a queue depth of 32. We then retested the drive using eight threads at QD32 and got a figure of 423,824 IOPS, much faster than the official figure. 4K Random Read v QD Performance Compared. At QD1 the MP400 performs very well, sitting in second place in our results table with 55,972 IOPS. However, the performance in comparison to the other drives around it at QD1 falls away as the queue depth deepens. The MP400 performs better in our 4-threaded 4K random write test than it does with the read tests although the best result of 271,327 IOPS (QD32) is still way off the official maximum of 560,000 IOPS. As with the read tests, we did a quick test of the drive using 8 threads at QD32 which yielded a figure of 493,280 IOPS, much improved, but still way short of the official figure. 4K Random Write v QD Performance Compared The drive performs solidly at QD1 (162,087 IOPS) before dropping sharply at QD2 (106,396 IOPS) but it recovers pretty well so that by the time the test finishes at QD32, the performance has risen to 271,327 IOPS. 
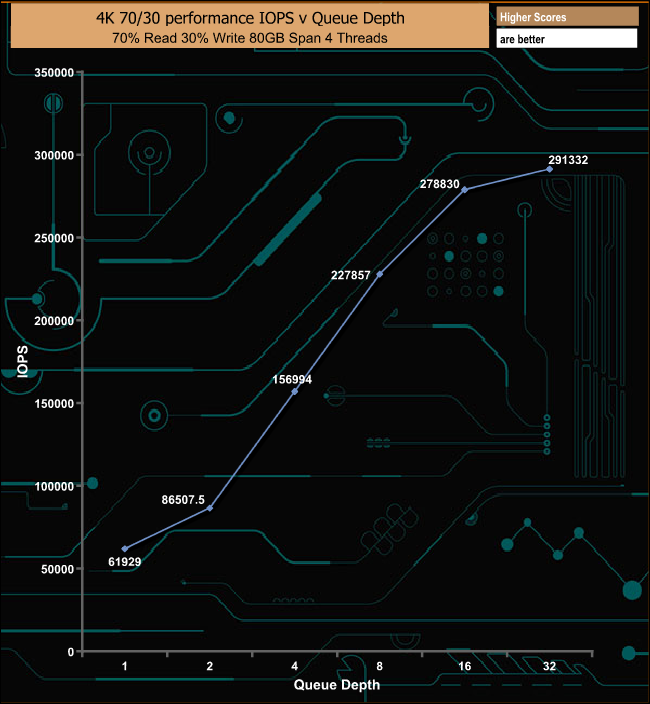
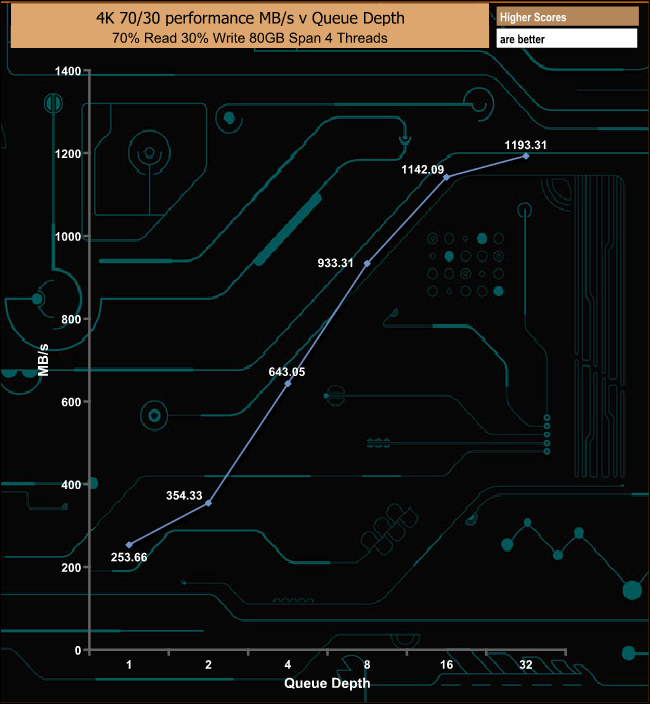
The MP400 displays strong performance in our mixed 70/30 read/write tests, peaking at 291,332 IOPS (1,193.31MB/s) at a QD of 32. In our read throughput test, the MP400 peaked at 2,804.02MB/s at the end of the test run at the 16MB block mark although this figure is some way short of the official maximum of 3,480MB/s. The MP400's peak throughput figure of 2,804.02MB/s puts it firmly in the middle of our results chart. Peak writes in our throughput test came at the 4MB block mark at 2,928.75MB/s, not that far short of the official maximum figure of 3,000MB/s. The write throughput performance puts the MP400 comfortably in the top ten drives we've tested to date. The PCMark 10 Full System Drive Benchmark uses a wide-ranging set of real-world traces from popular applications and common tasks to fully test the performance of the fastest modern drives. The benchmark is designed to measure the performance of fast system drives using the SATA bus at the low end and devices connected via PCI Express at the high end. The goal of the benchmark is to show meaningful real-world performance differences between fast storage technologies such as SATA, NVMe, and Intel’s Optane. The Full System Drive Benchmark uses 23 traces, running 3 passes with each trace. It typically takes an hour to run. Traces used: Booting Windows 10. Adobe Acrobat – starting the application until usable. Adobe Illustrator – starting the application until usable Adobe Premiere Pro – starting the application until usable. Adobe Photoshop – starting the application until usable. Battlefield V – starting the game until the main menu. Call of Duty Black Ops 4 – starting the game until the main menu. Overwatch – starting the game until main menu. Using Adobe After Effects. Using Microsoft Excel. Using Adobe Illustrator. Using Adobe InDesign. Using Microsoft PowerPoint. Using Adobe Photoshop (heavy use). Using Adobe Photoshop (light use). cp1 Copying 4 ISO image files, 20 GB in total, from a secondary drive to the target drive (write test). cp2 Making a copy of the ISO files (read-write test). cp3 Copying the ISO to a secondary drive (read test). cps1Copying 339 JPEG files, 2.37 GB in total, to the target drive (write test). cps2 Making a copy of the JPEG files (read-write test). cps3 Copying the JPEG files to another drive (read test). The best performance in the creative group of tests was the 437MB/s from the Adobe Photoshop heavy use test trace while the MP400 also showed strong performance in the Battlefield V (557MB/s) game test and the cp1 write (2,353MB/s) file transfer test. For the long term performance stability test, we set the drive up to run a 20-minute 4K random test with a 30% write, 70% read split, at a Queue Depth of 256 over the entire disk. The 2TB MP400 averaged 47,504 IOPS for the test with a performance stability of 44%. To test real life performance of a drive we use a mix of folder/file types and by using the FastCopy utility (which gives a time as well as MB/s result) we record the performance of drive reading from & writing to a 256GB Samsung SSD850 PRO. We use thee following folder/file types: 100GB data file. 60GB iso image. 60GB Steam folder – 29,521 files. 50GB File folder – 28,523 files. 12GB Movie folder – (15 files - 8 @ .MKV, 4 @ .MOV, 3 @ MP4). 10GB Photo folder – (304 files - 171 @ .RAW, 105 @ JPG, 21 @ .CR2, 5 @ .DNG). 10GB Audio folder – (1,483 files - 1479 @ MP3, 4 @ .FLAC files). 5GB (1.5bn pixel) photo. BluRay Movie - 42GB. 21GB 8K Movie demos - (11 demos) 16GB 4K Raw Movie Clips - (9 MP4V files). 4.25GB 3D Printer File Folder - (166 files - 105 @ .STL, 38 @ .FBX, 11 @ .blend, 5 @ .lwo, 4 @ .OBJ, 3@ .3ds). 1.5GB AutoCAD File Folder (80 files - 60 @ .DWG and 20 @.DXF). Our real-life file transfers didn’t cause the MP400 any real problems. The fastest transfer was the AutoCAD folder (3 secs) while it comes as no surprise to see the 50GB file folder transfer as the slowest, but only for reads. Somewhat surprisingly the drive seemed to struggle when the 100GB data file was written to it. To get a measure of how much faster PCIe NVMe drives are than standard SATA SSDs, we use the same files but transfer to and from a 512GB Toshiba OCZ RD400: Using the NVMe drive to transfer the files to and from the Corsair MP400 saw the AutoCAD folder once again take the top spot. The 50GB file folder transfer was the slowest while the 100GB data file transfer improved greatly. The lastest drive to join Corsair's stable of NVMe M.2 drives is the MP400, the company's first drive to make use of 3D QLC NAND, in this case, 96-layer QLC NAND. The drive also drops the Corsair Force branding. The new drive comes in four capacities starting at 1TB. It's not that long ago that a 1TB SSD would be the flagship model of a drive range but it just shows how fast the technology is moving that by using 3D QLC NAND, Corsair can offer this size drive as the entry-level model in a model range aimed at the consumer market space. The rest of the range consists of 2TB, 4TB and the soon to arrive mega 8TB flagship drive. Officially the 2TB MP400 is rated as up to 3,480MB/s and 3,000MB/s for Sequential read and write respectively. When tested with the ATTO benchmark the review drive produced a read figure of 3,190MB/s with writes at 2,830MB/s, so both figures are shy of the official maximum. However, using our own Sequential tests we could confirm those official figures with a read score of 3,496.76MB/s and 3,010.18MB/s for writes. As for random performance, Corsair rate the 2TB as up to 380,000 IOPS for reads and up to 560,000 IOPS for writes. Unfortunately with our standard 4-threaded random 4K tests, we couldn’t get anywhere near those official figures with 161,171 IOPS being the best read figure we could get, with writes at 271,327 IOPS both at a queue depth of 32. However, we did some quick 8-threaded testing at QD of 32 and got a read figure of 423,824 IOPS, bettering the official figure by some margin. The write figure of 493,280 IOPS on the other hand although much improved, was still short of the official figure. Corsair’s SSD Toolbox management utility isn't as well featured or as fancy looking as some but it does provide drive information, S.M.A.R.T details and supports firmware updates, secure wiping of the drive, drive optimisation and disk cloning. We found the 2TB Corsair MP400 on CCL Computers for £239.99 (inc VAT) HERE. Discuss on our Facebook page HERE. Pros Sequential performance. Line-up is made up of large capacities. 5-year warranty. Pricing. Cons Couldn’t match those official 4K Random figures with our standard tests. No hardware encryption support. KitGuru says: By employing 3D QLC NAND technology in the MP400, Corsair is able to offer some very large capacity SSDs at attractive price points.