
Corsair have a couple of M.2 2230 SSDs in their MP600 Gen 4 SSD range, including the MP600 Mini, as well the drive we are looking at here, the MP600 Core Mini. The Mini uses TLC NAND while the Core Mini has QLC NAND. At just £70 for a 1TB model, we find out what the Core Mini can bring to the table.
The MP600 Core Mini comes in just two capacities (at the time of writing) 2TB and 1TB, the version we are looking at here. Incidentally the MP600 Mini only comes as a 1TB unit currently.
Corsair's MP600 Core Mini combines a Phison PS5021-E21 4-channel controller with a single 176-layer 3D QLC NAND package. The PS5021-E21 is a DRAM-less design 4-channel controller so the Core Mini uses HMB (Host Memory Buffer) technology for caching duties, the drive uses a small portion of the system's main memory for cache.
Performance-wise the 1TB MP600 Core Mini is rated as up to 5,000MB/s and 3,800MB/s respectively for Sequential reads and writes. The 2TB drive gets the same ratings. Random performance is quoted as up to 650,000 IOPS for reads and up to 900,000 IOPS for writes for the 1TB drive. The 2TB model has the same write rating but a slower read figure of up to 550,000 IOPS.
Endurance for the 1TB MP600 Core Mini is a modest 250TBW and Corsair backs the drive with a 5-year warranty.
Physical Specifications:
- Usable Capacities: 1TB.
- NAND Components: 176-layer 3D QLC NAND.
- NAND Controller: Phison PS5021-E21-48.
- Cache: None (HMB technology).
- Interface: PCIe Gen 4 x4, NVMe 1.4.
- Form Factor: M.2 2230.
- Dimensions: 22 x 30mm.
- Drive Weight: 3g.
Firmware Version: ELFMC1.0
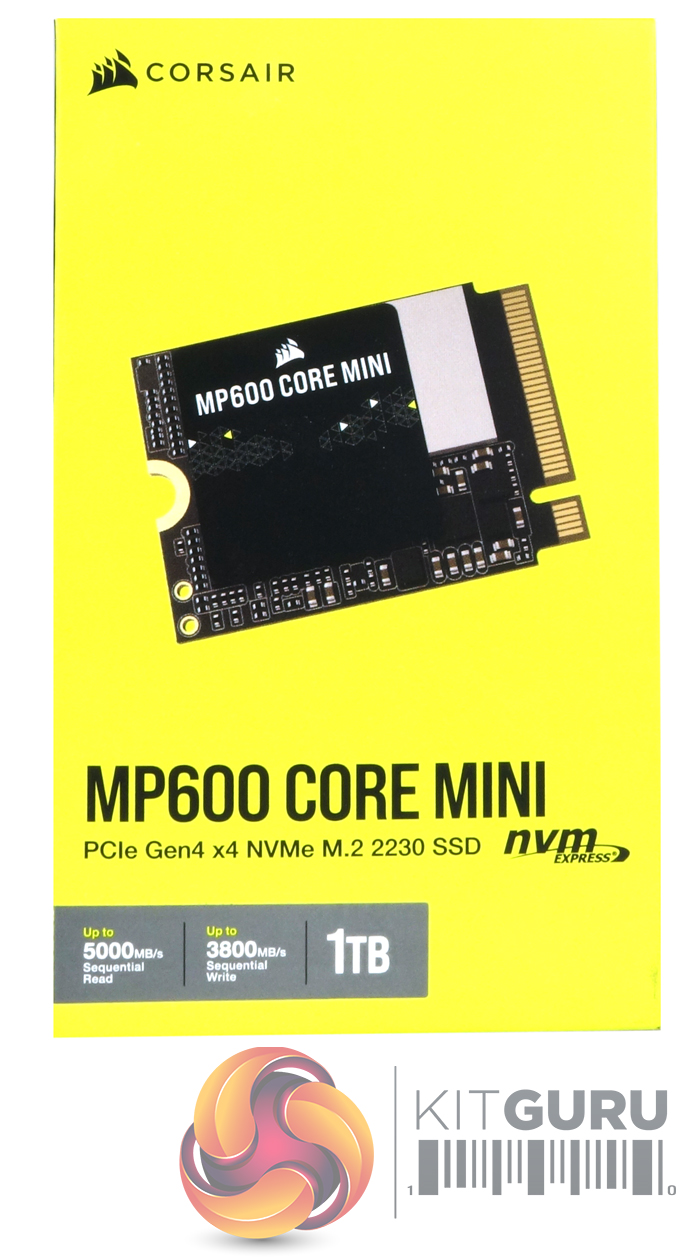
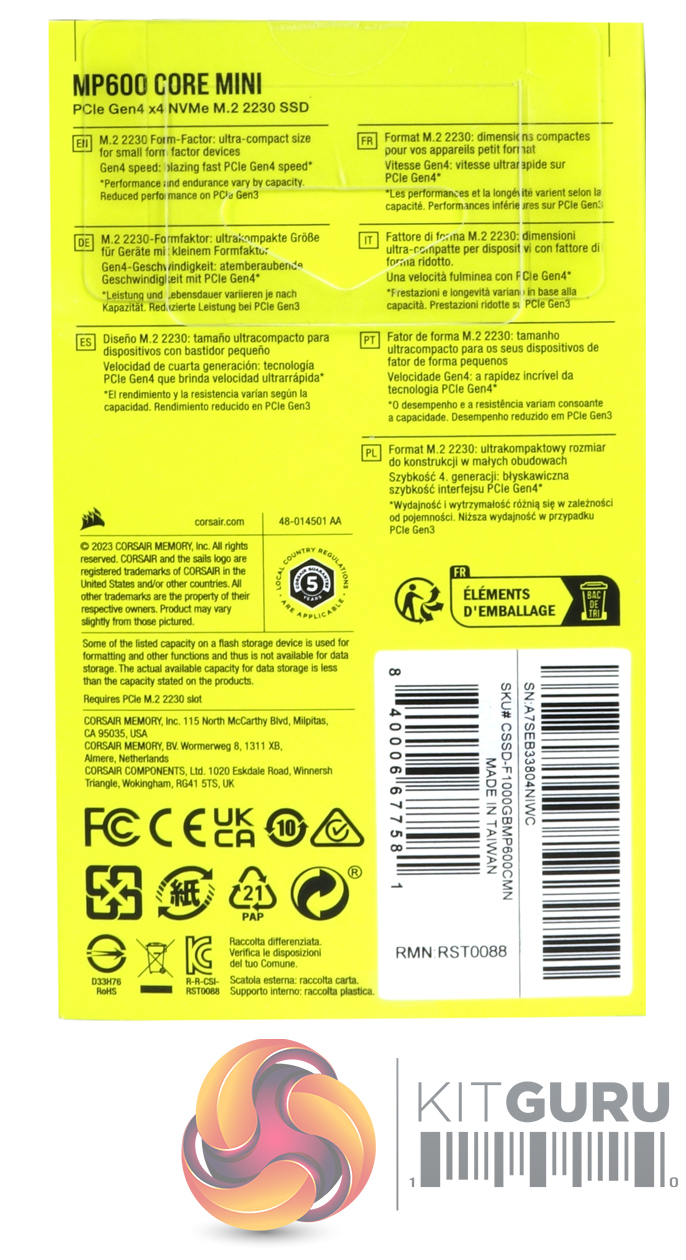
The Core Mini comes in a very compact box with a clear image of the drive on the front. Under the image is a strip label with performance figures for the Sequential read / write performance as well as the drive’s capacity. The rear of the box has multilingual information about the drive's performance.
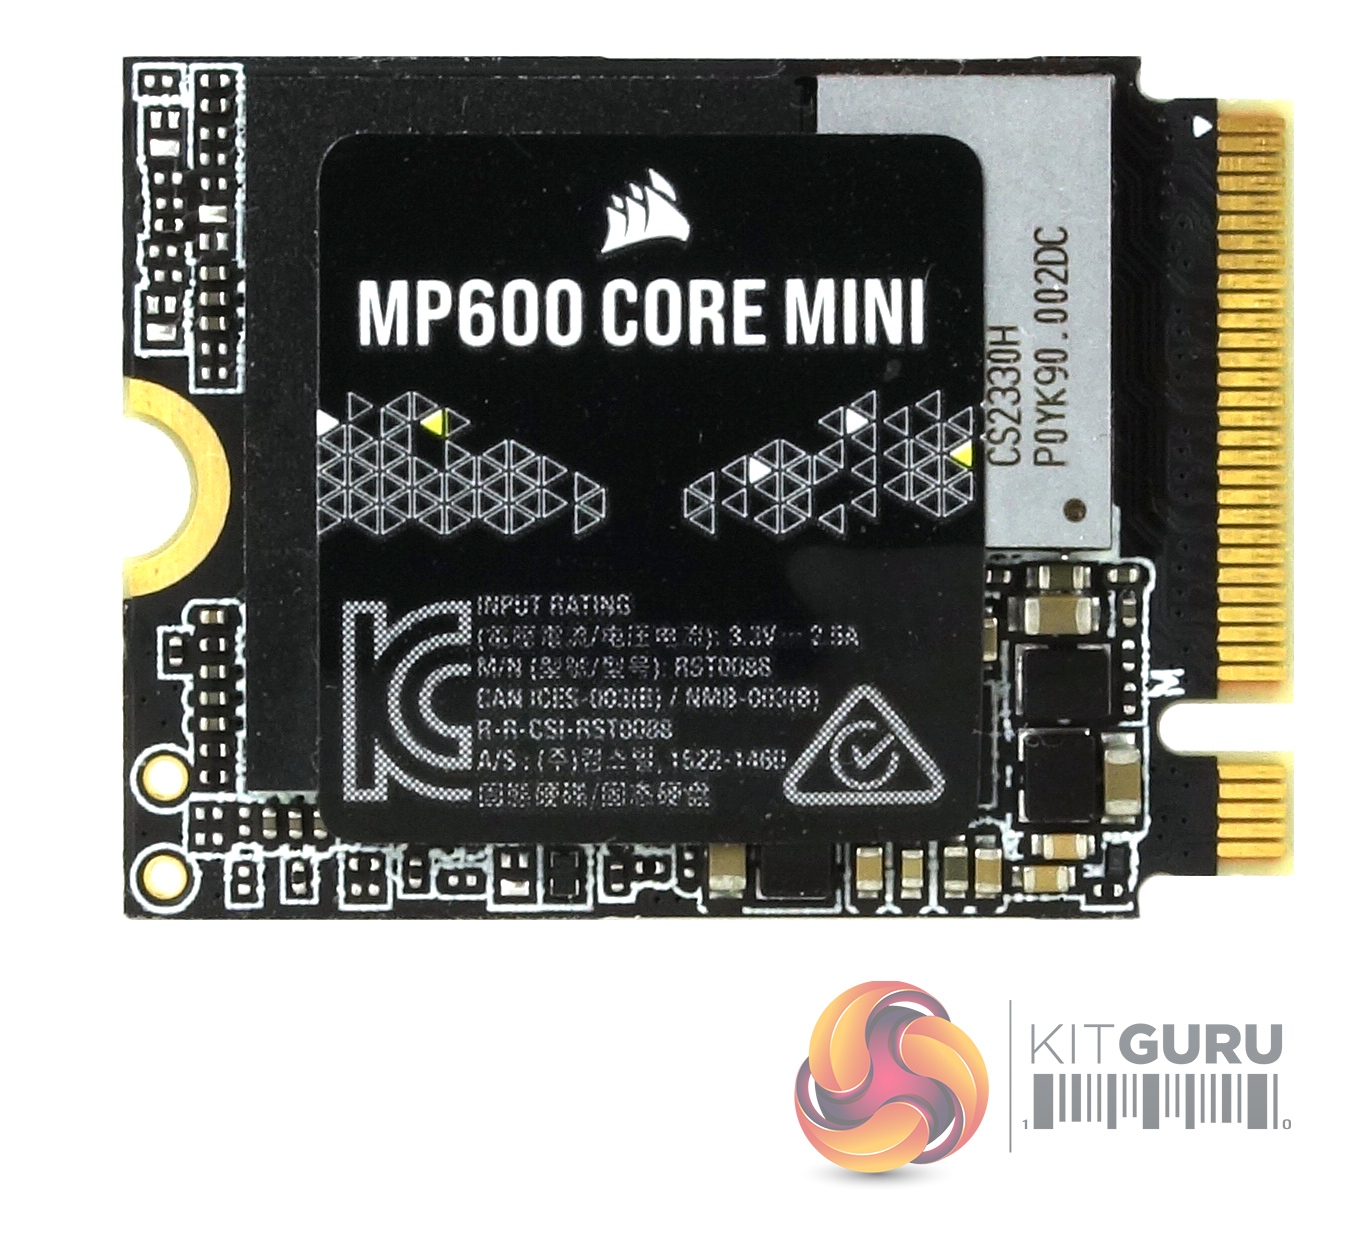
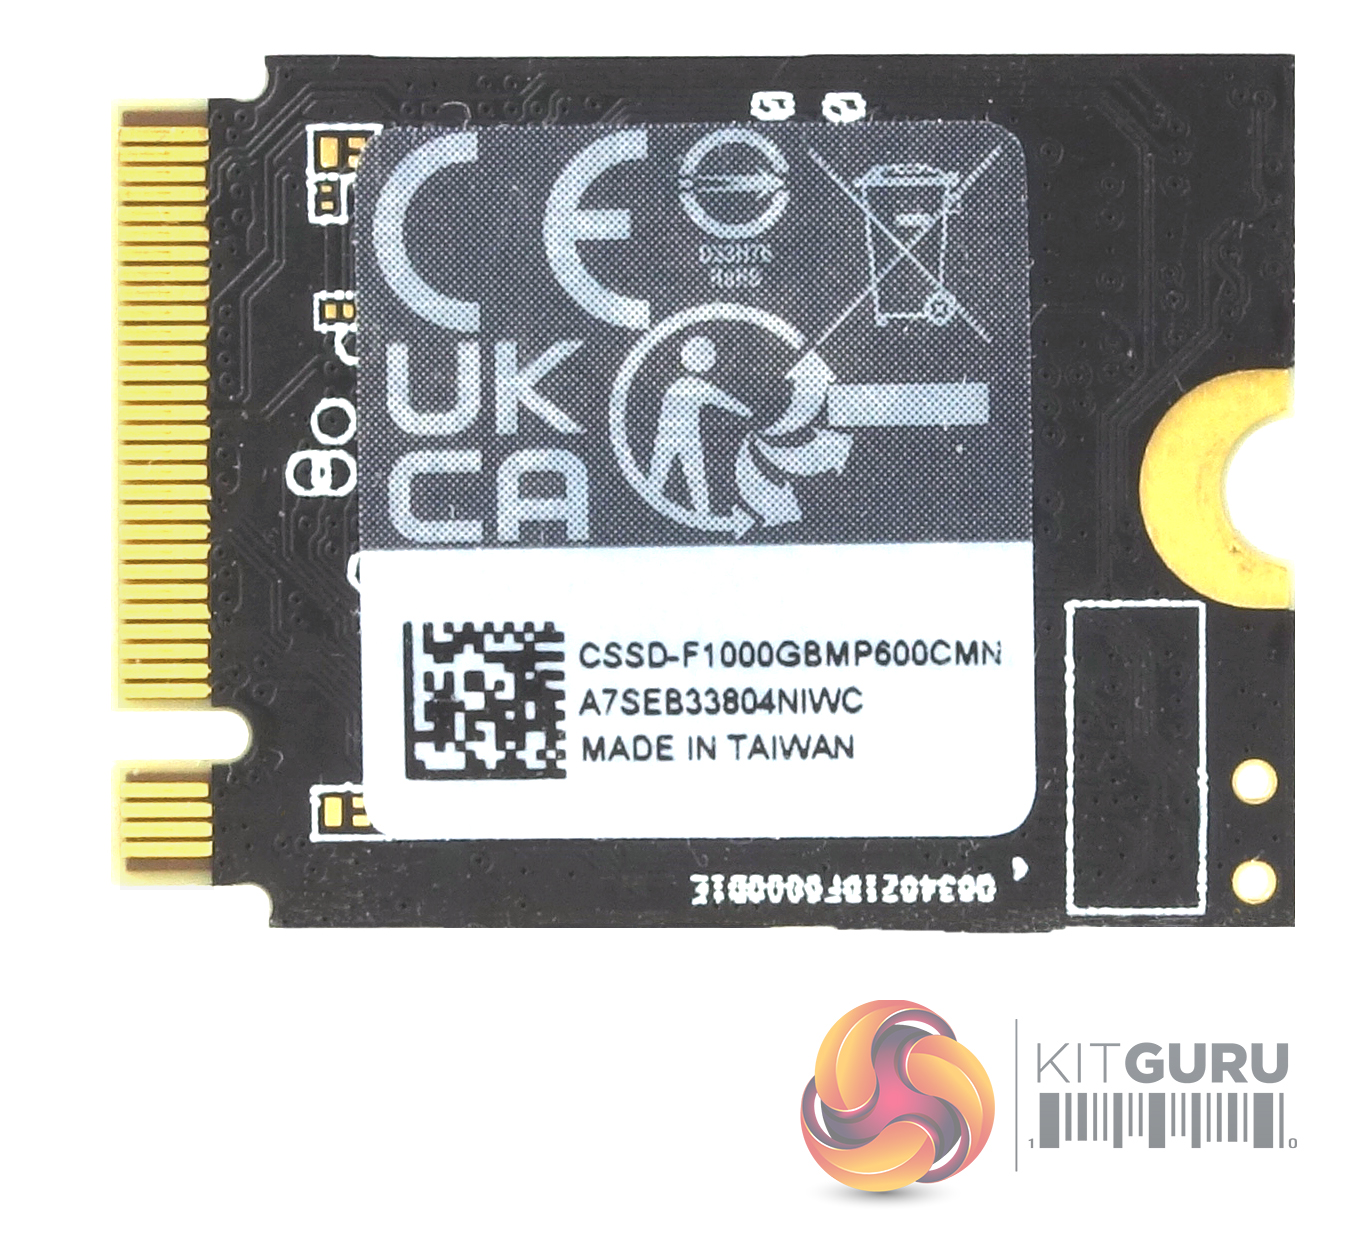
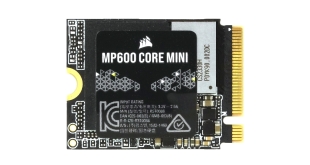
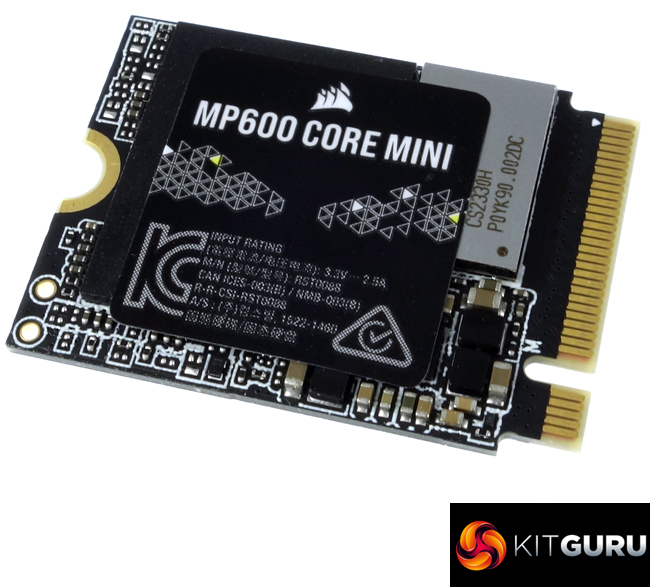
The 1TB MP600 Core Mini is built on a single-sided M.2 2230 format.
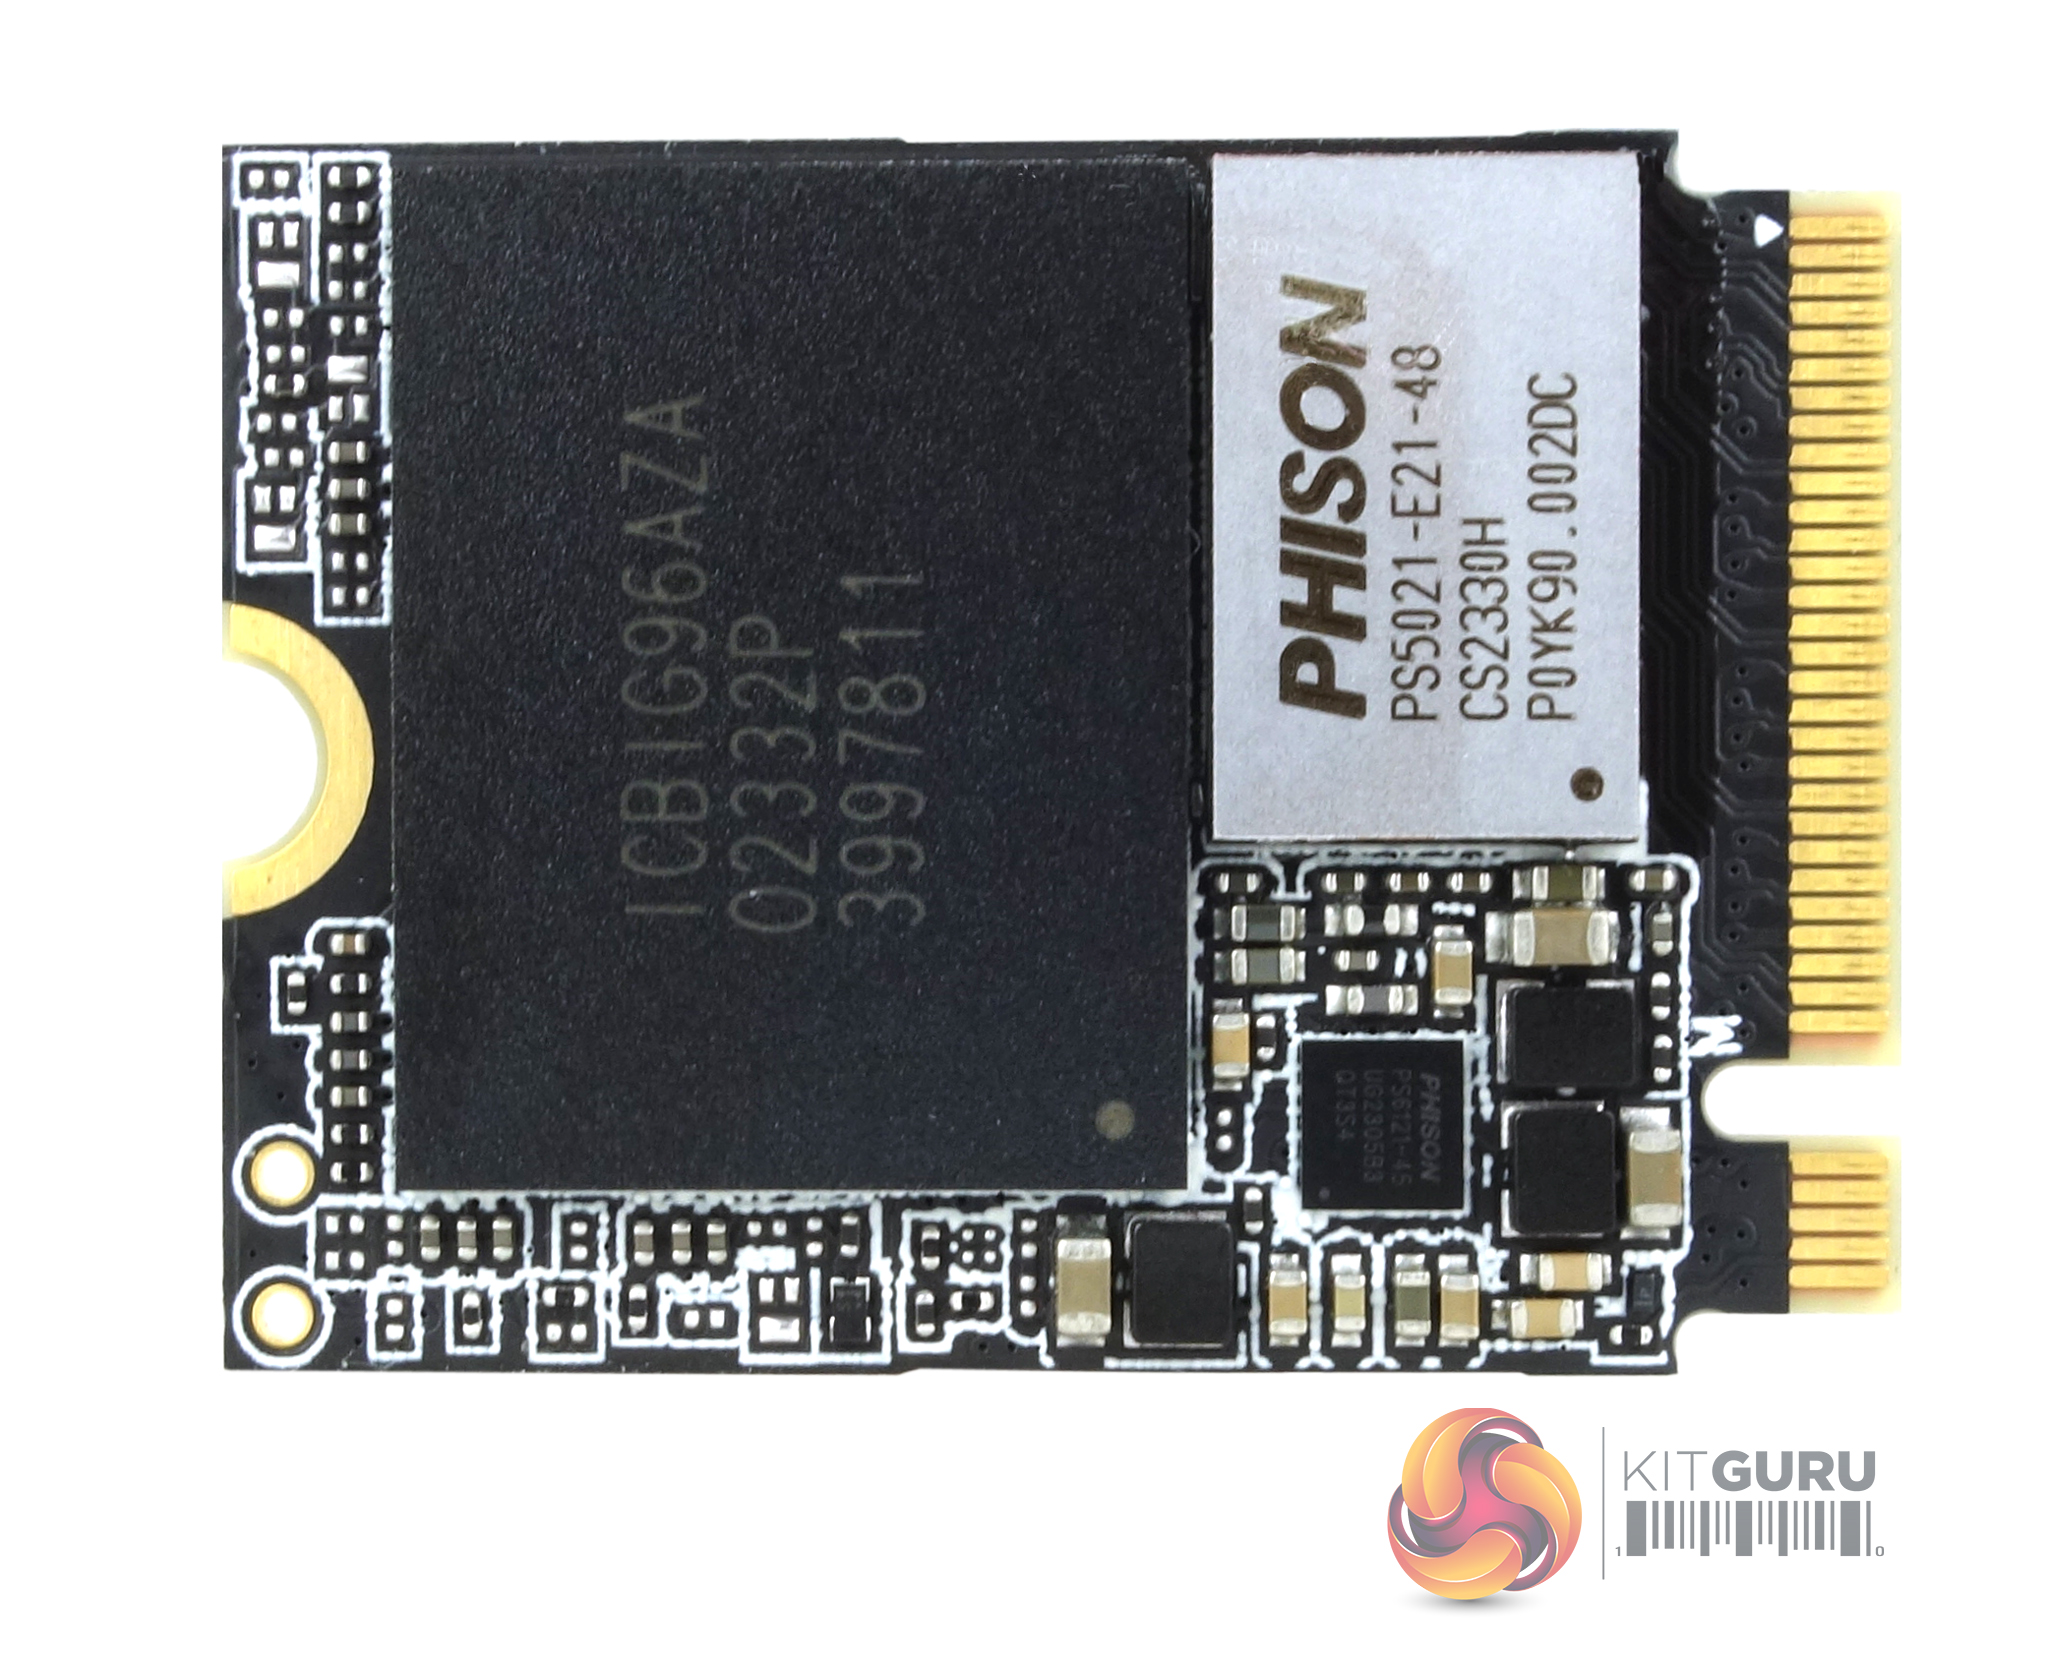
Under the top product label sits a Phison PS5021-E21-48 controller and a single 1TB package of Micron 176-layer 3D QLC NAND (coded ICBIG96AZA). Phison's PS5021-E21-48 is built on a 12nm TSMC process and comes in a 7.5 x 12mm package. The 4-channel controller has been designed for DRAM-less operation relying instead on HMB (Host Memory Buffer) technology.
The single CPU architecture, using a built-in ARM 32-bit Cortex-R5, supports up to 8TB of both TLC or QLC NAND (Toggle 5.0 and ONFi 5.0 compliant) at speeds of up to 5,000MB/s and 4,000MB/s for Sequential reads and writes respectively with random performance quoted as up to 780,000 IOPS for reads and up to 800,000 IOPS for writes. Data reliability is provided by Phison's 5th generation LDPC ECC along with End-To-End Data Path Protection. It also supports AES 256-bit Encryption.
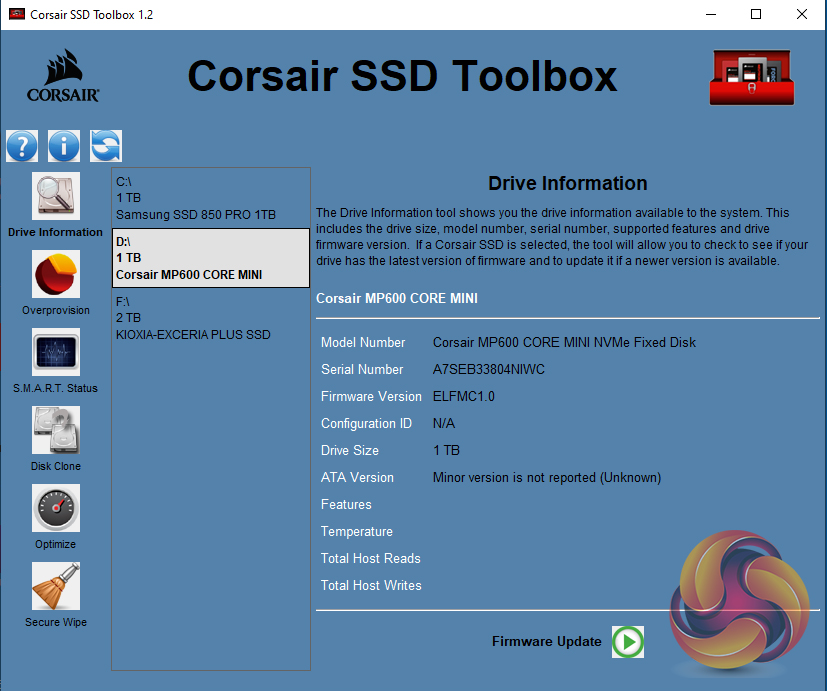
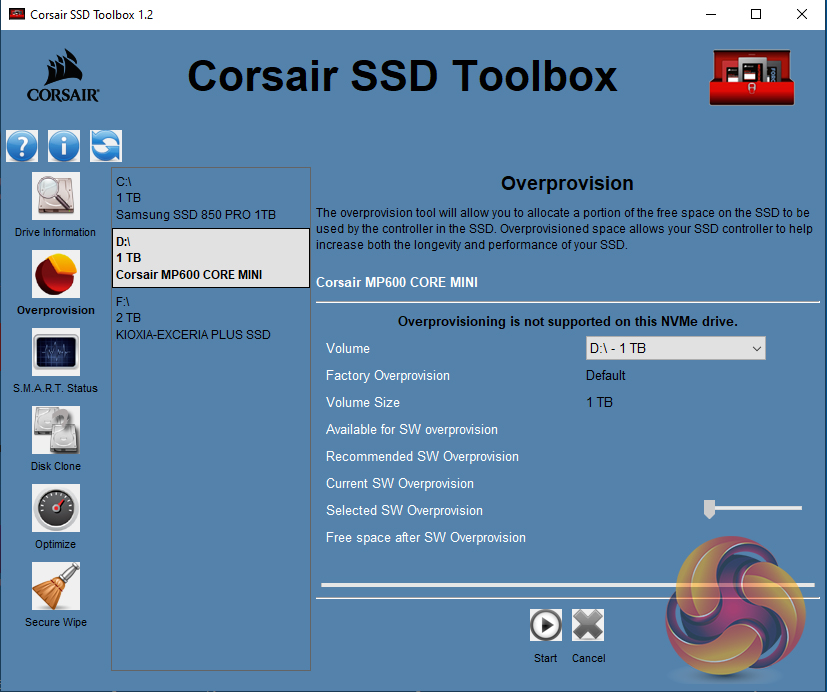
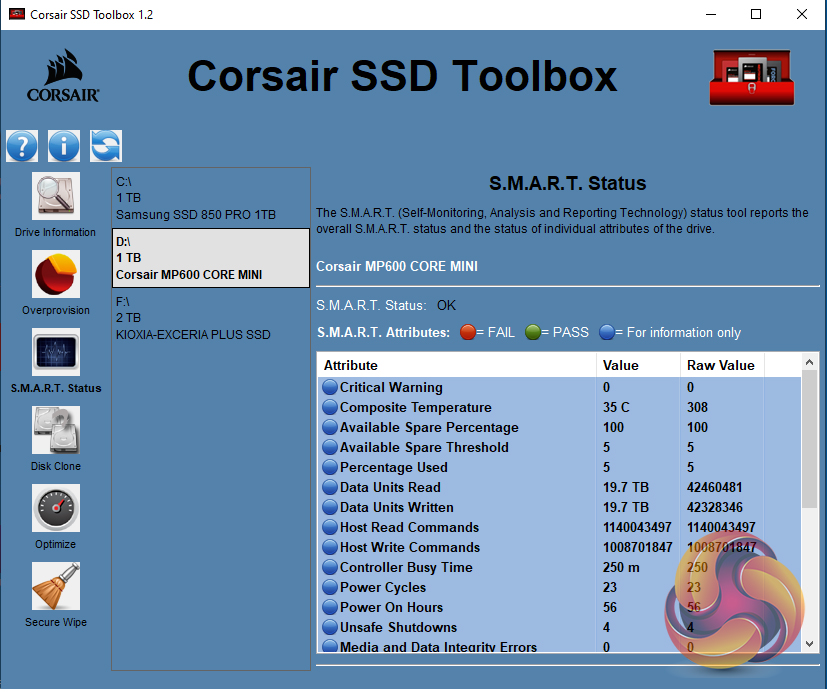
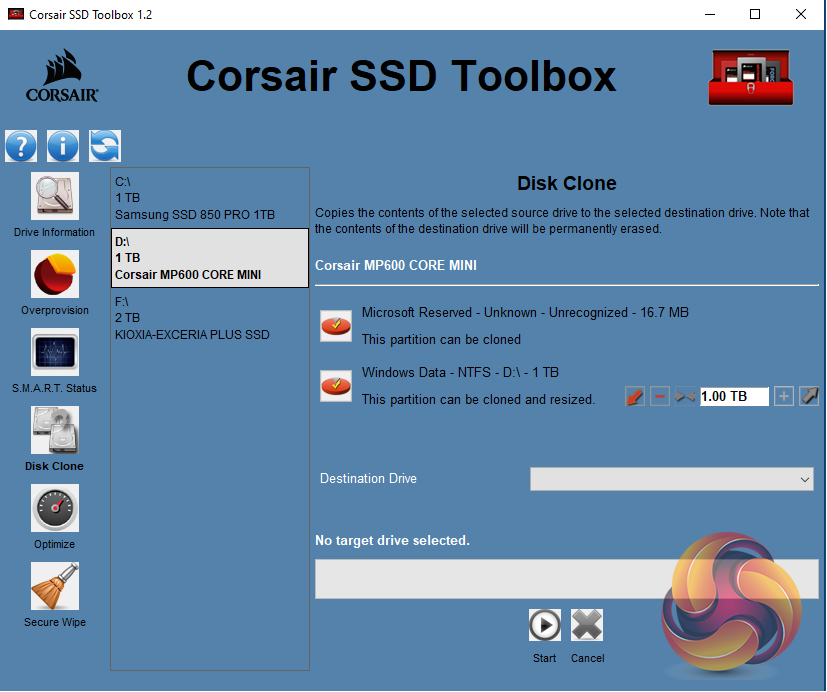
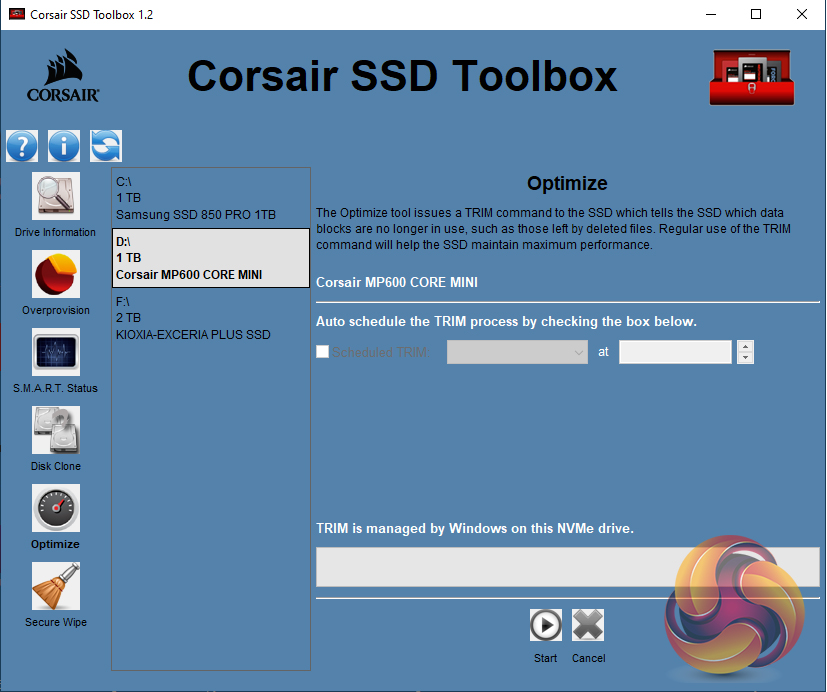
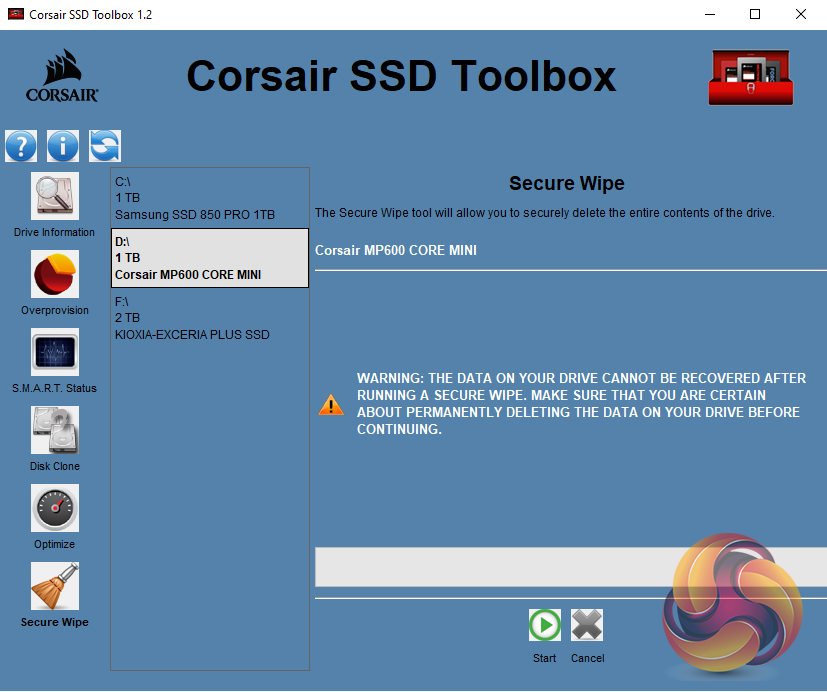
SSD Toolbox is Corsair's SSD management utility. Its GUI does look a bit dated compared to some of its rivals and could do with a bit of a refresh but it does provide all you really need to keep an eye on the drive and how it's performing. With it, you can check on drive information, and S.M.A.R.T details perform firmware updates, secure wiping of the drive, drive optimisation and it even incorporates a very handy disk cloning utility.
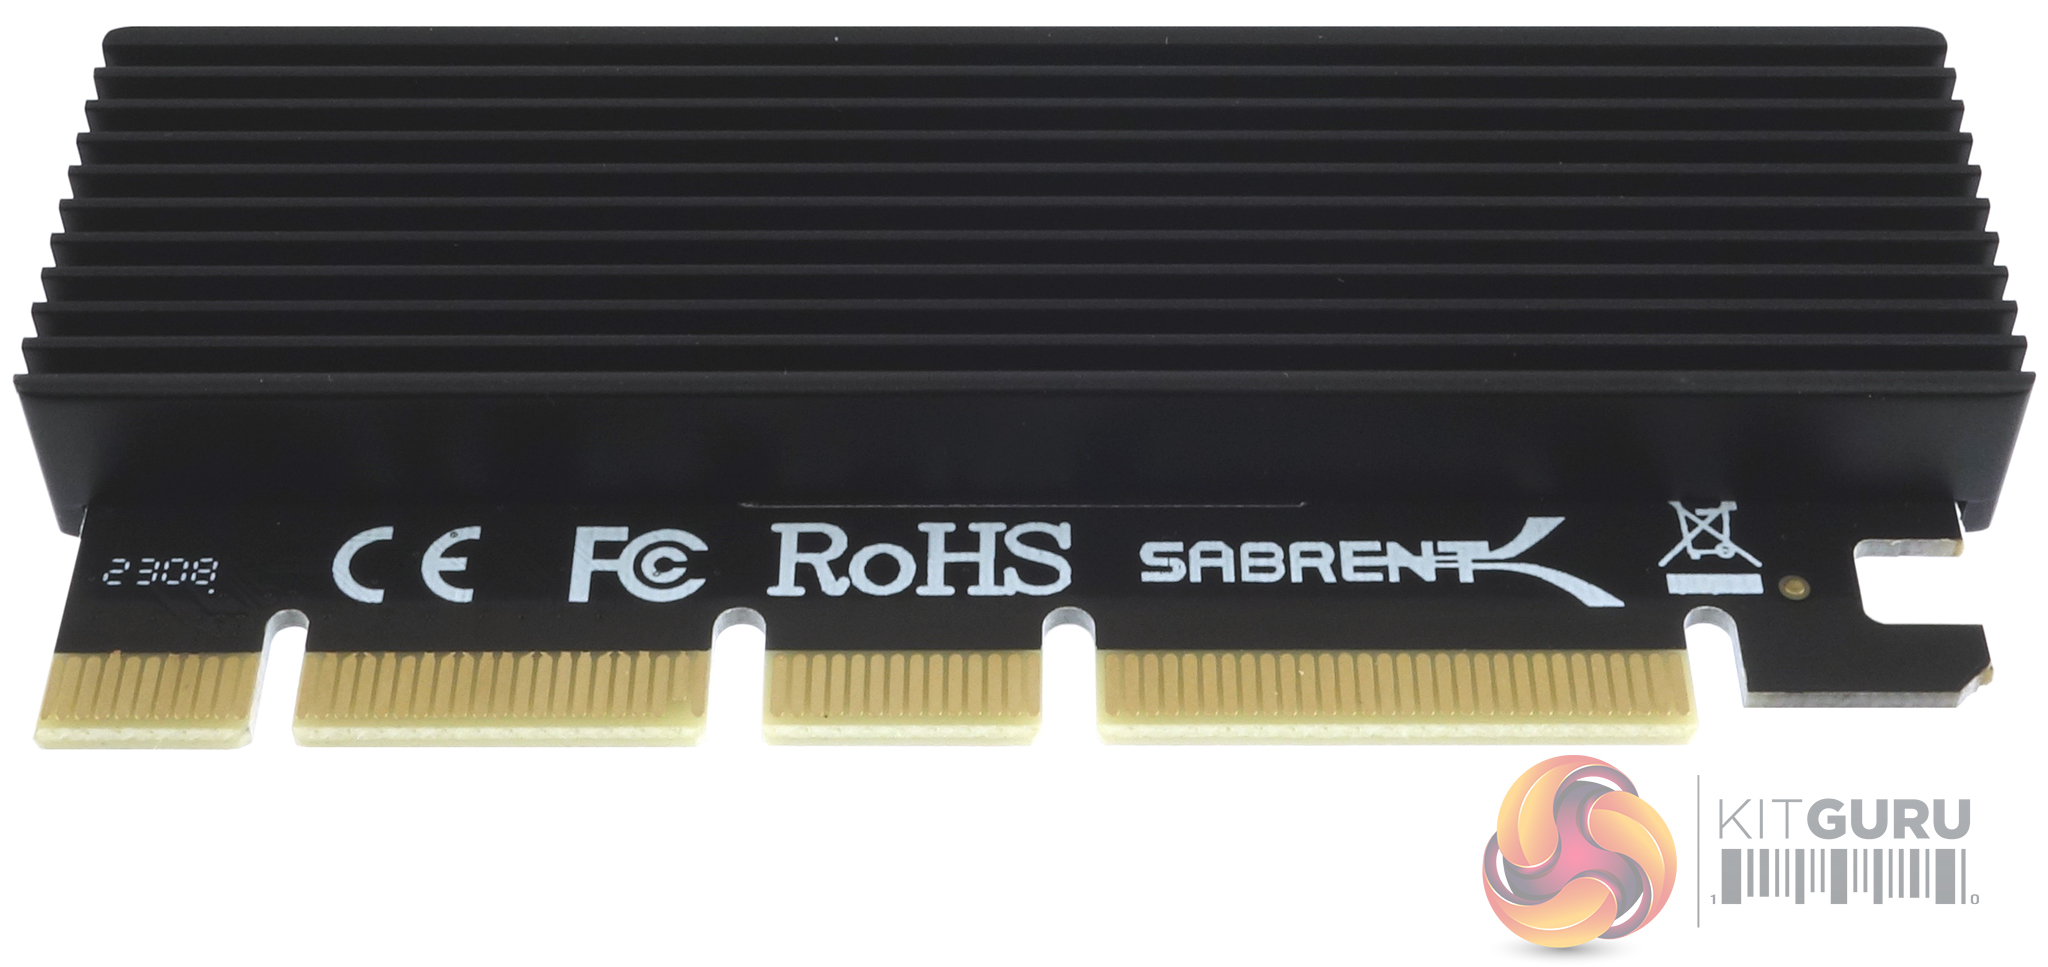
To test the Seagate FireCuda 520N in one of our test rigs we used a Sabrent (EC-PCIE) NVMe M.2 SSD to PCIe x16/x8/x4 card – a useful, reasonably priced little adapter if you have run out of M.2 PCIe x4 slots on a motherboard as it supports 2230 / 2242 / 2260 and 2280 format drives. For more details check the Sabrent website.
Main system:
AMD Ryzen 5 3600X, 32GB DDR4-3200, Sapphire R9 390 Nitro and a Gigabyte B550 AORUS Master motherboard.
Other drives
1TB class Gen 4
Corsair Force MP600 1TB
Crucial P5 Plus 1TB
Kingston NV2 1TB
Kioxia BG5 1TB
Patriot Viper VPN4100 1TB
PNY XLR8 CS3040 1TB
PNY XLR8 CS3140 1TB
Sabrent Rocket 4 Plus 1TB
Samsung SSD980 PRO 1TB
Samsung SSD980 PRO Heatsink 1TB
Seagate FireCuda 520 1TB
Seagate FireCuda 520N 1TB
Solidigm P41 Plus 1TB
Solidigm P44 Pro 1TB
Teamgroup T-Force Cardea Zero Z440 1TB
Teamgroup T-Force Cardea A440 Pro Special Series 1TB
WD Black SN770 1TB
WD Black SN850 1TB
Software:
Atto Disk Benchmark 4.
CrystalMark 8.0.0.
AS SSD 2.0.
IOMeter.
UL Solutions PC Mark 10.
UL Solutions 3DMark Storage Benchmark.
Final Fantasy XIV Endwalker Official Benchmark.
All our results were achieved by running each test five times with every configuration this ensures that any glitches are removed from the results. Trim is confirmed as running by typing fsutil behavior query disabledeletenotify into the command line. A response of disabledeletenotify =0 confirms TRIM is active.
CrystalDiskMark is a useful benchmark to measure the theoretical performance levels of hard drives and SSDs. We are using v8.0.

Although its read score of 65.25MB/s sees the drive in the bottom section of the default CrystalDiskMark 8 4K T1 QD1 test results chart, its write score of 258.46MB/s is the third fastest we've seen to date for a 1TB class consumer Gen 4 drive.


As you can see from the benchmark results screen we can confirm the official maximum Sequential read/write speeds of 5,000MB/s and 3,800MB/s respectively with a read test result of 5,137.99MB/s and 3,947.65MB/s for writes using the default test. Switching over to using compressible data sees the Sequential performance rocket up to 7,361MB/s for reads with writes at 5,626MB/s. The random 4K QD1 T1 read performance gets a very healthy kick up too, but writes see no improvement.

Those Sequential read/write result figures of 5,137MB/s and 3,947MB respectively puts the Corsair MP600 Core Mini in a mid-table position.
Peak Performance Profile

Using the default Peak Performance profile we could confirm and even better quite a bit the official 4K random read performance figures for the drive of up to 650,000 IOPS with a test result of 711,473 IOPS. On the other hand, we couldn't get close to the official write maximum of 900,000 IOPS, as the best test result we saw was 611,705 IOPS.


Switching over to CrystalDiskMark 8's Peak Performance profile we could once again confirm the official Sequential ratings for the drive.

Real World Profile

The Corsair MP600 Core Mini doesn't do too well in the Real World profile test. With Sequential read/write scores of 3,000B/s and 3,892MB/s respectively the drive sits near the bottom of the results chart.


The ATTO Disk Benchmark performance measurement tool is compatible with Microsoft Windows. Measure your storage system performance with various transfer sizes and test lengths for reads and writes. Several options are available to customize your performance measurement including queue depth, overlapped I/O and even a comparison mode with the option to run continuously. Use ATTO Disk Benchmark to test any manufacturer's RAID controllers, storage controllers, host adapters, hard drives and SSD drives and notice that ATTO products will consistently provide the highest level of performance to your storage.
We are using version 4.1 for our NVMe disk tests.

Corsair rates the Sequential performance of the 1TB Core Mini as up to 5,000MB/s and 3,800MB/s for read/writes respectively. With the ATTO benchmark, we soared past both of these with a best-read result of 6,880MB/s with writes at 5,240MB/s. The controller in the drive seems to prefer dealing with compressible data (as can be seen in the CrystalDiskMark 0 fill tests) and it's this type of data the ATTO uses as standard, hence the inflated read/write results.

AS SSD is a great free tool designed just for benching Solid State Drives. It performs an array of sequential read-and-write tests, as well as random read-and-write tests with sequential access times over a portion of the drive. It uses
incompressible data samples which many drives struggle with, so results can be viewed as the worst case scenarios.
AS SSD includes a sub suite of benchmarks with various file pattern algorithms but this is difficult in trying to judge accurate performance figures.

Using the AS SSD benchmark the drive's read score of 2464 sees the drive in the bottom half of the results chart. However, its write score of 2768 is better.

We used CrystalDiskMark 8‘s custom settings to test the Sequential read and write performance of the drive through a range of queue depths. The setup for the tests is listed below.
128KB Sequential Read / Write.
Transfer Request Size: 128KB, Thread(s): 1, Outstanding I/O: 1-32.


Using this Sequential performance test we can confirm the official Sequential 5,000MB/s reads, 3,800MB/s writes ratings of the 1TB MP600 Core Mini with a read test result of 5,138MB/s and 3,902MB/s for writes.
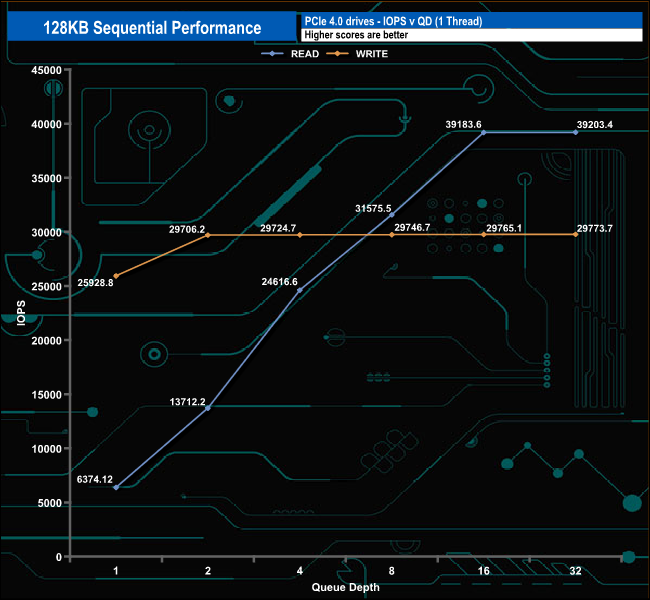
128KB Sequential Read Performance v QD comparison

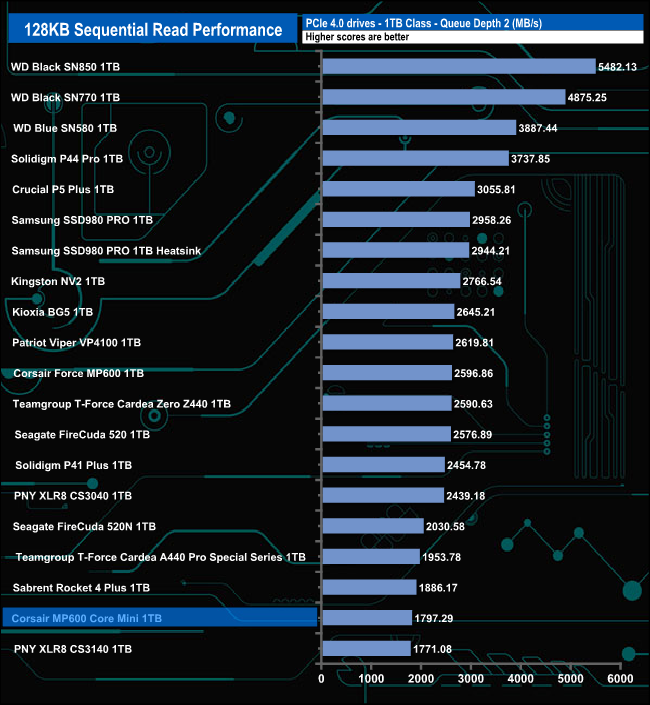
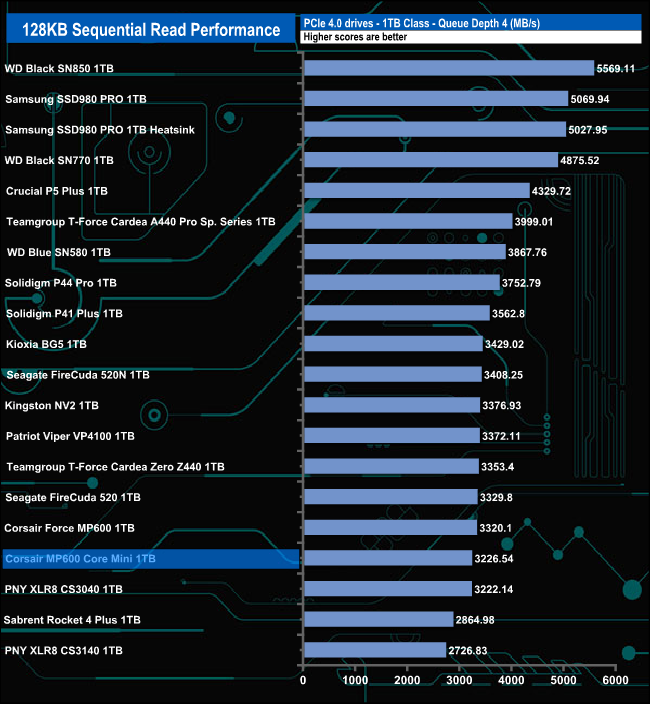
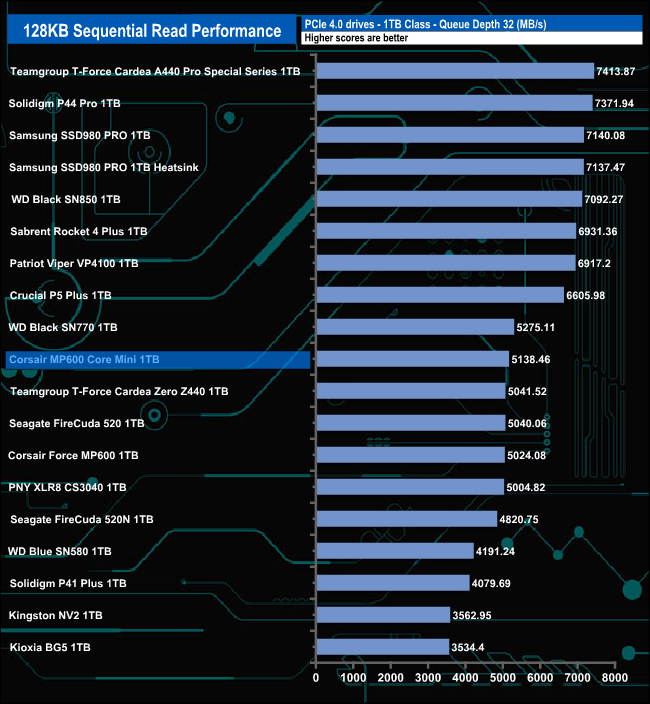
The drive sits near the bottom place of the Sequential read results at QDs 1, 2 and 4. At QD32 the performance of the drive has kicked in to such an extent that it is to be found in the middle of the pack.
128KB Sequential Write Performance v QD comparison
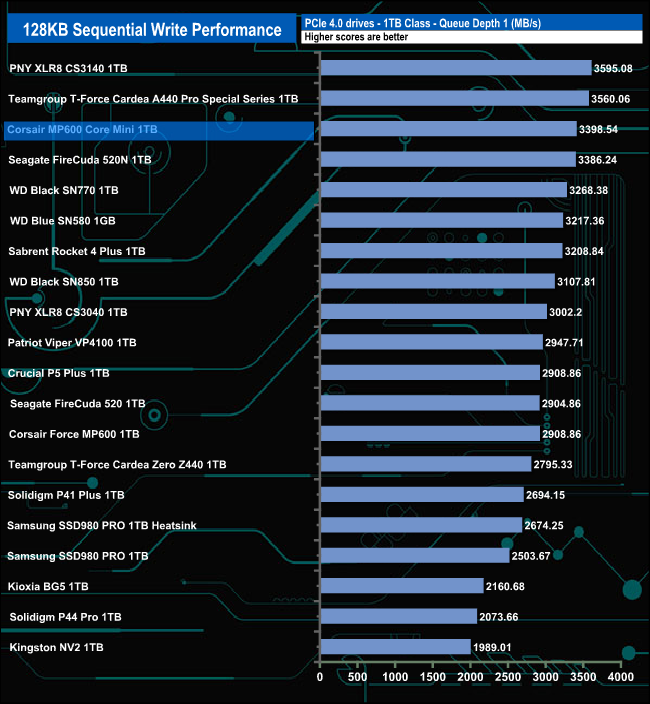


When it comes to the Sequential writes the drive performs best compared to the drives around it, at QD1. After this, as the queue depth deepens the performance falls away so that the Core Mini falls down the chart.
We used CrystalDiskMark 8‘s custom settings to test the 4K random read performance of the drive through a range of queue depths. The setup for the tests is listed below.
Transfer Request Size: 4KB, Outstanding I/O: 1-32.


The 1TB MP600 Core Mini is officially rated as up to 650,000 IOPS for random reads. Using our 4-threaded random read test we couldn't get to the official maximum as the best we saw was 374,577 IOPS (1,534.27MB/s) at QD32.
4K Random Read v QD Performance comparison


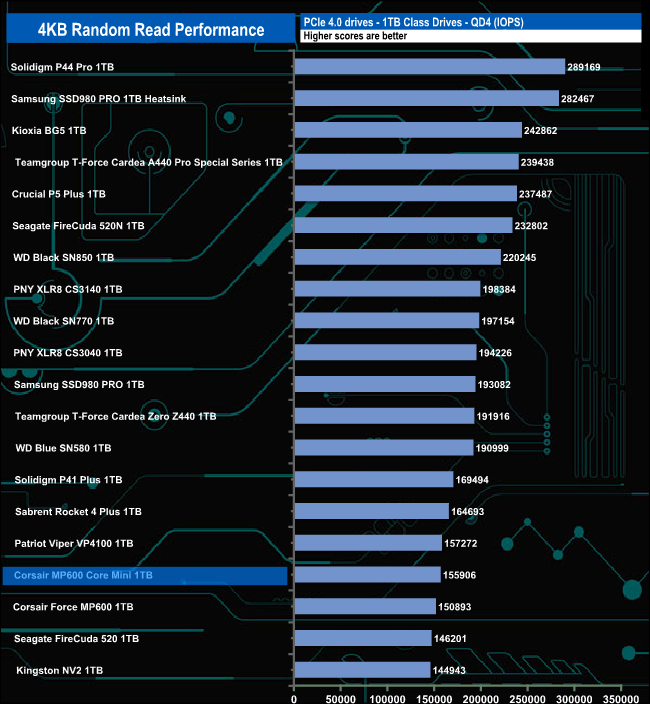

At QDs 1, 2 and 4 the drive languishes in the bottom half of the results chart but at QD32 it's to be found in a mid-table position.
We used CrystalDiskMark 8‘s custom settings to test the 4K random write performance of the drive through a range of queue depths. The setup for the tests is listed below.
Transfer Request Size: 4KB, Outstanding I/O: 1-32.


Officially Corsair's 1TB MP600 Core Mini is rated at up to 900,000 IOPS for 4K random writes. Using our 4-threaded tests we fell a long, long way short of this mark, the best we saw was 244,180 IOPS (1,000.15MB/s) at QD16.
4K Random Write v QD Performance comparison


Even though our best test result is a long way off the official figure, at QD1 it's the third fastest 1TB class consumer Gen 4 drives we've tested to date. But as the queue depth deepens the drive falls rapidly down the results chart.
We used CrystalDiskMark 8’s custom settings to test the 4K 70/30 mixed read/write performance of the drive through a range of queue depths using a single thread and four threads.

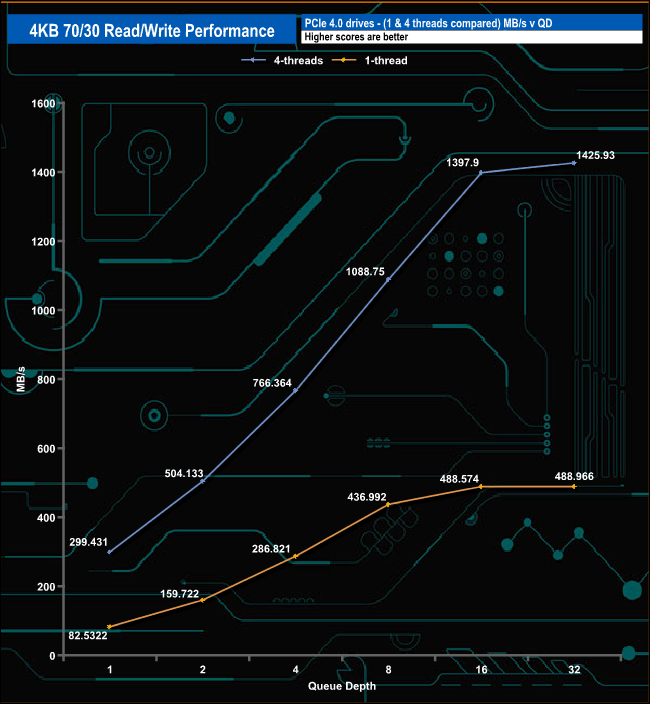

Corsair's MP600 Core Mini works through our 70/30 read/write tests without displaying any problems either using a single thread or four threads. Single thread performance ranges from 20,149 IOPS (82MB/s) at QD1 up to 119,314 IOPS (488MB/s) at QD32. With four threads the performance goes from 73,103 IOPS (299MB/s) at QD1 up to 348,127 IOPS (1,425MB/s) at QD32.
We used CrystalDiskMark 8 to test the random performance of the drive at lower queue depths (QD1 – QD8 where most of the everyday workloads occur) using 1 to 4 threads.
Random Reads.


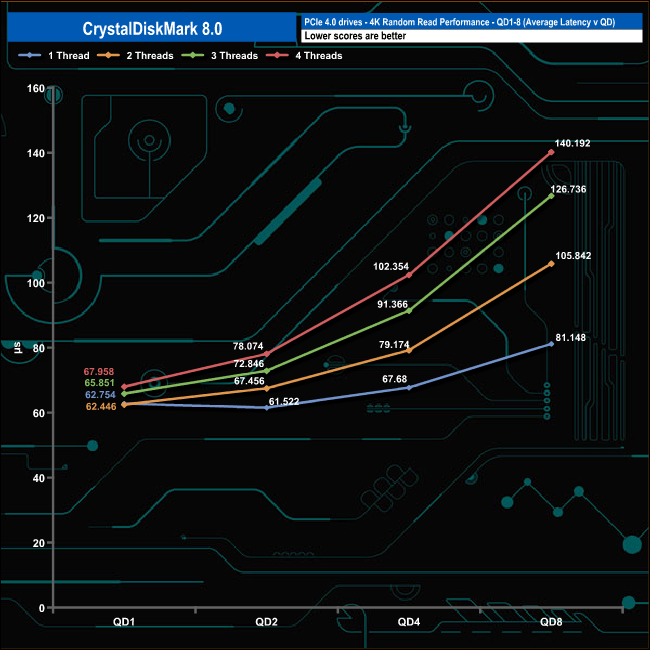
At QD1 the read performance of the 1TB MP600 Core Mini ranges from a low point of 15,907 IOPS (65.159MB/s) using a single thread up to 58,733 IOPS (240.573MB/s) using four threads. The performance increases steadily as the queue depth deepens for each thread count finishing at QD8 with figures ranging from 98,349 IOPS (402.84MB/s) for a single thread up to 227,715 IOPS (932.719MB/s) for four threads.
Random Writes.
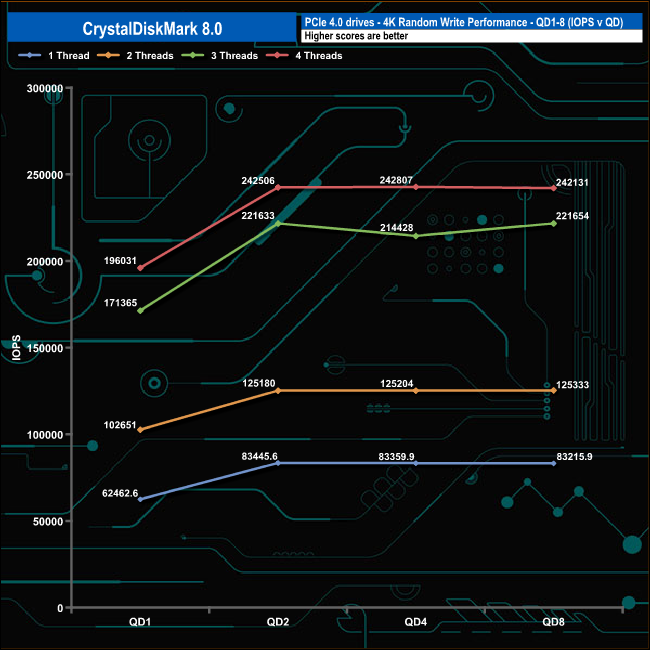

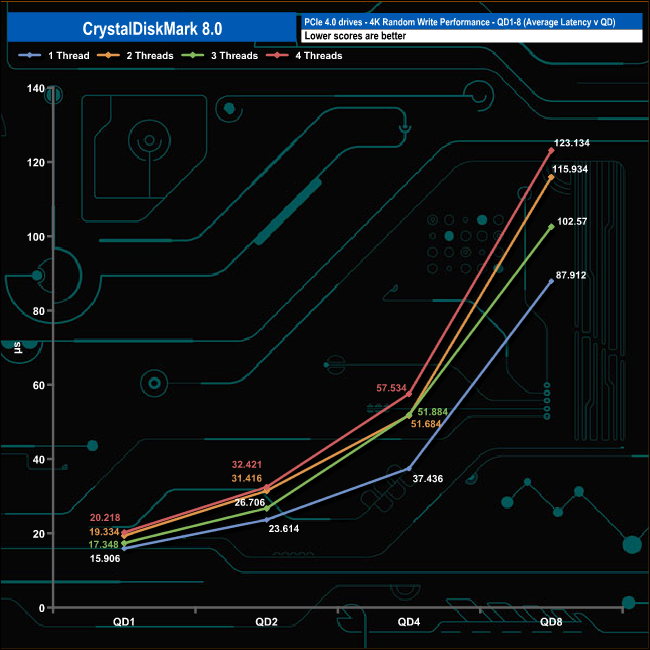
The MP600 Core Mini's write performance climbs smoothly from QD1 to QD2 where the performance levels off until the end of the test run for all threads except the three-threaded performance which drops 7,205 IOPS (29.51MB/s) at QD4 before recovering by the end of the test run at QD8.

In our read-throughput test, the 1TB MP600 Core Mini peaked at 4,174MB/s at the end of the test run at the 16MB block mark. That test result is some 826MB/s short of the official maximum of 5,000MB/s.

Although short of the maximum official figure, that test result of 4,174MB/s sees the drive creep into the top ten fastest 1TB drives we've seen in this test.

Peak write throughput came at the 2MB block mark at 4,041.87MB/s which is actually faster than the official rating by 241.87MB/s.

The write test result puts the drive in the bottom half of the results table.
The PCMark 10 Full System Drive Benchmark uses a wide-ranging set of real-world traces from popular applications and common tasks to fully test the performance of the fastest modern drives. The benchmark is designed to measure the performance of fast system drives using the SATA bus at the low end and devices connected via PCI Express at the high end.
The goal of the benchmark is to show meaningful real-world performance differences between fast storage technologies such as SATA, NVMe, and Intel’s Optane. The Full System Drive Benchmark uses 23 traces, running 3 passes with each trace. It typically takes an hour to run.
Traces used:
Booting Windows 10.
Adobe Acrobat – starting the application until usable.
Adobe Illustrator – starting the application until usable Adobe Premiere Pro – starting the application until usable.
Adobe Photoshop – starting the application until usable.
Battlefield V – starting the game until the main menu.
Call of Duty Black Ops 4 – starting the game until the main menu.
Overwatch – starting the game until the main menu.
Using Adobe After Effects.
Using Microsoft Excel.
Using Adobe Illustrator.
Using Adobe InDesign.
Using Microsoft PowerPoint.
Using Adobe Photoshop (heavy use).
Using Adobe Photoshop (light use).
cp1 Copying 4 ISO image files, 20 GB in total, from a secondary drive to the target drive (write test).
cp2 Making a copy of the ISO files (read-write test).
cp3 Copying the ISO to a secondary drive (read test).
cps1Copying 339 JPEG files, 2.37 GB in total, to the target drive (write test).
cps2 Making a copy of the JPEG files (read-write test).
cps3 Copying the JPEG files to another drive (read test).
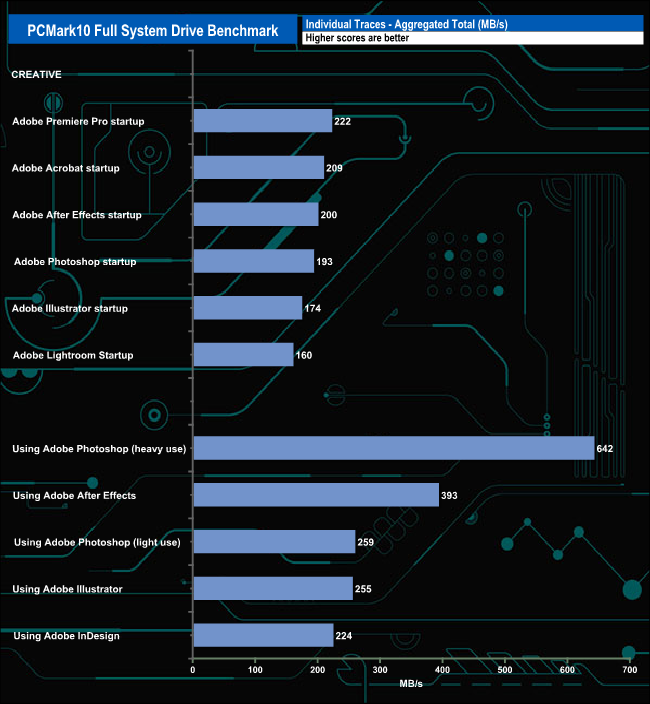
The Corsair MP600 Core Mini dealt with the rigours of the PCMark10’s Full System Drive well enough although it didn't set the world on fire with the individual trace results. It averaged 193MB/s for the six Adobe startup traces, the fastest being the 222GB/s for the Adobe Premiere Pro startup while the slowest was the Adobe Lightroom startup trace at 160MB/s. For the five Adobe usage traces the drive averaged 295MB/s, the fastest of which was the Heavy Use Adobe Photoshop trace at 642MB/s and the slowest was the Adobe InDesign trace at 224MB/s
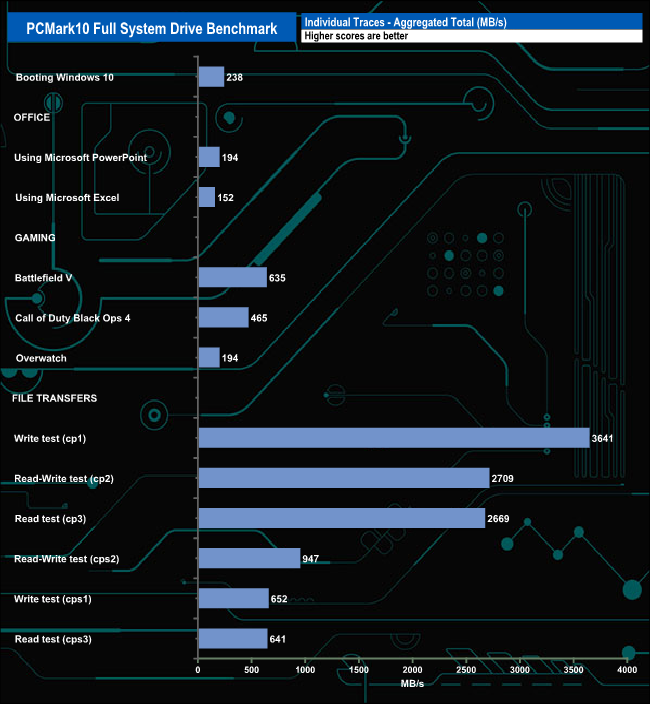
For the three gaming tests, the drive averaged just 431MB/s with the fastest being the Battlefield V trace at 635MB/s, next up the Call Of Duty Black Ops 4 trace at 465MB/s and finally Overwatch at 194MB/s.
The file transfer tests also produced a good cp1 (write test) figure of 3,641MB/s backed up by 2,7091MB/s for the cp2 read/write test trace and 2,699MB/s for the cp3 (read test).
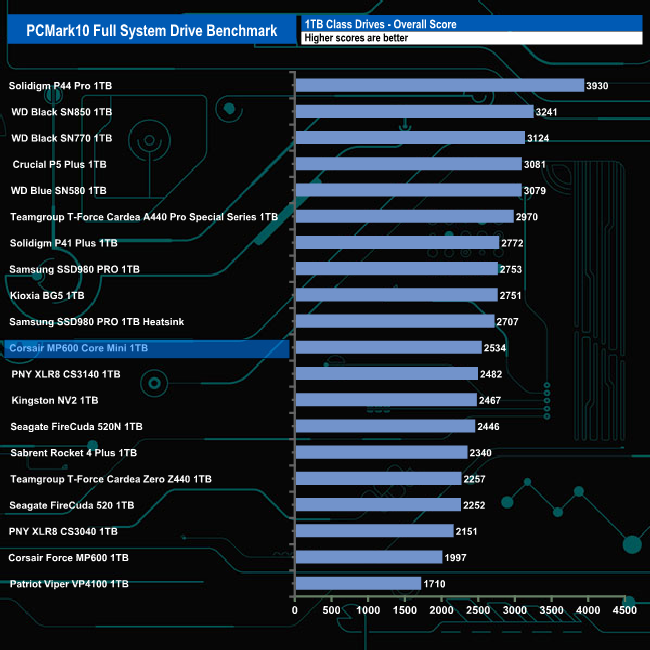
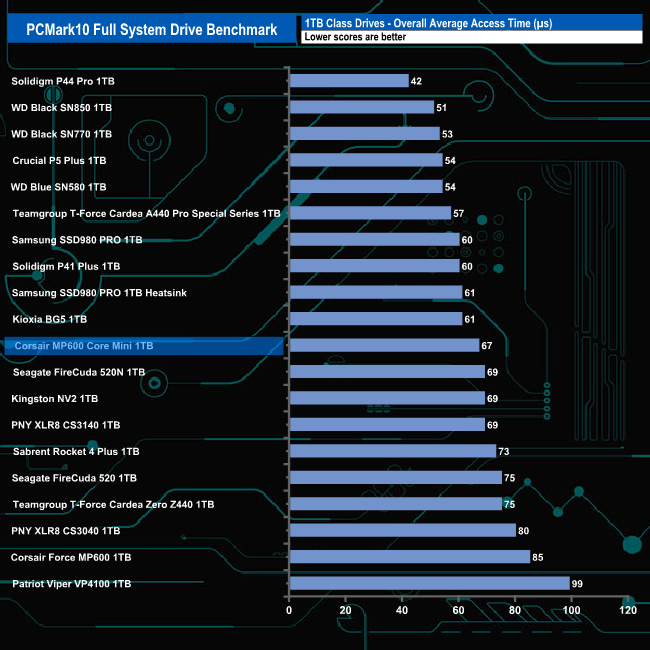
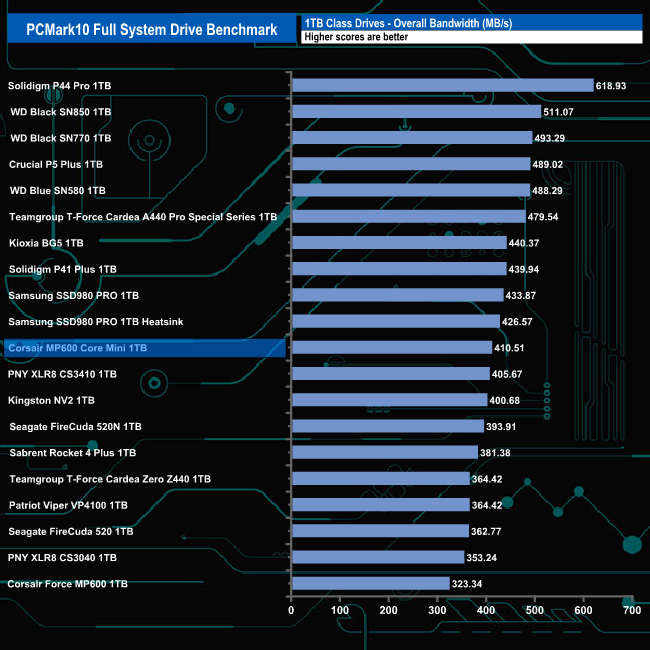
The overall bandwidth figure of 410.51MB/s sees the 1TB Corsair MP600 Core Mini sitting in a lower mid-table position.
The 3DMark Storage Benchmark uses traces recorded from popular games and gaming-related activities to measure real-world gaming performance.
Traces used:
Battlefield V
Loading Battlefield™ V from launch to the main menu.
Call of Duty Black Ops 4
Loading Call of Duty®: Black Ops 4 from launch to the main menu.
Overwatch
Loading Overwatch® from launch to the main menu.
Game Move
Copying the Steam folder for Counter-Strike®: Global Offensive from an external SSD to the system drive.
Game Recording
Recording a 1080p gameplay video at 60 FPS with OBS (Open Broadcaster Software) while playing Overwatch®.
Installing Game
Installing The Outer Worlds® from the Epic Games Launcher.
Game Saving
Saving progress in The Outer Worlds game.
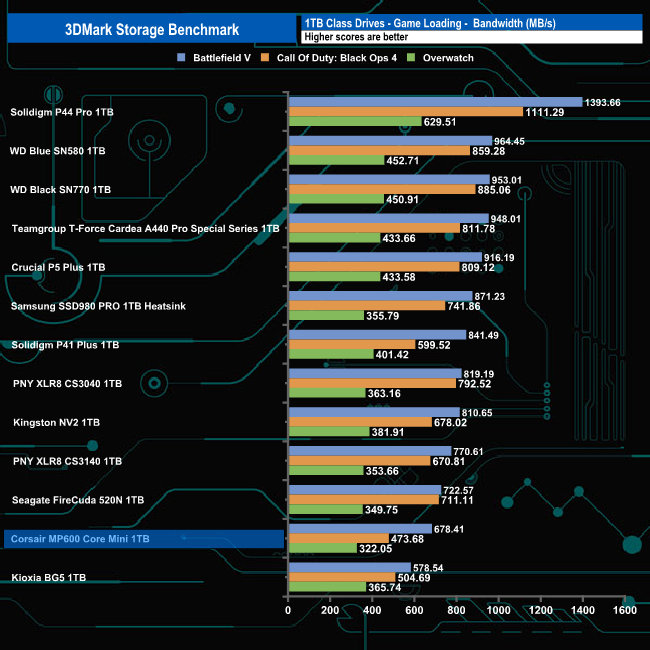
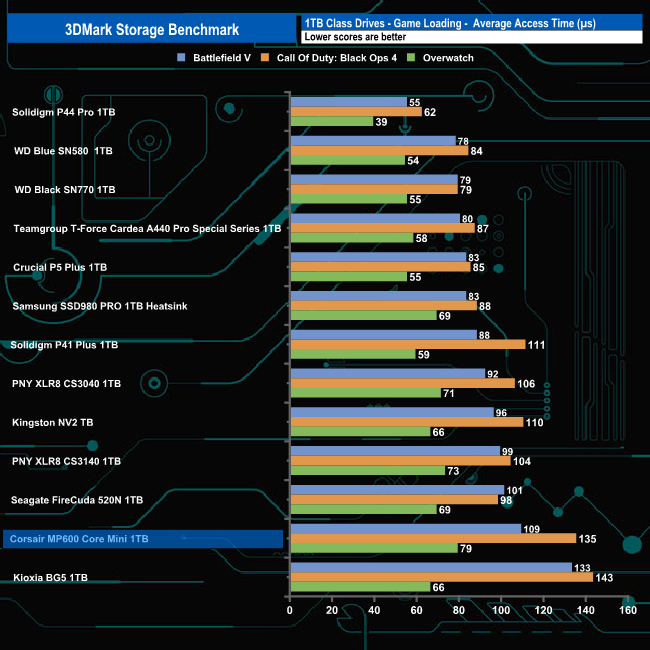
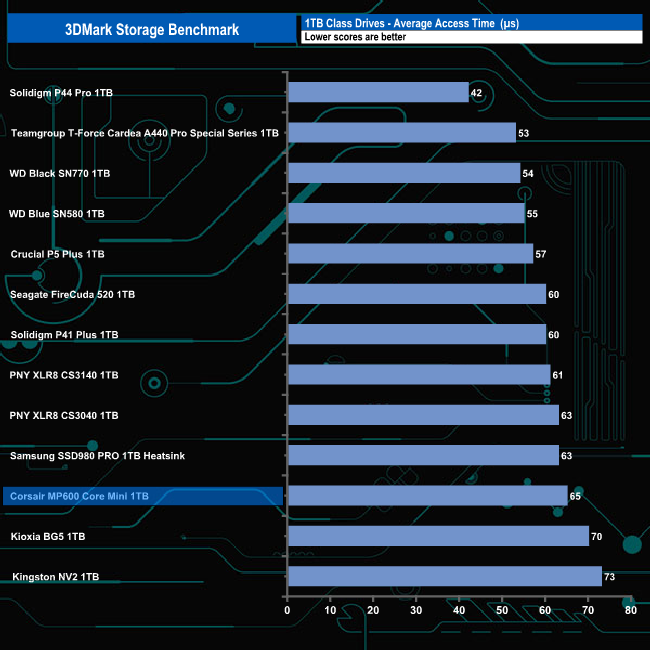
In 3DMark's Storage Benchmark Game Loading test, the MP600 Core Mini averaged 491.38MB/s for the three game loading tests with an average time of 73 µs.
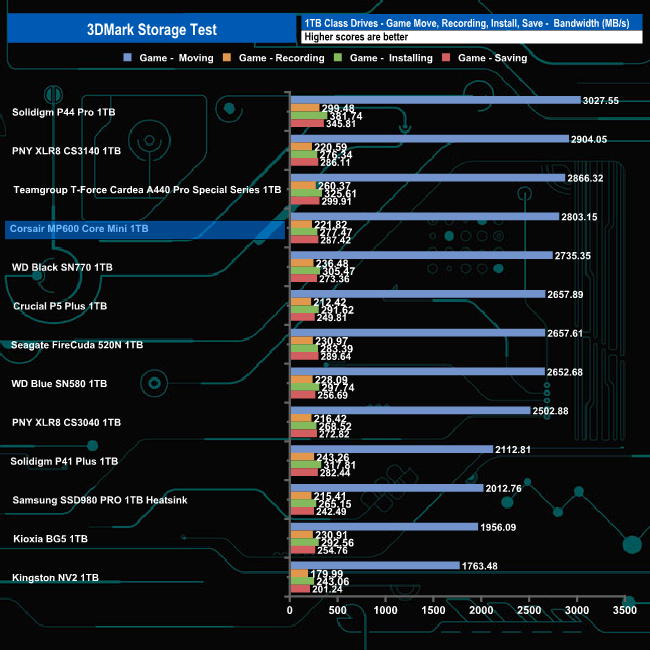
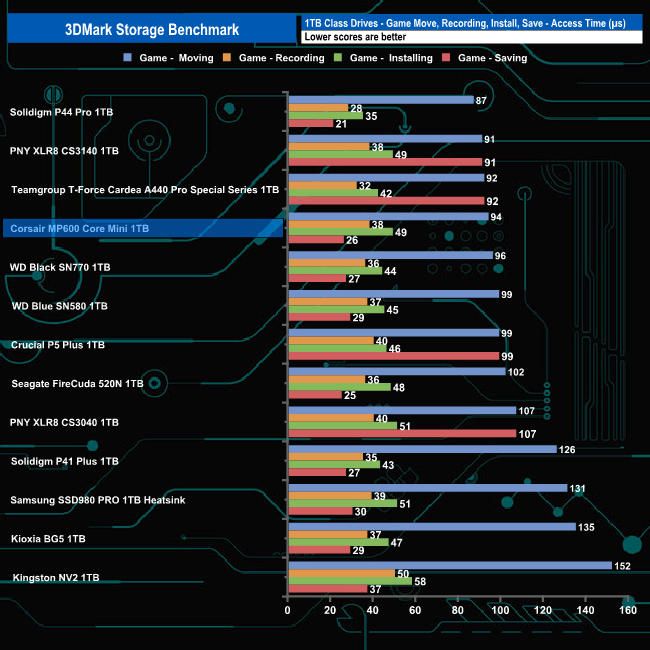
In the other set of tests; game moving, recording, installing and saving test traces the drive averaged 897.465MB/s with an average access time of 51.75µs for the four tests.
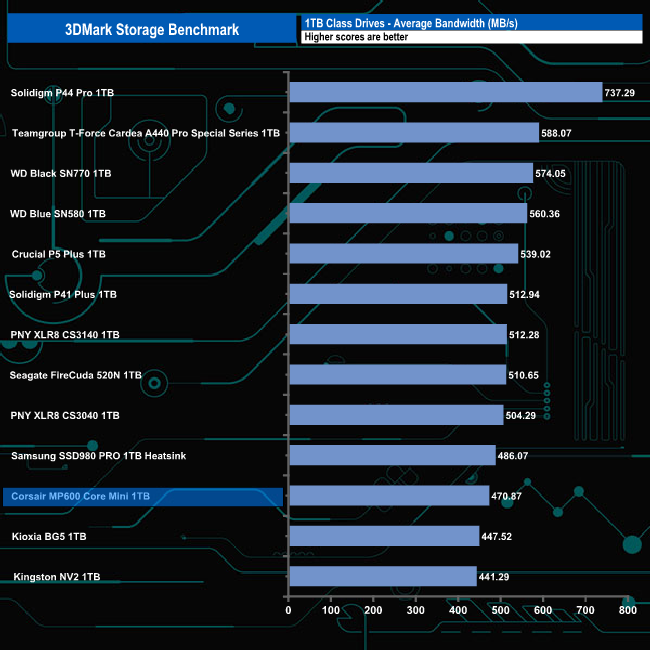
The average bandwidth figure for the complete test run for the drive was 470.87MB/s, a score that sees the Corsair MP600 Core Mini in the bottom half of the table.
The Final Fantasy XIV Endwalker Official Benchmark uses actual maps and playable characters to assign a score to your PC and rate its performance including scene loading times.
The benchmark gives an overall load time as well as loading times by scene.
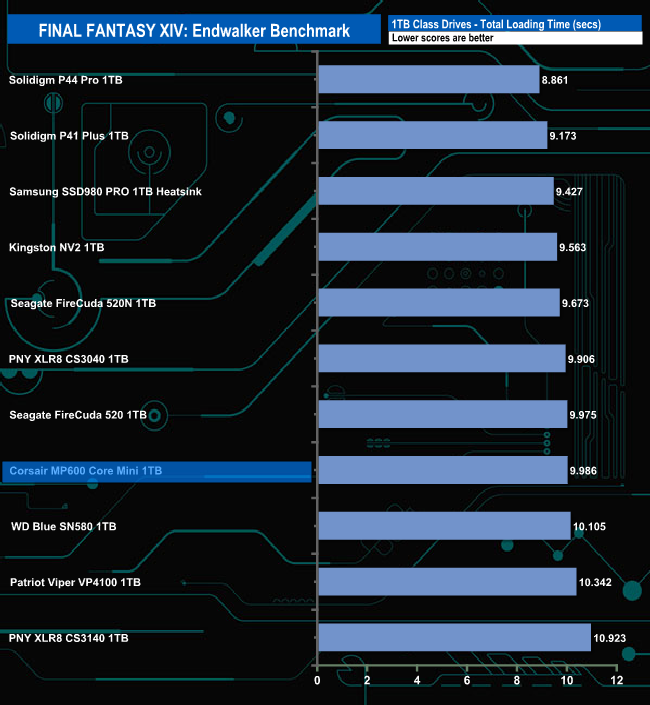

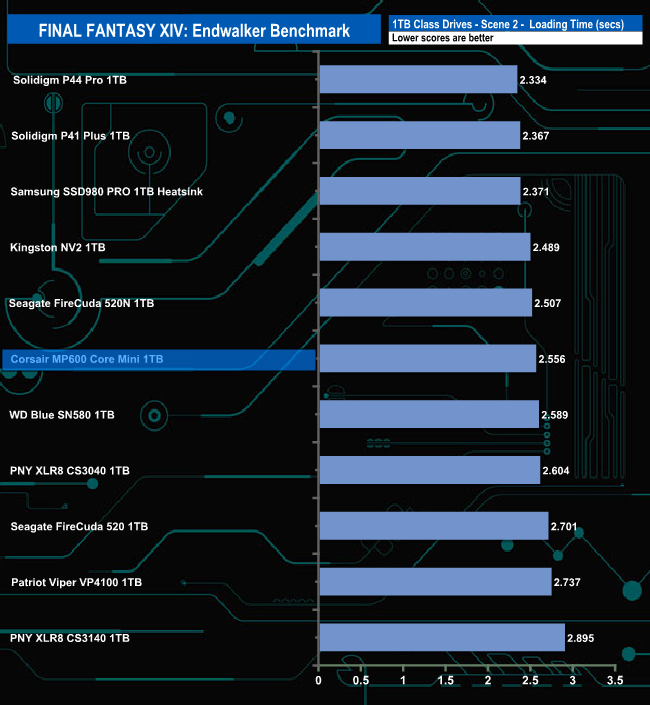
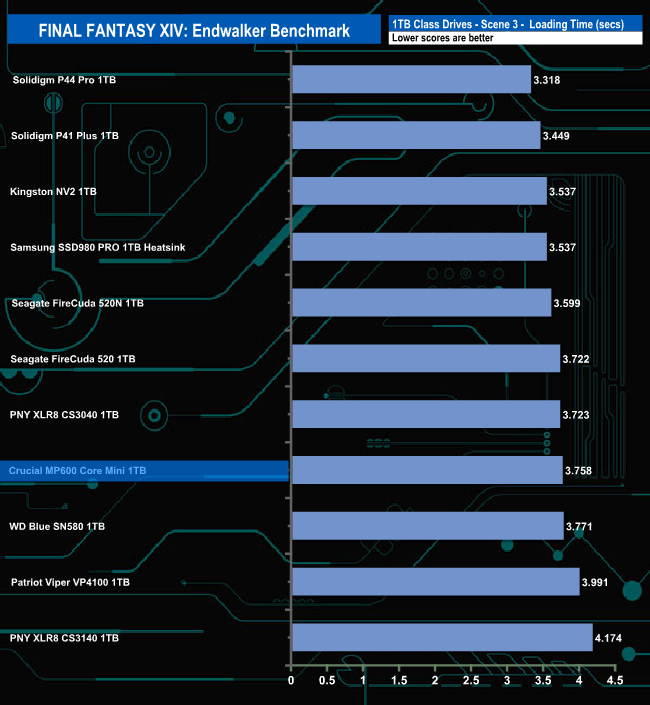


Corsair's MP600 Core Mini doesn't do that well enough in the Final Fantasy XIV Endwalker Official Benchmark. It doesn't get close to topping any of the individual scene load times and overall it ends up in the bottom four in the results chart.
We took note of the drive’s temperature during some of our benchmarking runs.
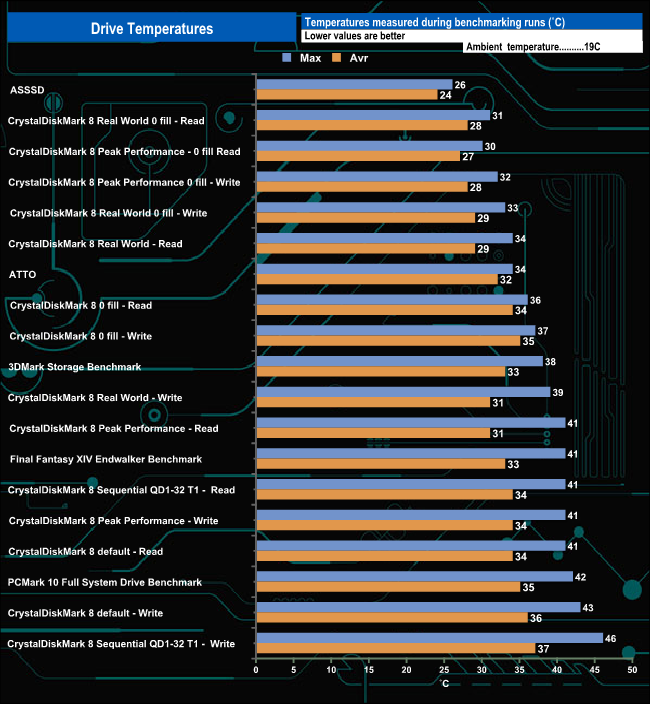
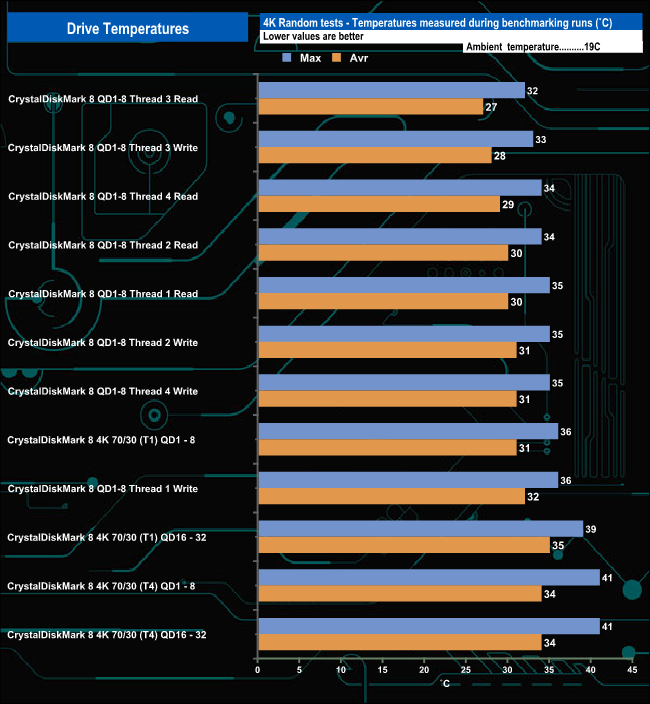
Because of the Corsair MP600 Core Mini's small format, we had to use an adapter to test the drive in our normal test rig. The Sabrent EC-PCIE comes with an aluminium heatsink and thermal padding to help keep any drive inside cool. The hottest the drive got was when it was being pushed very hard during the Sequential write test using CrystalDiskMark8 (QD1-32 T1), when it peaked at 46° C which is 19° C under the maximum operating temperature, which is getting a little too close for comfort. For the non-4 K tests the drive averaged 37°C while for the 4K-based tests, the average was 36°C.
To test real life performance of a drive we use a mix of folder/file types and by using the FastCopy utility (which gives a time as well as MB/s result) we record the performance of drive reading from & writing to a 2TB Kingston KC3000.
Transfer Details:
- Windows 10 backup – 118GB.
- Data file – 100GB.
- BluRay Movie – 42GB.
- Windows 11 iso – 5.4GB.
- File folder – 50GB – 28,523 files.
- Steam folder – 222GB (8 games: Alien Isolation, Battlefield 4, BioShock Infinite, Crysis 3, Grand Theft Auto V, Shadow Of Mordor, Skyrim, The Witcher3 Wild Hunt).
- Movie demos 8K – 21GB – (11 demos).
- Raw Movie Clips 4K – 16GB – (9 MP4V files).
- Movie folder – 12GB – 15 files – (8 @ .MKV, 4 @ .MOV, 3 @ MP4).
- Photo Folder – 10GB – 304 files – (171 @ .RAW, 105 @ JPG, 21 @ .CR2, 5 @ .DNG).
- Audio Folder – 10GB – 1,483 files – (1479 @ MP3, 4 @ .FLAC files).
- Single large image – 5GB – 1.5bn pixel photo.
- 3D Printer File Folder – 4.25GB – (166 files – 105 @ .STL, 38 @ .FBX, 11 @ .blend, 5 @ .lwo, 4 @ .OBJ, 3@ .3ds).
- AutoCAD File Folder – 1.5GB (80 files – 60 @ .DWG and 20 @.DXF).
![]()
![]()
The drive averaged 1,867MB/s when writing the 14 transfer tests, with the fastest being the 4K Movie Clips folder transfer at 3,373MB/s with the 50GB File folder the slowest at 348MB/s. Reading back the data the drive averaged 2,356MB/s, this time around it was the 8K Movie Scenes folder that was the fastest at 3,373MB/s. The slowest was the Steam folder transfer at 585MB/s.
Corsair has currently two drives vying for market share in the Gen 4 M.2 2230 SSD market segment, the MP600 Mini and the Core Mini (the drive we are reviewing here). What's the difference you may ask, well the Mini uses 3D TLC NAND and at the time of writing only comes in a 1TB version while the Core Mini uses 3D QLC NAND and comes in both 1TB and 2TB versions.
At the heart of the MP600 Core Mini is a Phison PS5027-E27T 4-channel PCIe 4.0 controller looking after a single package of 176-layer 3D QLC NAND. The PS5027-E27T is a DRAM-less design which relies on HMB (Host Memory Buffer) technology to perform any caching duties.
Official sequential ratings for the 1TB Core Mini drive are up to 5,000MB/s for reads with writes at up to 3,800MB/s. Testing the drive with the CrystalDiskMark 8 default settings we could confirm the official figures with test results of 5,137.99MB/s for reads and 3,947.65MB/s for writes. The controller seems to have a preference for handling compressible data as switching over to the 0 fill CrystalDiskMark 8 test saw the read result rise to 7,361MB/s while writes rose to 5,526MB/s.
Random 4K performance is quoted as up to 650,000 IOPS reads and an impressive up to 900,000 IOPS for writes for the 1TB drive. Using the default Peak Performance profile in CrystalDiskMark 8 which displays the IOPS result for the test run we could confirm the official read ratings. The best read test result was 711,472.66 IOPS but we couldn't get close to the write maximum as the best write result we saw was 611, 705.57 IOPS, so way off the official maximum.
Endurance for the 1TB MP600 Core Mini is quoted at a modest 250TBW and Corsair backs the drive with a 5-year warranty.
We found the 1TB Corsair MP600 Core Mini on Amazon for £67.99 (inc VAT) HERE.
Pros
- Overall Performance.
- 2TB option.
- 5-year warranty.
Cons
- Couldn’t match the official maximum 4K random write figures in some of our testing.
- DRAM-less design.
- QLC NAND may put some people off.
- Endurance.
KitGuru says: Corsair's MP600 Core Mini range offers a 2TB model which is something the original MP600 Core lacked as it was only available as a 1TB unit. The Core Mini brings slightly faster Sequential read performance than the Mini but has slower write speeds. The real difference between the two is that the Core Mini uses 3D QLC NAND (the Mini uses 3D TLC NAND) which may put some people off.