
Among the well-known brands offering PCIe 4.0 SSD since day one, one name was noticeable by its absence… but that has changed with the arrival of Crucial's P5 Plus, a drive aimed more at offering value for money than bleeding-edge performance. We review the 1TB model, priced at just under £160.
Crucial's P5 Plus line-up consists of just three capacities (at the time of writing); a 500GB entry model, 1TB (the drive we are looking at here) and a flagship 2TB drive. The P5 Plus uses a combination of a Micron controller (labelled DM02A1) and their latest 176-layer 3D TLC NAND. The drive also supports hardware AES 256 full disk encryption including support for the TCG OPAL 2.0 specification.
The P5 Plus is officially rated as up to 6,600MB/s for Sequential reads for all three drives, with the 500GB drive getting a 4,000MB/s Sequential write rating while the 1TB and 2TB drives are quoted as up to 5,000MB/s. We couldn't find a figure for random read/write performance on Crucial's website but a quick search online came up with figures of up to 630,000 IOPS for random reads and up to 700,000 IOPS for random writes.
The official TBW endurance rating for the 1TB drive is 600TB. For the 500GB drive, it's 300TB and the 2TB drive, 1200TB.
Physical Specifications:
- Usable Capacities: 1TB.
- NAND Components: Micron B47R 176-Layer 3D TLC NAND.
- NAND Controller: Micron DM02A1.
- Cache: 1GB LPDDR4-4266.
- Interface: PCIe Gen 4.0 x 4 / NVMe 1.4.
- Form Factor: M.2,2280.
- Dimensions: 22 x 80 x 2mm
- Drive Weight: 7g.
Firmware Version: P7CR402.
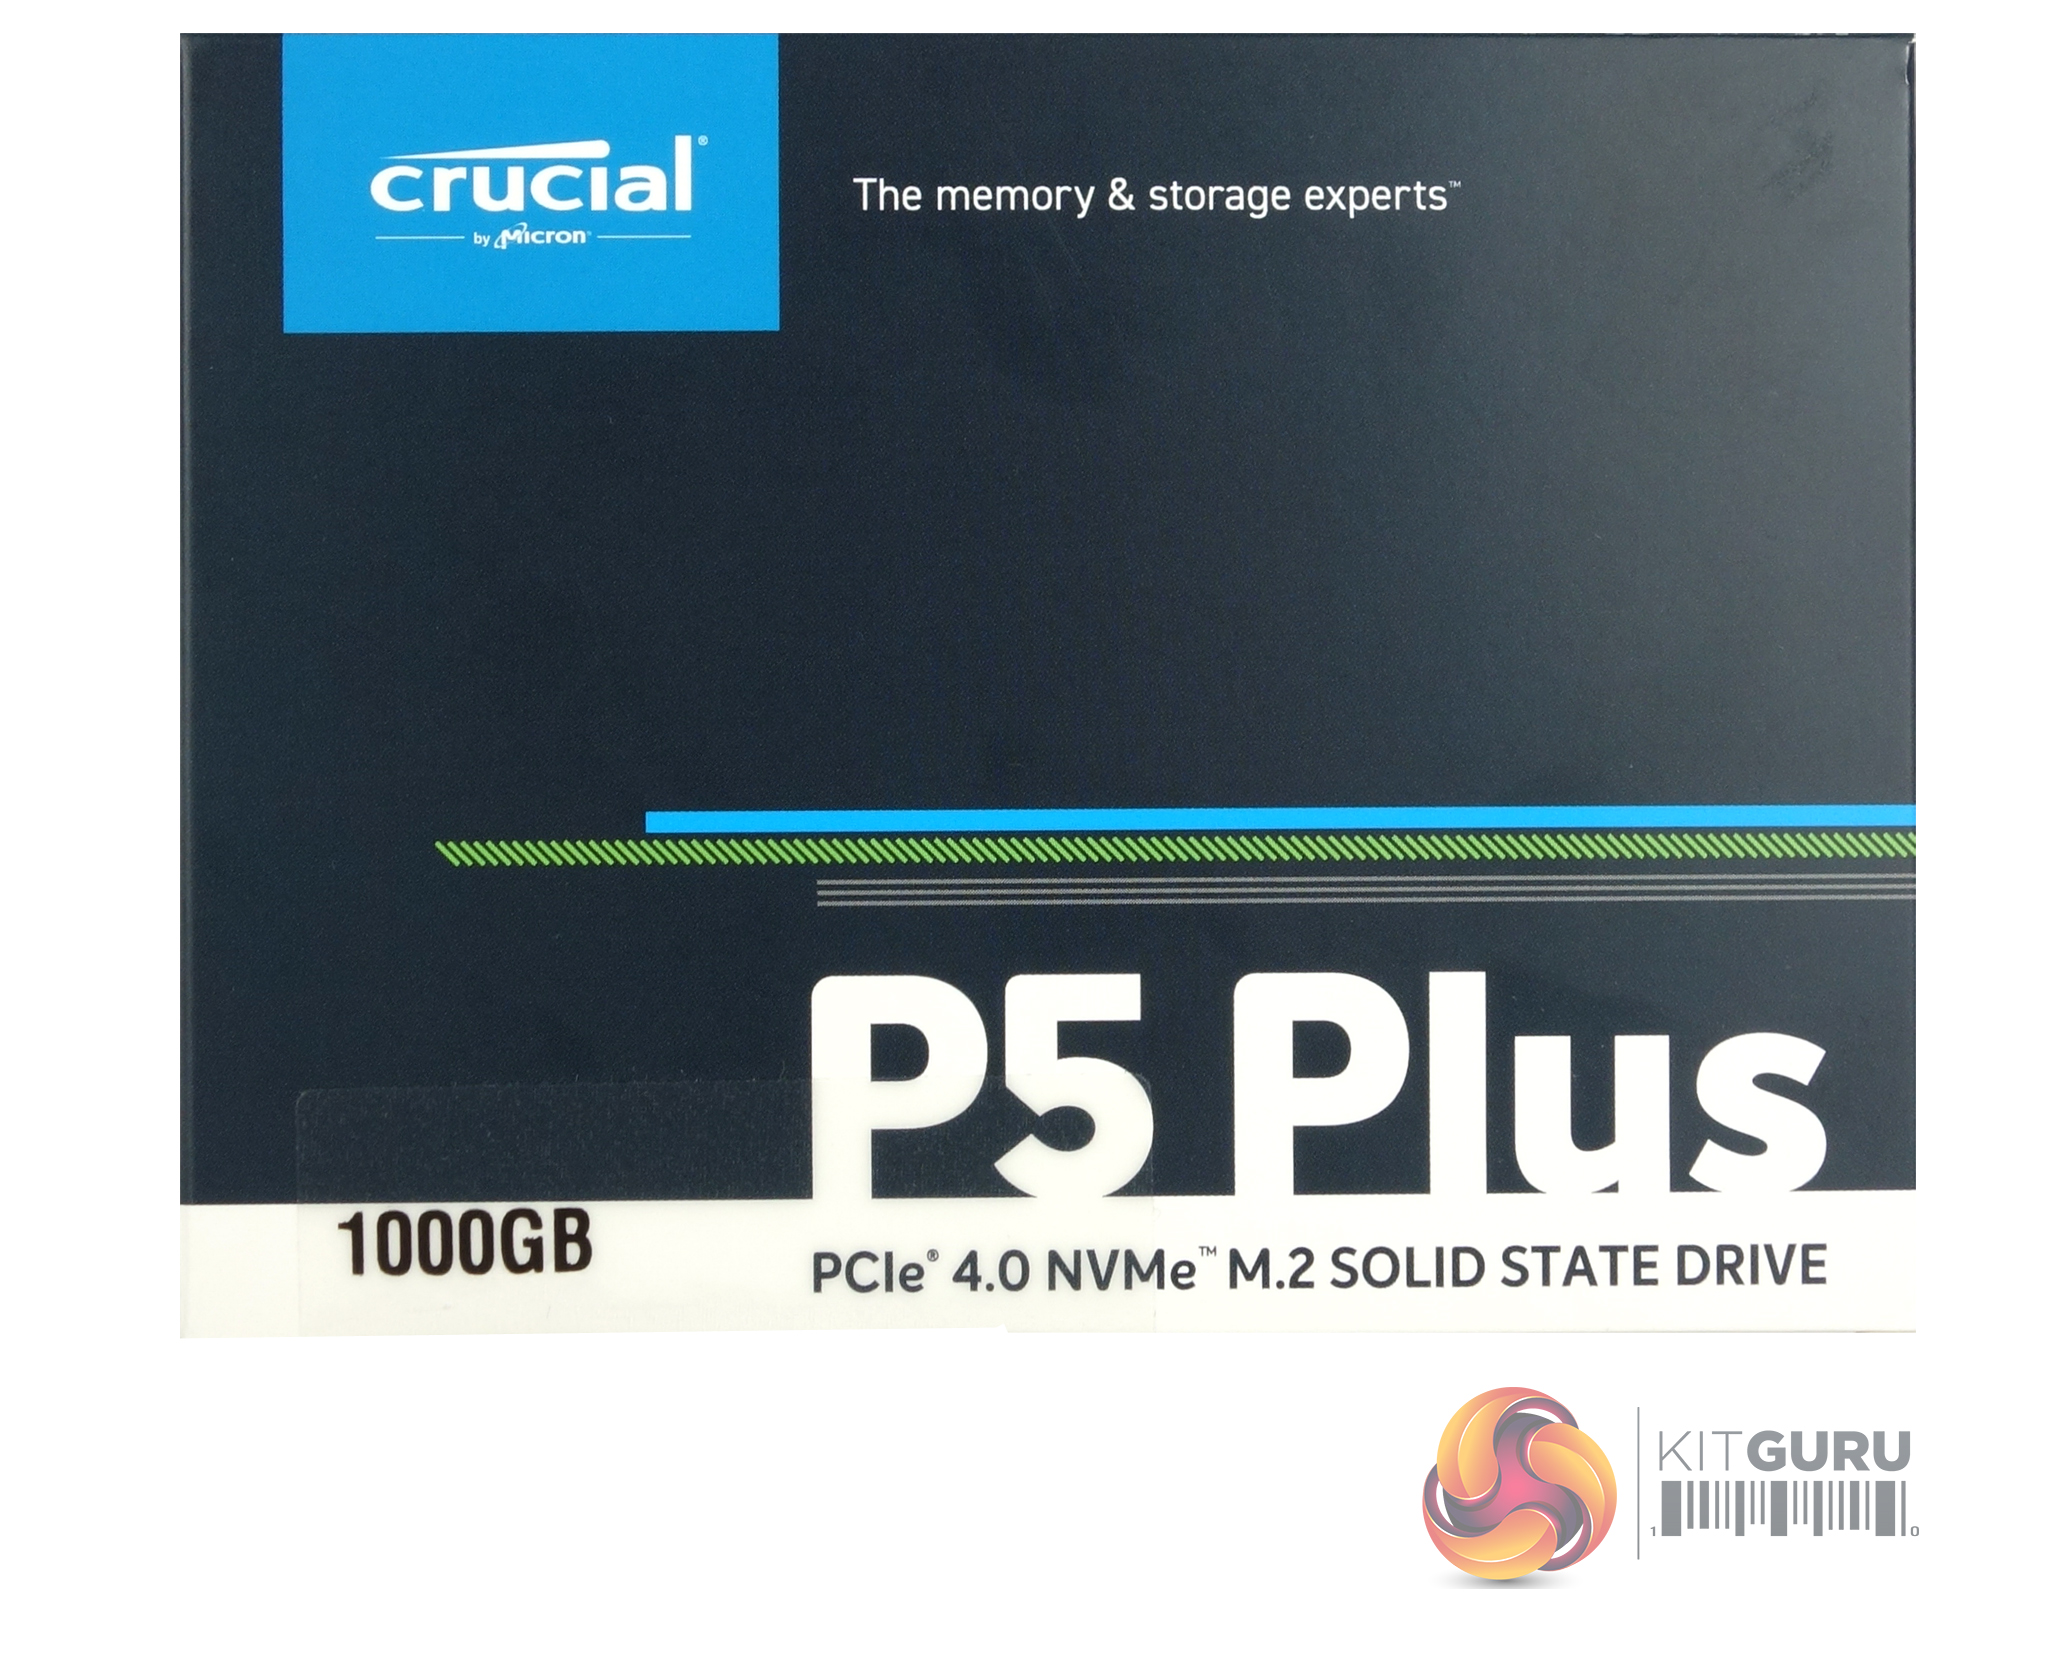
The P5 Plus comes in a box without any images of the drive on the front or back. On the bottom, left-hand side of the box front is the drive’s capacity along with details of the drive's interface. The rear of the box has three icons for Data Transfer Software (Acronis True Image for Crucial available via Crucial’s SSD support web page), Installation Guide and Firmware update.
The only things in the box beside the drive is a setup/warranty information pamphlet and an M.2 mounting screw, a very handy addition.
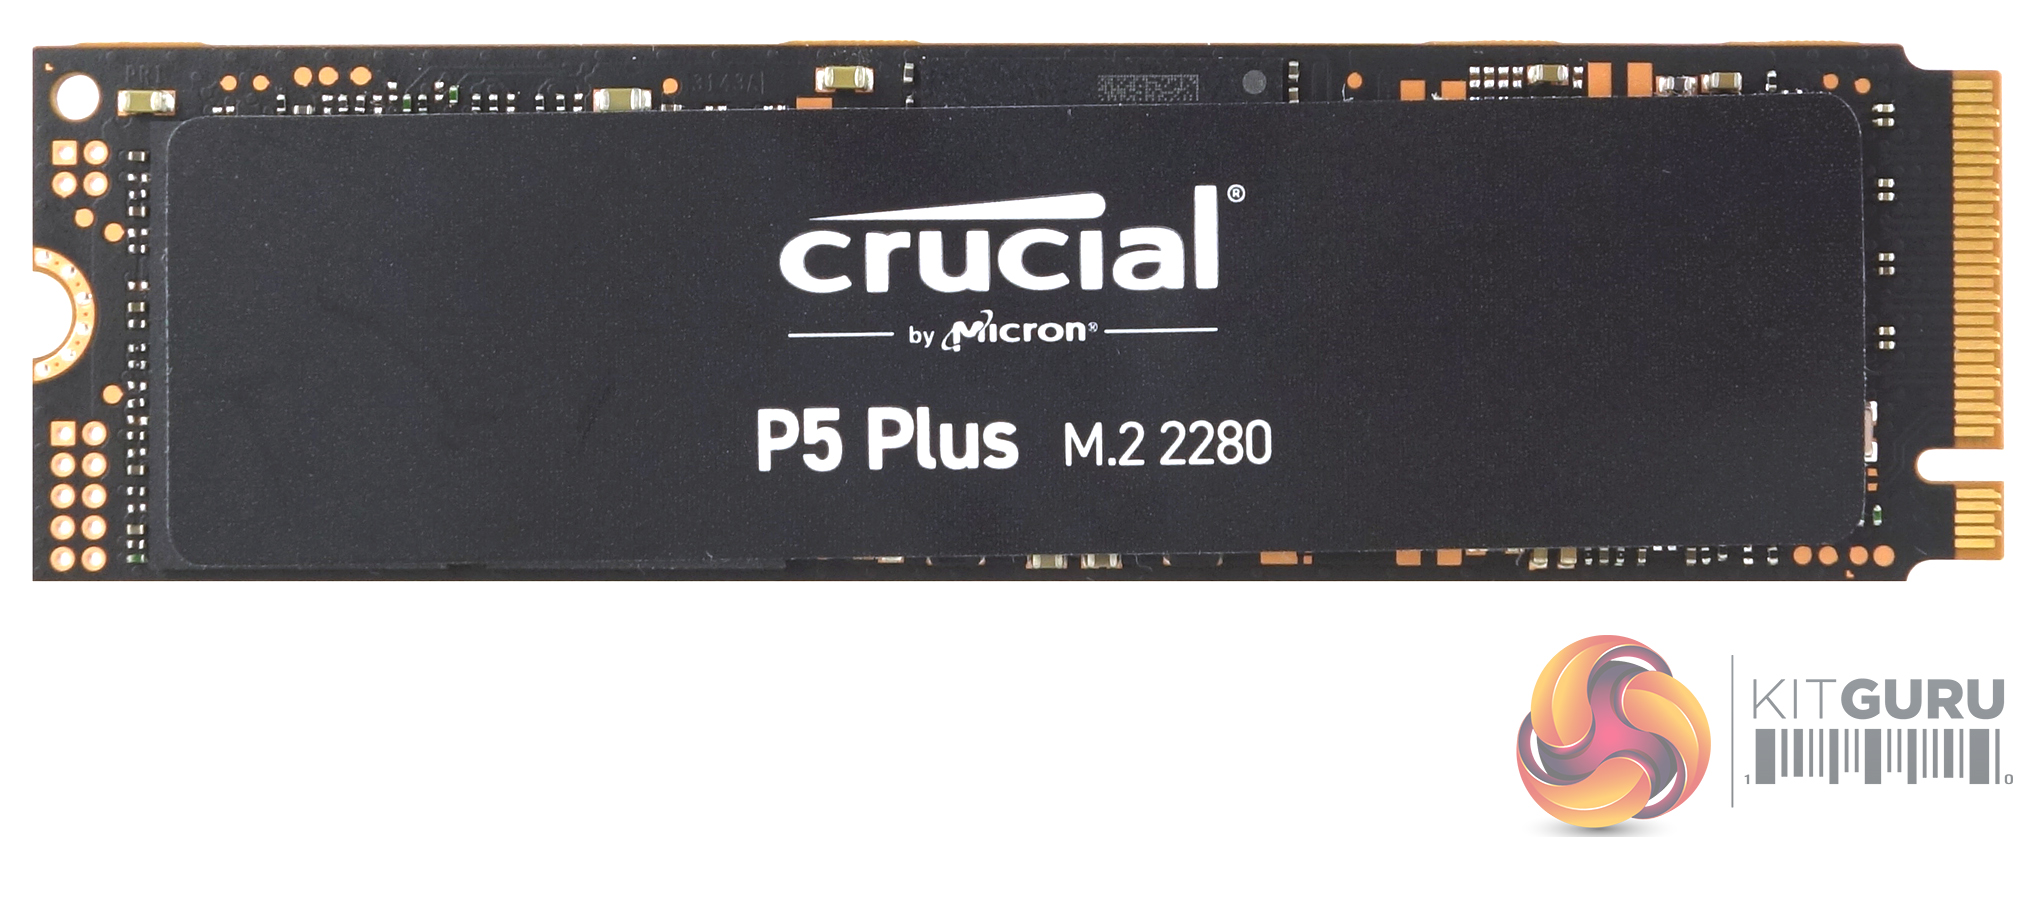
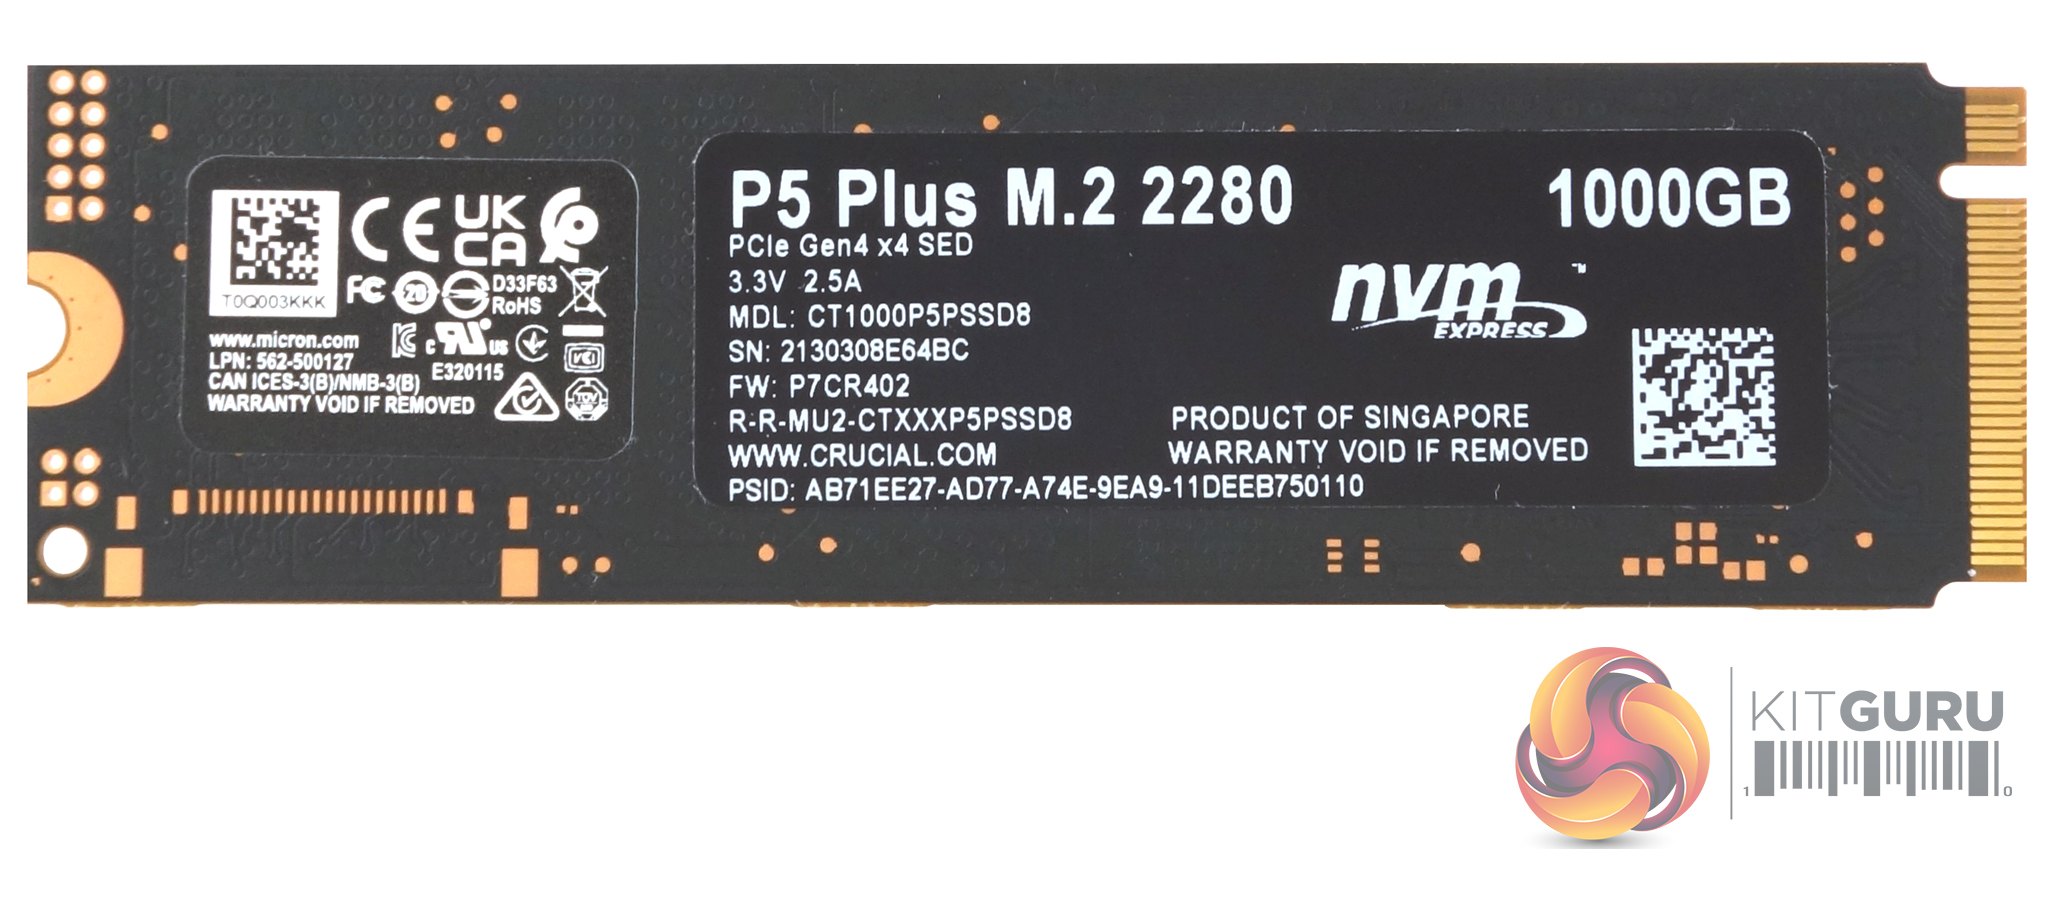
The 1TB P5 Plus is built on a single-sided M.2 format, with no additional cooling aids.

Under the product label on the top of the drive sits the Micron DM02A1 controller, two 512GB packages of Micron B47R 176-Layer 3D TLC NAND and a 1GB DLPDDR4-4266 chip for caching duties. Details on the controller are sparse, to say the least, basically that it has 8-channels and supports hardware encryption and that's about it.
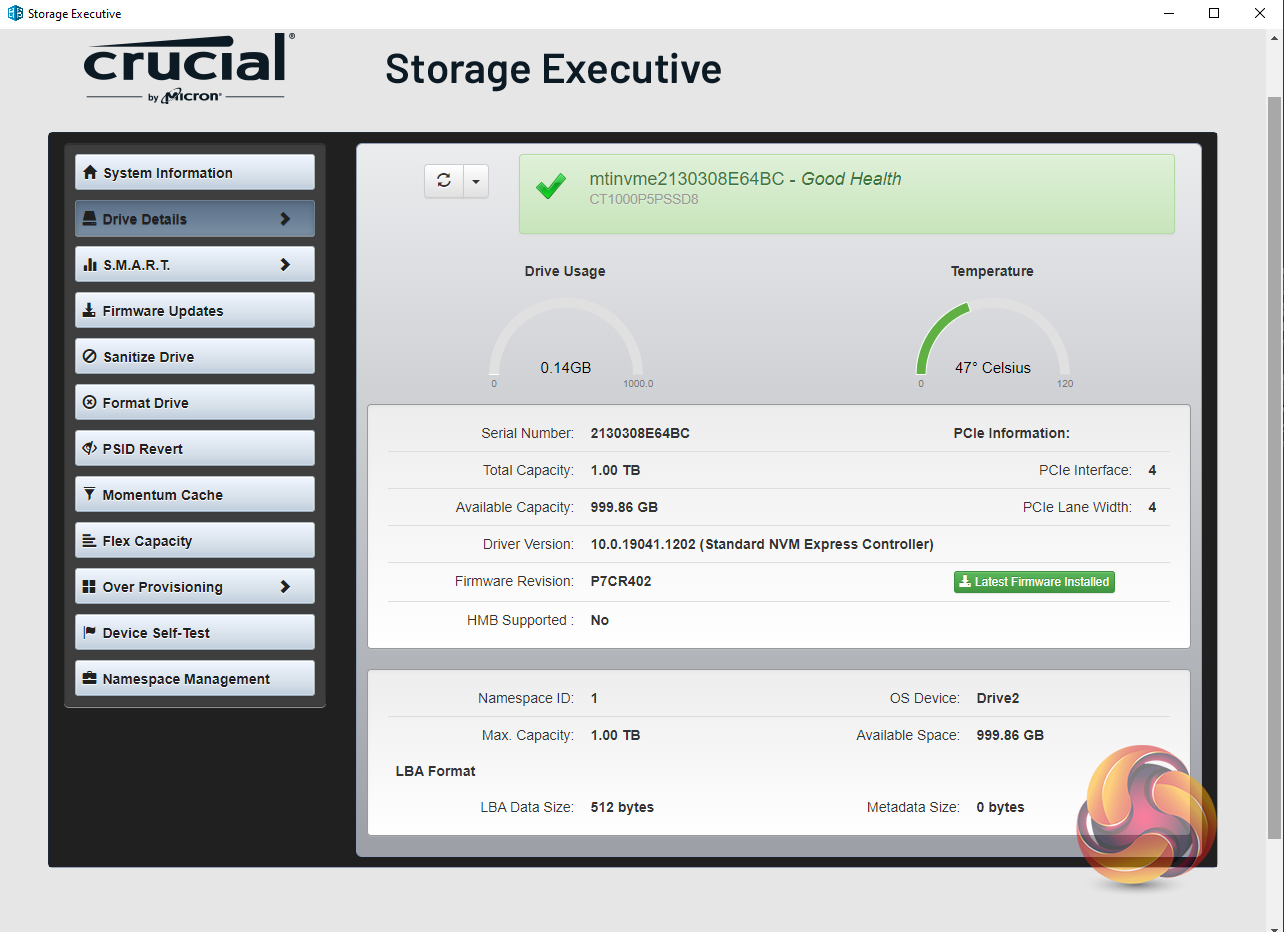
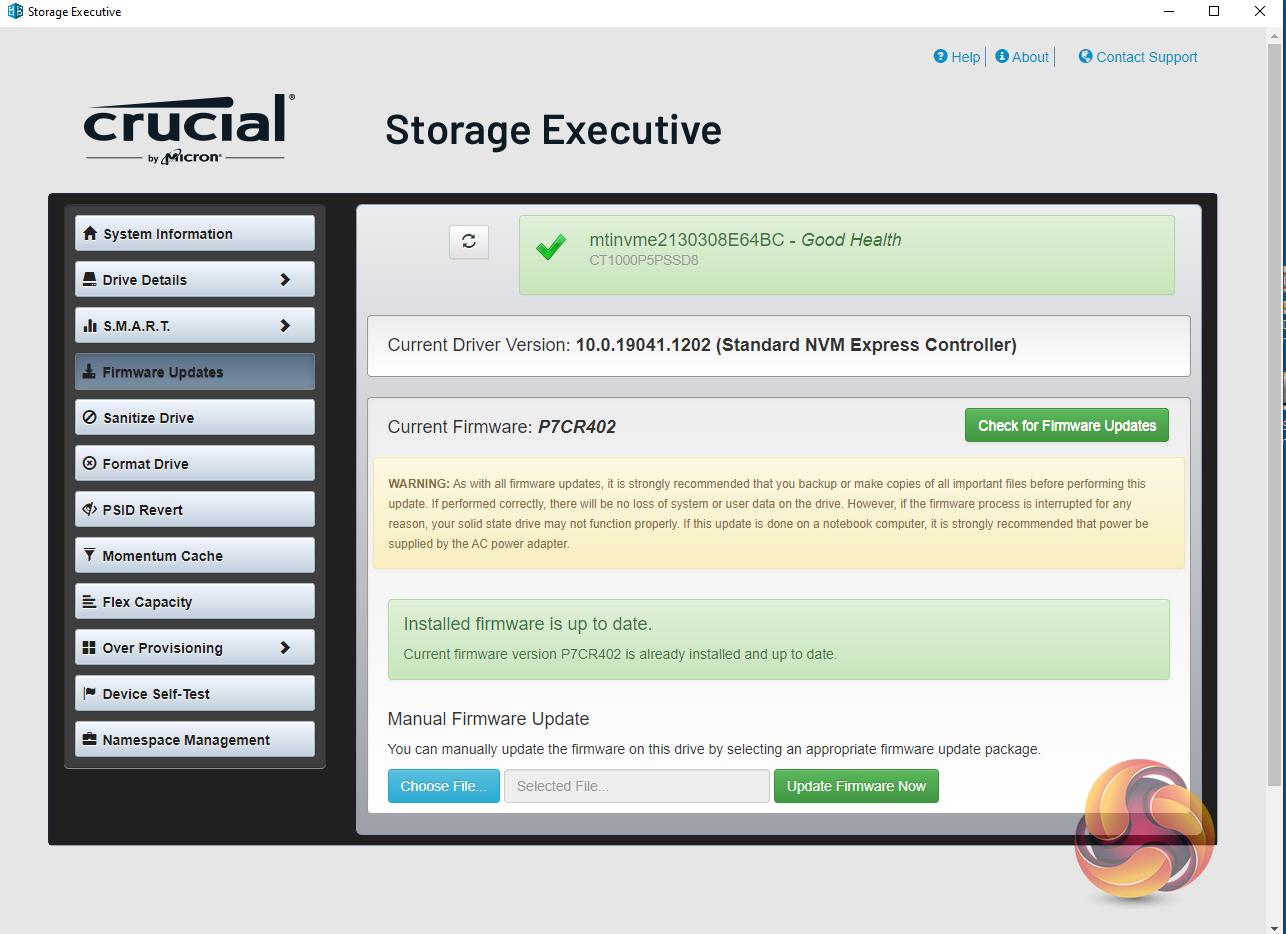
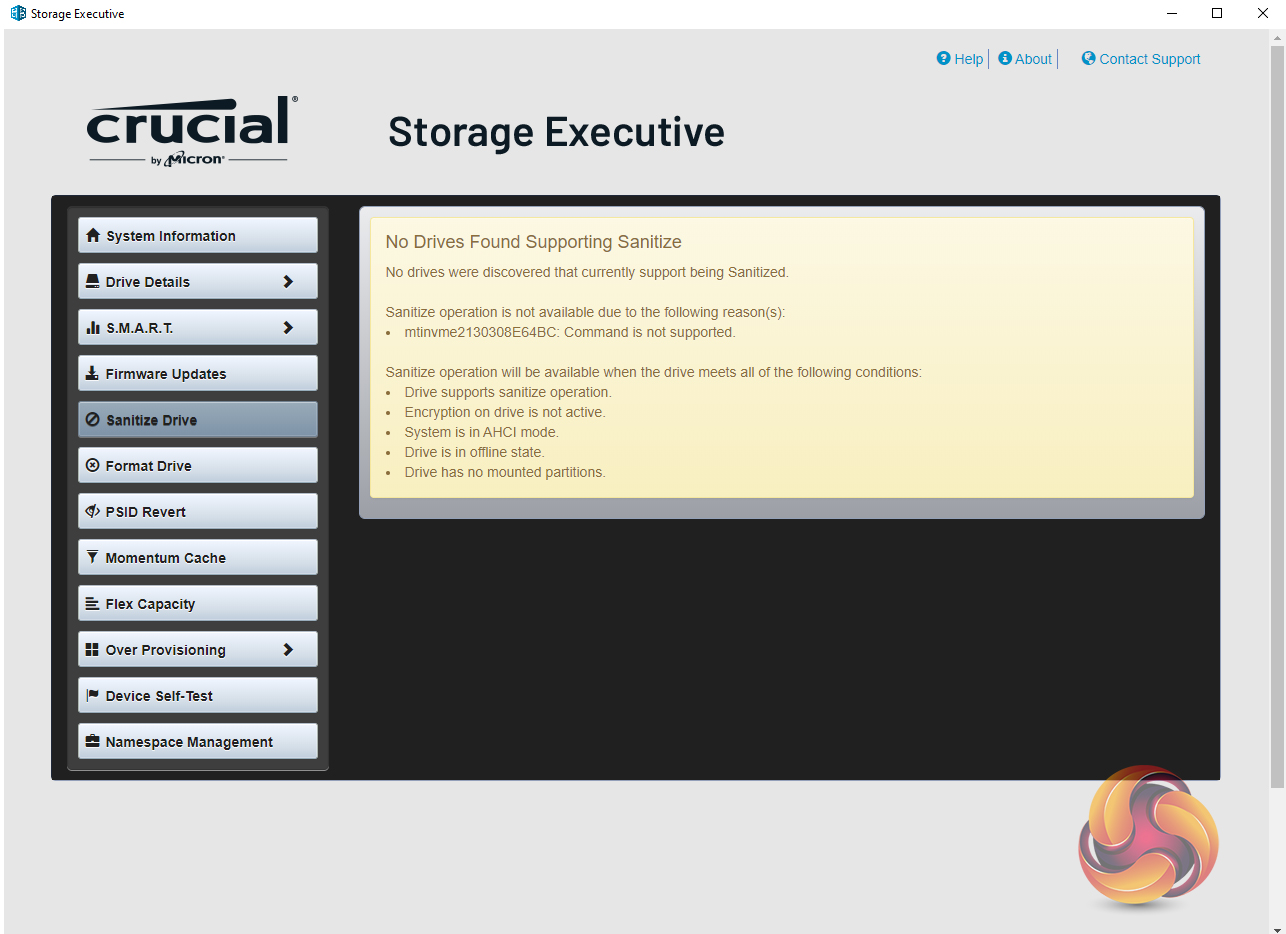
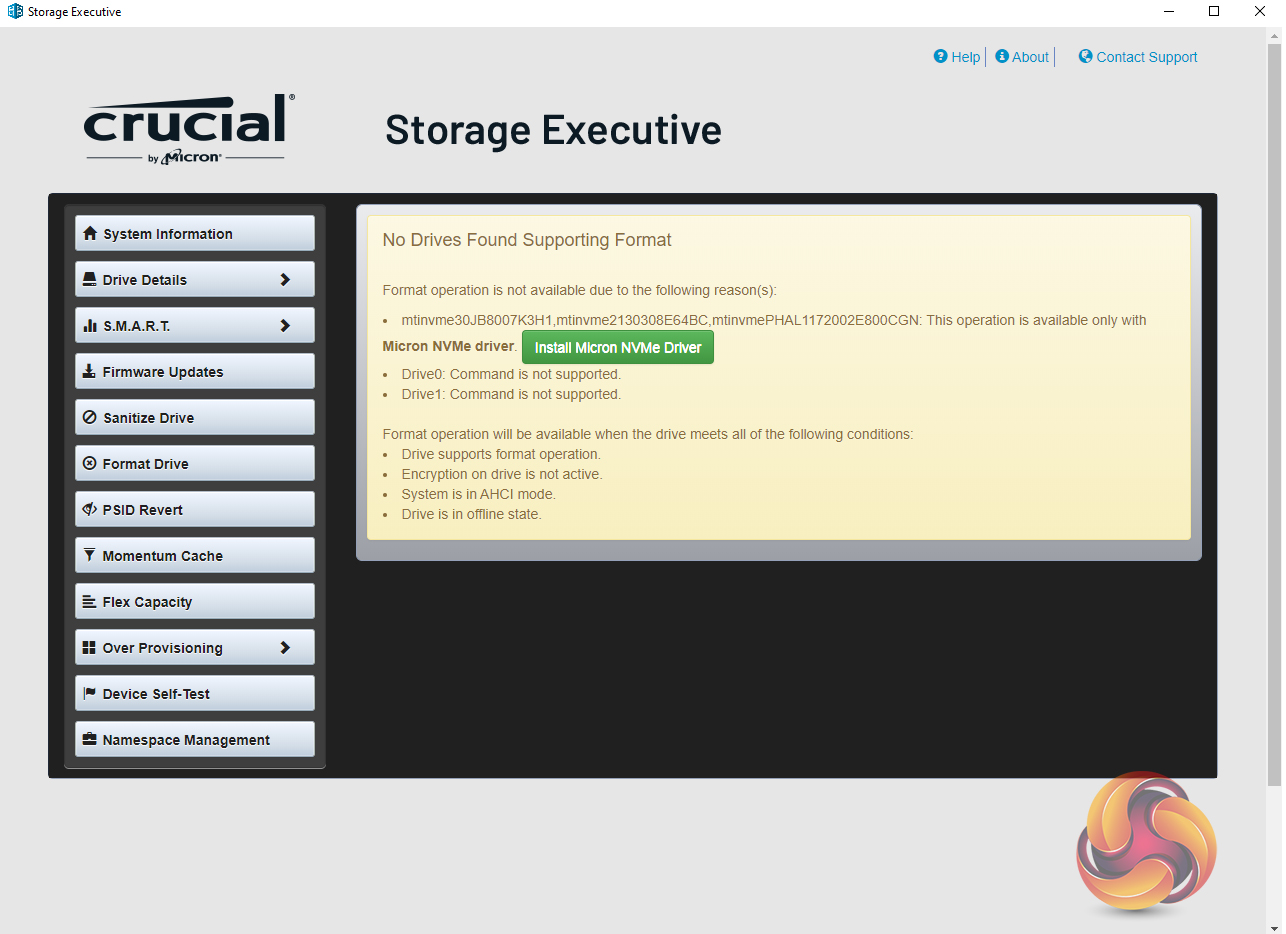
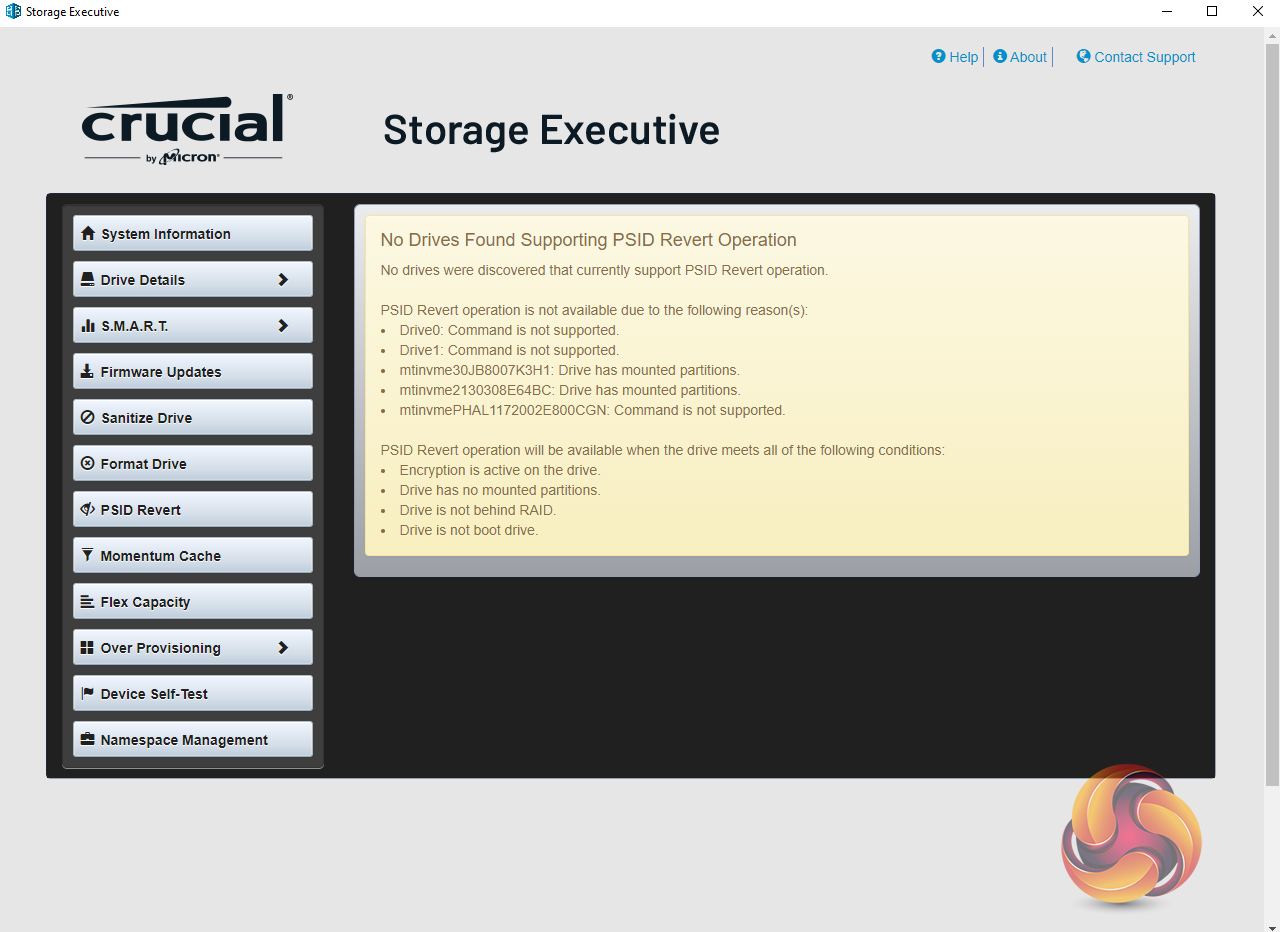
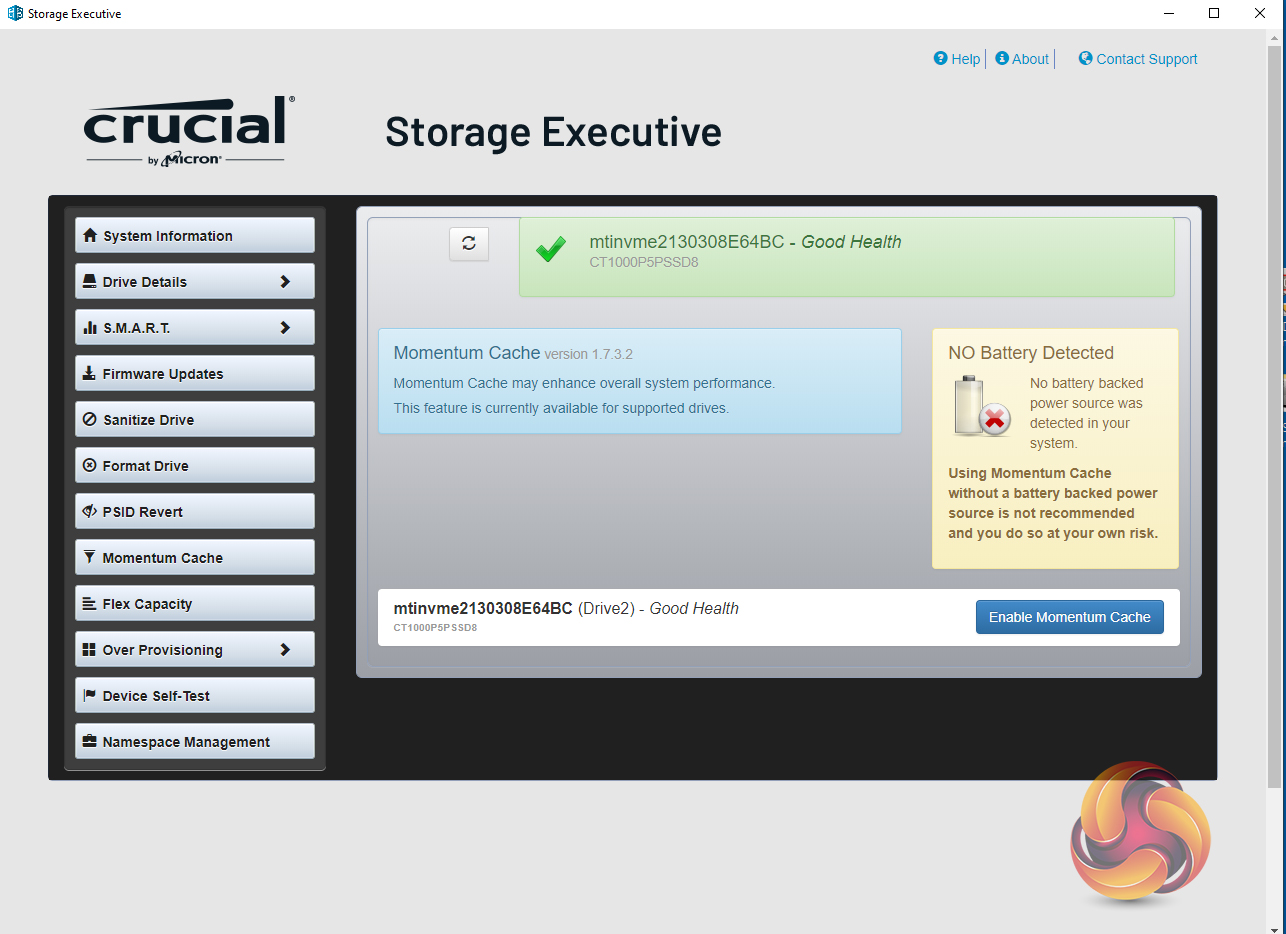
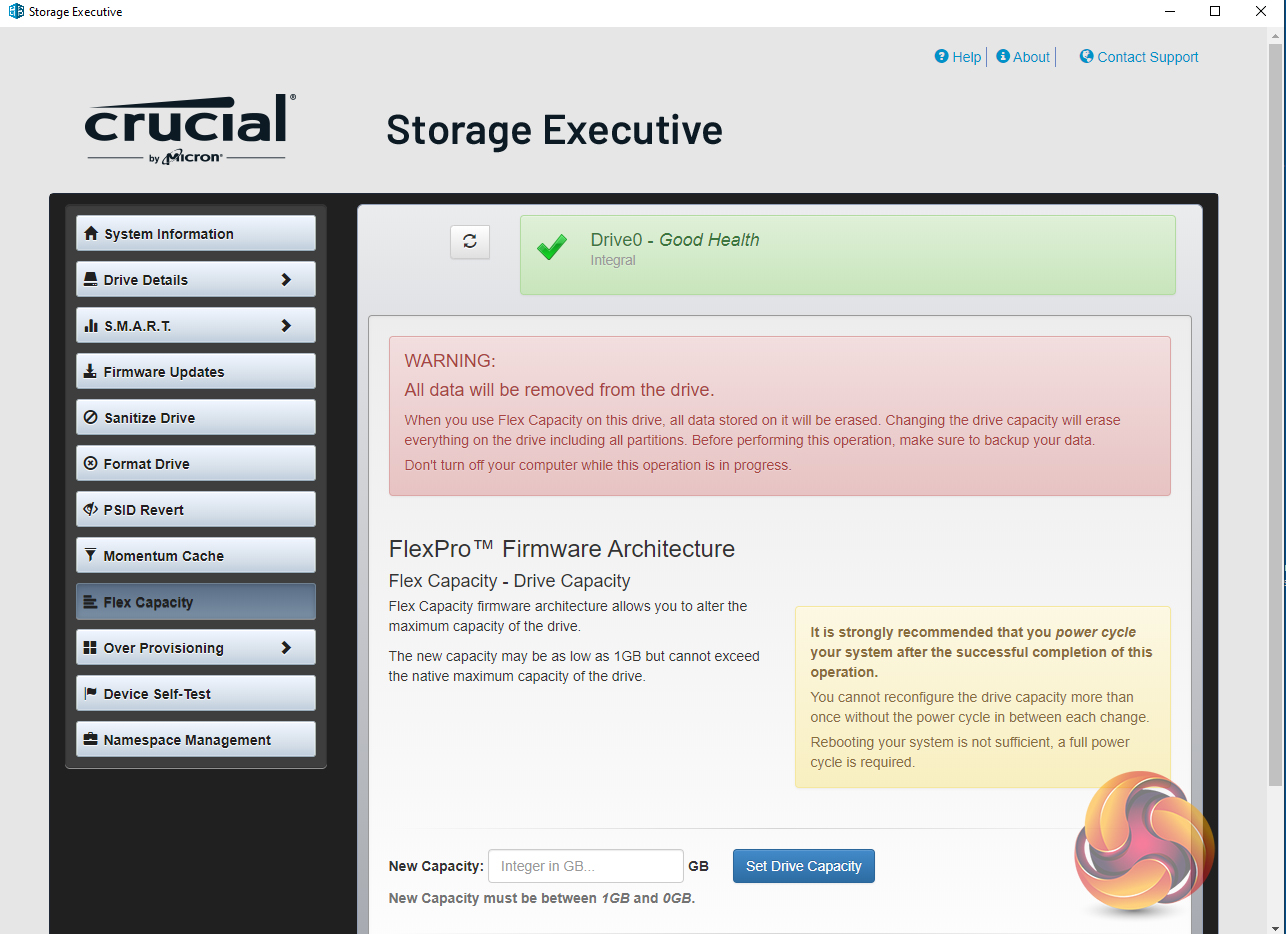

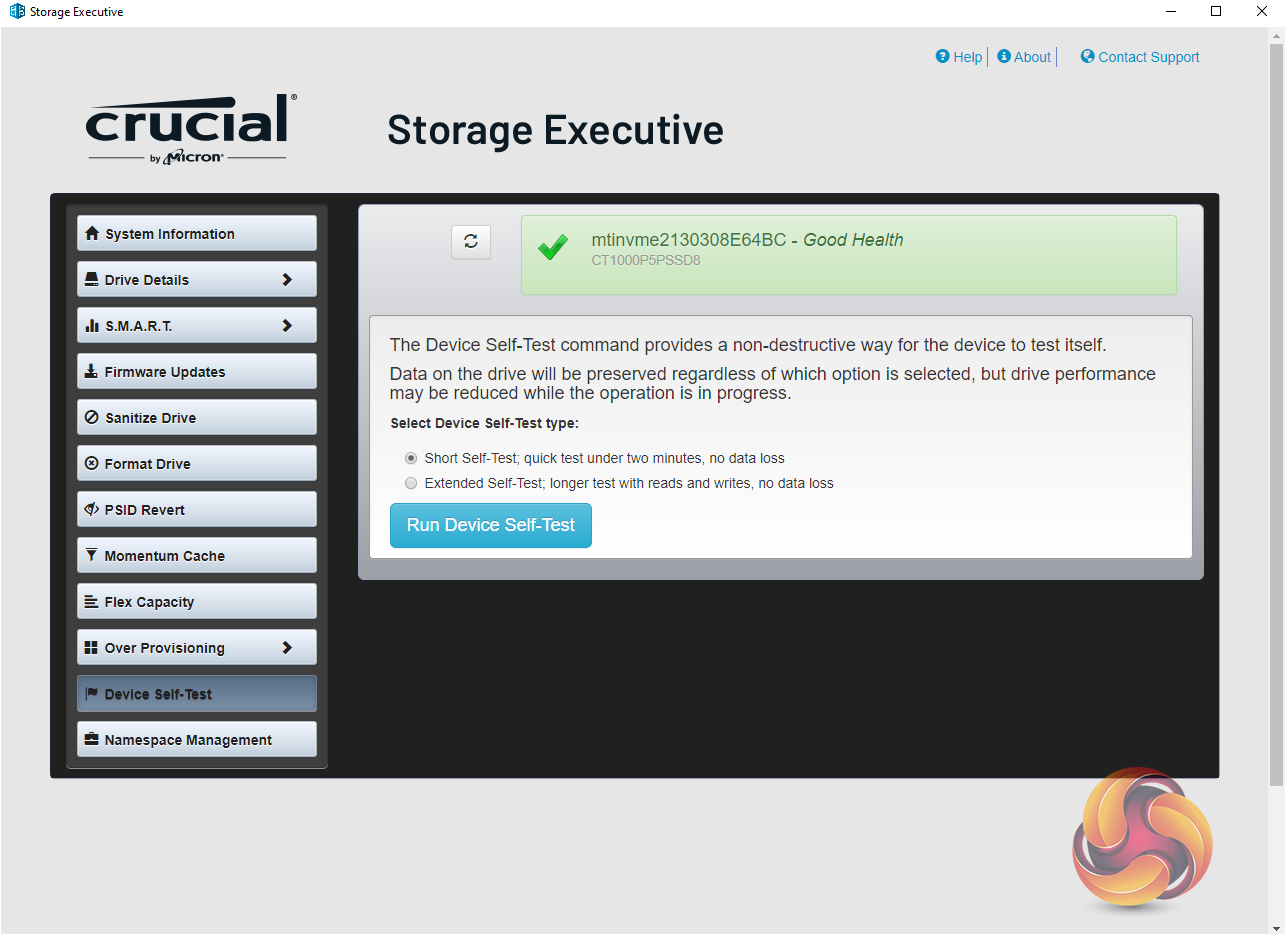
Crucial’s Storage Executive is a pretty comprehensive SSD toolkit. With it, you can check the drive’s S.M.A.R.T data, update the firmware, see how the drive’s capacity is being used, monitor the drive’s operating temperature and overall health as well as adjusting the Over Provisioning. There are few more options as well that aren't supported by this particular drive.
For testing, the drives are all wiped and reset to factory settings by HDDerase V4. We try to use free or easily available programs and some real-world testing so you can compare our findings against your own system.
This is a good way to measure potential upgrade benefits.
Main system:
AMD Ryzen 5 3600X, 16GB DDR4-2400, Sapphire R9 390 Nitro and an MSI MPG X570 Gaming Edge Wifi motherboard
Other drives
Corsair MP600 PRO 2TB
Corsair Force MP600 1TB
Corsair MP600 PRO XT 2TB
Gigabyte AORUS 7000e 2TB
MSI Spatium M480 2TB
Patriot Viper VP4300 2TB
Patriot Viper VPN4100 1TB
PNY XLR8 CS3040 1TB
PNY XLR8 CS3140 1TB
Sabrent Rocket 4 Plus 1TB
Sabrent Rocket 4 Plus 2TB
Sabrent Rocket 4 Plus 4TB
Samsung SSD980 PRO 1TB
Seagate FireCuda 520 1TB
Teamgroup T-Force Cardea Zero Z440 1TB
WD Black SN850 1TB
Software:
Atto Disk Benchmark 4.
CrystalMark 7.0.0.
AS SSD 2.0.
IOMeter.
Futuremark PC Mark 10.
All our results were achieved by running each test five times with every configuration this ensures that any glitches are removed from the results. Trim is confirmed as running by typing fsutil behavior query disabledeletenotify into the command line. A response of disabledeletenotify =0 confirms TRIM is active.
CrystalDiskMark is a useful benchmark to measure theoretical performance levels of hard drives and SSD’s. We are using v6.0 and v8.0.
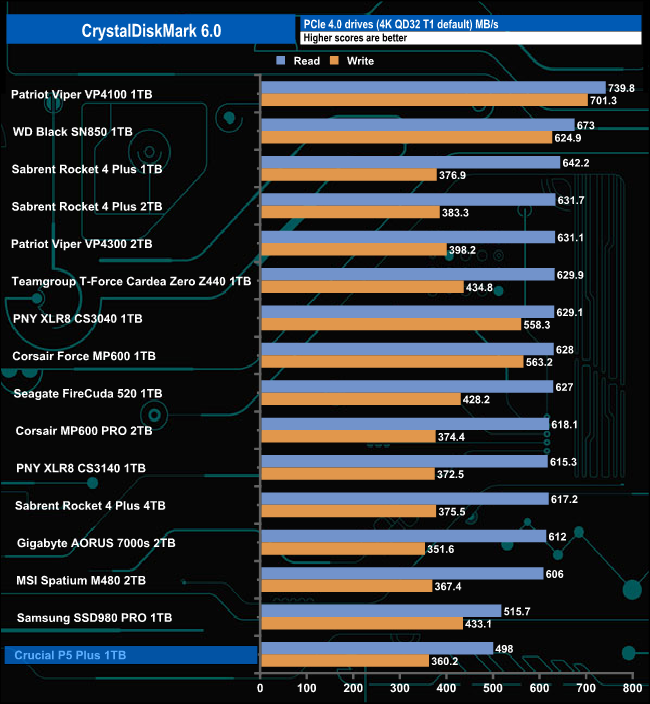
The P5 Plus doesn't seem to handle the single-threaded CrystalDiskMark QD32 test very well at all, sitting as it does at the bottom of the results chart. On the other hand, we could confirm the official Sequential read/write figures for the drive of up to 6600MB/s and 5,000MB/s for read and rights respectively with test results of 6,607MB/s for reads and 5,018MB/s for writes.

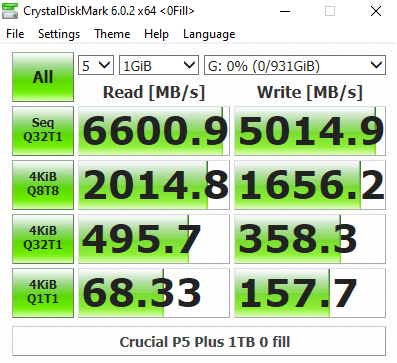
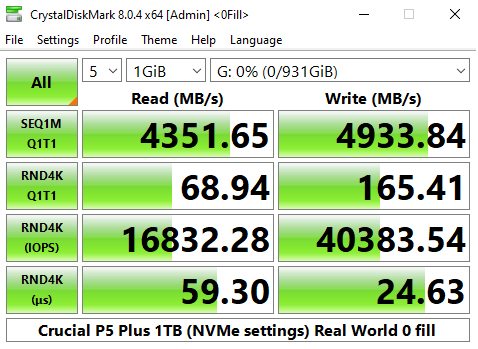
Looking at the two benchmark result screens it appears that the Micron controller the drive uses doesn't care about the type of data it's being asked to handle.
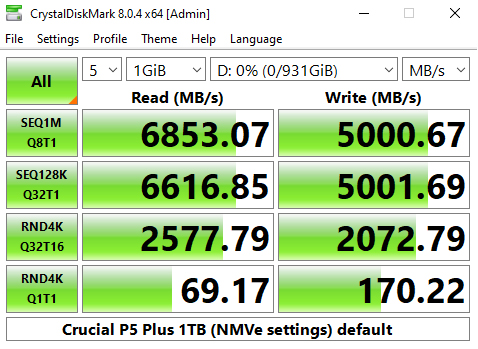
CrystalDiskMark 8

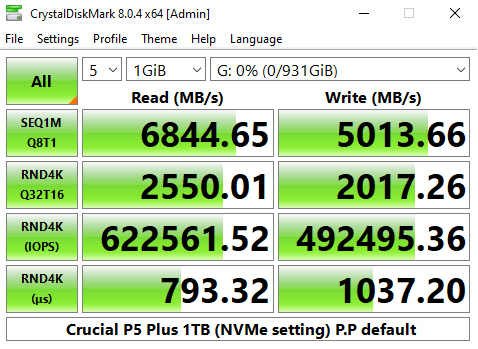
CrystalDiskMark 8 Peak Performance Profile
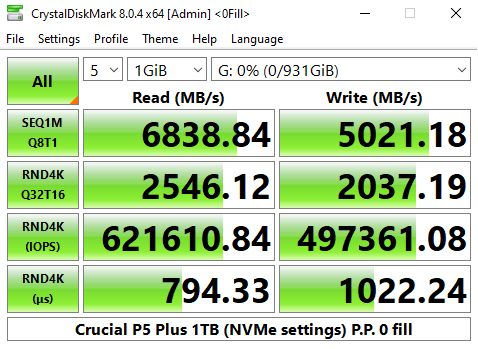
CrystalDiskMark 8 Real World Profile
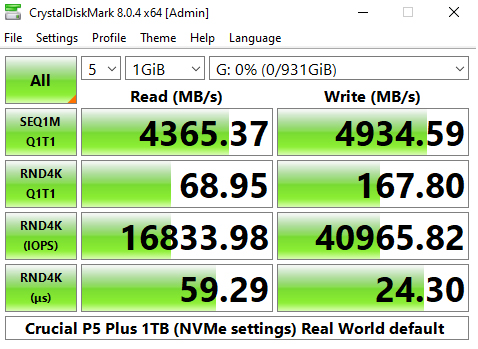
CrystalDiskMark 8 comes with a couple of interesting ready-made testing profiles as well as a dedicated NVMe setting. The best tested Sequential figure for reads, 6,853.07MB/s once again confirms the official rating, as does the best write result of 5,021.18MB/s.
The best tested random 4K read figure in CDM8's Peak Performance was 622,561.52 IOPS a little short of the official maximum of 630,000 IOPS. The best write figure of 497,361 IOPS was well short of the official maximum of 700,000 IOPS.
The ATTO Disk Benchmark performance measurement tool is compatible with Microsoft Windows. Measure your storage systems performance with various transfer sizes and test lengths for reads and writes. Several options are available to customize your performance measurement including queue depth, overlapped I/O and even a comparison mode with the option to run continuously. Use ATTO Disk Benchmark to test any manufacturers RAID controllers, storage controllers, host adapters, hard drives and SSD drives and notice that ATTO products will consistently provide the highest level of performance to your storage.
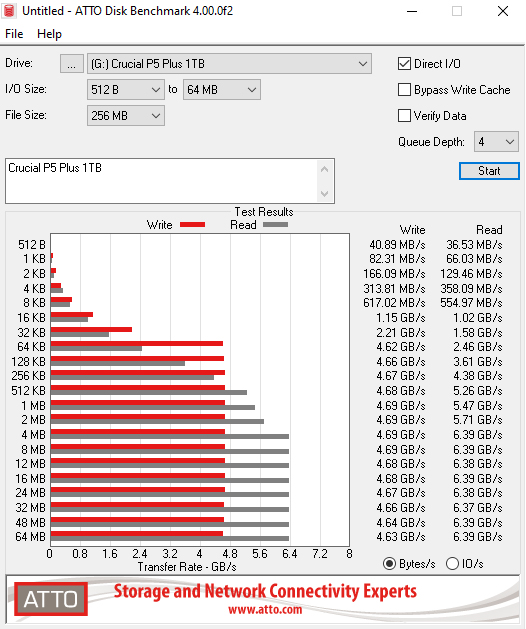
We are using version 4.0 for our NVMe disk tests.
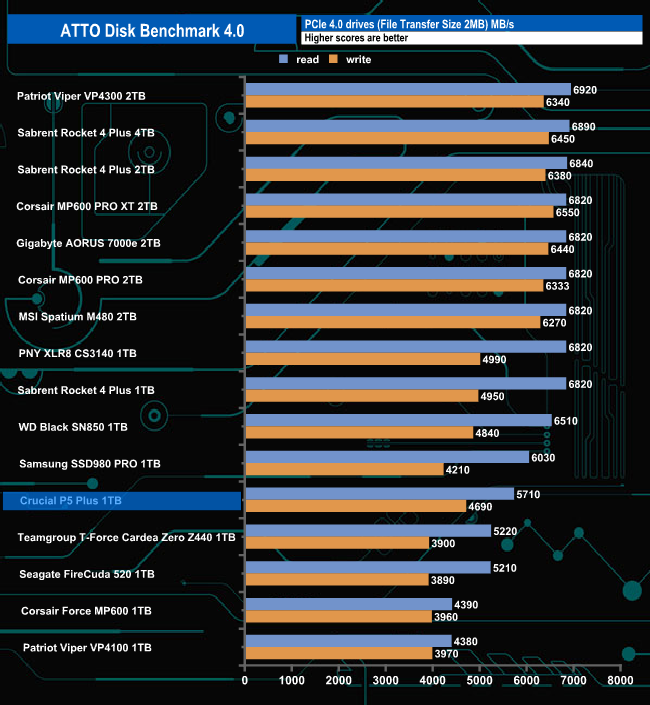
The official maximum Sequential read/write performance figures for the 1TB P5 Plus are up to 6,600MB/s and 5,000MB/s respectively. Using the ATTO benchmark we couldn’t quite hit either of these figures with reads of 5,710MB/s and 4,690MB/s for writes, figures which sees the drive in the bottom half of our results chart.
AS SSD is a great free tool designed just for benching Solid State Drives. It performs an array of sequential read and write tests, as well as random read and write tests with sequential access times over a portion of the drive. AS SSD includes a sub suite of benchmarks with various file pattern algorithms but this is difficult in trying to judge accurate performance figures.
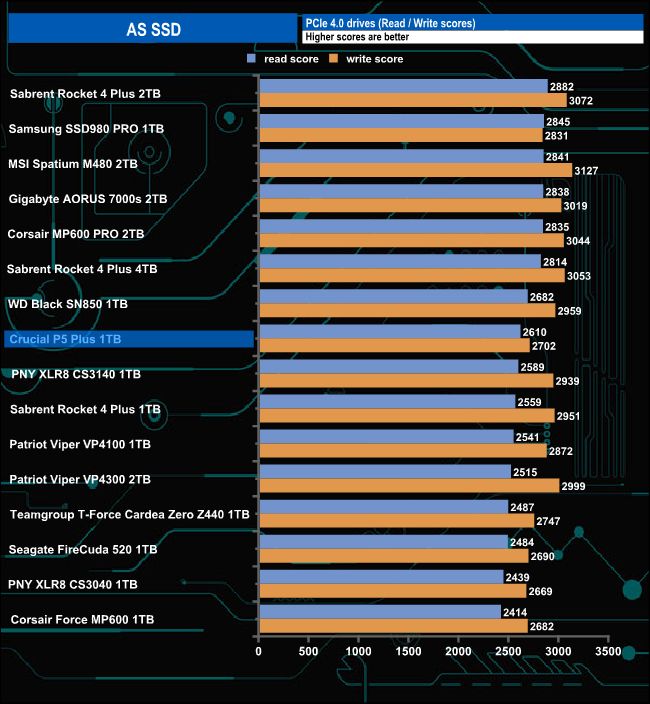
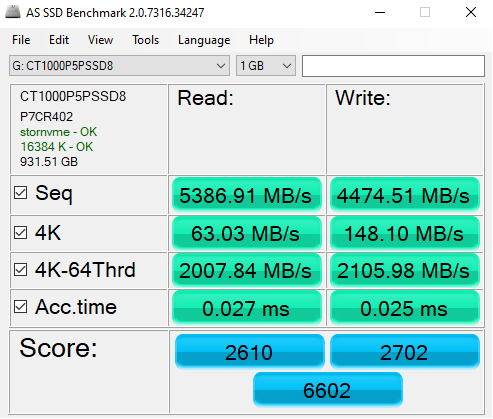
In the more demanding AS-SSD benchmark, the P5 Plus read and write scores of 2610 and 2702 respectively sees the drive in a mid-table position.
We test the Sequential read and write performance of a drive through a range of queue depths. The setup for the tests is listed below.
128KB Sequential Read / Write.
Transfer Request Size: 128KB, Thread(s): 1, Outstanding I/O: 1-32.
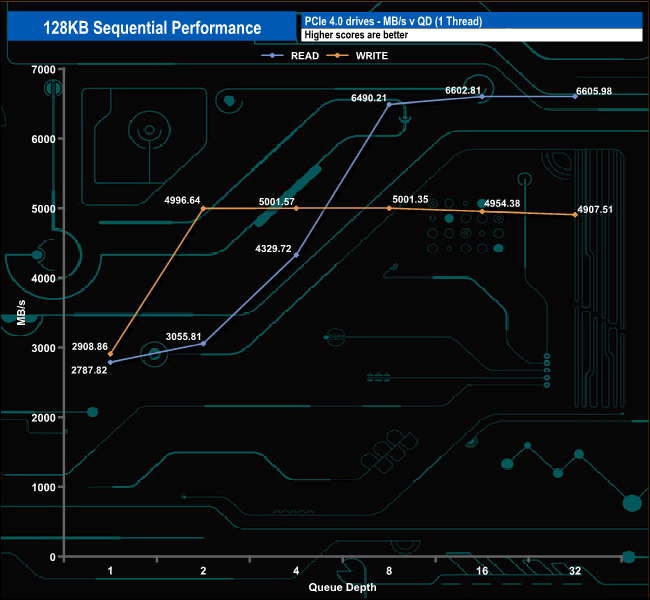
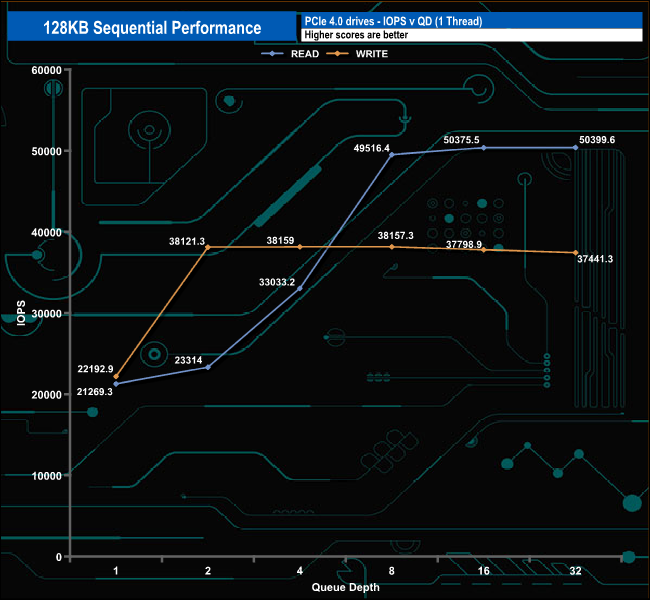
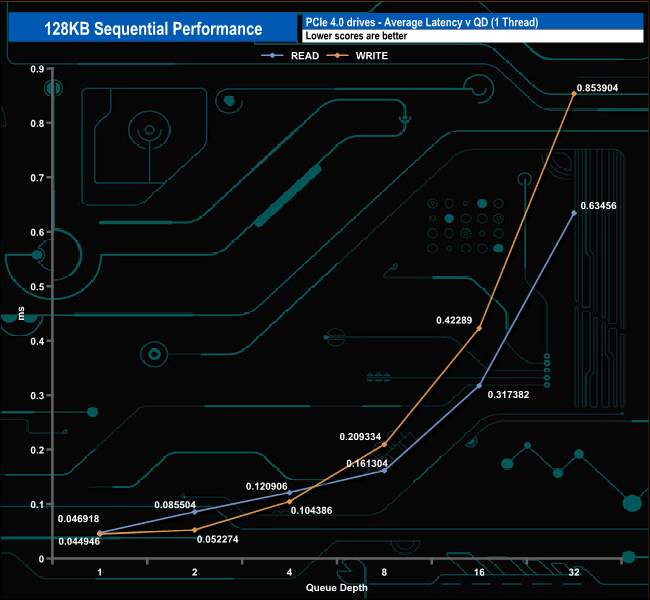
In our own Sequential tests, we saw a peak read score of 6,605.98MB/s (QD32) which confirmed the official read figure. The best-tested write result was 5,001.57MB/s (QD4) again confirming the official 5,000MB/s.
128KB Sequential Read Performance v QD compared.

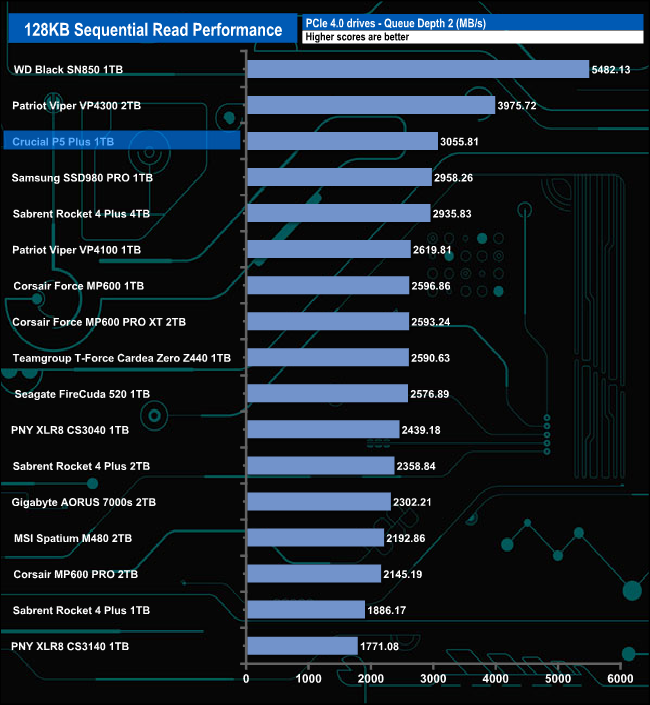
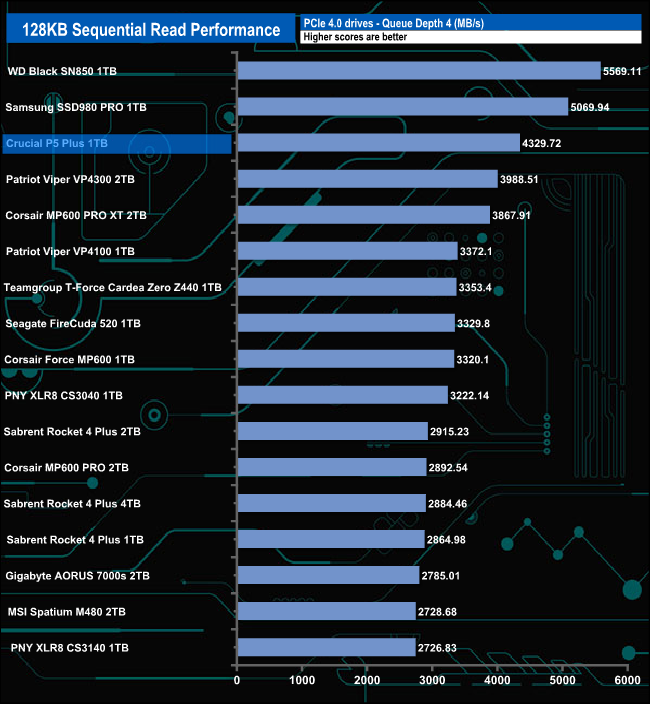
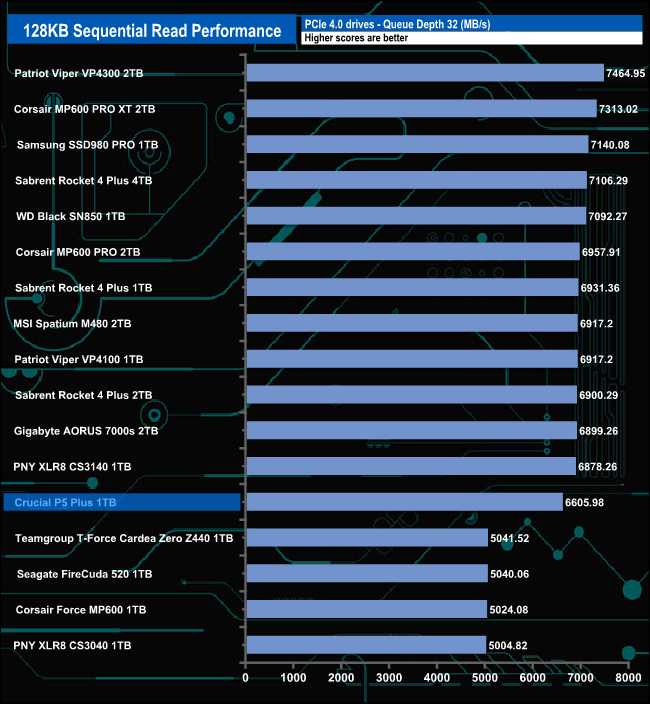
At QDs 1,2 and 4 the drive sits in the top five of the Sequential read results charts but at QD32, the drive sinks to the bottom half of the table.
128KB Sequential Write Performance v QD compared.
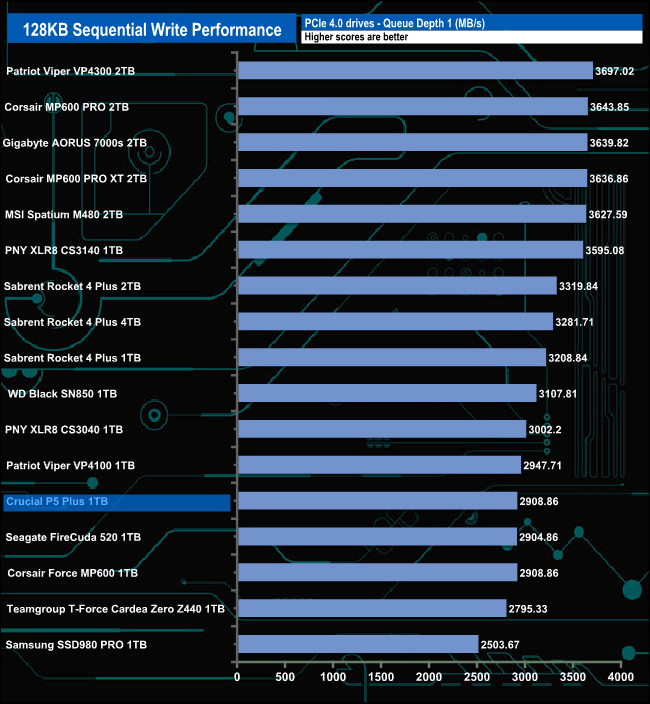
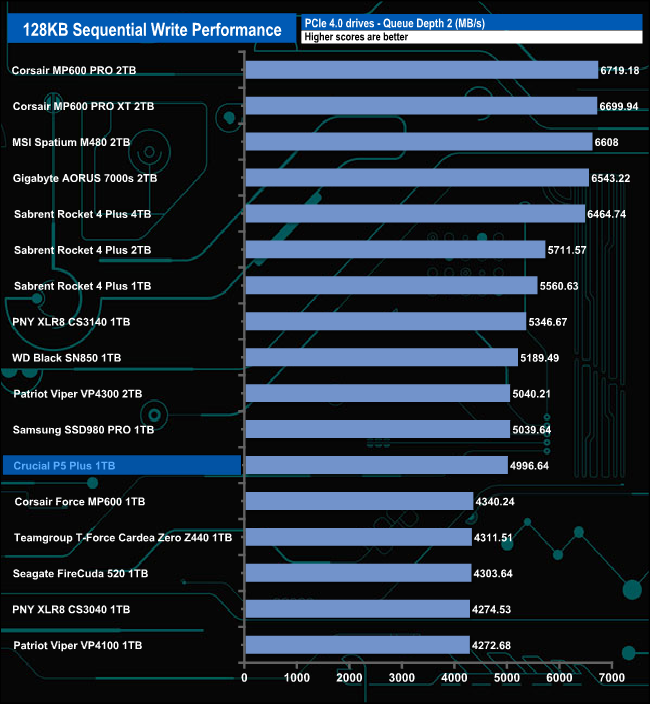
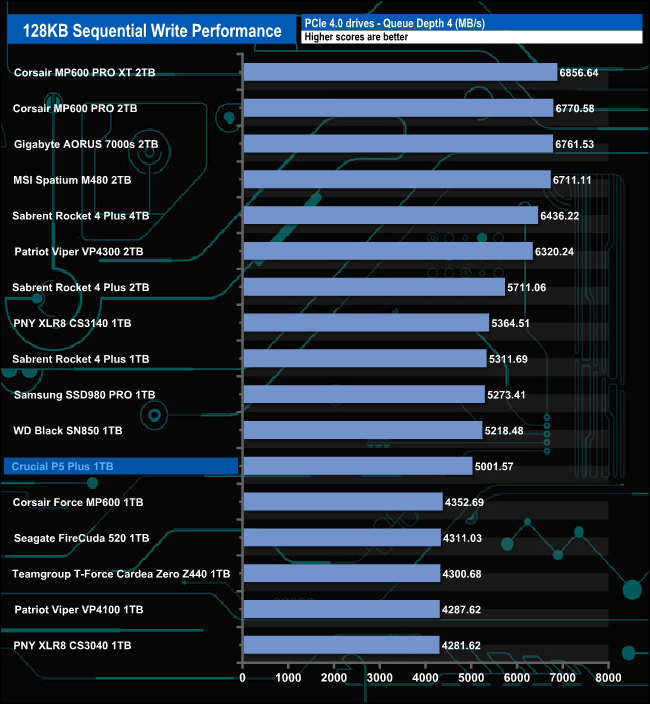

In contrast to the Sequential read results, the Sequential write results see the drive positioned in the bottom half of the results charts throughout the tested queue depths.
We test the 4K random read performance of a drive through a range of queue depths. The setup for the tests is listed below.
4K Random Read
Transfer Request Size: 4KB, Outstanding I/O: 1-32.
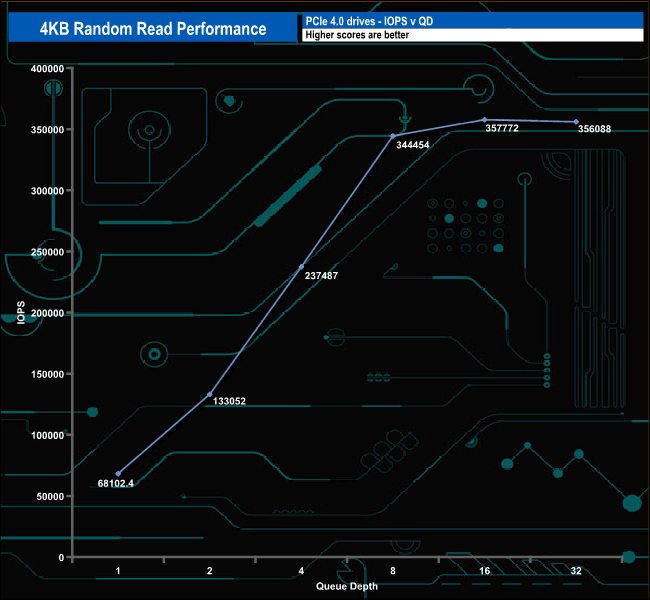
In our four-threaded random 4K read test, the peak result of 357,772 IOPS came at a queue depth of 16, but that figure is some way shy of the maximum 630,000 IOPS. We did a quick test of the drive at QD32 using eight threads, the result of 435,228 IOPS was an improvement but still some way short of the maximum.
4K Random Read v QD Performance compared.
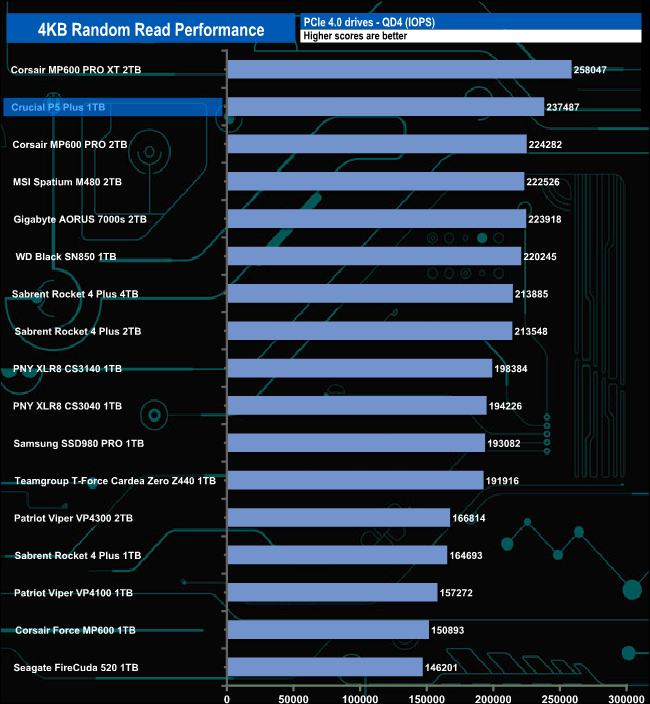
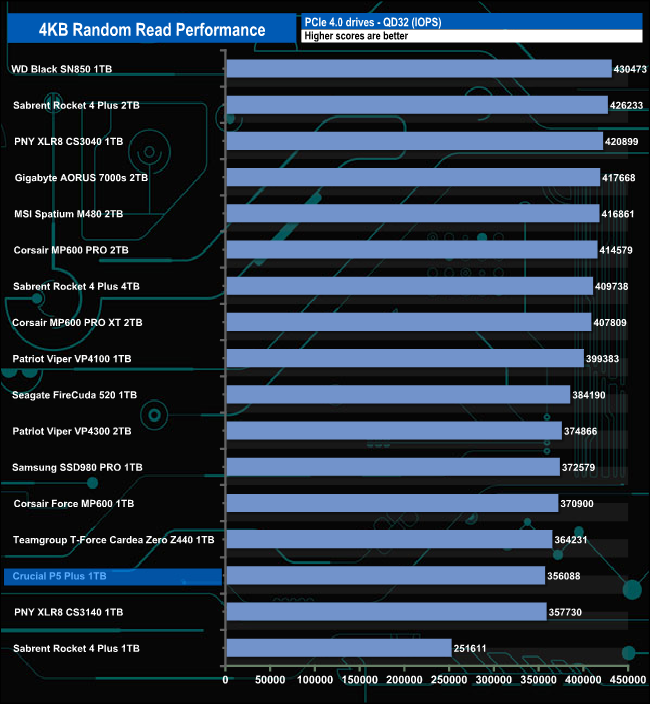
At low queue depths (1,2 and 4) the random read performance is strong enough to see the drive in the top five positions in the results chart. However, at the much deeper queue depth of 32, the drive is to be found much closer to the bottom of the chart.
We test the 4K random write performance of a drive through a range of queue depths. The setup for the tests is listed below.
4K Random Write
Transfer Request Size: 4KB, Outstanding I/O: 1-32.
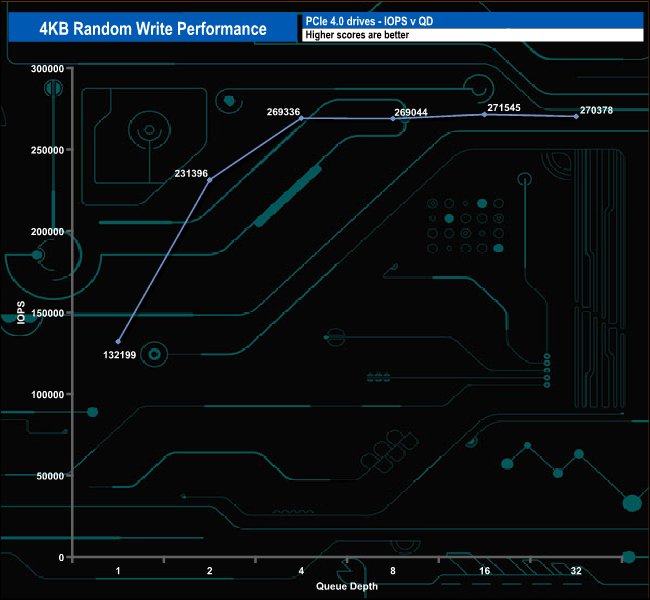
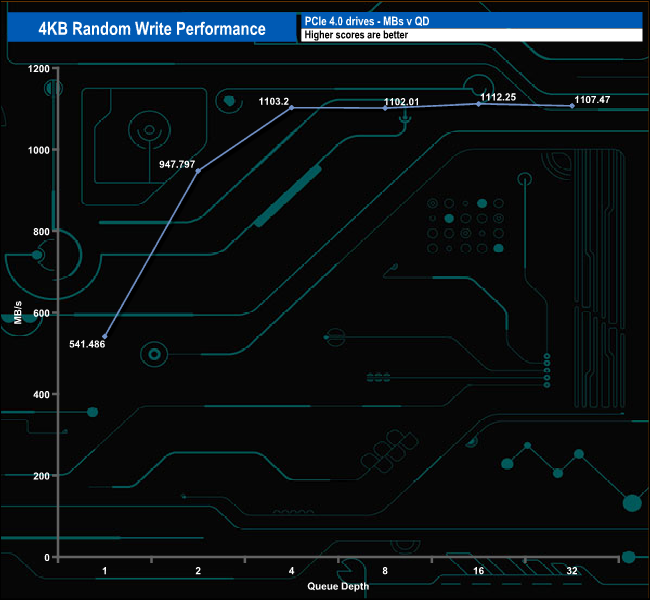
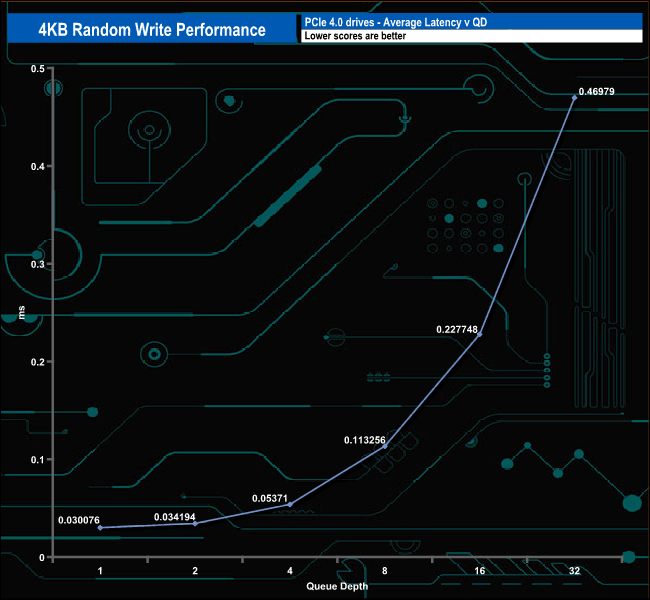
In our four-threaded random write tests, the drive's best performance came at the QD16 mark at 271,545 IOPS before dropping back to finish the test run at 270,378 IOPS. That peak figure is nowhere close to the official maximum for the drive of 700,000 IOPS. Once again we did a quick test using eight threads at QD32 with a result figure of 575,586 IOPS, still short of the maximum.
4K Random Write v QD Performance compared.
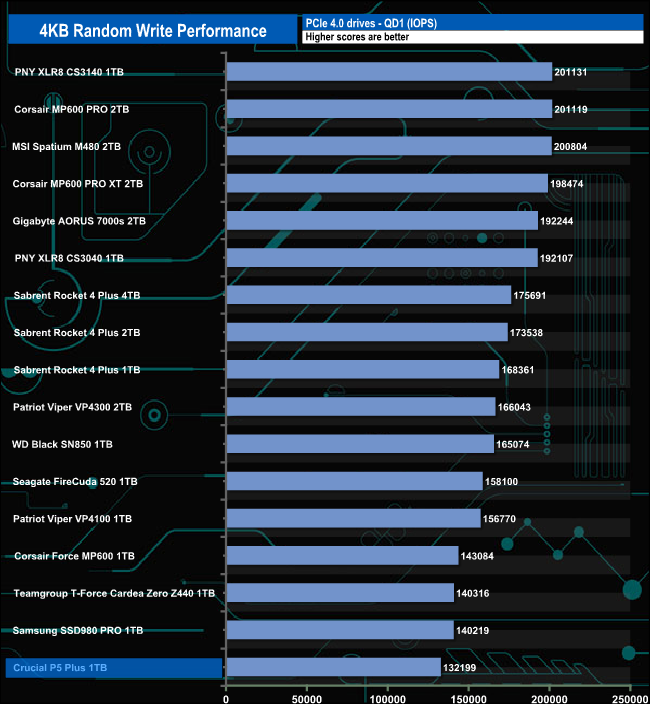
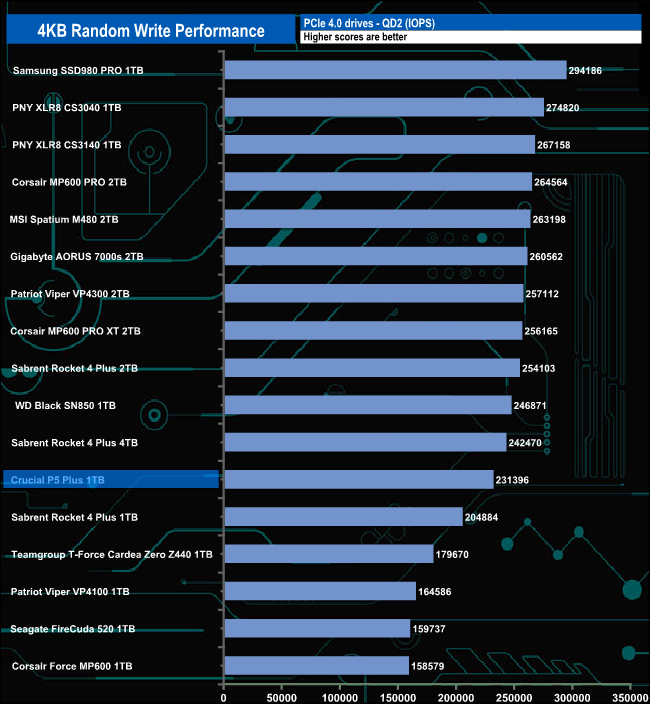
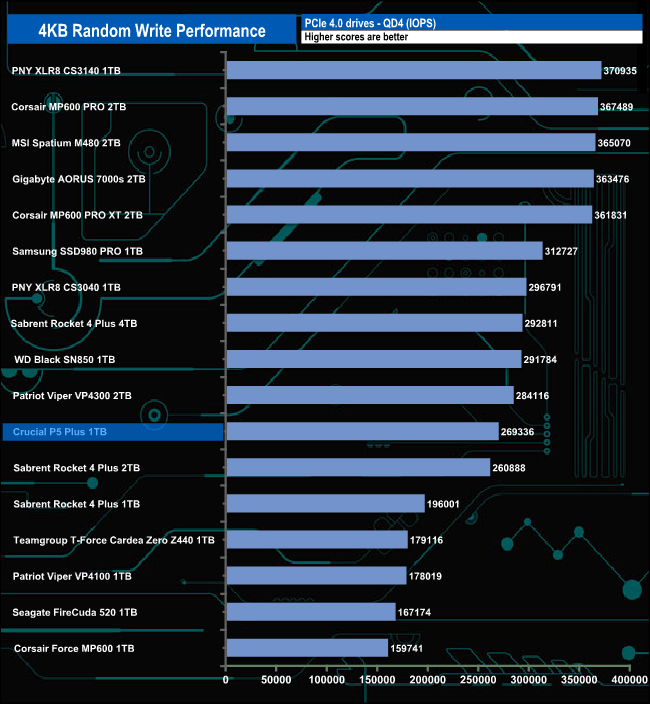
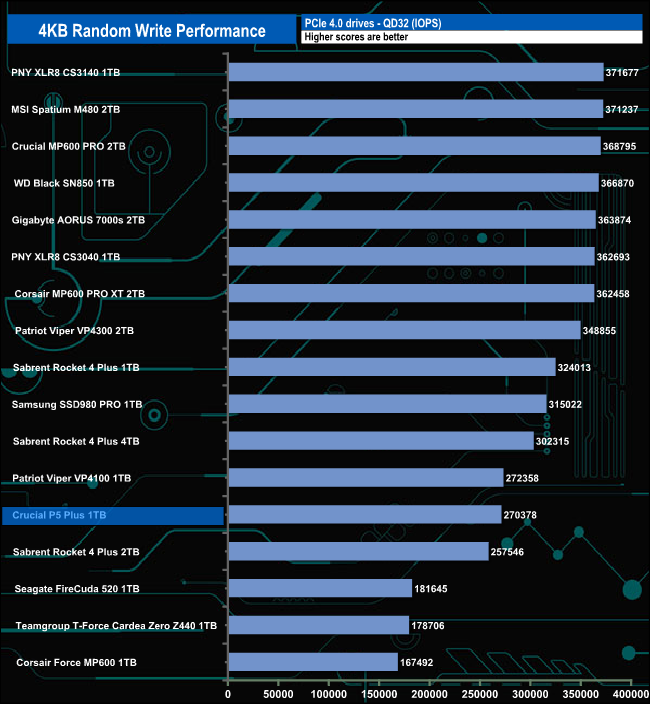
In a complete opposite to the random read performance, when it comes to random writes, the drive doesn't climb out of the bottom half of the result charts.
We test the 4K 70/30 mixed read/write performance of a drive through a range of queue depths.
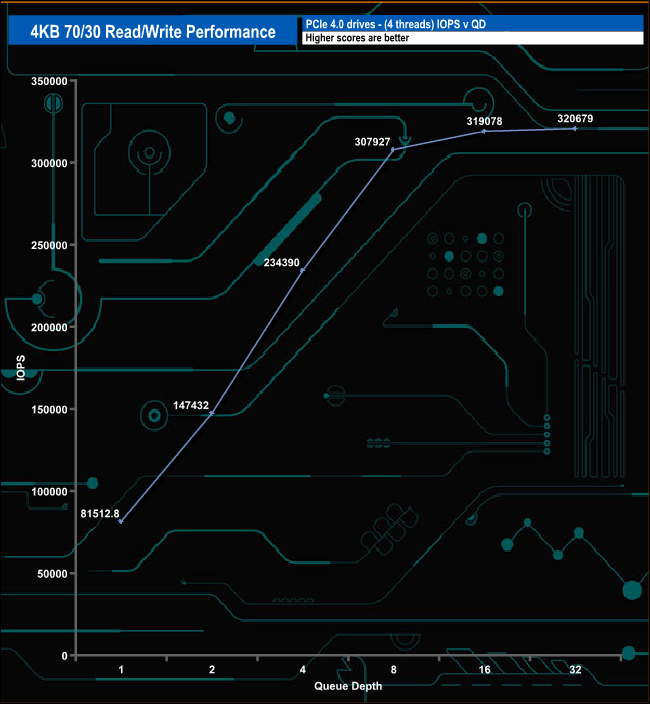
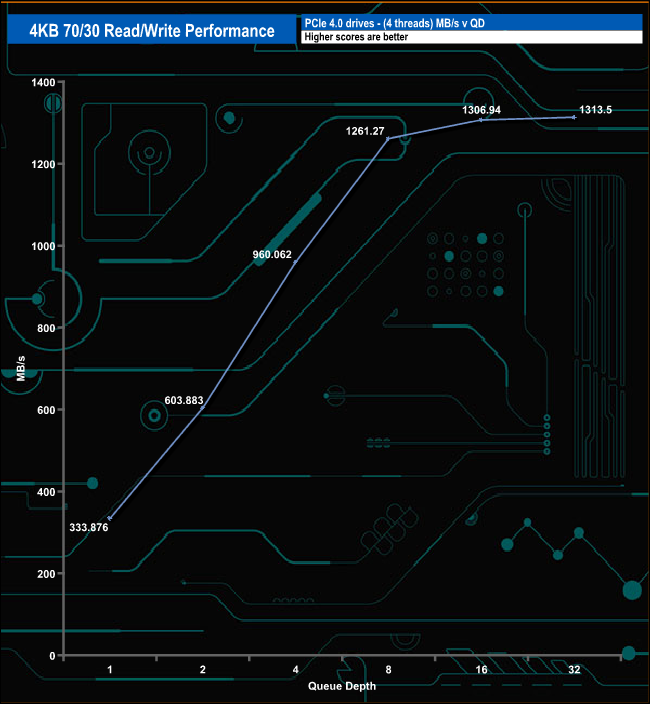
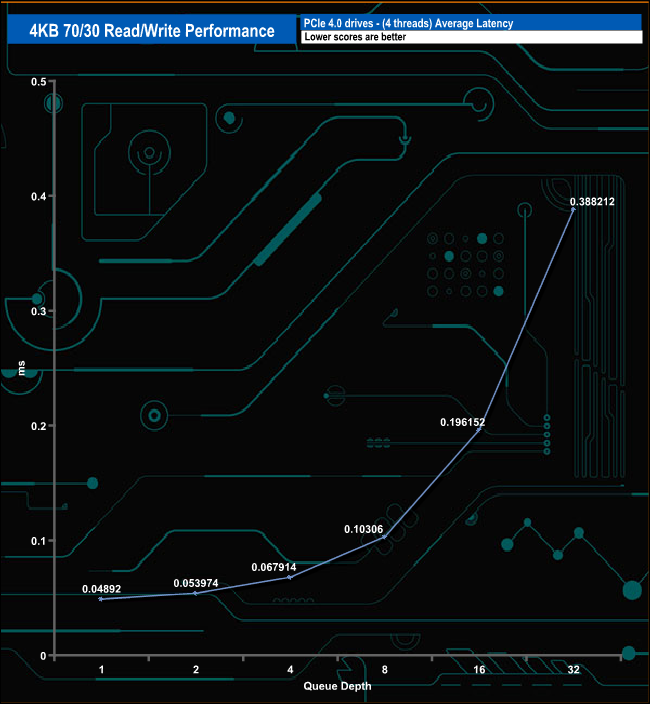
The drive performs well in our 4KB 70/30 Read/Write test climbing steadily until the QD16 mark where the performance starts to level off to finish the test run at QD32 with a figure of 320,679 IOPS (1313.5MB/s).
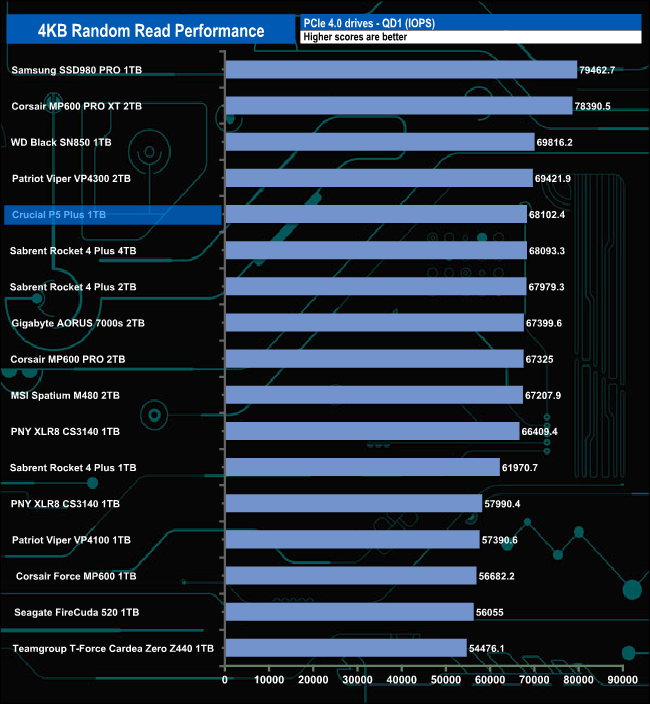
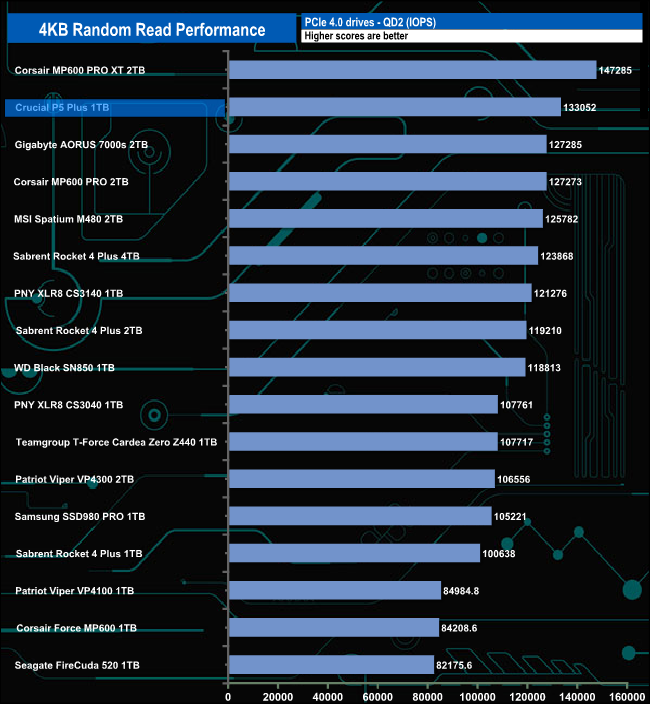
We used CrystalDiskMark 8 to test the random performance of the drive at lower queue depths (QD1 – QD8 where most of the everyday workloads occur) using 1 to 4 threads.
4K Random Read
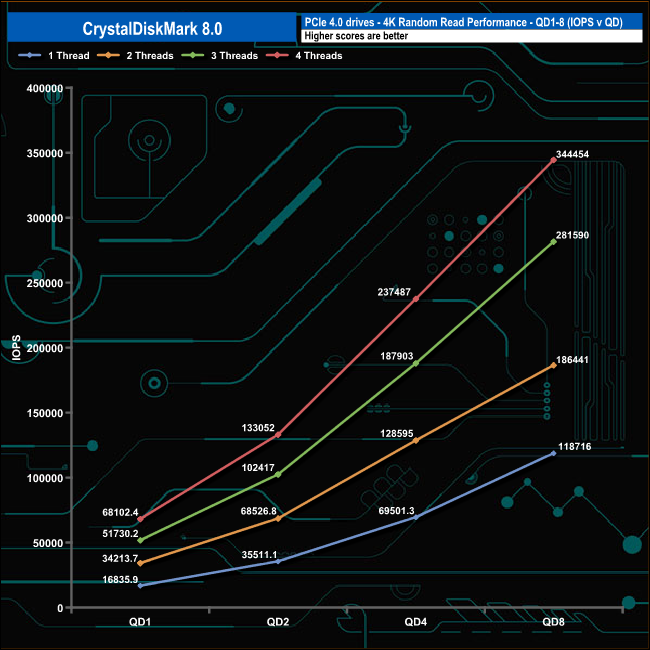
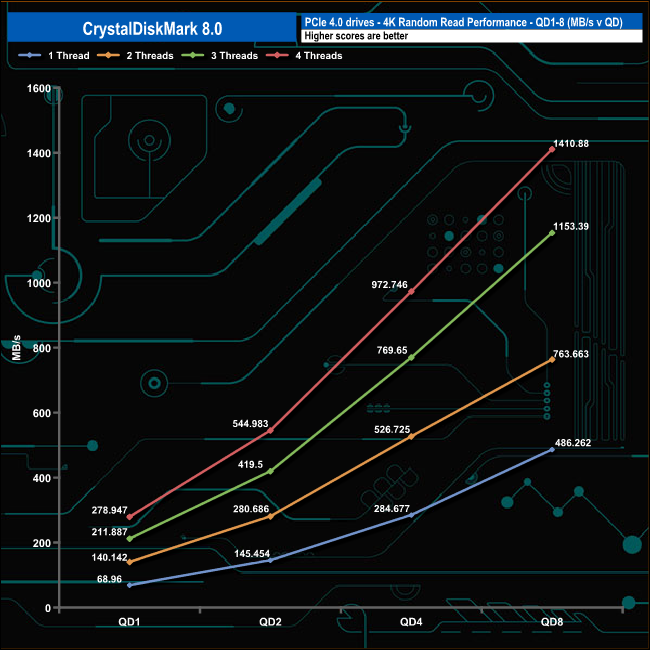
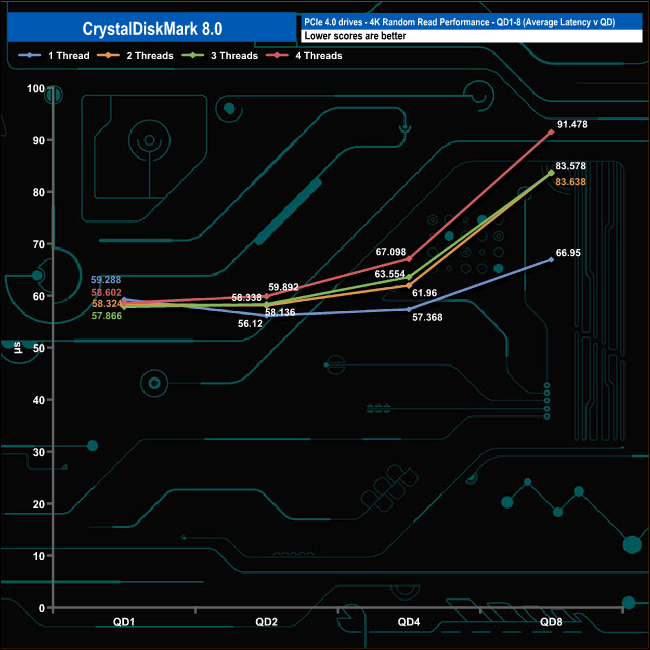
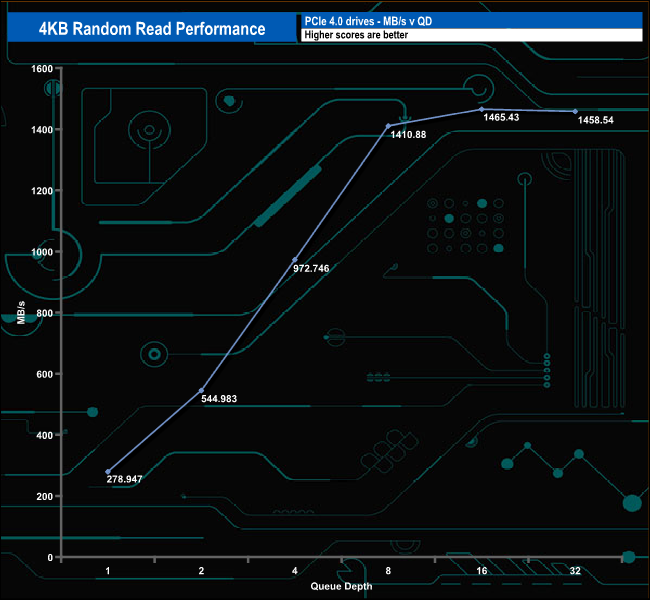
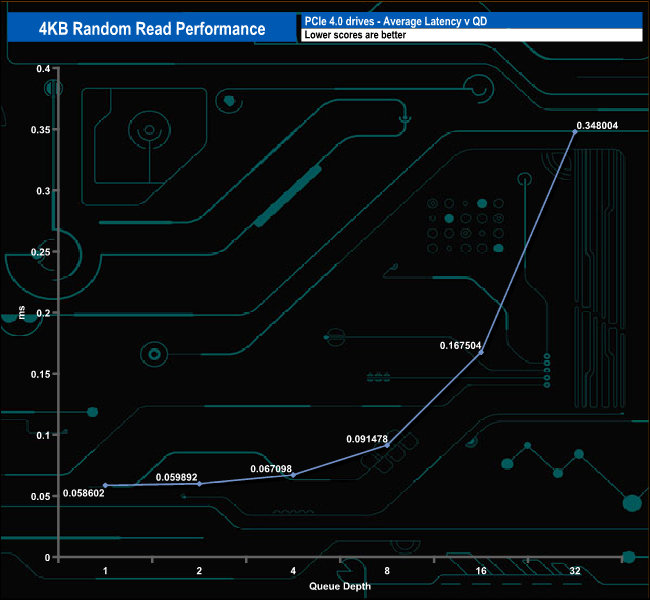
The 1TB Crucial P5 Plus read performance climbs smoothly throughout the tested queue depths and threads with a peak performance figure of 344,454 IOPS (1,410MB/s) at QD8 using 4 threads.
4K Random Write
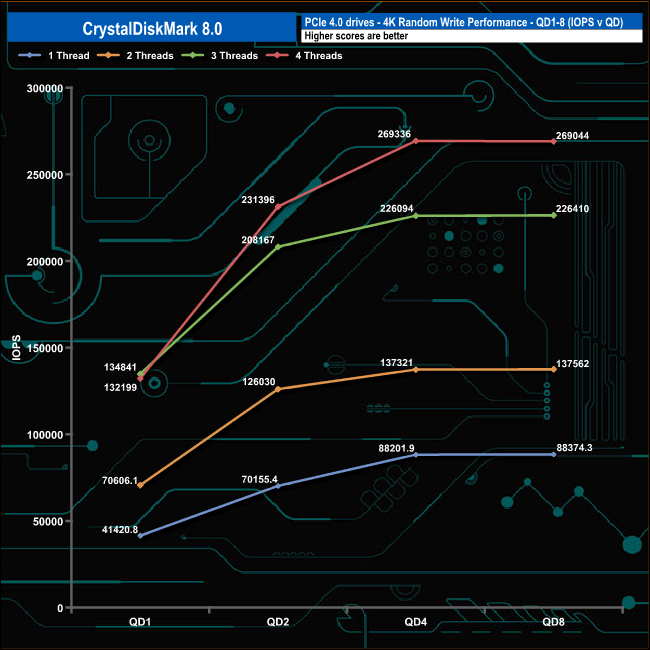
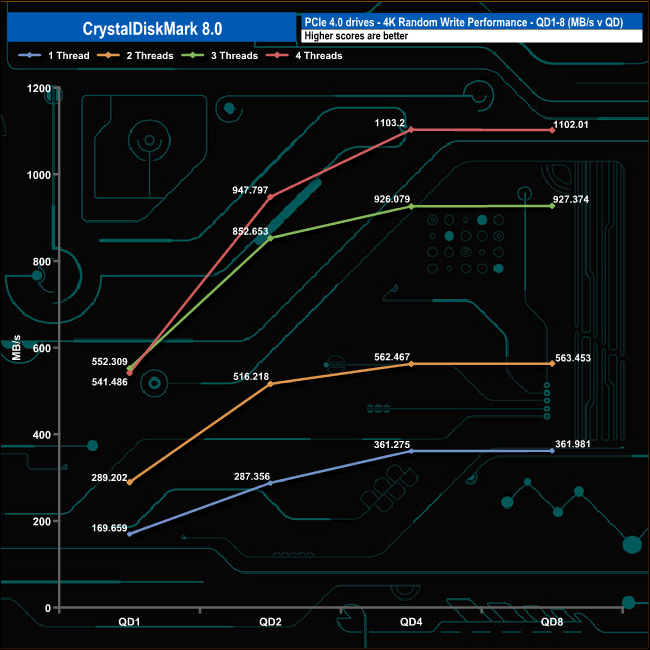

Using one and two threads, the drive peaks at QD8 (137,562 IOPS and 88,374 IOPS respectively). However, using three and four threads the drive peaks at QD4 before slipping back slightly at QD8.
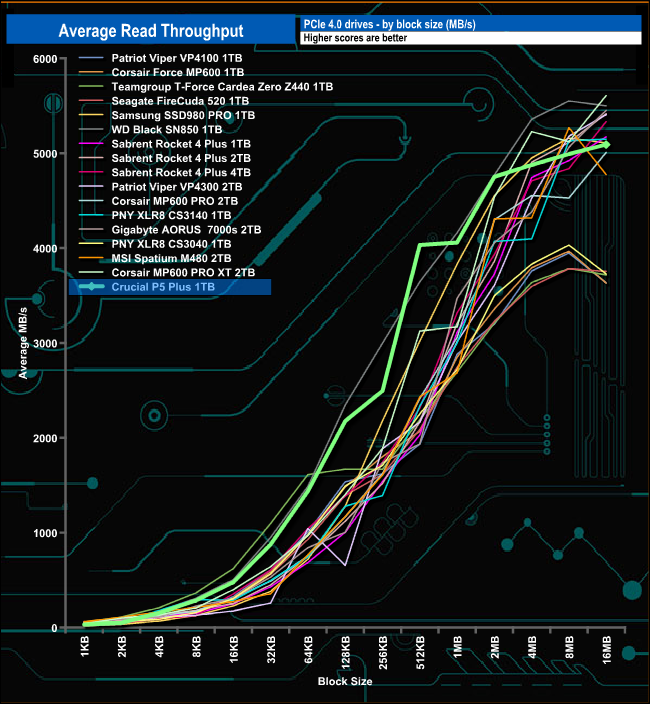
In the read throughput test, the Crucial P5 Plus peaks at the 16MB block mark at 5,091.43MB/s. That figure falls well short of the official maximum of 6,600MB/s.
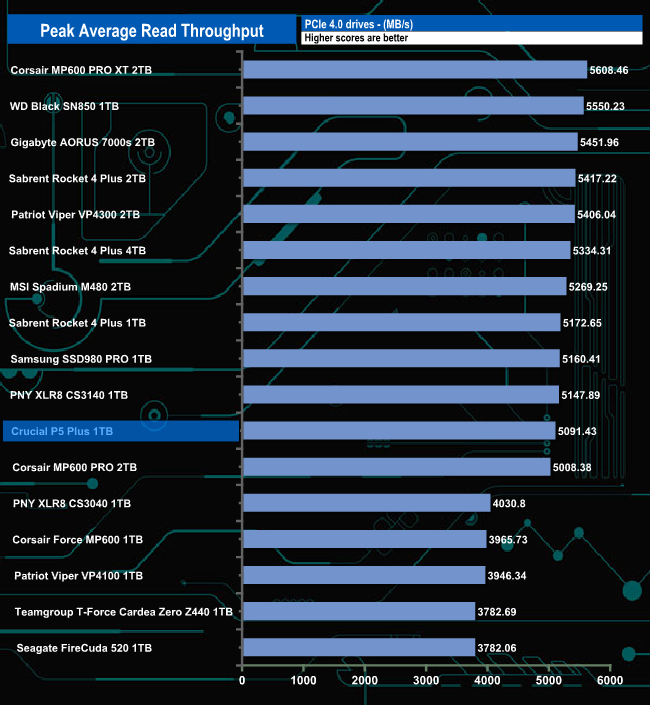
That read throughput figure of 5,091.43MB/s sees the drive sit towards the bottom of the results chart.
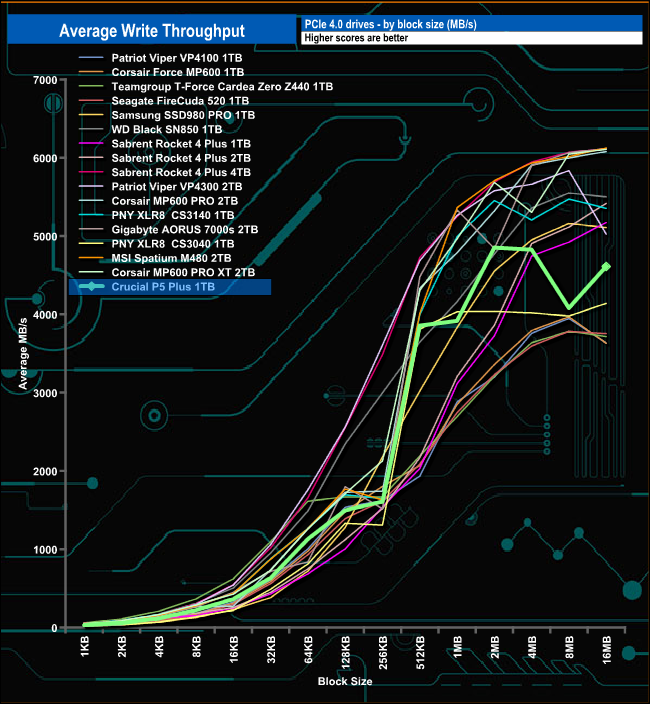
In our write throughput test, the drive peaked at the 2MB block mark at 4,853.28MB/s, a figure just shy of the official maximum of 5,000MB/s.
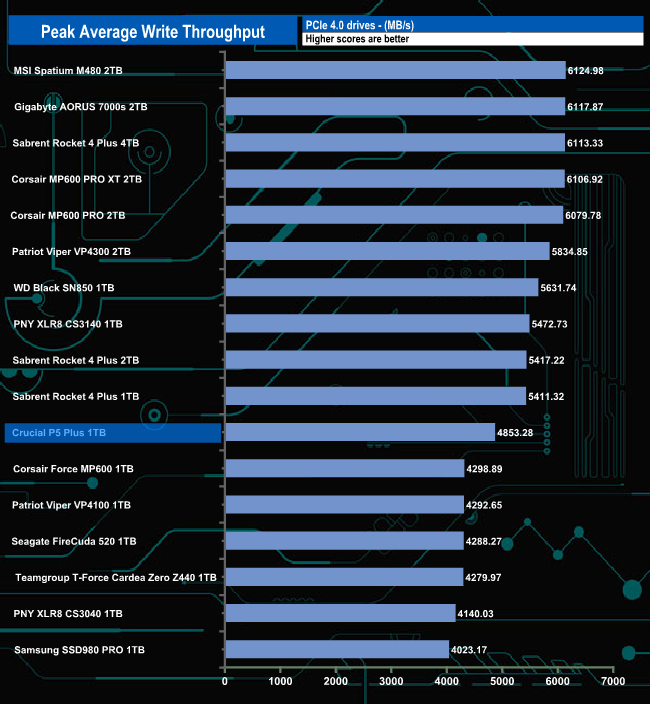
As with the read throughput test, the tested write result sees the drive towards the bottom half of the results chart.
The PCMark 10 Full System Drive Benchmark uses a wide-ranging set of real-world traces from popular applications and common tasks to fully test the performance of the fastest modern drives. The benchmark is designed to measure the performance of fast system drives using the SATA bus at the low end and devices connected via PCI Express at the high end.
The goal of the benchmark is to show meaningful real-world performance differences between fast storage technologies such as SATA, NVMe, and Intel’s Optane. The Full System Drive Benchmark uses 23 traces, running 3 passes with each trace. It typically takes an hour to run.
Traces used:
Booting Windows 10.
Adobe Acrobat – starting the application until usable.
Adobe Illustrator – starting the application until usable Adobe Premiere Pro – starting the application until usable.
Adobe Photoshop – starting the application until usable.
Battlefield V – starting the game until the main menu.
Call of Duty Black Ops 4 – starting the game until the main menu.
Overwatch – starting the game until main menu.
Using Adobe After Effects.
Using Microsoft Excel.
Using Adobe Illustrator.
Using Adobe InDesign.
Using Microsoft PowerPoint.
Using Adobe Photoshop (heavy use).
Using Adobe Photoshop (light use).
cp1 Copying 4 ISO image files, 20 GB in total, from a secondary drive to the target drive (write test).
cp2 Making a copy of the ISO files (read-write test).
cp3 Copying the ISO to a secondary drive (read test).
cps1Copying 339 JPEG files, 2.37 GB in total, to the target drive (write test).
cps2 Making a copy of the JPEG files (read-write test).
cps3 Copying the JPEG files to another drive (read test).
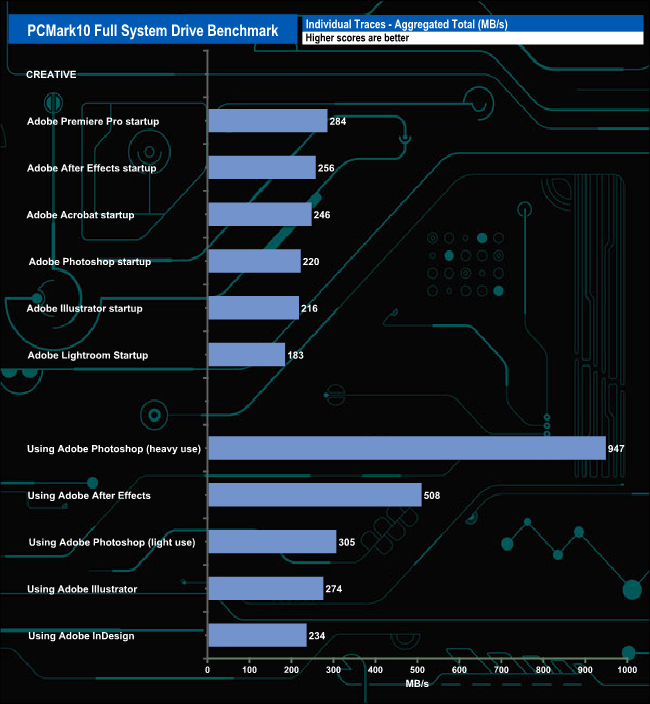
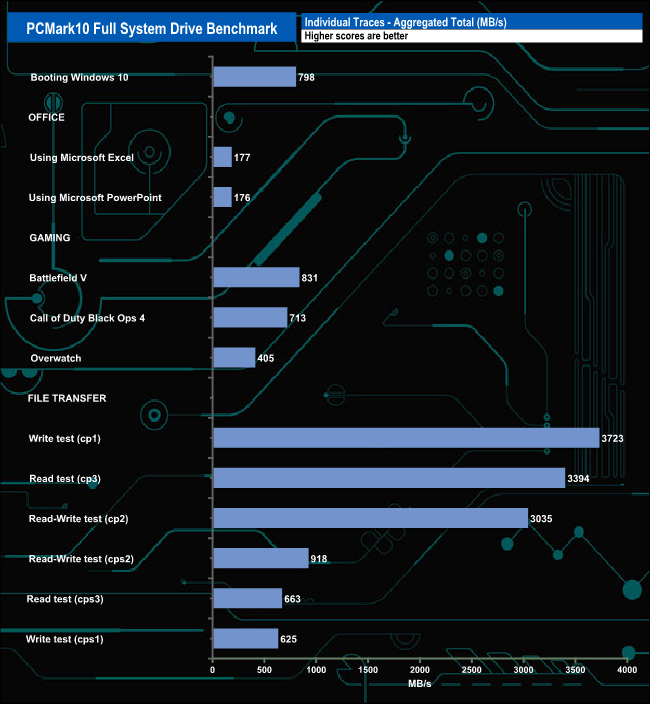
The Crucial P5 Plus dealt with the rigours of the PCMark10’s Full System Drive very well. The best result from the Creative set of test traces was the 947MB/s for the Heavy Use Adobe Photoshop trace. The file transfer tests also produced some good results with 3,723MB/s for the cp1 (write test), 3,394MB/s for the cp3 (read test) and 3,035MB/s for the cp2 (read/write test).
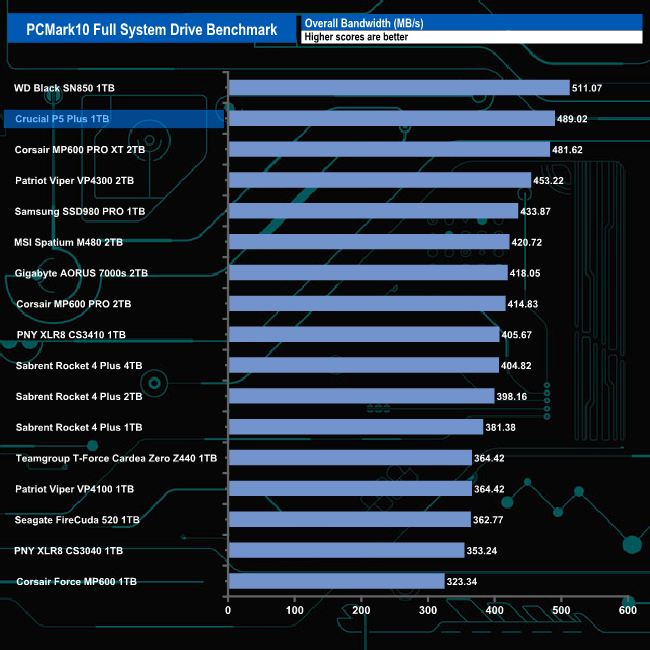
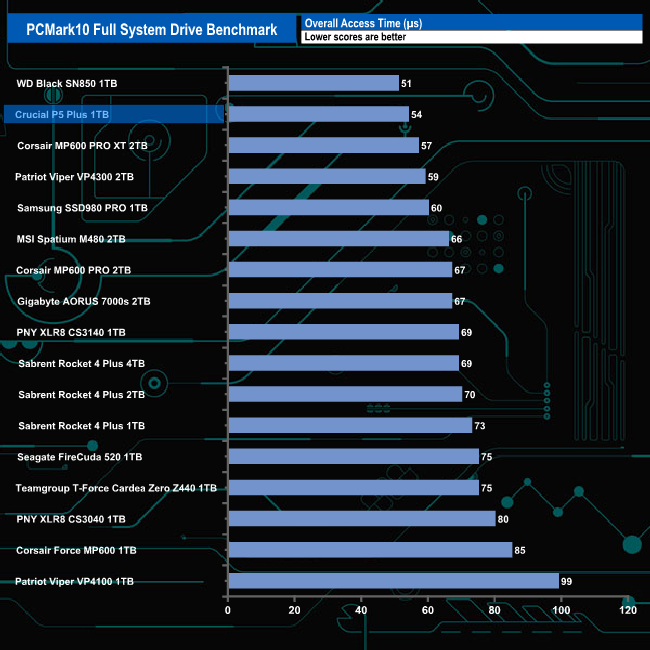
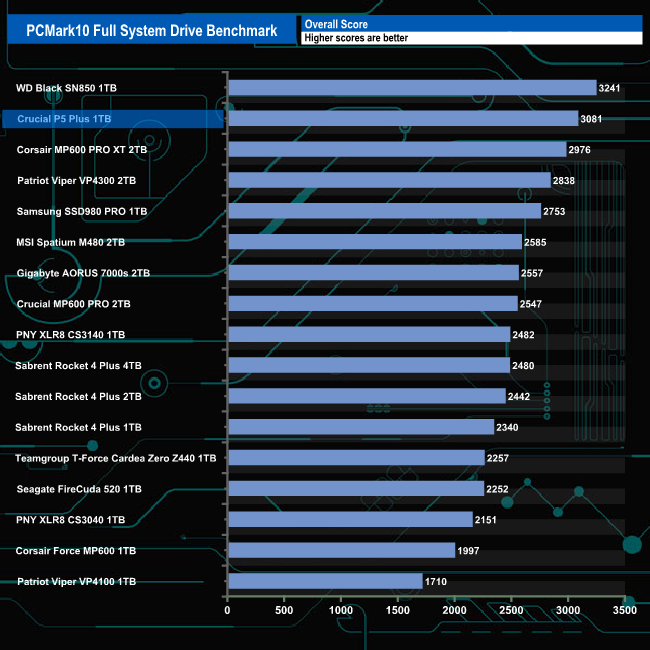
The overall bandwidth figure of 489.02MB/s that the Crucial P5 Plus scored is very good, good enough in fact, to see it go straight into second place on the results table behind the WD Black SN850.
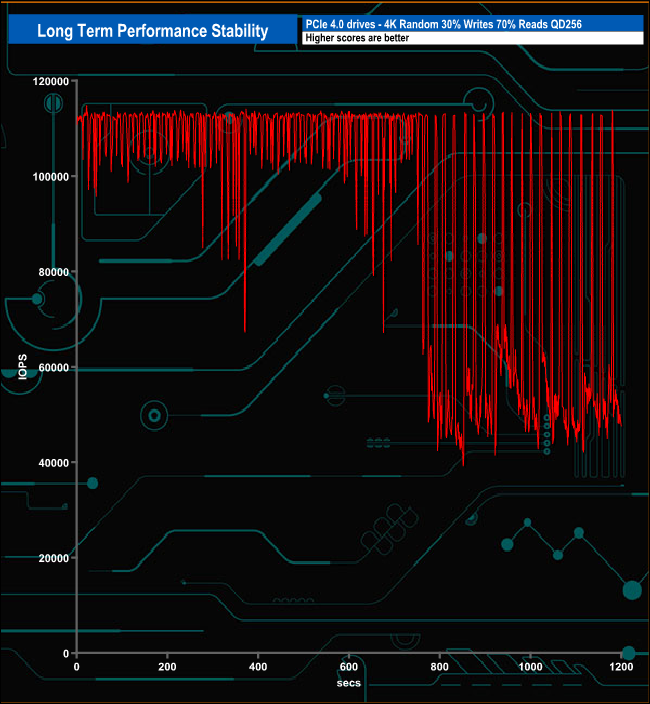
For the long term performance stability test, we set the drive up to run a 20-minute 4K random test with a 30% write, 70% read split, at a Queue Depth of 256 over the entire disk. The 1TB Crucial P5 Plus averaged 93,616 IOPS for the test with a good performance stability of 82%.
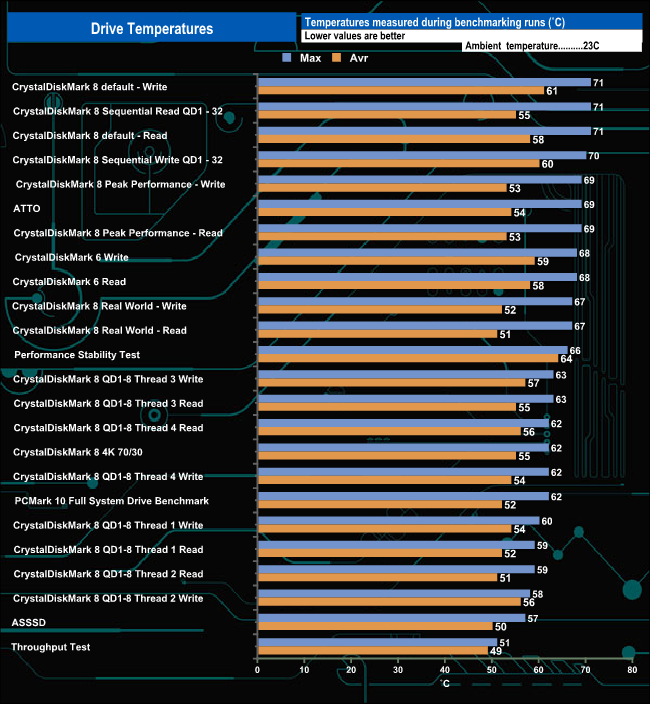
Crucial's P5 Plus doesn't come with a heatsink installed so when it's pushed hard without a third party cooler or any form of integrated motherboard cooler it pushes very close to the 80˚C limit where the adaptive thermal protection kicks in.
To test real life performance of a drive we use a mix of folder/file types and by using the FastCopy utility (which gives a time as well as MB/s result) we record the performance of drive reading from & writing to a 256GB Samsung SSD850 PRO.
We use the following folder/file types:
- 100GB data file.
- 60GB iso image.
- 60GB Steam folder – 29,521 files.
- 50GB File folder – 28,523 files.
- 12GB Movie folder – (15 files – 8 @ .MKV, 4 @ .MOV, 3 @ MP4).
- 10GB Photo folder – (304 files – 171 @ .RAW, 105 @ JPG, 21 @ .CR2, 5 @ .DNG).
- 10GB Audio folder – (1,483 files – 1479 @ MP3, 4 @ .FLAC files).
- 5GB (1.5bn pixel) photo.
- BluRay Movie – 42GB.
- 21GB 8K Movie demos – (11 demos)
- 16GB 4K Raw Movie Clips – (9 MP4V files).
- 4.25GB 3D Printer File Folder – (166 files – 105 @ .STL, 38 @ .FBX, 11 @ .blend, 5 @ .lwo, 4 @ .OBJ, 3@ .3ds).
- 1.5GB AutoCAD File Folder (80 files – 60 @ .DWG and 20 @.DXF).
![]()
![]()
Crucial's P5 Plus handled our real-life file testing without displaying any real problems. It averaged 516.57MB/s when writing the larger test files to the drive and 443.57MB/s when reading the data back again. It’s not as efficient when handling the folders that contain lots of small files averaging 322.3MB/s for writes and 369MB/s for reads.
To get a measure of how much faster PCIe NVMe drives are than standard SATA SSD's we use the same files but transfer to and from a 2TB Kioxia Exceria Plus drive:
![]()
![]()
Switching over to an all NVMe storage environment saw, as you would imagine, huge rises in transfer rates particularly when the drive was dealing with the larger file size transfers. Ten of the transfers topped well over 2.5GB/s when writing to the drive, the best being the 2,952MB/s when writing the 4K Movie Clips folder to the drive. Reads, although much improved, didn’t quite hit the heights of the write performance, the best being the 2,595MB/s when reading the contents of the 8K movie scene folder.
While PCIe 4.0 SSDs have been around for over two years at this point, Crucial has been biding its time and has now joined the party with the P5 Plus.
The drive uses Micron's latest NAND, the world's first 176-layer 3D TLC NAND. The B47R NAND uses Micron's 2nd generation Floating Gate technology and the company has stated that the new NAND offers 35% faster read and write times over 96-layer NAND, and a 25% improvement over 128-layer. The drive also uses a Micron controller, the DM02A1, details of which are very scarce.
The official maximum Sequential read/write performance figures for the 1TB Crucial P5 Plus are up to 6,600MB/s and 5,000MB/s respectively. Using the ATTO benchmark we couldn’t quite hit either of these figures, but we could confirm both with the CrystalDiskMark benchmark. The best-tested read figure we saw was 6,853.07MB/s using CrystalDiskMark 8 (NVMe settings, default profile). The best write figure was 5,021.18MB/s using the Peak Performance profile (0 fill).
Officially the 1TB Crucial P5 Plus is rated at up to 630,000 IOPS for random reads and up to 700,000 IOPS for random writes. Using our 4-threaded 4K tests we couldn’t get close to these official maximums, the best figures we saw was 357,772 IOPS and 271,545 IOPS for read / writes respectively. Using the Peak Performance profile of the CrystalDiskMark 8 benchmark the fastest speeds we saw were 622,561.22 IOPS for reads and 497,361.08 IOPS, still short of those official maximums.
Crucial has kept the cost of the P5 Plus down by not giving the drive any form of physical heatsink. But as with all Gen 4 drives, it runs hot when pushed hard and although it does have adaptive thermal protection, to prevent any thermal throttling it does need either a third party cooler or use it with dedicated motherboard cooling technology.
We found the 1TB Crucial P5 Plus on Amazon UK for £157.19 (inc VAT) HERE.
Discuss on our Facebook page HERE.
Pros
- 176-layer NAND technology.
- Management software.
- 5-year warranty.
Cons
- Performance at deeper queue depths.
- Couldn’t match the official random write figures under testing.
- Needs a PCIe 4.0 supporting motherboard for best performance.
KitGuru says: It's taken quite a while but Crucial now has a Gen 4 SSD in their stable of drives. Not only that but it uses Micron's latest 176-layer NAND. It may not be the fastest Gen 4 drive around but Crucial have given it a fighting chance with a pretty competitive price tag.