

The FX900 Pro is HP's latest SSD aimed at the enthusiast end of the market. It combines an InnoGrit controller with Micron 176-layer NAND together with a PCIe Gen4 interface. We review the 2TB model, retailing for about $250 – can it do enough to prove competitive in a highly saturated market? That's what we will find out today.

At the heart of the HP FX900 Pro is an InnoGrit IG5236 8-channel controller paired with 176-layer NAND. Four capacities currently make up the FX900 Pro range; 512GB, 1TB, 2TB (our review sample) and a flagship 4TB model.
The official Sequential read/write for the drives are; up to 7,400MB/s reads for the 1TB, 2TB and 4TB models and up to 7,000MB/s for the 512GB drive. Sequential writes are listed as up to 3,800MB/s for the 512GB, 6,400MB/s for the 1TB model, 6,700MB/s for the 2TB drive and up to 6,300MB/s for the 4TB unit.
Random read/write performance for the drives is listed as up to 540K IOPS & 938K IOPS for the 512GB drive, 1,014K IOPS & 1,079K IOPS for the 1TB drive, the 2TB drive is rated at up to 1,344K IOPS for reads and up to 1,122K IOPS writes. The 4TB drive gets figures of up to 1,350K and 1,150K for reads and writes respectively.
The endurance for the 2TB drive is listed as 1,200 TBW and it's backed by a five-year warranty.
Physical Specifications:
- Usable Capacities: 2TB.
- NAND Components: Micron 176 Layer B47R Fortis Grade.
- NAND Controller: InnoGrit IG5236 8-channel.
- Cache: DDR4-2666.
- Interface: PCIe Gen 4.0 x 4, NVMe 1.4.
- Form Factor: M.2 2280.
- Dimensions: 80 x 22 x 3.2mm.
- Drive Weight: 10g.
Firmware Version: 3.A.F.A.
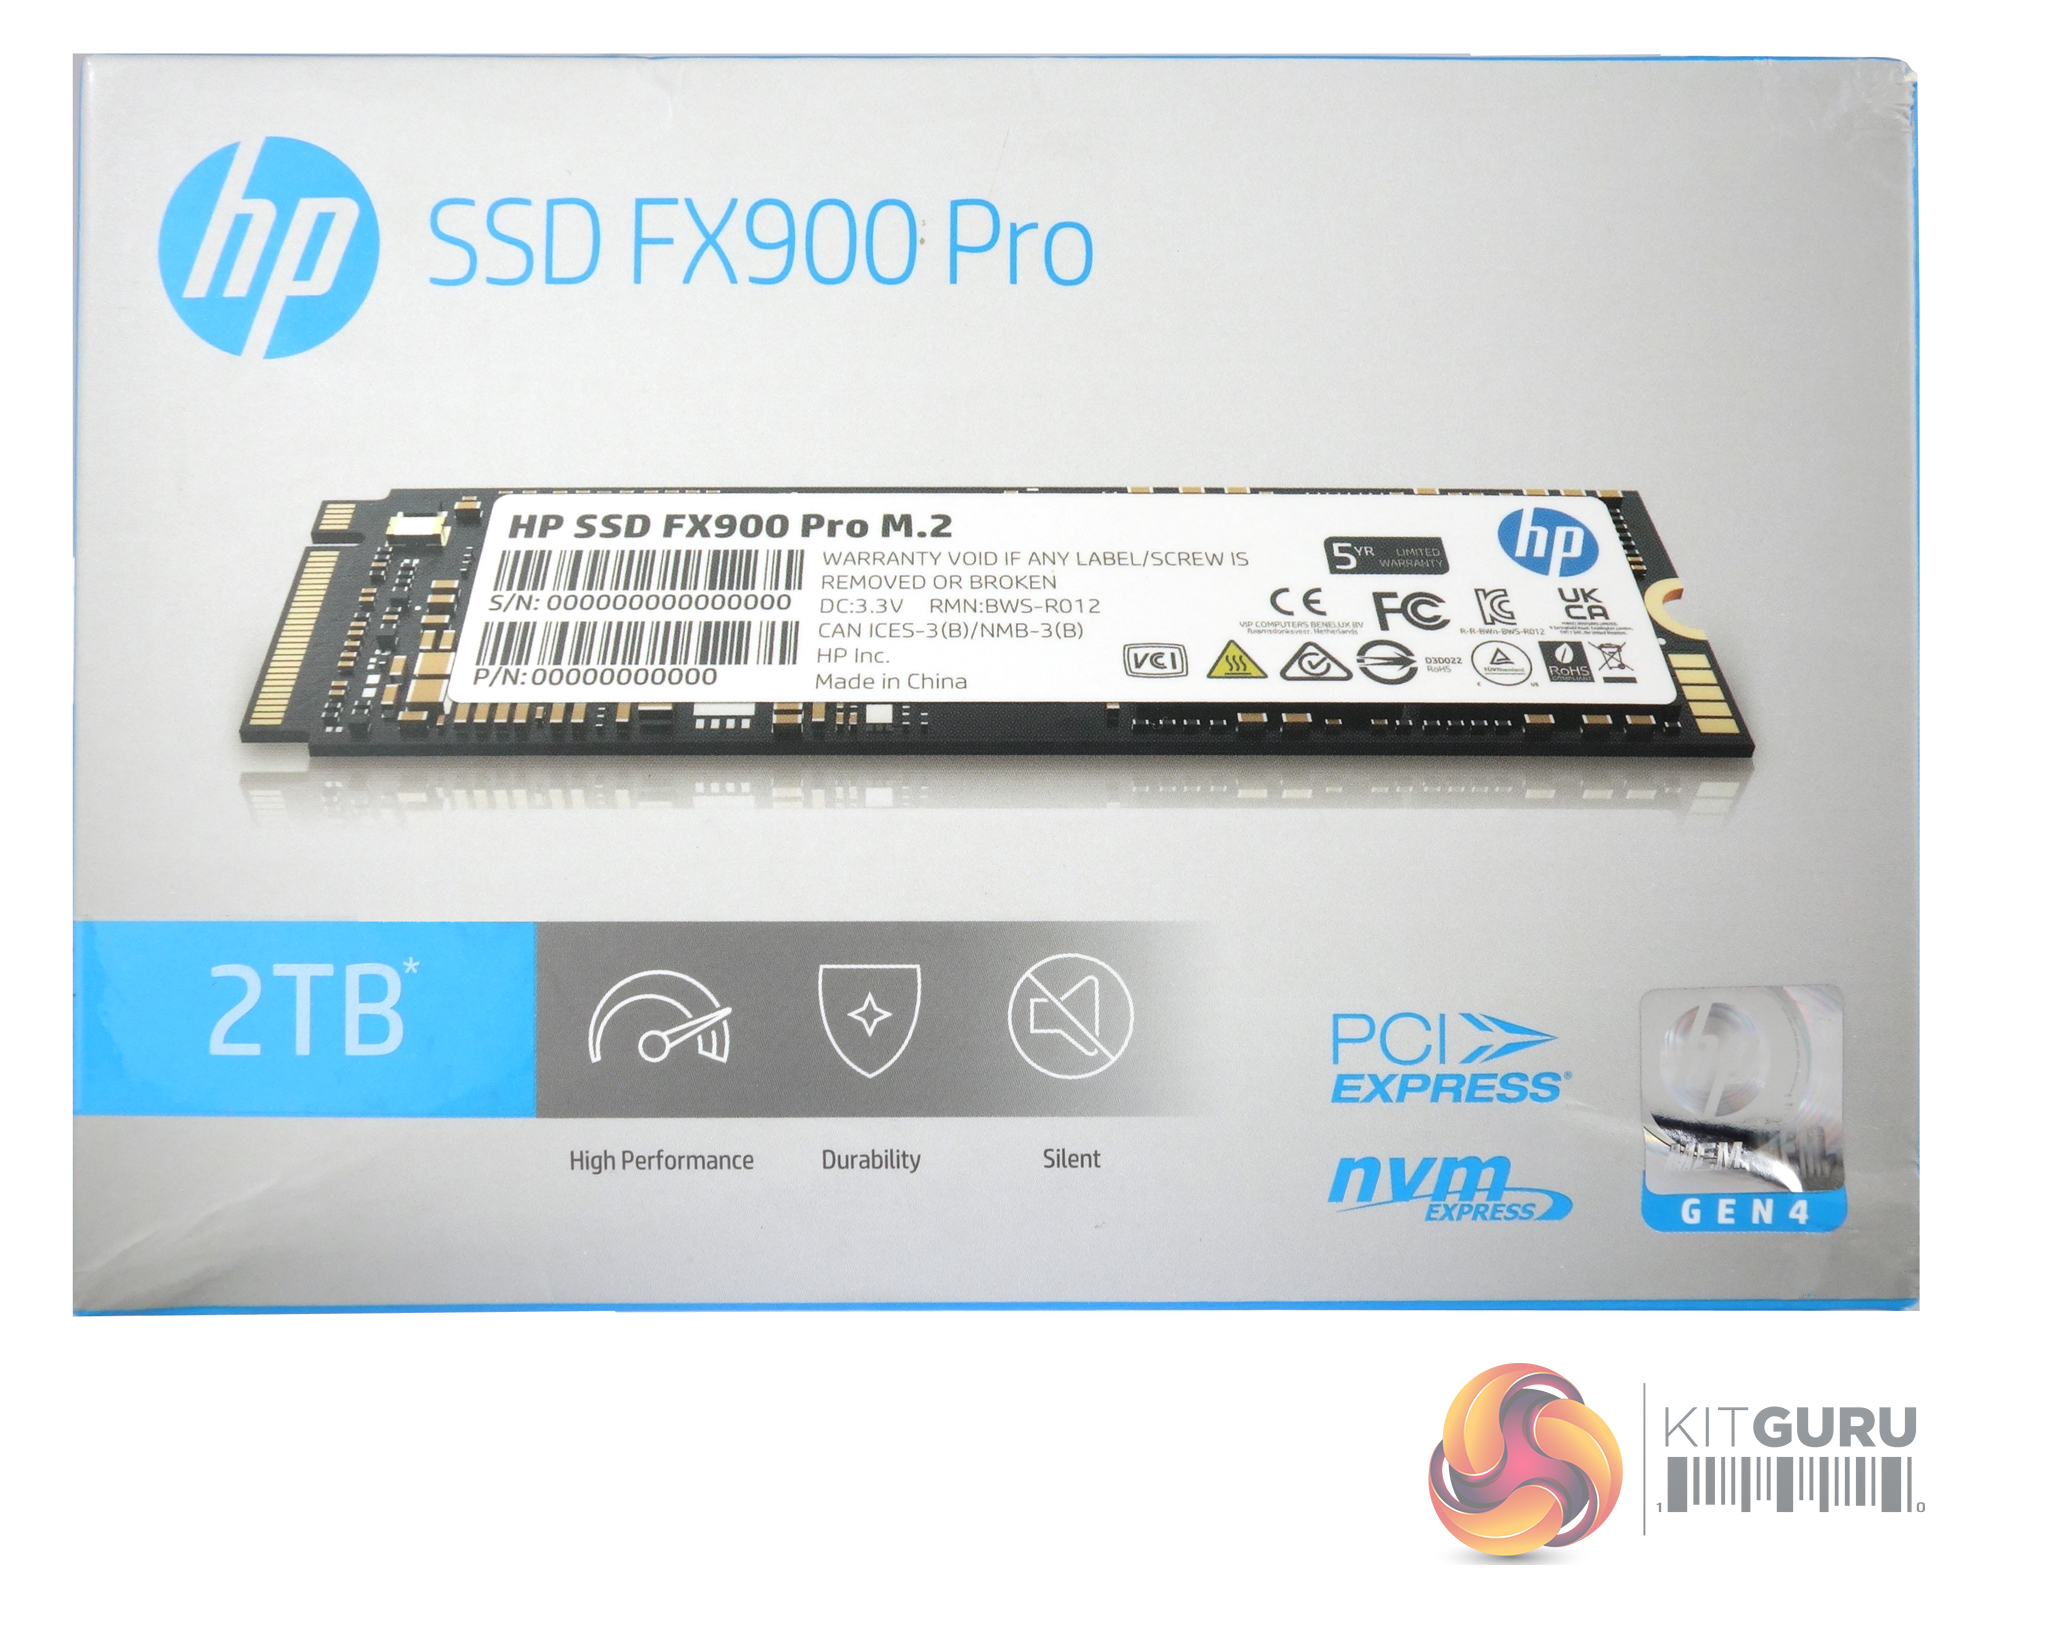
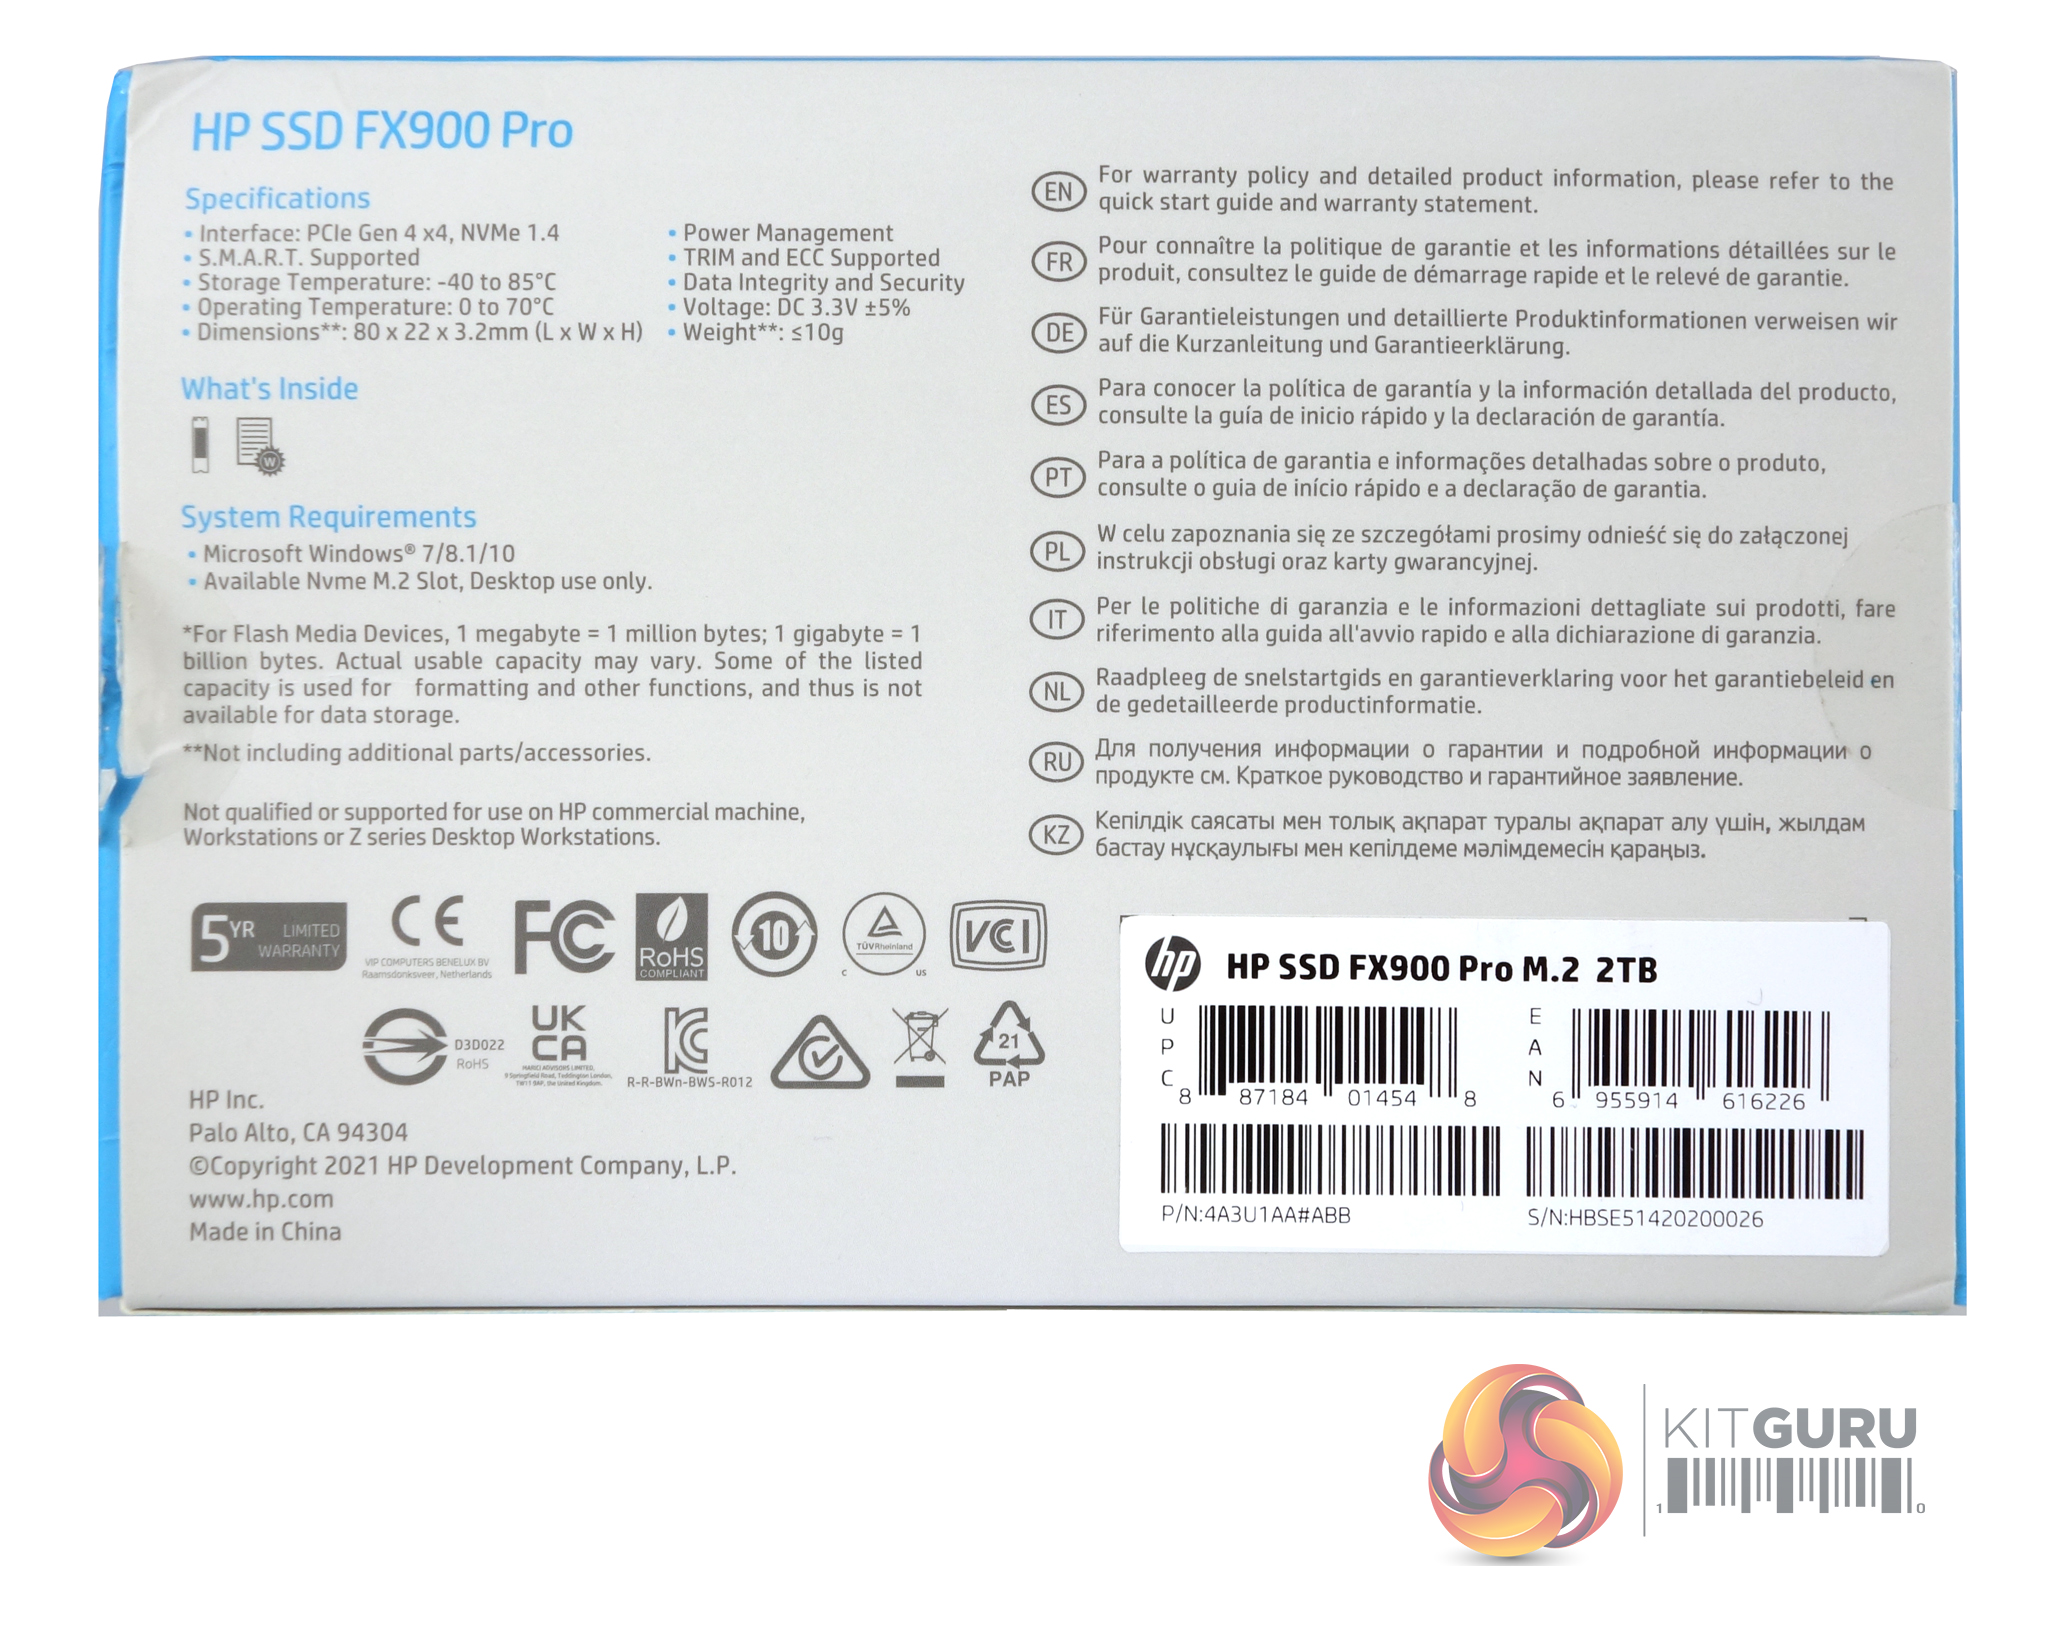
The front of the box carries an image of the back of the drive, (the side with the product label). Under the image is a band that displays the capacity of the drive along with icons for High Performance, Durability and Silence. The rear of the box has a very small list of the drive's features along with the system requirements on one side while the other has a multilingual list for extra warranty information. The one thing that is missing though is any hint of the drive's performance
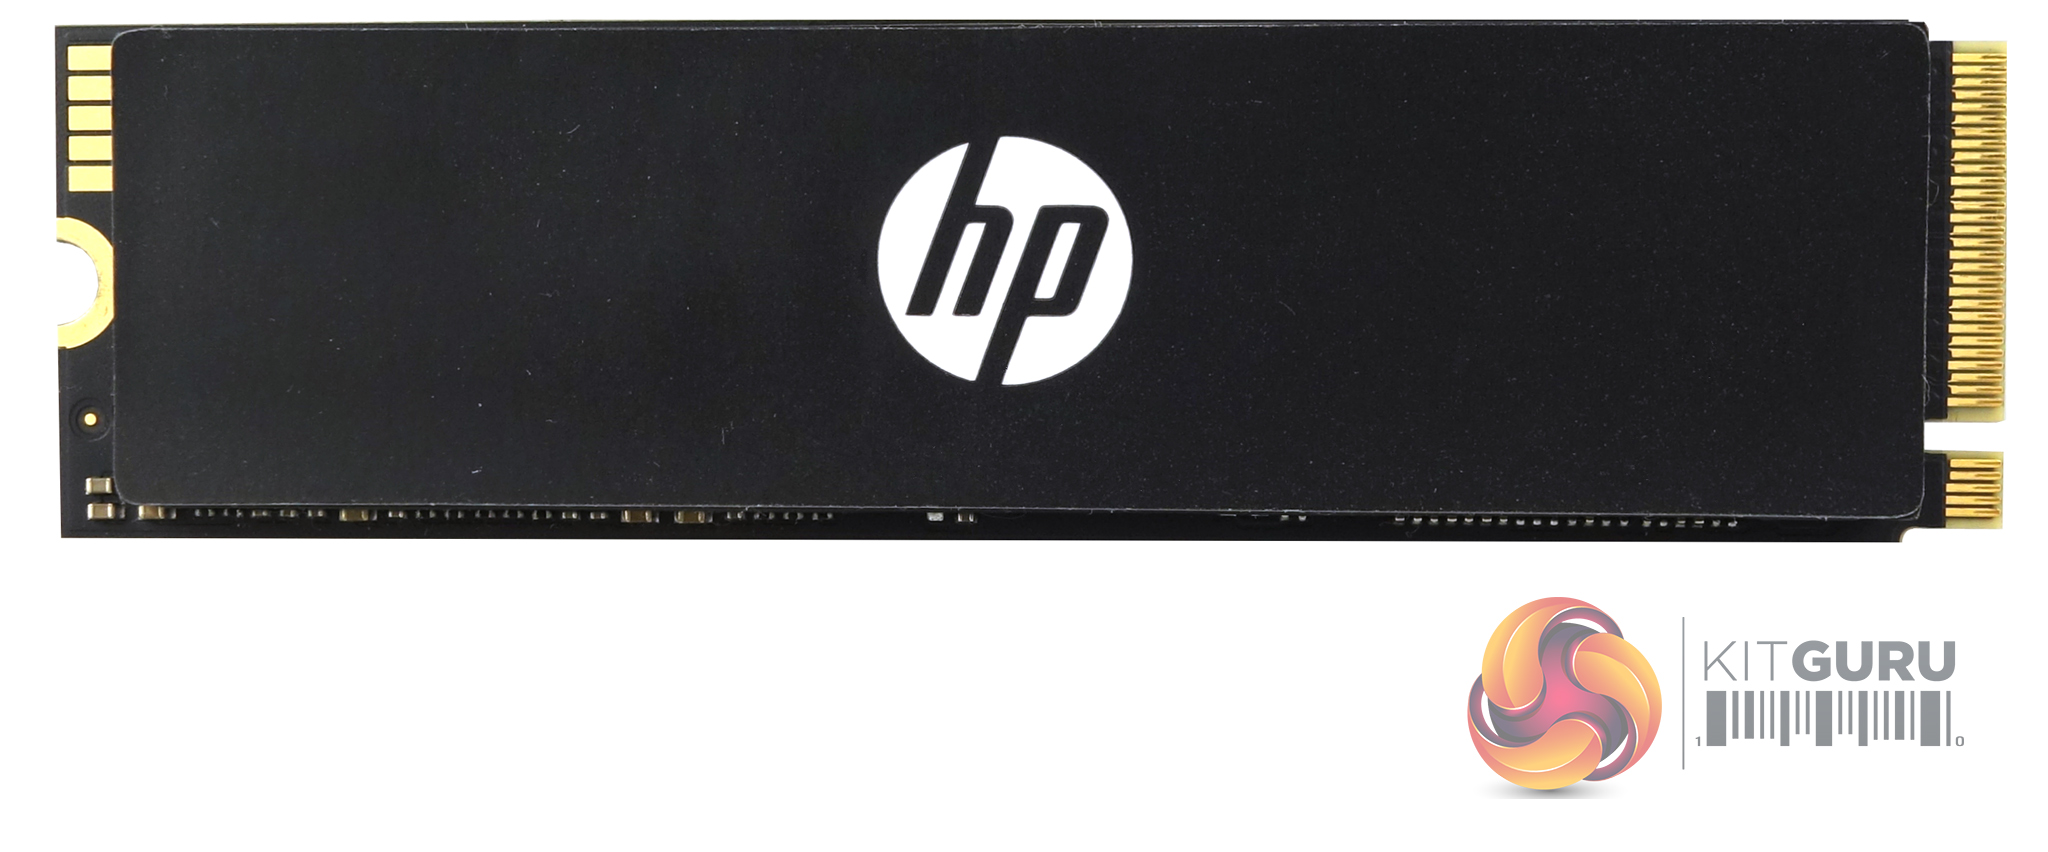
The drive is built for HP by BIWIN Storage, the Chinese OEM manufacturer of high-performance memory and storage solutions. The 2TB FX900 Pro is built on a standard M.2 2280 dual-sided layout format and uses an InnoGrit IG5236 controller together with 176-layer Micron B47R Fortis Grade NAND. One side of the PCB holds the IG5236, two 512GB NAND packages and a DDR4 2666 cache IC while the other side is home to two more NAND packages and a second cache chip.
InnoGrit's IG5236 (code name Rainier) is built on a 12nm process and is aimed at high-end client solutions. The 8-channel, NVMe 1.4 controller supports SLC, MLC, TLC and QLC NAND flash with either ONFI 4.1 or Toggle 2.0/3.0/4.0 with the NAND interface running at up to 1200MT/s.
Unlike some of the large chunky heatsinks we've seen on competitors' Gen 4 drives, the FX900 drive uses a thin Thermal Pad under the top label which uses graphene foam. BIWIN say that the working temperature of the drive is effectively reduced by about 18 degrees.
For testing, the drives are all wiped and reset to factory settings by HDDerase V4. We try to use free or easily available programs and some real-world testing so you can compare our findings against your own system.
This is a good way to measure potential upgrade benefits.
Main system:
AMD Ryzen 5 3600X, 16GB DDR4-2400, Sapphire R9 390 Nitro and an MSI MPG X570 Gaming Edge Wifi motherboard
Other drives
Corsair MP600 PRO 2TB
Corsair Force MP600 1TB
Corsair MP600 PRO XT 2TB
Crucial P5 Plus 1TB
Gigabyte AORUS 7000e 2TB
Kingston KC3000 2TB
MSI Spatium M480 2TB
Patriot Viper VP4300 2TB
Patriot Viper VPN4100 1TB
PNY XLR8 CS3040 1TB
PNY XLR8 CS3140 1TB
Sabrent Rocket 4 Plus 1TB
Sabrent Rocket 4 Plus 2TB
Sabrent Rocket 4 Plus 4TB
Samsung SSD980 PRO 1TB
Seagate FireCuda 520 1TB
Seagate FireCuda 530 2TB
Teamgroup T-Force Cardea Zero Z440 1TB
Teamgroup T-Force Cardea A440 Pro Special Series 1TB
WD Black SN770 1TB
WD Black SN850 1TB
Software:
Atto Disk Benchmark 4.
CrystalMark 8.0.0.
AS SSD 2.0.
IOMeter.
Futuremark PC Mark 10.
All our results were achieved by running each test five times with every configuration this ensures that any glitches are removed from the results. Trim is confirmed as running by typing fsutil behavior query disabledeletenotify into the command line. A response of disabledeletenotify =0 confirms TRIM is active.
CrystalDiskMark is a useful benchmark to measure theoretical performance levels of hard drives and SSD’s. We are using v8.0.
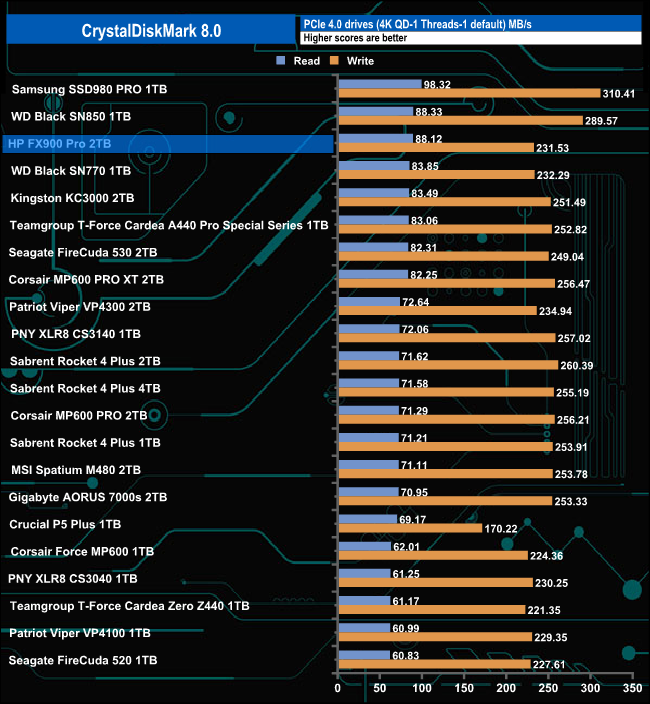
Using the default CrystalBenchMark 8 4K QD1 T-1 benchmark the FX900 Pro's result figure of 88.12MB/s for reads is good enough to sit the drive in the third spot in our results chart. The write result of 231.53MB/s isn't as strong in comparison with many of its competitors.
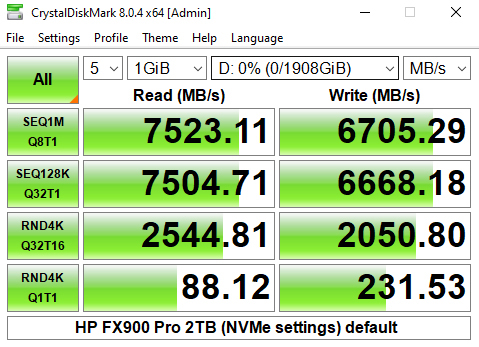
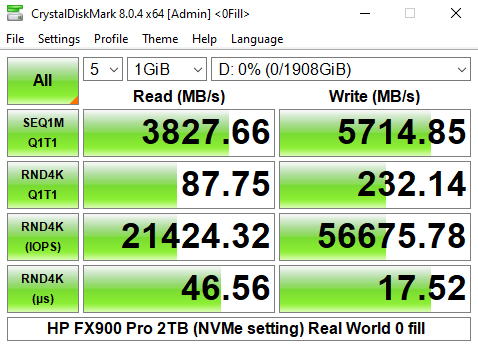
Looking at the benchmark result screens we could confirm the official read/write maximums of 7,400MB/s and 6,700MB/s with test results of 7,523MB/s and 6,705MB/s for reads and writes respectively. That tested read score of 7,523MB/s makes the FX900 Pro the fastest consumer Gen4 drive we've seen to date, although the write performance isn't as strong.
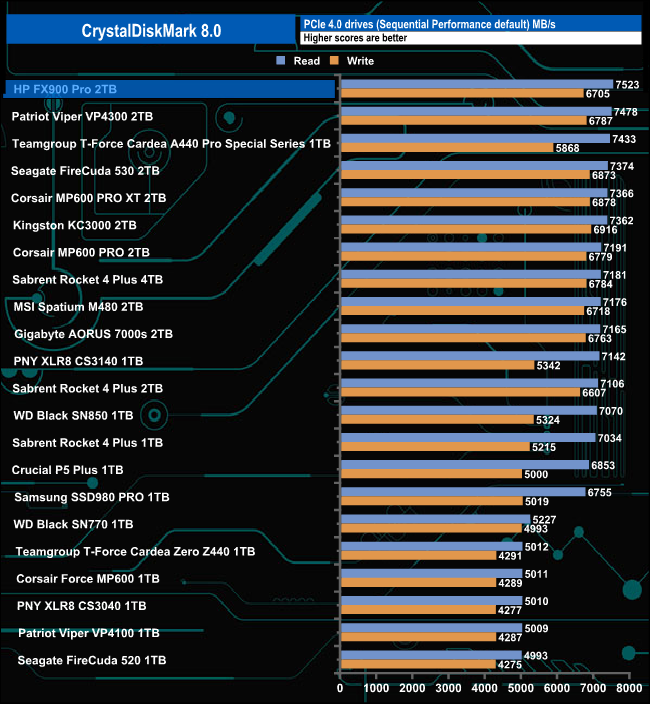
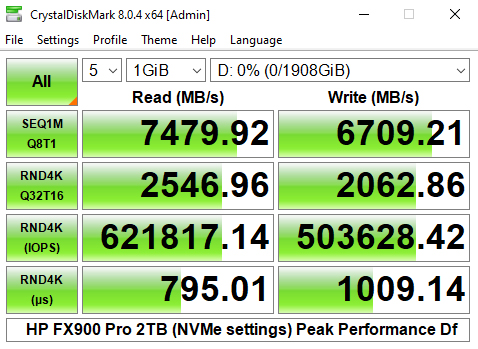
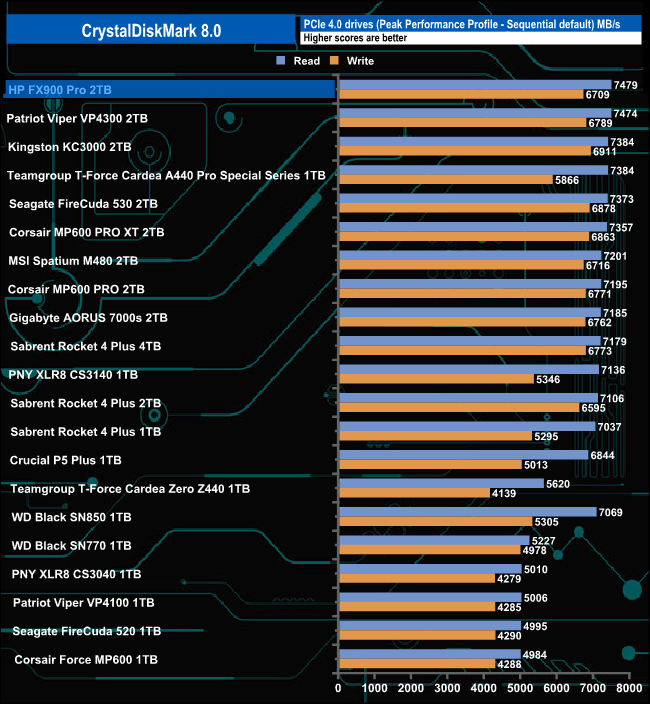
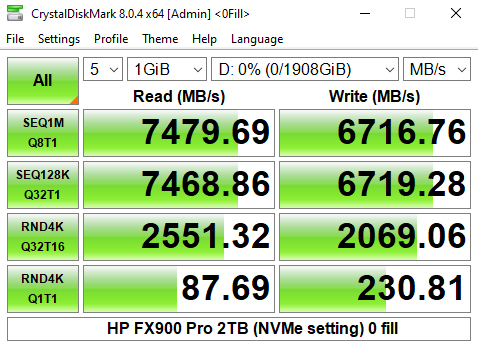
Switching over to the CrystalDiskMark 8 Peak Performance profile we could once again confirm the official Sequential read/write figures with test results of 7,479MB/s for reads and 6,709MB/s for writes.
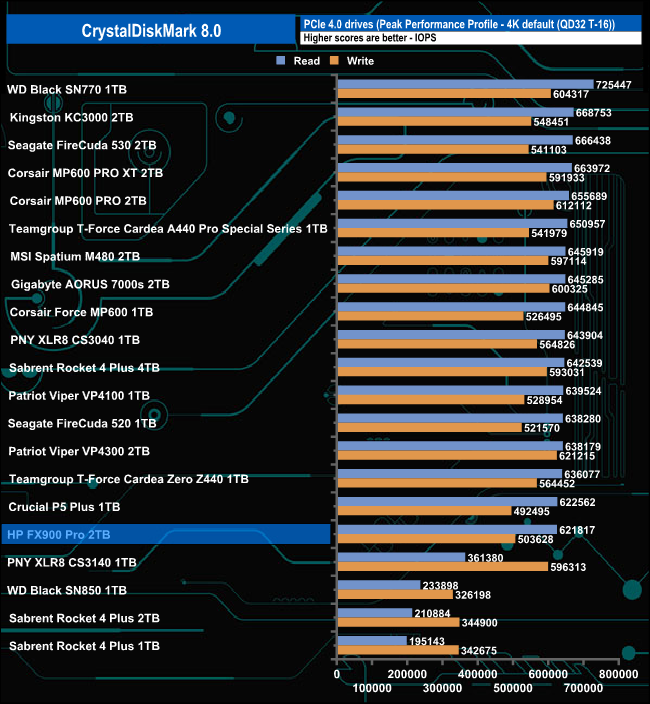
The 4K test results are nowhere near as impressive with both reads and writes falling well short of the official figures. The 2TB FX900 Pro is rated up to 1344 K IOPS for reads and 1122 K IOPS for writes. The best read result we saw in CrystalDiskMark was 621,817 IOPS for reads and 503,628 IOPS for writes.

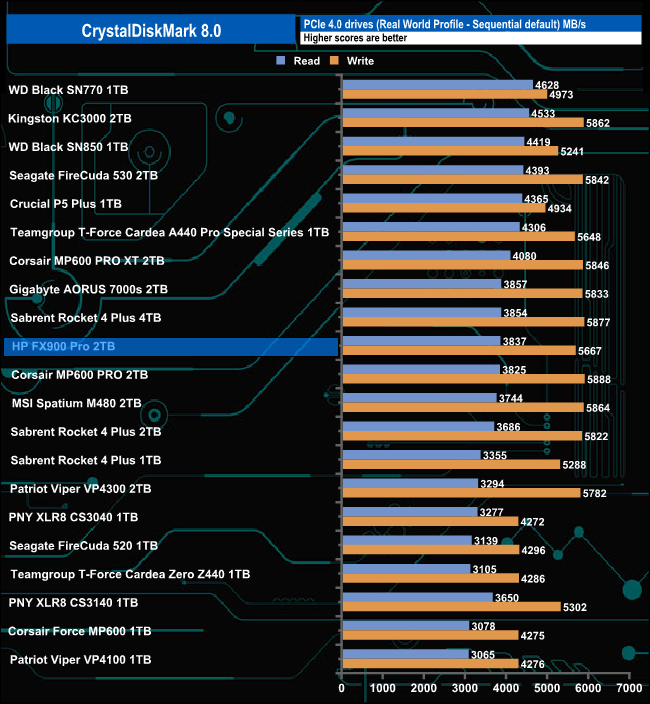
Using the Real World profile sees the drive sitting in mid-table with a Sequential read result of 3,837MB/s while write performance is much better at 5,667MB/s.
The ATTO Disk Benchmark performance measurement tool is compatible with Microsoft Windows. Measure your storage system's performance with various transfer sizes and test lengths for reads and writes. Several options are available to customize your performance measurement including queue depth, overlapped I/O and even a comparison mode with the option to run continuously. Use ATTO Disk Benchmark to test any manufacturer's RAID controllers, storage controllers, host adapters, hard drives and SSD drives and notice that ATTO products will consistently provide the highest level of performance to your storage.
We are using version 4.0 for our NVMe disk tests.
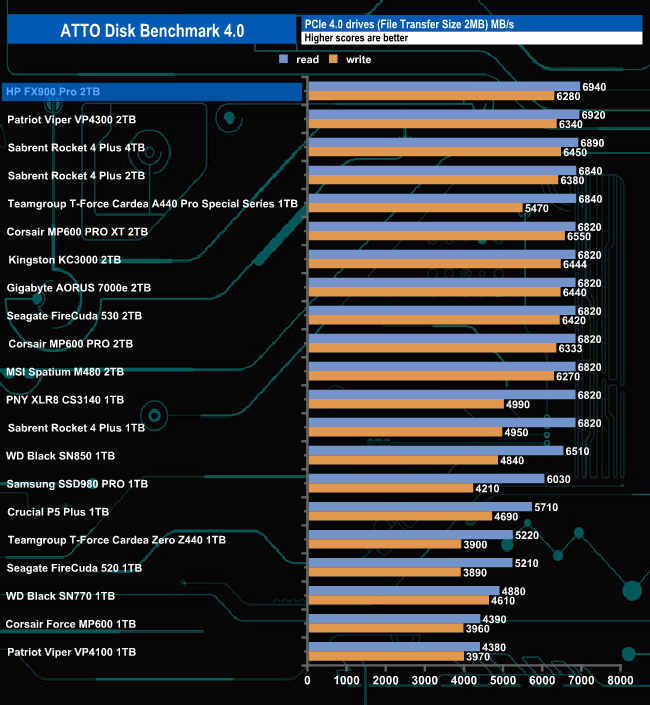
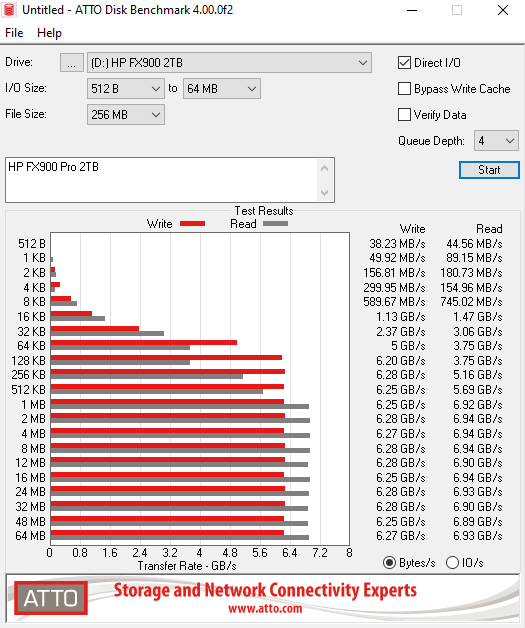
Although the read and write result figures from the ATTO benchmark, 6,940MB/s and 6,280MB/s respectively are short of the official maximums of 7,400MB/s and 6,700MB/s, the read result is good enough to stick the drive on top of our result chart.
AS SSD is a great free tool designed just for benching Solid State Drives. It performs an array of sequential read and write tests, as well as random read and write tests with sequential access times over a portion of the drive. AS SSD includes a sub suite of benchmarks with various file pattern algorithms but this is difficult in trying to judge accurate performance figures.
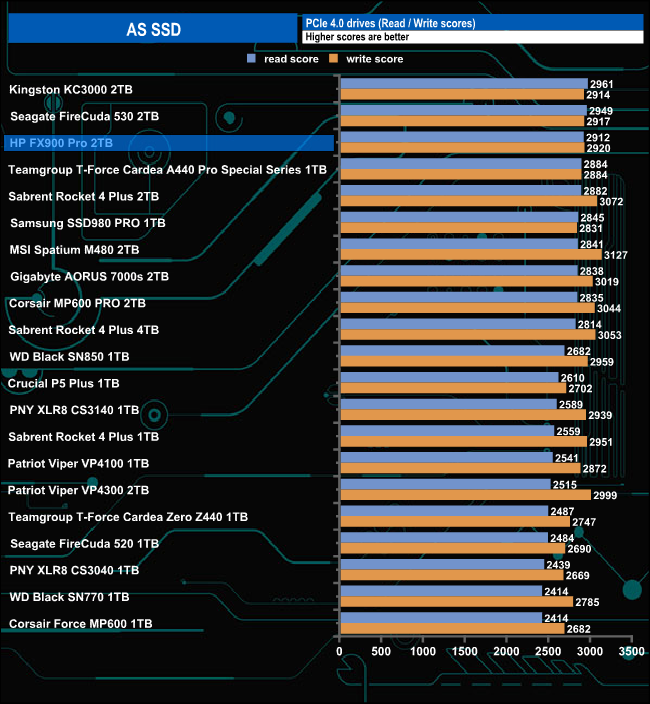
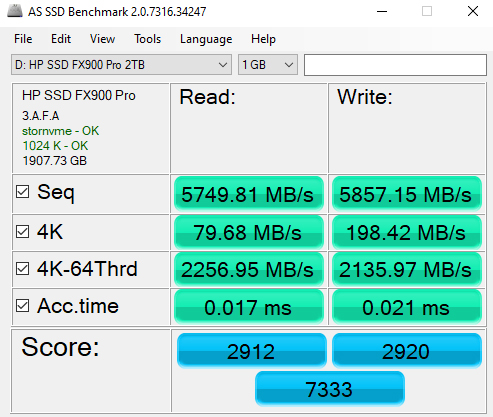
Using the more demanding AS-SSD benchmark sees the drive producing a read score of 2912, good enough to place the drive in third spot in our result chart. The write score of 2920 is decent but not as good as some of the drives in this chart.
We used CrystalDiskMark 8‘s custom settings to test the Sequential read and write performance of the drive through a range of queue depths. The setup for the tests is listed below.
128KB Sequential Read / Write.
Transfer Request Size: 128KB, Thread(s): 1, Outstanding I/O: 1-32.
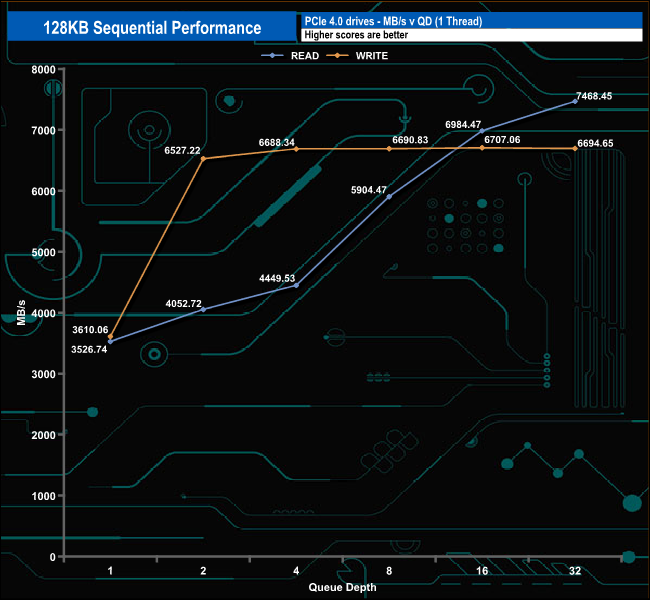
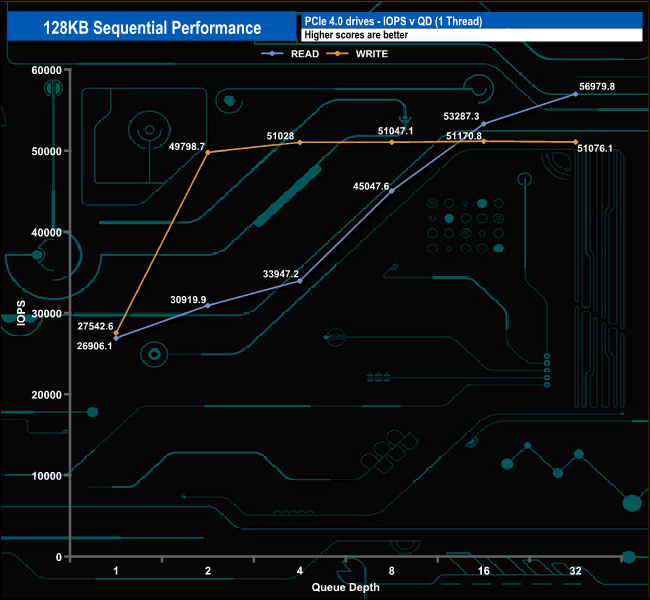
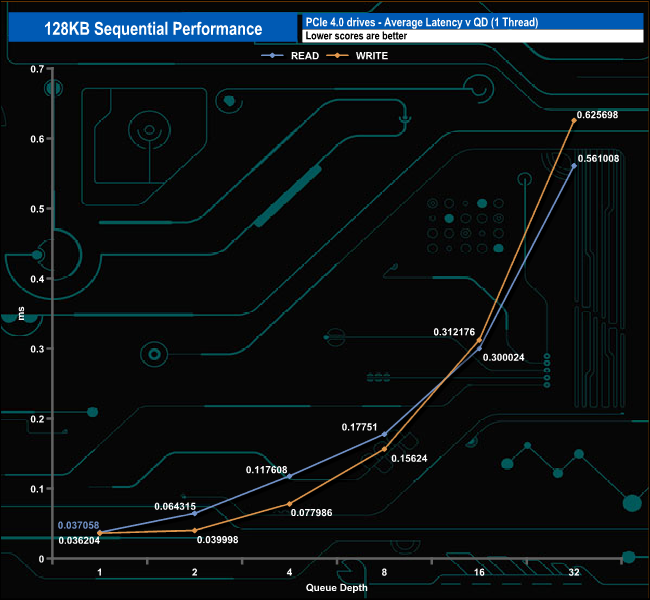
In the 128KB Sequential read and write tests, the drives read performance climbs smoothly as the queue depth deepens, reaching 7,468.45MB/s at the end of the test run at QD32, a figure that just about confirms the official maximum speed of 7,400MB/s.
When it comes to write performance the drive rises rapidly in performance from QD1- QD2 then begins to plateau out with a peak of 6,707MB/s at QD16 before dropping back to end the test run at 6,694.65 MB/s.
Sequential Read Performance v QD compared.
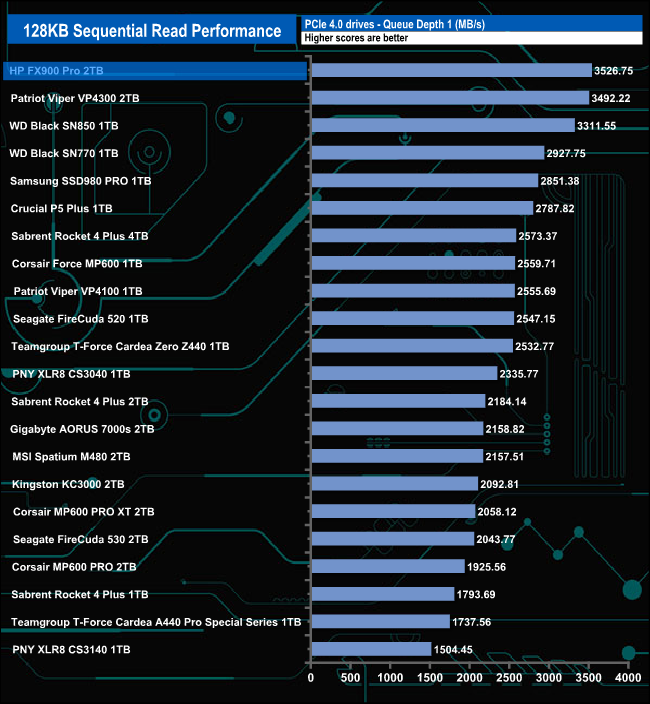
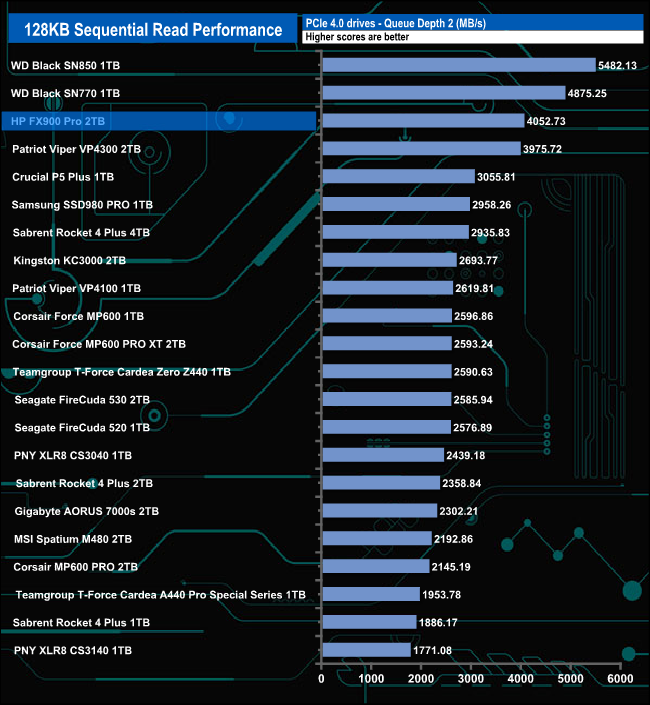
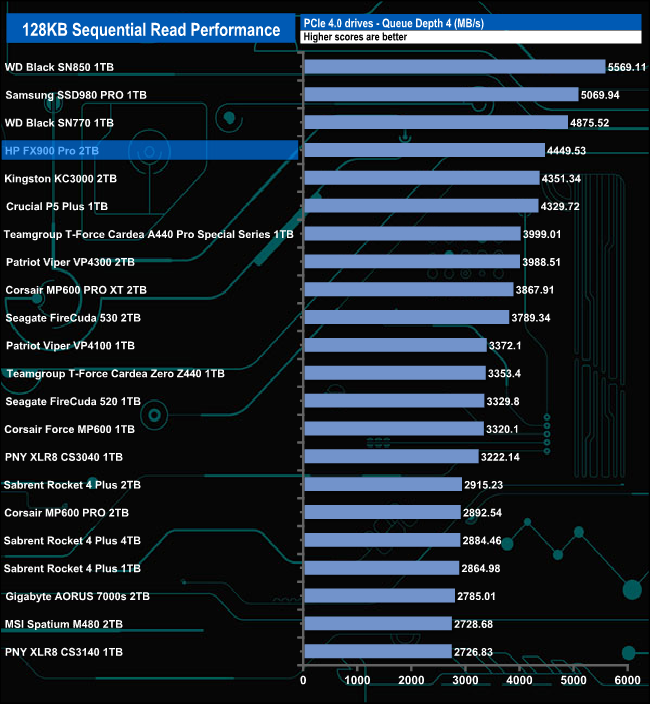
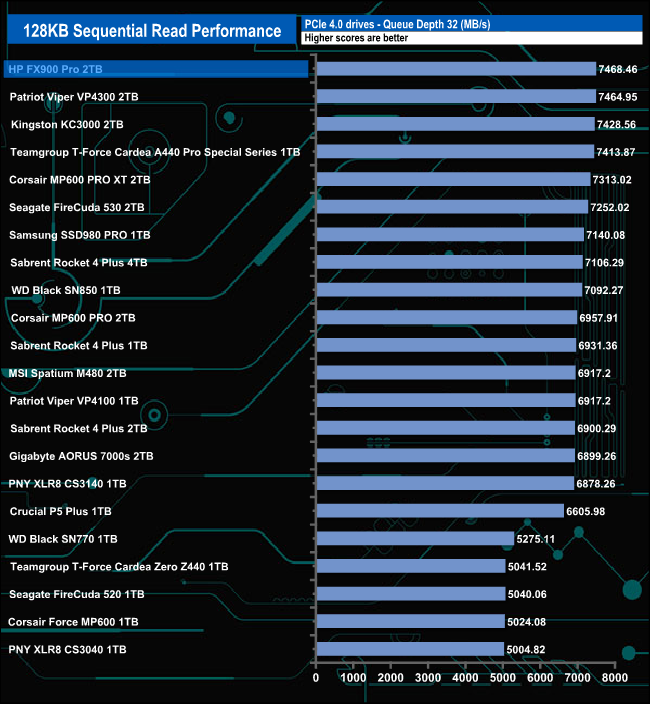
The 2TB HP FX900 Pro is the fastest consumer drive we've seen to date for Sequential reads at QD1 (3,526MB/s). At QD's 2 & 4 it drops to third and fourth place respectively before topping the table again at QD32 with a test result of 7,468.46MB/s.
Sequential Write Performance v QD compared.
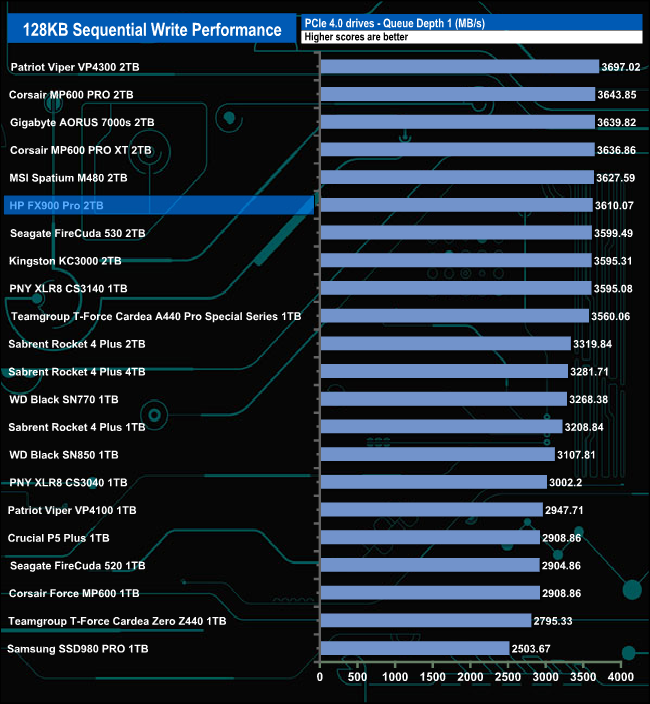
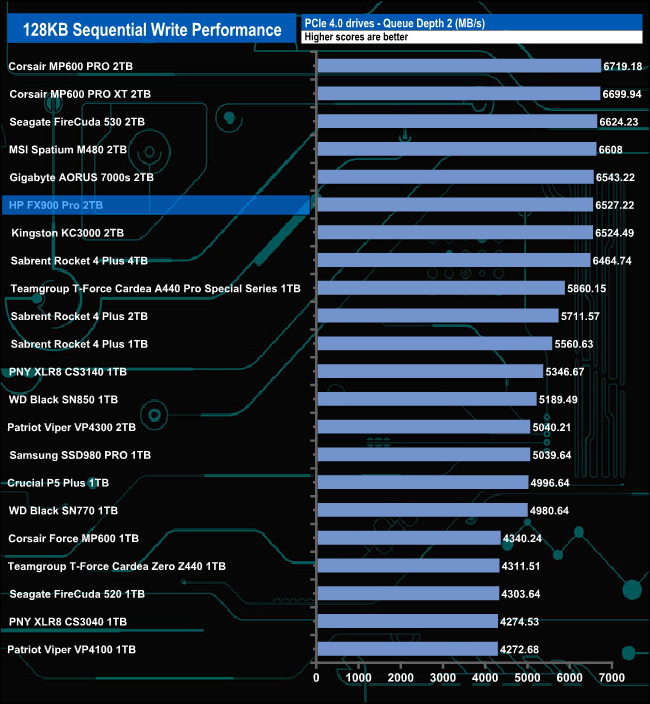
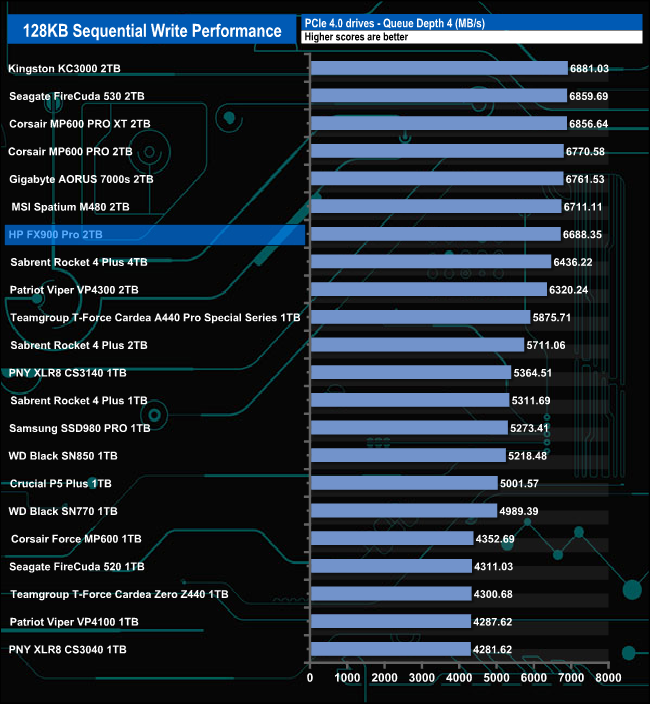
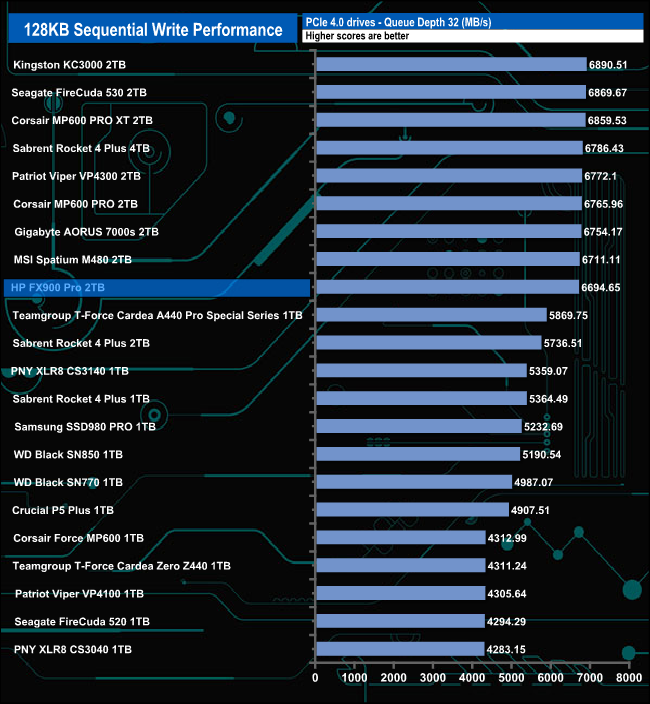
In relation to the drives around it, the FX900 Pro's best Sequential write performance comes at QD's 1 & 2 where it sits in sixth place. As the queue depth deepens further it begins to drop down the results chart.
We used CrystalDiskMark 8‘s custom settings to test the 4K random read performance of the drive through a range of queue depths. The setup for the tests is listed below.
Transfer Request Size: 4KB, Outstanding I/O: 1-32.
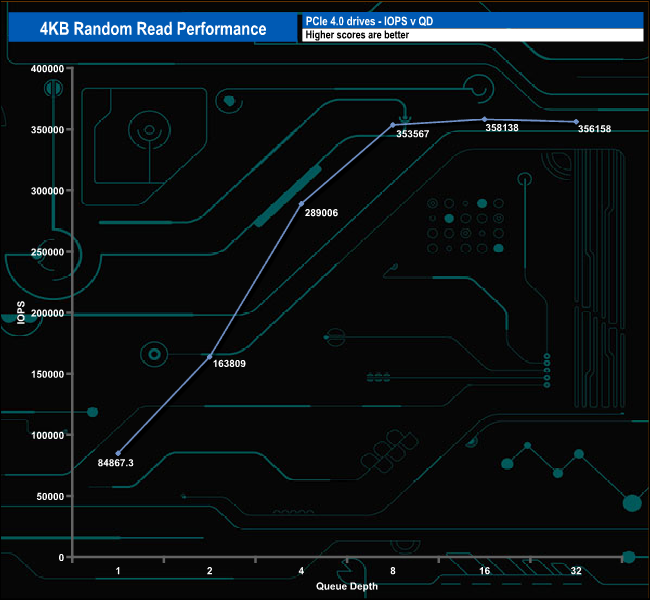
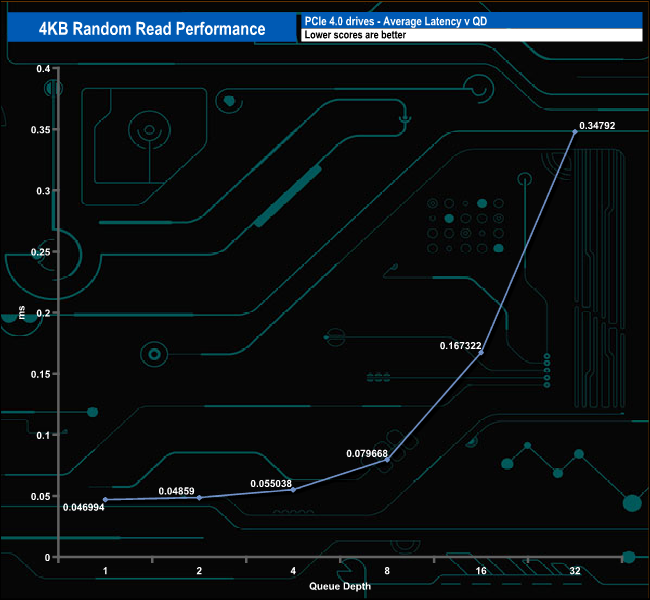
HP rate the 4K random read performance of the 2TB FX900 Pro as up to 1,344K IOPS. Using our 4-threaded 4K random testing, the best we saw was 358,138 IOPS (QD16).
4K Random Read v QD performance compared.
Even though we couldn't get anywhere close to the official maximum 4K random read figure, the FX900 Pro is the fastest consumer drive we've tested to date for random reads at QDs 1, 2 and 4. In contrast at QD32, the drive sits in the bottom section of the results graph.
We used CrystalDiskMark 8‘s custom settings to test the 4K random write performance of the drive through a range of queue depths. The setup for the tests is listed below.
Transfer Request Size: 4KB, Outstanding I/O: 1-32.
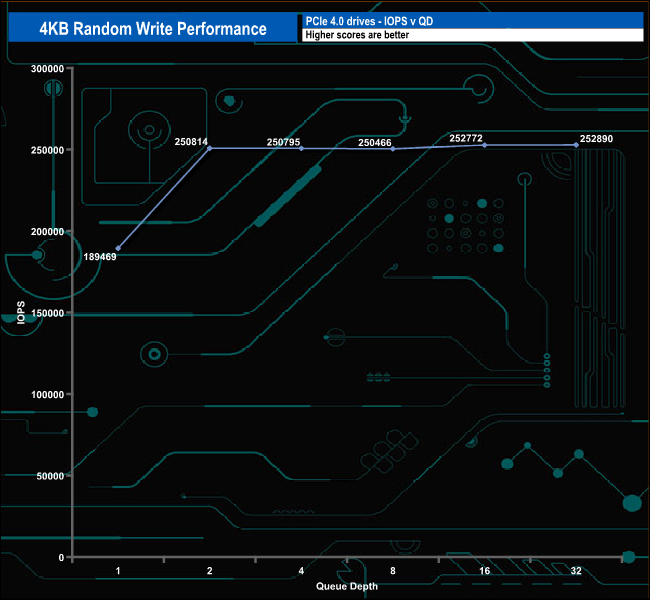
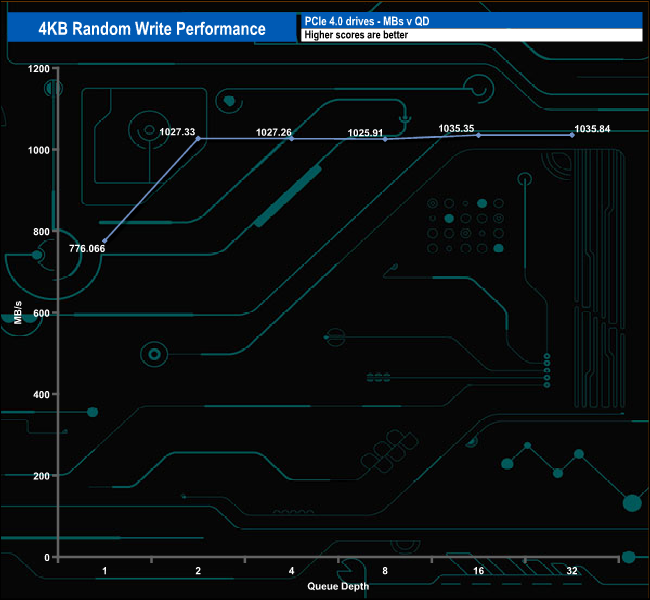
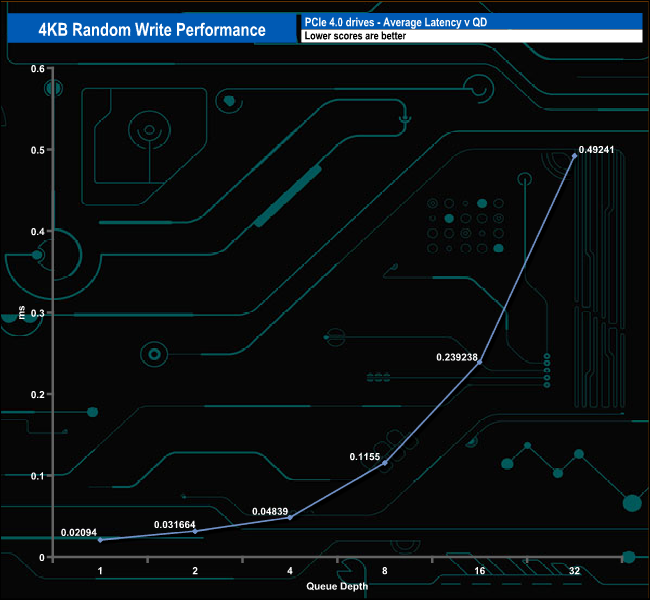
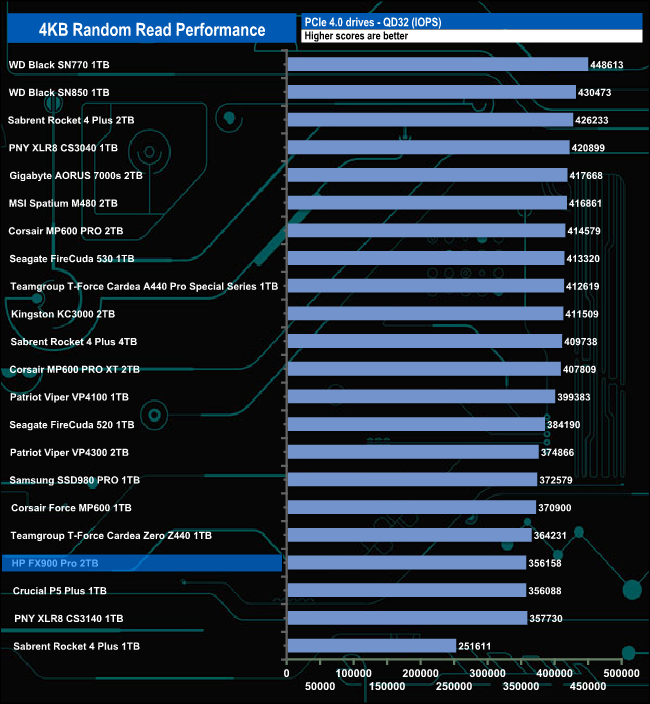
In the random write test, the best test result we saw from the FX900 Pro was 252,890 IOPS (QD32), which is nowhere near the official maximum of 1,122K IOPS. We did a quick test of the drive using eight threads at QD32 and got a test result of 429,095 IOPS, still well short of the official figure.
4K Random Write v QD performance compared.
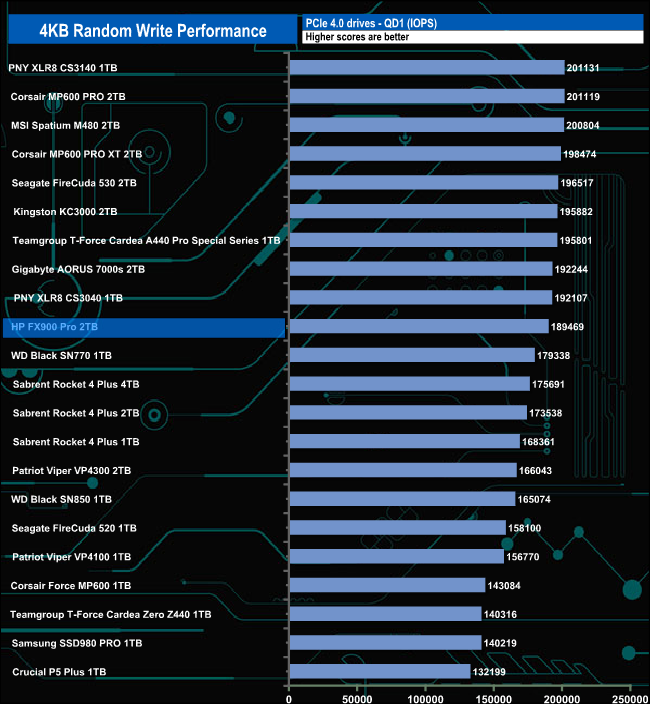
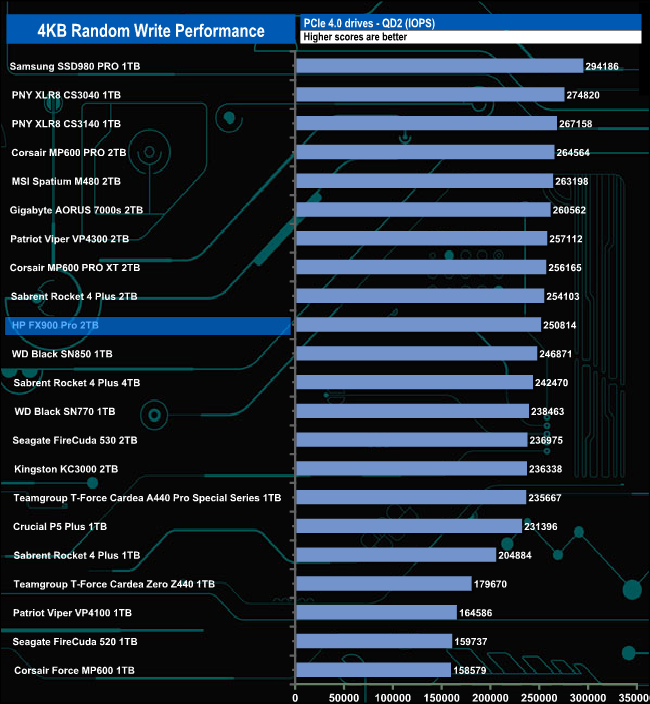
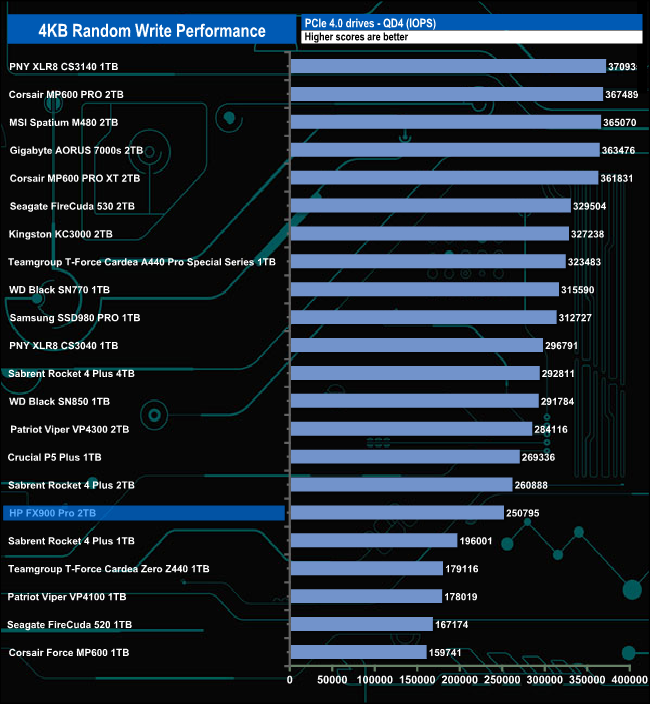
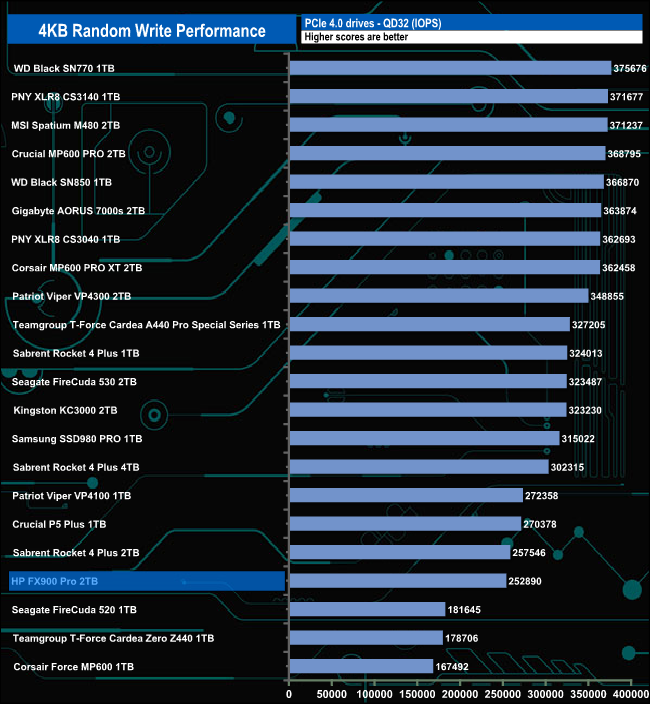
The drive sits around mid-table at QDs 1 & 2 but at QD4 it has slid towards the bottom half of the results chart where it stays for the QD32 result.
We used CrystalDiskMark 8’s custom settings to test the 4K 70/30 mixed read/write performance of the drive through a range of queue depths using a single thread and four threads.
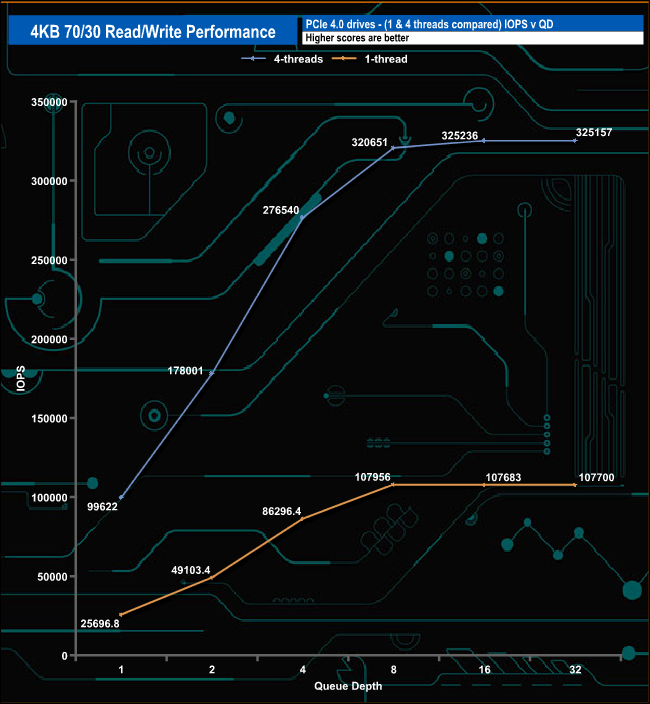
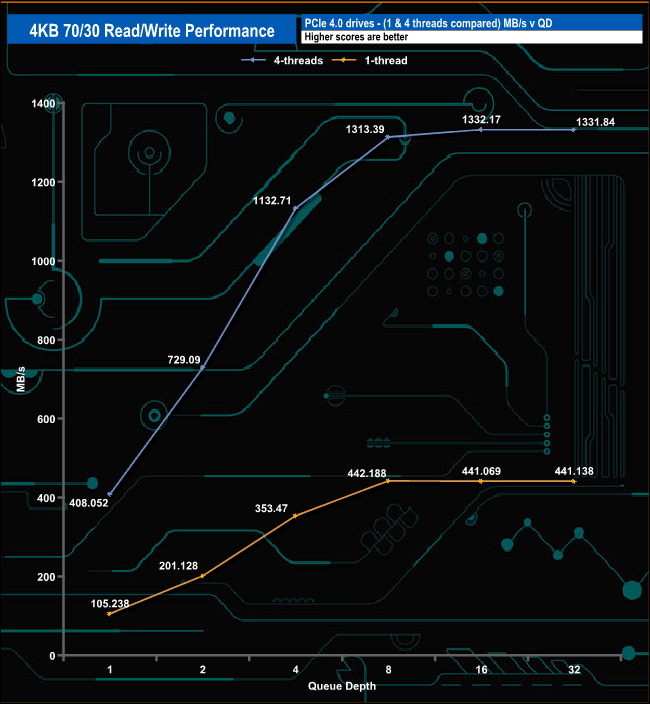
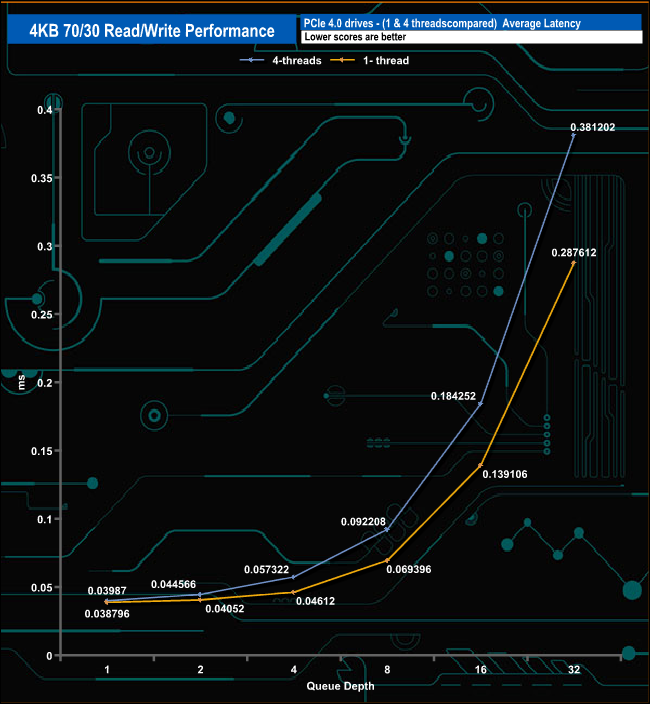
The HP FX900 has no problem dealing with our 70/30 read/write tests either with a single thread or four threads. With a single thread, the drive climbs from 25,696 IOPS (105.23MB/s) at QD1 up to 107,956 IOPS (442.18MB/s) at QD8 before dropping back to finish the test run at 107,700 IOPS (441/13MB/s) at QD32.
With four threads the drive goes from 99,622 IOPS (408.05MB/s) at QD1 up to 325,157 IOPS (1,331.84MB/s) at QD32 but the rate of increase slows from QD8 onwards.
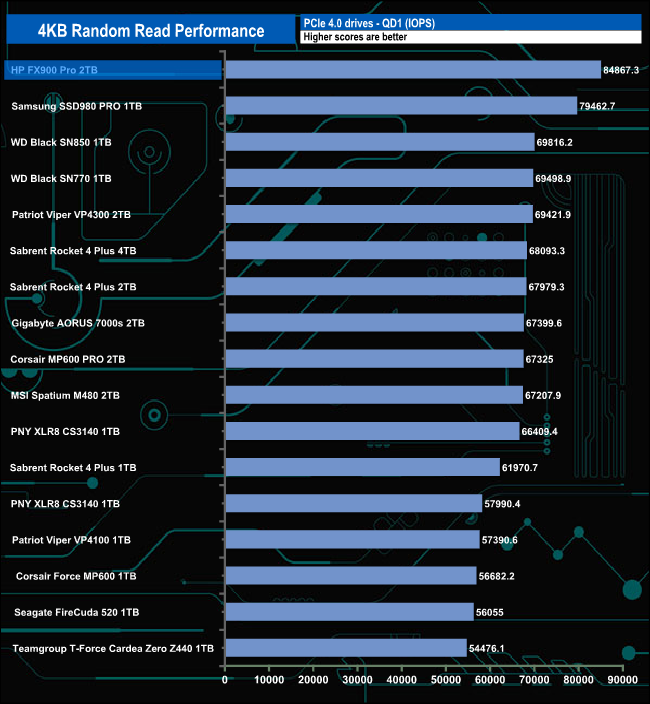
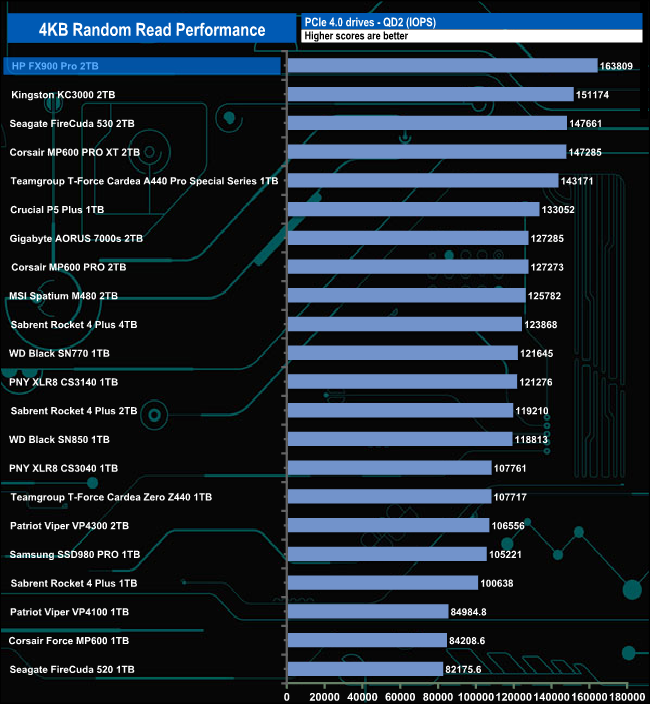
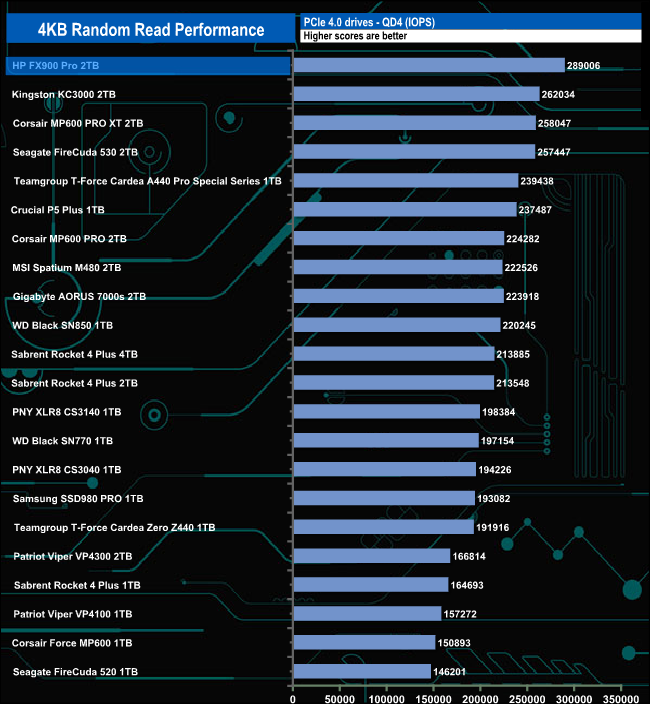
We used CrystalDiskMark 8 to test the random performance of the drive at lower queue depths (QD1 – QD8 where most of the everyday workloads occur) using 1 to 4 threads.
Random Reads
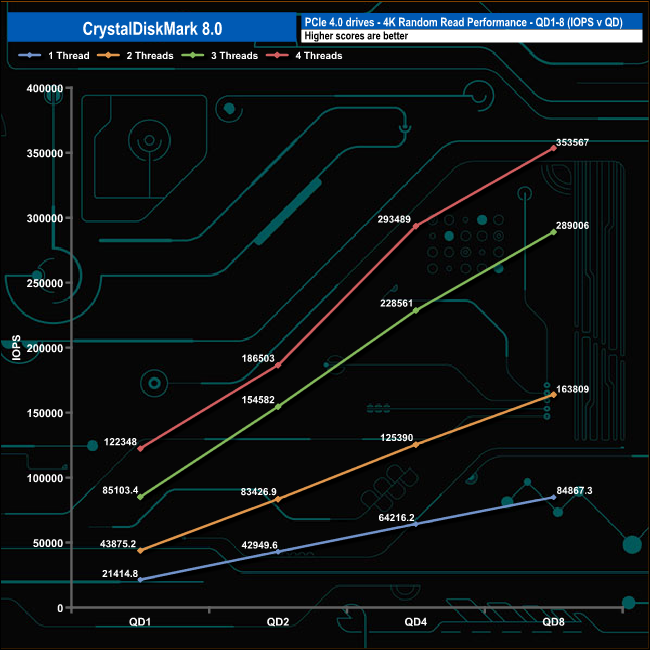
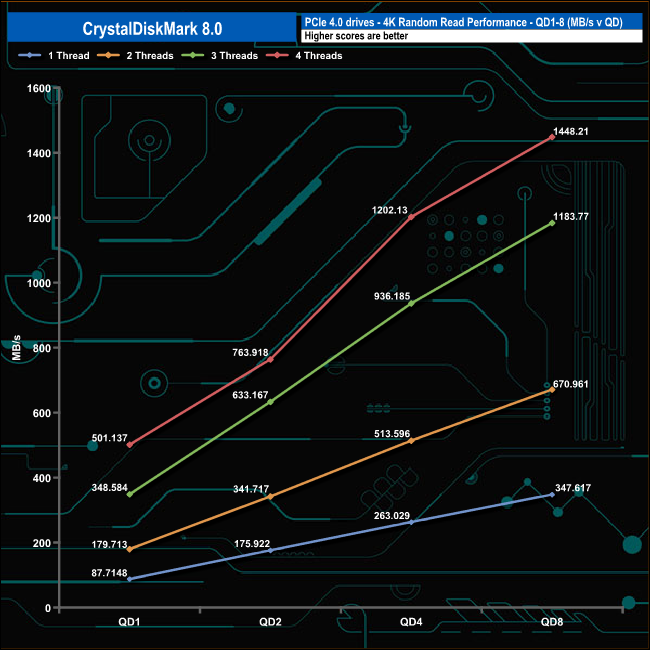
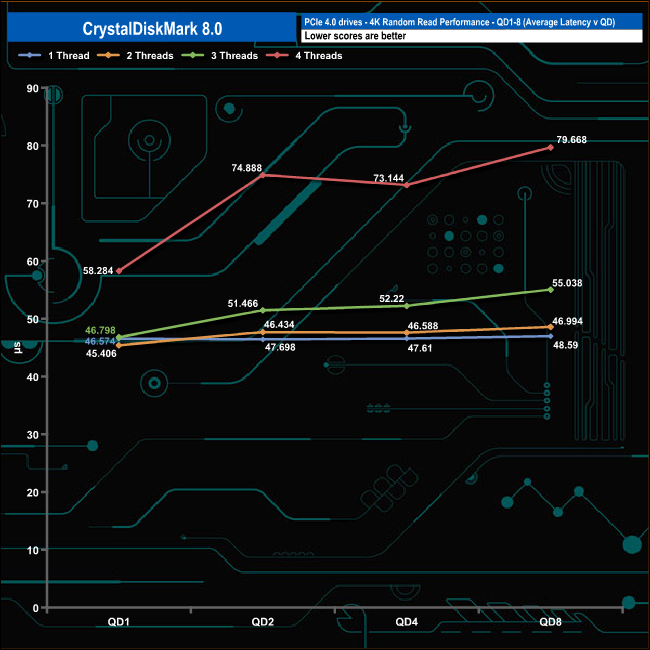
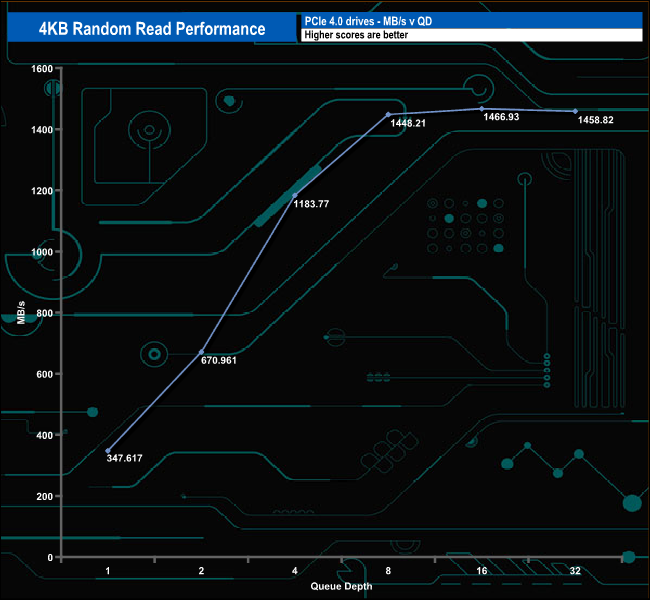
In our lower queue depth, 4K random read tests, the performance increases steadily as the queue depth deepens for each thread. At QD1 the performance ranged from a low point of 21,414 IOPS (87.71MB/s) for a single thread up to 122,348 IOPS (501.13MB/s) for four threads. At QD8 a single thread produced 84,867 IOPS (347MB/s), two threads 163,809 IOPS (670MB/s), three threads 289,006 IOPs (1,183MB/s) and finally with four threads, 353,567 IOPS (1,448MB/s).
Random Write
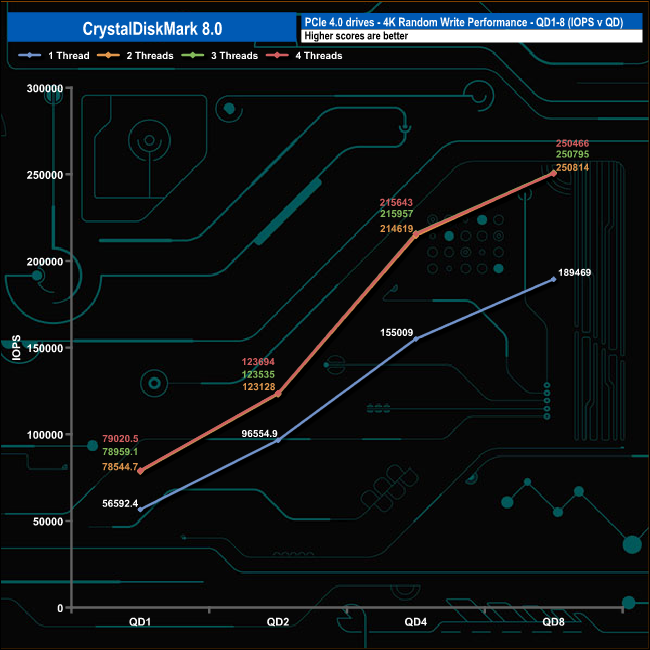
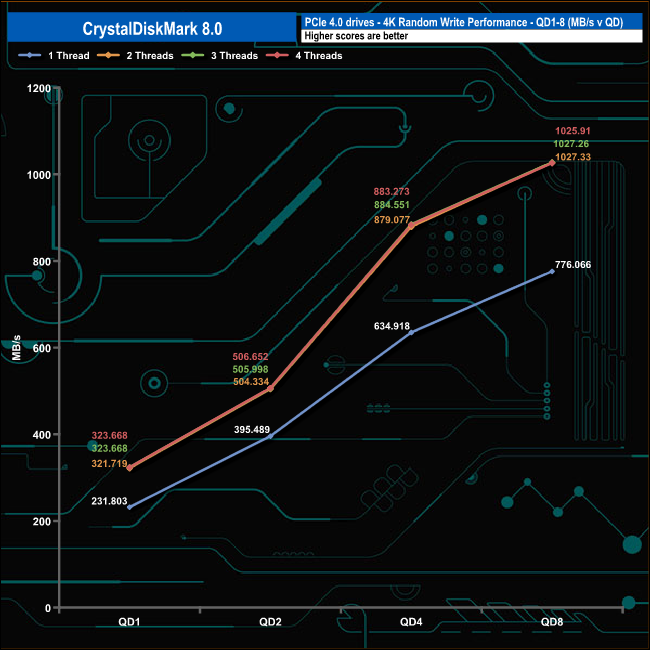
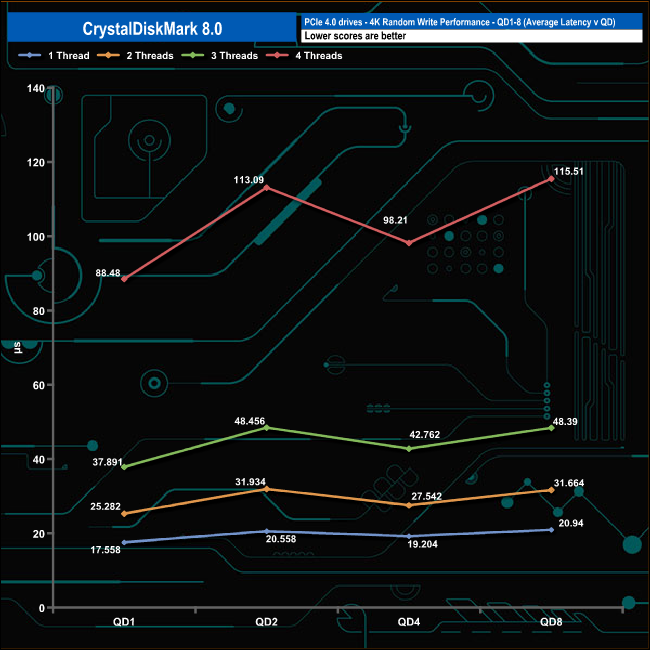
The FX900 Pro's write performance climbs smoothly throughout the tested queue depths with QD's 2, 3 and 4 closely matched.
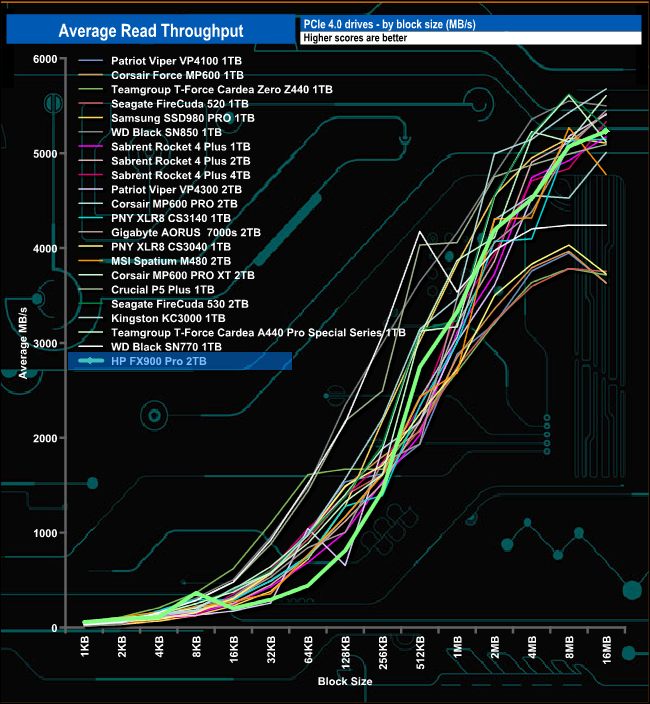
In our read throughput test, the 2TB FX900 Pro peaked at 5,231.31MB/s at the 16MB block mark. That test result is some way off the official maximum of 7,400MB/s.
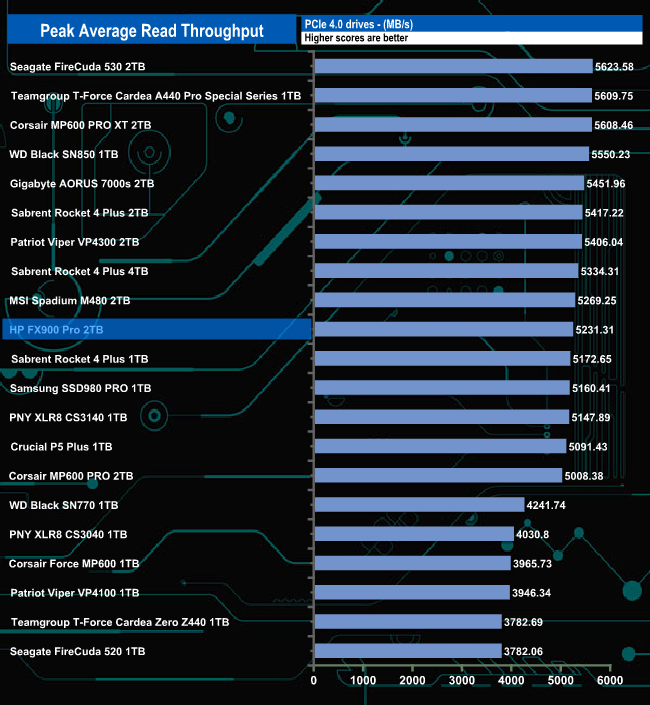
The peak read score of 5,231,31MB/s puts the drive into the middle of our results chart.
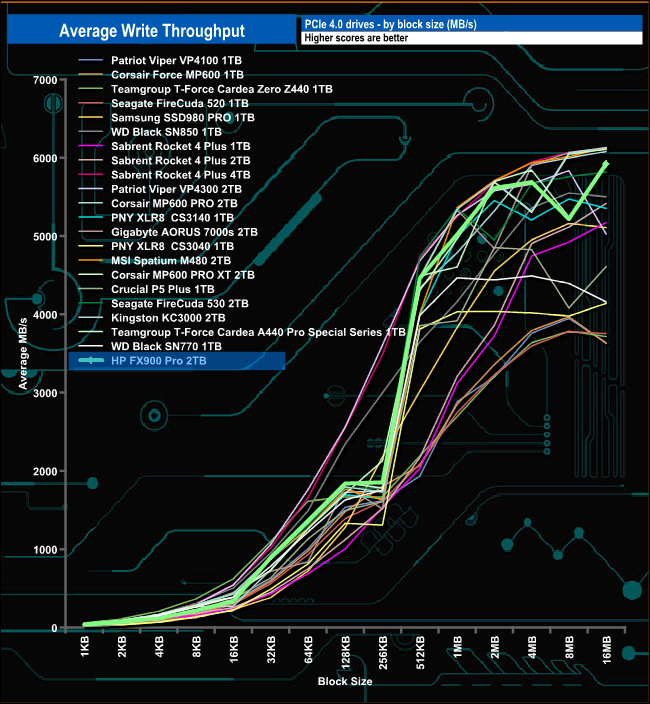
Peak write throughput came at the 16MB block mark at 5,921.45MB/s, again slower than the official maximum figure of 6,700MB/s. The performance of the drive seems to plateau out between the 128KB and 256KB block marks but it recovers very well.
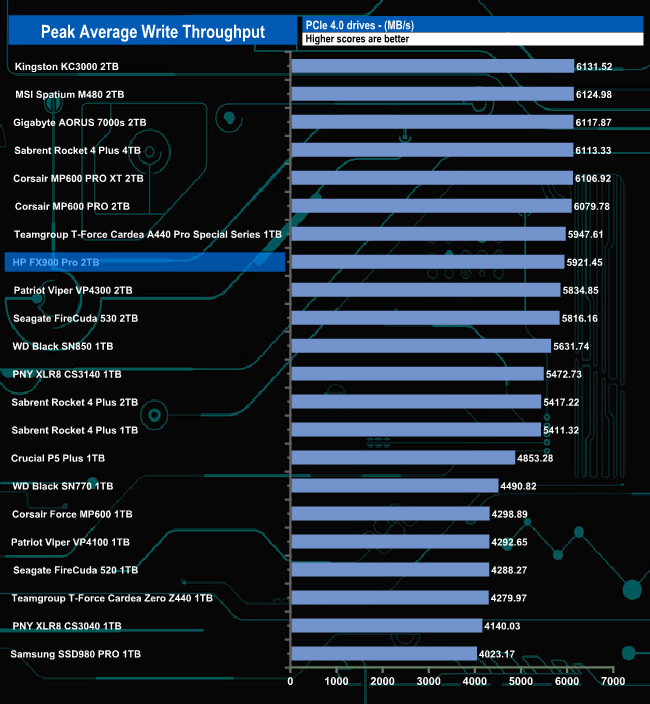
The FX900 Pro's write result of 5,921.45MB/s sees the drive placed just inside the Top 10 drives we've tested, just in front of another InnoGrit IG5236 powered drive, Patriot's Viper VP4300.
The PCMark 10 Full System Drive Benchmark uses a wide-ranging set of real-world traces from popular applications and common tasks to fully test the performance of the fastest modern drives. The benchmark is designed to measure the performance of fast system drives using the SATA bus at the low end and devices connected via PCI Express at the high end.
The goal of the benchmark is to show meaningful real-world performance differences between fast storage technologies such as SATA, NVMe, and Intel’s Optane. The Full System Drive Benchmark uses 23 traces, running 3 passes with each trace. It typically takes an hour to run.
Traces used:
- Booting Windows 10.
- Adobe Acrobat – starting the application until usable.
- Adobe Illustrator – starting the application until usable Adobe Premiere Pro – starting the application until usable.
- Adobe Photoshop – starting the application until usable.
- Battlefield V – starting the game until the main menu.
- Call of Duty Black Ops 4 – starting the game until the main menu.
- Overwatch – starting the game until main menu.
- Using Adobe After Effects.
- Using Microsoft Excel.
- Using Adobe Illustrator.
- Using Adobe InDesign.
- Using Microsoft PowerPoint.
- Using Adobe Photoshop (heavy use).
- Using Adobe Photoshop (light use).
- cp1 Copying 4 ISO image files, 20 GB in total, from a secondary drive to the target drive (write test).
- cp2 Making a copy of the ISO files (read-write test).
- cp3 Copying the ISO to a secondary drive (read test).
- cps1Copying 339 JPEG files, 2.37 GB in total, to the target drive (write test).
- cps2 Making a copy of the JPEG files (read-write test).
- cps3 Copying the JPEG files to another drive (read test).
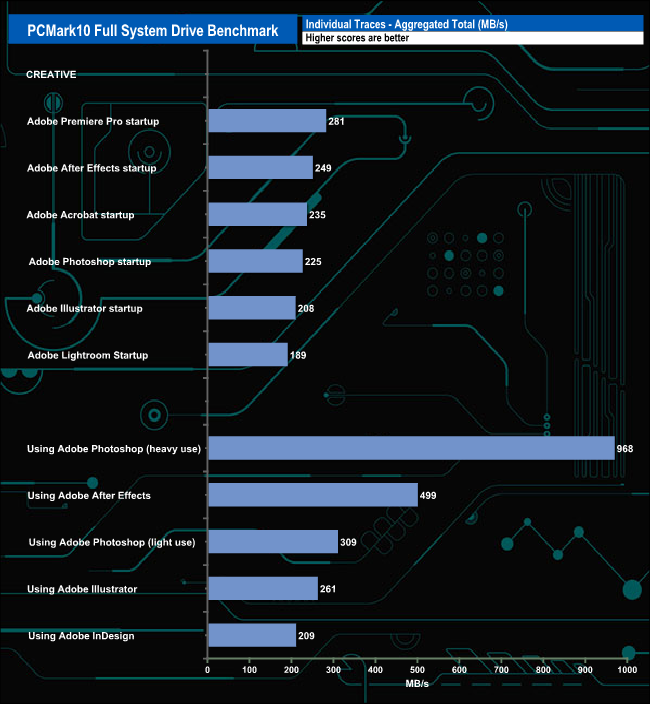
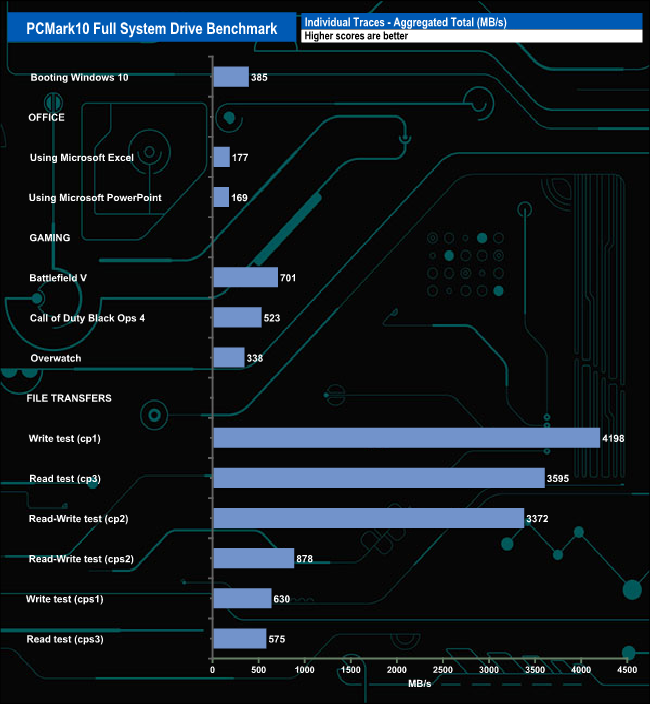
The best result from the HP FX900 Pro in PCMark10’s Full System Drive Benchmark Adobe test traces was the 968MB/s for the Heavy Use Adobe Photoshop trace. The file transfer tests also produced a good cp1 (write test) figure of 4,198MB/s backed up by the 3,595MB/s for the cp3 (read test) and 3,372MB/s for the cp2 read/write test traces.
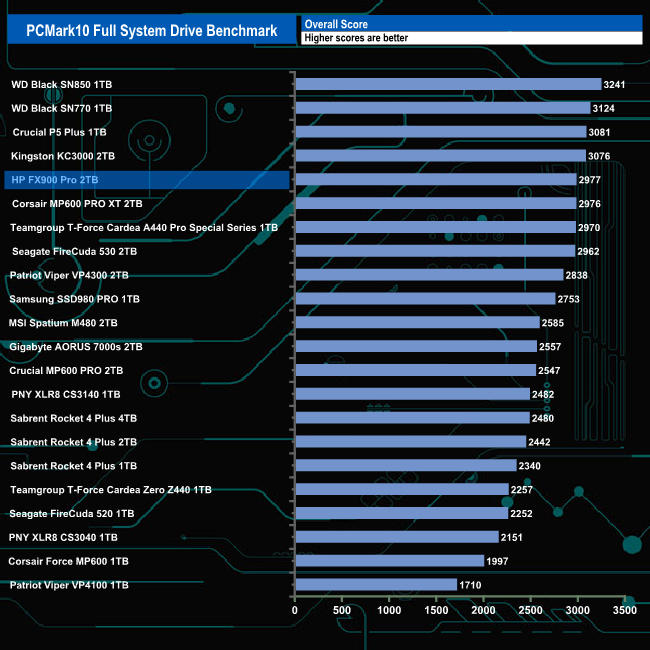
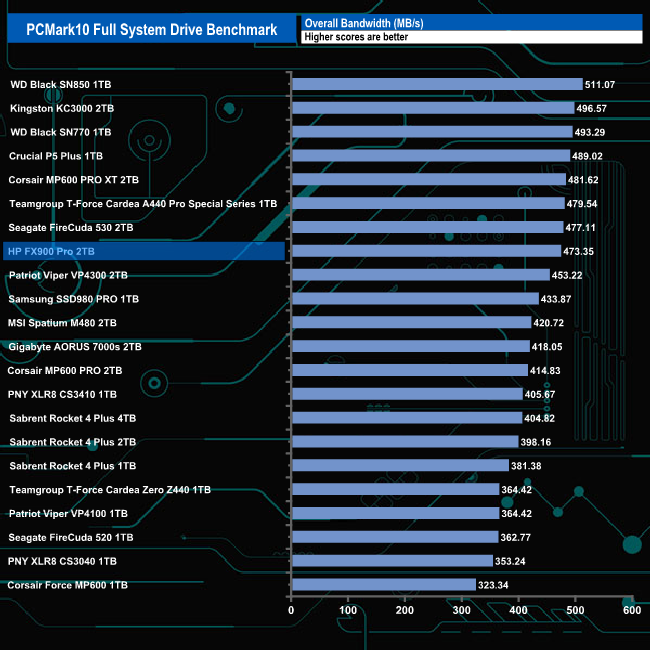
The overall bandwidth figure of 473.35MB/s sees the drive slip into the top ten in our result chart just ahead of another InnoGrit IG5236 powered drive, the Patriot VP4300.
The 3DMark Storage Benchmark uses traces recorded from popular games and gaming-related activities to measure real-world gaming performance.
Traces used –
Battlefield V: Loading Battlefield™ V from launch to the main menu.
Call of Duty Black Ops 4: Loading Call of Duty®: Black Ops 4 from launch to the main menu.
Overwatch: Loading Overwatch® from launch to the main menu.
Game Move: Copying the Steam folder for Counter-Strike®: Global Offensive from an external SSD to the system drive.
Game Recording: Recording a 1080p gameplay video at 60 FPS with OBS (Open Broadcaster Software) while playing Overwatch®.
Installing Game: Installing The Outer Worlds® from the Epic Games Launcher.
Game Saving: Saving progress in The Outer Worlds game.
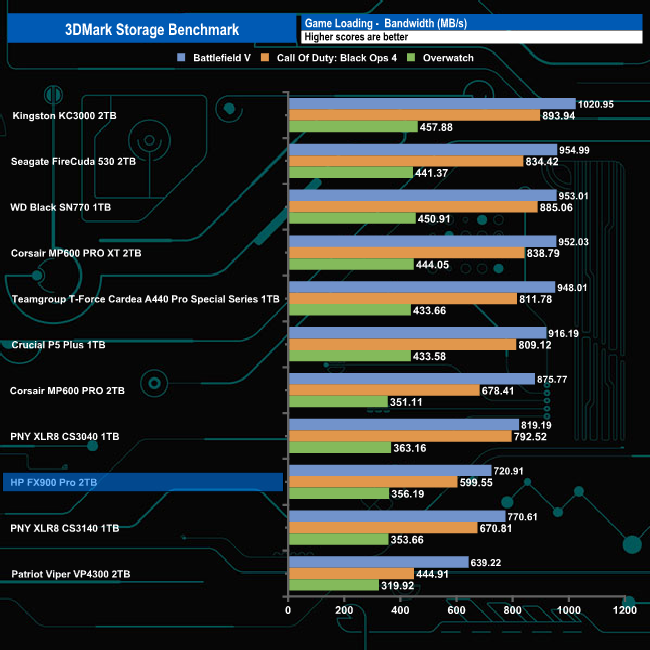
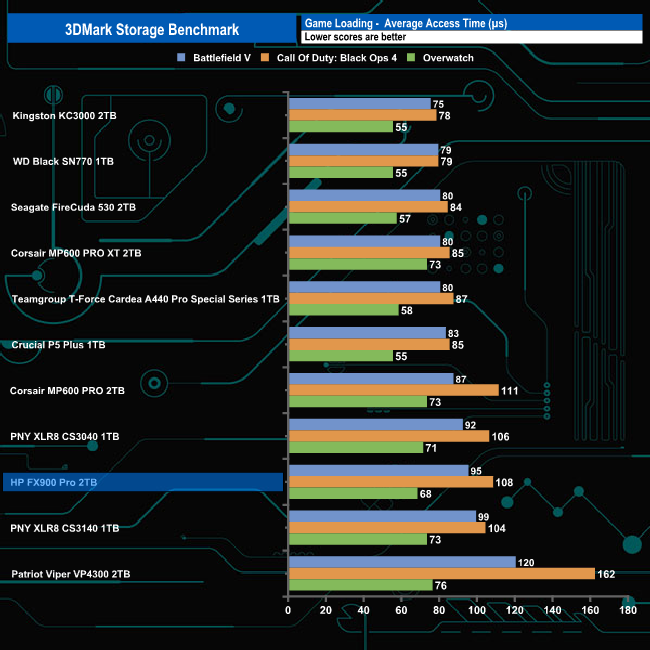
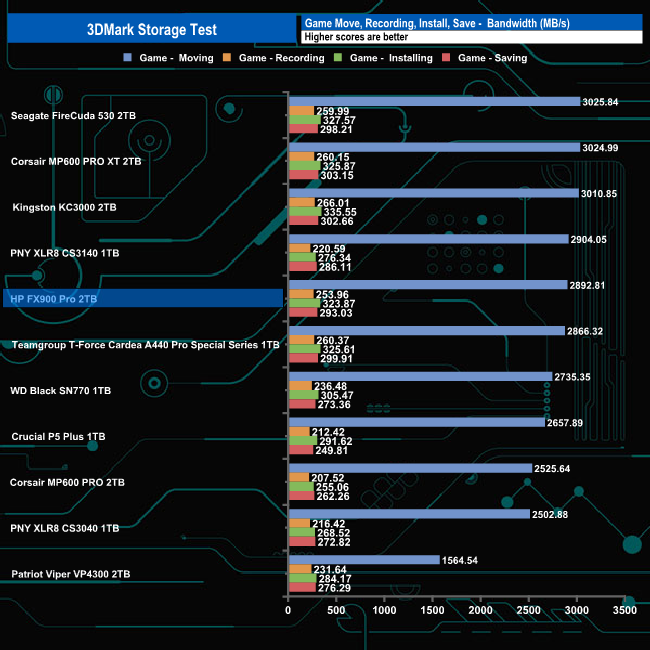
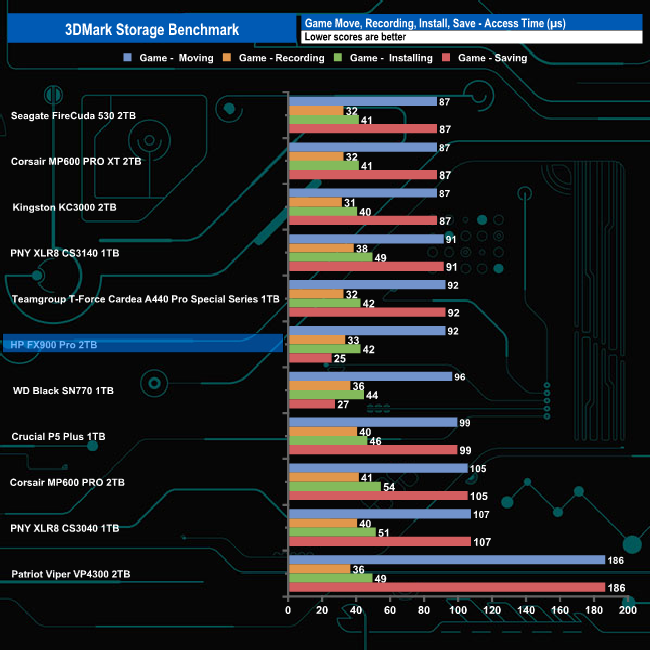
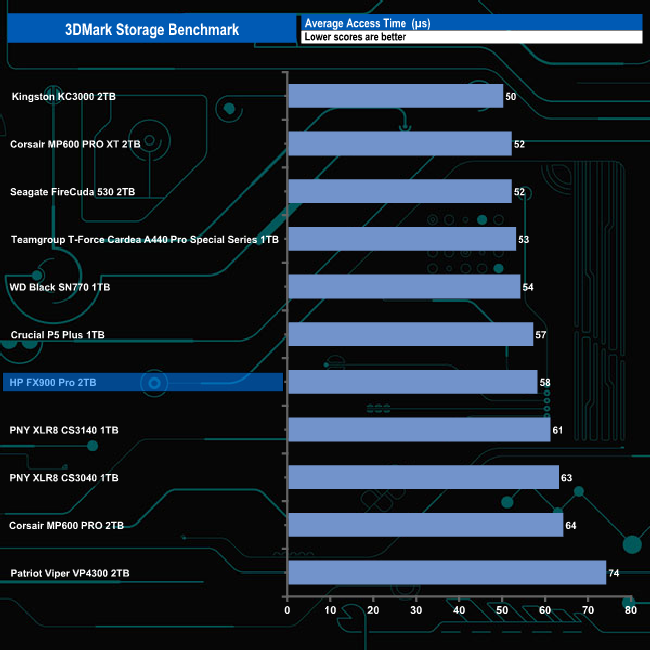
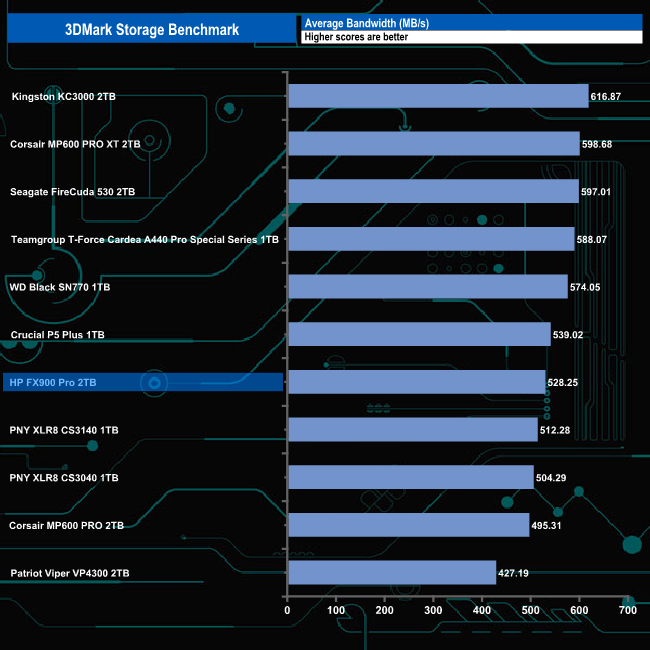
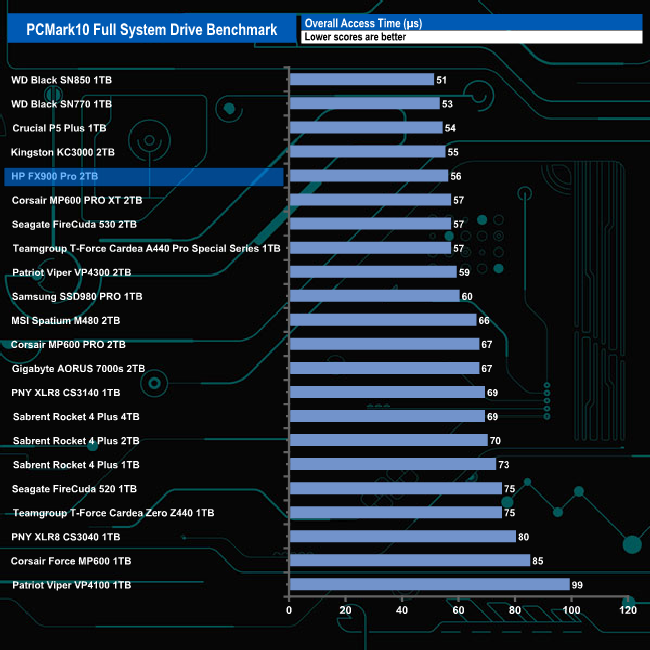
In 3DMark’s Storage Test, the FX900 Pro had an average bandwidth figure of 558.88MB/s for the three game load tests (Battlefield V, Call of Duty: Black Ops 4 and Overwatch) with an average access time of 90.33µs for the same three games. The overall bandwidth figure for the complete test run was 528.25MB/s which puts the drive in the lower portion of the results chart.
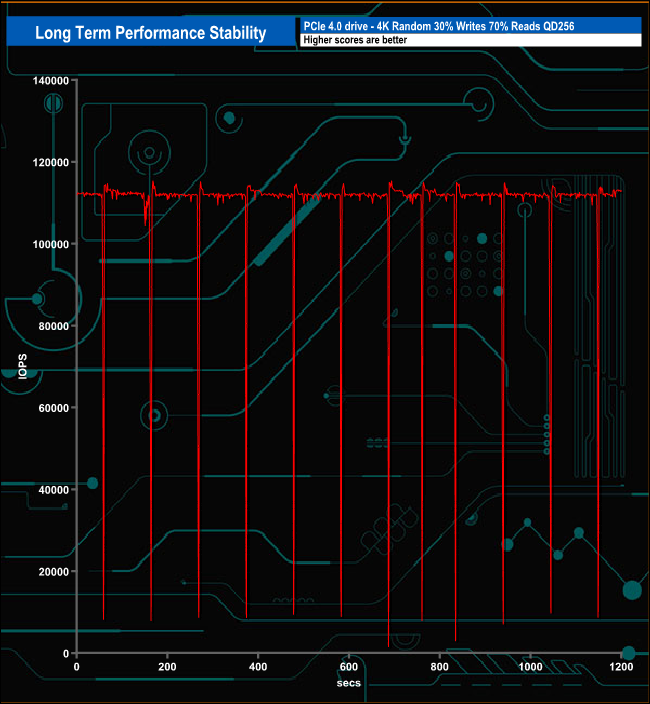
For the long term performance stability test, we set the drive up to run a 20-minute 4K random test with a 30% write, 70% read split, at a Queue Depth of 256 over the entire disk. The 2TB HP FX900 Pro averaged 110,071 IOPS for the test, with a performance stability of 96% which is enterprise-level stability.
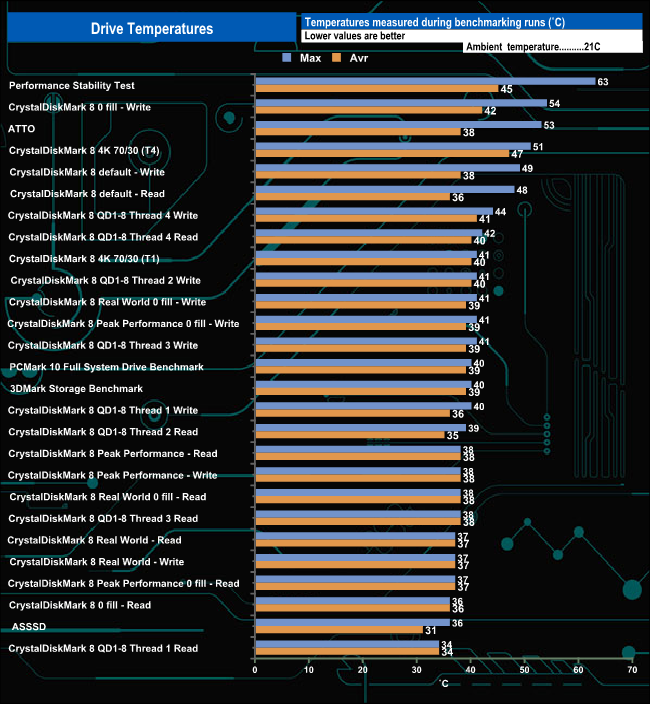
We took note of the drive’s temperature during some of our benchmarking runs. The HP FX900 Pro uses a thin thermal pad which employs graphene foam in its construction. The hottest the drive got was when it was being pushed extremely hard during the Performance Stability test when it peaked at 63° C, perilously close to the maximum operating temperature of 70° C. However for the bulk of our testing the temperature averaged around 40° C, comfortably below the maximum operating temperature
To test real life performance of a drive we use a mix of folder/file types and by using the FastCopy utility (which gives a time as well as MB/s result) we record the performance of drive reading from & writing to a 256GB Samsung SSD850 PRO.
We use the following file/folder types:
- 100GB data file.
- 60GB iso image.
- 60GB Steam folder – 29,521 files.
- 50GB File folder – 28,523 files.
- 12GB Movie folder – (15 files – 8 @ .MKV, 4 @ .MOV, 3 @ MP4).
- 10GB Photo folder – (304 files – 171 @ .RAW, 105 @ JPG, 21 @ .CR2, 5 @ .DNG).
- 10GB Audio folder – (1,483 files – 1479 @ MP3, 4 @ .FLAC files).
- 5GB (1.5bn pixel) photo.
- BluRay Movie – 42GB.
- 21GB 8K Movie demos – (11 demos)
- 16GB 4K Raw Movie Clips – (9 MP4V files).
- 4.25GB 3D Printer File Folder – (166 files – 105 @ .STL, 38 @ .FBX, 11 @ .blend, 5 @ .lwo, 4 @ .OBJ, 3@ .3ds).
- 1.5GB AutoCAD File Folder (80 files – 60 @ .DWG and 20 @.DXF).
![]()
![]()
The drive was consistent when dealing with the larger file transfers in our real-life file transfer tests averaging 544.5MB/s when writing six of the largest folders to the drive and 465MB/s when reading them back. The fastest transfer was for writing the 60GB iso image (551MB/s) with the slowest being the 50GB file folder transfer at 259MB/s.
To get a measure of how much faster PCIe NVMe drives are than standard SATA SSD's we use the same files but transfer to and from a 2TB Kioxia Exceria Plus drive:
![]()
![]()
Swapping over to an all NVMe architecture saw transfer speeds rocket as you might expect. Seven of the write transfers topped 3GB/s, the fastest of which was the 3,098MB/s for the 60GB iso (2,182MB/s when reading back the data). Nine of the thirteen transfers topped the 2GB/s when reading the files with six of them topping 2.5GB/s. The slowest transfers came when the drive was handling the 50GB file folder with 462MB/s writing and 574MB/s reading.
HP's latest SSD aimed at the enthusiast end of the market, the FX900 Pro is the result of the company teaming up with BIWIN Storage, the Chinese OEM manufacturer of high-performance memory and storage solutions. Unlike many of the PCIe Gen4 drives currently on the shelf, the FX900 Pro doesn't make use of Phison's E18 controller but instead uses the 8-channel InnoGrit IG5236 (codenamed Rainer) IC. The NAND used in the FX900 Pro is Micron's latest 176-layer B47R Fortis Grade. Currently, the FX900 Pro range is made up of four drives; a 512GB entry-level drive, 1TB, 2TB (the drive we are reviewing) and the recently introduced 4TB flagship drive.
The 2TB version of the HP FX900 is rated at up to 7,400MB/s for Sequential reads and up to 6,700MB/s for writes. When we tested the drive with the ATTO benchmark we couldn't quite hit those maximum figures with test results of 6,940MB/s and 6,280MB/s for read and writes respectively. While we couldn't hit the maximums, that read figure of 6,940MB/s is the fastest we've seen to date for a consumer NVMe drive while being tested with the ATTO benchmark.
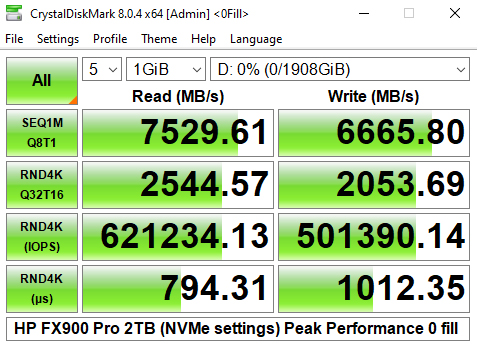
We could, however, confirm those official Sequential figures using the CrystalDiskMark 8 benchmark. The fastest read result we saw was the 7,529.61MB/s when using the 0 fill setting in the Peak Performance profile. The best Sequential write figure we saw was the 6,716.76MB/s result in the default profile 0 fill test. As with the ATTO read the result, the two read results that we use in our results charts, from the default test (7,523MB/s) and the Peak Performance profile default (7,479MB/s) put the drive on the top of both respective charts.
When it comes to 4K random performance, HP quote very impressive figures of up to 1,344K IOPS and up to 1,122K IOPS for read and writes respectively. With our standard 4-threaded tests we saw a best of 358.138 IOPS (QD16) for reads and 252,890 IOPS for writes at QD32. We did a quick test of the drive using eight threads at QD32 and got test results of 585,350 IOPS and 429,095 IOPS respectively, still well short of the official figure. Using the Peak Performance profile in CrystalDiskMark 8 we got a bit closer to the official figures with test results of 621,817 IOPS for reads and 503,628 IOPS for writes.
In terms of endurance, the 2TB FX900 Pro is rated at 1,200TB TBW and it's backed with a 5-year warranty.
We found the 2TB HP FX900 Pro on Amazon.com for $249.99 (plus taxes & shipping) HERE. Unfortunately we have not been able to find the FX900 Pro on sale in the UK – we have been told it will be available in the UK market at some point, but we are not yet sure when that will be.
Pros
- Sequential performance especially reads.
- Slimline heatsink design.
- Endurance.
Cons
- Couldn't meet the official maximum 4K figures under our tests.
- Not yet available in the UK.
KitGuru says: HP's offering into the bunfight that is the Gen4 SSD market, the FX900 Pro is a very capable drive. Well built, using high-end components, the FX900 Pro veers off the well-trodden path of using a Phison controller and mixes an InnoGrit controller with 176-layer NAND to very good effect.