

The DC1000M is the latest addition to Kingston's data centre SSD portfolio. Designed for dealing with mixed-use workloads, such as high-performance cloud servicing, web hosting, high-resolution media capture and transport and virtualisation, it features a U.2 connector and uses a 16-channel controller combined with 3D TLC NAND.
This SSD is available in four capacities at the time of writing; 960GB, 1.92TB (the drive we are reviewing here), 3.84TB and the huge 7.68TB flagship drive make up the DC1000M range. The DC1000M uses a Silicon Motion SM2270 16-channel controller which looks after Kioxia BiCS3 64-layer 3D TLC NAND.
Sequential read performance is the same for all four drives-up to 3,100MB/s while Sequential writes vary with capacity. The 960GB is rated up to 1,330MB/s, the 1.92TB 2,600MB/s, 3.84TB 2,700MB/s and up to 2,800MB/s for the 7.68TB drive.
Random 4K performance is quoted as up to 400,000 IOPS / 125,000 IOPS for read and writes respectively for the 960GB drive, up to 540,000 IOPS reads and 205,000 IOPS writes for the 1.92TB drive. The 3.84TB and 7.68TB drives share the same 210,000 IOPS write figure with the 3.84TB drive having a faster read speed at 525,000 IOPS over the 485,000 IOPS of the flagship drive.
As far as power consumption is concerned the 1.92TB drive is rated at 5.22W idle, 5.31W average read with a maximum of 5.70W. Average writes are rated at 13.1W with a 13.92W maximum.
Endurance wise, Kingston rate the 1.92TB drive at 3362TBW which works out at 1 Drive Write Per Day (DWPD) over the 5-year length of the drive's warranty.
Physical Specifications:
- Usable Capacities: 1.92TB.
- NAND Components: Kioxia BiCS3 64-layer 3D TLC.
- NAND Controller: Silicon Motion SM2270.
- Interface: U.2. PCIe NVMe Gen3 x4.
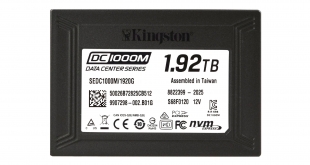
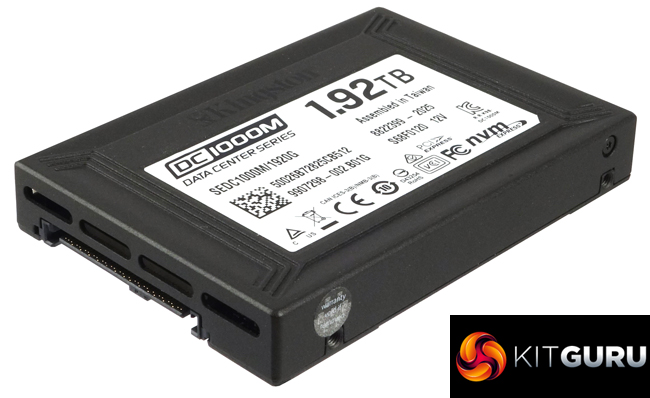
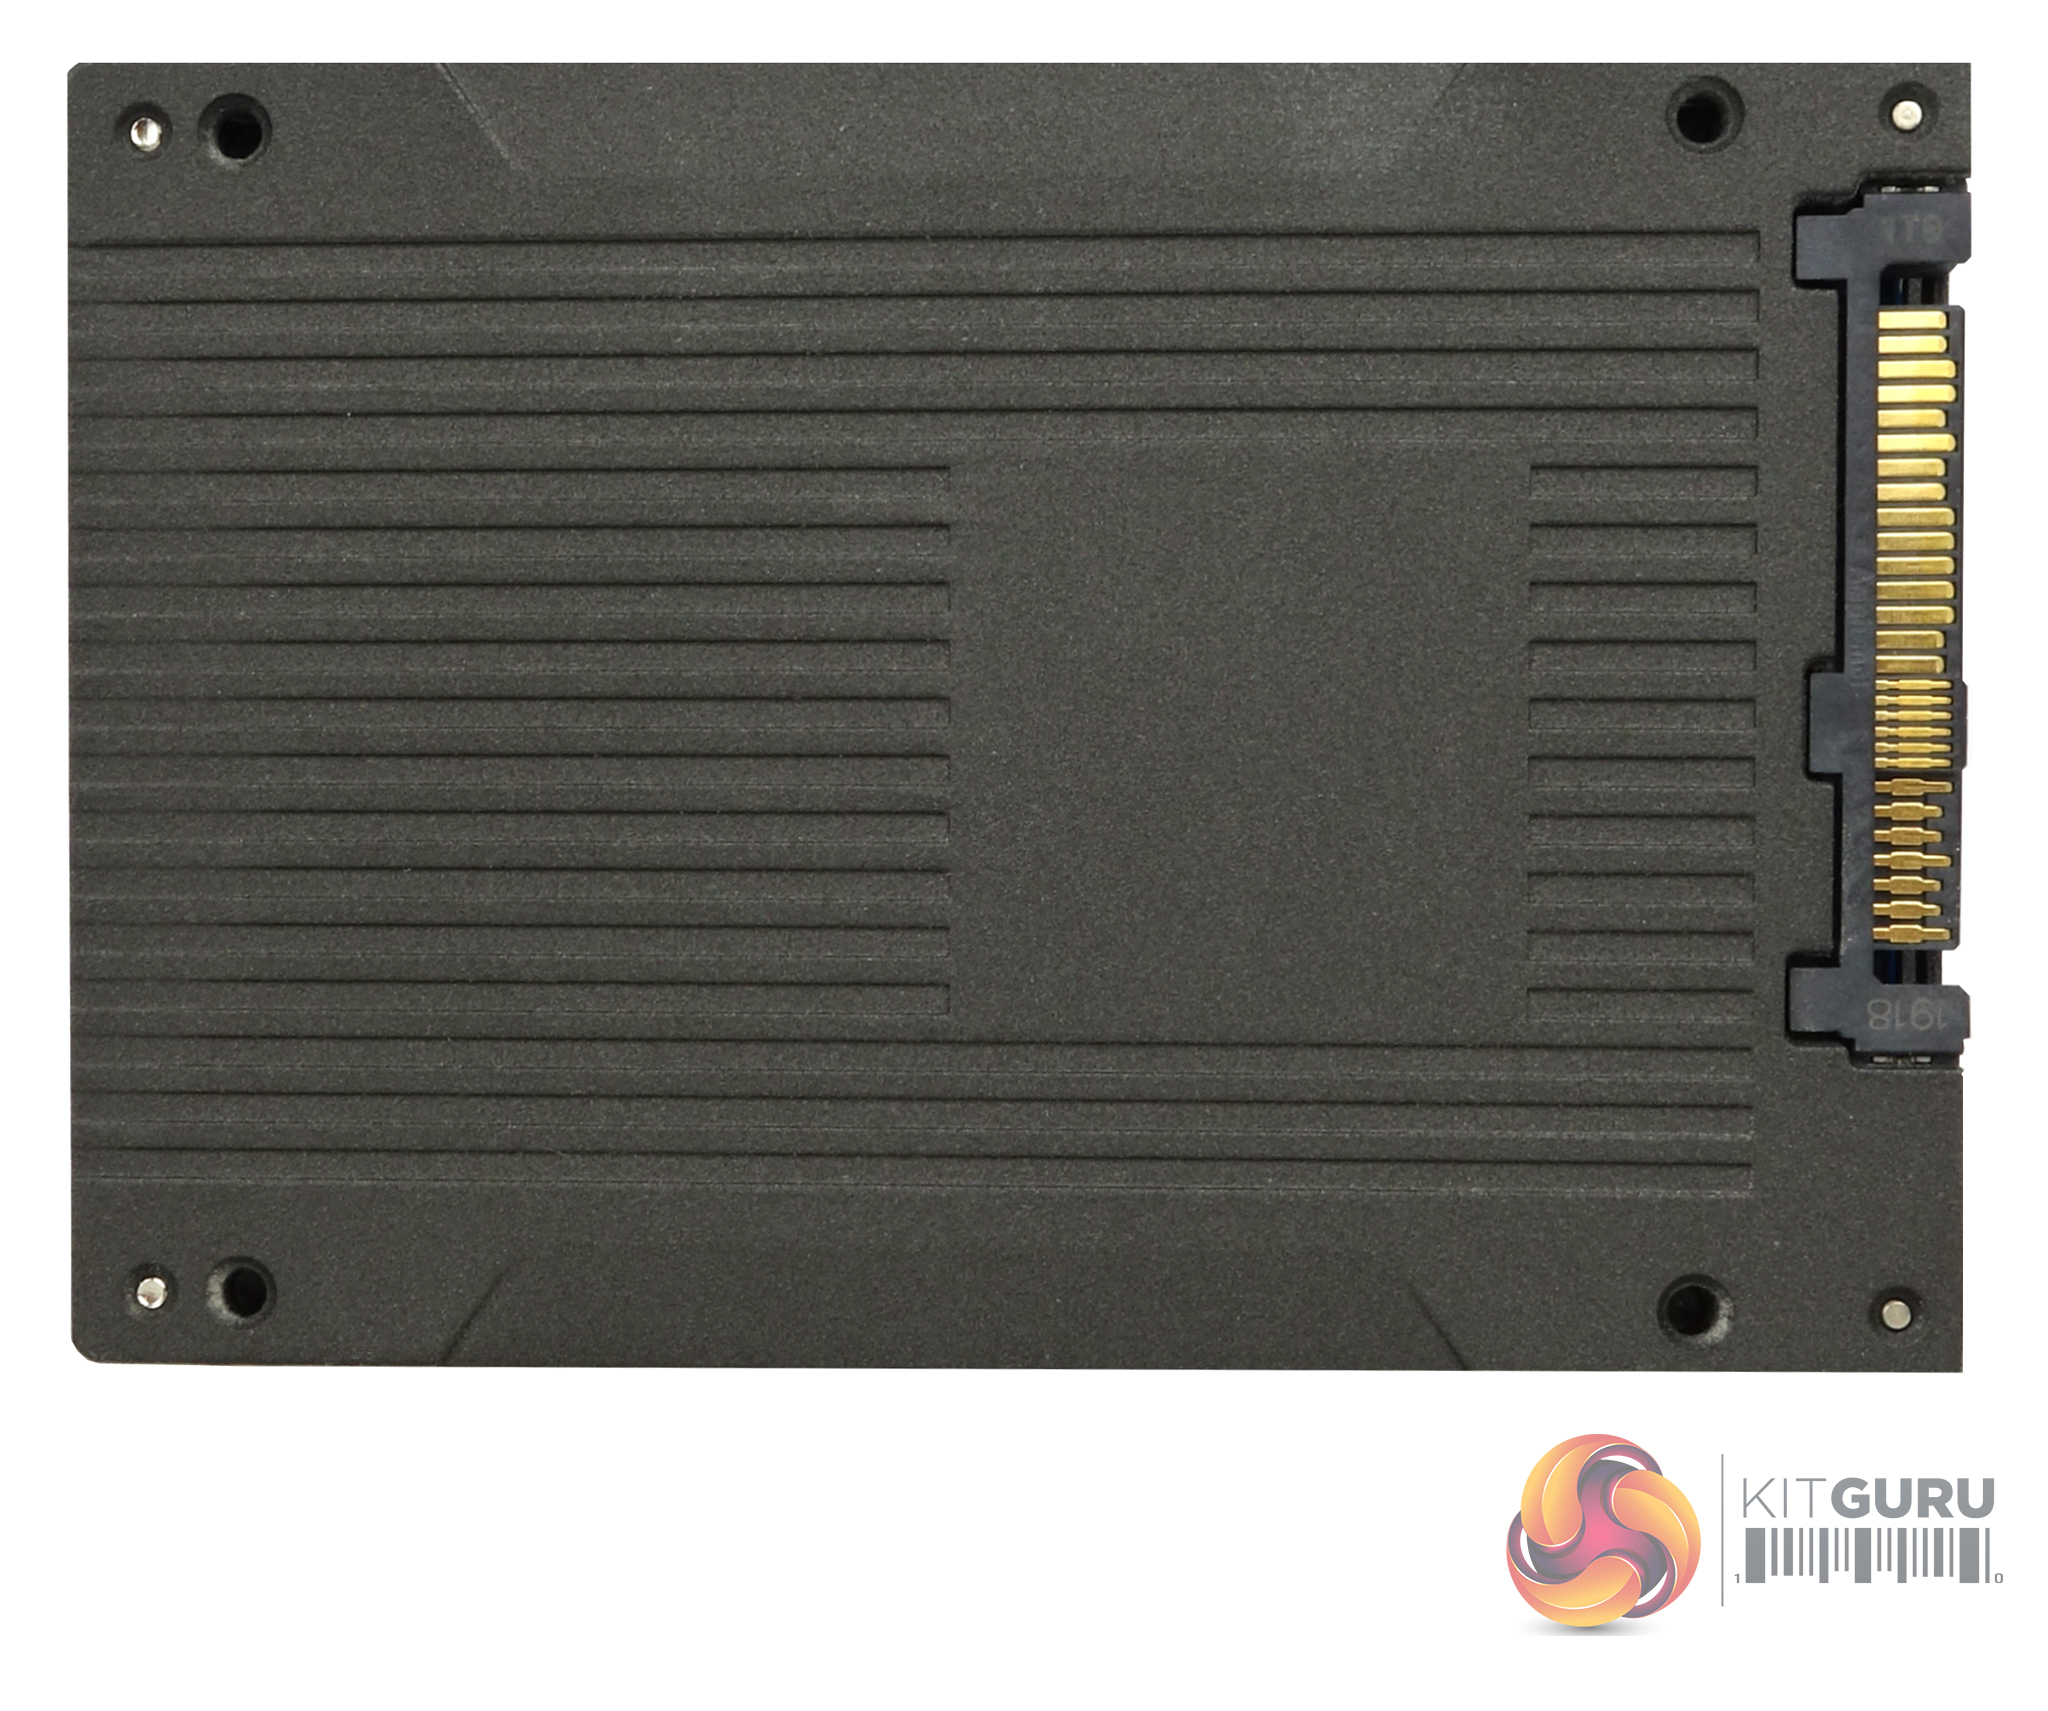
- Form Factor: 2.5in, 15mm.
- Dimensions: 100.09 x 69.84 x 14.75mm.
- Drive Weight: 160g.
Firmware Version: S68F0120.
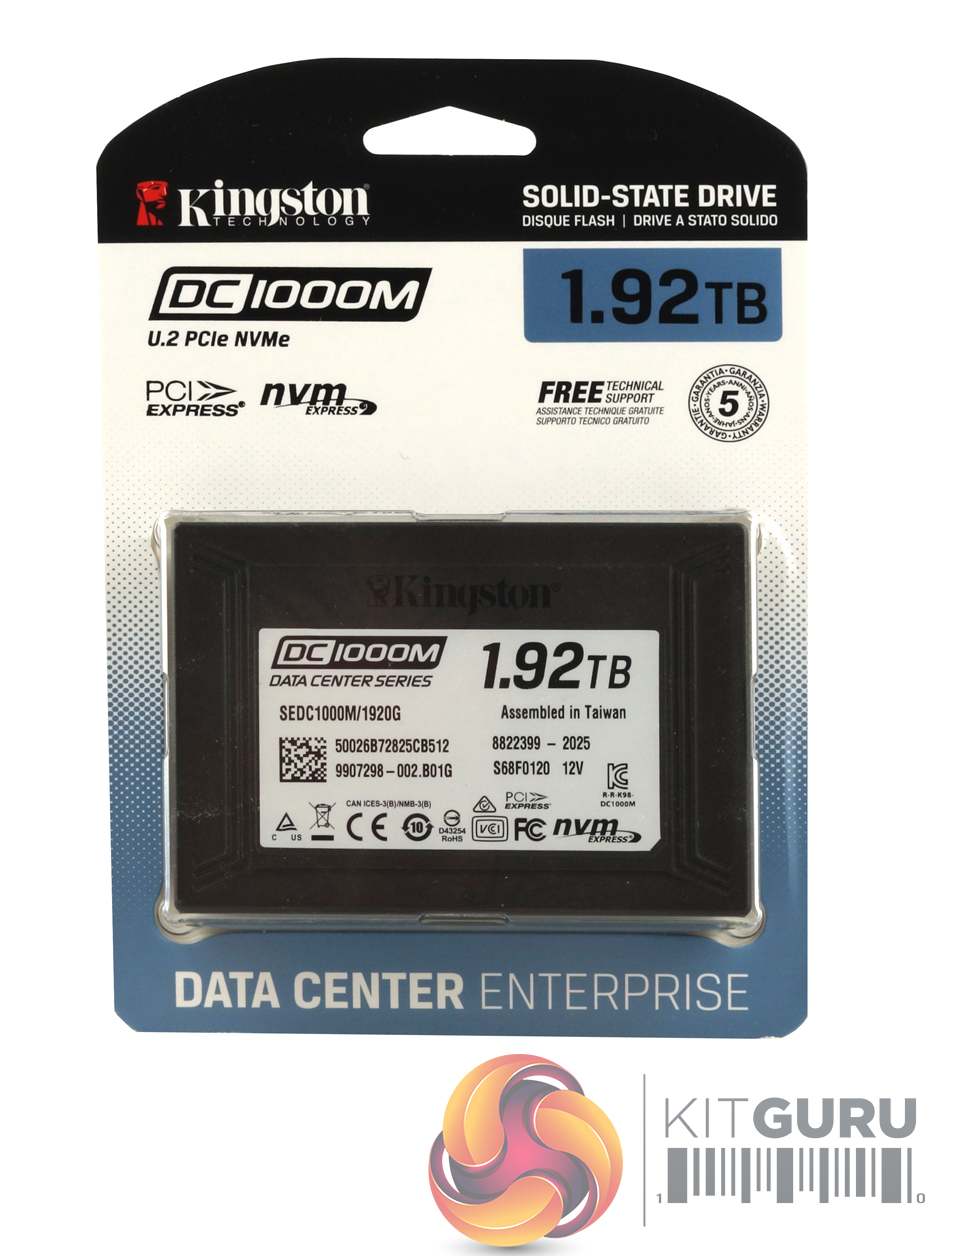
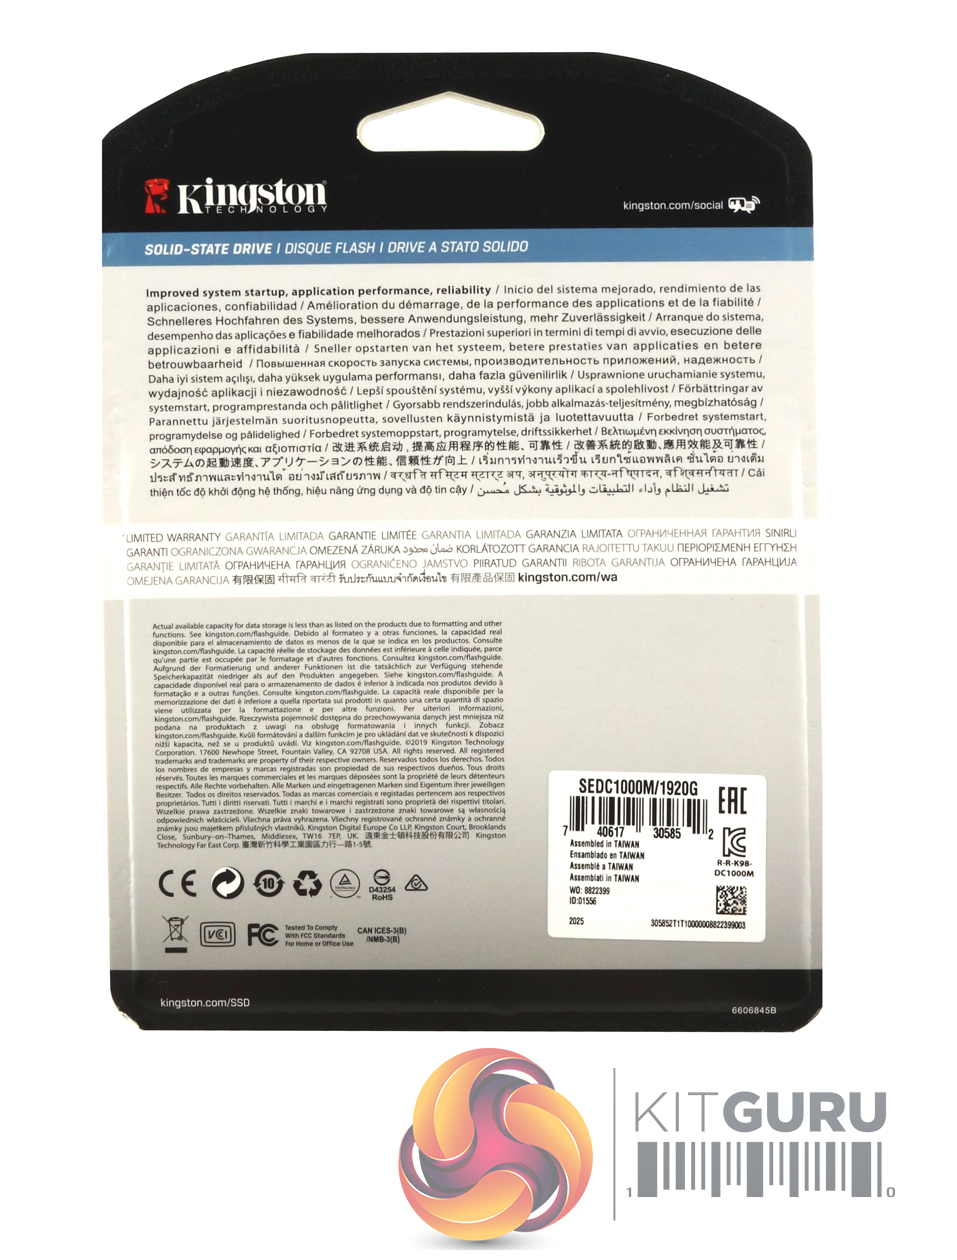
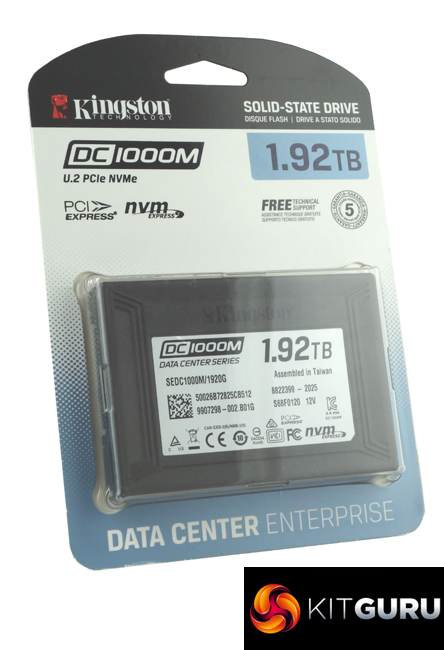
Unlike many other companies that deliver their data centre/enterprise drives in plain vanilla boxes, Kingston ships its drives in blister packs. The DC1000M's blister pack has the drive’s capacity clearly labelled on the front along with which market segment (s) the drive is aimed at, while the rear has multilingual marketing and warranty notes on it.
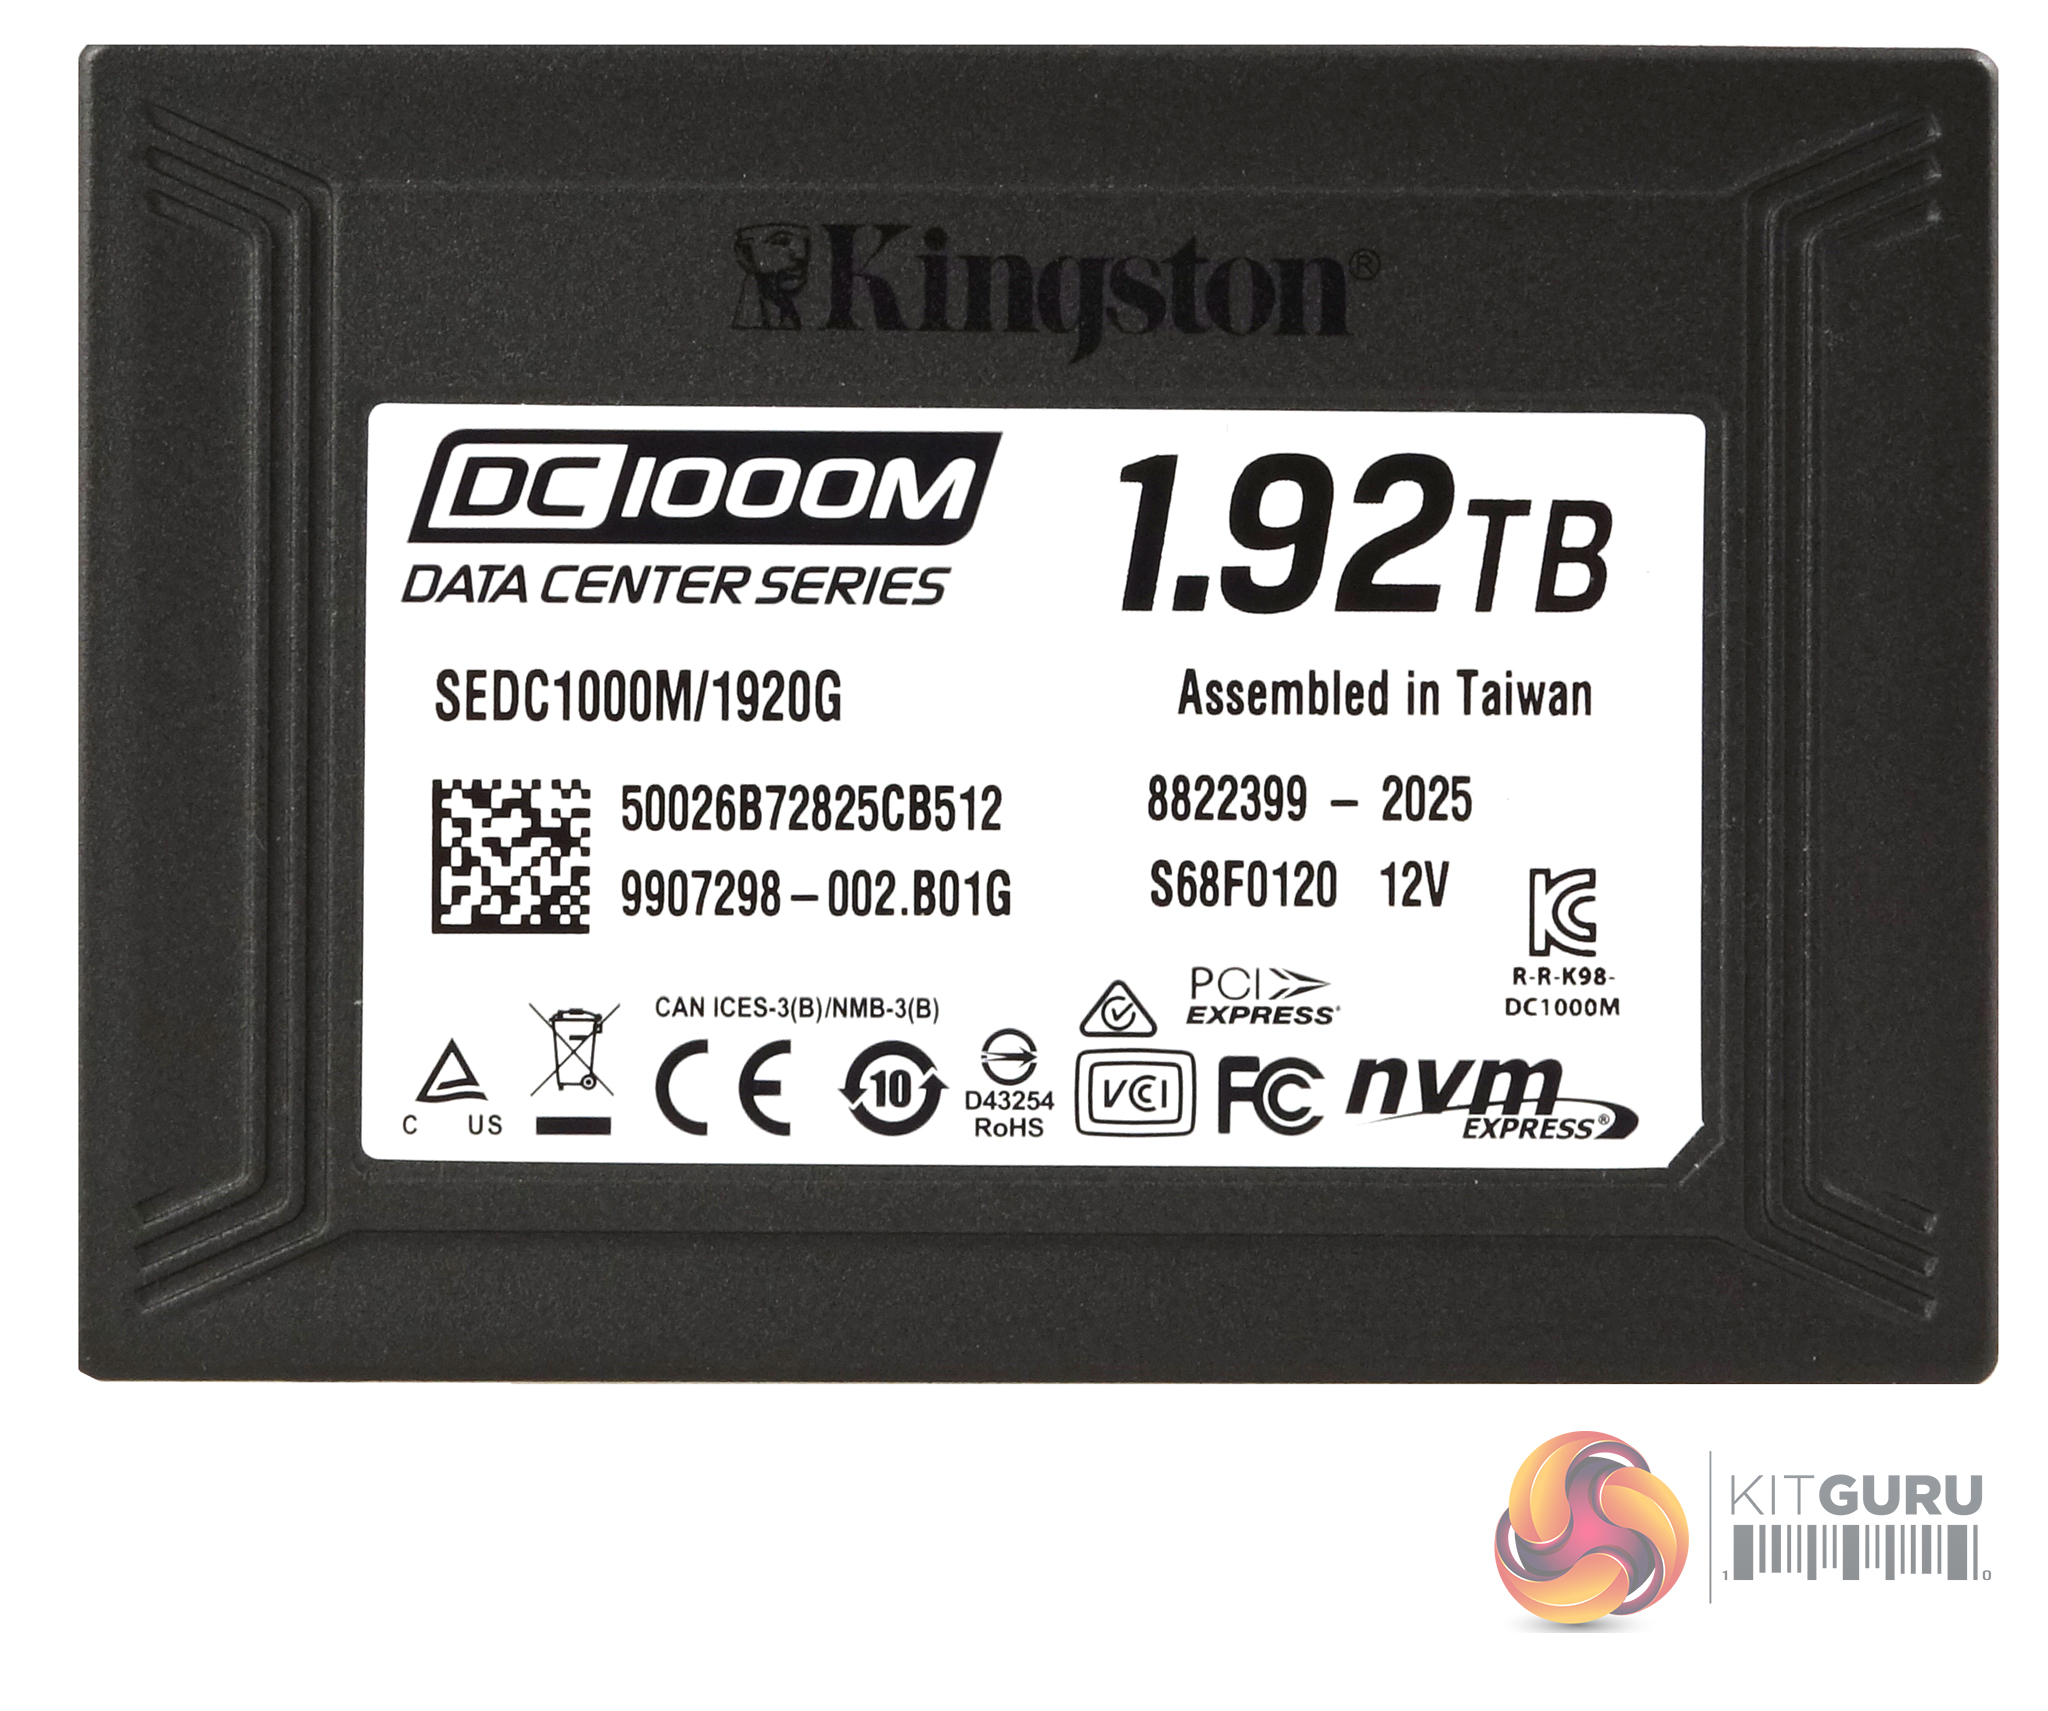
The drive is built on a 2.5in 15mm format and comes with a metal enclosure. At the heart of the DC1000M lies a Silicon Motion SM2270 16-channel controller which is combined with Kioxia BiCS3 64-layer 3D TLC NAND. The Silicon Motion SM2270 is a high-performance PCIe NVMe controller designed for data centre drives. The 16 channel controller features triple ARM Cortex R5 Dual-core CPUs and has a PCIe Gen3 x8 host interface and dual 32 bit DRAM data bus.
The controller supports 3D NAND and QLC NAND Flash technologies and features end-to-end data path protection, Error Correction Code and Silicon Motion’s 6th generation NANDXtend technology for error recovery.
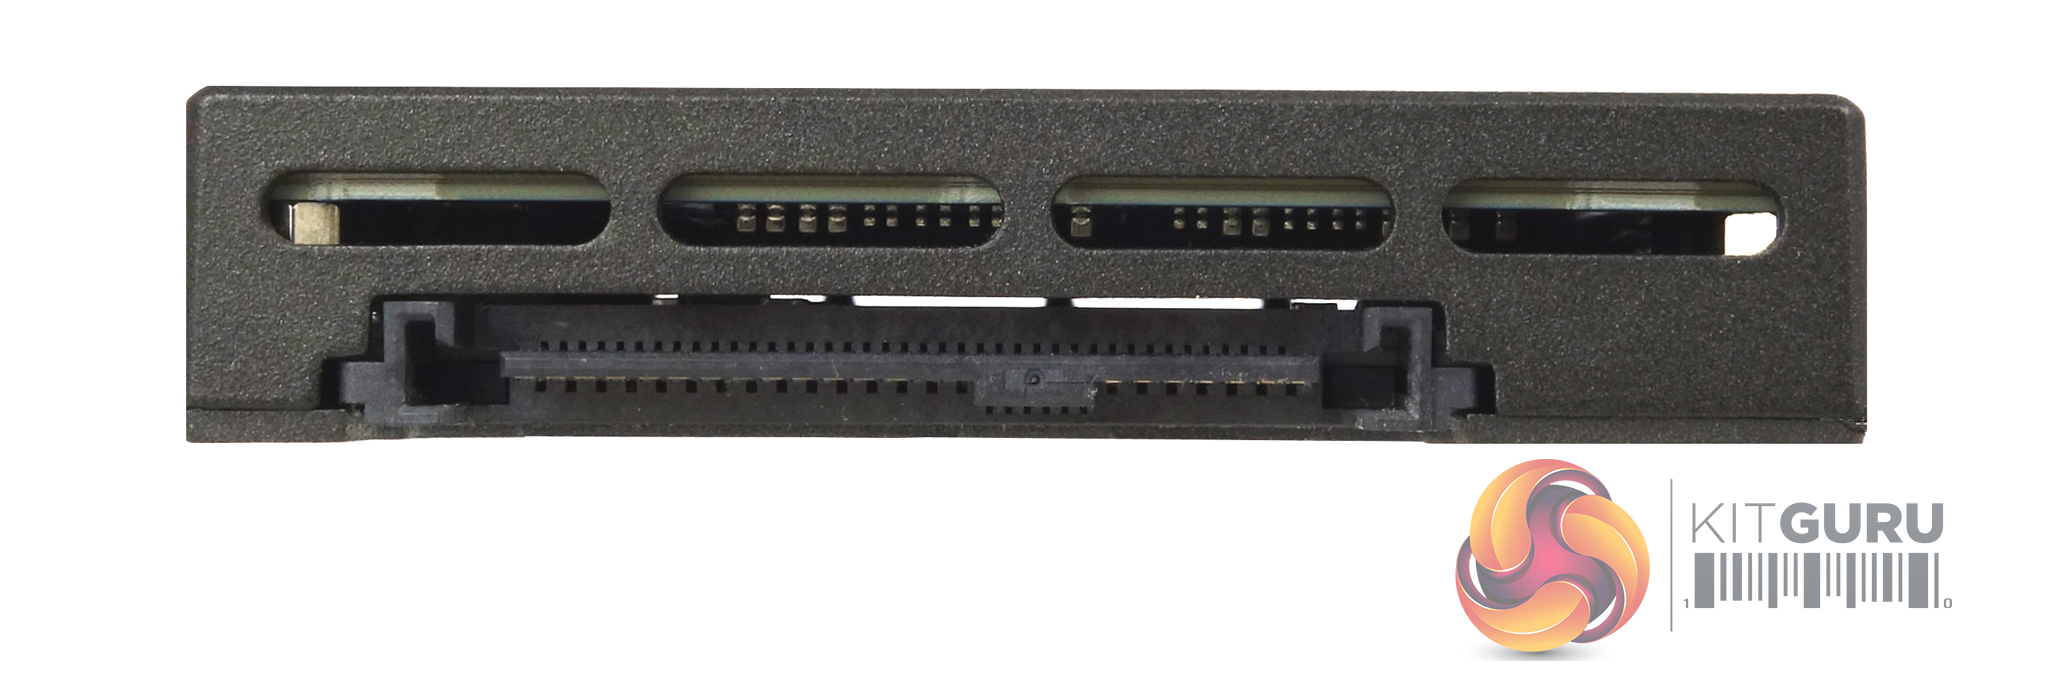
The drive uses a U.2 (PCIe NVMe Gen3 x4 ) interface which is hot-pluggable and compatible with U.2 server and data storage backplanes.
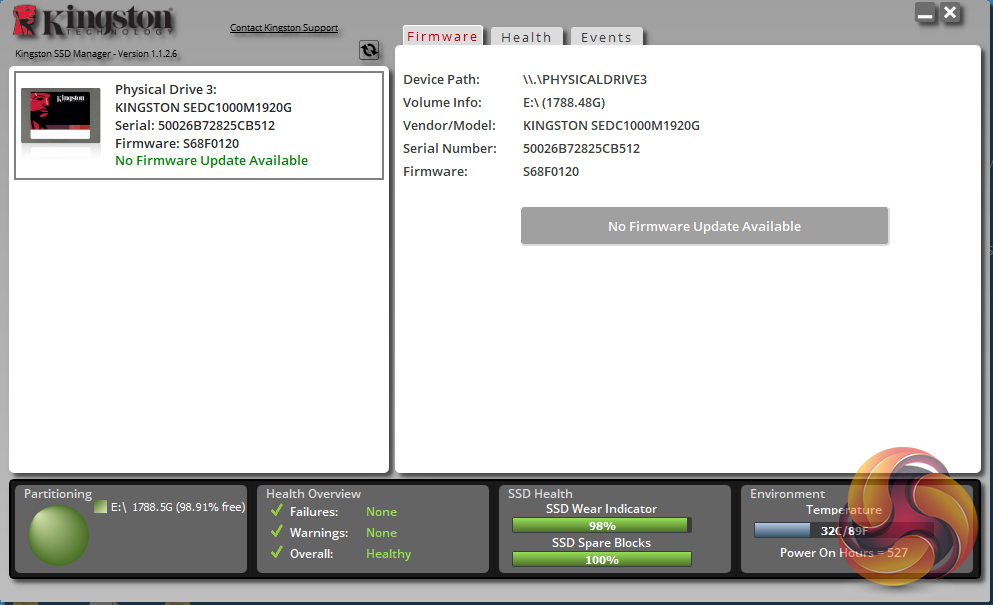
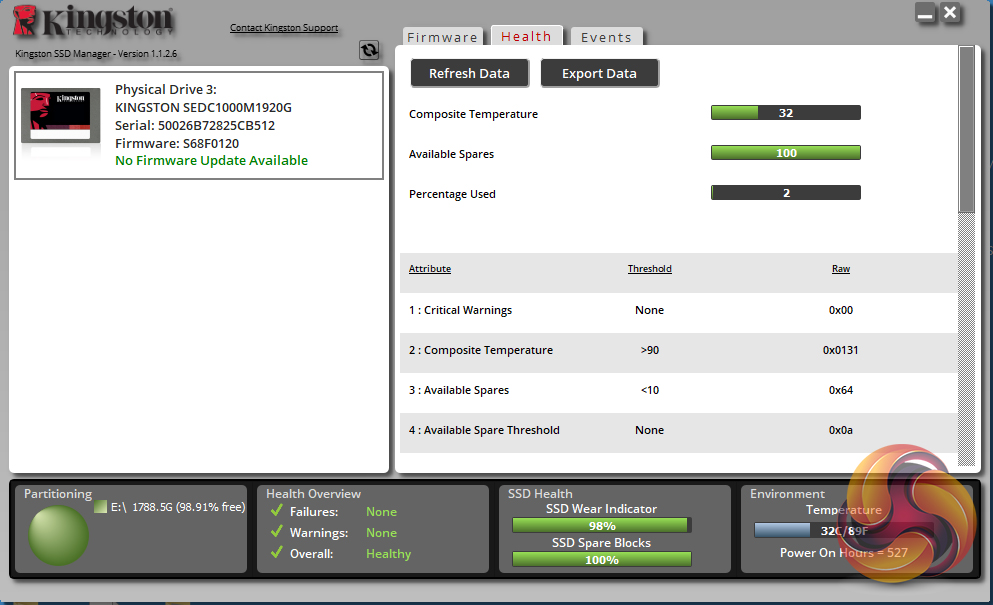
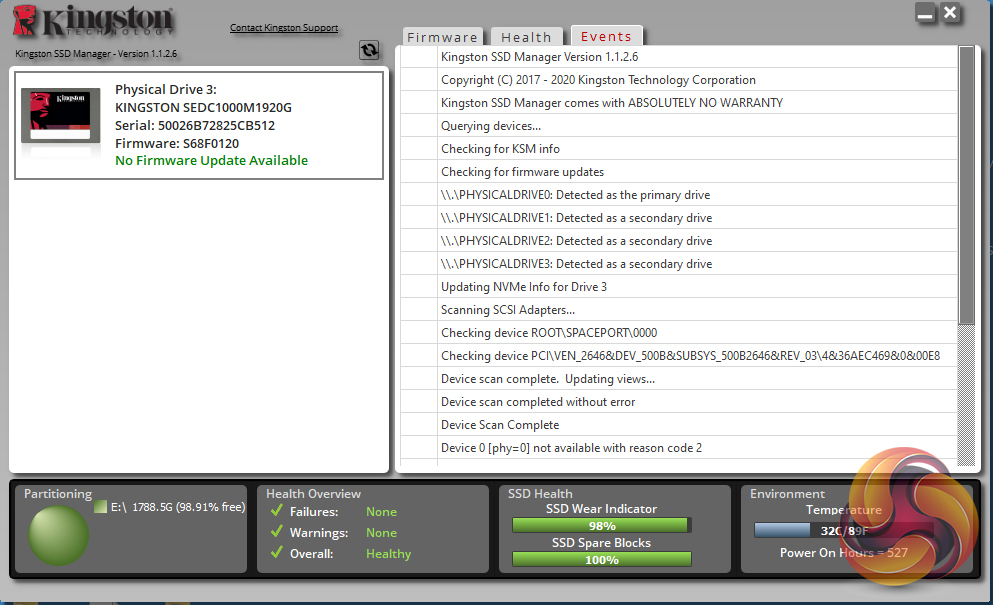
Kingston’s SSD management software utility is simply called SSD Manager. With it, you can monitor the health of the drive and how it’s being used, check the drive’s SMART data (including reliability tracking, usage statistics, life remaining, wear levelling and temperature) and update the firmware.
For testing, the drives are all wiped and reset to factory settings by HDDerase V4. We try to use free or easily available programs and some real-world testing so you can compare our findings against your own system.
This is a good way to measure potential upgrade benefits.
Main system:
Intel Core i7-7700K with 16GB of DDR4-3200 RAM, Sapphire R9 390 Nitro and an Asus Prime Z270-A motherboard.
Other Drives
Intel DCP4510 8TB
Intel Optane SSD DC P4800X 750GB
Kingston DCP1000 1.2TB (RAID 0 / RAID1)
Kingston DC1000B 480GB
Kingston KC1000 960GB
Software:
Atto Disk Benchmark 4.
IOMeter.
Futuremark PC Mark 10.
All our results were achieved by running each test five times with every configuration this ensures that any glitches are removed from the results. Trim is confirmed as running by typing fsutil behaviour query disabledeletenotify into the command line. A response of disabledeletenotify =0 confirms TRIM is active.
The ATTO Disk Benchmark performance measurement tool is compatible with Microsoft Windows. Measure your storage systems performance with various transfer sizes and test lengths for reads and writes. Several options are available to customize your performance measurement including queue depth, overlapped I/O and even a comparison mode with the option to run continuously.
Use ATTO Disk Benchmark to test any manufacturers RAID controllers, storage controllers, host adapters, hard drives and SSD drives and notice that ATTO products will consistently provide the highest level of performance to your storage.
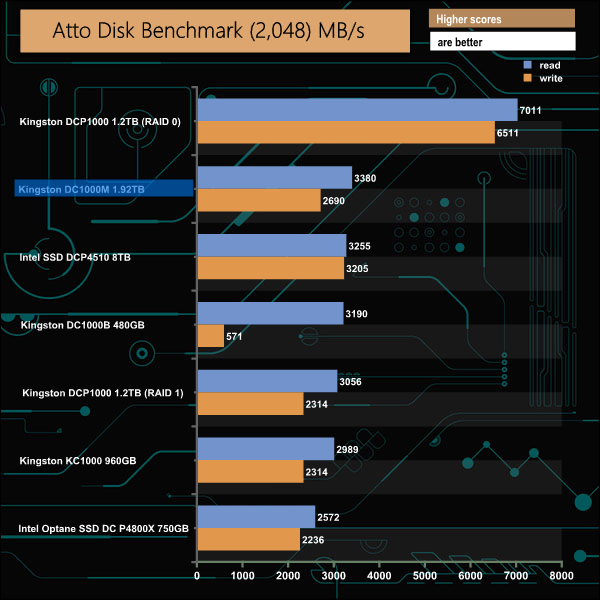
The 1.92TB DC1000M is rated up to 3,100MB/s for Sequential reads and up to 2,600MB/s for writes. Using the ATTO benchmark we could confirm both those figures with the tested drive producing a read figure of 3,380MB/s, some 280MB/s over the official speed with writes at 2,690MB/s.
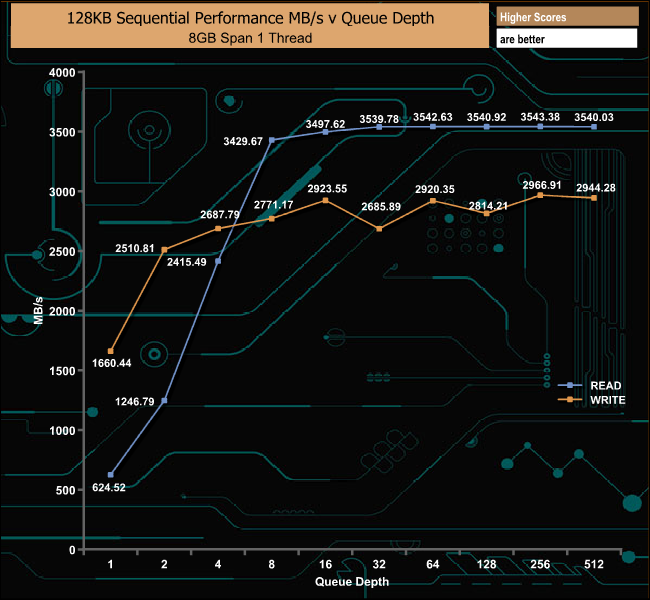
When we tested the DC1000M with our own Sequential tests we saw a peak read score of 3,543.38MB/s (QD256), bettering the official 3,100MB/s by some 443MB/s. Writes peaked at 2,966.91MB/s (QD256), some 366MB/s faster than the official rating of 2,600MB/s.
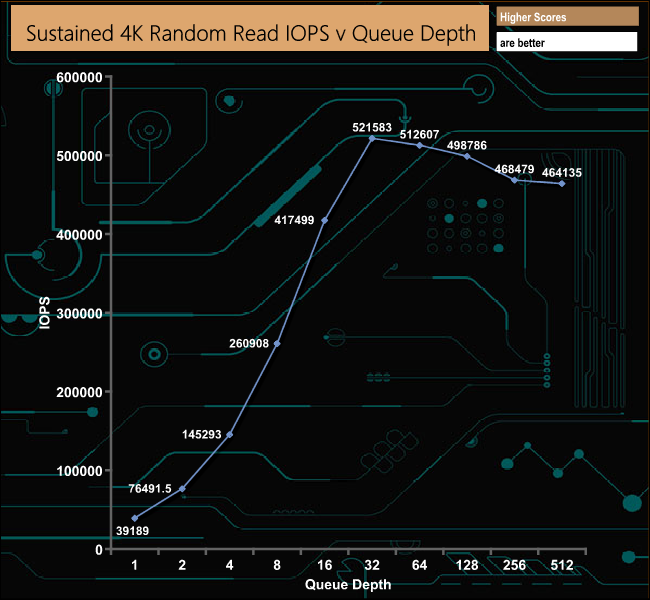
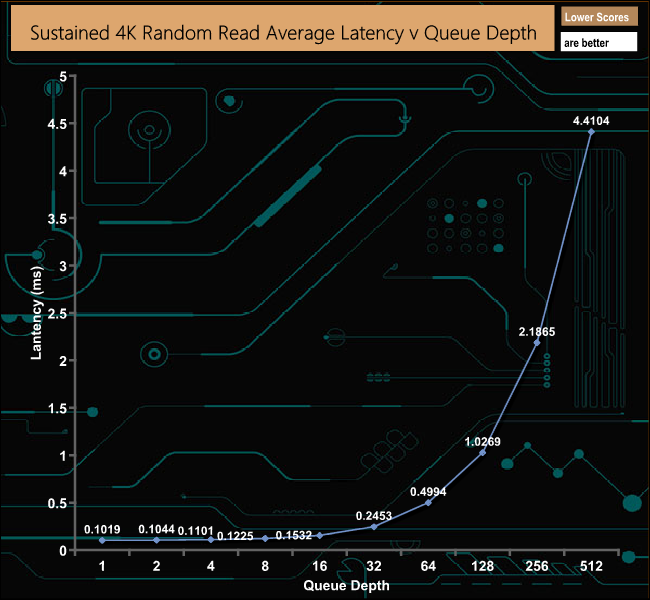
Kingston rate the DC1000M's 4K random read performance as up to 540,000 IOPS. When tested with our four threaded tests, the best result we saw was 521,583 IOPS at a queue depth of 32. After peaking at QD32 the performance slowly drops away, to finish the test runs at 464,135 IOPS at a queue depth of 512. We did a quick test at QD32 but with 8 threads and saw a peak maximum figure of 611.539 IOPS.
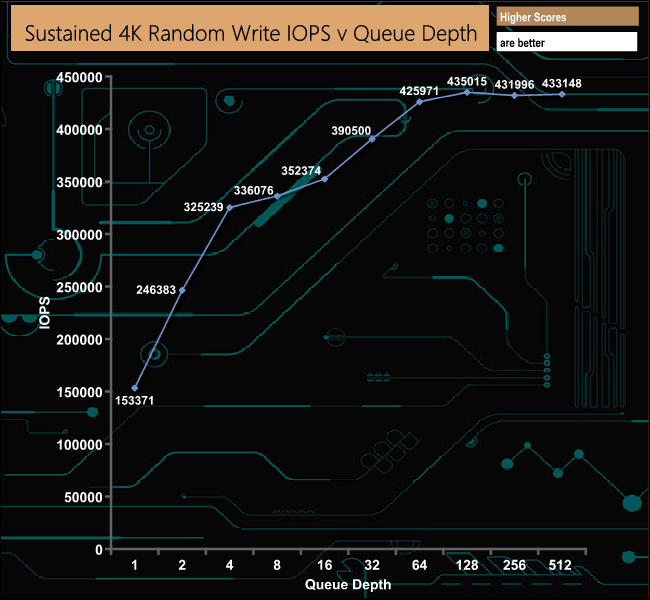
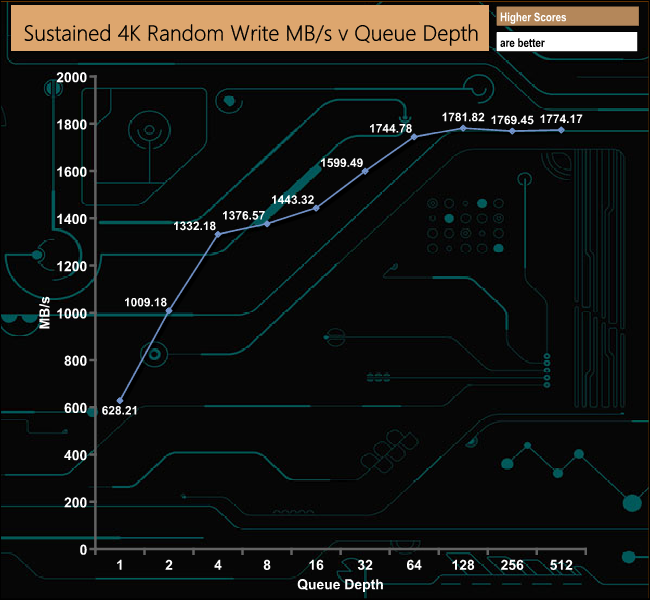
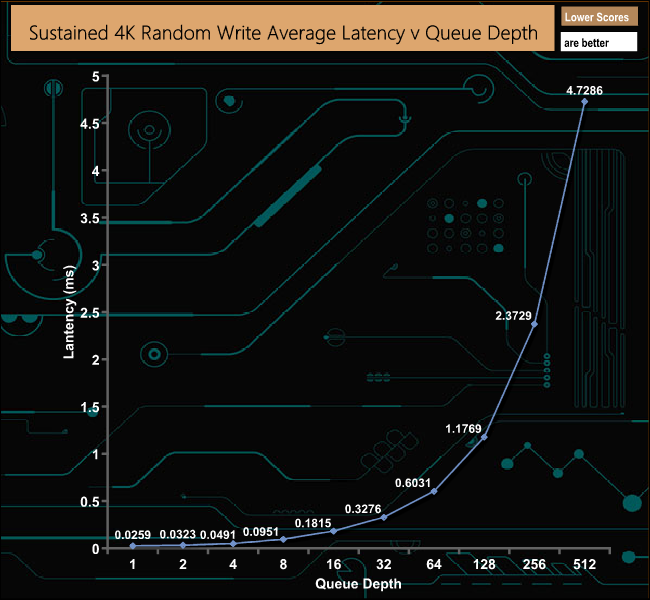
The 1.92TB DC1000M is officially rated as up to 205,000 IOPS for random writes which, after testing the drive with our 4-threaded tests seems to be a very conservative figure as the drive produced a peak of 435,015 IOPS at a queue depth of 128. Apart from QD1 (153,371 IOPS), the drive bettered the official maximum IOPS rating through every tested QD.

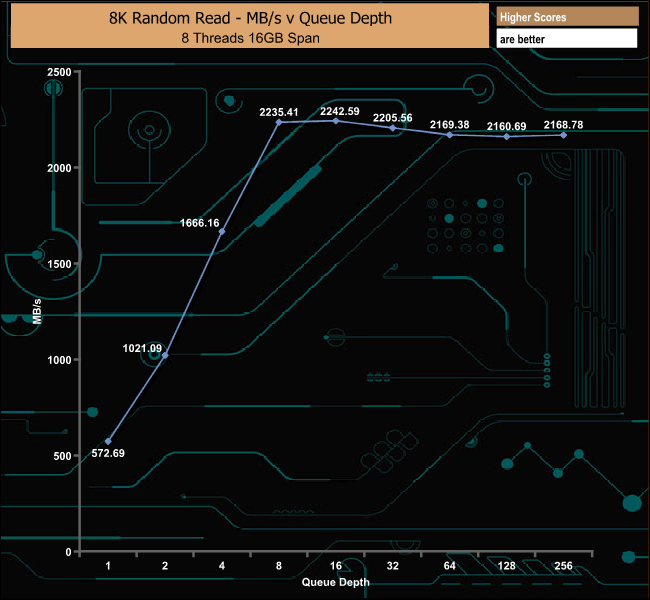
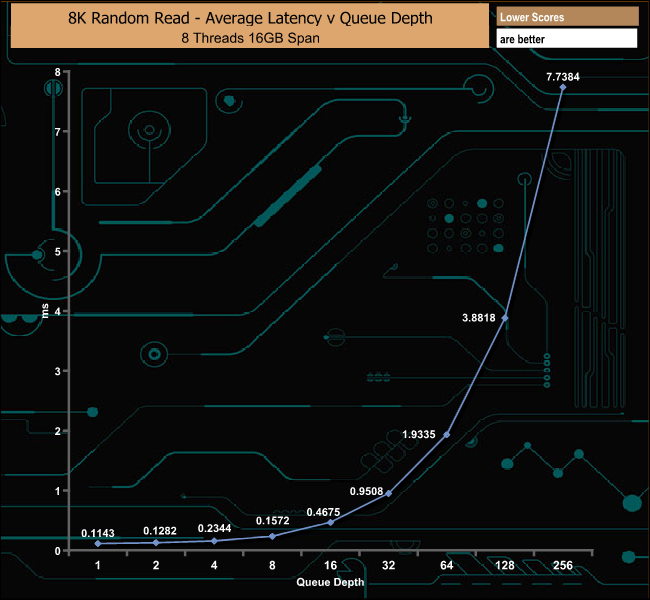
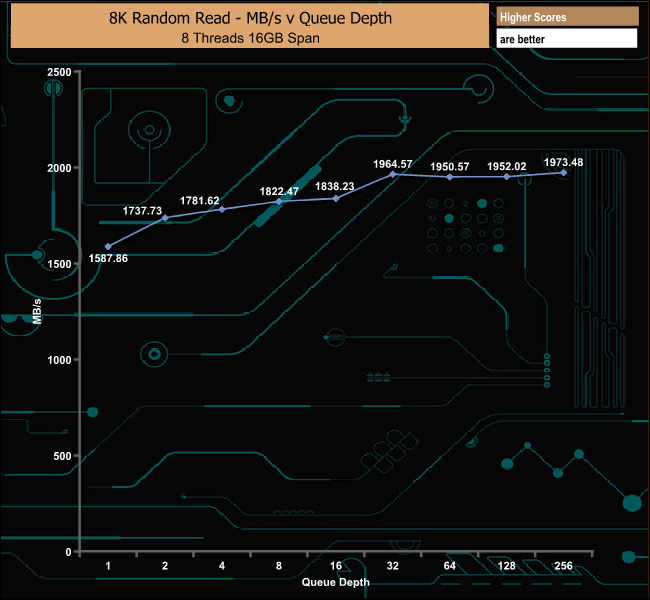
As the DC1000M has been designed for use in data centres we also tested the drive using 8K data. In our read test, the drive topped out at 273,754 IOPS (QD16) before slowly dropping back to finish the test run at 264,744 IOPS at QD256.
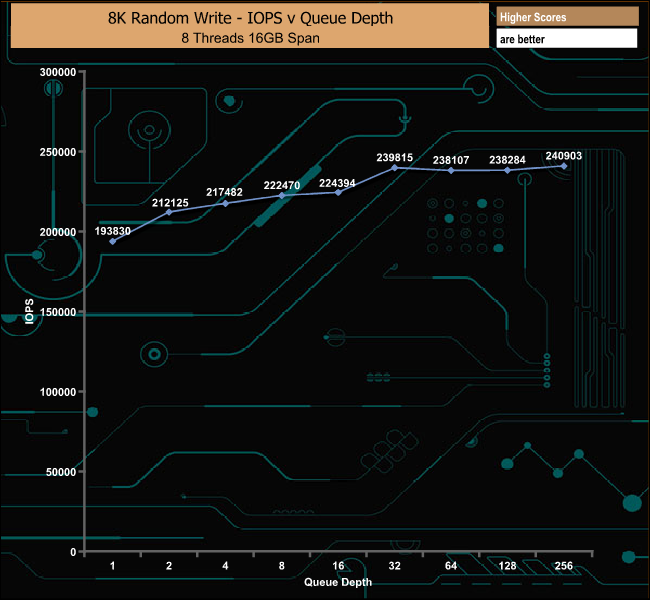
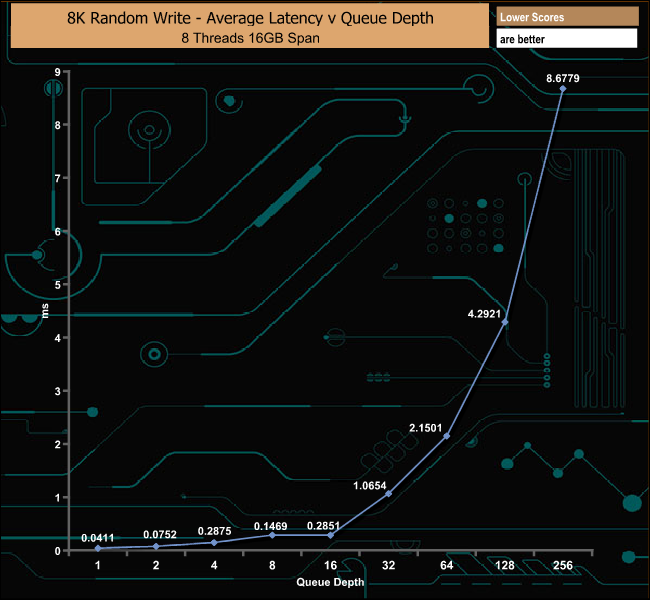
In the 8K write test, the DC1000M peaked at the end of the test run at 240,903 IOPS at QD256. Using 8K data blocks the drive is, after QD1, pretty consistent in its performance from QD's 2 to16 and again from QD32 to QD256.
4K Random 70/30 Mix Read/Write
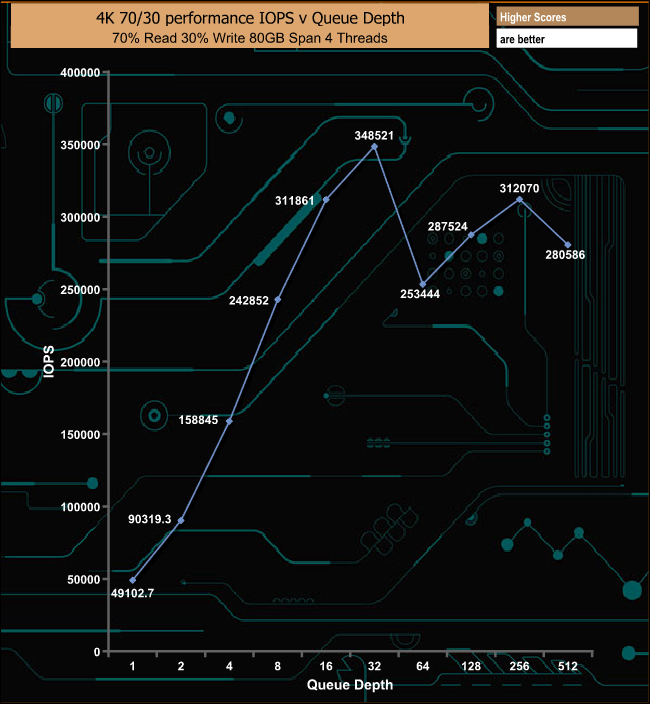
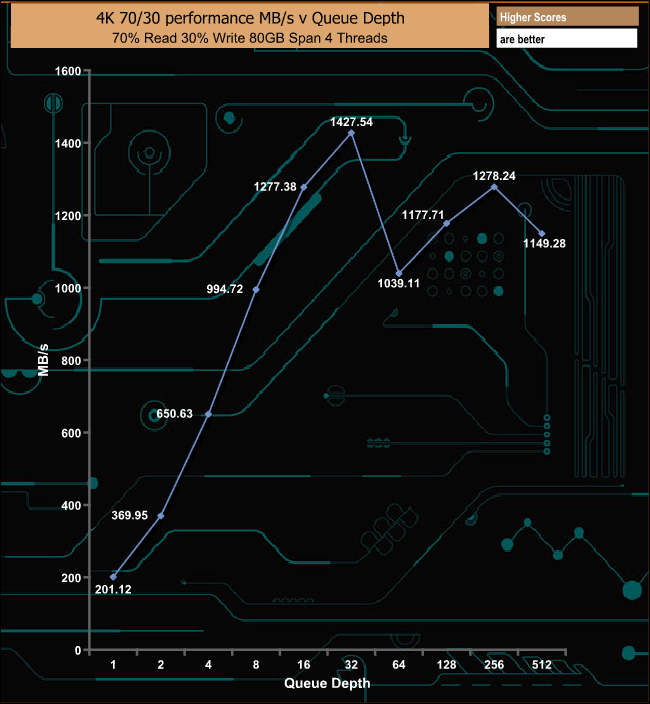
In the mixed 4K 70/30 read/write test the drive climbs steadily from QD1 up to when it peaks at QD32 (348,521 IOPS). After this point, the performance is somewhat erratic until the end of the test at QD512.
8K Random 70/30 Mix Read/Write
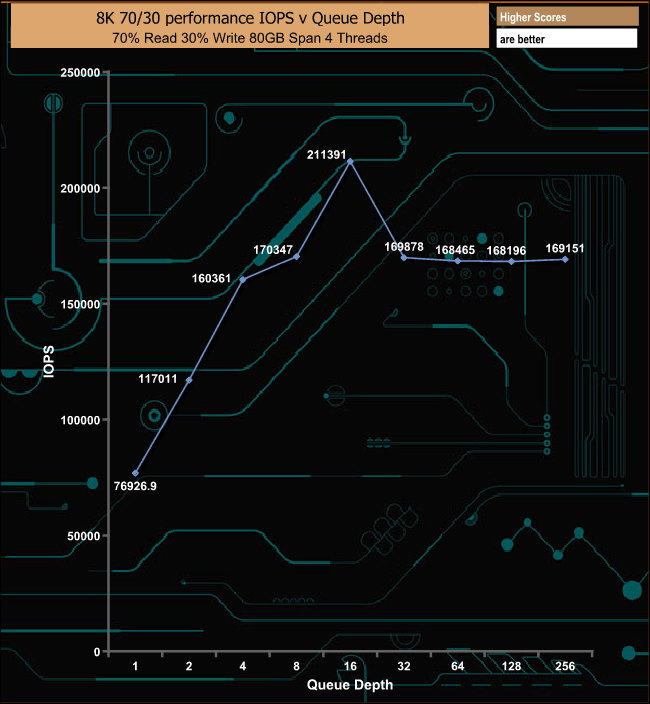
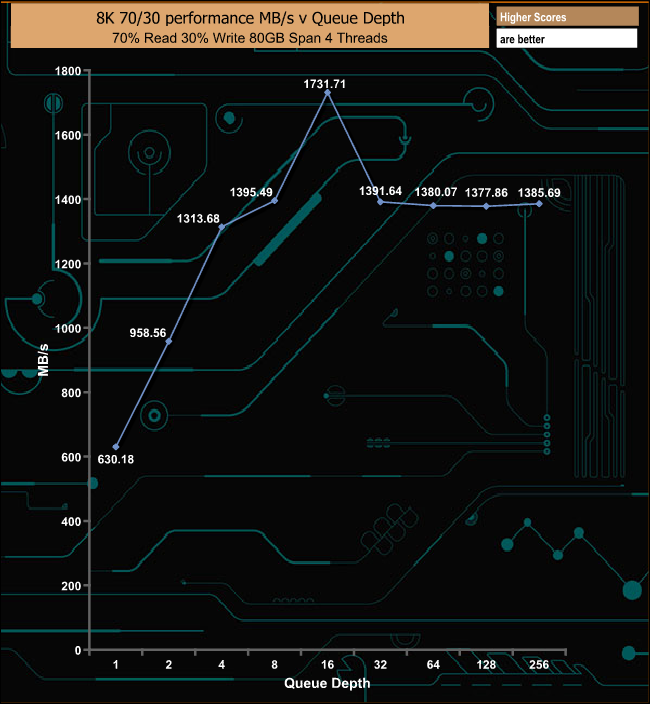
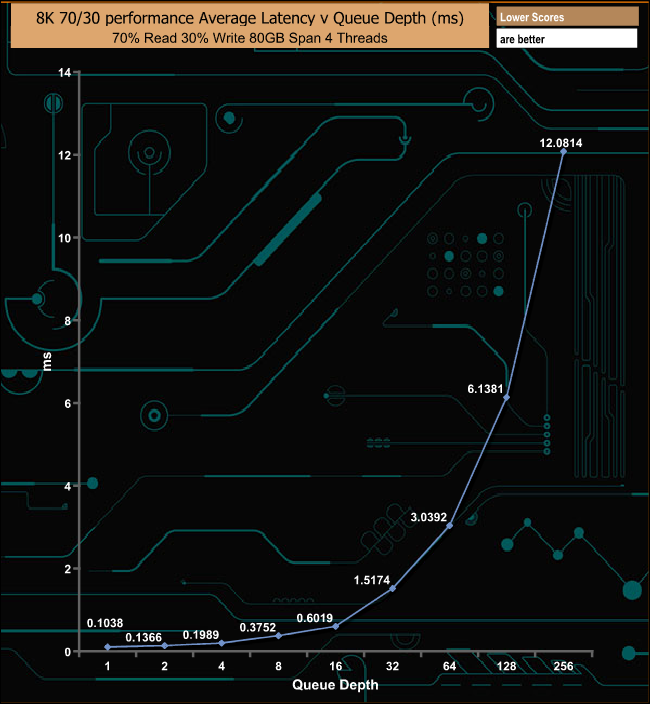
In the 8K test the peaks earlier than the 4K test at a QD of 16. As with the 4K 70/30 test the performance drops off but this time is much more consistent through the remainder of the test.
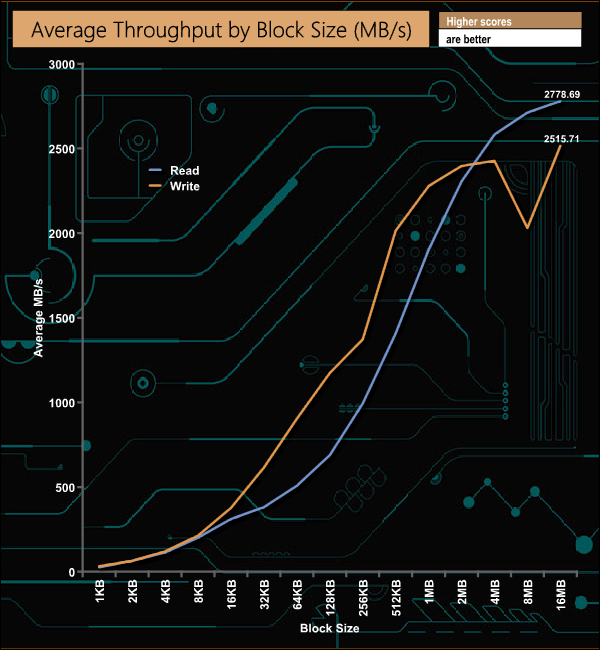
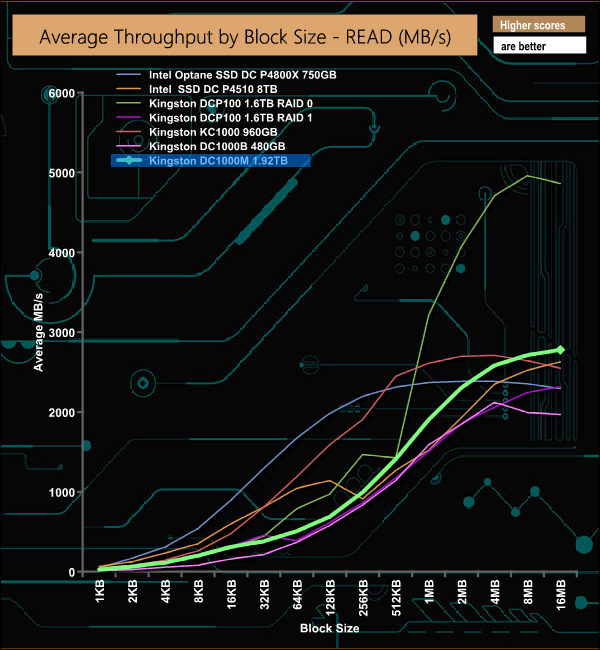
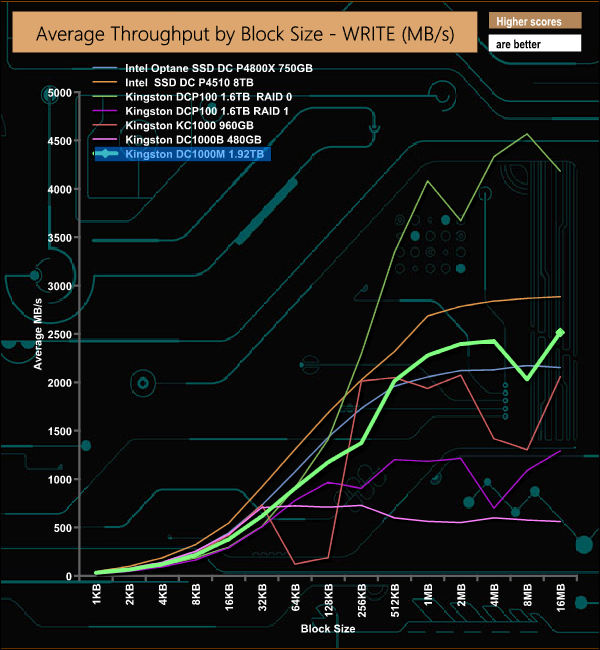
In our throughput tests the peak read performance at 2,778,59MB/s doesn't quite get to the maximum official figure of 3,100MB/s. The write throughput peak falls short as well but this time is much closer to the official 2,600MB/s at 2,515.71MB/s.
We also tested the drive in a number of workload scenarios that it might face in real life. The IOMeter settings we used to test with are listed below:-
Database 8K 8Threads QD64
Transfer Size: 8K Reads: 67% Writes: 33% Random: 100%
Boundary: 4K Outstanding IO: 64 Threads/Workers: 8
Decision Support DB
Transfer Size: 1MB Reads: 100% Writes: 0% Random: 100%
Boundary: 4K Outstanding IO: 64 Threads/Workers: 8
Digital Video Surveillance
Transfer Size: 512K Reads: 90% Writes: 10% Sequential: 100%
Boundary: 512K Outstanding IO: 64 Threads/Workers:8
Exchange Server 2007
Transfer Size: 8K Reads: 67% Writes: 33% Random: 100%
Boundary: 8K Outstanding IO: 60 Threads/Workers: 1
Mail Server
Transfer Size: 32K Reads: 58% Writes: 42% Random: 95%
Boundary: 4K Outstanding IO: 64 Threads/Workers: 8
Microsoft VM
Transfer Size: 4K Reads: 100% Writes: 0% Random: 80%
Boundary: 2K Outstanding IO: 64 Threads/Workers: 1
OS Paging
Transfer Size: 64K Reads: 90% Writes: 10% Sequential: 100%
Boundary: 4K Outstanding IO: 64 Threads/Workers:1
Video On Demand
Transfer Size: 128K Reads: 100% Writes: 0% Random: 100%
Boundary: 4K Outstanding IO: 512 Threads/Workers: 8
Web File Server 64KB
Transfer Size: 64K Reads: 95% Writes: 5% Random: 75%
Boundary: 4K Outstanding IO: 64 Threads/Workers: 8
Web File Server 8KB
Transfer Size: 8K Reads: 95% Writes: 5% Random: 75%
Boundary: 4K Outstanding IO: 64 Threads/Workers: 8
Web File Server 4KB
Transfer Size: 4K Reads: 95% Writes: 5% Random: 75%
Boundary: 4K Outstanding IO: 64 Threads/Workers: 8
Workstation
Transfer Size: 8K Reads: 80% Writes: 20% Random: 80%
Boundary: 8K Outstanding IO: 64 Threads/Workers: 4
VDI Light
Transfer Size:10K Reads: 15% Writes: 85% Random: 100%
Boundary: 2K Outstanding IO: 4 Threads/Workers: 1
VDI Medium
Transfer Size:10K Reads: 15% Writes: 85% Random: 100%
Boundary: 2K Outstanding IO: 8 Threads/Workers: 1
VDI Heavy
Transfer Size:10K Reads: 15% Writes: 85% Random: 100%
Boundary: 2K Outstanding IO:12 Threads/Workers: 1
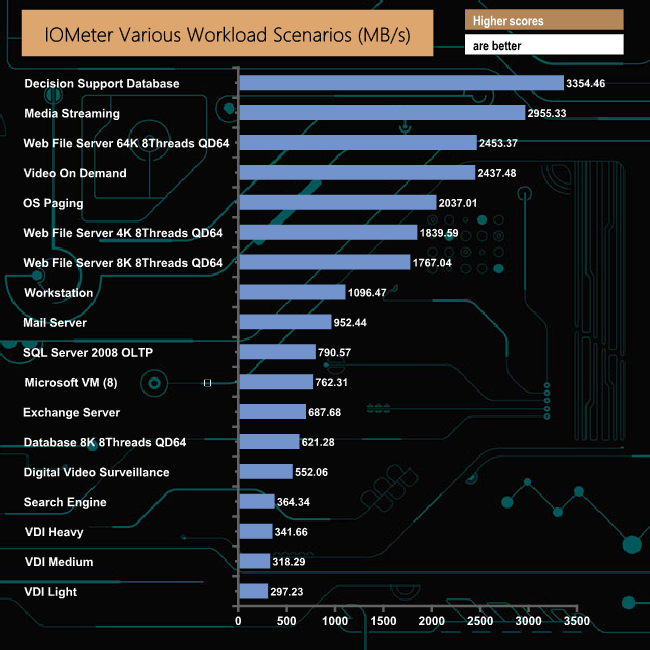
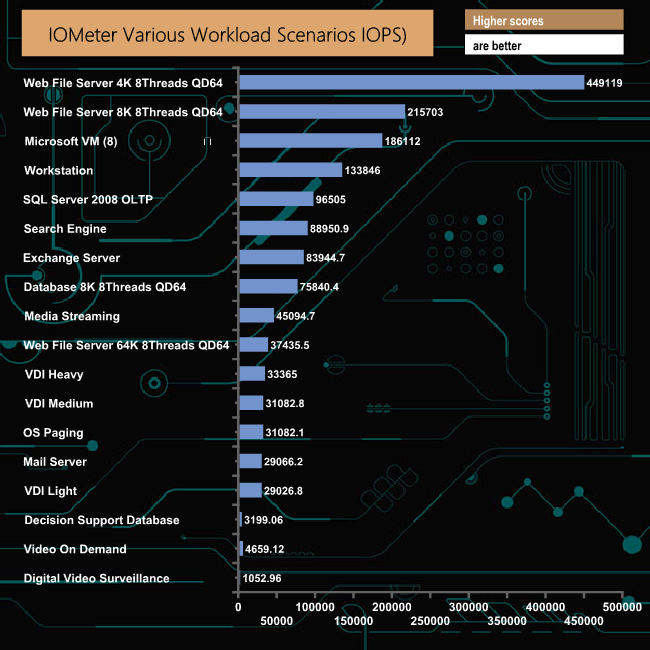
As you might expect for a drive designed to handle most of these scenarios, the DC1000M tackles these tests very efficiently with some strong bandwidth figures as a result.
The PCMark 10 Full System Drive Benchmark uses a wide-ranging set of real-world traces from popular applications and common tasks to fully test the performance of the fastest modern drives. The benchmark is designed to measure the performance of fast system drives using the SATA bus at the low end and devices connected via PCI Express at the high end.
The goal of the benchmark is to show meaningful real-world performance differences between fast storage technologies such as SATA, NVMe, and Intel’s Optane. The Full System Drive Benchmark uses 23 traces, running 3 passes with each trace. It typically takes an hour to run.
Traces used:
Booting Windows 10.
Adobe Acrobat – starting the application until usable.
Adobe Illustrator – starting the application until usable Adobe Premiere Pro – starting the application until usable.
Adobe Photoshop – starting the application until usable.
Battlefield V – starting the game until the main menu.
Call of Duty Black Ops 4 – starting the game until the main menu.
Overwatch – starting the game until main menu.
Using Adobe After Effects.
Using Microsoft Excel.
Using Adobe Illustrator.
Using Adobe InDesign.
Using Microsoft PowerPoint.
Using Adobe Photoshop (heavy use).
Using Adobe Photoshop (light use).
cp1 Copying 4 ISO image files, 20 GB in total, from a secondary drive to the target drive (write test).
cp2 Making a copy of the ISO files (read-write test).
cp3 Copying the ISO to a secondary drive (read test).
cps1Copying 339 JPEG files, 2.37 GB in total, to the target drive (write test).
cps2 Making a copy of the JPEG files (read-write test).
cps3 Copying the JPEG files to another drive (read test).
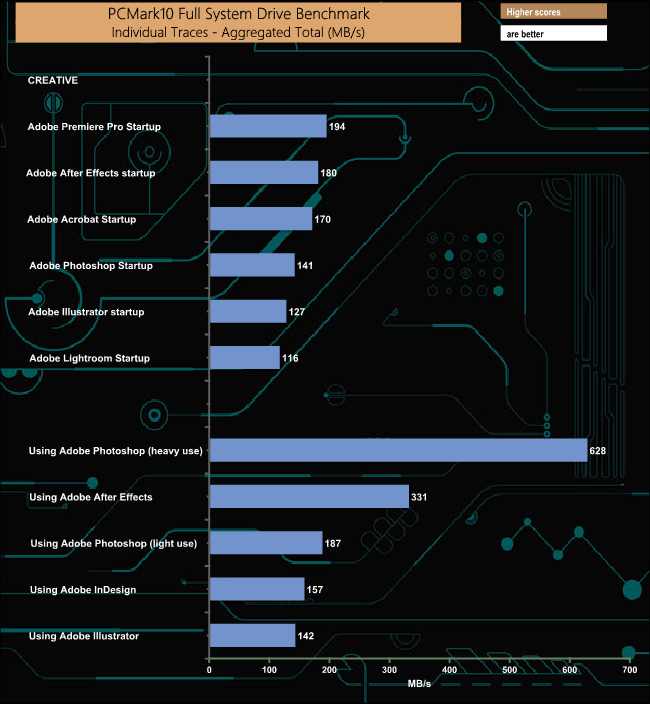
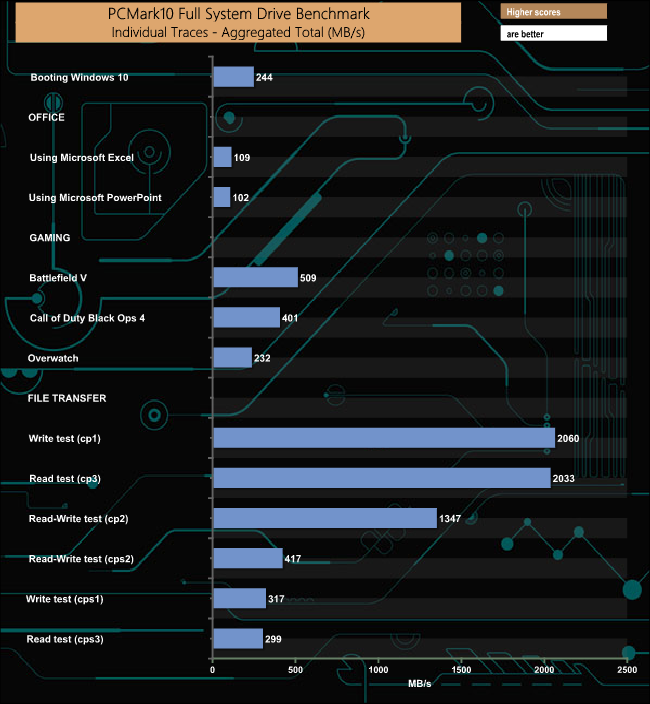
The DC1000M handles the test traces in PCMark 10 Full System Drive Benchmark without any problems. Best bandwidth figures come in Adobe Photoshop (heavy use) and the cp1 and cp2 read and write tests.
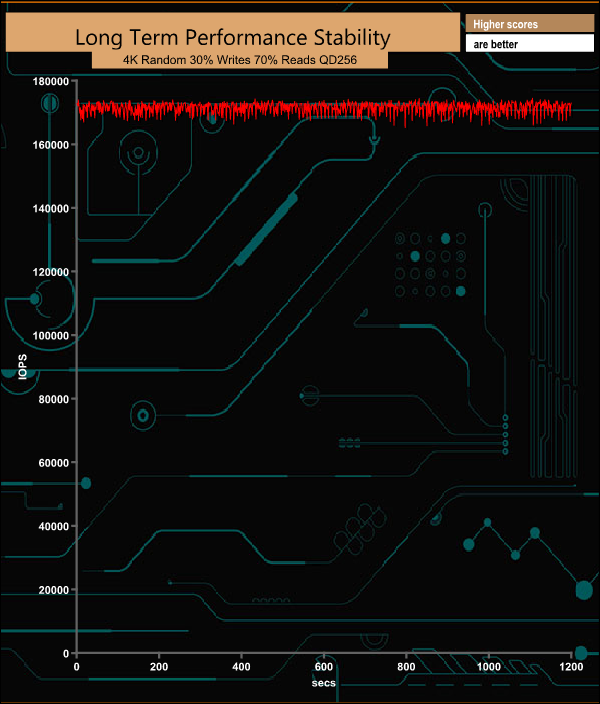
For the long term performance stability test, we set the drive up to run a 20-minute 4K random test with a 30% write, 70% read split, at a Queue Depth of 256 over the entire disk. The DC1000M averaged 171,579 IOPS for the test with a performance stability of 98% which is what you should expect from a drive aimed at the data centre market segment.
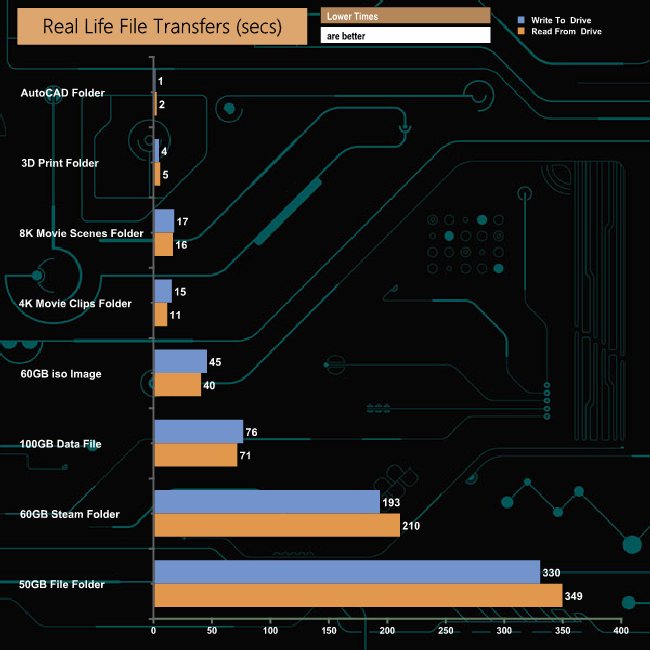
To test real-life performance of a drive we use a mix of folder/file types and by using the FastCopy utility (which gives a time as well as MB/s result) we record the performance of drive reading from & writing to a 256GB Samsung SSD850 PRO.
We use the following folder/file types:
- 100GB data file.
- 60GB iso image.
- 60GB Steam folder – 29,521 files.
- 50GB File folder – 28,523 files.
- 21GB 8K Movie demos – (11 demos)
- 16GB 4K Raw Movie Clips – (9 MP4V files).
- 4.25GB 3D Printer File Folder – (166 files – 105 @ .STL, 38 @ .FBX, 11 @ .blend, 5 @ .lwo, 4 @ .OBJ, 3@ .3ds).
- 1.5GB AutoCAD File Folder (80 files – 60 @ .DWG and 20 @.DXF).
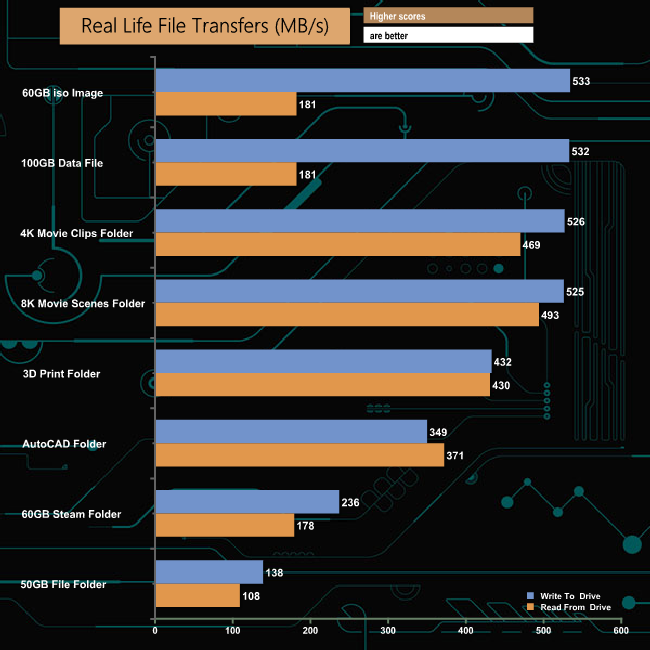
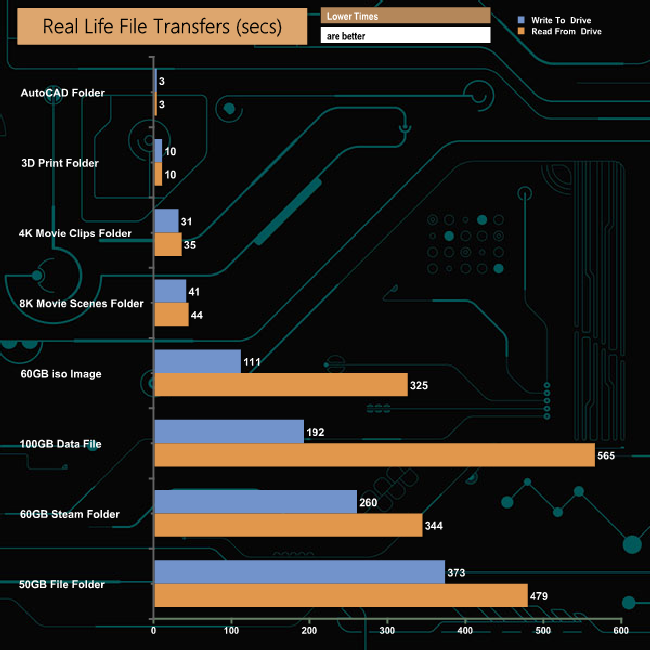
Our real-life file transfer tests posed little problem for the DC1000M as it handled most of them very efficiently. As always it’s the 50GB file folder transfer that slows down the drive.
To get a measure of how much faster the drive can be reading and writing to another NVMe drive we use the same files but transfer to and from a 512GB Toshiba OCZ RD400:
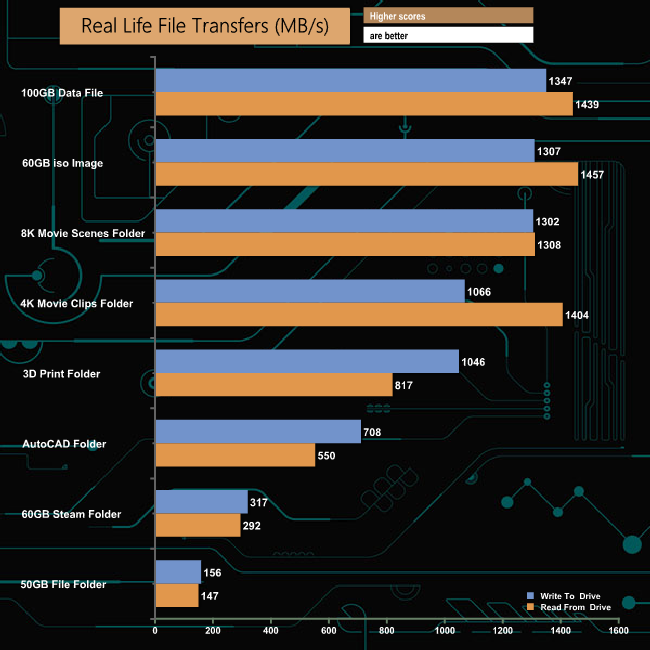
Taking the SATA drive out of the equation allows the DC1000M to show a bit more of what it’s capable of. Best write performance came with the 100GB Data File transfer at 1,347MB/s while the best read performance came with the 60GB iso transfer at 1,457MB/s.
Kingston’s DC1000M drive has been designed for mixed-use workloads in the data centre and enterprise environments. As such, the drive implements Kingston’s QoS (Quality of Service) requirements to ensure predictable random I/O performance and low latencies over a wide range of read and write workloads. The DC1000M range consists of four drives (at the time of writing) from the entry-level 960GB drive through 1.92TB and 3.84TB models to the huge 7.68TB flagship drive.
At the heart of the DC1000M lies a Silicon Motion SM2270 16-channel controller which is combined with Kioxia BiCS3 64-layer 3D TLC NAND. The drive uses a U.2 (PCIe NVMe Gen3 x4 ) interface which is hot-pluggable and compatible with U.2 backplanes of storage systems and enterprise servers.
Kingston quotes Sequential read/write figures for the 1.92TB DC1000M as up to 3,100MB/s and 2,600MB/s respectively. Incidentally, that read figure is the same across the range (write performance for the rest of the range is quoted as 1,330MB/s for the 960GB, 2,700MB/s for the 3.84TB drive and 2,800MB/s for the flagship 7.68TB drive).
We confirmed both official figures with the ATTO benchmark, the review drive producing a read figure of 3,380MB/s and 2,690MB/s for writes. Using our own Sequential tests we saw a peak read score of 3,543.38MB/s (QD256) with writes peaked at 2,966.91MB/s (QD256).
Random 4K performance for the 1.92TB drive is quoted as up to 540,000 IOPS for reads and up to 205,000 IOPS for writes. Using our standard 4-threaded tests, we saw a peak read figure of 521,583 IOPS at a queue depth of 32, not that far away from that maximum figure. When it came to write performance the best we saw from the drive was 435,015 IOPS (QD128) far, far exceeding the official 205,000 IOPS. However switching over to using 8K data, the drive peaked at 240,903 IOPS (QD256) much, much closer to the official figure.
As you might expect the DC1000M comes with a wealth of enterprise-class features including; power loss protection (PLP), telemetry monitoring for increased data centre reliability and end-to-end data path protection. As for the drive's endurance, Kingston rate the 1.92TB drive at 3362TBW which works out at 1 Drive Write Per Day (DWPD) over the 5-year length of the drive's warranty.
We found the 1.92TB Kingston DC1000M on Span.com for £446.40 inc VAT) HERE.
Discuss on our Facebook page HERE.
Pros
- Overall Performance.
- Endurance.
Cons
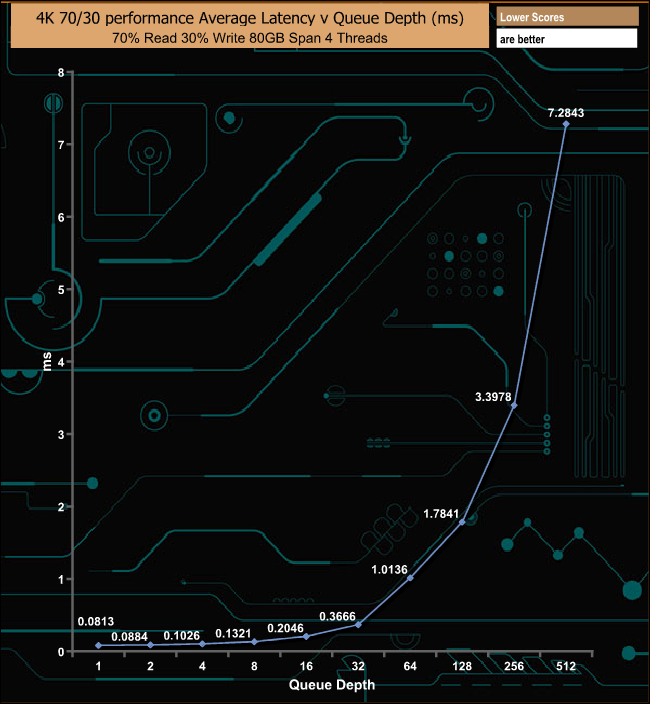
- Inconsistent performance in our 4K 70/30 read/write tests at deeper queue depths.
- Pricey.
KitGuru says: Kingston’s DC1000M range offers useful capacity sizes, ending up at a huge 7.68TB model. The drive has the hardware power protection, end to end data protection and enterprise-grade performance stability IT managers demand from an SSD of this class.