The latest addition to Kingston's range of SSD's is the KC2000 M.2 NVMe drive. Sitting under both the company's consumer and business banners - the KC2000 uses the latest Toshiba 96-layer NAND in combination with Silicon Motion's newest SM2262EN controller. As well as using the latest Toshiba BiCS4 96-layer 3D TLC NAND and Silicon Motion's SM2262EN controller, it's also a self-encrypting drive using 256-bit AES Hardware-based encryption to support end-to-end data protection. Currently, there are four capacities making up the KC2000 product line; 250GB, 500GB, 1TB (the drive we are reviewing here) and the flagship 2TB model. Performance wise the 1TB and 2TB drives have the same up to 3,200MB/s Sequential read and up to 2,200MB/s write ratings. The two smaller drives in the range share the same 3,000MB/s read figure with the 500GB drive rated as up to 2,000MB/s for writes with the 250GB drive making do with a 1,100MB/s write rating. Random 4K performance for the 1TB drive is stated as up to 350,000 IOPS for reads and up to 275,000 IOPS for writes. The 2TB model is a slower drive with reads and writes both quoted as up to 250,000 IOPS. The 250GB and 500GB drives share the same up to 350,000 IOPS read rating with writes given as up to 200,000 IOPS for the 250GB drive and 275,000 IOPS for the 500GB drive. The endurance figure given for the 1TB drive is 600TBW and Kingston back the drive with a 5-year warranty. Physical Specifications: Usable Capacities: 1TB. NAND Components: Toshiba BiCS4 96-layer TLC NAND. NAND Controller: Silicon Image SM2262EN. Cache: 1GB DDR3L Interface: PCIe Gen 3.0 x4 NVMe. Form Factor: 2280 M.2. Dimensions: 80 x 22 x 3.5mm. Drive Weight: 10g. Firmware Version: S2681101 Kingston's KC2000 drive is packaged in a blister pack with the drive sitting in a plastic tray. Sitting under the drive is an Acronis True Image HD activation key, the software is available as a download from the Kingston website. On the top right of the cardboard backing is the drives capacity along with a panel explaining how much faster than a standard 7,200 rpm mechanical drive the KC2000 is. To the right of this is a logo displaying the fact that Kingston back the drive with a 5-year warranty. The rear of that packaging houses some multi-lingual marketing notes. The 1TB KC2000 is a dual-sided design. Sitting under the product label you will find the Silicon Motion SM2262EN controller and four 128GB packages of Toshiba BiCS4 96-layer 3D TLC NAND. The other side of the PCB is home to four more NAND packages and two 512MB DDR3L cache ICs. Silicon Motion's SM2262EN is a 8-channel controller with a 800 MT/s interface speed supporting NVMe 1.3 specifications. It supports ONFI 4.0/3.0 and Toggle 3.0/2.0 NAND and NV-DDR3 as well as DDR3, DDR3L, LPDDR3 and DDR4 DRAM. Kingston's SSD management utility is called SSD Manager, the version supporting the KC2000 is v1.1.2.0. It automatically detects any firmware updates as well as displaying drive status, temperatures and SMART information. It also has a page for TCG Opal and IEEE-1667 encryption settings. For testing, the drives are all wiped and reset to factory settings by HDDerase V4. We try to use free or easily available programs and some real world testing so you can compare our findings against your own system. This is a good way to measure potential upgrade benefits. Main system: Intel Core i7-7700K with 16GB of DDR4-3200 RAM, Sapphire R9 390 Nitro and an Asus Prime Z270-A motherboard. Other drives: Corsair Force MP500 480GB Corsair Force MP510 960GB Crucial P1 1TB Gigabyte Aorus RGB 512GB Intel Optane SSD900P 480GB Intel Optane SSD905P 480GB Intel SSD760p 512GB Kingston A1000 480GB Plextor M9Pe(Y) 512GB Plextor M8PeG 512GB Patriot Viper VPN100 1TB PNY CS3030 1TB PNY CS2030 240GB Samsung SSD970 EVO 2TB Samsung SSD970 PRO 1TB Samsung SSD960 PRO 2TB Samsung SSD960 EVO 1TB Samsung SSD960 EVO Plus 1TB Toshiba XG6 1TB Toshiba OCZ RD400 512GB Western Digital Black SN750 1TB Western Digital Black SN750 1TB with Heatsink Western Digital Black NVMe 1TB Western Digital Black PCIe 512GB Software: Atto Disk Benchmark 3.05. CrystalMark 6.0.0. AS SSD 2.0. IOMeter. Futuremark PC Mark 8 All our results were achieved by running each test five times with every configuration this ensures that any glitches are removed from the results. Trim is confirmed as running by typing fsutil behavior query disabledeletenotify into the command line. A response of disabledeletenotify =0 confirms TRIM is active. CrystalDiskMark is a useful benchmark to measure theoretical performance levels of hard drives and SSD’s. We are using v6.0. At a deep queue depth of 32, Kingston's KC2000 has faster read performance than the Toshiba XG6, the only other drive in this list using 96-Layer 3D NAND. However the Toshiba drive has the advantage when it comes to writes. At QD1 (1-Thread), Kingston's drive has a slightly better read and write performance than Toshiba's drive. The ATTO Disk Benchmark performance measurement tool is compatible with Microsoft Windows. Measure your storage systems performance with various transfer sizes and test lengths for reads and writes. Several options are available to customize your performance measurement including queue depth, overlapped I/O and even a comparison mode with the option to run continuously. Use ATTO Disk Benchmark to test any manufacturers RAID controllers, storage controllers, host adapters, hard drives and SSD drives and notice that ATTO products will consistently provide the highest level of performance to your storage. We are using version 3.5 for our NVMe disk tests. Kingston's official Sequential read figure for the 1TB KC2000 is up to 3,200MB/s while write performance is rated at up to 2,200MB/s. We could confirm those figures with the ATTO benchmark, the review drive produced a read figure of 3,130MB/s with writes at 2,276MB/s. AS SSD is a great free tool designed just for benching Solid State Drives. It performs an array of sequential read and write tests, as well as random read and write tests with sequential access times over a portion of the drive. AS SSD includes a sub suite of benchmarks with various file pattern algorithms but this is difficult in trying to judge accurate performance figures. In the more demanding AS SSD benchmark, Kington's KC2000 sits mid table, just under Toshiba's XG6 drive, the Toshiba drive producing better read and write scores. IOMeter is another open source synthetic benchmarking tool which is able to simulate the various loads placed on hard drive and solid state drive technology. There are many ways to measure the IOPS performance of a Solid State Drive, so our results will sometimes differ from manufacturer’s quoted ratings. We do test all drives in exactly the same way, so the results are directly comparable. We test 128KB Sequential read and write and random read and write 4k tests. The test setup’s for the tests are listed below. Each is run five times. 128KB Sequential Read / Write. Transfer Request Size: 128KB Span: 8GB Thread(s): 1, Outstanding I/O: 1-32 Test Run: 20 minutes per test 4K Sustained Random Read / Write. Transfer Request Size: 4KB Span: 80GB Thread(s): 4, Outstanding I/O: 1-32 Test Run: 20 minutes per test 4K Random 70/30 mix Read/Write. Transfer Request Size: 4KB Span: 80GB Reads: 70% Writes: 30% Thread(s): 4 Outstanding I/O: 2 – 32 Test Run: 20 minutes. 128KB Sequential Performance Kingston's official Sequential performance figures for the drive are up to 3,200MB/s for reads and up to 2,200MB/s for writes. We could confirm both these maximum figures with our Sequential tests, the review drive producing a peak read figure of 3,272.87 MB/s (QD4) and 2,512.39MB/s peak (QD16) for writes. 128KB Sequential Read Performance v QD Compared At a QD of 1, Kingston's KC2000 drive out performs the Toshiba XG6, the other 96-layer equipped drive in our results chart but as the queue depth deepens, the two drives performance becomes much closer. 128KB Sequential Write Performance v QD Compared The write performance of the KC2000 remains pretty consistent as the queue depth deepens. 4K Random Read v QD Performance Kingston state a maximum 4K random read IOPS figure for the 1TB KC2000 as up to 350,000 IOPS. In our 4K random read testing using 4-threads the best we got from the drive was 308,960 IOPS at a queue depth of 32. 4K Random Read v QD Performance Compared At queue depths 1 and 4, the Kingston KC2000 drive offers better 4K random read performance that the Toshiba XG6 but at QD2 and 32, it's the Toshiba drive that offers the better performance. 4K Random Write v QD Performance In our 4K random write tests, the peak IOPS figure we saw for the drive was 321,974 IOPS at a QD of 16 before ending the test at 281,110 IOPS at QD32. Both figures bettering the official write figure of 275,000 IOPS. 4K Random Write v QD Performance Compared When it comes to 4K random write performance the Kingston KC2000 outpaces the Toshiba XG6 through all the tested queue depths. 4K 70/30 Mixed Performance 
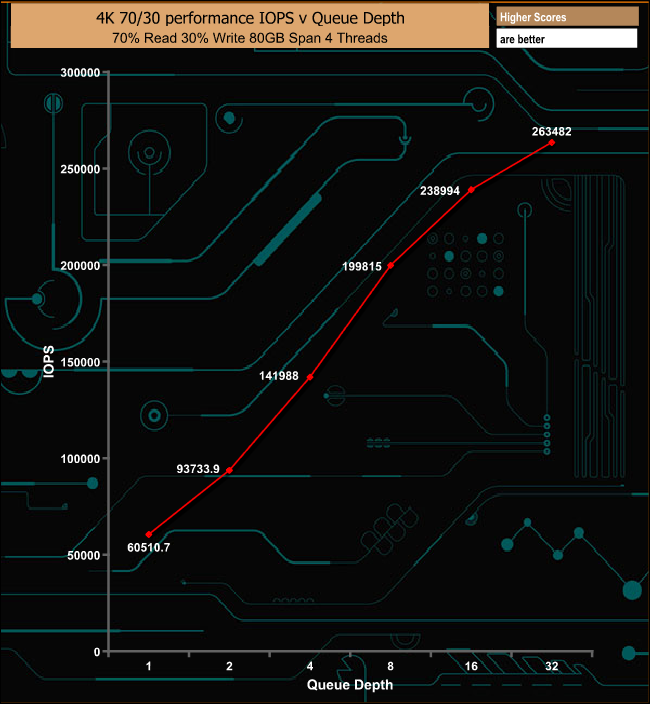
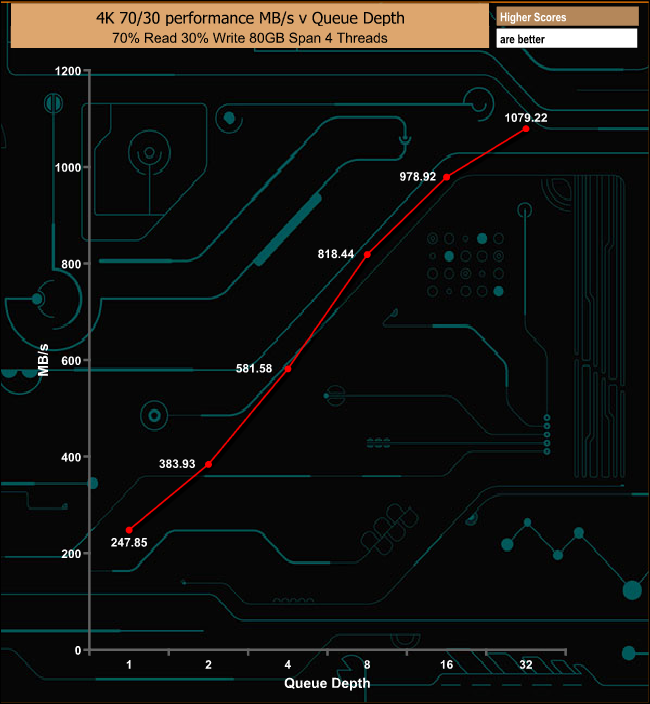
The KC2000 displays solid performance throughout the tested queue depths finishing the test run at 263,482 IOPS (1,079.22MB/s) at a QD of 32. In our read throughput test, the 1TB KC2000's performance peaked at 2,708.59MB/s at the 4K block size before slipping back to finish the test run at 2,548.61MB/s. That 2,708.59MB/s read throughput performance places the KC2000 in the mid-point on our results table. In our write throughput test, the performance of the drive was very erratic, dropping as low as 21MB/s at the 64KB block size, however the drive recovers very well so at the 256KB block size it reaches 2012.44MB/s. Peak performance comes at the 2MB block size at 2,075.32MB/s before finishing the test run at 2058.32MB/s. The peak write throughput figure of 2,075.32MB/s is a bit shy of the maximum write speed of 2,200MB/s as quoted by Kingston for the drive. Futuremark’s PCMark 8 is a very good all round system benchmark but it’s Storage Consistency Test takes it to whole new level when testing SSD drives. It runs through four phases; Preconditioning, Degradation, Steady State, Recovery and finally Clean Up. During the Degradation, Steady State and Recovery phases it runs performance tests using the 10 software programs that form the backbone of PCMark 8; Adobe After Effects, Illustrator, InDesign, Photoshop Heavy and Photoshop Light, Microsoft Excel, PowerPoint, Word, Battlefield 3 and World of Warcraft. With some 18 phases of testing, this test can take many hours to run. Preconditioning The drive is written sequentially through up to the reported capacity with random data, write size of 256 × 512 = 131,072 bytes. This is done twice. Degradation Run writes of random size between 8 × 512 and 2048 × 512 bytes on random offsets for 10 minutes. It then runs a performance test. These two actions are then repeated 8 times and on each pass the duration of random writes is increased by 5 minutes. Steady State Run writes of random size between 8 × 512 and 2048 × 512 bytes on random offsets for final duration achieved in degradation phase. A performance test is then run. These actions are then re-run five times. Recovery The drive is idled for 5 minutes. Then a performance test is run. These actions are then repeated five times. Clean Up The drive is written through sequentially up to the reported capacity with zero data, write size of 256 × 512 = 131,072 bytes. The KC2000 handles the rigours of PCMark 8's Consistency Test rather well. There are no major drops performance as the test progresses although the drives recovery isn't exactly consistent, PCMark 8’s Consistency test provides a huge amount of performance data, so here we’ve looked a little closer at how the KC2000 performs in each of the benchmarks test suites. Adobe Creative Cloud Kingston's KC2000 drive suffers during the Degradation phases for both Adobe Photoshop tests and the Steady State and Recovery phases for the Adobe Photoshop Heavy test. On the other hand the performance during the Steady State test runs for the Adobe Photoshop Light is very good although it blots its copy book with the dramatic drop in bandwidth during the fourth Recovery run. Microsoft Office You won't see a results chart looking like this for the Microsoft Office parts of the test run very often. More often than not, the Microsoft Word test trace plays havoc with the drives bandwidth performance. In the case of Kingston's KC2000 it takes the test in its stride. Very impressive. Casual Gaming The drive really struggles with the World Of Warcraft test trace during the Casual Gaming part of the benchmark run. It delivers very low bandwidth for the Degradation and Steady State phases although the drives recovery is very, very impressive. The Battlefield 3 trace doesn't cause as many problems for the drive during the test runs, but the recovery is equally as impressive. Just like the Consistency test, PCMark 8’s Standard Storage test also saves a large amount of performance data. The default test runs through the test suite of 10 applications three times. Here we show the total bandwidth performance for each of the individual test suites for the third and final benchmark run. The KC2000 shows strong performance for the individual test suites. The 1,524MB/s and 1,198MB/s for the Adobe Heavy and Light tests respectively is very good but the 886MB/s for the Adobe InDesign test and the 711MB/s for the Powerpoint test are also worthy of note. The 694.04MB/s bandwidth figure produced by the KC2000 for the overall PCMark8 Storage Test is very good and only just under the 696.43MB/s produced by the other 96-layer NAND drive in the table, Toshiba's XG6 OEM drive. For the long term performance stability test, we set the drive up to run a 20-minute 4K random test with a 30% write, 70% read split, at a Queue Depth of 256 over the entire disk. The 1TB KC2000 averaged 82,149 IOPS for the test with a performance stability of 70.16%, which is what you would expect for a drive aimed at business users as well as the consumer segment. To test real life performance of a drive we use a mix of folder/file types and by using the FastCopy utility (which gives a time as well as MB/s result) we record the performance of drive reading from & writing to a 256GB Samsung SSD850 PRO. 100GB data file. 60GB iso image. 60GB Steam folder – 29,521 files. 50GB File folder – 28,523 files. 21GB 8K Movie demos. 12GB Movie folder – 24 files (mix of Blu-ray and 4K files). 11GB 4K Raw Movie Clips (8 MP4V files). 10GB Photo folder – 621 files (mix of png, raw and jpeg images). 10GB Audio folder – 1,483 files (mix of mp3 and .flac files). 5GB (1.5bn pixel) photo. The drive handles large file sizes a lot more effectively than smaller ones, as can be seen by the 500MB/s+ figures for the tests made up of larger files (ISO image, 4K movie clips and 8K Movie scenes etc). To get a measure of how much faster PCIe NVMe drives are than standard SATA SSD's we use the same files but transfer to and from a 512GB Toshiba OCZ RD400. To give a better idea of just how much faster going from NVMe to NVMe drive is, as opposed to going from a standard SATA SSD, the 1000GB data file took 3m 11s to transfer from the SATA SSD to the Kingston KC2000 and 3m 41s to go the other way. When the same file was written to the NVMe drive from the Kingston 2000 it took a mere 48s to read and just 1m 12s to write to the Kingston drive. Sitting under the company's business and consumer banners, Kingston's KC2000 drive is the second one we've seen that uses 96-layer 3D NAND but the first to be readily available, as the first 96-layer drive, Toshiba's XG6 is an OEM part. Where the Toshiba drive used an in-house controller to look after the Toshiba 96-layer BiCS4 3D TLC NAND, Kingston have chosen Silicon Motion's latest 8-channel controller, the SM2262EN for the KC2000. When it comes to performance, Kingston quote Sequential read/write figures of 3,200MB/s and 2,200MB/s respectively for the 1TB drive which we could confirm with the ATTO benchmark. Under test the review drive produced a read figure of 3,130MB/s and 2,276MB/s for writes. The 1TB KC2000 is rated at up to 350,000 IOPS for random reads and up to 275,000 IOPS for random writes. Under testing we got a peak random read performance of 308,960 IOPS (QD32) while the peak random write figure we got was 321,974 IOPS (QD16), both figures obtained testing the drive using four threads. One feature of the KC2000 that will interest business users is the encryption support. A self-encrypting drive, the KC2000 uses 256-bit AES hardware-based encryption to provide support for end-to-end data protection. It has Microsoft eDrive support built in and also supports the use of independent TCG Opal 2.0 security management software from venders including McAfee, WinMagic and Symantec. Kingston's SSD management utility, SSD Manager may not be as feature rich as some of its competitors such as Samsung and WD for example, but even so it automatically detects any firmware updates as well as displaying drive status, temperatures and SMART information and lets you keep an eye on TCG Opal and IEEE-1667 encryption settings. We found the 1TB Kingston KC2000 on alza.co.uk for £160.90 (inc VAT) HERE Pros Overall performance. Endurance. Encryption support. Cons 4K QD2 reads a little disappointing in our tests. Kitguru says: Kingston's KC2000 makes good use of the latest 96-layer 3D NAND technology, combining it with the latest controller from Silicon Image to produce not only the fastest M.2 NVMe Kingston drive we've tested to date but a drive with security at its heart.