

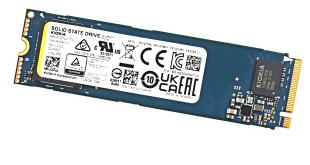
The BG series of SSDs are to be found under Kioxia's business product banner. The latest member of the family is the BG5, the first in the series to feature a PCIe Gen4 interface, which is used in combination with Kioxia's 5th generation 112-layer BiCS Flash NAND. We check out the 1TB model and find out what performance is on offer from this OEM drive.
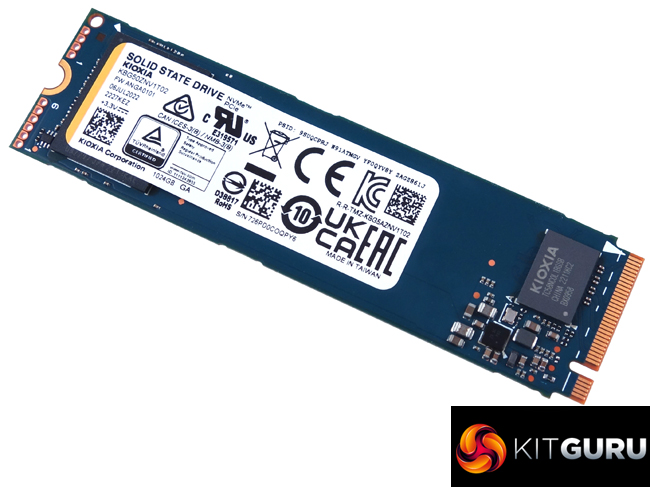
The BG5 is aimed at IoT devices, ultra-mobile PCs and as a boot drive for data centre servers and it comes in three capacities; 256GB, 512GB and 1TB. There are two formats available; M.2 2230 module (coded KBG50ZNS) and an M.2 2280 version (coded KBG50ZNV). It's the latter we are looking at here, with the 1TB KBG50ZNV1T02 flagship drive.
Kioxia quotes Sequential read performance figures as up to 3,400MB/s for the entry-level 256GB drive and up to 3,500MB/s for the 512GB and 1TB models. Sequential write performance for the range is quoted as up to 1,900MB/s and 2,700MB/s for the 256GB and 512GB drives respectively with the 1TB drive rated as up to 2,900MB/s.
As for random read performance, the BG5 is rated as up to 350,000 IOPS for the 256GB model, 400,000 IOPS for the 512GB and up to 500,000 IOPS for the 1TB drive. Random writes are; 256GB, 360,000 IOPS, 512GB 430,000 IOPS and up to 450,000 IOPS for the 1TB model.
Physical Specifications:
- Usable Capacities: 1TB.
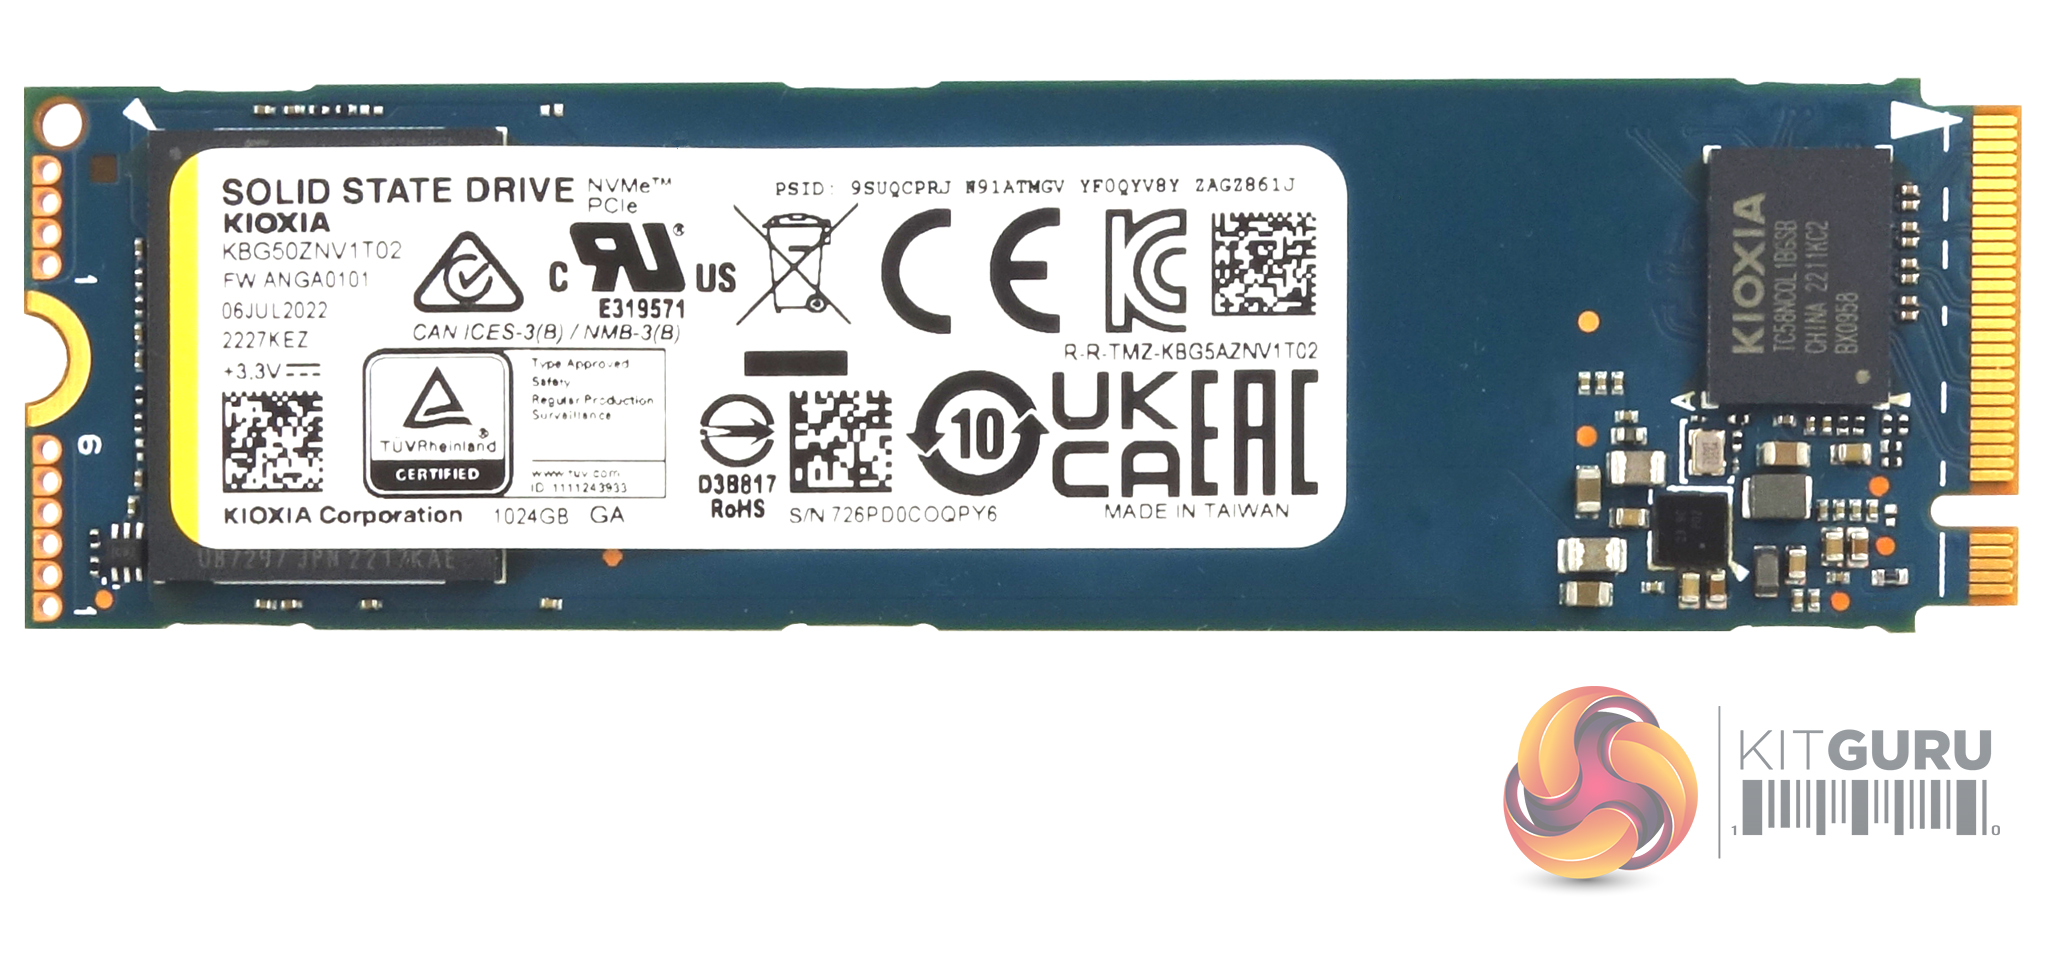
- NAND Components: Kioxia BiCS5 112-layer TLC 3D NAND.
- NAND Controller: Kioxia TC58NCOL1BGSB.
- Cache: none.
- Interface: PCIe Gen4x4. NVMe 1.4,
- Form Factor: 2280 M.2.
- Dimensions: 2.23 x 22 x 80mm.
- Drive Weight: 6g
Firmware Version: ANGA0101.
The BG5 comes in two module sizes, M.2 2230 and the more familiar M.2 2280, like our review sample above. The 1TB 2280 drive is a single-sided design with all the components sitting on one side of the PCB.
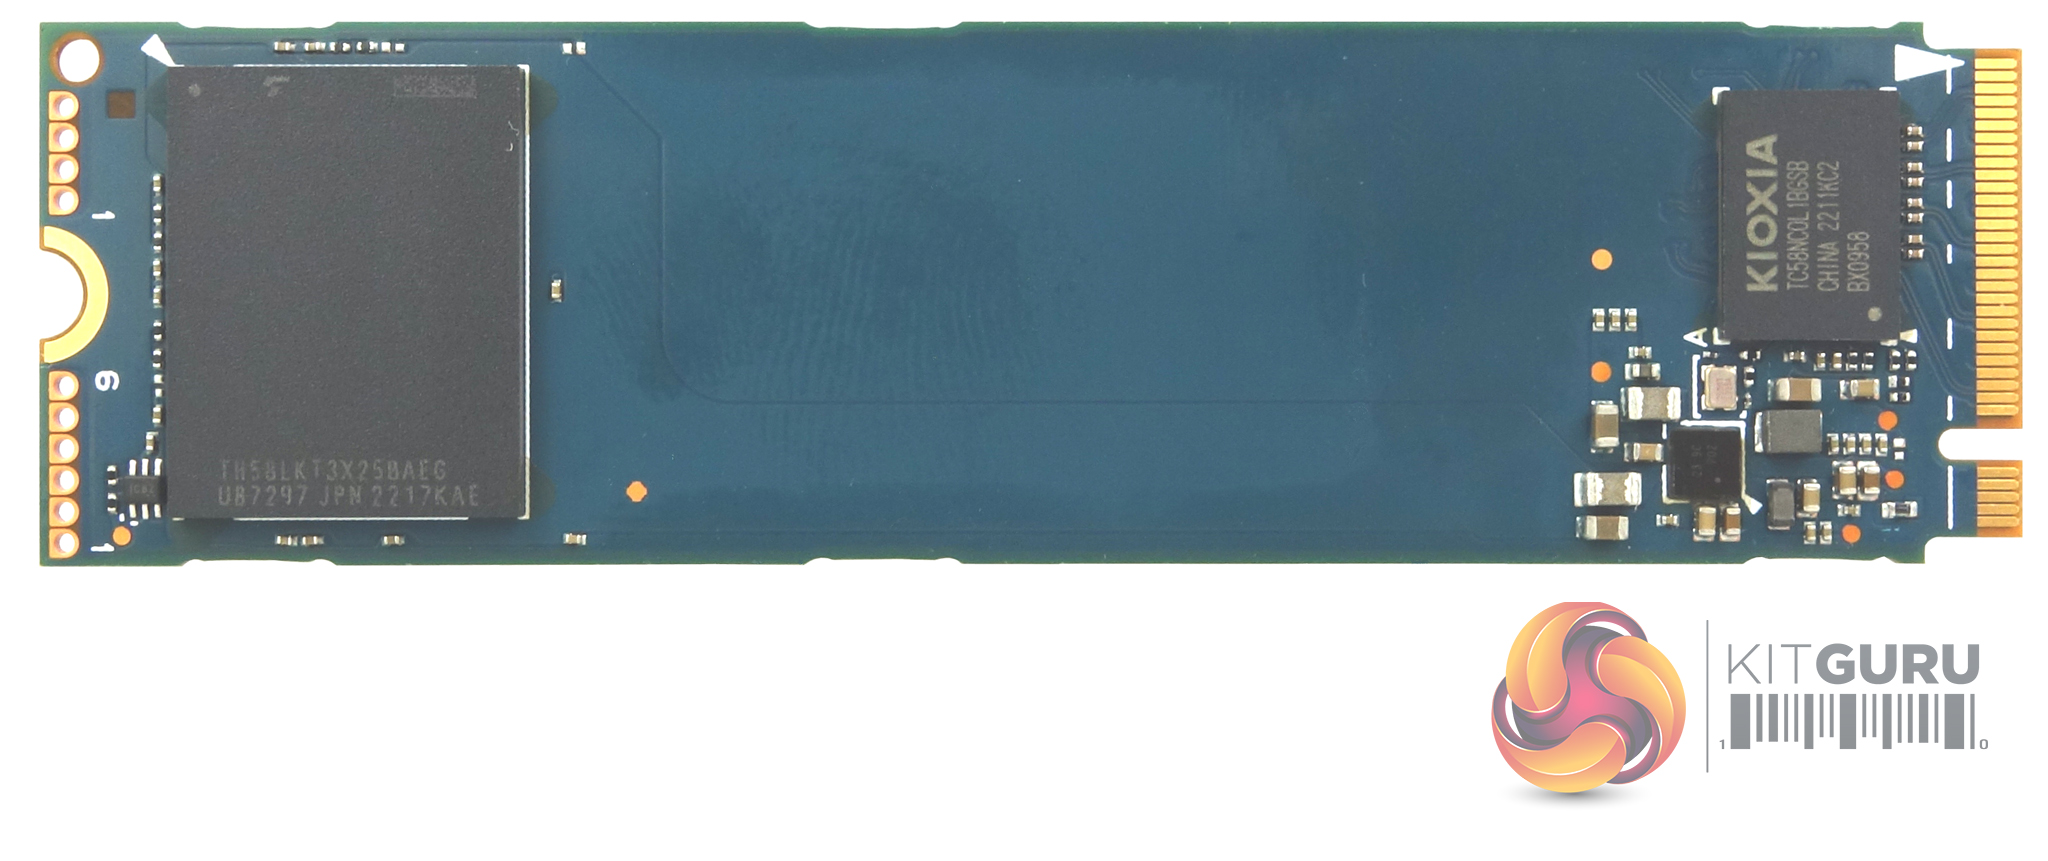
Under the product sticker is a single 1TB package of Kioxia's BiCS5 112-layer TLC 3D NAND (coded TH58LKT3X25BAEG). There's a lot of empty real estate between the NAND package and the tiny Kioxia controller, labelled TC58NCOL1BGSB at the other end of the board.
For testing, the drives are all wiped and reset to factory settings by HDDerase V4. We try to use free or easily available programs and some real-world testing so you can compare our findings against your own system.
This is a good way to measure potential upgrade benefits.
Main system:
AMD Ryzen 5 3600X, 16GB DDR4-2400, Sapphire R9 390 Nitro and an MSI MPG X570 Gaming Edge Wifi motherboard
Other drives
- Corsair MP600 PRO 2TB
- Corsair Force MP600 1TB
- Corsair MP600 PRO XT 2TB
- Crucial P5 Plus 1TB
- Gigabyte AORUS 7000e 2TB
- HP FX900 Pro 2TB
- Kingston KC3000 2TB
- Kioxia Exceria Pro 2TB
- MSI Spatium M480 2TB
- Patriot Viper VP4300 2TB
- Patriot Viper VPN4100 1TB
- PNY XLR8 CS3040 1TB
- PNY XLR8 CS3140 1TB
- Sabrent Rocket 4 Plus 1TB
- Sabrent Rocket 4 Plus 2TB
- Sabrent Rocket 4 Plus 4TB
- Samsung SSD980 PRO 1TB
- Samsung SSD980 PRO Heatsink 1TB
- Seagate FireCuda 520 1TB
- Seagate FireCuda 530 2TB
- Teamgroup T-Force Cardea Zero Z440 1TB
- Teamgroup T-Force Cardea A440 Pro Special Series 1TB
- WD Black SN770 1TB
- WD Black SN850 1TB
- WD Black SN850X Heatsink 2TB
Software:
- Atto Disk Benchmark 4.
- CrystalMark 8.0.0.
- AS SSD 2.0.
- IOMeter.
- UL Solutions PC Mark 10.
- UL Solutions 3DMark Storage Benchmark.
All our results were achieved by running each test five times with every configuration. This ensures that any glitches are removed from the results. Trim is confirmed as running by typing “fsutil behavior query disabledeletenotify” into the command line. A response of “disabledeletenotify =0” confirms TRIM is active.
CrystalDiskMark is a useful benchmark to measure the theoretical performance levels of hard drives and SSDs. We are using v8.0.
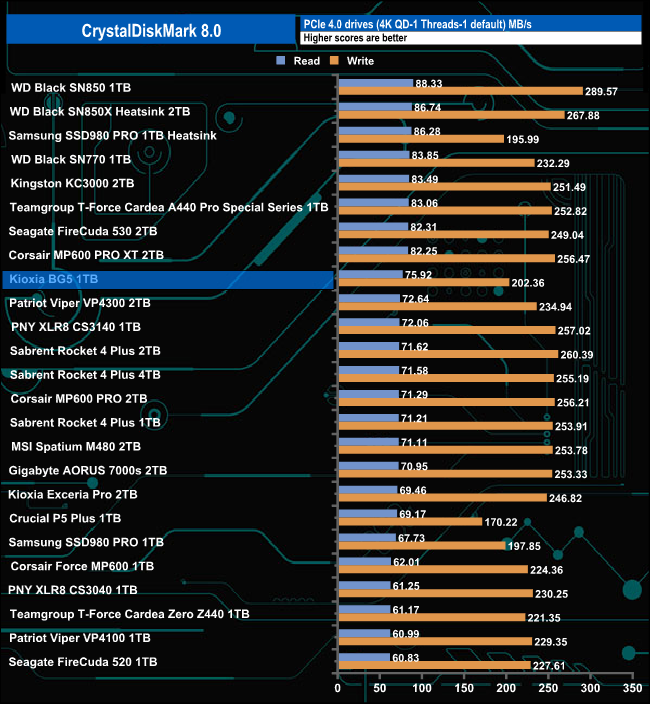
The 1TB BG5 performs reasonably well in CrystalDiskMark 8's 4K QD1 test with a read score of 75.92MB/s which is good enough to see the drive creep into the top ten. Its write result of 202.36MB/s is a bit on the low side though.
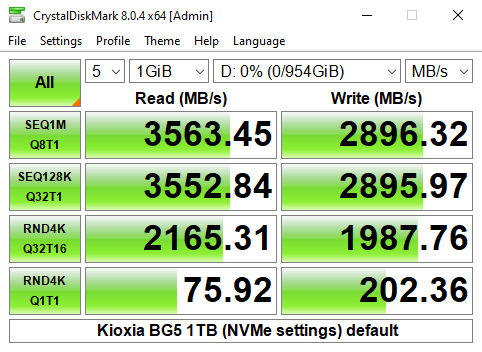
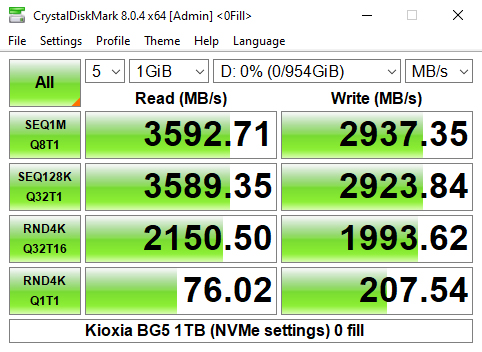
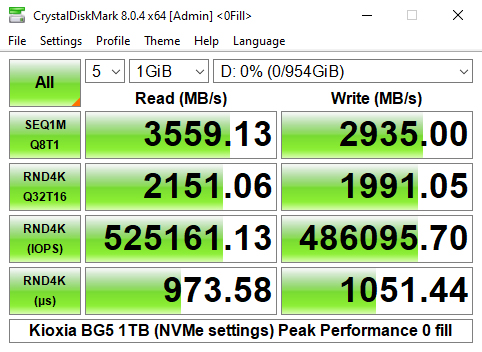
Using the default settings of CrystalDiskMark 8 we could confirm the official 3,500MB/s Sequential read rating but fell a little short of the official write figure of 2,900MB/s. However, using the 0 fill option we could also confirm this figure.
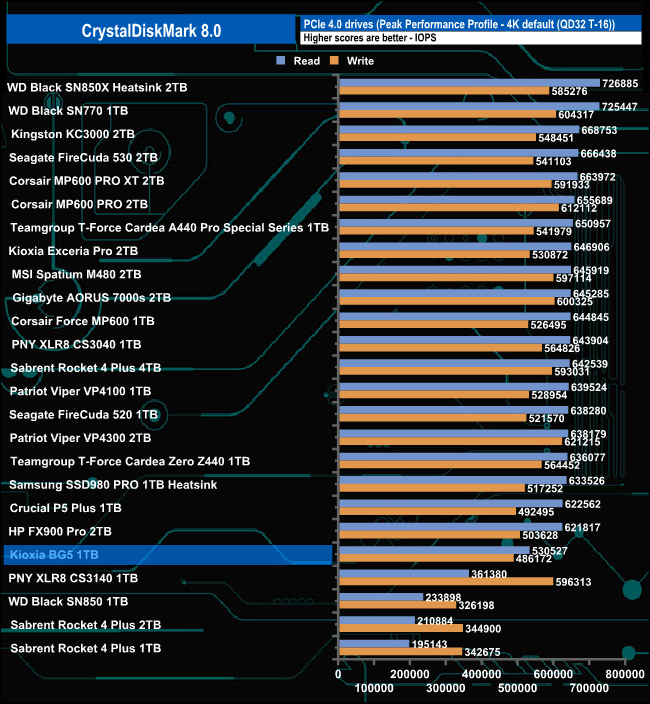
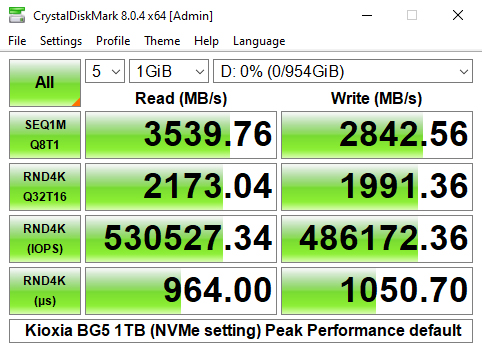
Using the Peak Performance profile of CrystalDiskMark 8 we could confirm both official 4K random figures; up to 500,000 IOPS random reads and 450,000 IOPS random writes with test results of 530,527 IOPS for reads and 486,172 IOPS for writes.
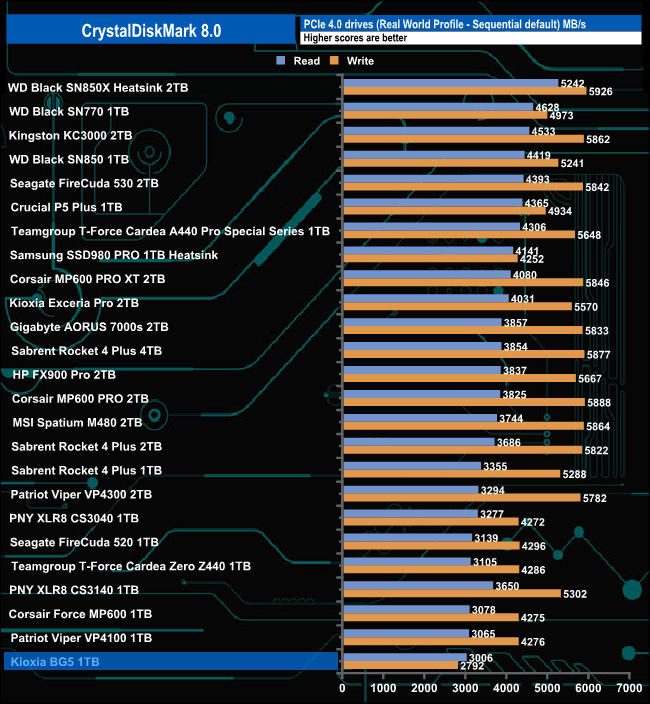
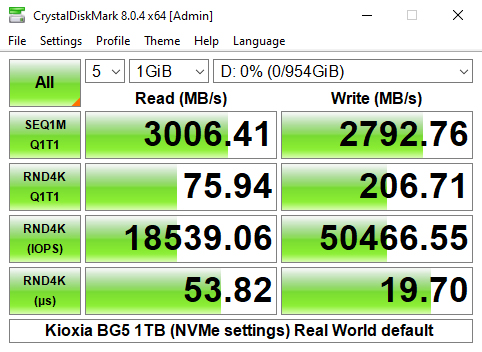
Using the Real World profile we saw Sequential read/write scores of 3,006MB/s and 2,792MB/s respectively while the drive produced a random read score of 18,539 IOPS with writes at 50,466 IOPS.
The ATTO Disk Benchmark performance measurement tool is compatible with Microsoft Windows. Measure your storage systems performance with various transfer sizes and test lengths for reads and writes. Several options are available to customize your performance measurement including queue depth, overlapped I/O and even a comparison mode with the option to run continuously.
Use ATTO Disk Benchmark to test any manufacturer's RAID controllers, storage controllers, host adapters, hard drives and SSD drives. Notice that ATTO products will consistently provide the highest performance to your storage.
We are using version 4.0 for our NVMe disk tests.
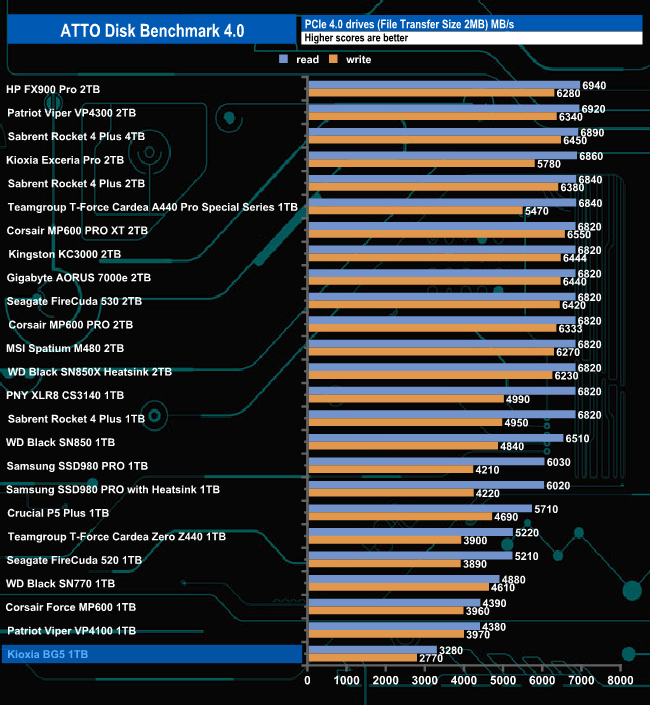
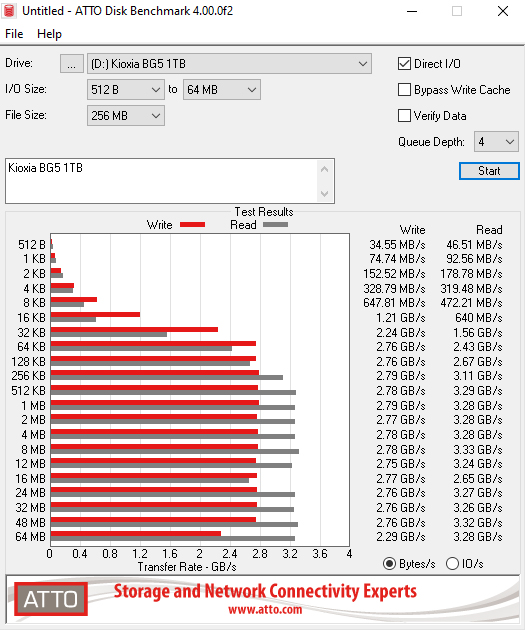
Kioxia rate the read/write Sequential performance of the 1TB BG5 as up to 3,500MB/s and 2,900MB/s respectively. Using the ATTO benchmark we couldn't quite hit those maximums with test result figures of 3,280MB/s for reads and 2,770MB/s for writes.
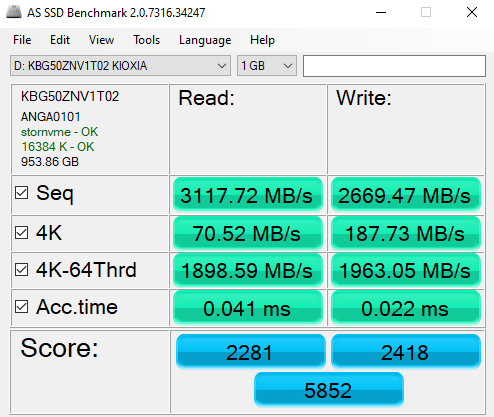
AS SSD is a great free tool designed just for benching Solid State Drives. It performs an array of sequential read and write tests, as well as random read and write tests with sequential access times over a portion of the drive. AS SSD includes a sub suite of benchmarks with various file pattern algorithms but this is difficult in trying to judge accurate performance figures.
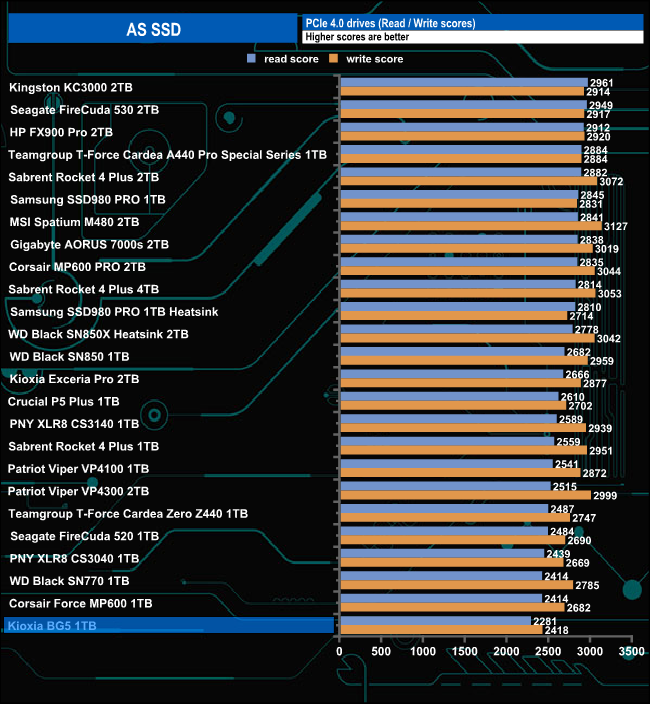
The BG5 seemed to struggle a bit with the more demanding AS-SSD benchmark with Sequential read/write figures of 3,117MB/s and 2,669MB/s respectively. Its write score of 2418 is stronger than its read score but both put the drive in last place in the results table.
We used CrystalDiskMark 8‘s custom settings to test the Sequential read and write performance of the drive through a range of queue depths. The setup for the tests is listed below.
128KB Sequential Read / Write.
Transfer Request Size: 128KB, Thread(s): 1, Outstanding I/O: 1-32.
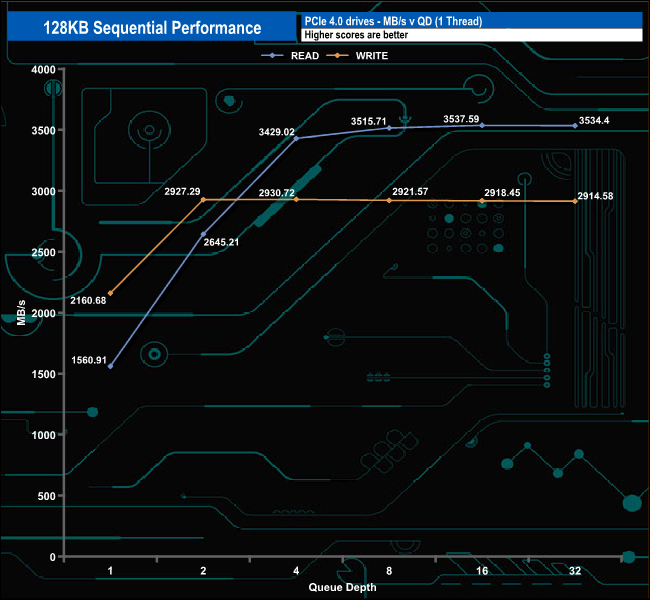
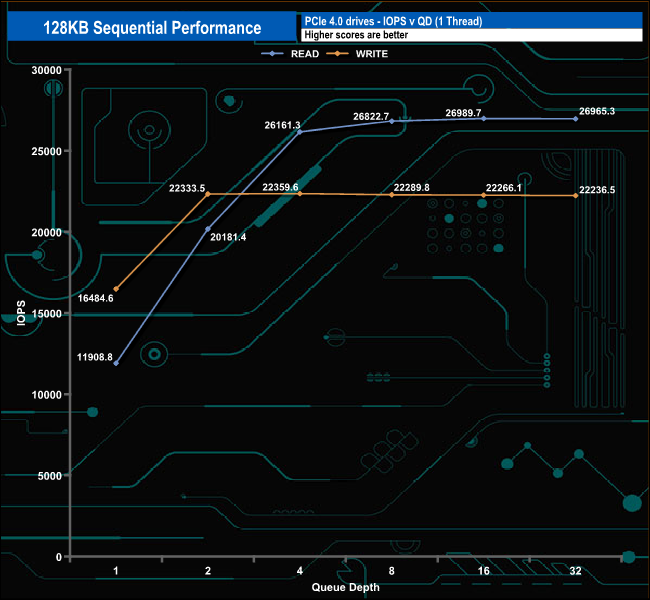
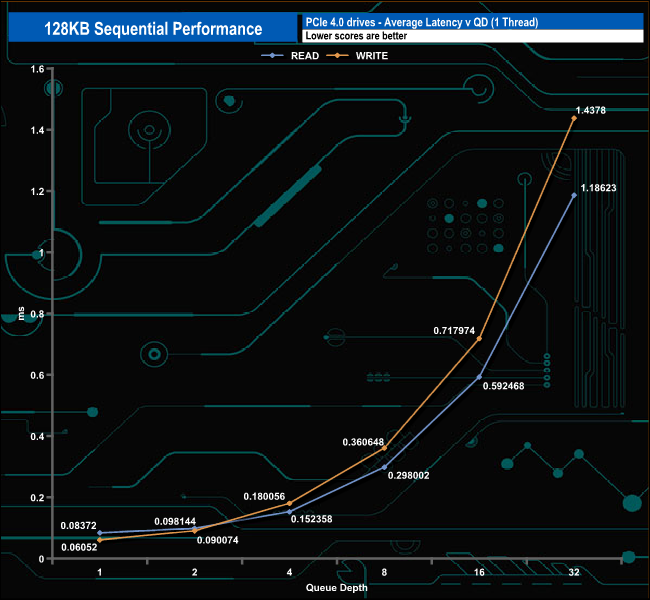
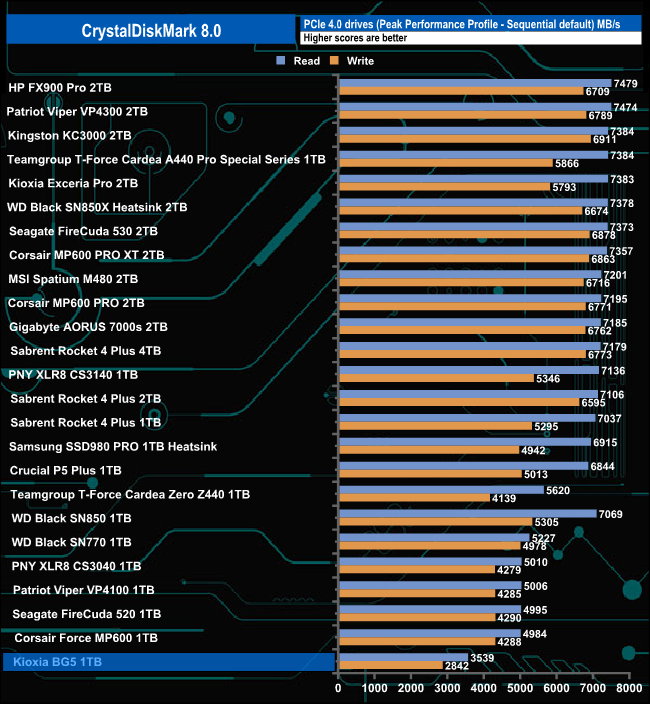
In our own Sequential read/write tests we could confirm the official maximum figures of 3,500MB/s for reads and 2,900MB/s for writes with peak test results of 3,537MB/s (QD16) and 2,930MB/s (QD4) for read and writes respectively.
128KB Sequential Read Performance compared:
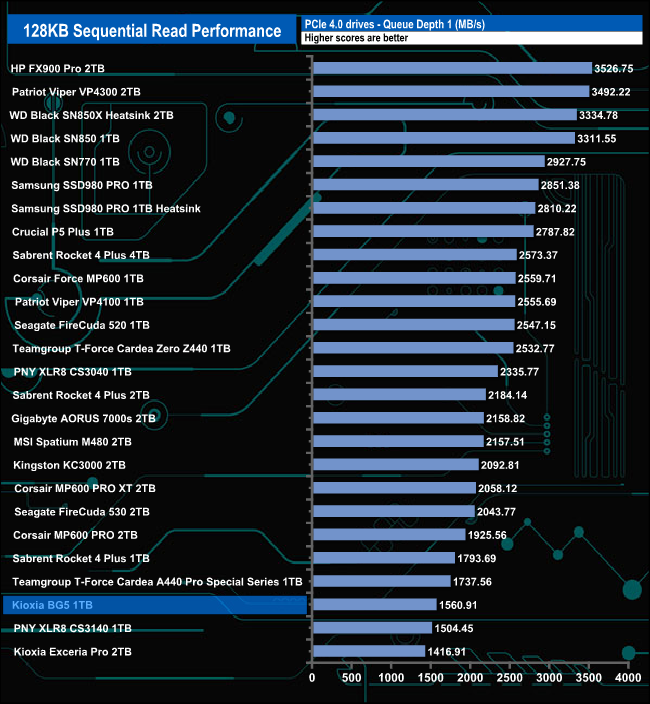
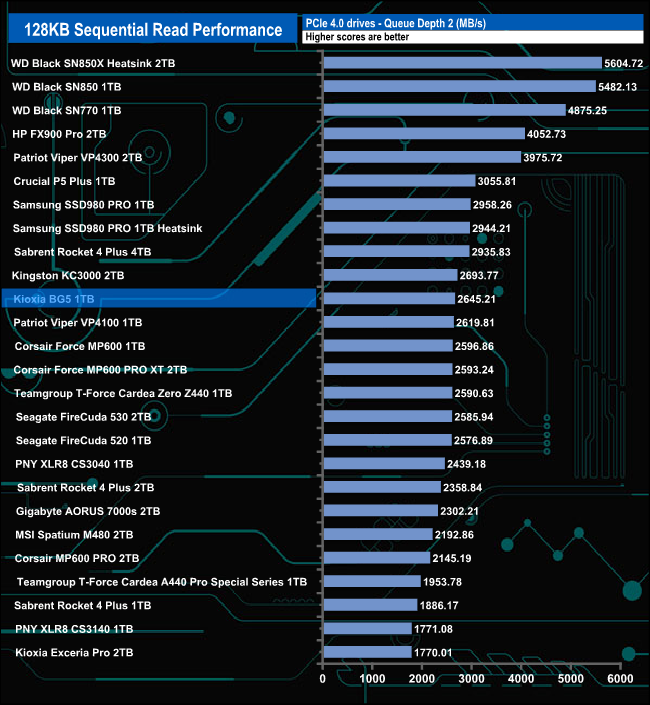
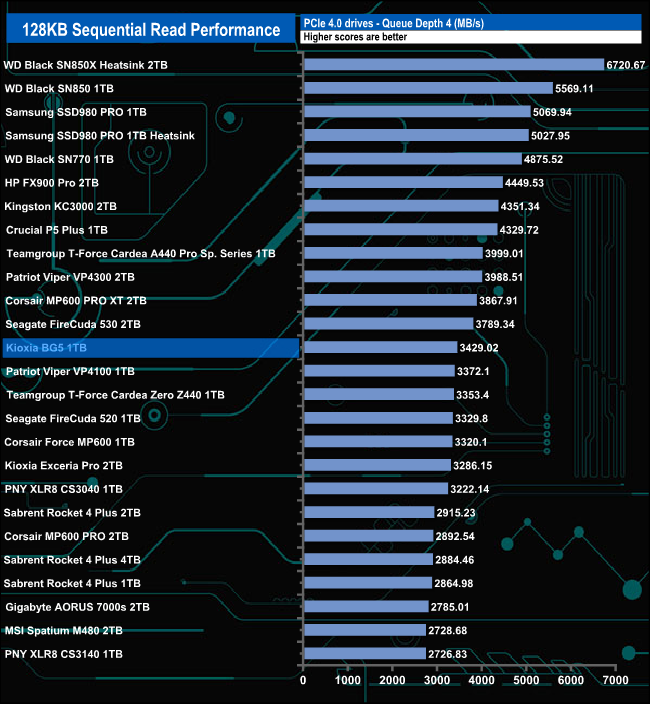
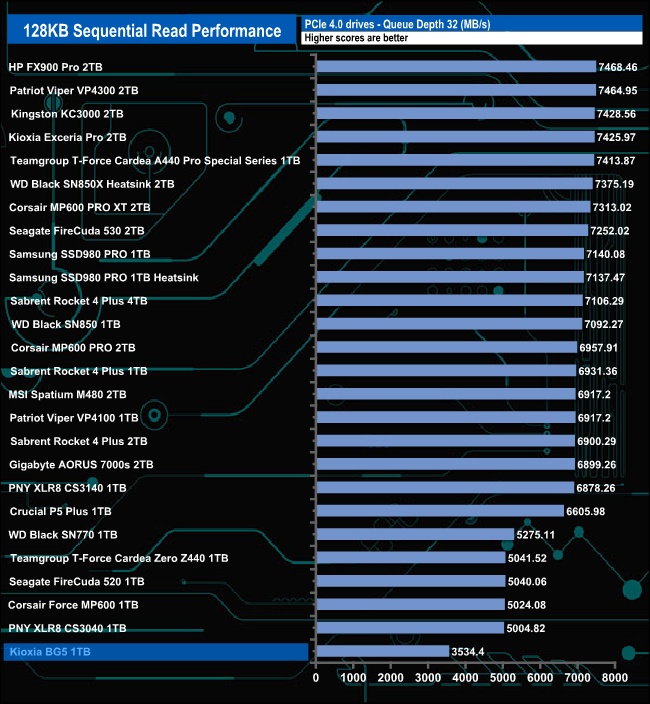
The BG5 performs best in relation to other drives around it at QD's 2 and 4 where it sits mid-table. At QD1 it's near the bottom of the table and at QD32, it sits in last place.
128KB Sequential Write Performance compared:
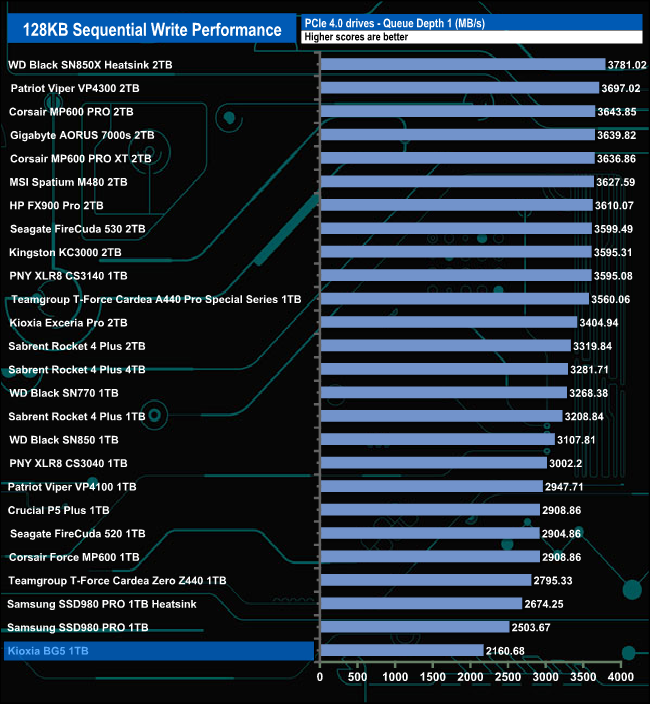
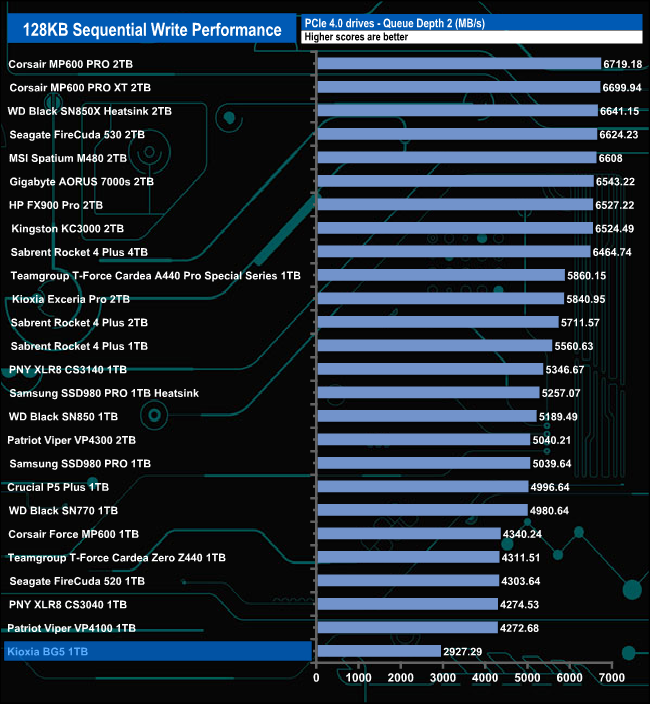
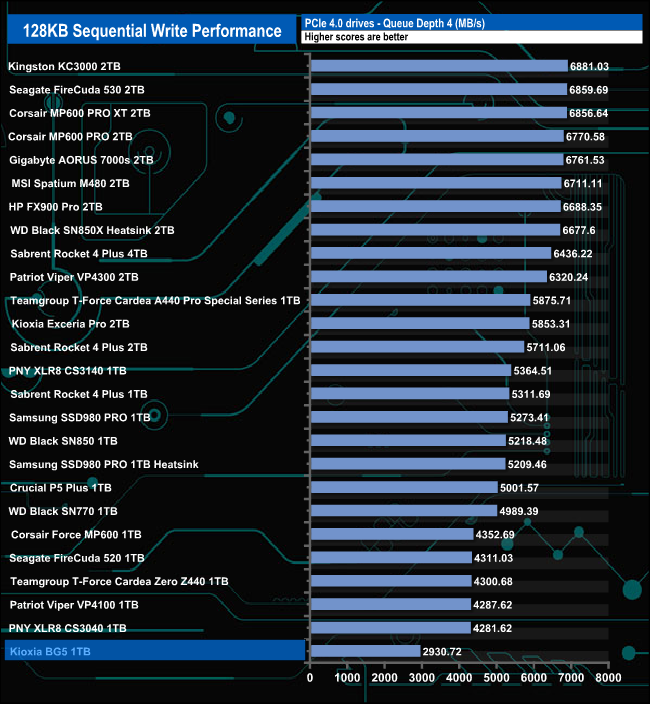
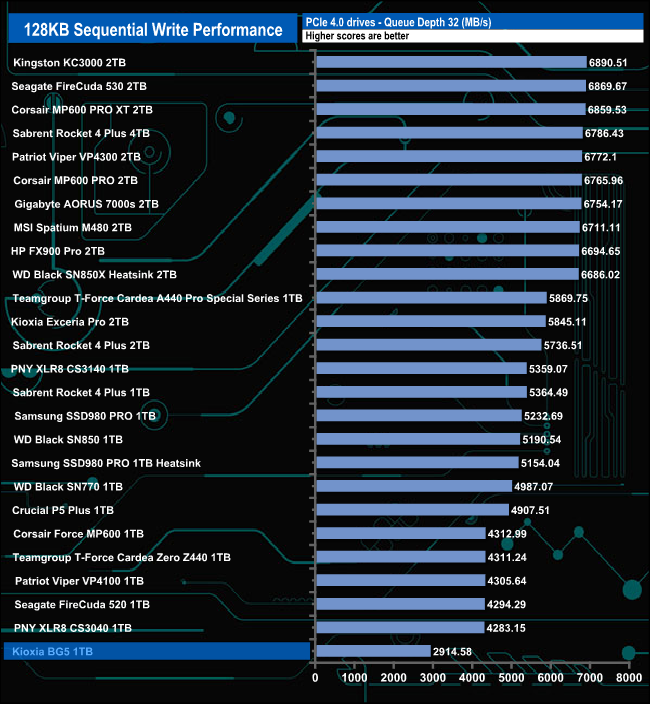
When it comes to Sequential write performance the drive sits firmly at the bottom of our results chart for all the tested queue depths,
We used CrystalDiskMark 8‘s custom settings to test the 4K random read performance of the drive through a range of queue depths. The setup for the tests is listed below.
Transfer Request Size: 4KB, Outstanding I/O: 1-32.
Using our four threaded 4K random read tests we couldn't get close to the maximum official random read figure of 500,000 IOPS, with 359,765 IOPS being the best result we saw. We did a quick test of the drive using eight threads and could confirm the official figure with a test result of 547,760 IOPS.
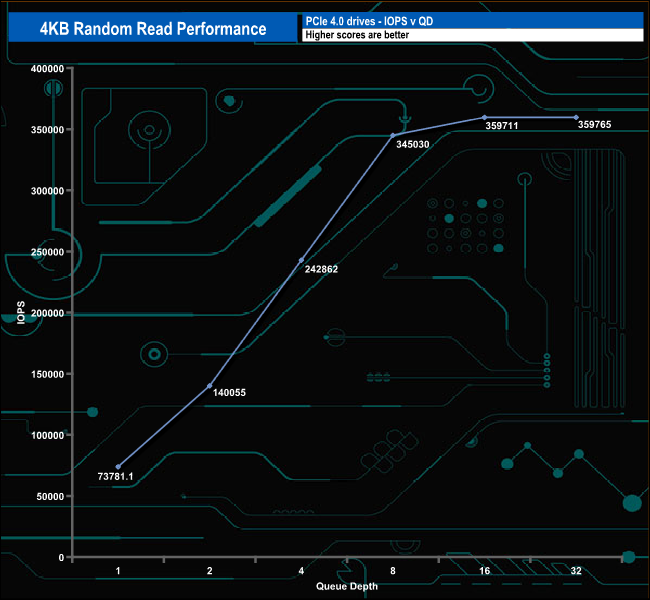
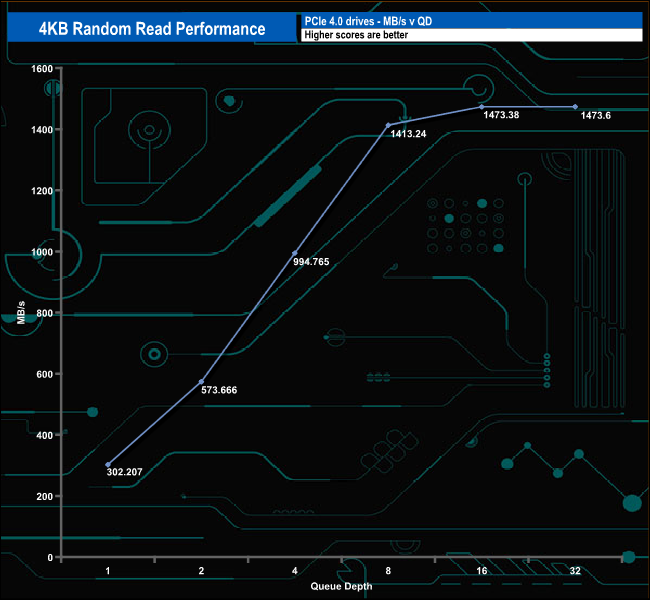
4K Random Read v QD Performance compared.
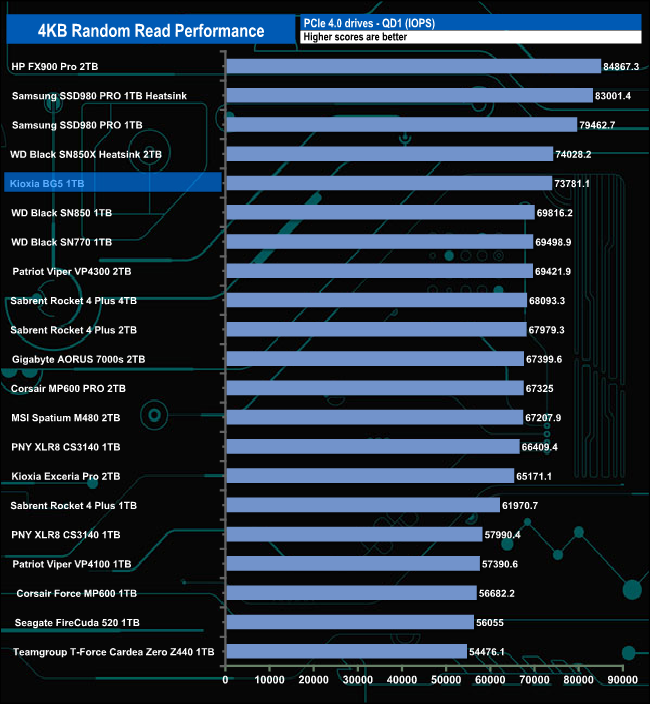
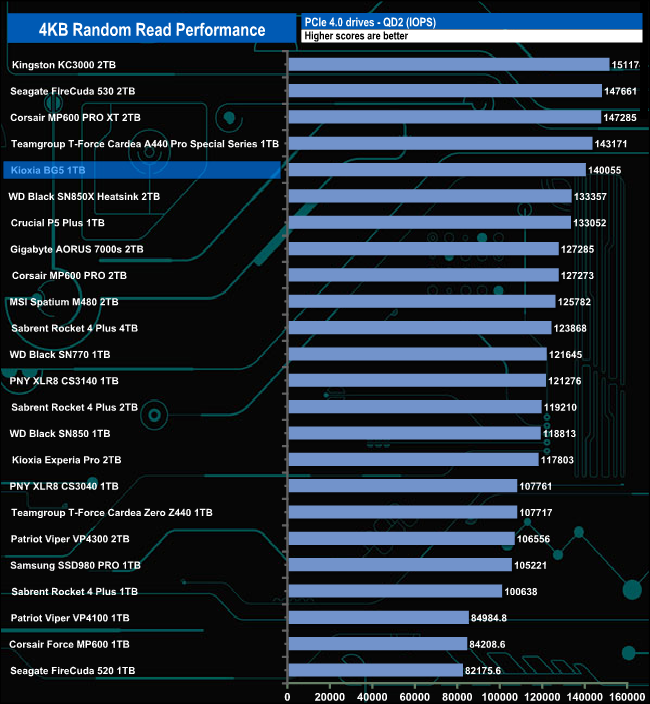
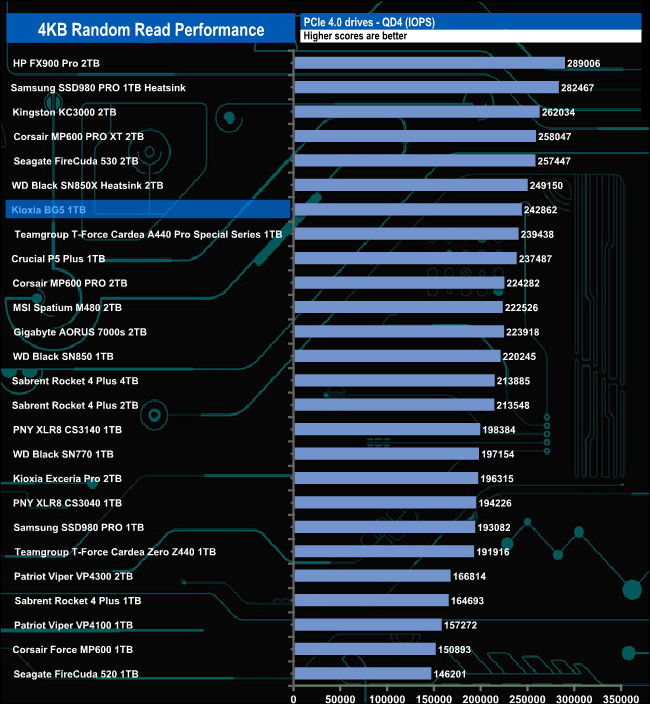
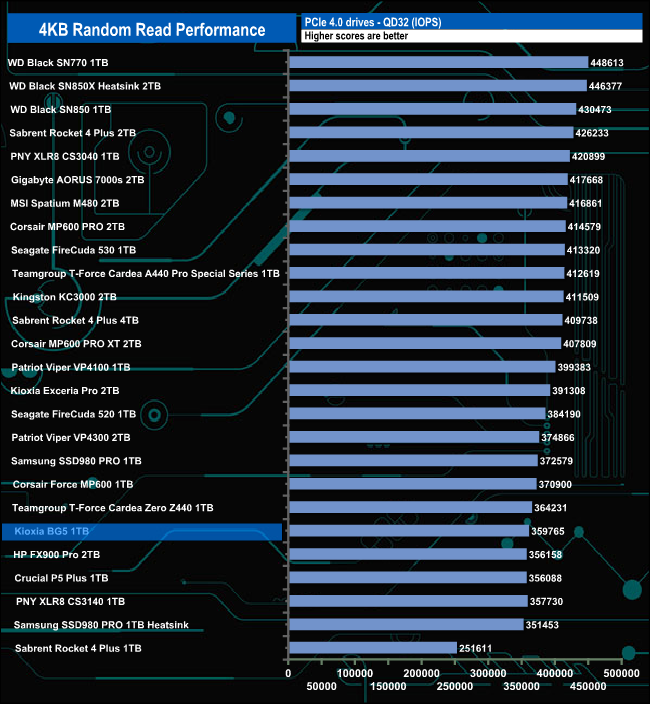
At QD 1 and 2, the BG5 sits in the top five of the drives we have tested. As the queue depth deepens the drive starts to drop down the table. By QD32 it's in the bottom half of our results chart.
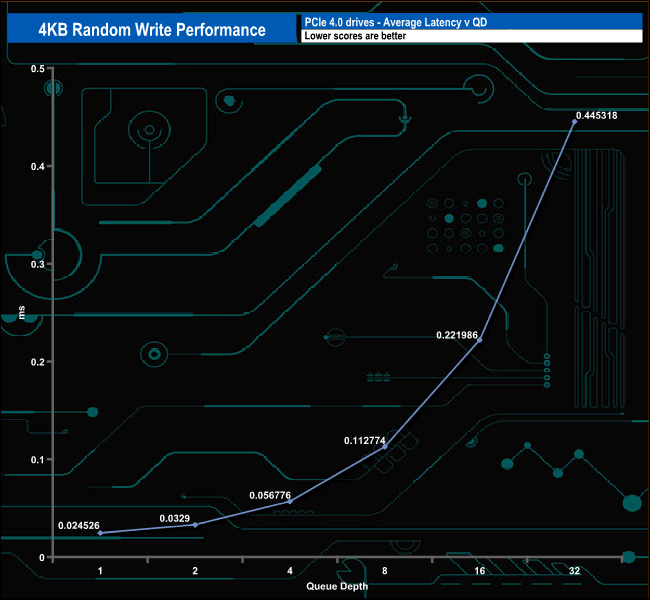
We used CrystalDiskMark 8‘s custom settings to test the 4K random write performance of the drive through a range of queue depths. The setup for the tests is listed below.
Transfer Request Size: 4KB, Outstanding I/O: 1-32.
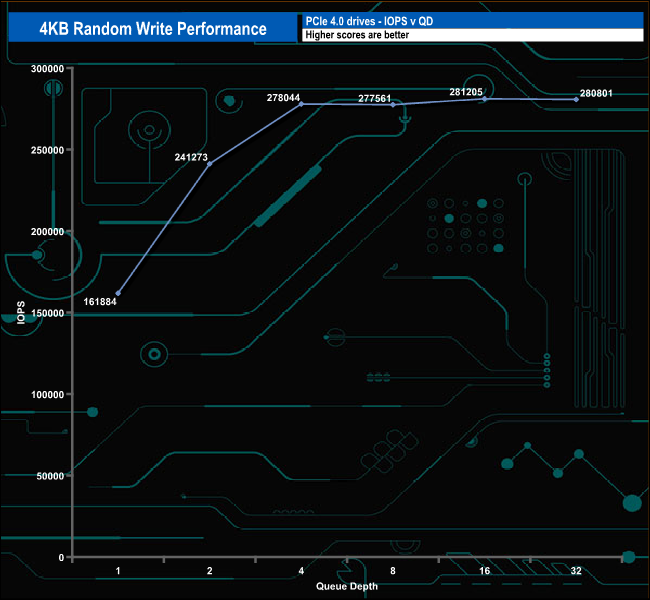
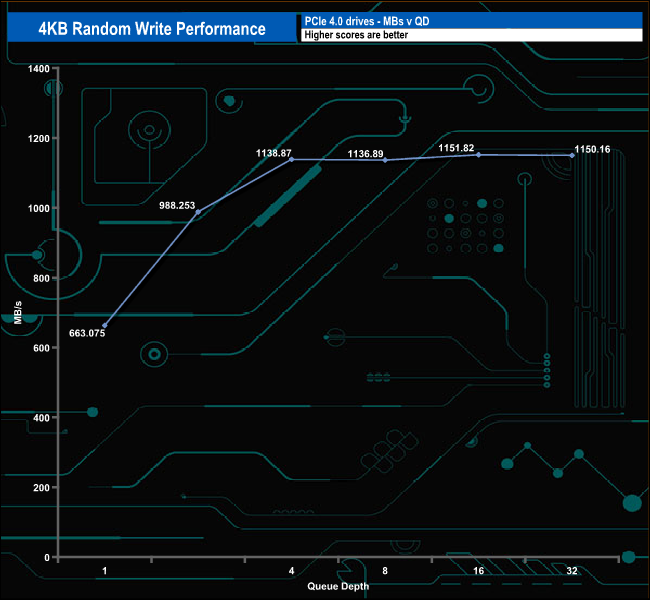
With our 4-threaded random write tests, the best result we saw from the drive was 281,205 IOPS at QD16, with the performance dropping back to 280,801 IOPS at the end of the test at QD32, both figures nowhere near the official maximum rating of 450,000 IOPS.
4K Random Write v QD Performance compared:
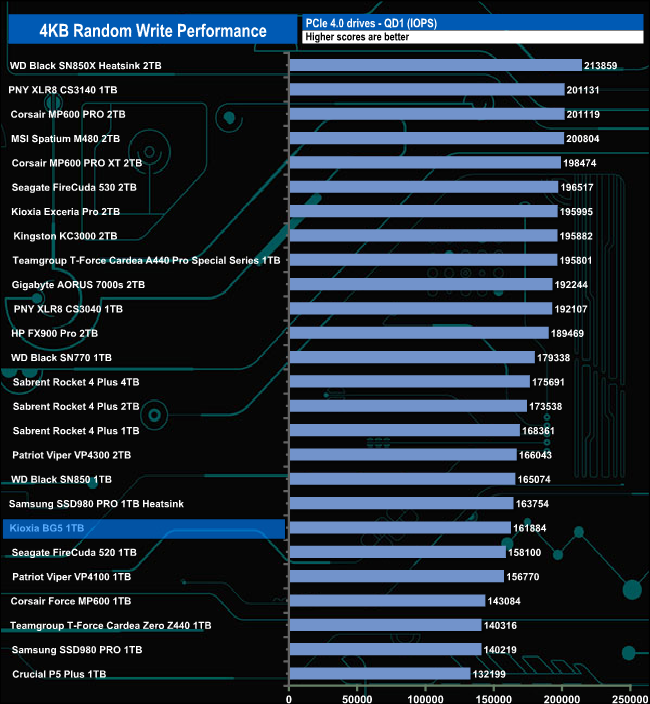
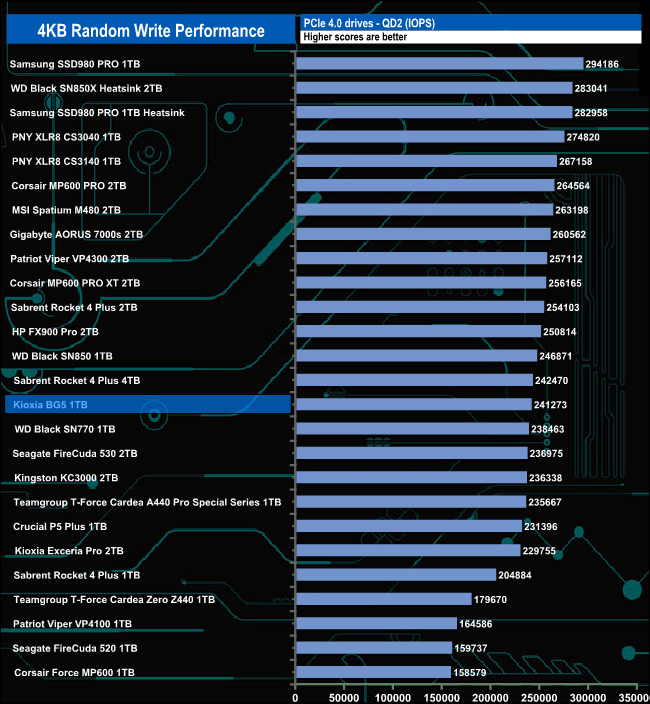
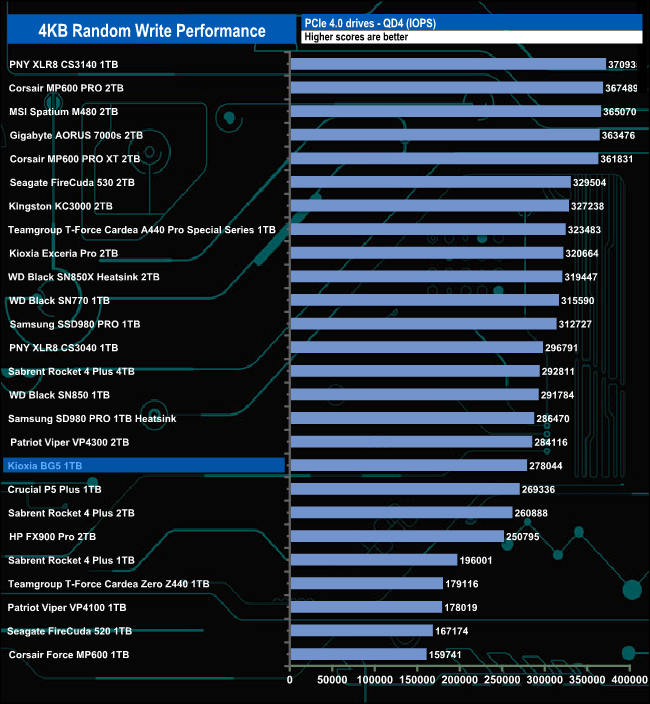
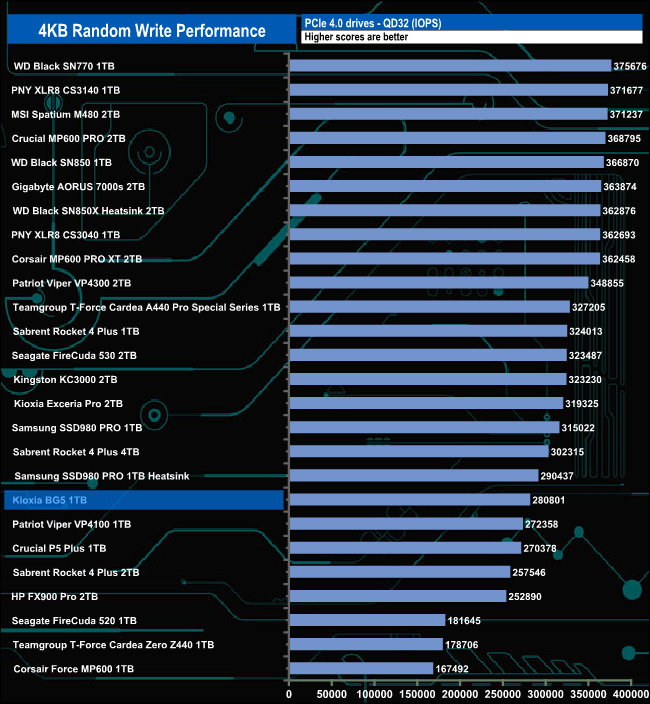
The best performance from the drive in comparison with its competitors came at QD2 where the drive sat in a mid-table position.
We used CrystalDiskMark 8’s custom settings to test the 4K 70/30 mixed read/write performance of the drive through a range of queue depths using a single thread and four threads.
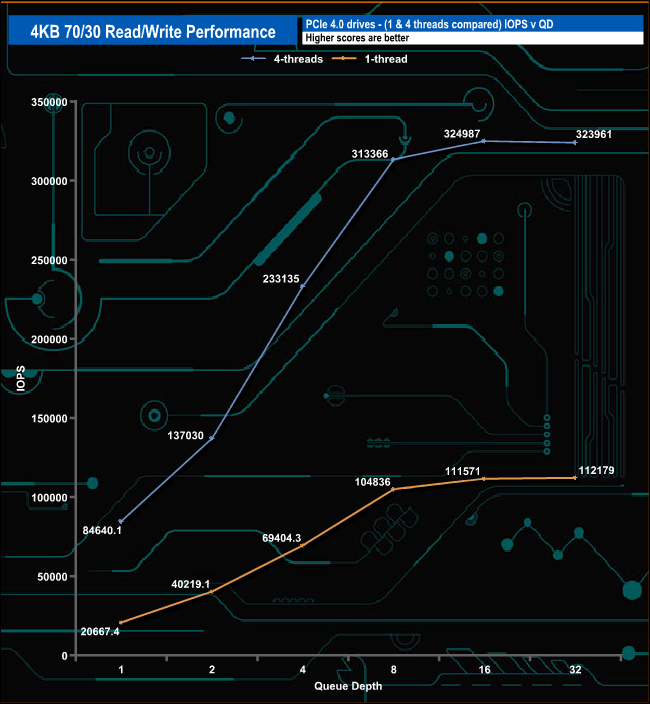
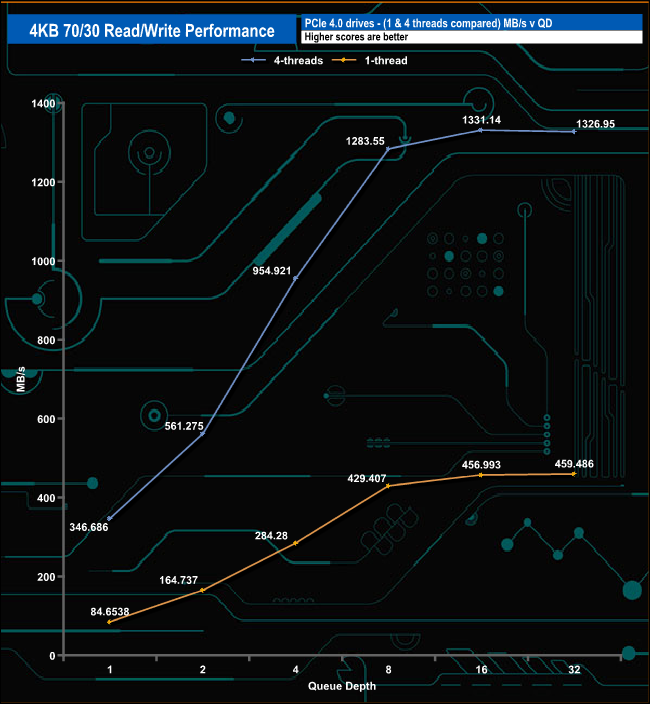
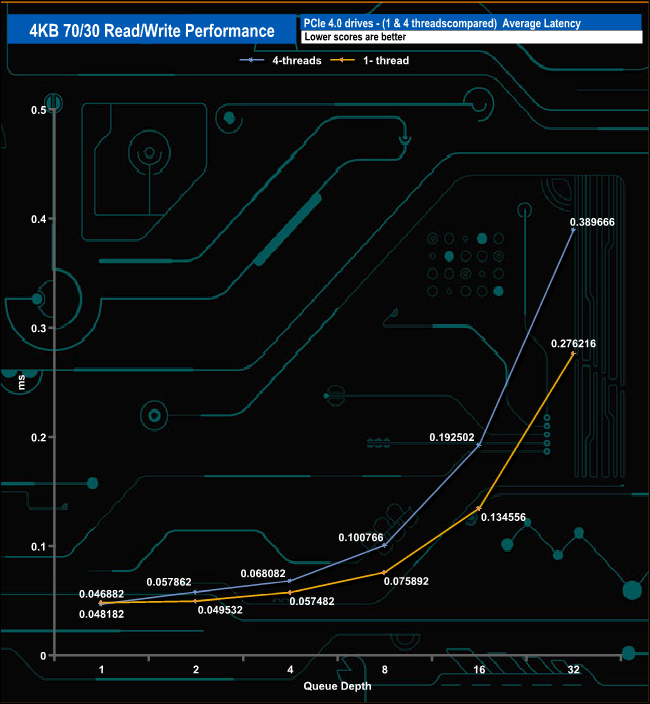
Using 4-threads, the drive peaked at 324,987 IOPS (QD16) in our 4K random 70/30 read/write tests before slipping back slightly to finish the test run at 323,961 IOPS. Using a single thread the drive peaked at 112,179 IOPS at the end of the test run. With both thread tests, the rate of performance increase slows from QD16 onwards.
We used CrystalDiskMark 8 to test the random performance of the drive at lower queue depths (QD1 – QD8 where most of the everyday workloads occur) using 1 to 4 threads.
4K Random Read Performance QD1-QD8
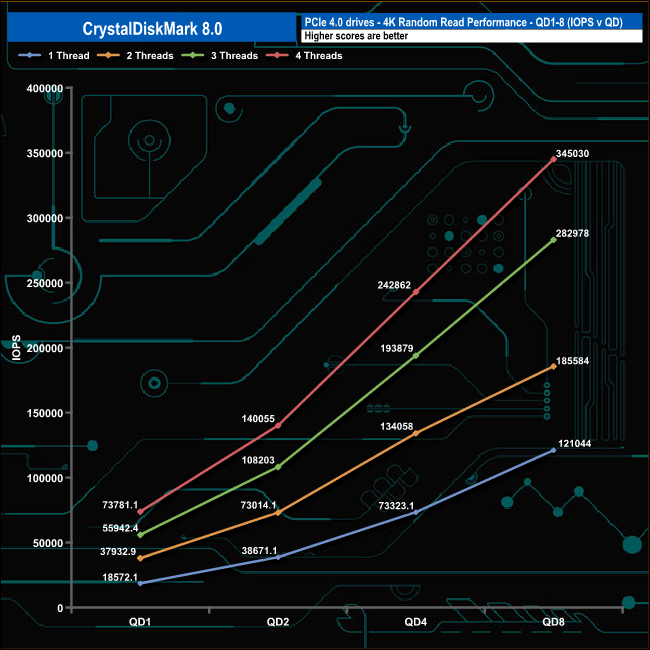
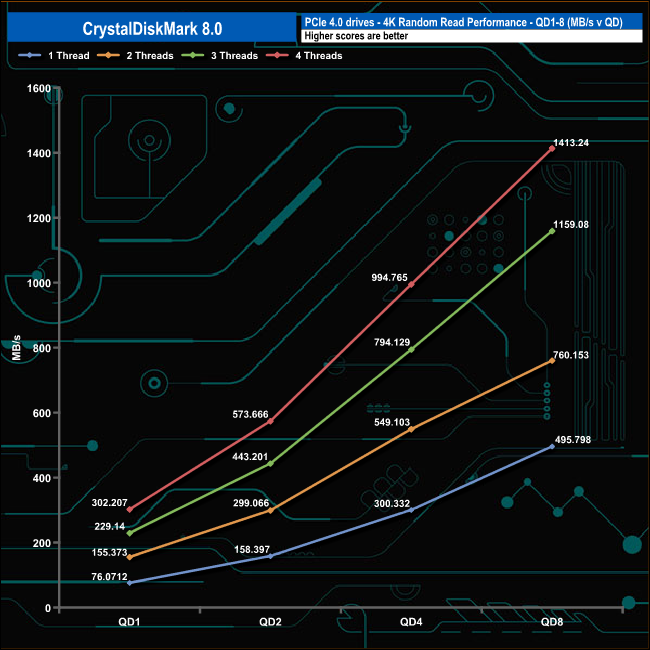
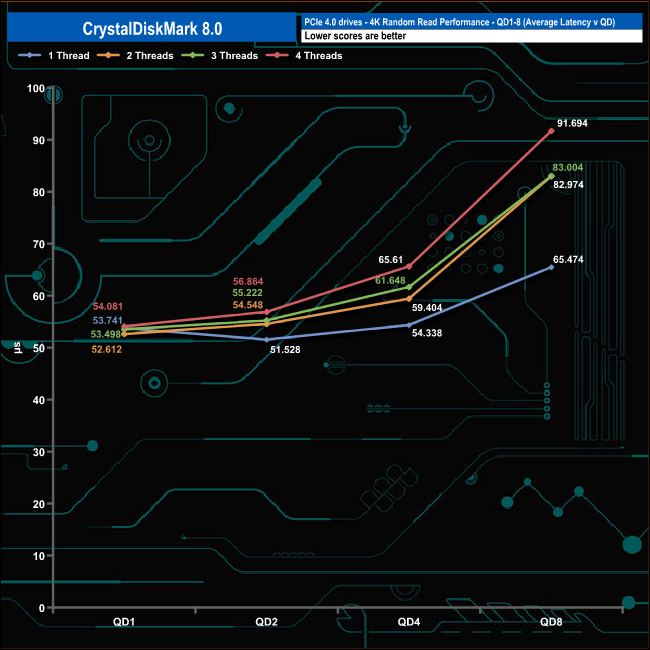
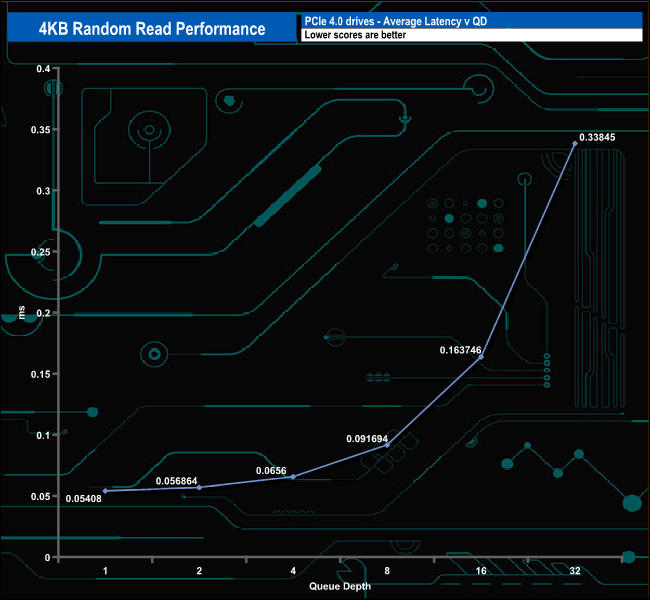
In our lower queue depth, 4K random read tests, the performance increases steadily as the queue depth deepens for each thread. At QD1 the performance ranged from a low point of 18,572 IOPS (76.07MB/s) for a single thread up to 73,781 IOPS (302.30MB/s) for four threads. At QD8 a single thread produced 121,044 IOPS (495.79MB/s) and four threads, 345,030 IOPS (1,413.24MB/s).
4K Random Write Performance QD1-QD8:
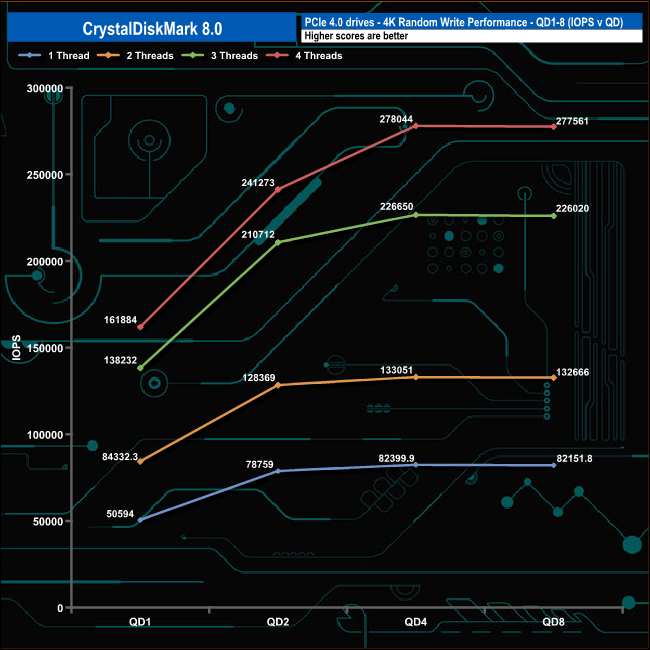
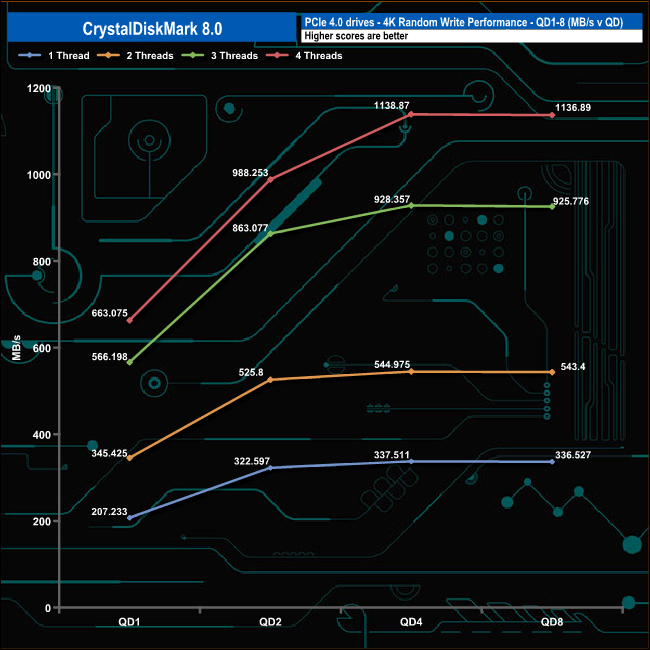
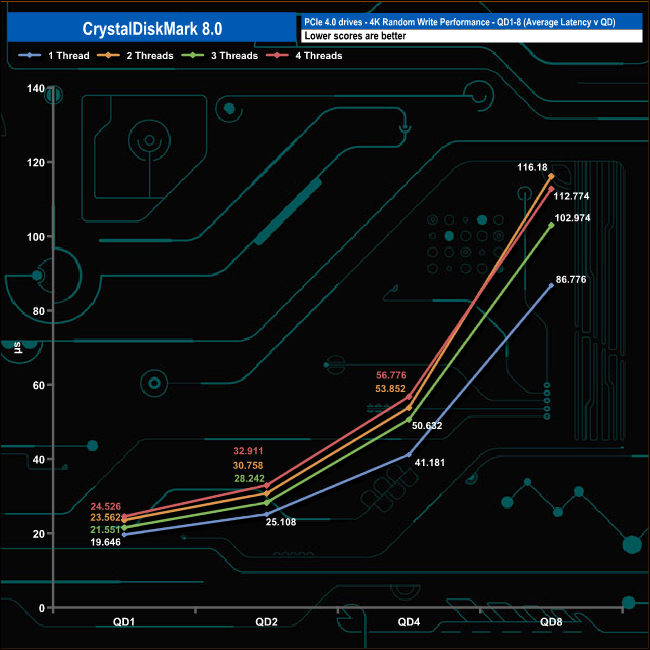
In the 4K write test both one and two-thread performance begins to slow from QD2 onwards while using three and four threads sees the slow down happening from QD4.
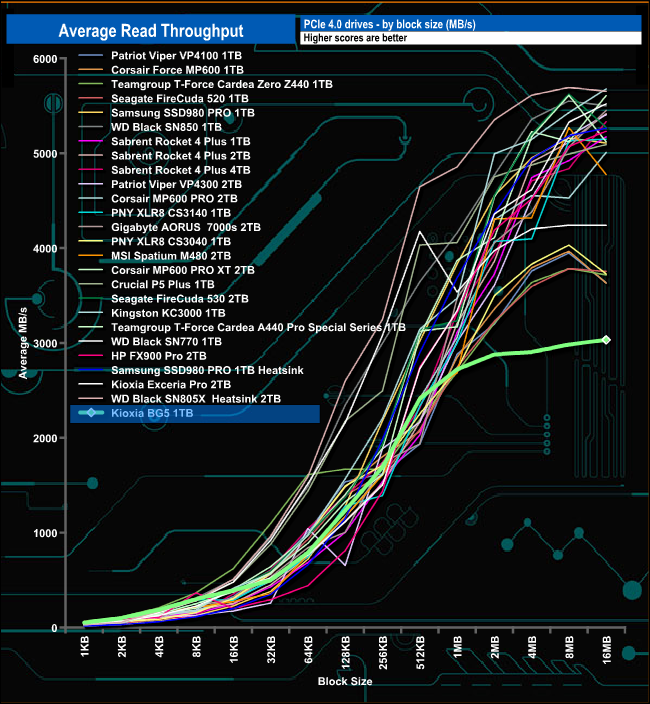
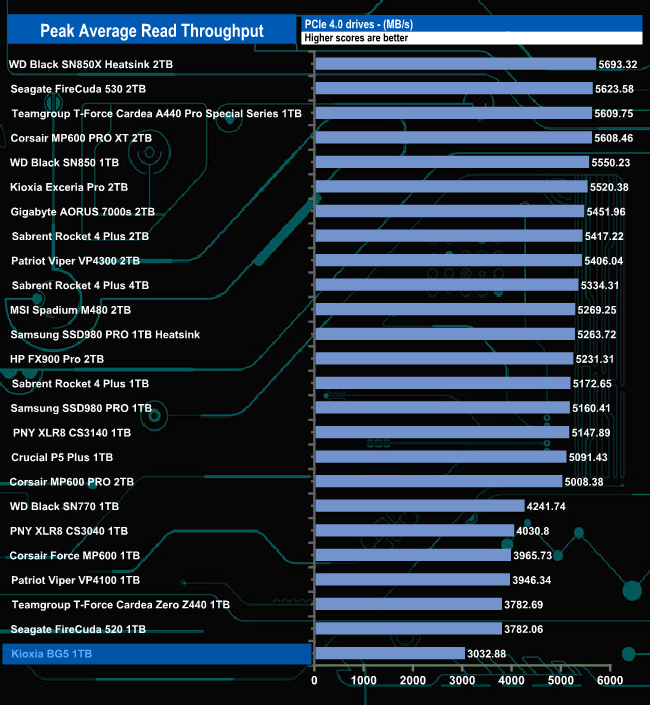
In our read throughput test, the drive peaks at the end of the test (16MB block mark) with a score of 3,032.88MB/s a fair bit behind the official read rating of 3,500MB/s and it sees the drive at the bottom of the results chart.
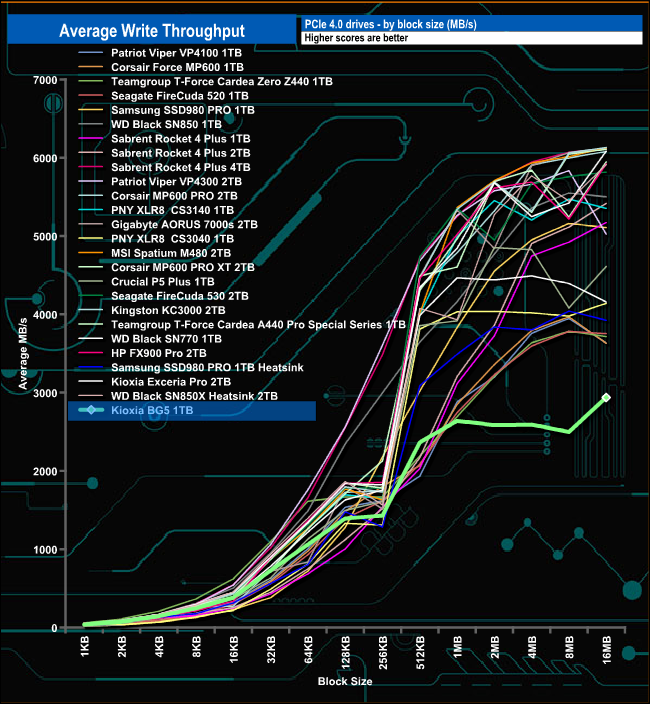
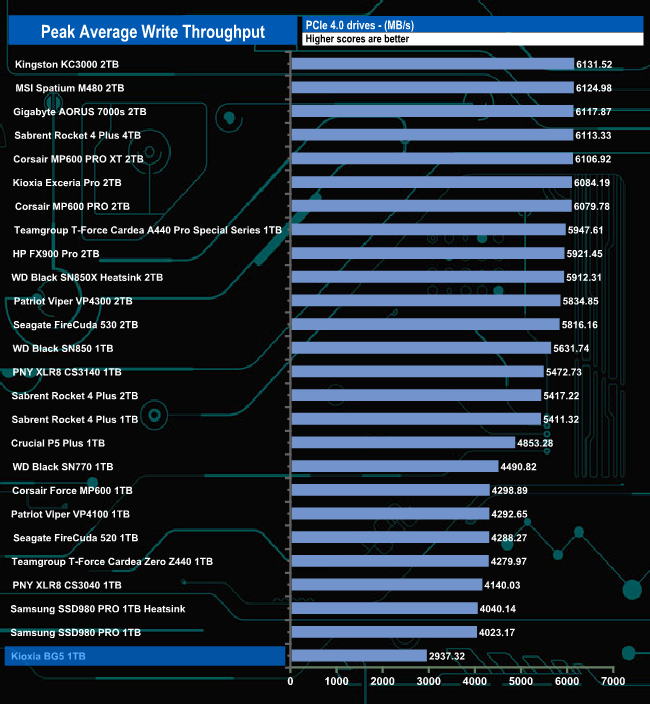
As with the read throughput test, the write test sees the drive peak at the end of the test run with a test figure of 2,937.32MB/s which, unlike the read figure, confirms the official write rating of 2,900MB/s but as with the read performance, that figure sees the drive propping up the table.
The PCMark 10 Full System Drive Benchmark uses a wide-ranging set of real-world traces from popular applications and common tasks to fully test the performance of the fastest modern drives. The benchmark is designed to measure the performance of fast system drives using the SATA bus at the low end and devices connected via PCI Express at the high end.
The goal of the benchmark is to show meaningful real-world performance differences between fast storage technologies such as SATA, NVMe, and Intel’s Optane. The Full System Drive Benchmark uses 23 traces, running 3 passes with each trace. It typically takes an hour to run.
Traces used:
- Booting Windows 10.
- Adobe Acrobat – starting the application until usable.
- Adobe Illustrator – starting the application until usable Adobe Premiere Pro – starting the application until usable.
- Adobe Photoshop – starting the application until usable.
- Battlefield V – starting the game until the main menu.
- Call of Duty Black Ops 4 – starting the game until the main menu.
- Overwatch – starting the game until main menu.
- Using Adobe After Effects.
- Using Microsoft Excel.
- Using Adobe Illustrator.
- Using Adobe InDesign.
- Using Microsoft PowerPoint.
- Using Adobe Photoshop (heavy use).
- Using Adobe Photoshop (light use).
- cp1 Copying 4 ISO image files, 20 GB in total, from a secondary drive to the target drive (write test).
- cp2 Making a copy of the ISO files (read-write test).
- cp3 Copying the ISO to a secondary drive (read test).
- cps1Copying 339 JPEG files, 2.37 GB in total, to the target drive (write test).
- cps2 Making a copy of the JPEG files (read-write test).
- cps3 Copying the JPEG files to another drive (read test).
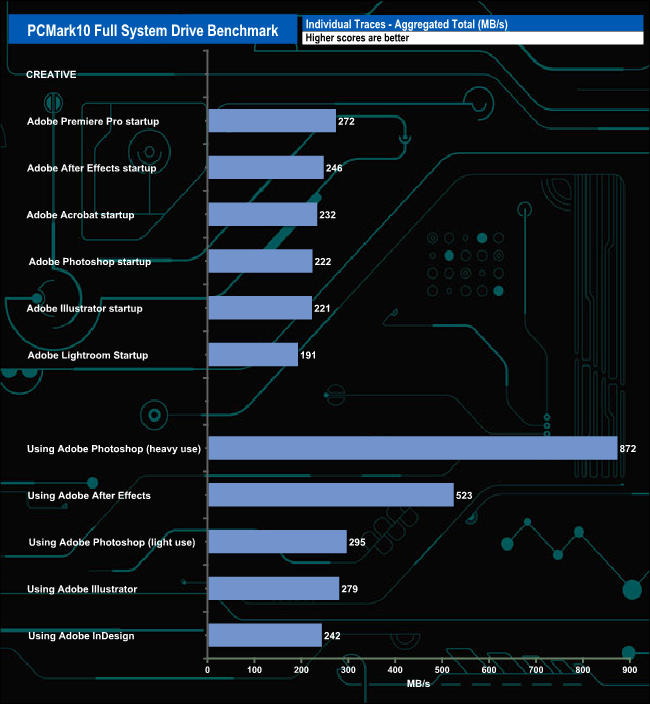
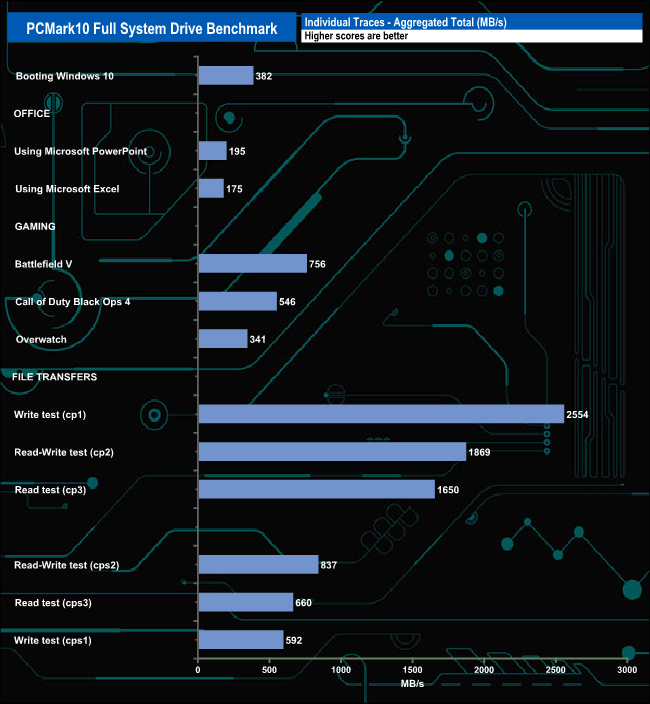
The best result from the 1TB Kioxia BG5 in PCMark10’s Full System Drive Benchmark Adobe test traces was the 872MB/s for the Heavy Use Adobe Photoshop trace while the best result in the gaming test traces was the 756MB/s from the Battlefield V trace. The file transfer tests also produced a good cp1 (write test) figure of 2,554MB/s backed up by the 1,869MB/s for the cp2 read/write and 1,650MB/s for the cp3 (read test) test traces.


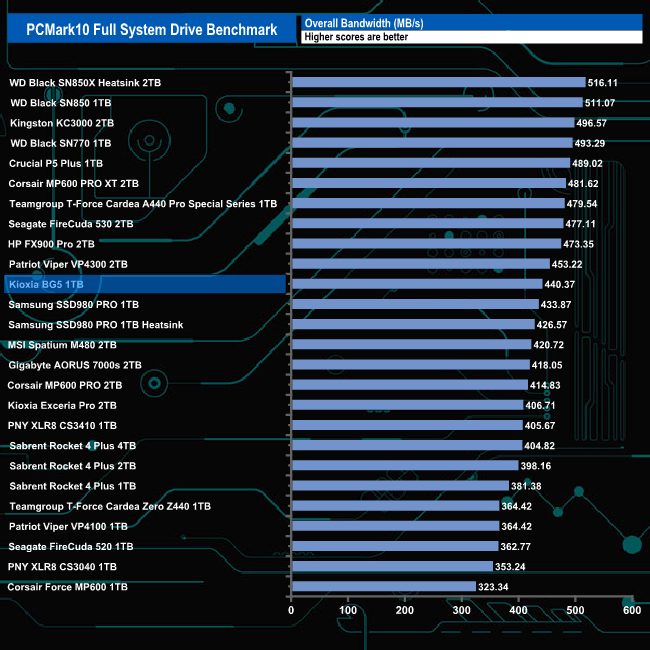
The overall bandwidth figure of 440.37MB/s sees the drive positioned in the mid-half of the table.
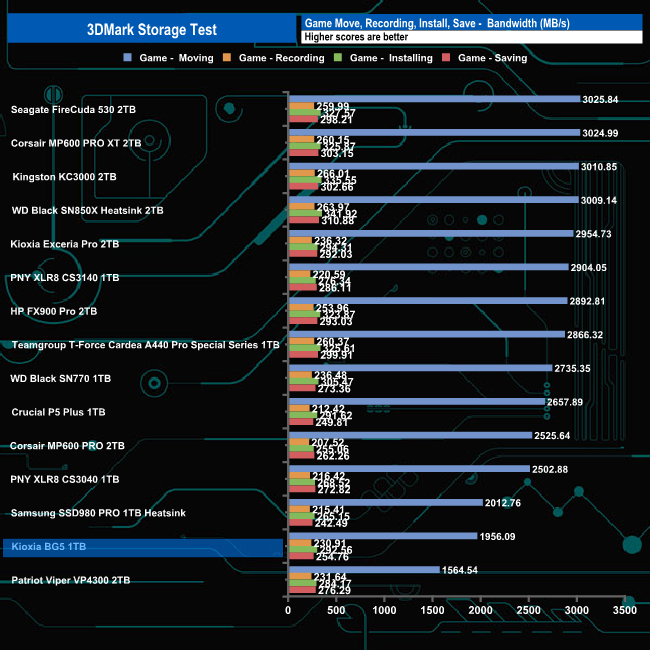
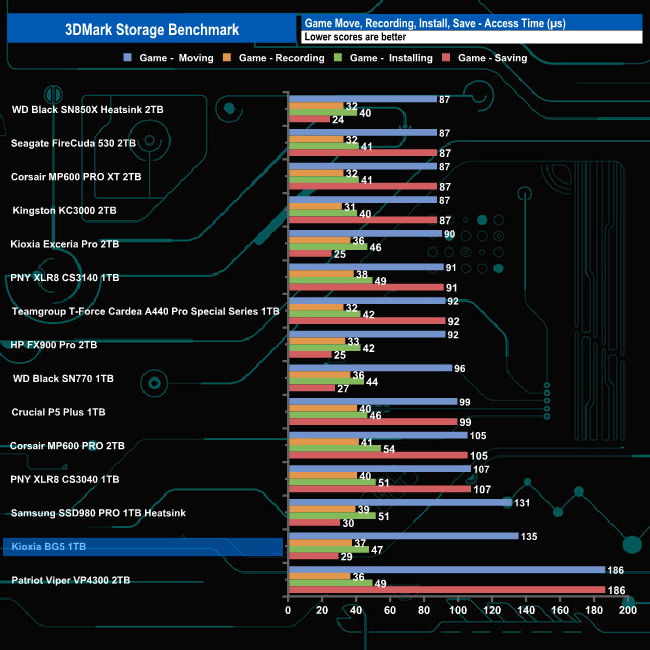
The 3DMark Storage Benchmark uses traces recorded from popular games and gaming-related activities to measure real-world gaming performance.
Traces used –
- Battlefield V
Loading Battlefield™ V from launch to the main menu. - Call of Duty Black Ops 4
Loading Call of Duty®: Black Ops 4 from launch to the main menu. - Overwatch
Loading Overwatch® from launch to the main menu. - Game Move
Copying the Steam folder for Counter-Strike®: Global Offensive from an external SSD to the system drive. - Game Recording
Recording a 1080p gameplay video at 60 FPS with OBS (Open Broadcaster Software) while playing Overwatch®. - Installing Game
Installing The Outer Worlds® from the Epic Games Launcher. - Game Saving
Saving progress in The Outer Worlds game.
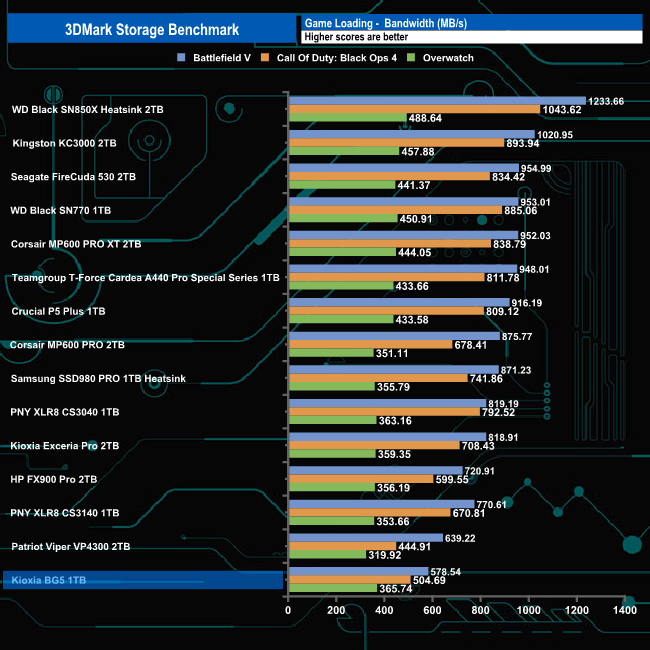
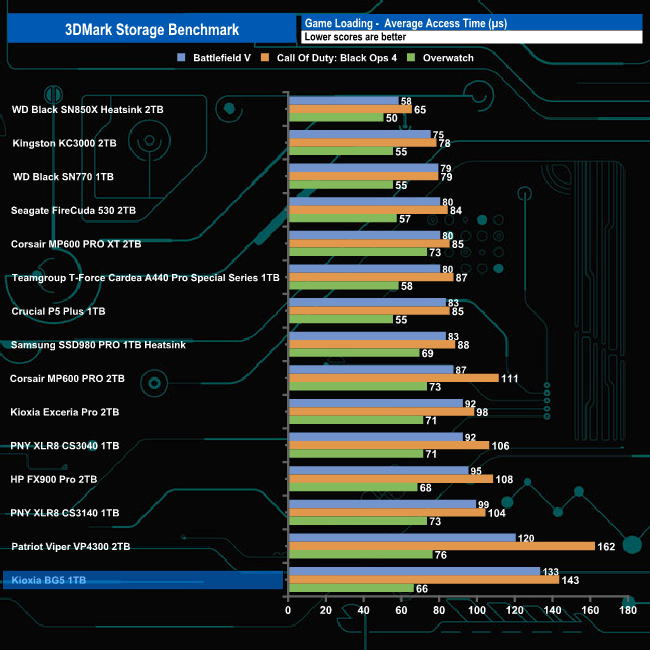
Kioxia's BG5 isn't a drive you would pick for gaming and to be fair to Kioxia, it's not marketed as one. In 3DMark’s Storage Test, the BG5 had an average bandwidth figure of 482MB/s for the three-game load tests (Battlefield V, Call of Duty: Black Ops 4 and Overwatch) with an average access time of 114µs for the same three games.
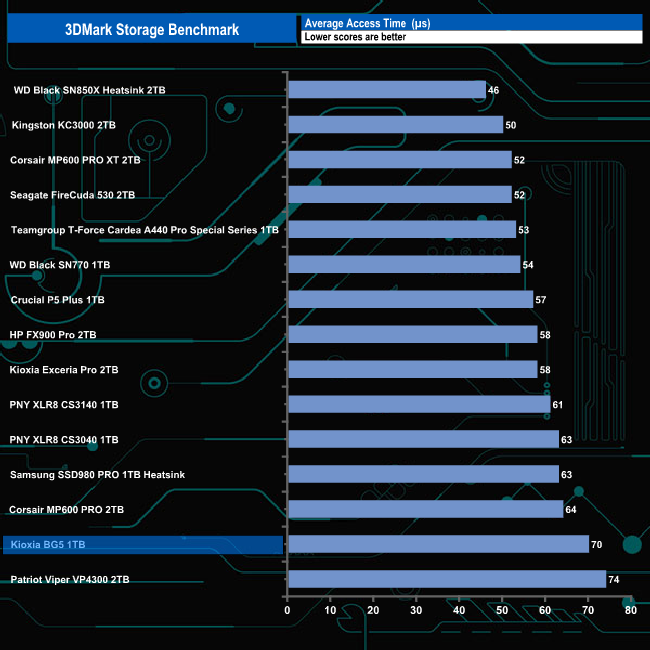
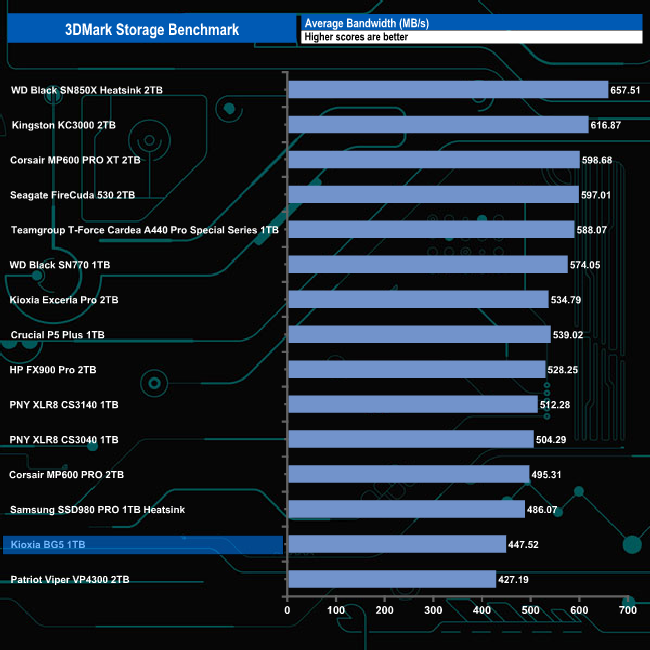
The overall average bandwidth figure for the complete test run was 447.52MB/s which sees the drive in last but one place in the results chart.
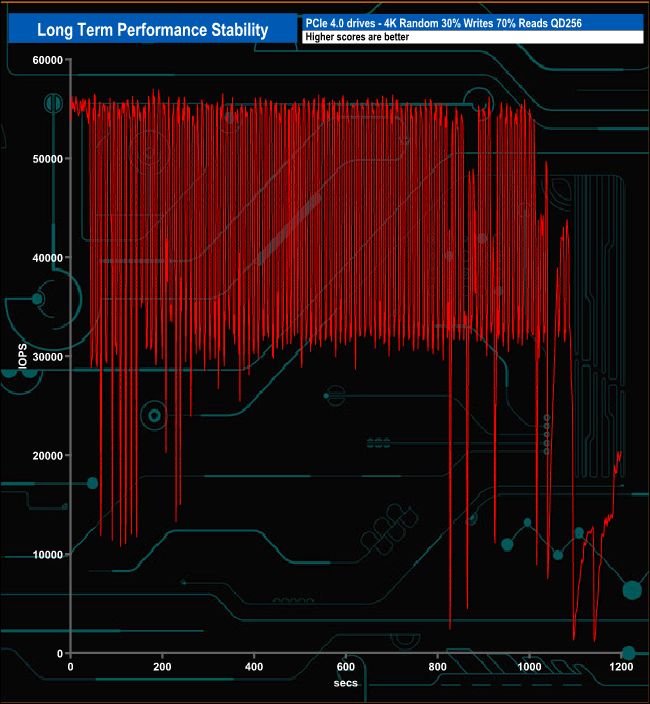
For the long-term performance stability test, we set the drive up to run a 20-minute 4K random test with a 30% write, 70% read split, at a Queue Depth of 256 over the entire disk. The 1TB Kioxia BG5 averaged 41,073 IOPS for the test with performance stability of 73%.
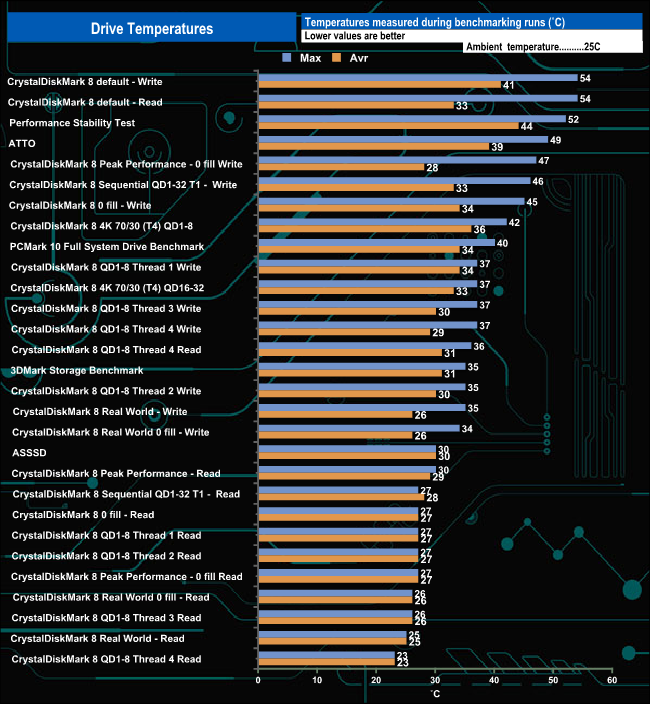
We took note of the drive’s temperature during some of our benchmarking runs. The Kioxia BG5 doesn't come with any form of a physical heat sink but it didn't seem to run that hot whatever we threw at it. The hottest it got was when it was being pushed hard during the CrystalDiskMark default tests and the Performance Stability test where the drive got to 54° C and 52° C respectively. Those temperatures are comfortably below the official maximum operating temps for the drive which is 95° C for the controller and 85° C for any other components.
To test the real-life performance of a drive we use a mix of folder/file types and by using the FastCopy utility (which gives a time as well as MB/s result) we record the performance of the drive reading from & writing to a 256GB Samsung SSD850 PRO.
- 100GB data file.
- 60GB iso image.
- 60GB Steam folder – 29,521 files.
- 50GB File folder – 28,523 files.
- 21GB 8K Movie demos.
- 12GB Movie folder – 24 files (mix of Blu-ray and 4K files).
- 11GB 4K Raw Movie Clips (8 MP4V files).
- 10GB Photo folder – 621 files (mix of png, raw and jpeg images).
- 10GB Audio folder – 1,483 files (mix of mp3 and .flac files).
- 5GB (1.5bn pixel) photo.
- Blu-ray movie.
![]()
![]()
Our real-life file transfers were dealt with by the Kioxia BG5 without any problems. The large file transfers averaged 545MB/s for writes and 455MB/s for writes. The slowest transfers were for the 50GB file folder, which is nearly always the case.
To get a measure of how much faster PCIe NVMe drives are than standard SATA SSD's we use the same files but transfer to and from a 2TB Kioxia Exceria Plus drive.
![]()
![]()
Switching over to the NVMe to NVMe file transfer tests saw the bandwidths rocket upwards and transfer times drop dramatically as you might expect. Five of the write speeds topped 2.6GB/s, the fastest being the 2,674MB/s for the 5GB image transfer. Four of the read transfers topped 2.6GB with two, the 12GB Movie and 8K Movie Scenes folders topping 2.7GB/s.
The fifth generation Kioxia BG drive, the BG5, is the first of the series to use a PCIe Gen 4 x 4 interface. Along with the faster interface, the drive uses Kioxia's BiCS5 112-layer TLC 3D NAND. The BG5 comes in two module sizes, (M.2 2230 and the more familiar M.2 2280) and three capacities; 256GB, 512GB and 1TB.
The previous BG drive, the fourth generation BG4 only appeared in M.2 1620 and M.2 2230 form factors thanks to the controller and flash being combined in a single package using a PCIe 3 x4 interface. The new BG5 sees the NAND and controller separated out.
This is due to the increasing power demands of the new interface meeting the thermal limits of a single chip design. Keeping the two components separate allows for betting cooling of the individual components. Also Instead of a DRAM cache, it uses NVMe Host Memory Buffer (HMB) technology, which uses a portion of the host memory (less than 100MB) to support caching demands.

An OEM part at present, Kioxia are aiming the BG5 at ultra-mobile, 2-in-1 notebook PCs, IoT/embedded devices and as boot drives for server and storage arrays. There is also a SED (Self-Encrypting Drive) version of the BG5 supporting the TCG OPAL 2.01 specification.
When it comes to Sequential performance, the official figures for the 1TB BG5 are up to 3,500MB/s for reads and up to 2,900MB/s for writes. Using the ATTO benchmark we couldn't hit either of those maximums with test results of 3,280MB/s for reads and 2,770MB/s for writes. However, using our own Sequential tests we could confirm the official ratings with peak figures of 3,534MB/s for reads and 2,914MB/s for writes.
Testing the 4K performance of the drive, we couldn't get close to the official maximums of up to 500,000 IOPS for reads and 450,000 IOPS for writes using our 4-threaded tests. The best read/write figures we saw were 359,765 IOPS and 281,205 IOPS respectively. However, turning to the Peak Performance profile of CrystalDiskMark 8 we could confirm both 530,527 IOPS for reads and 486,172 IOPS for writes.
Kioxia's BG5 isn't the fastest Gen4 drive we've seen by a long chalk, indeed some of the high-end Gen3 drives will give it a run for its money but what will be useful for OEMs is that the BG5 does it using fewer PCIe lanes than a Gen 3 drive, freeing up lanes for other components in a system.
Pros:
- Choice of form factors (M.2 Type 2230 and M.2 Type 2280).
- Doesn't get too hot when pushed.
Cons:
- OEM part only at present.
- Not the fastest Gen4 drive we've seen.
KitGuru says: Although an OEM part, the BG5 may well find its way to the consumer space in one form or another in the not-too-distant future.