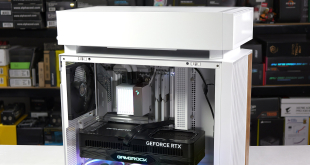

One of the latest models to join Klevv's Gen 4 SSD lineup is the CRAS C925G, a drive that utilises a DRAM-less design controller supporting NVMe 2.0 and features a thin copper-graphene composite heatsink.
The M.2 2280 Klevv CRAS C925G combines a Maxio MAP1602 4-channel DRAM-less controller and 238-Layer 3D TLC NAND. Available in 500GB, 1TB and 2TB (the drive we are looking at here) capacities, the drive comes with a very thin copper-graphene composite heatsink to help keep it cool.
Officially, the 2TB CRAS C925G is rated as up to 7,400MB/s and 6,500MB/s for Sequential reads and writes, respectively. The 500GB and 1TB drives have the same read rating, but with 6,200MB/s and 6,300MB/s, respectively, write ratings.
The random 4K read performance for the range is quoted up to 670,000 IOPS for the 500GB and 1TB drives, with the 2TB drive rated at up to 700,000 IOPS. As for random writes, the 500GB and 1TB drives are rated as up to 980,000 IOPS, with the 2TB drive getting a 1M IOPS figure.
The endurance for the 2TB CRAS C925G is 2400TBW, the 1TB drive gets 1200TBW and the 500GB drive gets 600TBW.
Klevv backs the CRAS C925G with a 5-year warranty.
Physical Specifications:
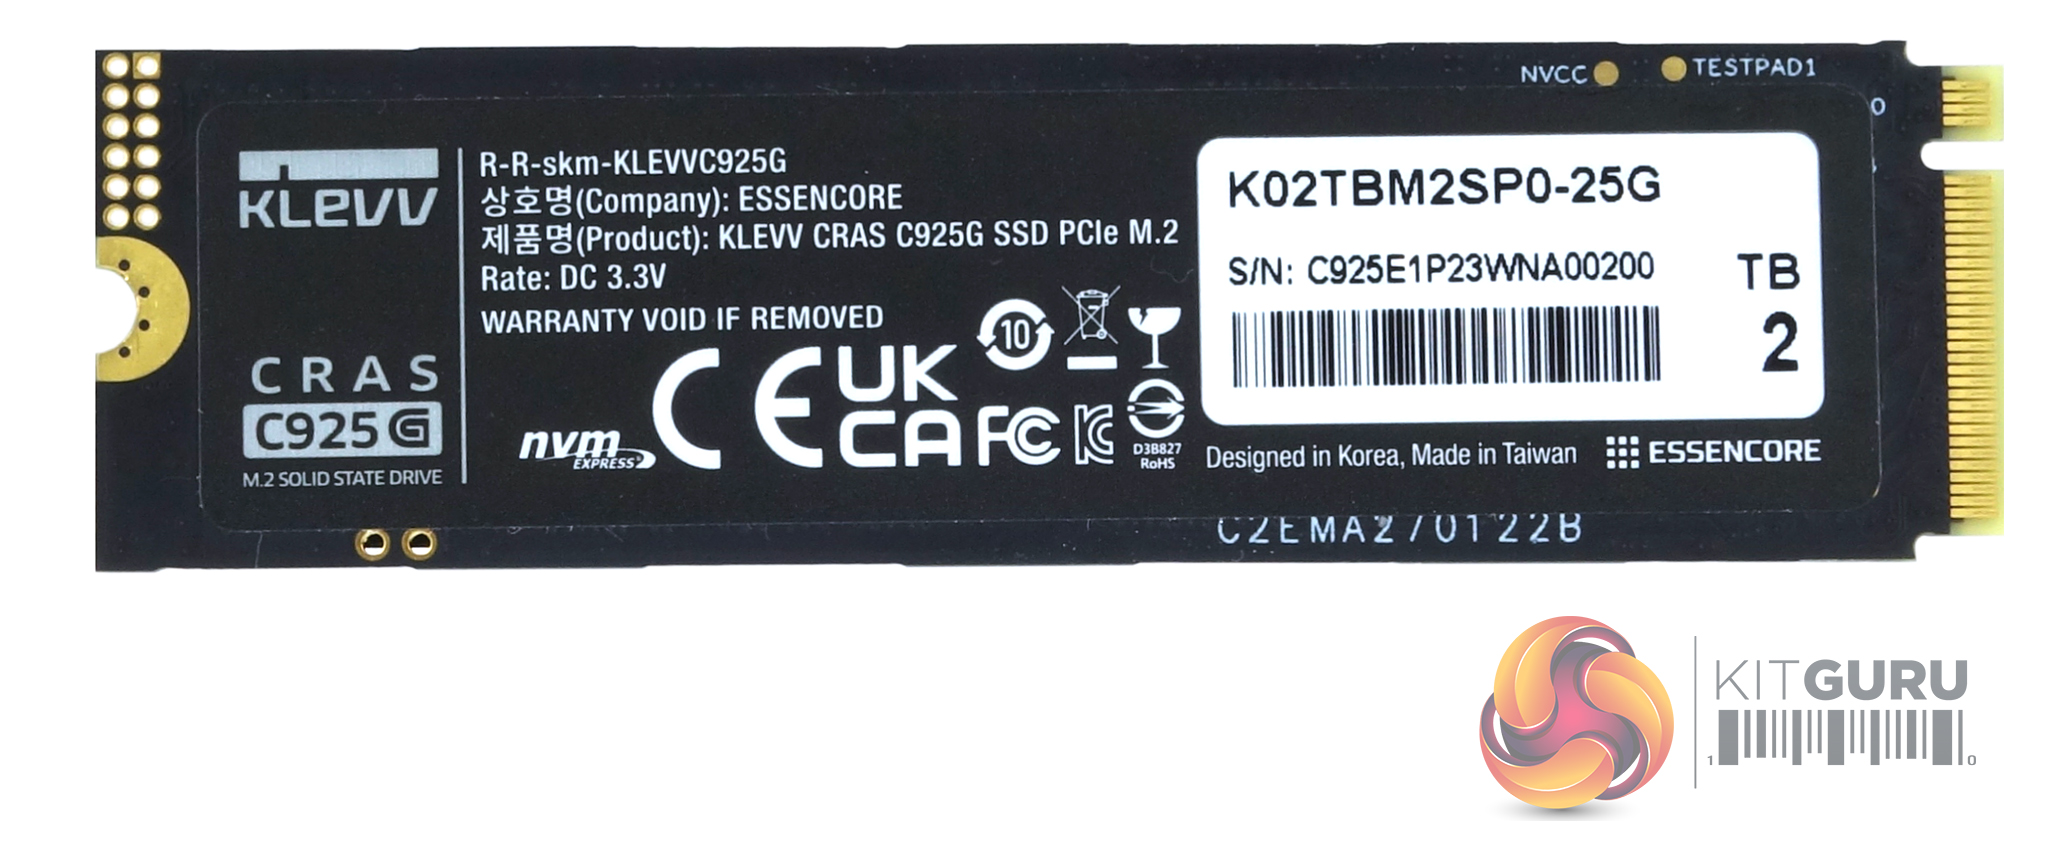
- Usable Capacities: 2TB.
- NAND Components: 238-Layer 3D TLC,
- NAND Controller: Maxio MAP1602.
- Cache: None, DRAM-less (HMB).
- Interface: PCIe Gen 4 x4, NVMe 2.0.
- Form Factor: M.2,2280.
- Dimensions: 80 x 22 x 2.8mm.
- Drive Weight: 9g.
Firmware Version: SVN27141.
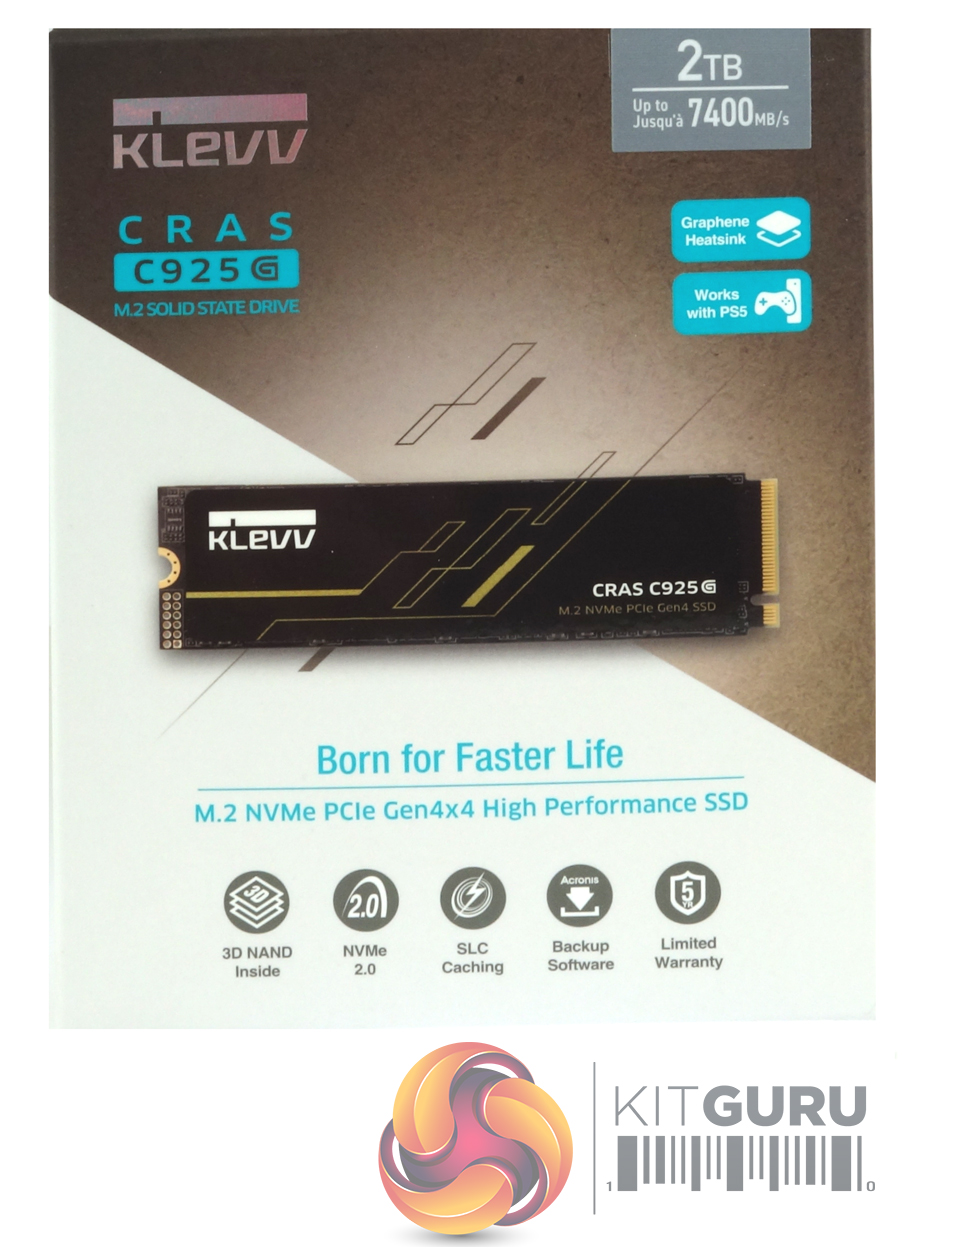
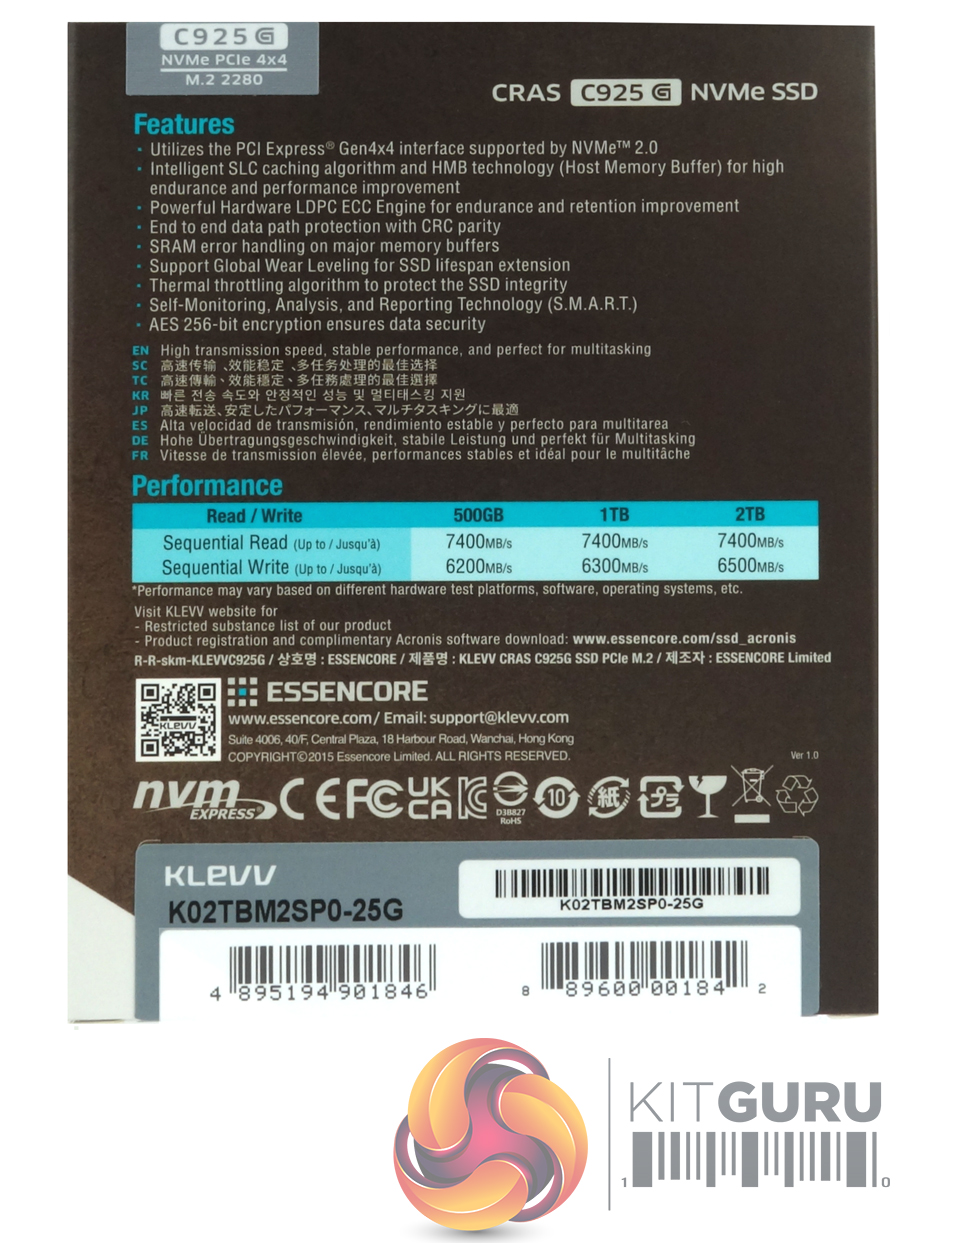
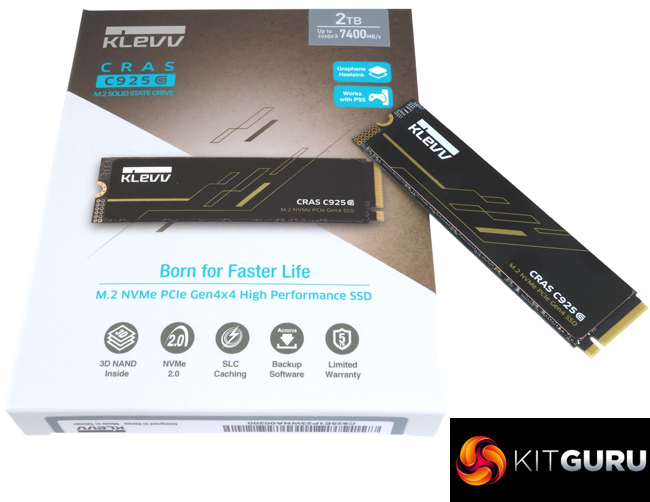
The Klevv CRAS C925G ships in a compact box with a clear image of the drive in the centre. Above this image, in the top right-hand corner, is a sticker which holds the drive's capacity (2TB) and maximum Sequential read speed (7,400MB/s). Under this, we find two more icons for the graphene heatsink and the fact that the drive works with PS5. Below the drive's image is a row of five icons for 3D NAND, NVMe 2.0, SLC Caching, Backup software and a 5-year limited warranty.
The rear of the box has a detailed feature list under which is a multi-lingual statement about transmission speed, stable performance and what the drive is good for. Under this is a performance table for all three drives in the range, displaying Sequential read/write speeds. To keep the drive cool, Klevv has used a thin graphene-copper composite heatsink, thinner and lighter than the heatsink supplied with the original CRAS C925.
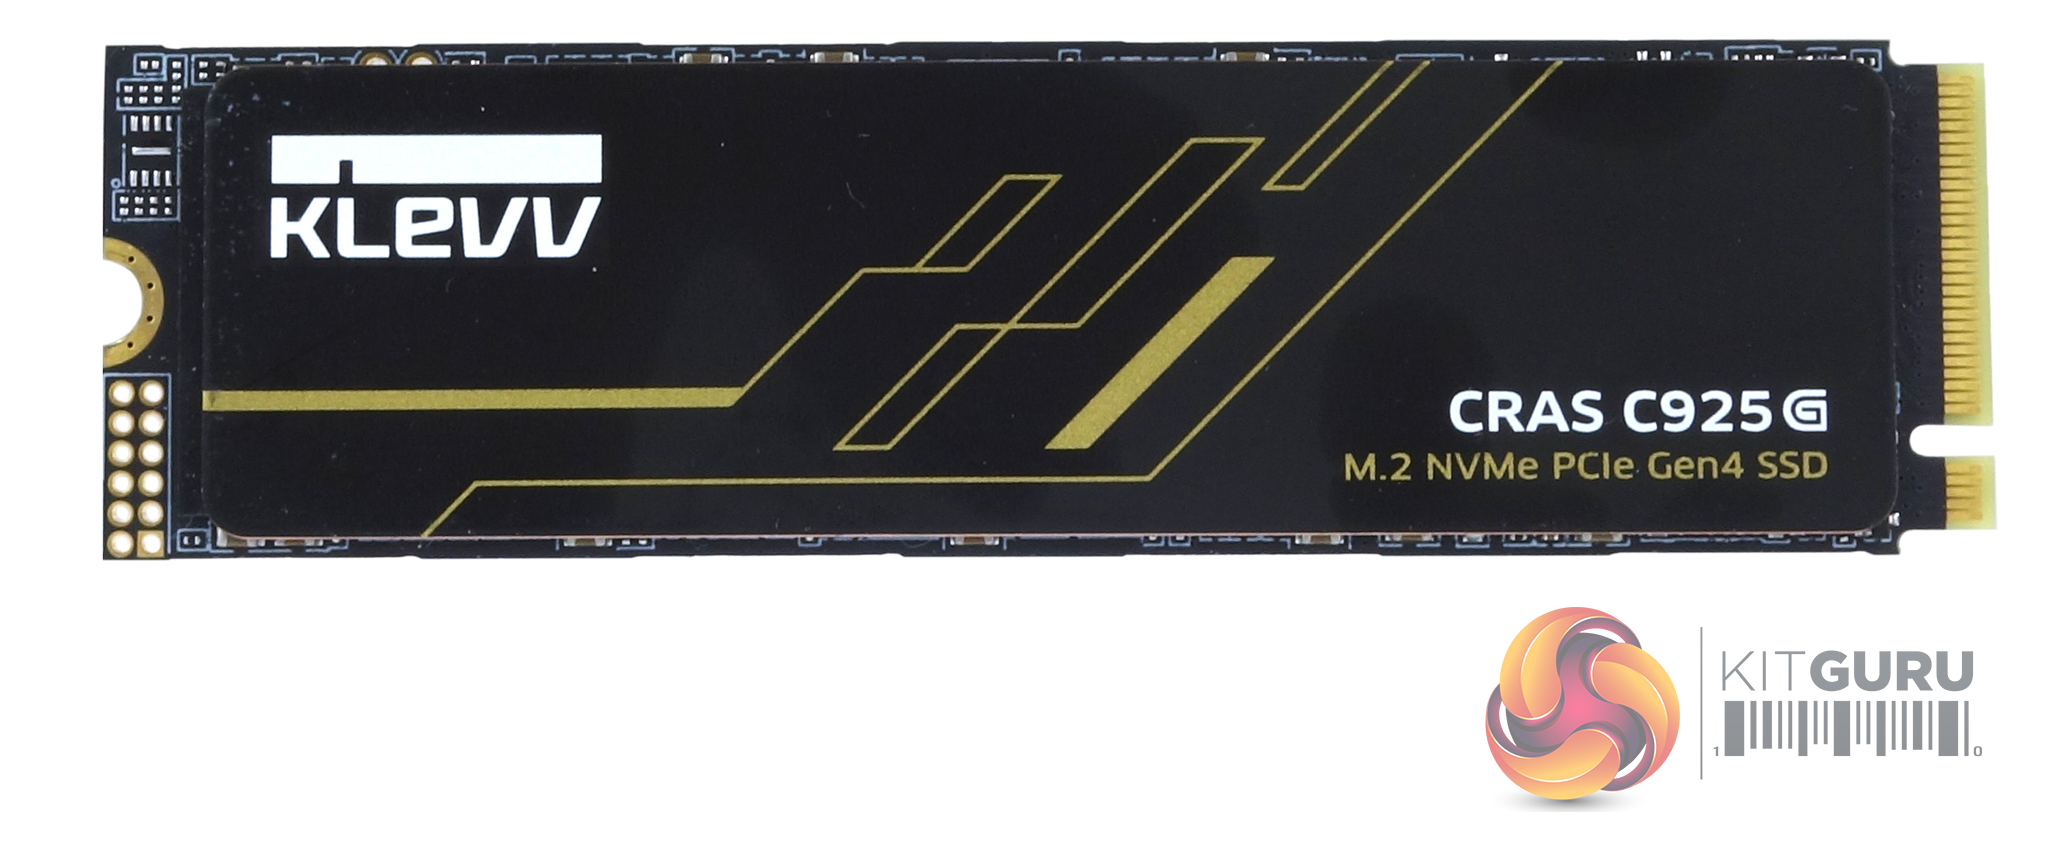
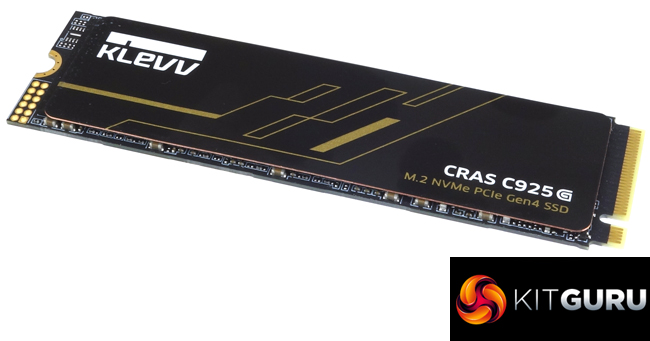
The 2TB CRAS C925G is built on a single-sided M.2 2280 format. The drive uses a DRAM-less design, Maxio MAP1602 4-channel controller. The MAP1602 is built on a 12nm TSMC process and has a very small footprint with just a 7.1mm x 11mm package. It uses ARM Cortex-R5 architecture; the MAP1602 supports up to 4TB of 2D MLC/TLC or 3D MLC/TLC/QLC with an interface speed of up to 2400MT/s, which is faster than some of its DRAM-less competitors. Error correction is provided by MAXIO Agile ECC 3 Technology, which provides error correction, and the drive also supports AES 256-bit encryption.
Maxio quote Sequential read / write performance figures for the controller of up to 7,400MB/s and 6,500MB/s, respectively. 4K random performance is rated as up to 1,000K IOPS for both random reads and writes.
For the 2TB CRAS C925G Klevv has matched the controller with two packages of Essencore ENFGGP8NC5LR-HR (rebranded SK Hynix) 238-Layer 3D TLC NAND.
For testing, the drives are all wiped and reset to factory settings by HDDerase V4. We try to use free or easily available programs and some real-world testing so you can compare our findings against your own system.
This is a good way to measure potential upgrade benefits.
Main system:
AMD Ryzen 7 7700X, 32GB DDR5-6000, Nvidia GeForce RTX 3050 and a Gigabyte AORUS X670E Xtreme motherboard.
Other drives
Corsair MP600 GS 2TB
Corsair MP600 PRO 2TB
Corsair MP600 PRO XT 2TB
Corsair MP600 Elite Heatsink 2TB
Crucial P310 2280 2TB
Crucial T500 2TB
Gigabyte AORUS 7000e 2TB
HP FX900 Pro 2TB
Kingston Fury Renegade Heatsink 2TB
Kingston KC3000 2TB
Kioxia Exceria Plus 2TB
Kioxia Exceria Plus G3 2TB
Kioxia Exceria Pro 2TB
Klevv CRAS C910 2TB
Klevv CRAS C925 2TB
Klevv CRAS C930 2TB
Lexar NM790 4TB
Lexar NM790 with Heatsink 4TB
Lexar Professional NM800PRO Heatsink 2TB
MSI Spatium M480 2TB
Netac NV7000-t 2TB
Patriot Viper VP4300 2TB
Sabrent Rocket 4 Plus 2TB
Sabrent Rocket 4 Plus 4TB
Samsung SSD990 PRO 2TB
Samsung SSD990 EVO Plus 2TB
Solidigm P41 Plus 2TB
Seagate Lightsaber Collection Special Edition FireCuda 2TB
Seagate FireCuda 530 2TB
WD Black SN850X Heatsink 2TB
WD_Black SN770M 2TB
Software:
Atto Disk Benchmark 4 & 5.
CrystalDiskMark 8.0.0.
AS SSD 2.0.
UL Solutions PC Mark 10.
UL Solutions 3DMark Storage Benchmark.
Final Fantasy XIV Endwalker Official Benchmark.
All our results were achieved by running each test five times with every configuration, which ensures that any glitches are removed from the results. Trim is confirmed as running by typing fsutil behaviour query disabledeletenotify into the command line. A response of disabledeletenotify =0 confirms TRIM is active.
CrystalDiskMark is a useful benchmark to measure theoretical performance levels of hard drives and SSDs. We are using v8.0.5.
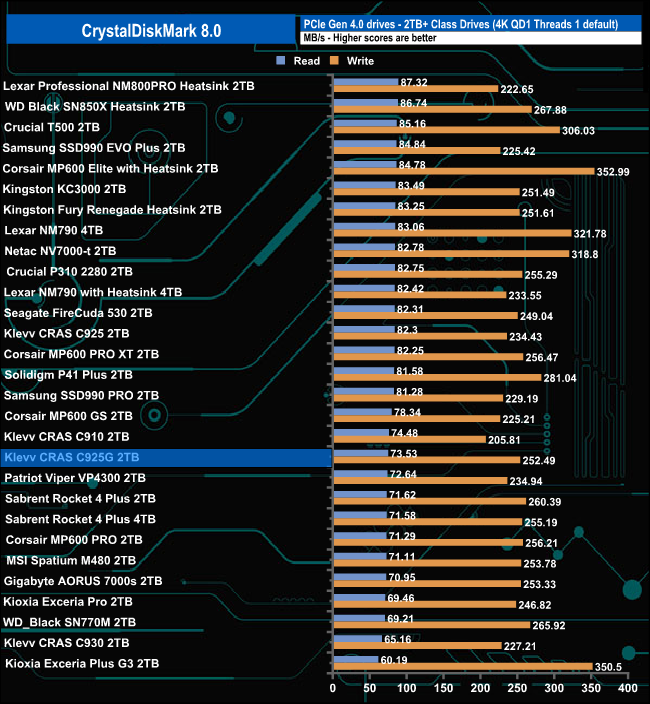
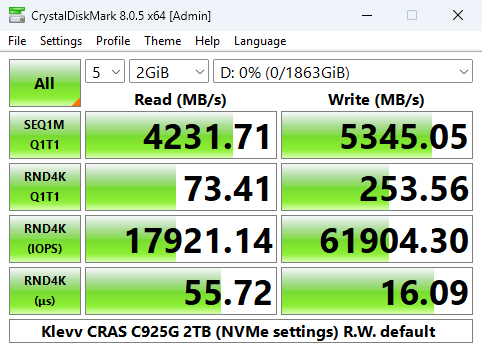
The CRAS C925G read score of 73.53MB/s in CrystalDiskMark 8's 4K QD1 is 8.77MB/s slower than the CRAS C925, but its write performance has improved from 234.43MB/s to 252.49MB/s, representing an increase of 18MB/s.
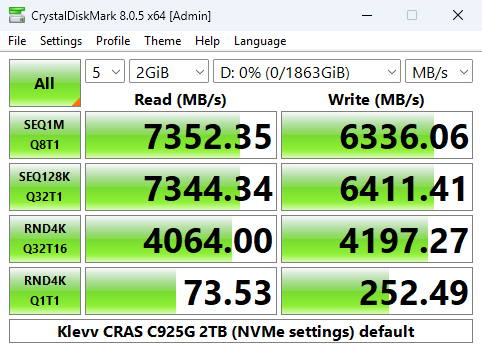
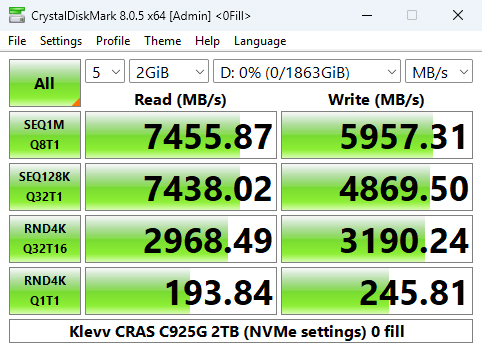
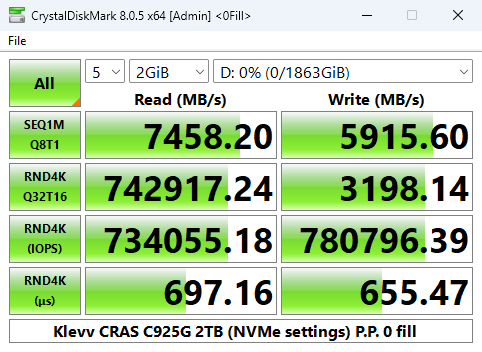
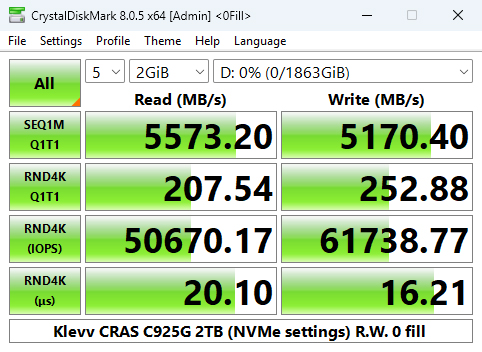
A glance at the benchmark result screens shows that using the default test, the drive came up a little short of the official maximums of 7,400MB/s and 6,500MB/s for Sequential reads and writes, respectively. Although switching over to the compressible data test, we could confirm the official read figure, but the write performance dropped some 378MB/s.
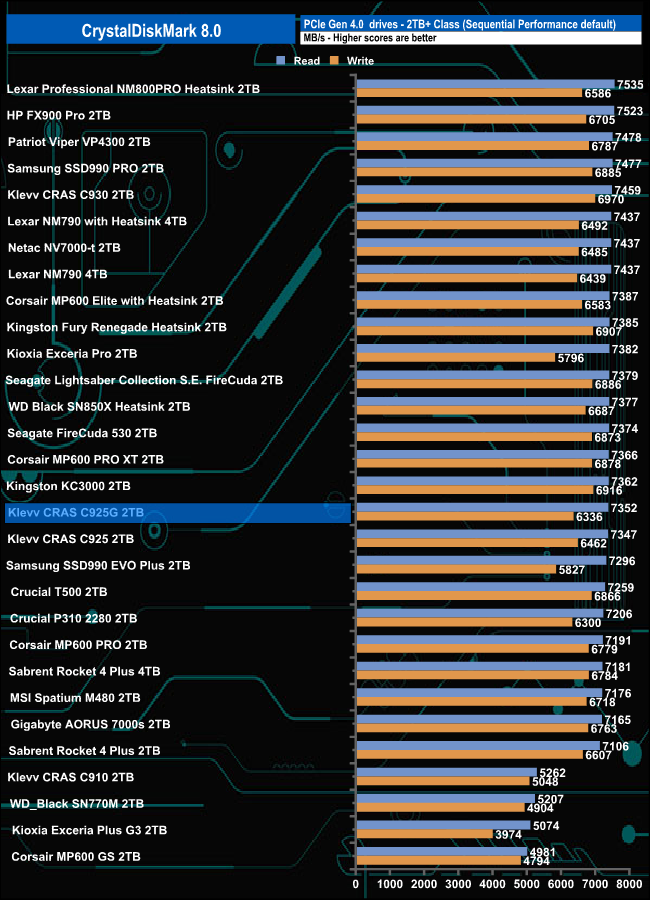
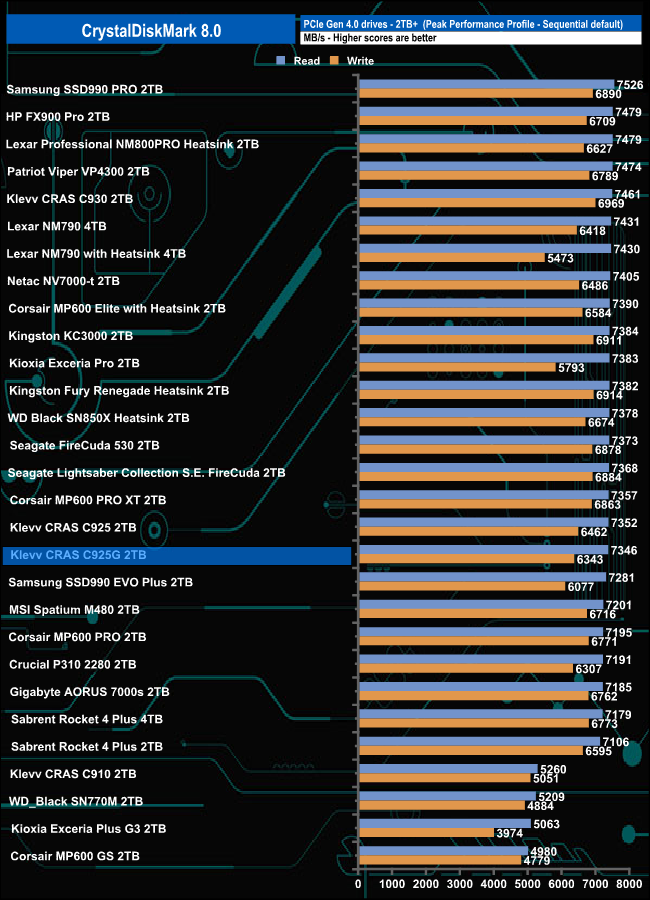
The CRAS C925G Sequential read test result of 7,352 MB/s places the drive in a lower mid-position in the results chart.
Peak Performance Profile
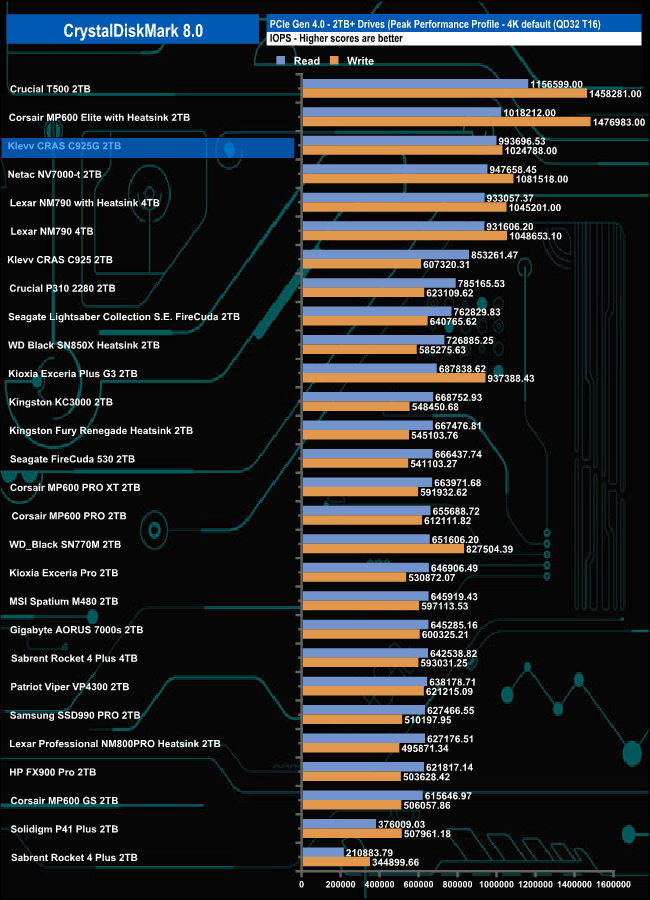
The drive is officially rated at 700,000 IOPS for random reads, and using the Peak Performance profile of CrystalDiskMark8, we got a nice increase on the official rating at 993.696 IOPS. We could confirm the official random performance of 1M IOPS with a test result of 1,024,788 IOPS.
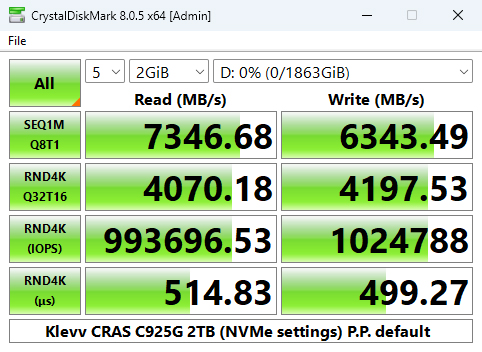
As with the default test, we couldn't confirm the official maximums for Sequential performance for either reads or writes.
Real World Profile
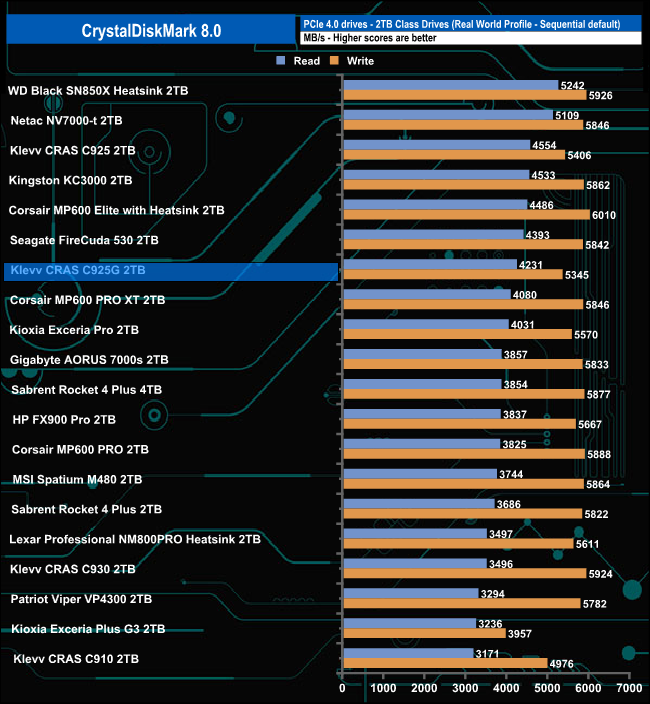
In the Real World profiles test, the drive's Sequential read result of 4,231MB/s sees it slip into the top ten in the results chart. Its write performance, however, is somewhat stronger at 5,345MB/s.
The ATTO Disk Benchmark performance measurement tool is compatible with Microsoft Windows. Measure your storage system's performance with various transfer sizes and test lengths for reads and writes. Several options are available to customise your performance measurement, including queue depth, overlapped I/O and even a comparison mode with the option to run continuously. Use ATTO Disk Benchmark to test any manufacturer's RAID controllers, storage controllers, host adapters, hard drives and SSD drives and notice that ATTO products will consistently provide the highest level of performance to your storage. ATTO uses RAW or compressible data.
We are using version 4.1 for our NVMe disk tests with a set length of 256mb and testing both the read and write performance. We will also start using ATTO 5 for testing drives. ATTO 5 has new features, enhancements and changes which allow it to benchmark modern SSDs more thoroughly than previous versions.
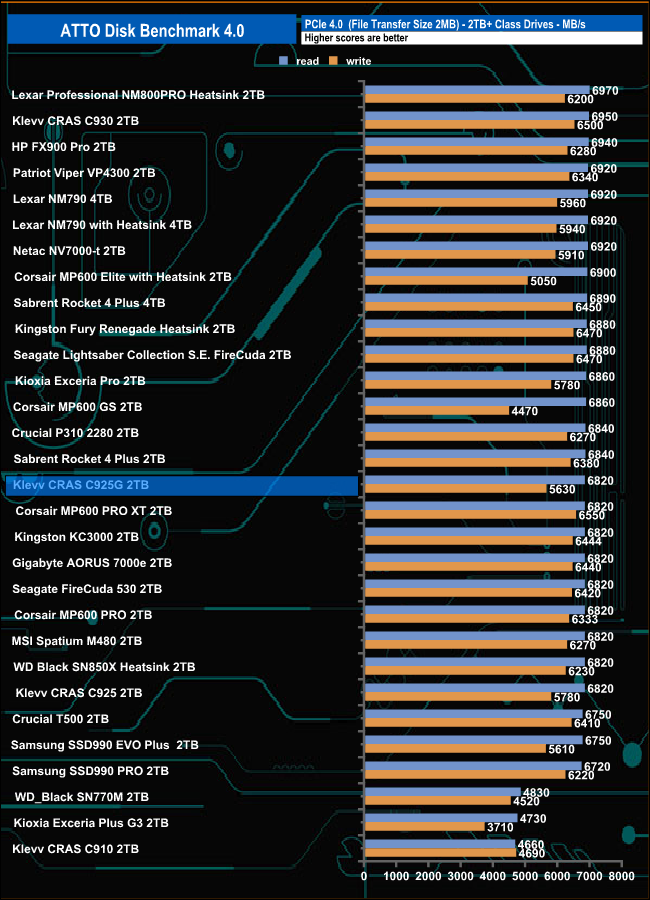
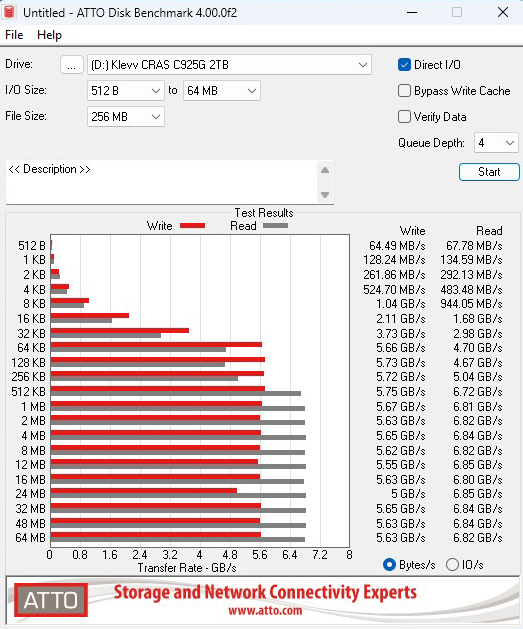
With the ATTO 4 benchmark results, the drive fell short of the official 7,400MB/s and 6,500MB/s for Sequential reads and writes respectively, with reads at 6,820MB/s and writes at 5,630MB/s, results which sees the drive in a mid position in the results chart.
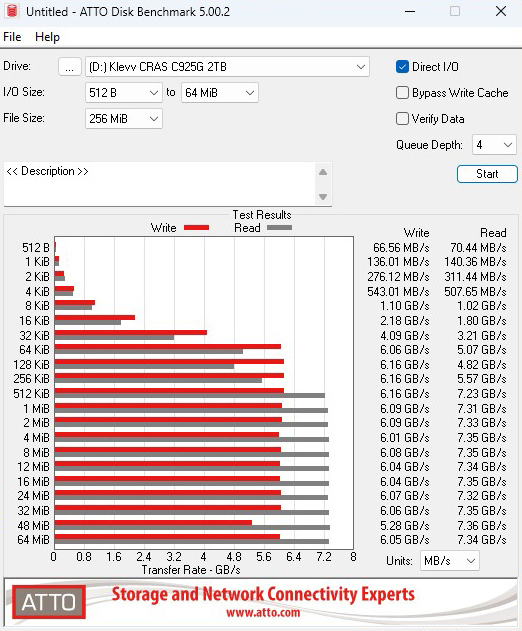
Using ATTO 5, we still couldn't confirm the official figures, but got closer at 7,330MB/s for reads and 6,090MB/s for writes.
AS SSD is a great free tool designed just for benchmarking Solid State Drives. It performs an array of sequential read and write tests, as well as random read and write tests with sequential access times over a portion of the drive. It uses
incompressible data samples, which many drives struggle with, so results can be viewed as the worst-case scenarios.
AS SSD includes a sub suite of benchmarks with various file pattern algorithms, but it is difficult to judge accurate performance figures.
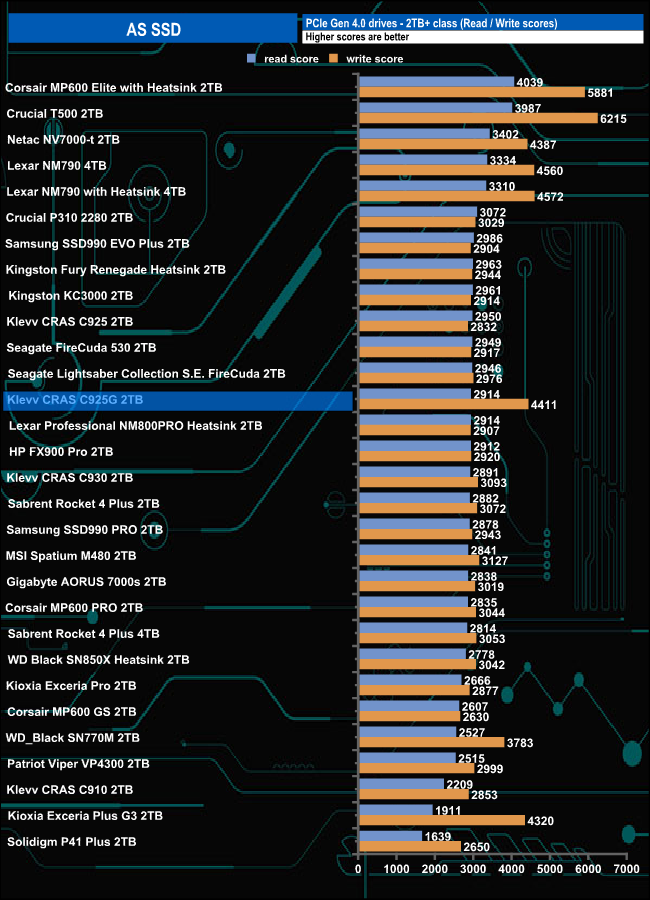
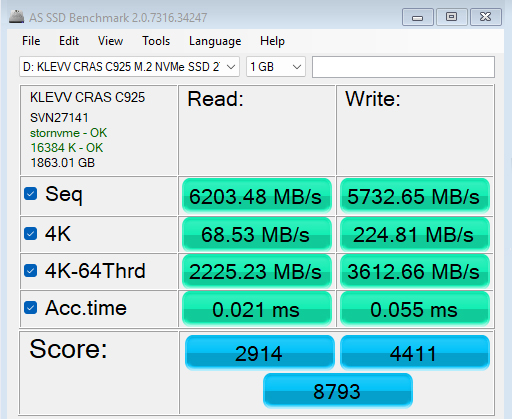
The 2TB CRAS C925G read score of 2914 is good enough to slip the drive into the top mid section of our results chart, but the write score is much stronger.
We used CrystalDiskMark 8‘s custom settings to test the Sequential read and write performance of the drive through a range of queue depths. The setup for the tests is listed below.
128KB Sequential Read / Write.
Transfer Request Size: 128KB, Thread(s): 1, Outstanding I/O: 1-32.
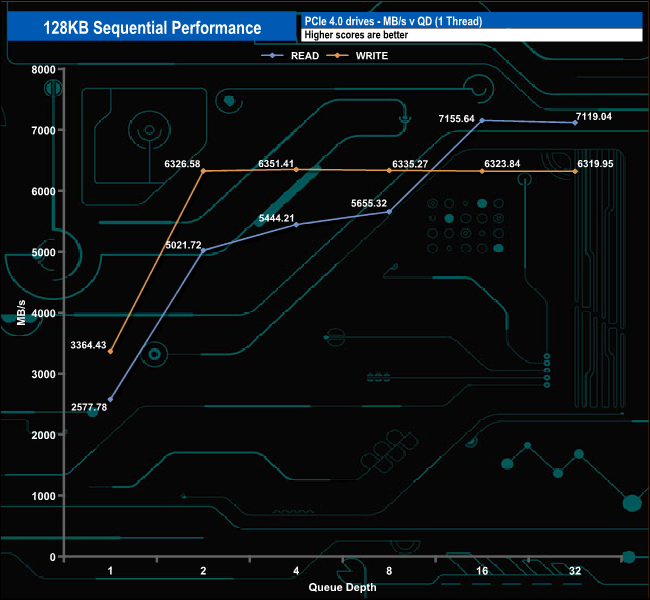
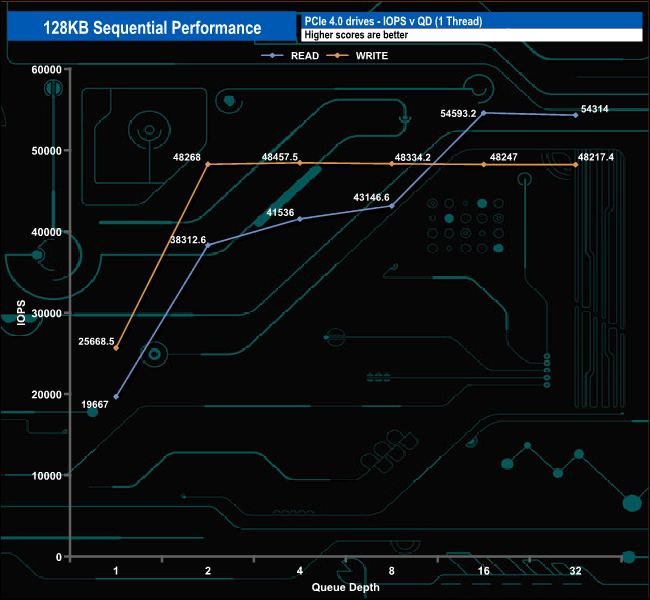
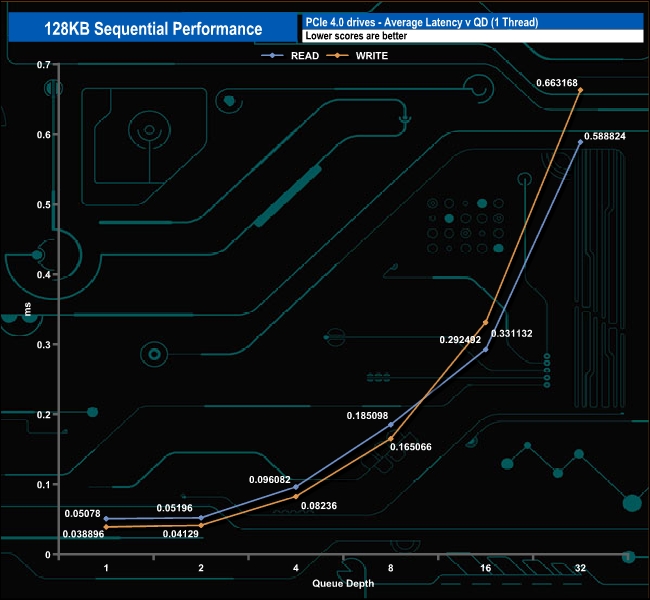
With our 128KB Sequential tests, we came up just short of the maximum figures for the drive in both the read and write tests. The read figure of 7,155MB/s (QD16) is 245MB shy of the official 7,400MB/s, while the writes are just 149MB/s shy of the official 6,500MB/s, with a peak of 6,351MB/s (QD4).
128KB Sequential Read Performance v QD
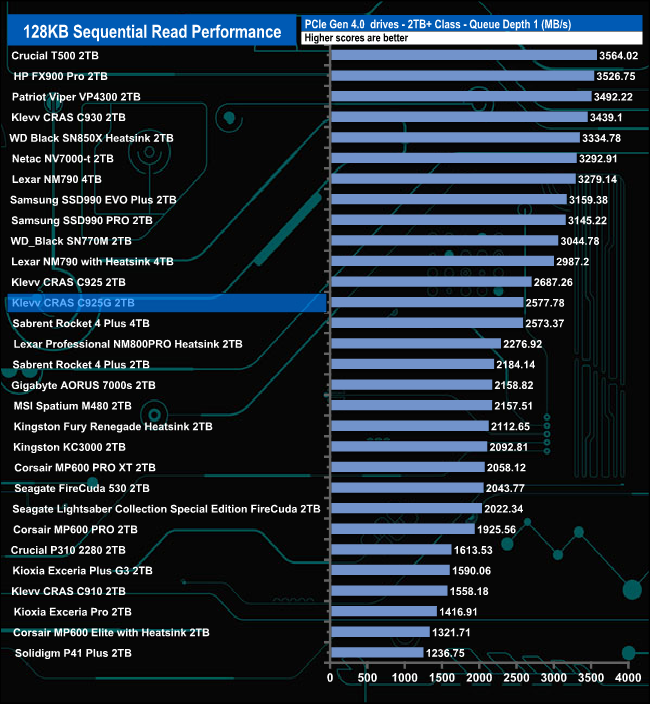
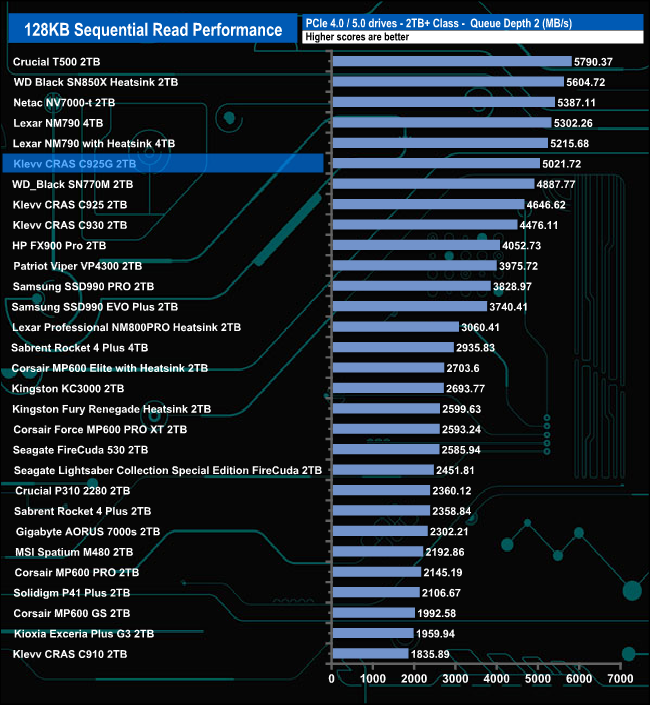
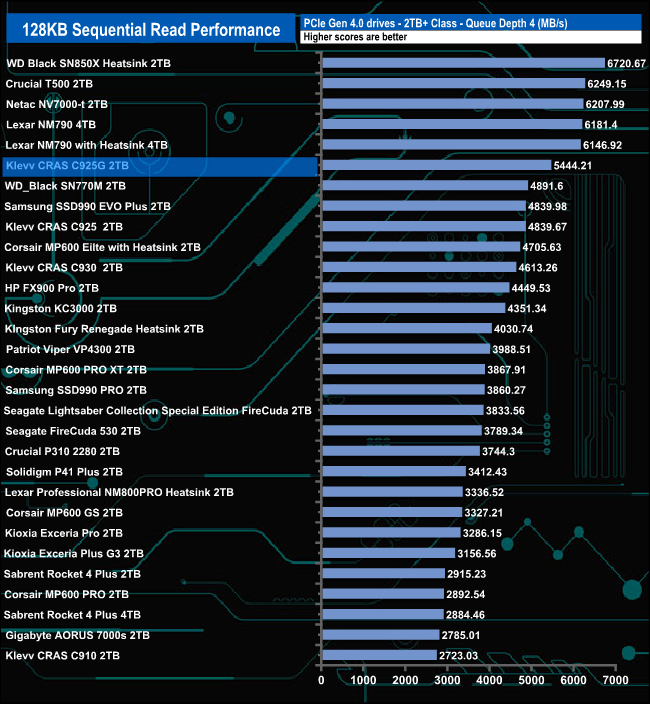
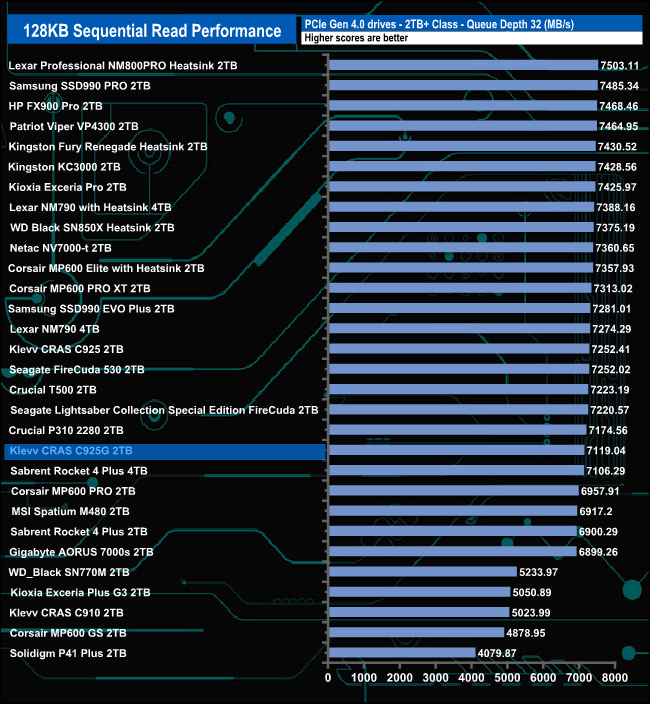
At QD1, the 2TB CRAS C925G sits just outside the top ten of the Sequential read results table. At QDs 2 and 4, it makes progress up the charts, but at QD32 it drops to a lower mid-table position.
128KB Sequential Write Performance v QD
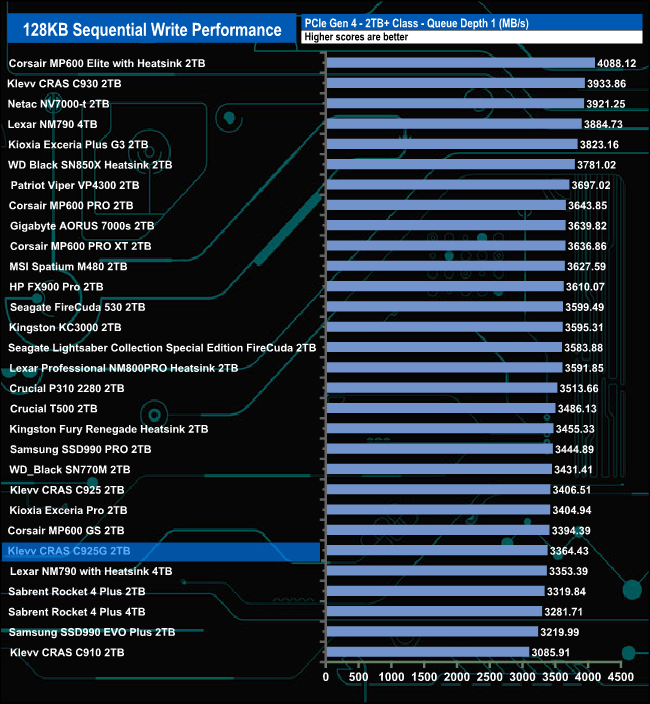
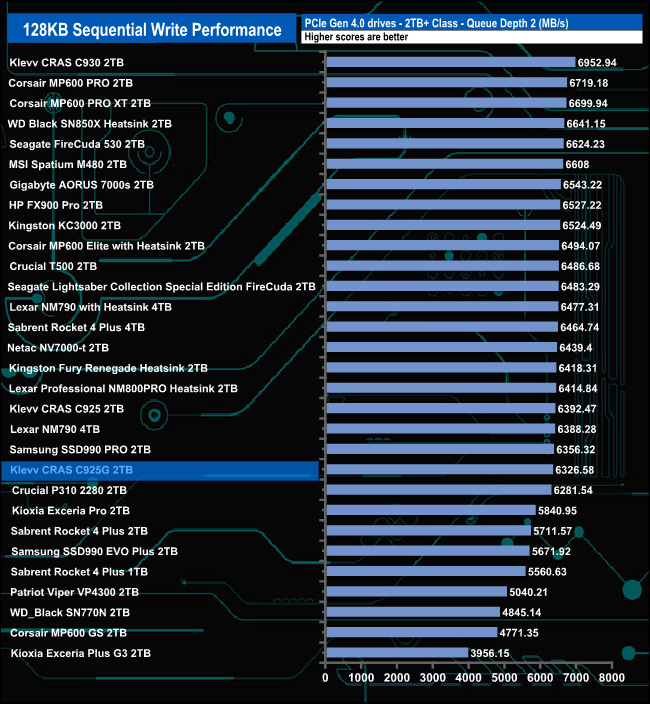
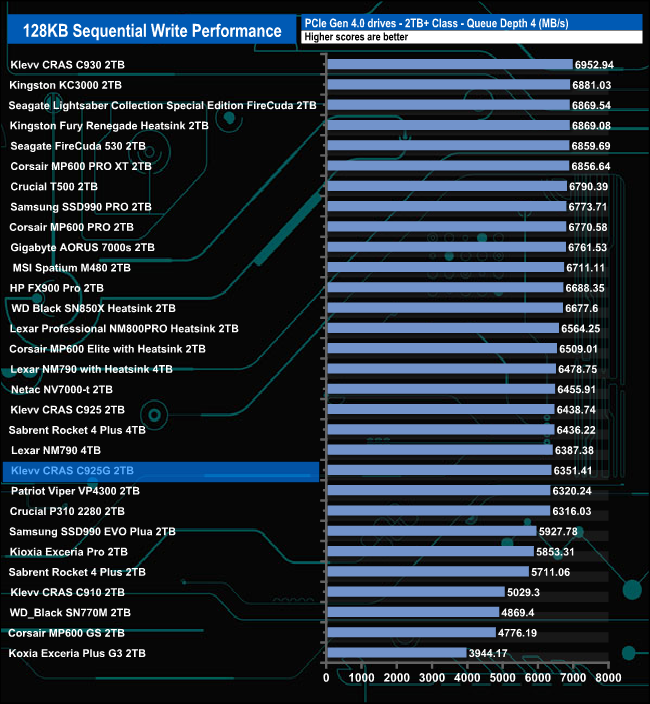
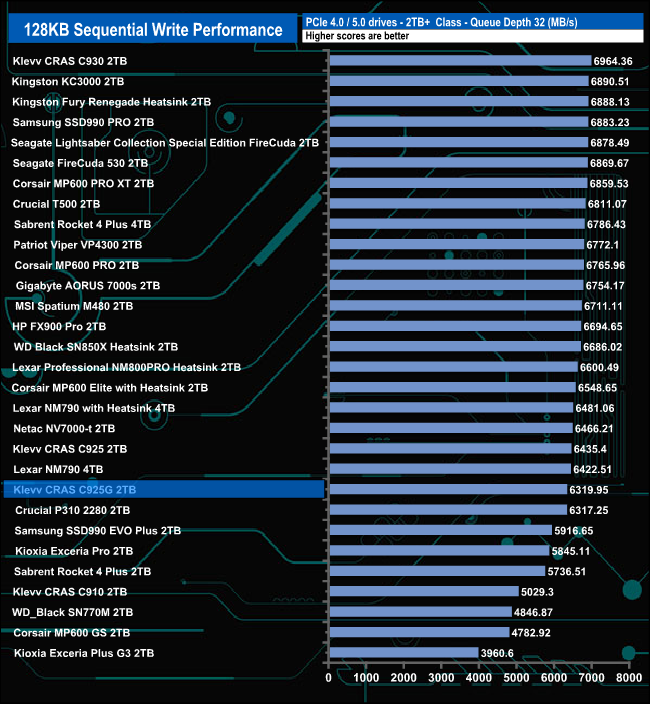
When it came to the Sequential write test, the drive's worst performance compared to the other drives was surprisingly at QD1. As the queue depth deepened, the performance improved, and the drive started to climb up the table with the best performance at QD4.
We used CrystalDiskMark 8‘s custom settings to test the 4K random read performance of the drive through a range of queue depths. The setup for the tests is listed below.
Transfer Request Size: 4KB, Outstanding I/O: 1-32.
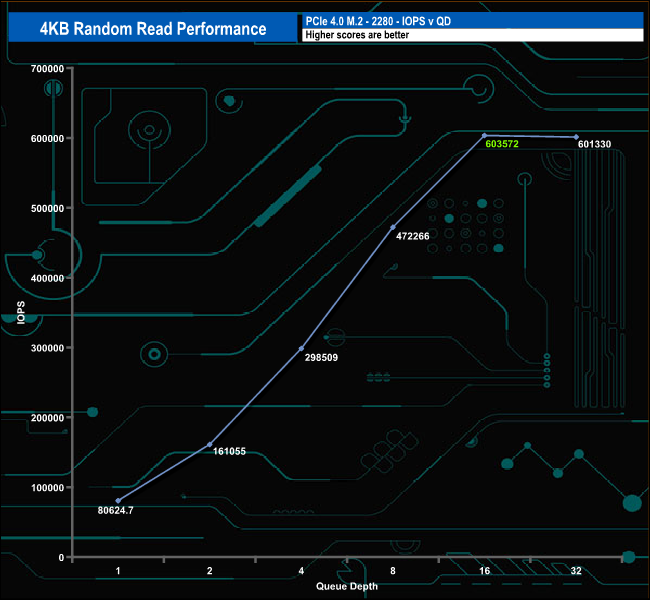
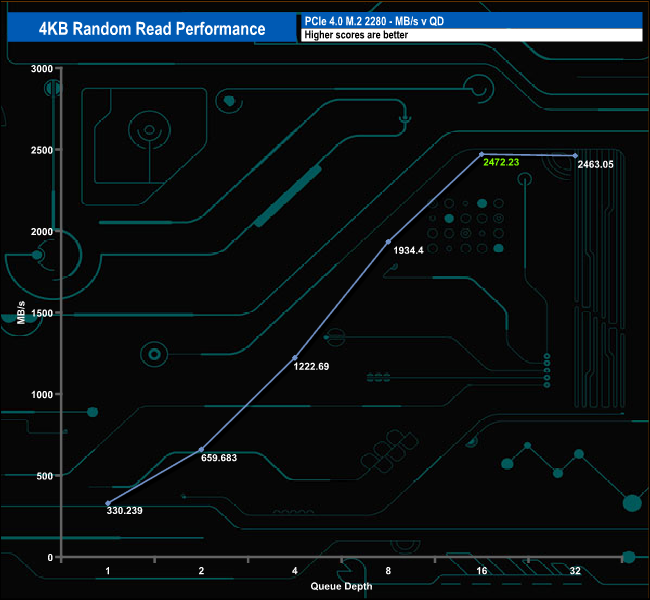
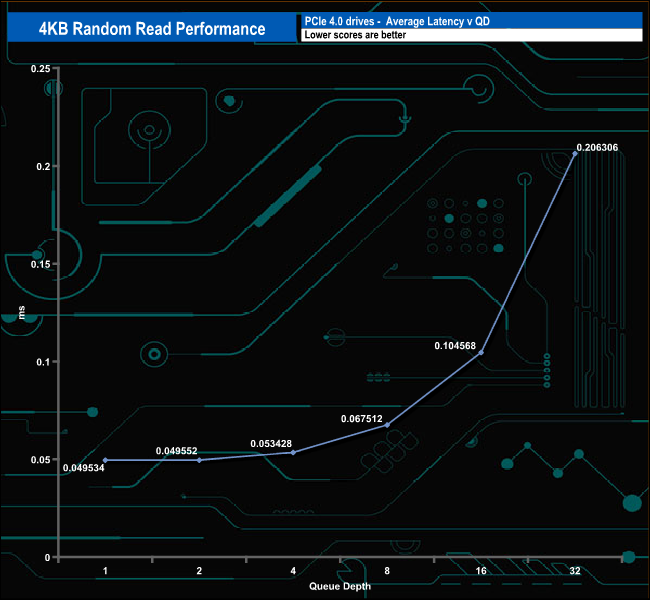
Officially, the 2TB CRAS C925G is rated as up to 700,000 IOPS for 4K random reads. With our four-threaded tests, we couldn't get close to the official maximum figure with a peak test result of 603,572 IOPS at QD16 before the performance dropped back to 601,330 IOPS at the end of the test run (QD32).
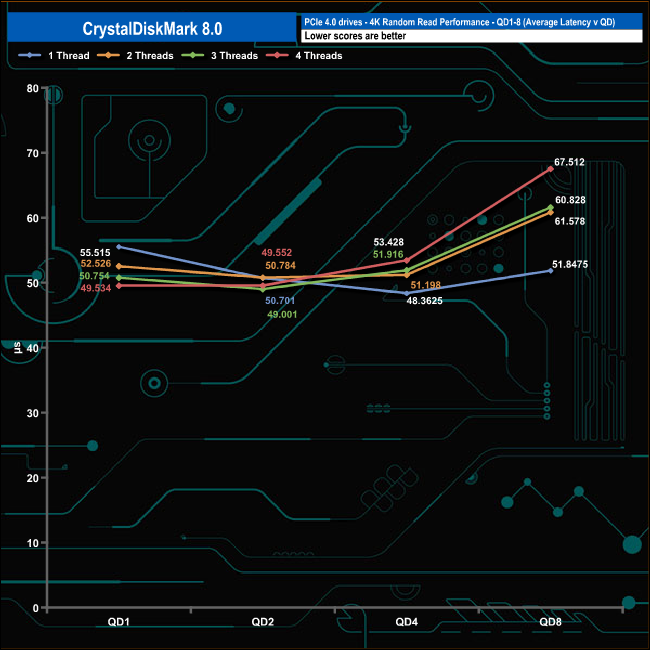
4K Random Read v QD performance
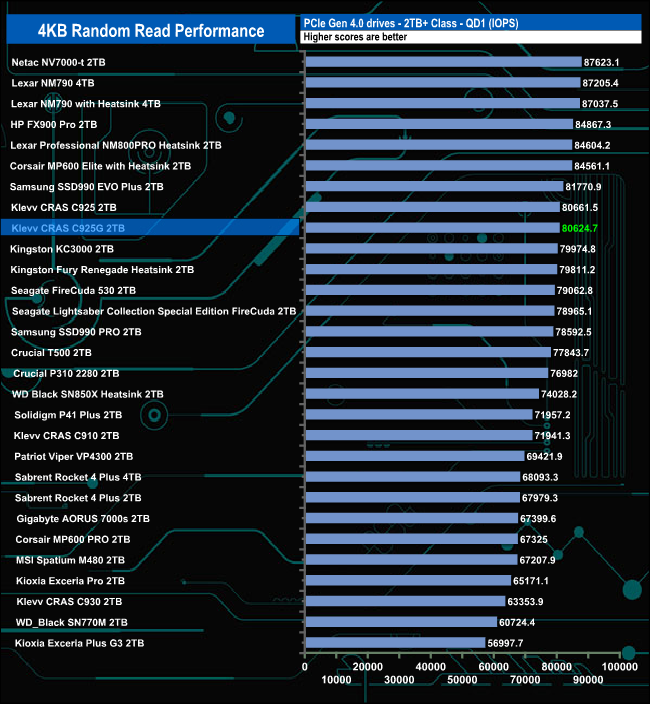
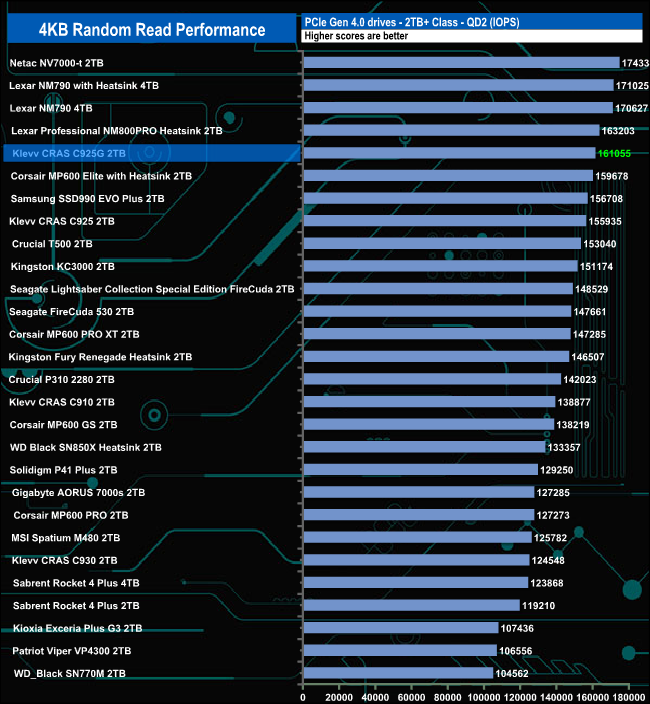
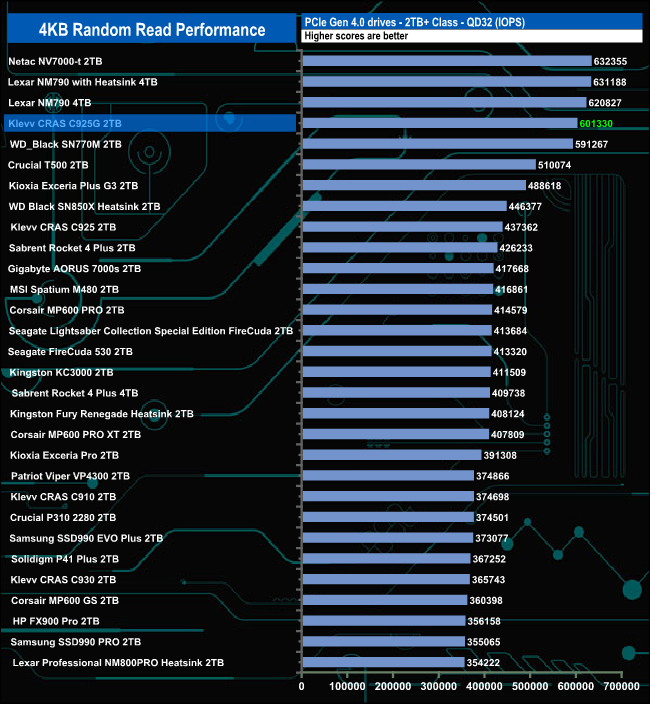
Although we couldn't get close to the official 4K random read figure, it is a consistent drive, as the test results we did get saw the drive in the top ten results for all the tested queue depths. Compared to the drives around it, the drive's slowest performance came at QD1, with the fastest at queue depths 4 and 32.
We used CrystalDiskMark 8‘s custom settings to test the 4K random write performance of the drive through a range of queue depths. The setup for the tests is listed below.
Transfer Request Size: 4KB, Outstanding I/O: 1-32.
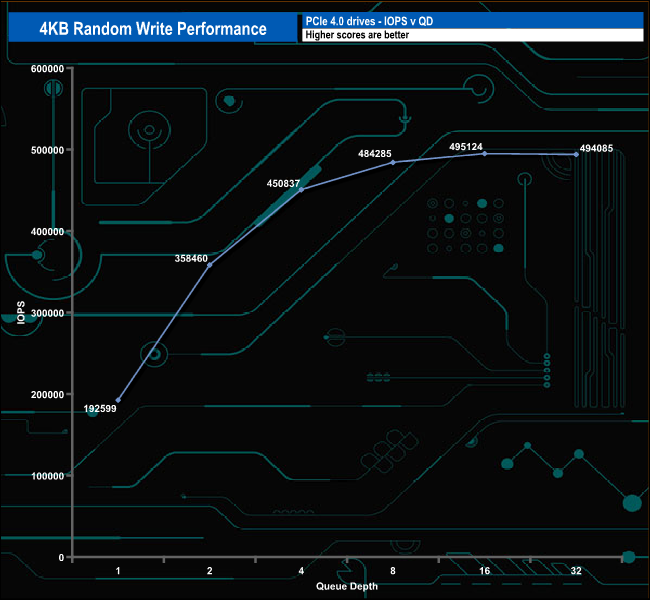
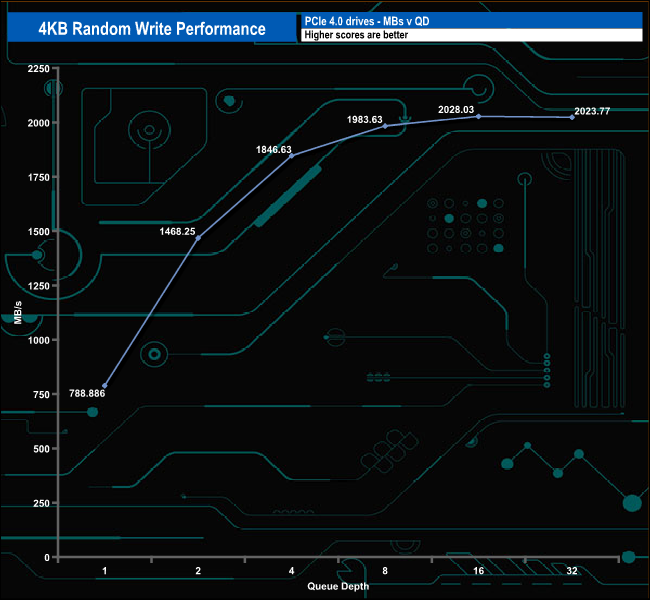
Klevv rates the 4K random write performance of the 2TB CRAS C925G as up to 1,000,000 IOPS. With our four threaded tests, we couldn't get close to this; the best we saw from the drive was 495,124 IOPS (QD16) before sinking back to 494,085 IOPS at QD32.
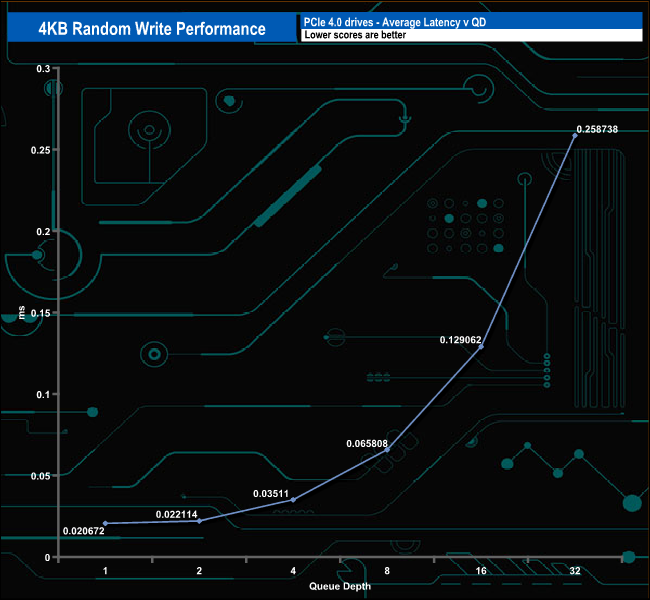
4K Random Write v QD Performance
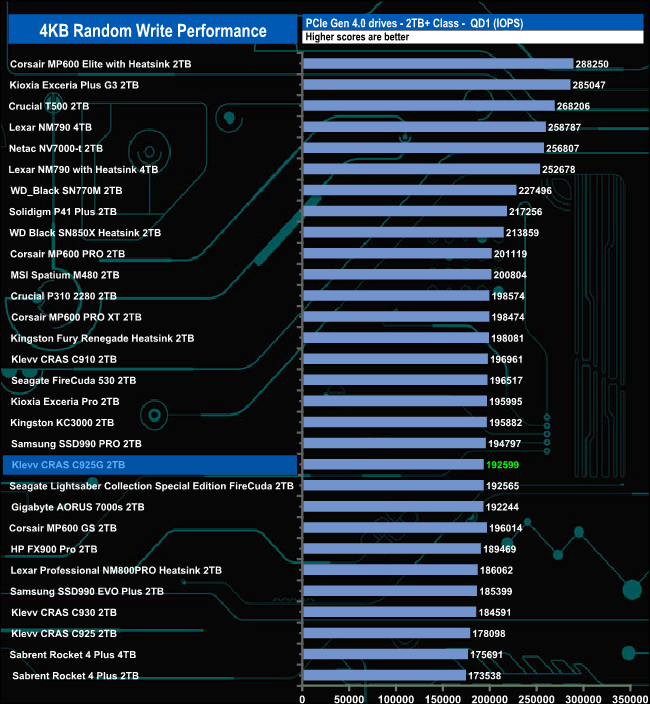
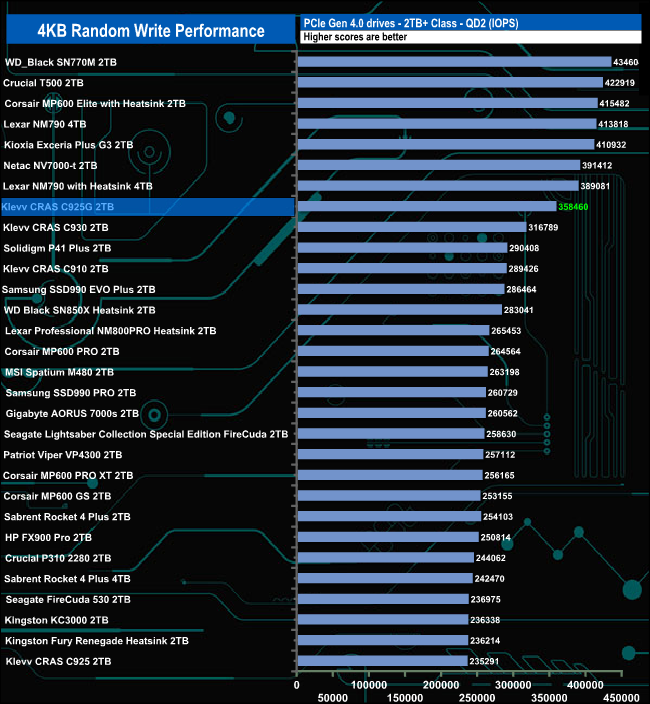
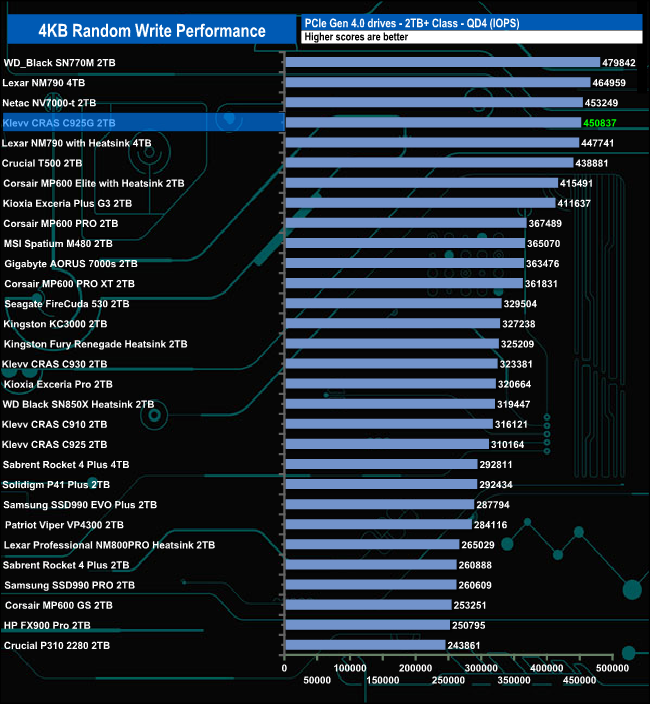
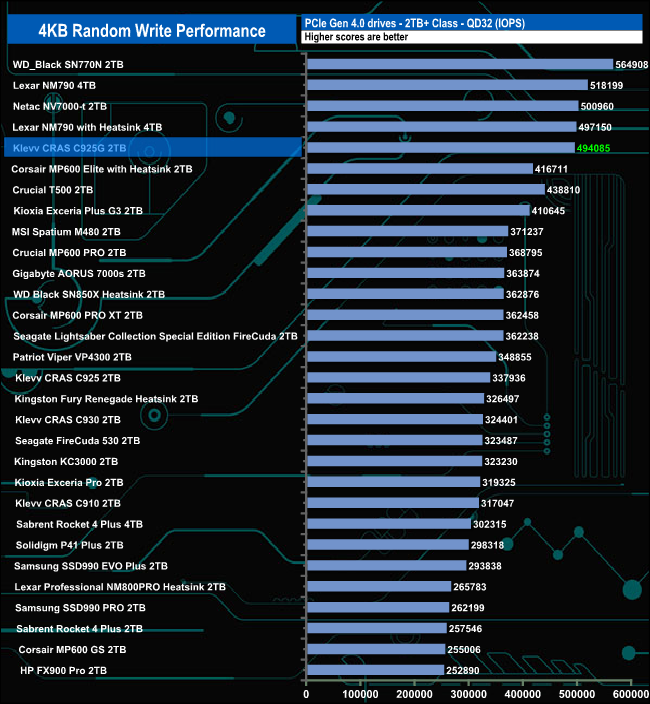
At QD1, the performance of the drive sees it in the lower half of the results chart. But as the QD deepens, the drive moves up the results chart into eighth place at QD2, fourth place at QD4, before dropping down to fifth place at QD32.
We used CrystalDiskMark 8’s custom settings to test the 4K 70/30 mixed read/write performance of the drive through a range of queue depths using a single thread and four threads.
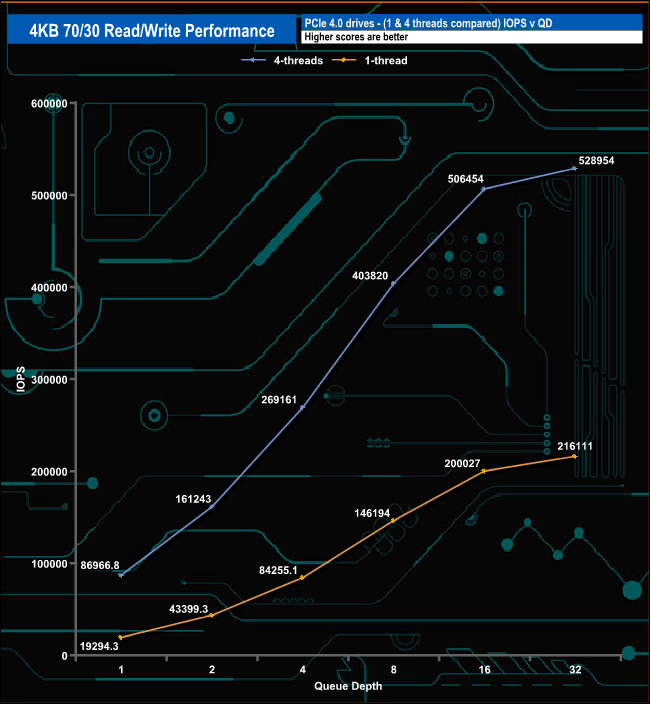
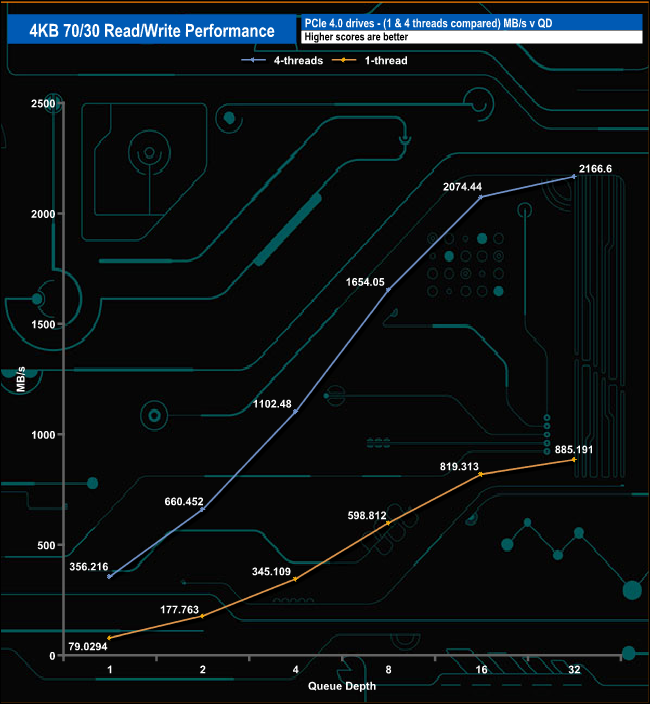
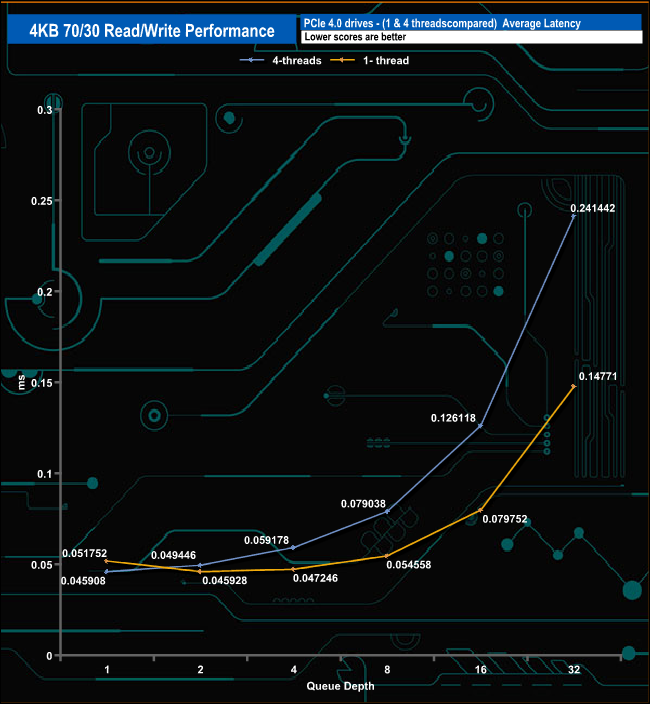
In our 4K 70/30 tests using a single thread, the 2TB CRAS C925G produced results from 19,294 IOPS (79.02MB/s) at QD1 up to 216,111 IOPS (885.19MB/s) at QD32. Switching up to four threads, the performance goes from 86,966 IOPS (356.21MB/s) at QD1 up to 528,954 IOPS (2,166MB/s) at QD32.
We used CrystalDiskMark 8’s custom settings to test the 4K 70/30 mixed read/write performance of the drive through a range of queue depths using a single thread and four threads.
4K Random Read Performance QD1-QD8
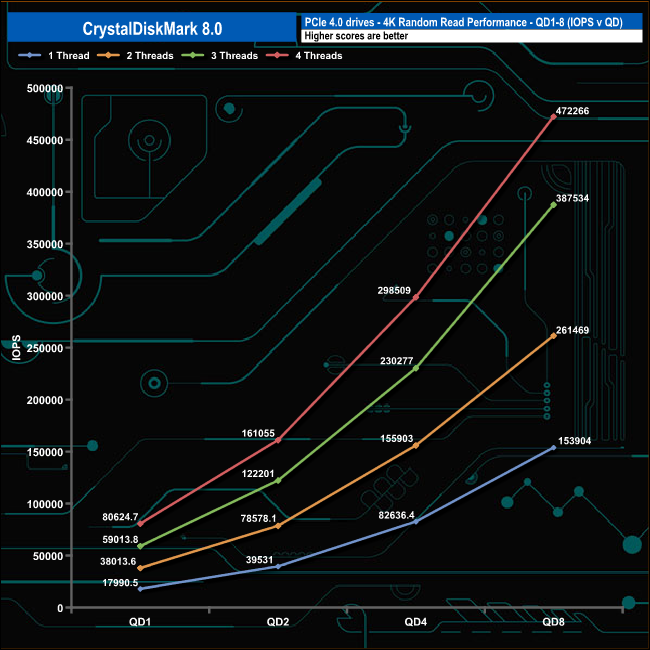
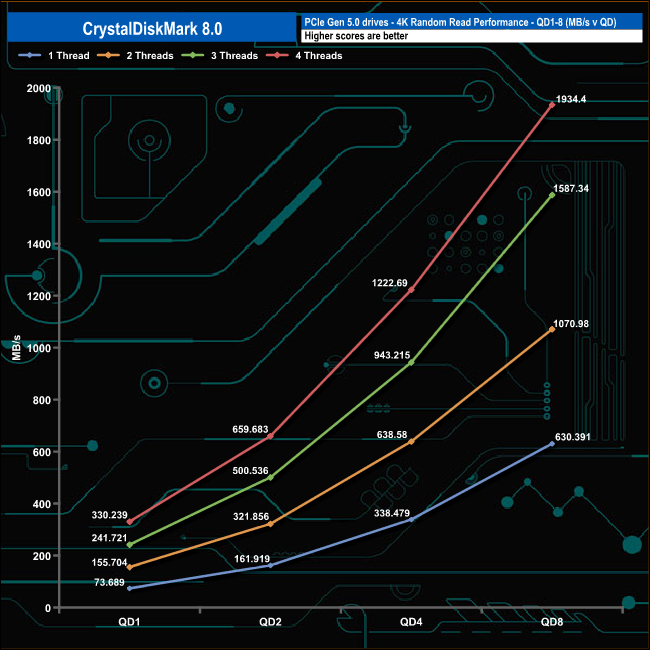
In the QD1-QD8 random read tests, the CRAS C925G exhibited smooth increases in performance as the queue depth increased without any noticeable issues. At QD1, the drive speed ranges from 17,990 IOPS (73.68 MB/s) using a single thread to 80,624 IOPS (330.23 MB/s) using four threads. At the end of the test run at QD8, the single-threaded performance had risen to 153,904 IOPS (630.39MB/s) while the four-threaded performance rose to 472,266 IOPS (1,934.4MB/s).
4K Random Write Performance QD1-QD8
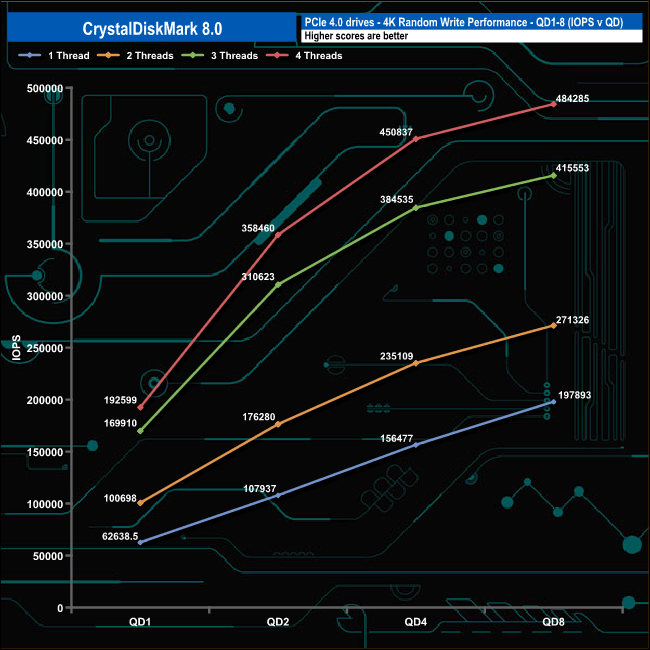
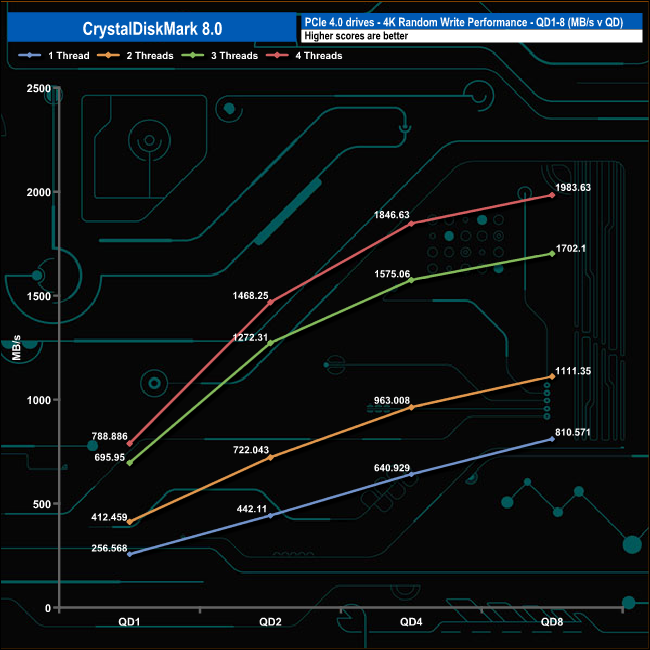
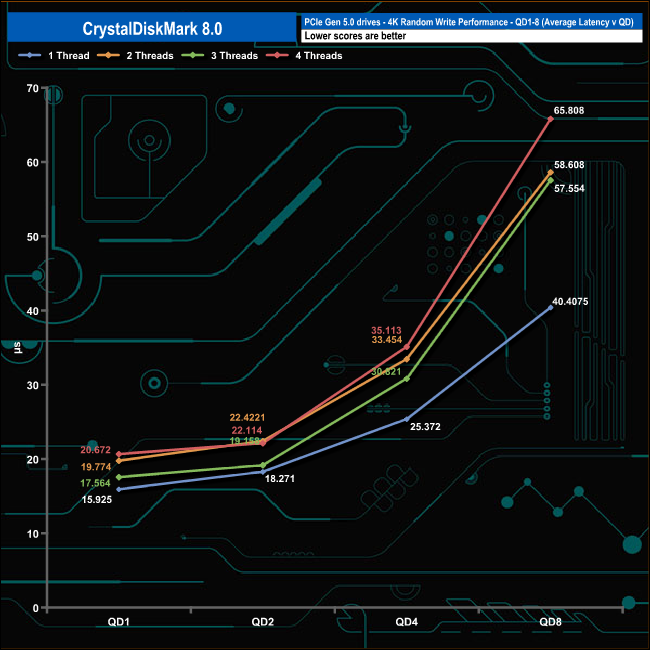
In the 4K write tests, the performance rose quickly from QD1 to QD2 for all four tested threads, with the fastest rise seen in the three and four-threaded tests
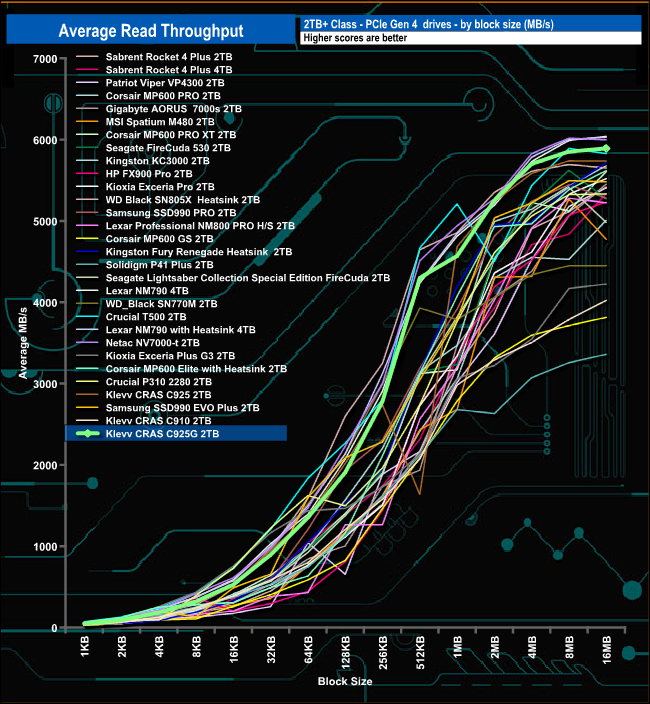
In our read-throughput test, the 2TB CRAS C925G achieved a peak of 5,893.01MB/s at the 16MB block mark, which is significantly below the official maximum of 7,400MB/s.
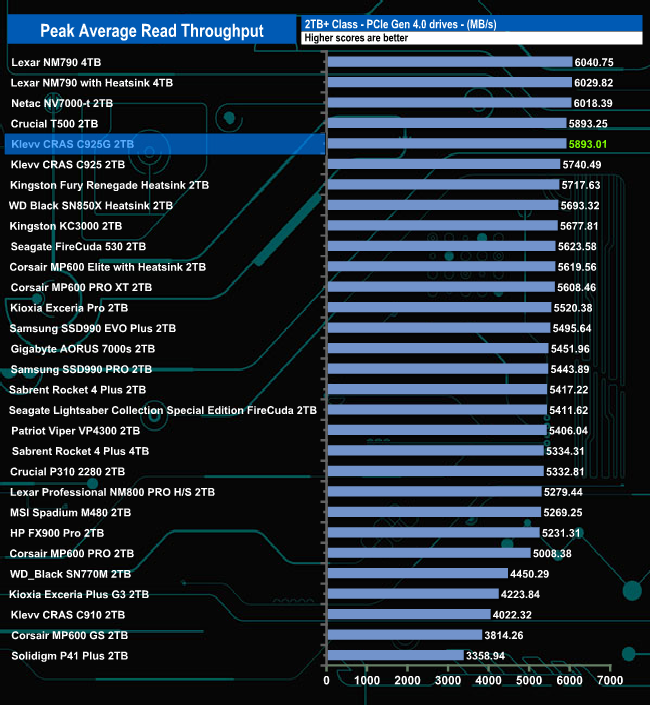
Even though the peak test result figure of 5,893MB/s is well short of the official maximum for the drive, that peak result is good enough to stick the drive into the fifth spot on the results chart, some 153MB/s faster than the CRAS C925.
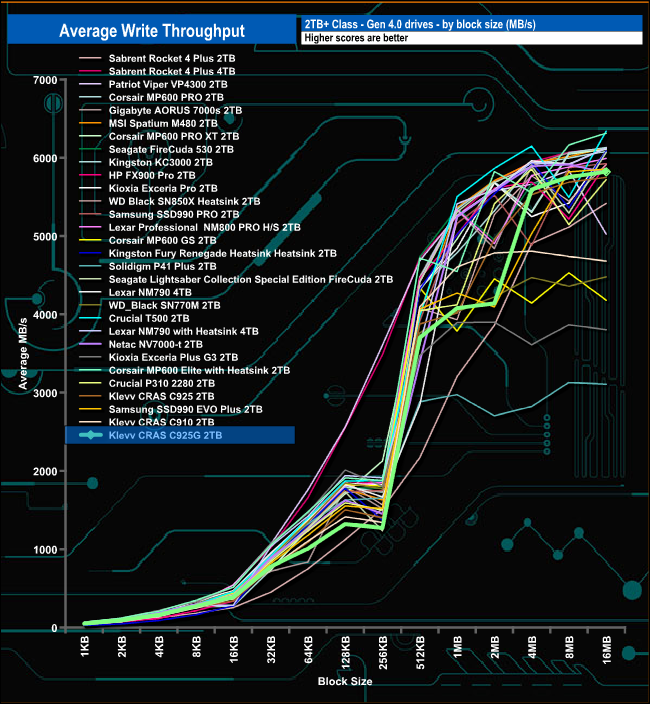
In the write throughput tests, the drive peaked at the end of the test run (16MB block) at 5,820MB/s, 680MB/s short of the official maximum of 6,500MB/s.
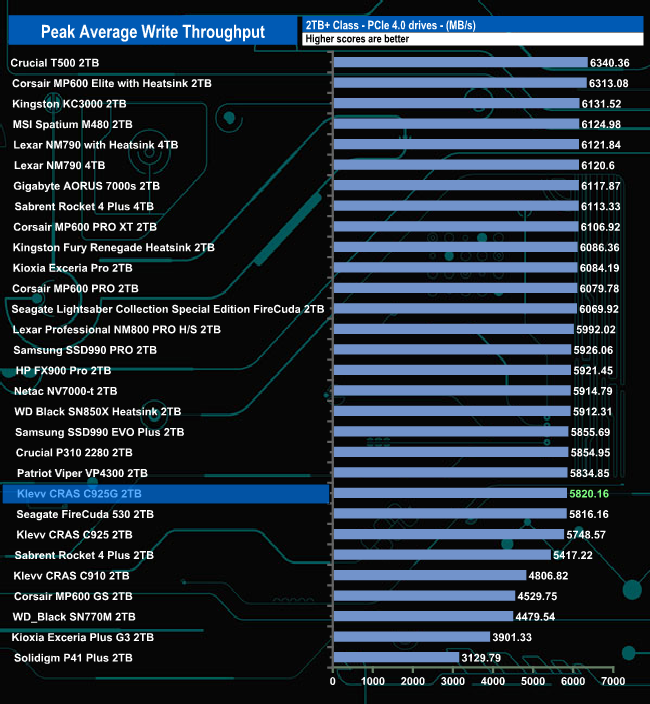
With a test result of 5,820MB/s, the 2TB CRAS C925G sits in the bottom half of the table. Its test result is 680MB/s short of the official maximum but 72MB/s faster than the CRAS C925.
The PCMark 10 Full System Drive Benchmark uses a wide-ranging set of real-world traces from popular applications and common tasks to fully test the performance of the fastest modern drives. The benchmark is designed to measure performance of fast system drives using the SATA bus at the low end and devices connected via PCI Express at the high end.
The goal of the benchmark is to show meaningful real-world performance differences between fast storage technologies such as SATA, NVMe, and Intel’s Optane. The Full System Drive Benchmark uses 23 traces, running 3 passes with each trace. It typically takes an hour to run.
Traces used:
Booting Windows 10.
Adobe Acrobat – starting the application until usable.
Adobe Illustrator – starting the application until usable Adobe Premiere Pro – starting the application until usable.
Adobe Photoshop – starting the application until usable.
Battlefield V – starting the game until the main menu.
Call of Duty Black Ops 4 – starting the game until the main menu.
Overwatch – starting the game until main menu.
Using Adobe After Effects.
Using Microsoft Excel.
Using Adobe Illustrator.
Using Adobe InDesign.
Using Microsoft PowerPoint.
Using Adobe Photoshop (heavy use).
Using Adobe Photoshop (light use).
cp1 Copying 4 ISO image files, 20 GB in total, from a secondary drive to the target drive (write test).
cp2 Making a copy of the ISO files (read-write test).
cp3 Copying the ISO to a secondary drive (read test).
cps1Copying 339 JPEG files, 2.37 GB in total, to the target drive (write test).
cps2 Making a copy of the JPEG files (read-write test).
cps3 Copying the JPEG files to another drive (read test).
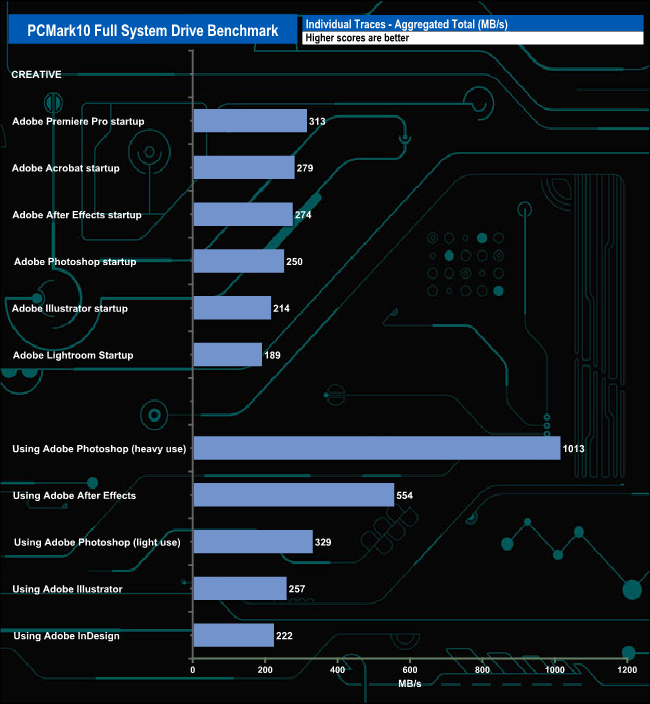
Klevv's 2TB CRAS C925G handled the demands of the PCMark10 Full System Drive Benchmark pretty well. Tested with the six Adobe startup traces, it produced an average of 253MB/s, with the fastest being the Premiere Pro test trace at 313MB/s, with the Lightroom trace the slowest at 189MB/s. As is normal with the usage traces, it was the Photoshop heavy usage trace that produced the best result of 1,013MB/s, with the InDesign trace being the slowest at 222MB/s. For the five usage traces, the drive averaged 475MB/s.
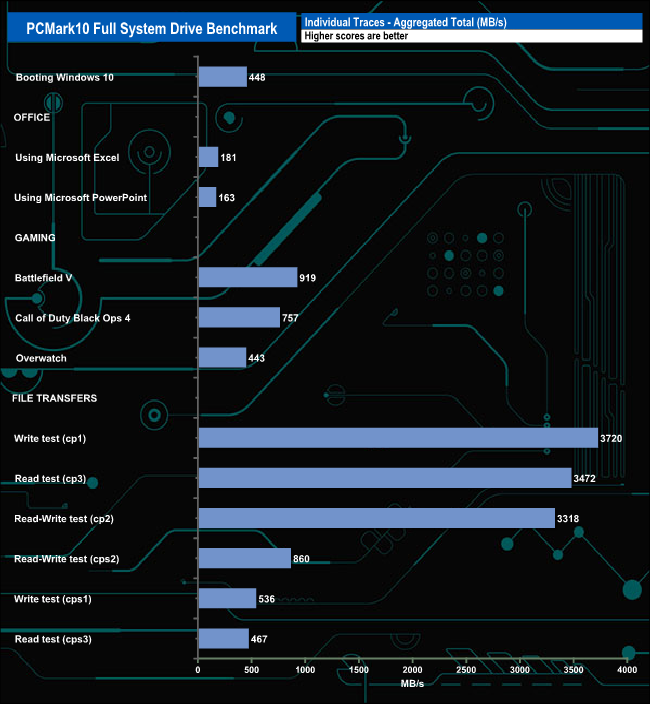
The three gaming traces produced an average result of 706MB/s, the fastest being Battlefield V at 919MB/s. Next came Call Of Duty Black Ops 4 at 757MB/s, followed by Overwatch at 443MB/s.
When it came to the file transfers, the fastest was the cp1 Write test at 3,720MB/s, with the drive averaging 2,062MB/s for the six file transfer tests.
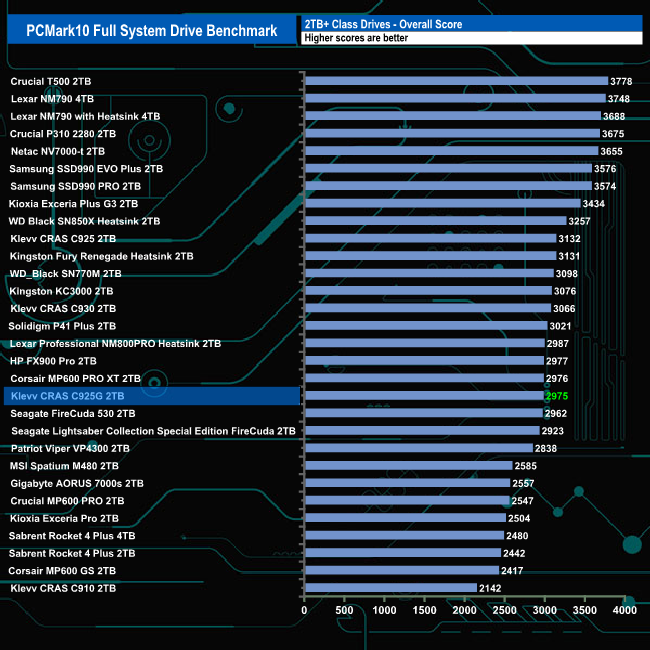
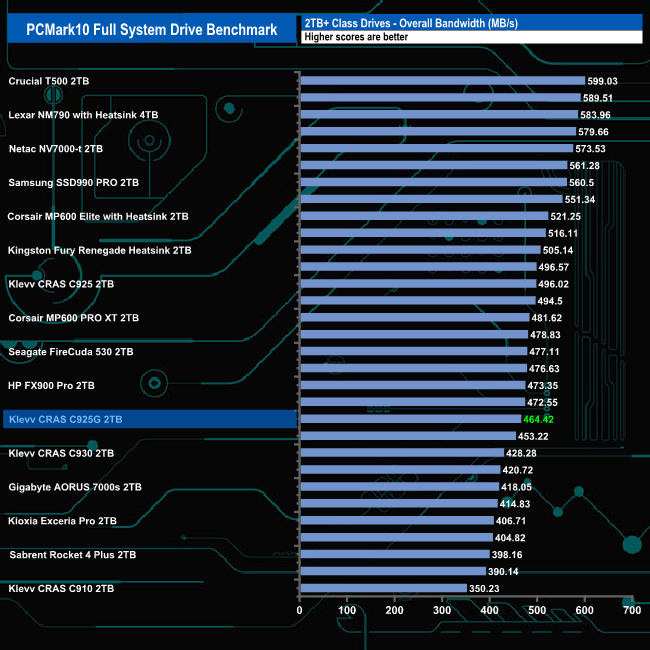
With an overall bandwidth figure of 464.02MB/s, the 2TB Klevv CRAS C925G sits in the lower half of the results table, 31MB/s behind the CRAS C925.
The 3DMark Storage Benchmark uses traces recorded from popular games and gaming-related activities to measure real-world gaming performance.
Traces used:
Battlefield V
Loading Battlefield™ V from launch to the main menu.
Call of Duty Black Ops 4
Loading Call of Duty®: Black Ops 4 from launch to the main menu.
Overwatch
Loading Overwatch® from launch to the main menu.
Game Move
Copying the Steam folder for Counter-Strike®: Global Offensive from an external SSD to the system drive.
Game Recording
Recording a 1080p gameplay video at 60 FPS with OBS (Open Broadcaster Software) while playing Overwatch®.
Installing Game
Installing The Outer Worlds® from the Epic Games Launcher.
Game Saving
Saving progress in The Outer Worlds game.
Battlefield V
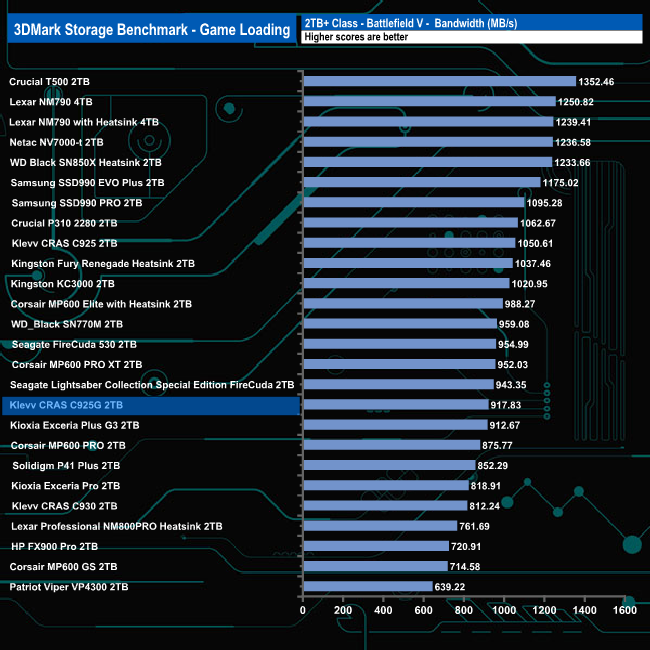
In 3DMark’s Storage Test, the Battlefield V game loading result of 917.83MB/s sees it in a mid-table position, 132.78MB/s behind Klevv's CRAS C925.
Call of Duty Black Ops 4
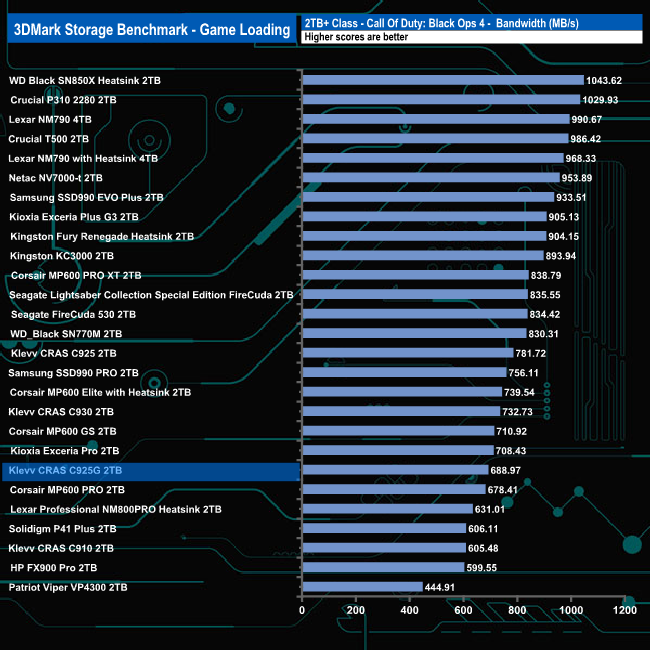
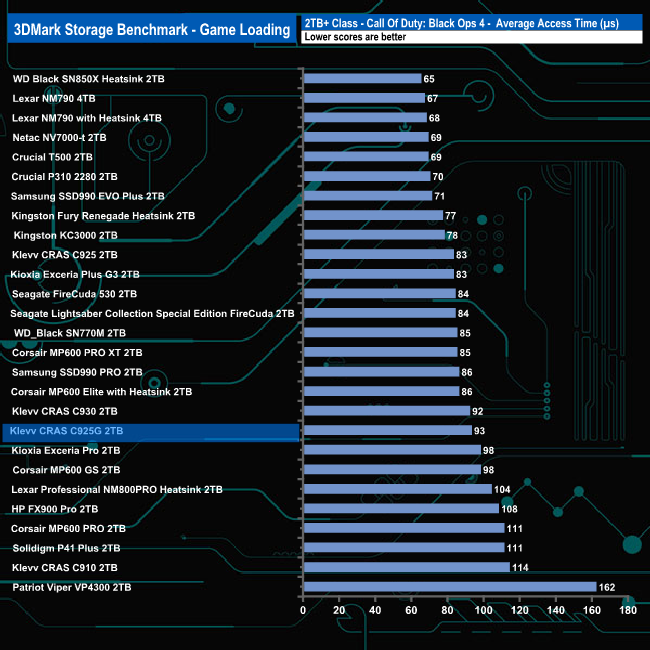
Using the Call of Duty Black Ops 4 trace, the drive produced a score of 688.17MB/s, which sees the drive in the bottom half of the results chart.
Overwatch
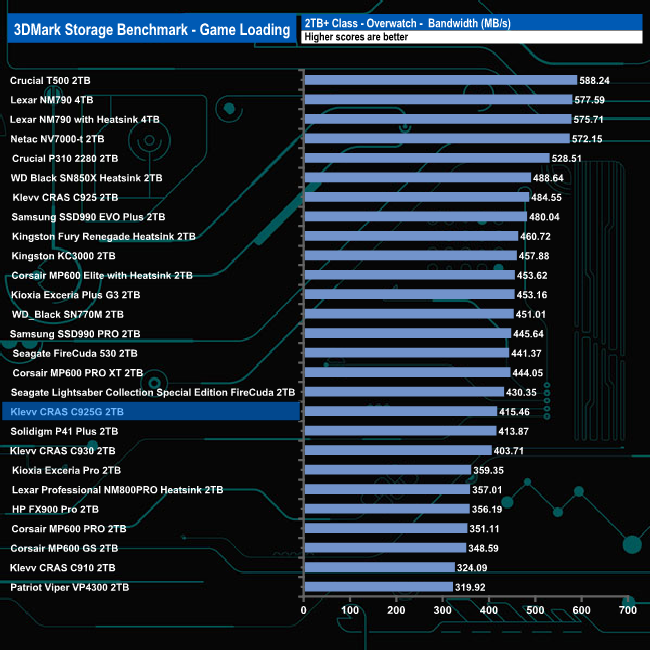
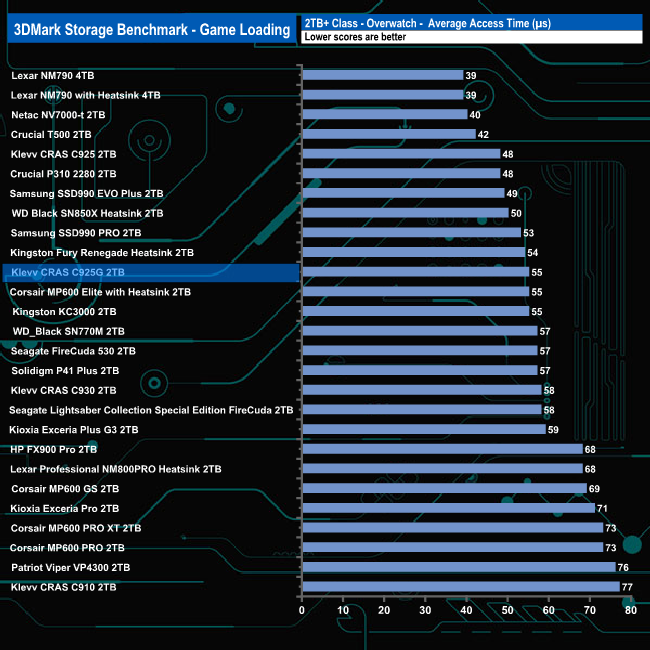
In 3DMark’s Storage Test Overwatch test, the tested drive produced a score of 415.46MB/s, which sees it placed in the bottom half of the drive; its score is 69MB/s slower than the CRAS C925.
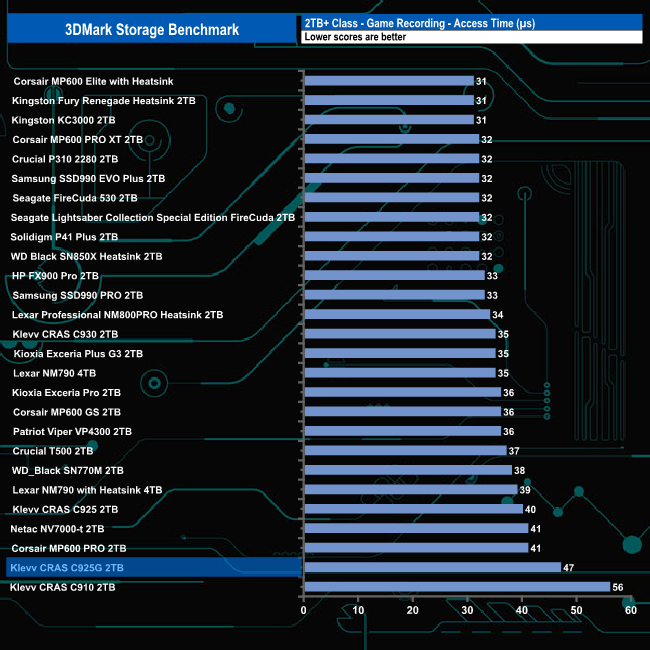
Game Move
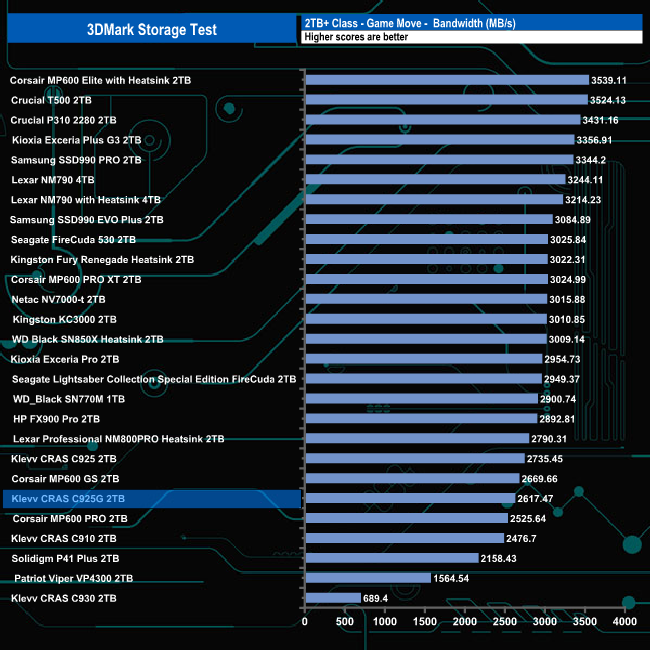
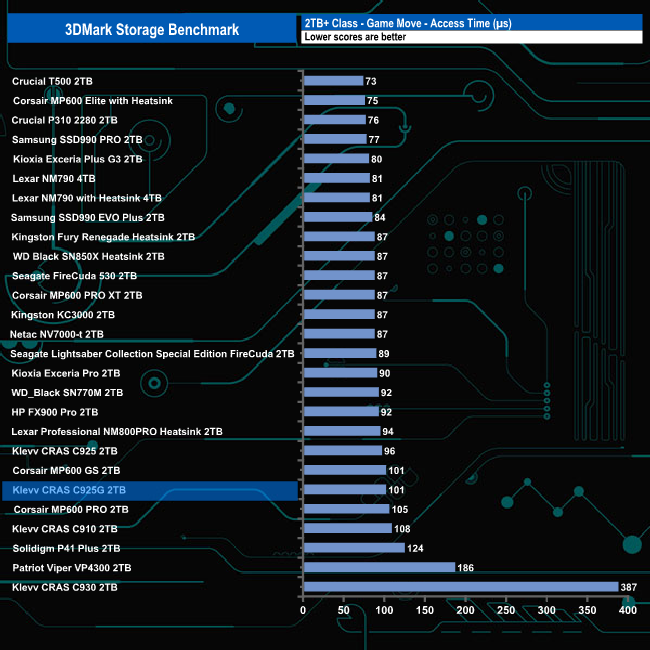
In the Game Move test, the drive produced a score of 2617.47MB/s at an average access time of 101µs (0.101ms).
Game Recording
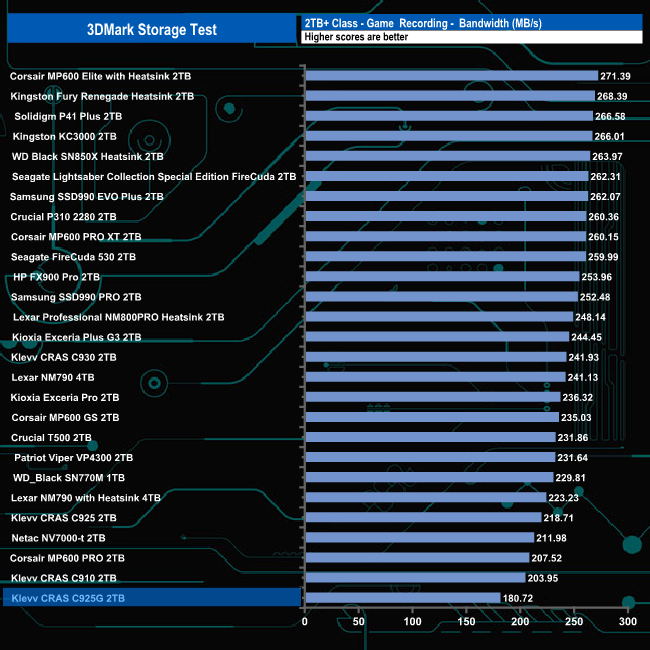
The CRAS C925G doesn't seem to handle the Game Recording test very well, as its test score of 180.72MB/s sees it in last place on the results chart.
Installing Game
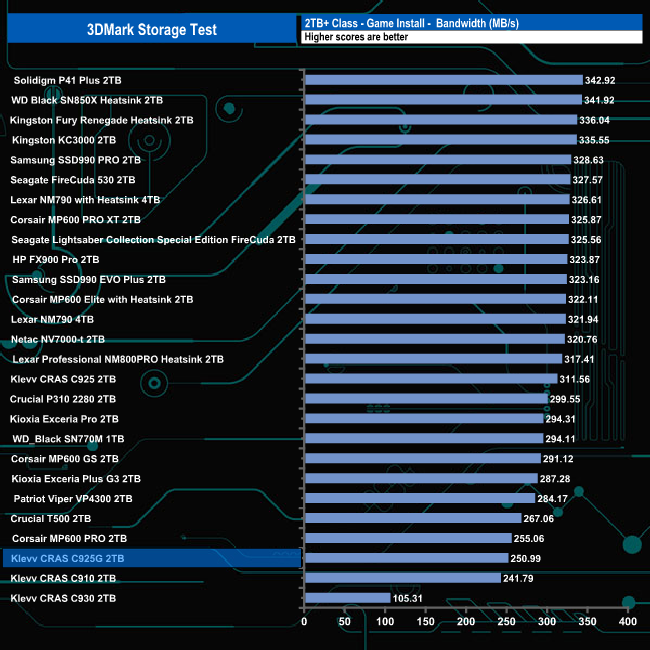
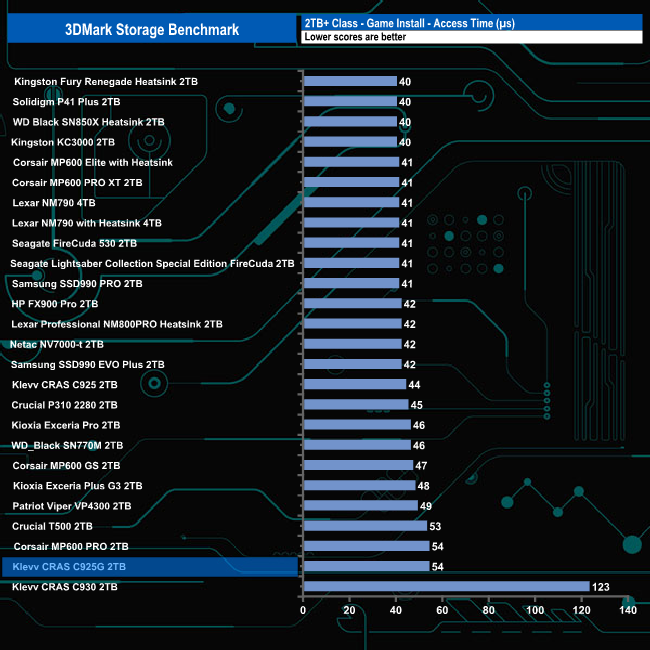
In the Game Install test, the drive sits 3rd from bottom in the chart, ahead of the CRAS C910 and C930, but 61MB/s behind the CRAS C925.
Game Saving
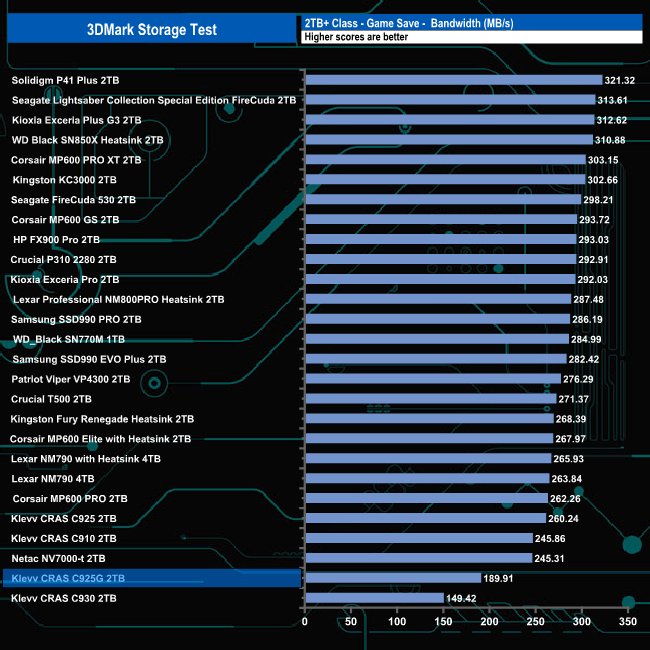
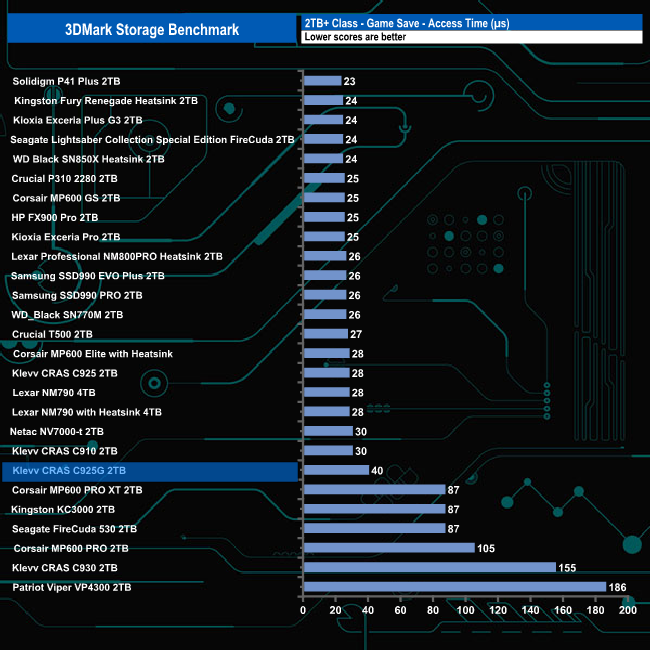
Klevv's CRAS C925G produced a result of 189.91MB/s in the Game Save tests, which put the drive in the penultimate spot on the results graph.
The Final Fantasy XIV Endwalker Official Benchmark uses actual maps and playable characters to assign a score to your PC and rate its performance, including scene loading times.
The benchmark gives an overall load time as well as loading times by scene.
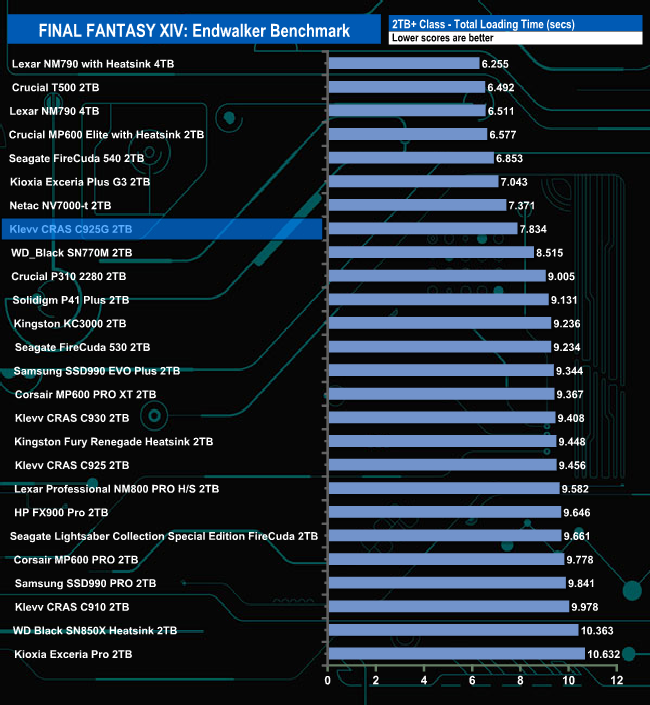
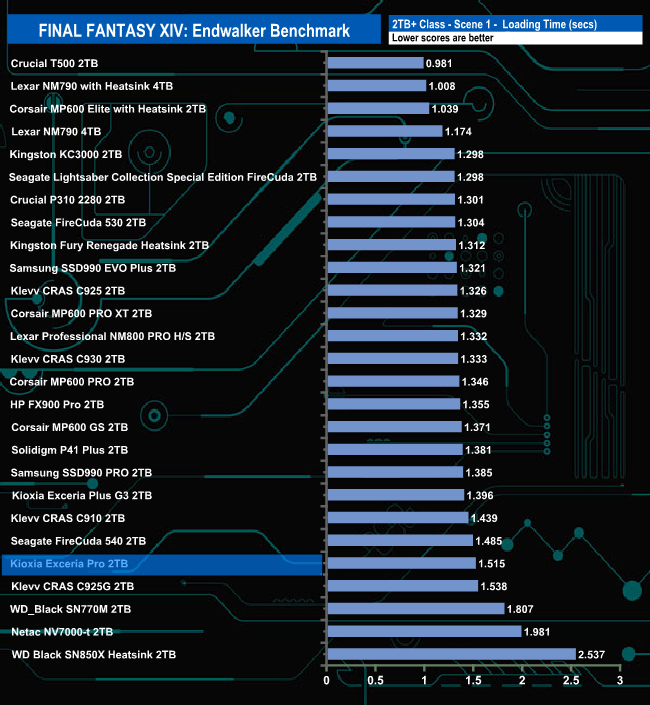
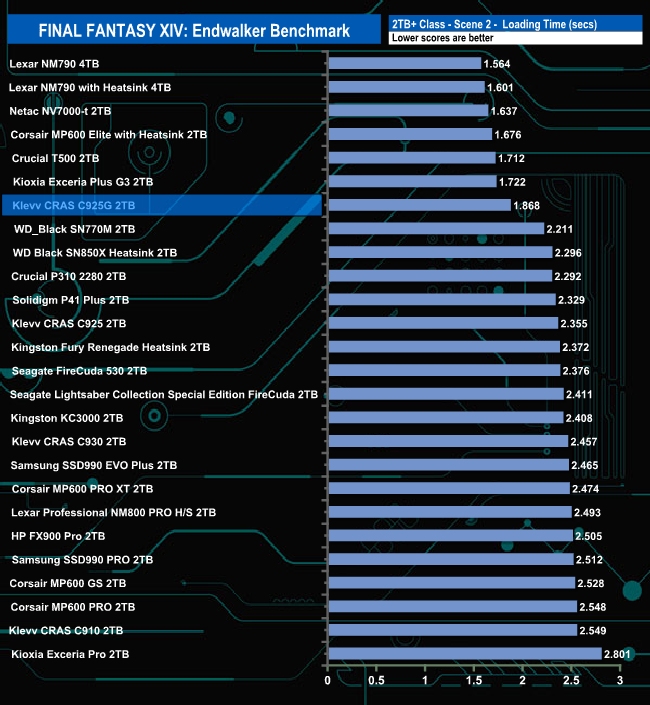
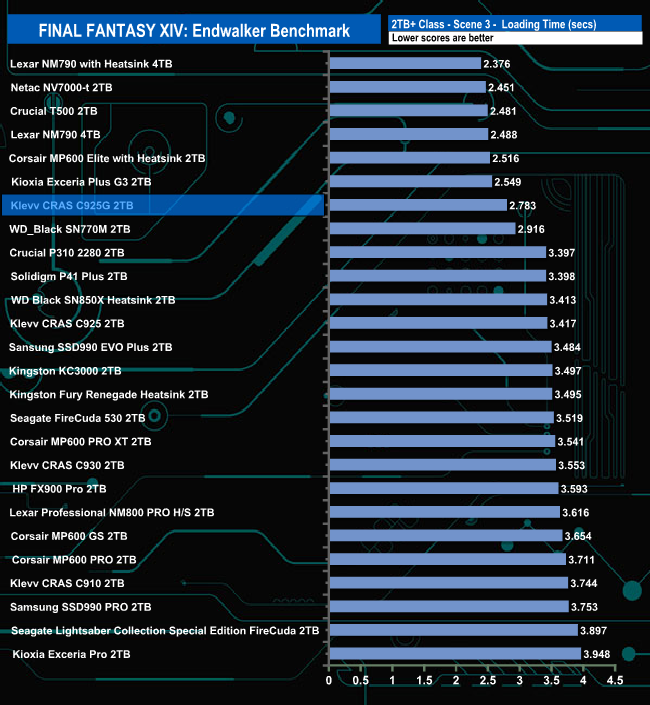
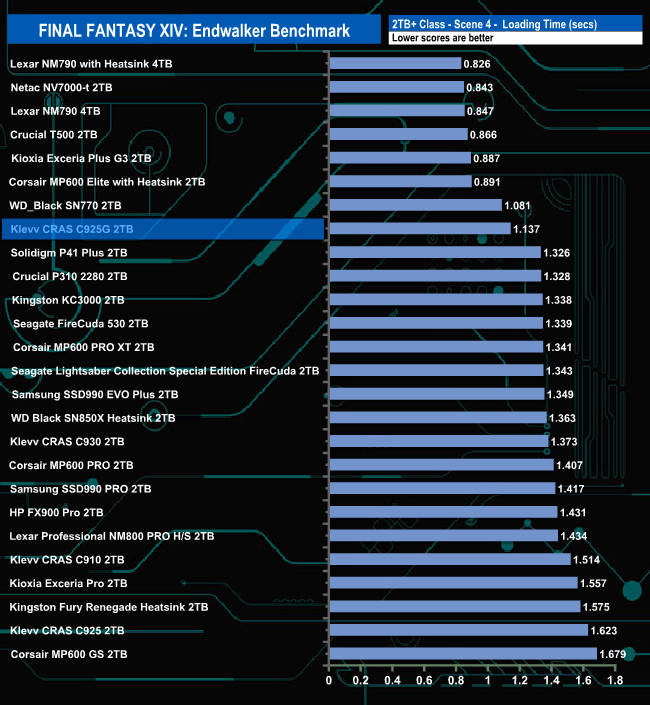
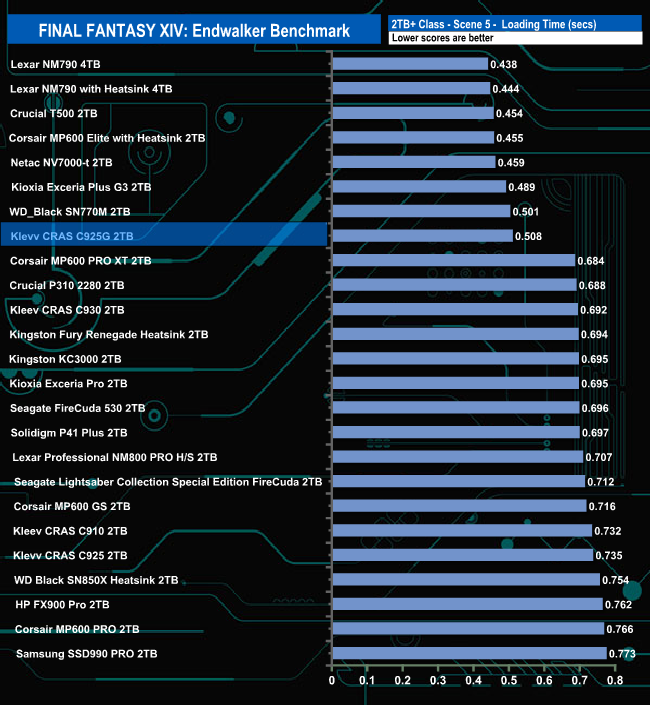
Klevv's 2TB CRAS C925G SSD makes a pretty decent job of the Final Fantasy XIV Endwalker Official Benchmark. It sits in the top ten of every scene load, apart from Scene 1, where it sits in the bottom half of the result chart.
We took note of the drive’s temperature during some of our benchmarking runs.
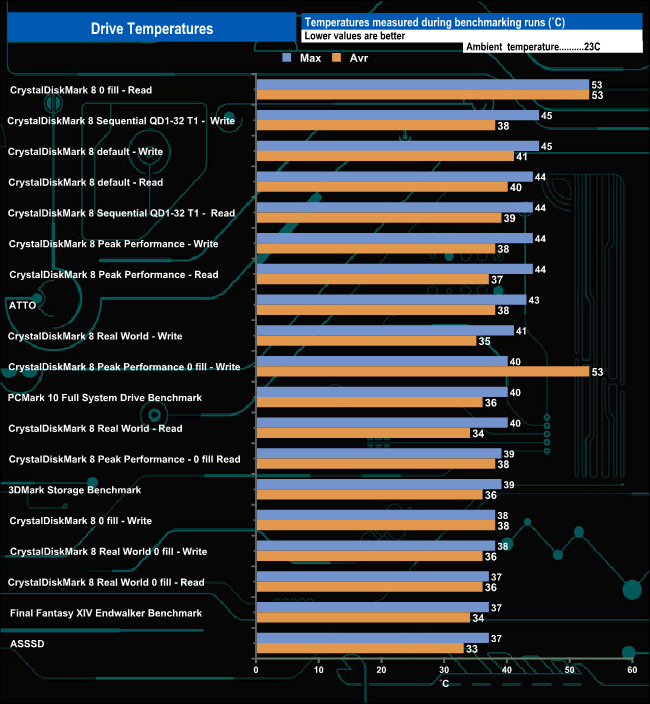
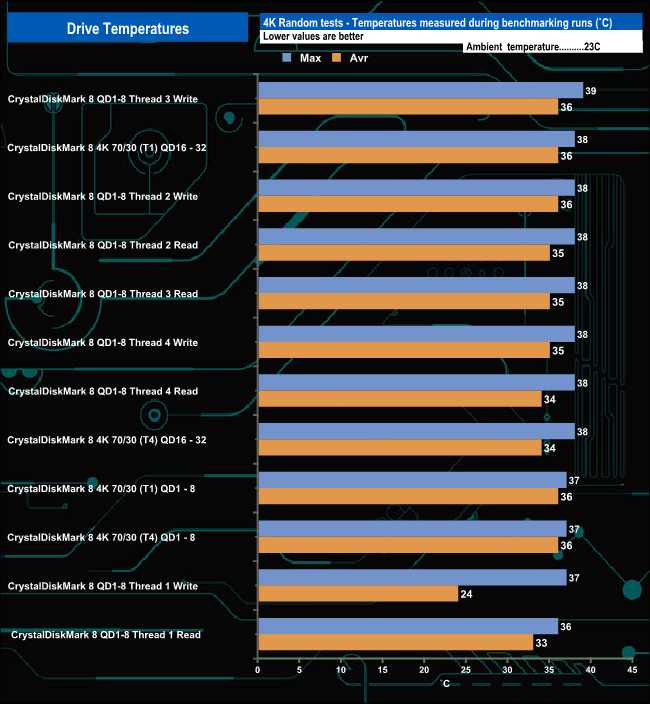
Klevv's CRAS C925G comes with a thin graphene-copper composite heatsink. Using this in conjunction with enhanced thermal management (thermal throttling) keeps the drive thermally stable. The hottest the drive got during our testing runs was 53° C during CrystalDiskMark 8's 0 fill read tests. It averaged 41° C for the bulk of the testing, with the 4K tests averaging 37.75° C. For the bulk of the 4K testing, the drive was consistent in its thermal performance.
To test the real-life performance of a drive, we use a mix of folder/file types, and by using the FastCopy utility (which gives a time as well as MB/s result), we record the performance of the drive reading from & writing to a 2TB Kingston KC3000.
Transfer Details
Data file – 100GB.
File folder – 50GB – 28,523 files.
Movie demos 8K – 21GB – (11 demos).
Raw Movie Clips 4K – 16GB – (9 MP4V files).
Audio Folder – 10GB – 1,483 files – (1479 @ MP3, 4 @ .FLAC files).
Single large image – 5GB – 1.5bn pixel photo.
3D Printer File Folder – 4.25GB – (166 files – 105 @ .STL, 38 @ .FBX, 11 @ .blend, 5 @ .lwo, 4 @ .OBJ, 3@ .3ds).
AutoCAD File Folder – 1.5GB (80 files – 60 @ .DWG and 20 @.DXF).
![]()
![]()
The CRAS C925G averaged 2,801MB/s (3 secs) when writing the contents of the 8 real-life transfer tests, with the fastest being the 4K Movie Clip folder at 5,264MB/s. The drive. Reading the data back, the fastest performance came from the 5GB image at 5,938MB/s and averaged 3,194MB/s for the eight transfers.
The latest drive to be added to the ‘C' range of Klevv's Gen4 SSDs is the CRAS C925G, designed for 4K content creation, data-intensive AI tasks, and heavy-duty applications.
At the heart of the C925G is a Maxiotech MAP1602A 4-channel controller. A DRAM-less design, the MAP1602A uses Host Memory Buffer (HMB) 3.0 technology, which uses system memory instead of a dedicated cache chip and uses Dynamic SLC cache writing technology. Built on a 12nm process, the MAP1602A uses ARM Cortex-R5 architecture with a fast 2400 MT/s flash interface, which helps performance. For the 2TB version of the CRAS C925G, Klevv has paired the MAP1602A with two 1TB packages of Essencore-branded 238-Layer 3D TLC NAND.
Klevv rates the performance of the 2TB CRAS C925G as per the maximum speeds supported by the MAP1602A controller – up to 7,400MB/s and 6,500MB/s for sequential reads and writes, respectively, and 1M IOPS for random writes, although random reads for the drive are rated down a bit at up to 700,000 IOPS from the 1602A's 1M IOPS.
Using the default CrystalDiskMark 8 tests, we couldn't quite hit the official maximums for sequential performance; the best we saw was 7,352MB/s for reads and 6,336MB/s for writes. Switching over to the compressible data test, we could confirm the official read figure with a test result of 7,455.871MB/s, but the write performance at 5,957.31MB/s dropped back even further from both the official and default test results.
When it came to random performance, we couldn't get close to the official figures with our 4-threaded tests. The best random read figure we saw was 603,572 IOPS at QD16. Writes were even further away from the official figure at 495,124 IOPS (QD16). However, switching over to the default Peak Performance Profile in CrystalDiskMark 8, we could confirm the official random read figure and indeed better it by a decent margin with a test result of 993,696 IOPS, closer to the official stated maximum controller speed. When it came to random writes, we could also confirm the official maximums with a test result of 1,024,788 IOPS.
To help keep the CRAS C925G cool, Klevv uses a combination of enhanced thermal management and a thin graphene-copper composite heatsink, a combination which worked well, as the hottest the drive got under testing was 53° C.
The Klevv CRAS C925G comes with an official license for Acronis True Image HD, which is downloadable from the Klevv website.
We don't yet have confirmed UK pricing, but the 2TB model is listed on Amazon US for $119.99 HERE.
Pros
- Overall performance.
- Endurance.
Cons
- Write speeds in some benchmark tests.
- DRAM-less design.
- Model line-up stops at 2TB.
KitGuru says: Klevv's CRAS C925G offers decent all-around performance, and instead of the bundled aluminium heatsink that comes with the C925, the C925G comes with a preinstalled thinner graphene-copper composite heatsink that works well.