

Netac's NV150HK is the first Gen 5 drive to join the company's large range of SSDs. Designed for gaming and content creation use, it offers sequential speeds of up to 14,000MB/s and 13,000MB/s for reads and writes, respectively.
The NV150HK range consists of three models: 1TB, 2TB (the drive we are reviewing) and a flagship 4TB drive. The drive uses a combination of a Silicon Motion controller and 232-layer 3D TLC NAND.
Netac quotes sequential read performance figures for the range of up to 13,000MB/s for the 1TB drive and up to 14,000MB/s for the 2TB and 4TB models. Sequential write performance is quoted as up to 8,000MB/s for the 1TB model and up to 13,000MB/s for the 2TB and 4TB models.
4K random performance for the NV150HK is listed as up to 1.6M IOPS / 1.8M IOPS for random reads/writes for the 1TB model, while the 2TB and 4TB models get ratings of up to 2M IOPS for reads and up to 1.8M IOPS for writes.
The 2TB drive has an endurance rating of 1,200 TBW. The 1TB model gets 600TB, and the 4TB drive, 2,400TBW.
Netac backs the drive with a 5-year limited warranty.
Physical Specifications:
- Usable Capacities: 2TB.
- NAND Components: Micron 232-Layer 3D TLC NAND.
- NAND Controller: Silicon Motion SM2508.
- Cache: 2GB LPDDR4-2133MHz.
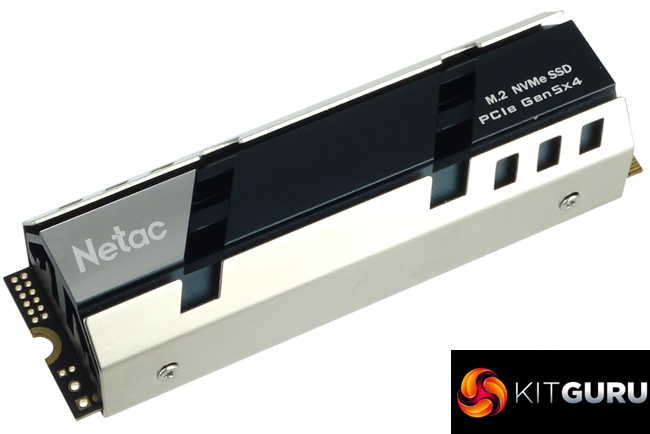
- Interface: PCIe Gen 5 x4, NVMe 2.0.
- Form Factor: M.2 2280.
- Dimensions: 130 x 65 x 25.5mm (including heatsink).
- Drive Weight: 62g.
Firmware Version: Y0428T.
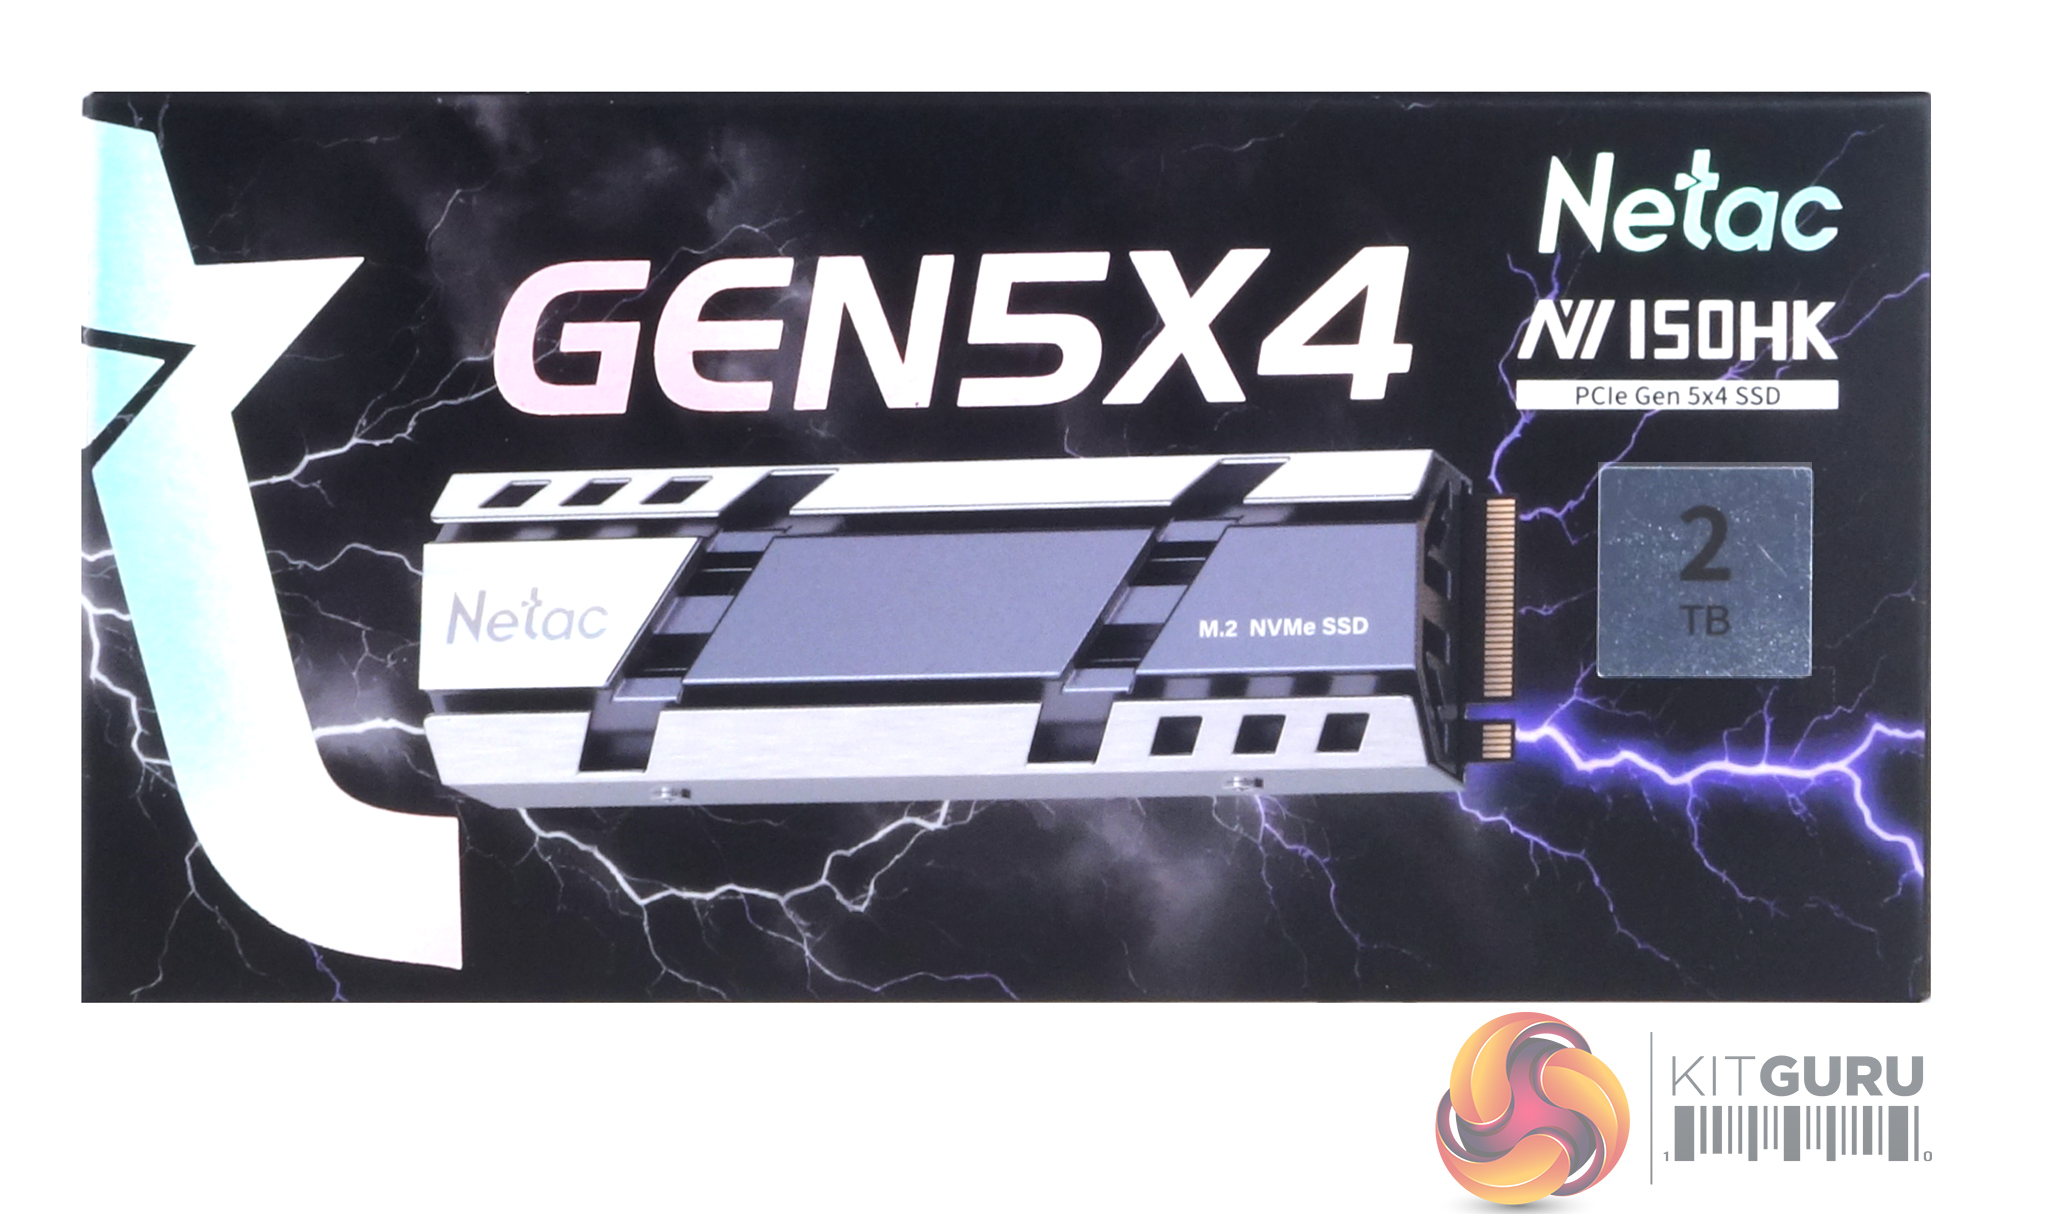
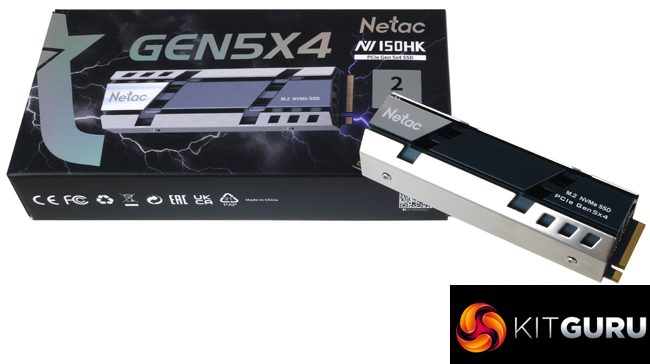
The Netac NV150HK comes in a pretty compact box with a clear image of the drive on the front. To the right of the image is a panel showing the drive's capacity. Above this is a line about the interface the drive uses.nertac
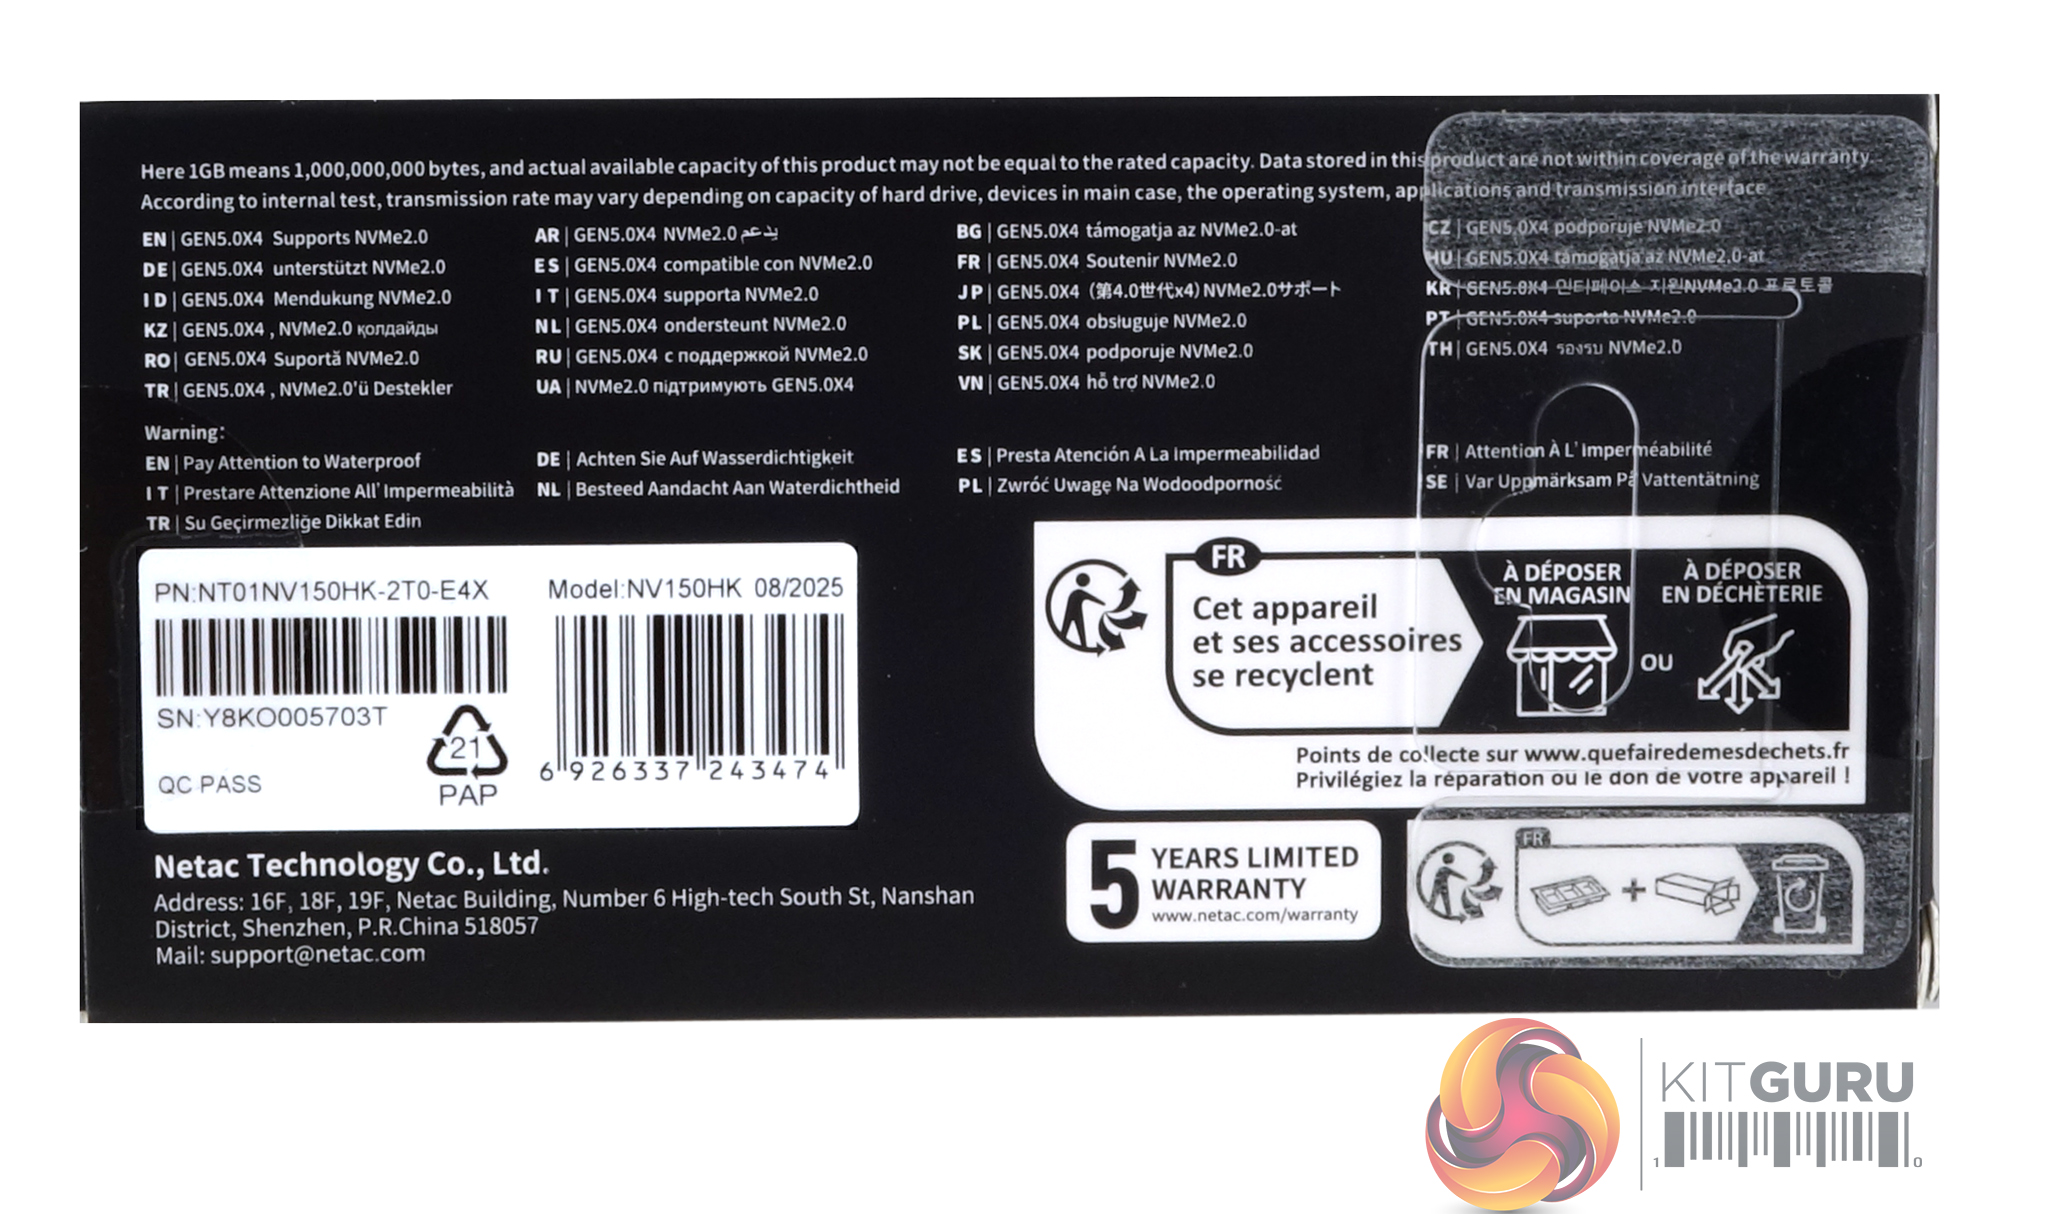
The top half of the rear of the box is covered in multilingual details about the interface – Gen5 x4 NVMe 2.0. At the bottom edge of the box is a panel displaying the fact that a five-year warranty backs the drive.
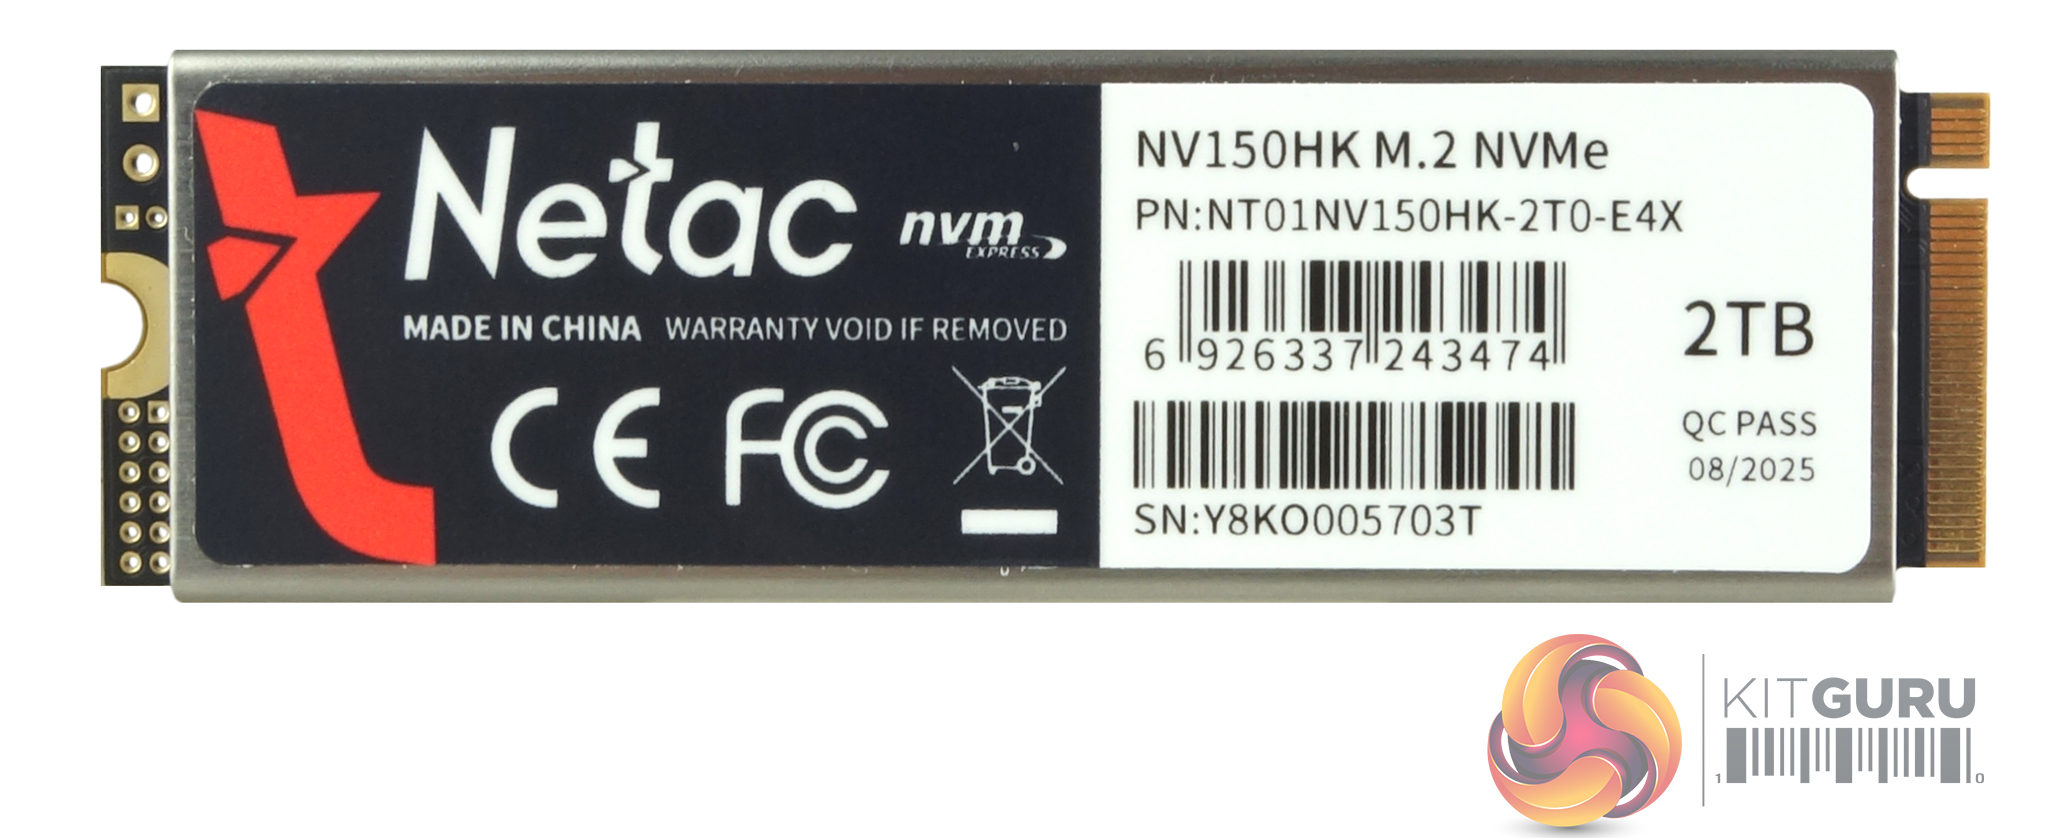
The drive is of a dual-sided design with Flash packages on both sides of the PCB.
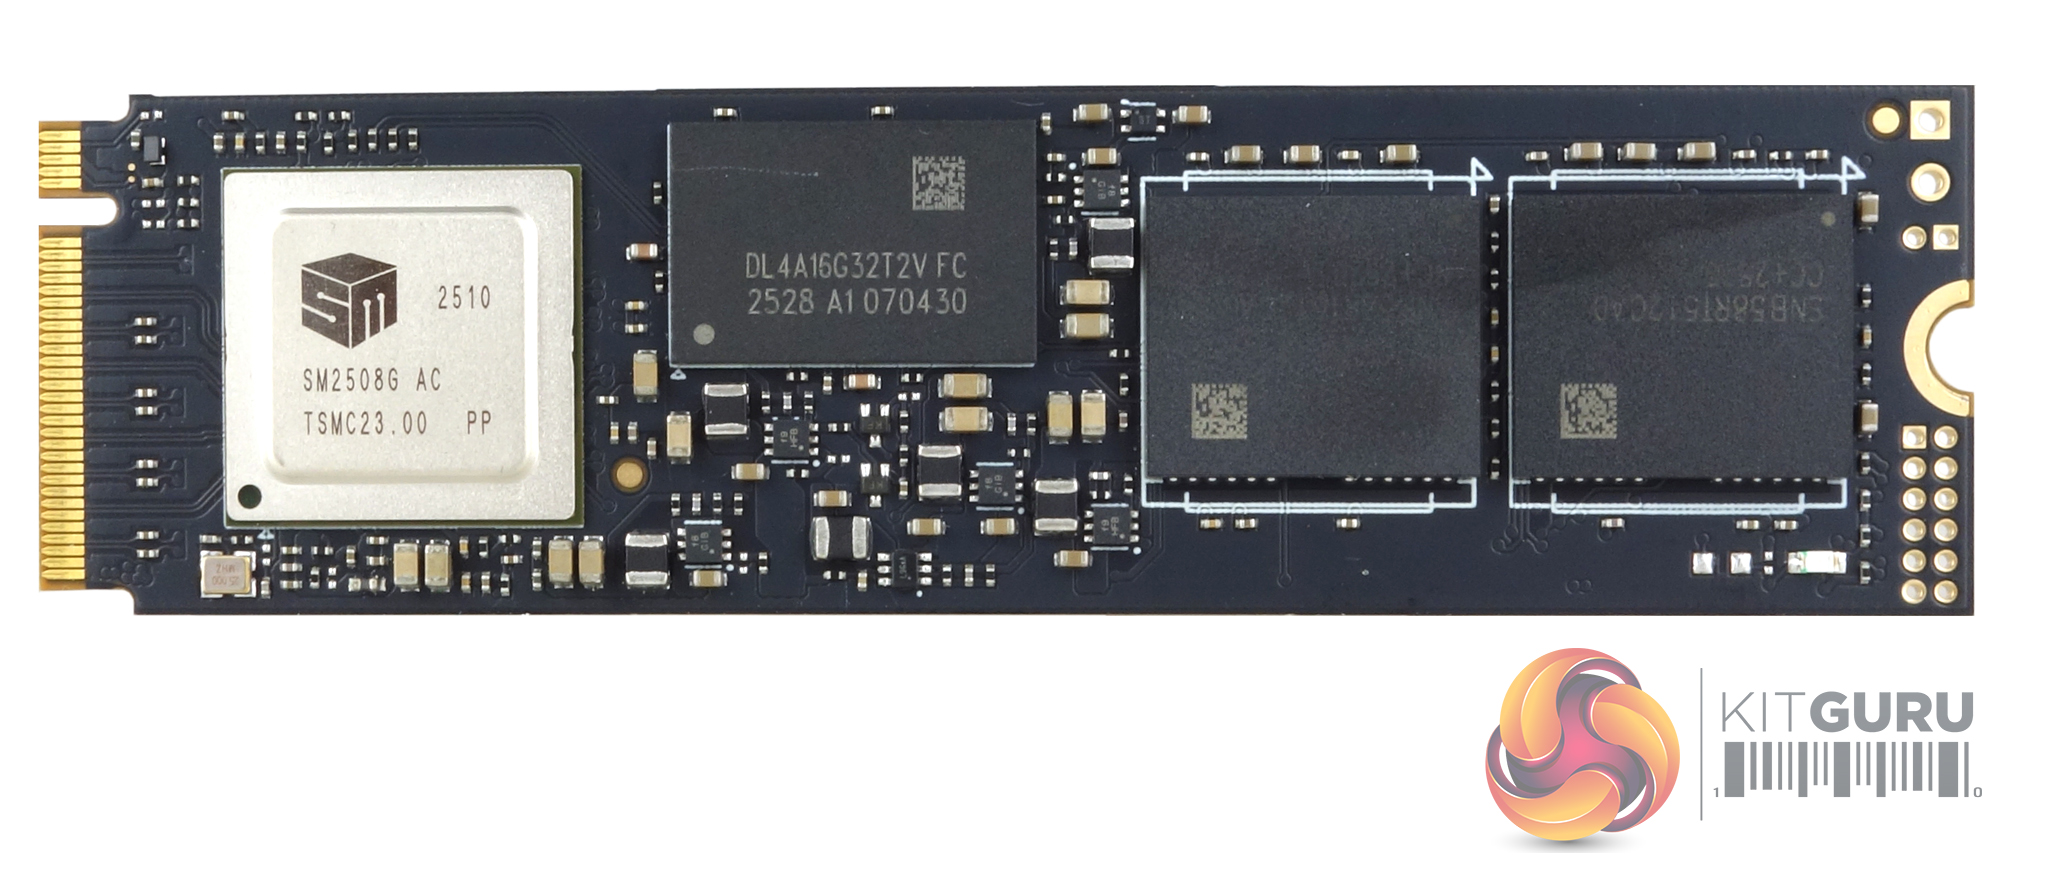
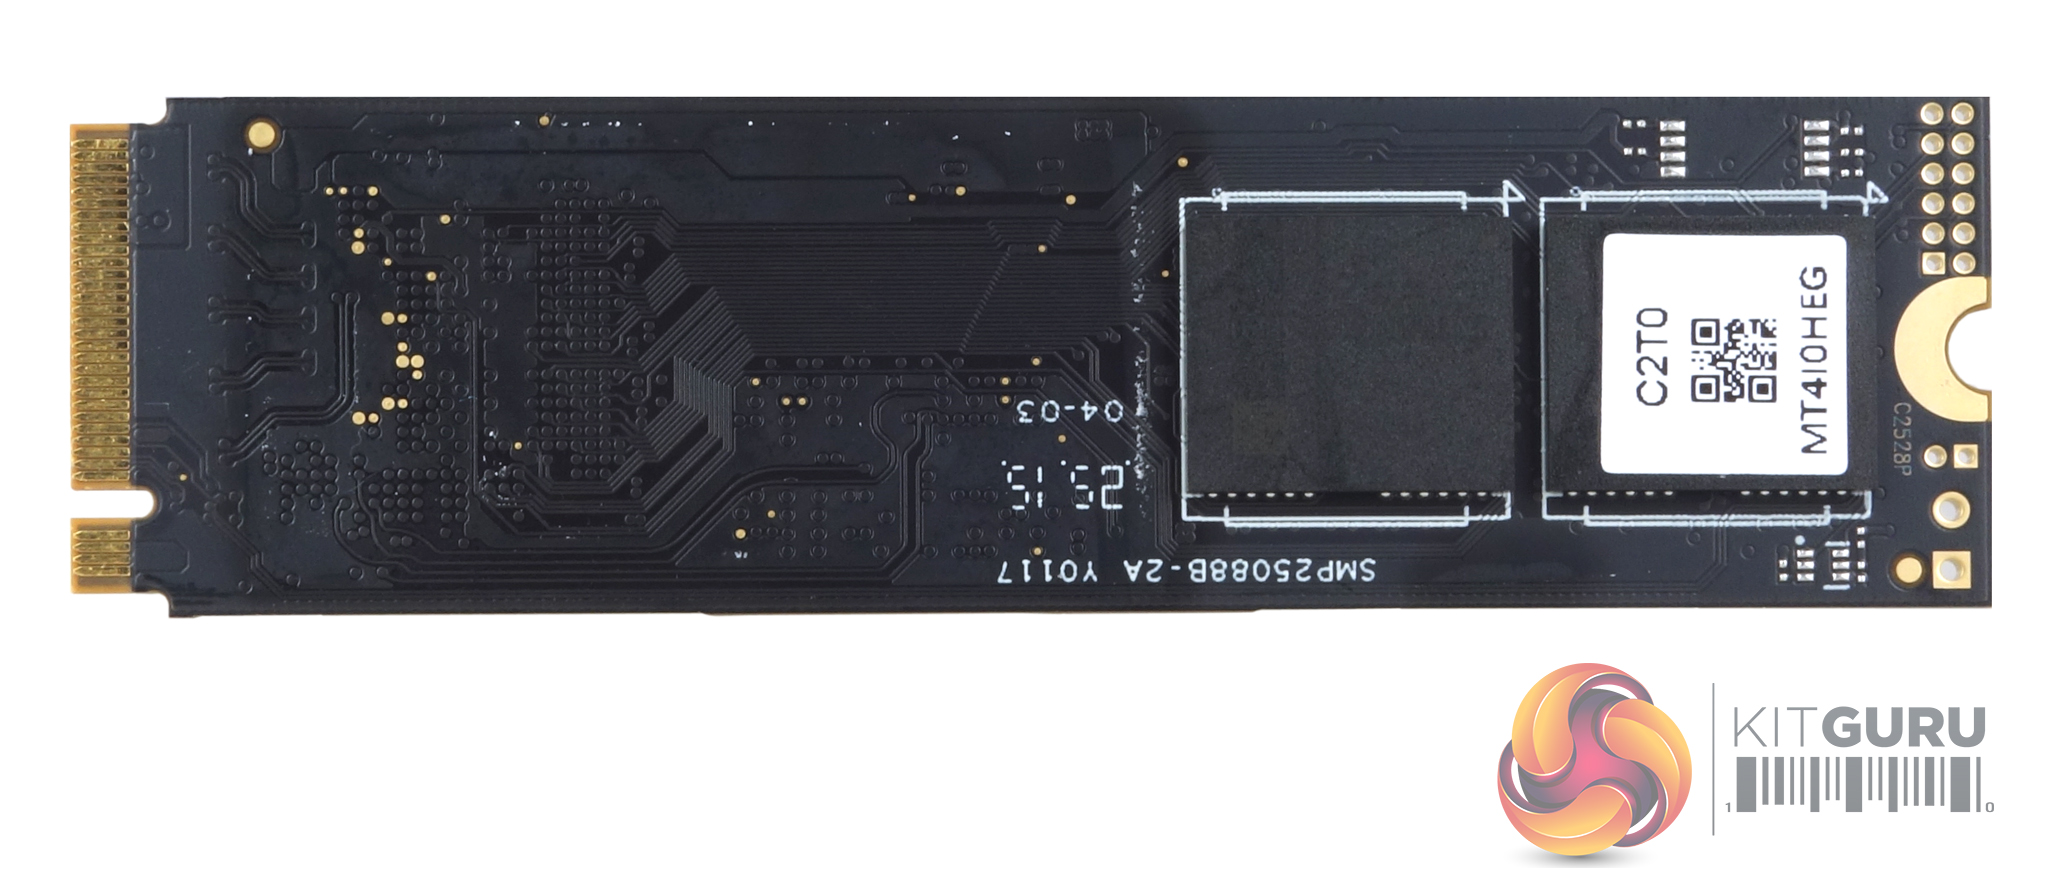
One side of the PCB holds the Silicon Motion SM2508 controller, a 2GB LPDDR4-2133MHz DRAM cache IC and two packages of 232-layer NAND. The other side of the PCB is home to another two packages of NAND.
Silicon Motion's SM2508 is an 8-channel controller built on a 6nm process. It uses a Quad-core ARM Cortex-R8 processor supporting the NAND channels at speeds of up to 3,600 MT/s per channel, supporting NVMe 2.0. It supports DDR4 and LPDDR4 DRAM with transfer rates of up to 3,200Mb/s. The SM2508 supports Sequential performance speeds of up to 14,500MB/s and 14,000MB/s for read and writes, respectively. While 4K performance is quoted as up to 2.5M IOPS for read and writes. It offers best-in-class power consumption of 3.5W in active mode and less than 2mW in PS4 mode.
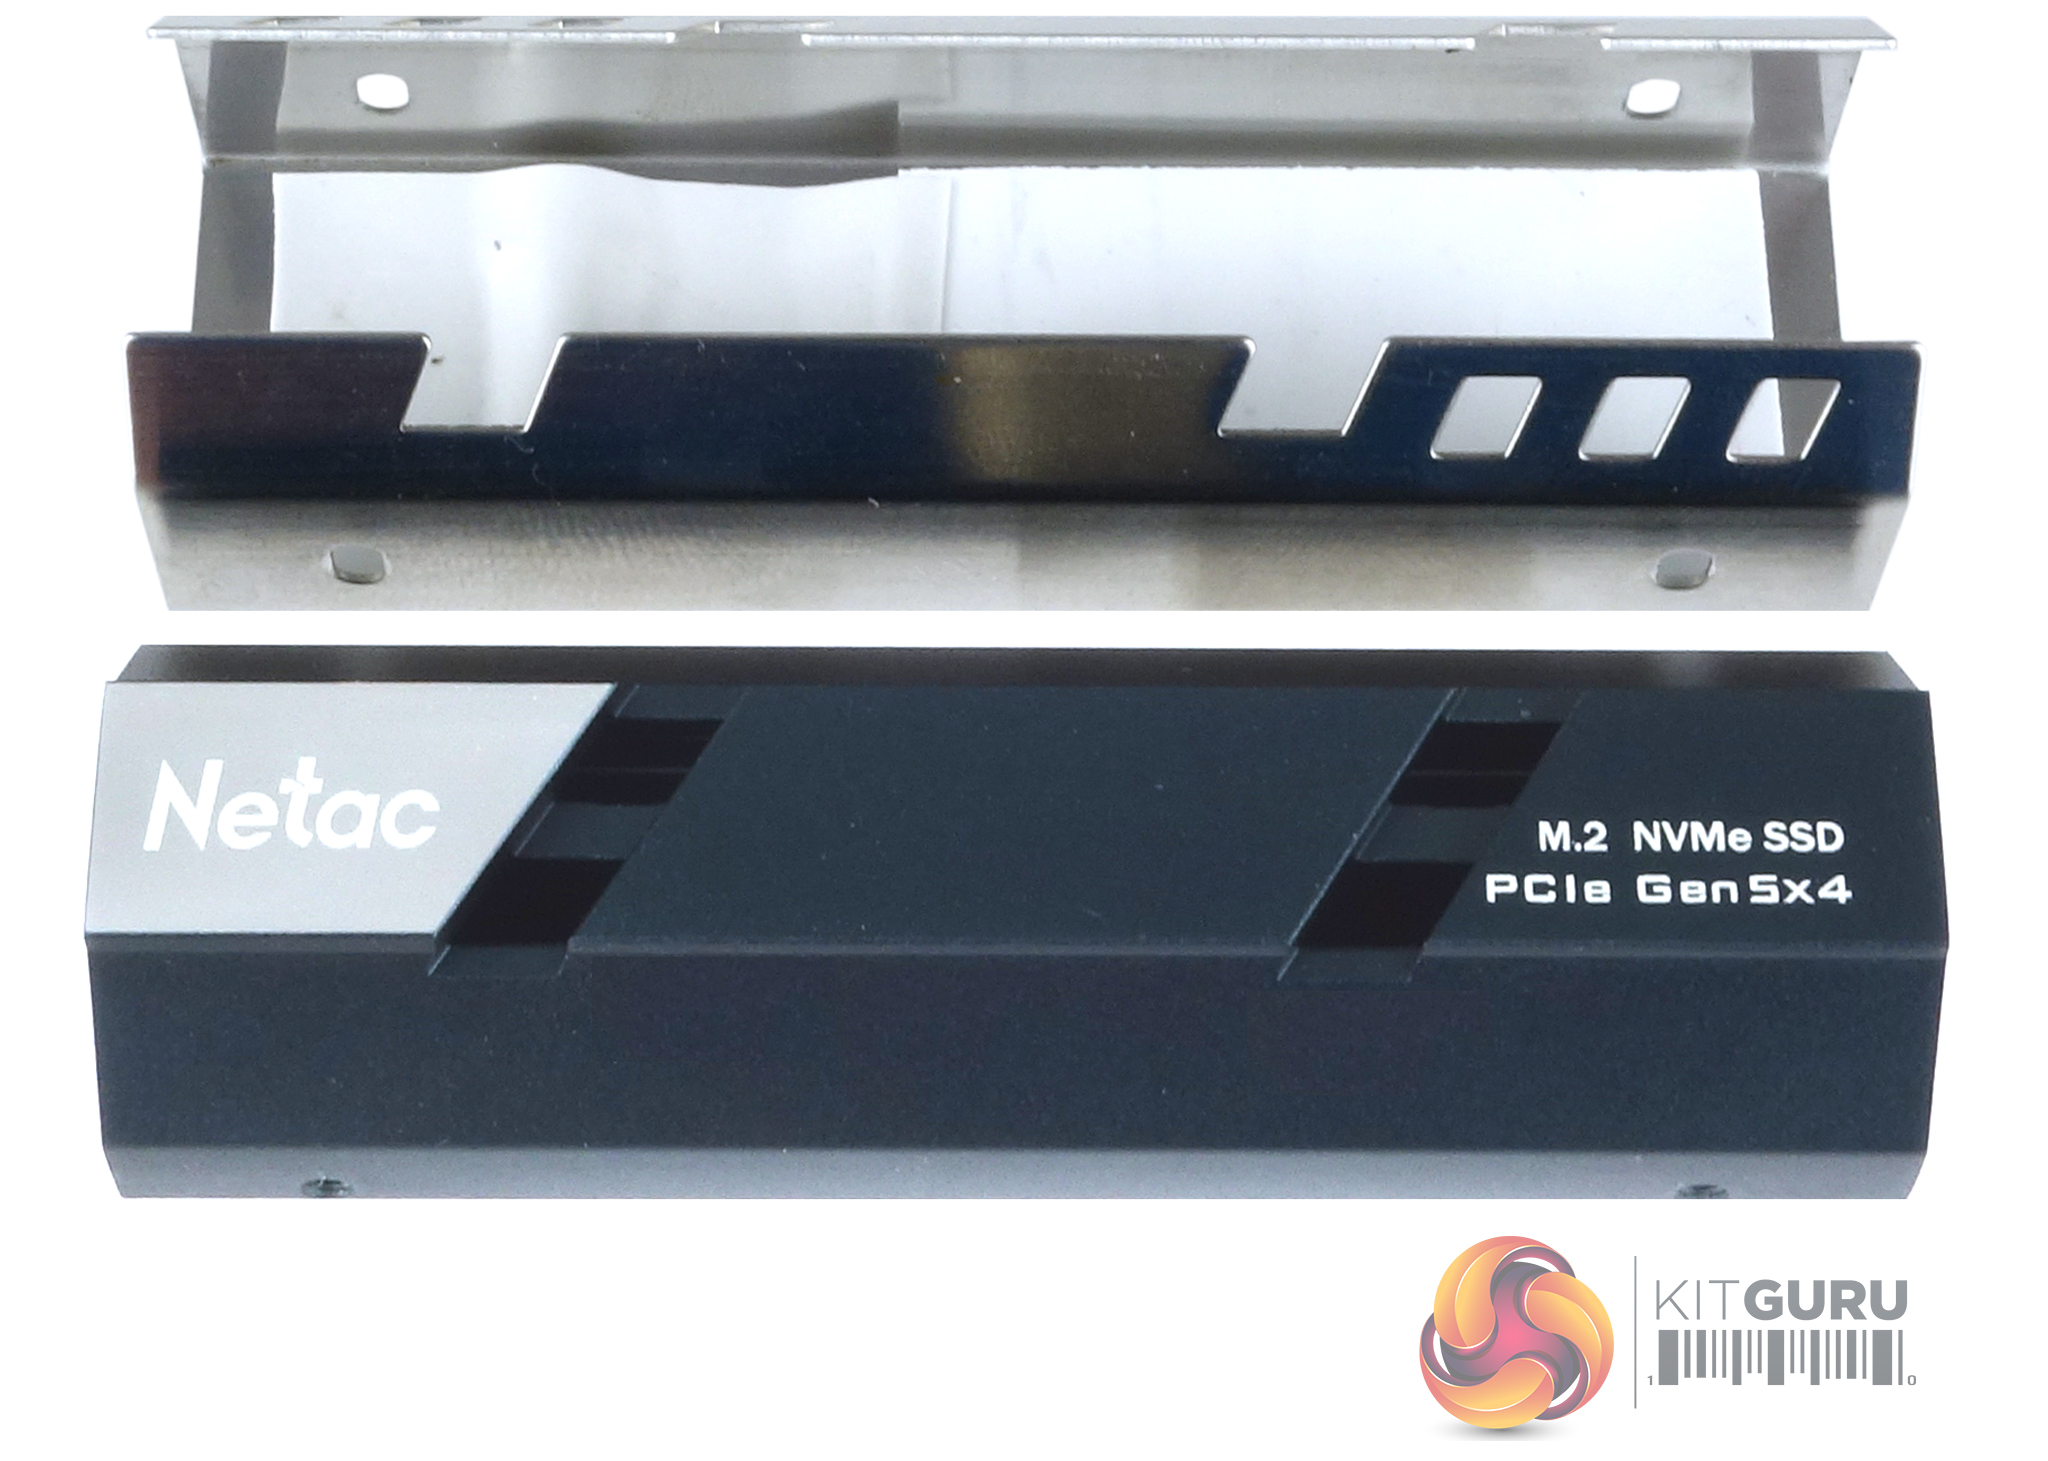
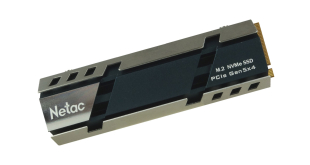
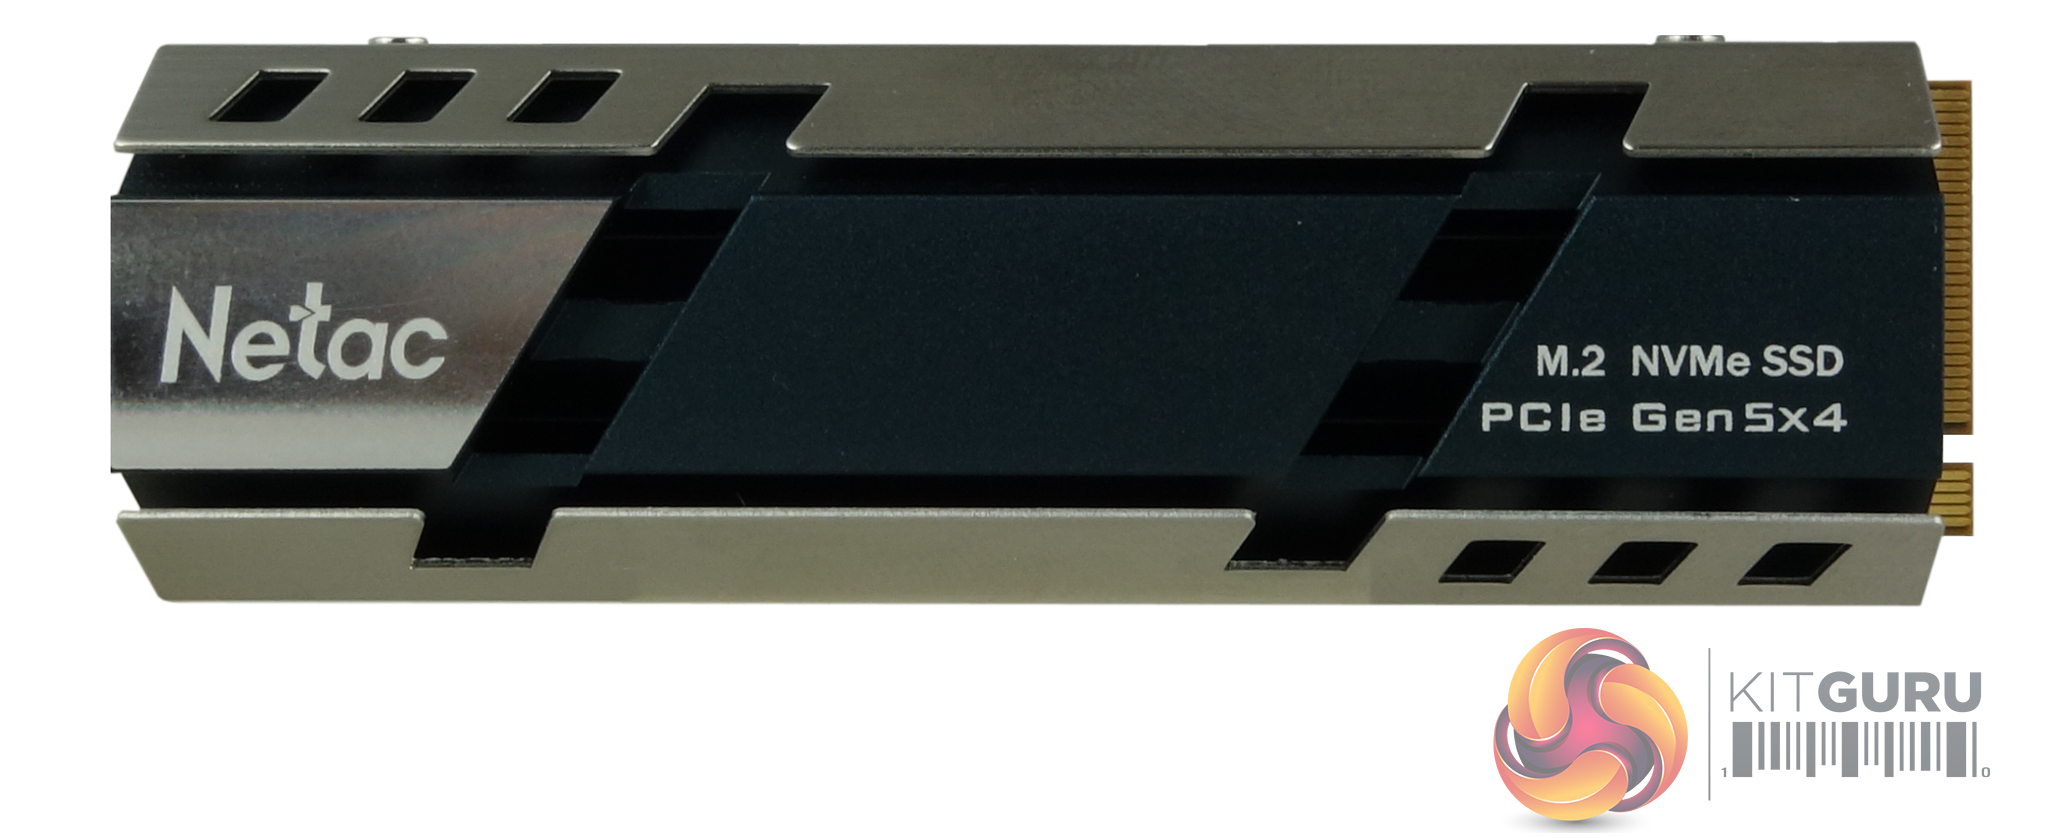
Netac have used a two-piece heatsink design with the NV150HK, the finned heatsink itself (weighing in at 32g), which is held in a chrome-finished cradle by four tiny screws. The drive is sandwiched between two fairly thick thermal pads.
For testing, the drives are all wiped and reset to factory settings by HDDerase V4. We try to use free or easily available programs and some real-world testing so you can compare our findings against your own system.
This is a good way to measure potential upgrade benefits.
Main system:
AMD Ryzen 7 7700X, 32GB DDR5-6000, Nvidia GeForce RTX 3050 and a Gigabyte AORUS X670E Xtreme motherboard.
Other drives
Biwin Black Opal X570 PRO 4TB
Biwin Black Opal X570 PRO 2TB
ADATA Legend 970 2TB
Corsair MP700 PRO SE 4TB
Corsair MP700 PRO 2TB
Corsair MP700 Elite 2TB
Crucial T705 2TB
Crucial T700 2TB
Crucial T700 with Heatsink 2TB
Gigabyte AORUS 10000 2TB
Kingston Fury Renegade G5 2TB
Kioxia Exceria Plus G4 2TB
Klevv Genuine G360 2TB
Samsung SSD 9100 PRO 2TB
Seagate FireCuda 520 2TB
Sandisk WD Black SN8100 2TB
Software:
Atto Disk Benchmark 4 / 5
CrystalMark 8.0.0.
AS SSD 2.0.
IOMeter.
UL Solutions PC Mark 10.
UL Solutions 3DMark Storage Benchmark.
Final Fantasy XIV Endwalker Official Benchmark.
All our results were achieved by running each test five times with every configuration, which ensures that any glitches are removed from the results. Trim is confirmed as running by typing fsutil behaviour query disabledeletenotify into the command line. A response of disabledeletenotify =0 confirms TRIM is active.
CrystalDiskMark is a useful benchmark for measuring the theoretical performance levels of hard drives and SSDs. We are using v8.0.5.
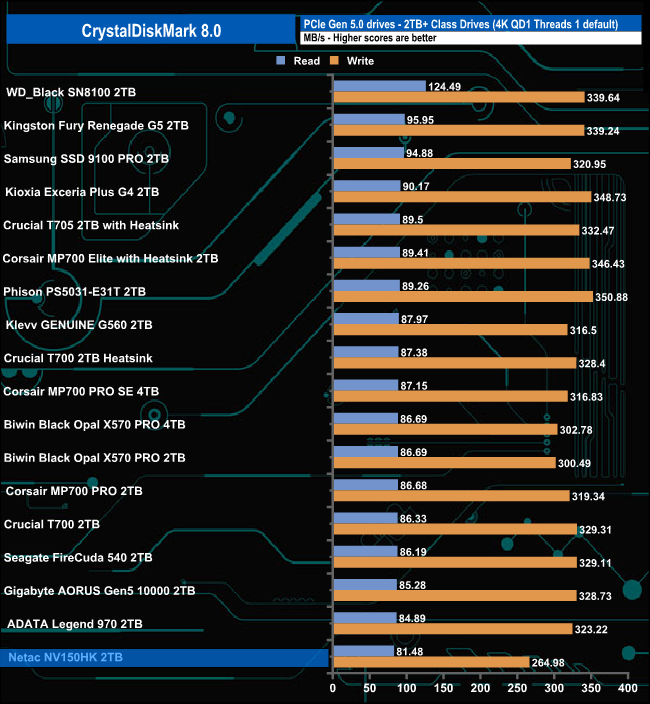
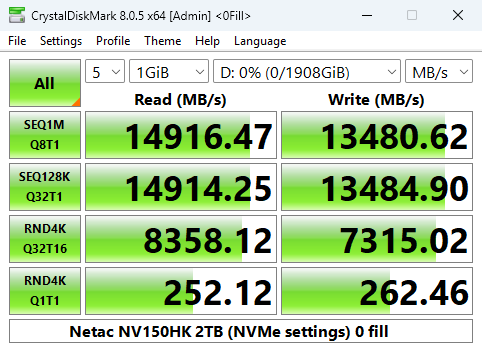
Using the default settings for the 4K QD1 CrystalDiskMark 8 test, the 2TB NV150HK read score of 81.48MB/s sees it in last place in our results chart. Switching to the compressed data test, the read performance increased across the board, especially the 4K QD1 T1 test, with the only real improvements in writes coming from the 4K QD32 T16 test.
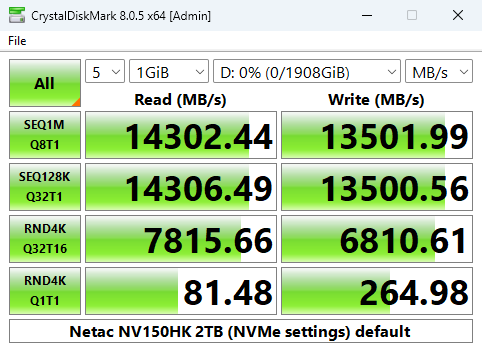
Looking at the benchmark result screens, we could confirm the official Sequential maximums and even better them a little, of up to 14,000MB/s & 13,000MB/s respectively for read and writes, with test results of 14,302MB/s for reads and 13,501MB/s for writes.
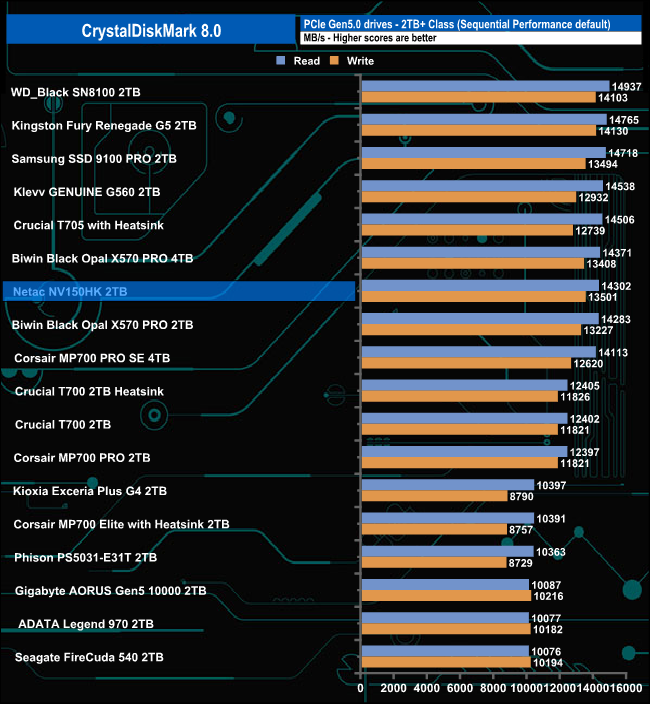
The Netac's NV150HK read score of 14,302MB/s sees the drive slip into seventh place on the results chart. Its write score of 13,501MB/s is the third fastest we've seen to date for a Gen 5 consumer drive.
Peak Performance Profile
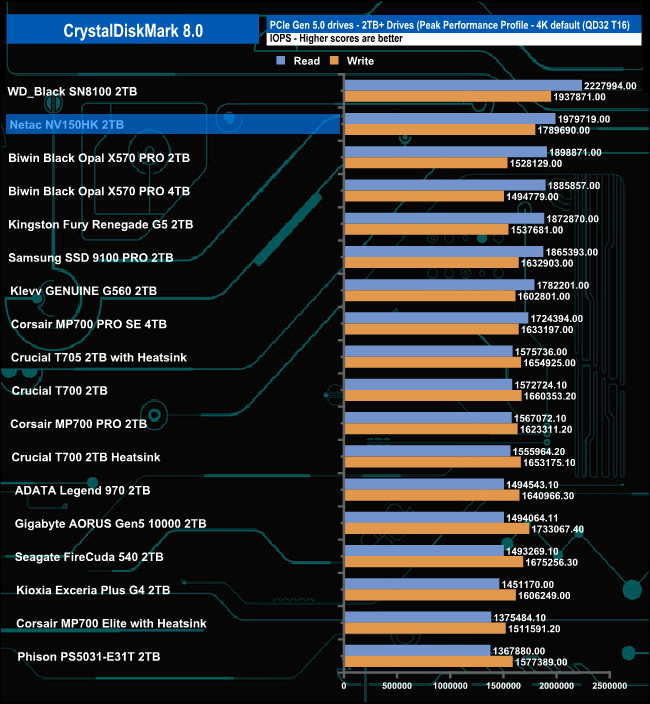
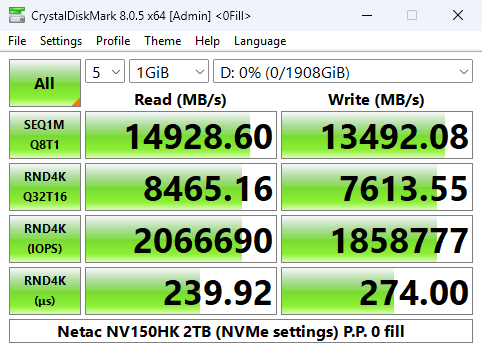
Netac quotes random 4K maximums of up to 2M IOPS for reads and up to 1.8M IOPS for writes. Using the default Peak Performance profile of CrystalDiskMark 8, we couldn't quite hit the official maximums with test results of 1,979,719 IOPS for reads and 1,789,690 IOPS for writes. Switching over to the compressed data test, the read/write scores improved to confirm, and better, the official figures with a read result of 2,066,690 IOPS with writes at 1,858,777 IOPS.
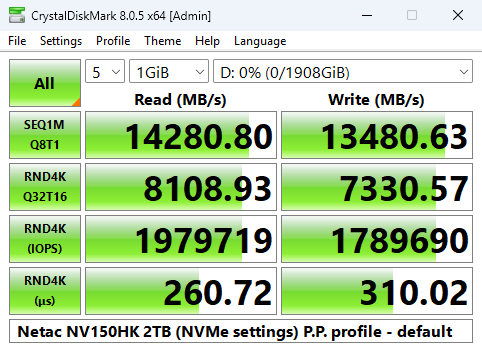
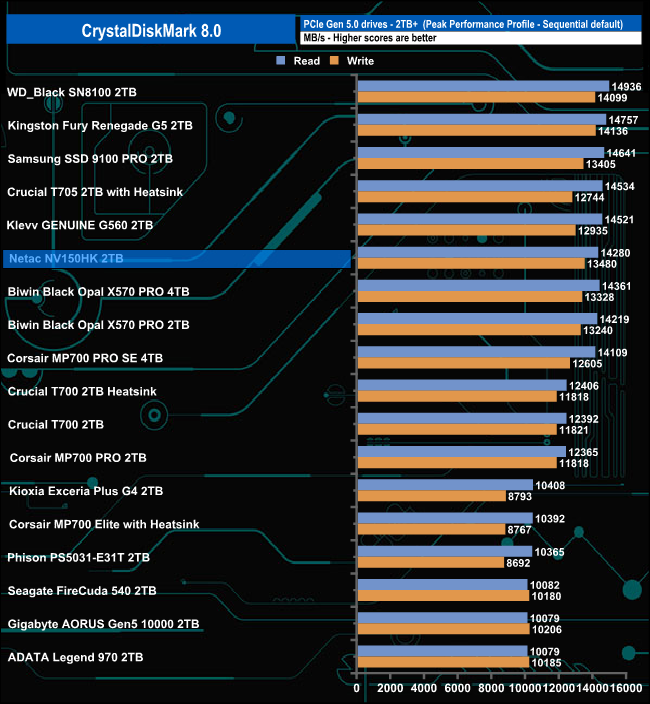
Once again, with the Peak Performance profile, we could confirm the official Sequential performance figures, its read result of 14,280MB/s putting it into sixth place in the results chart.
Real World Profile
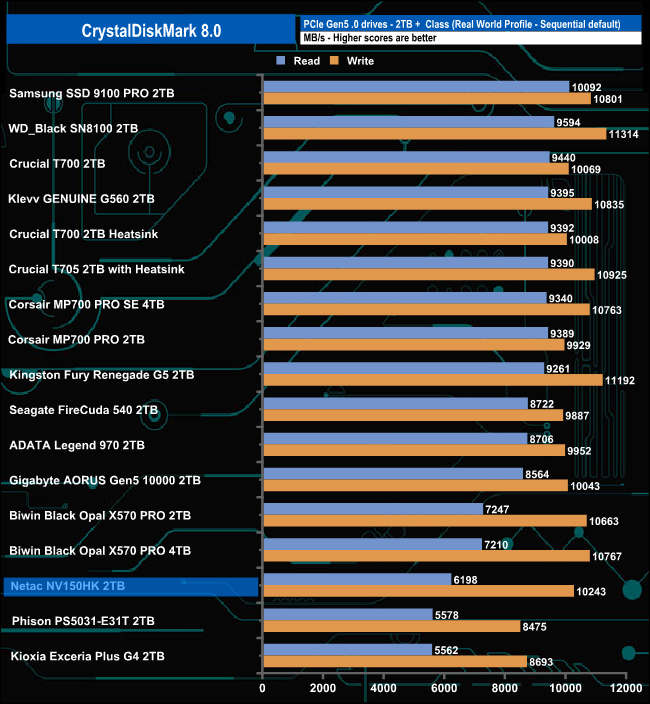
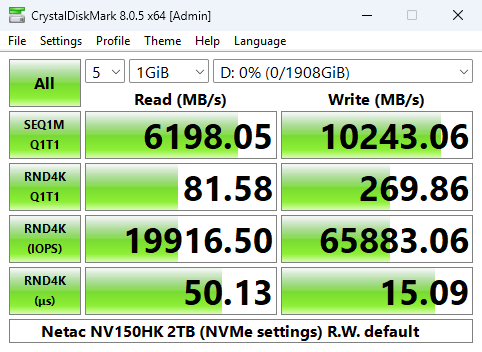
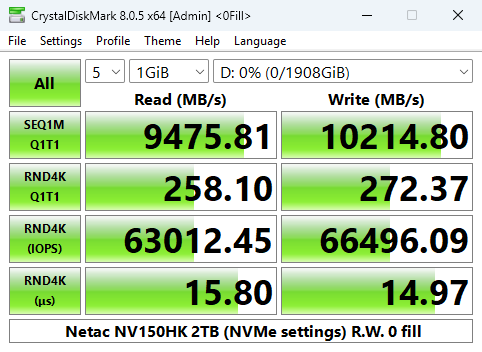
When it comes to CrystalDiskMark's Real World profile, the NV150HK doesn't fare so well; its read score of 6,198MB/s puts it into third from last position in the result chart; however, its write performance is much stronger at 10,243MB/s. Once again, switching over to the compressed data test shows huge improvements in the read performance.
The ATTO Disk Benchmark performance measurement tool is compatible with Microsoft Windows. Measure your storage system's performance with various transfer sizes and test lengths for reads and writes. Several options are available to customise your performance measurement, including queue depth, overlapped I/O and even a comparison mode with the option to run continuously. Use ATTO Disk Benchmark to test any manufacturer's RAID controllers, storage controllers, host adapters, hard drives and SSD drives and notice that ATTO products will consistently provide the highest level of performance to your storage. ATTO uses RAW or compressible data.
We are using version 4.1 for our NVMe disk tests, with a set length of 256 MB, and testing both read and write performance simultaneously. We are introducing ATTO 5.0, which brings new features, enhancements and changes for more accurate testing of the latest drives.
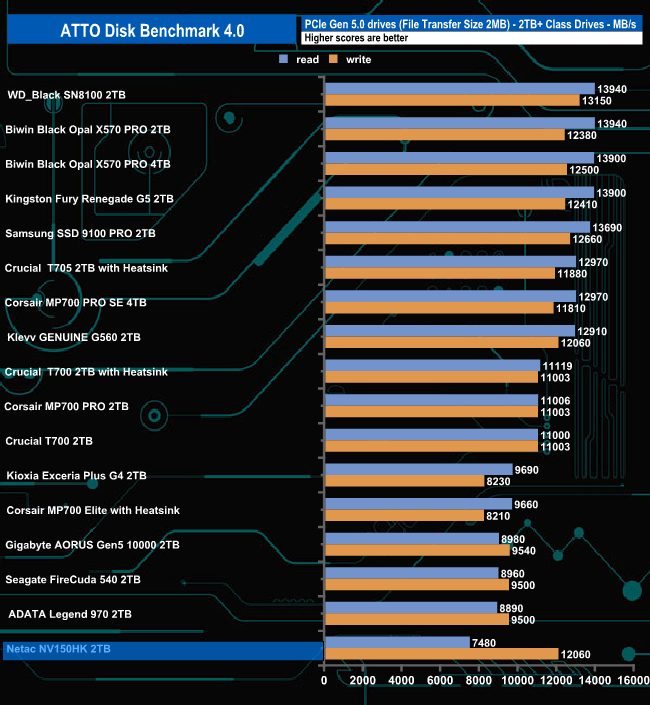
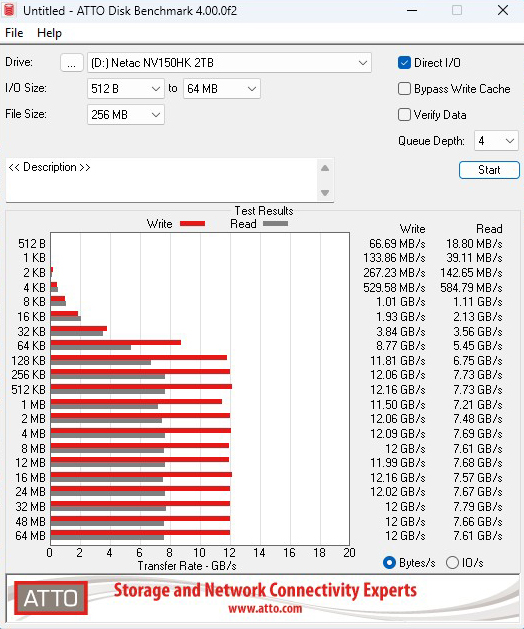
Using version 4.0.02 of the ATTO benchmark, we couldn't get close to the official read Sequential maximum of 14,000MB/s, with a test result of just over half that at 7,480MB/s. This has nothing to do with the drive; it's down to this version of ATTO and how it deals with the latest Gen 5 drives. A look at the ATTO version 5 results for the drive confirms this.
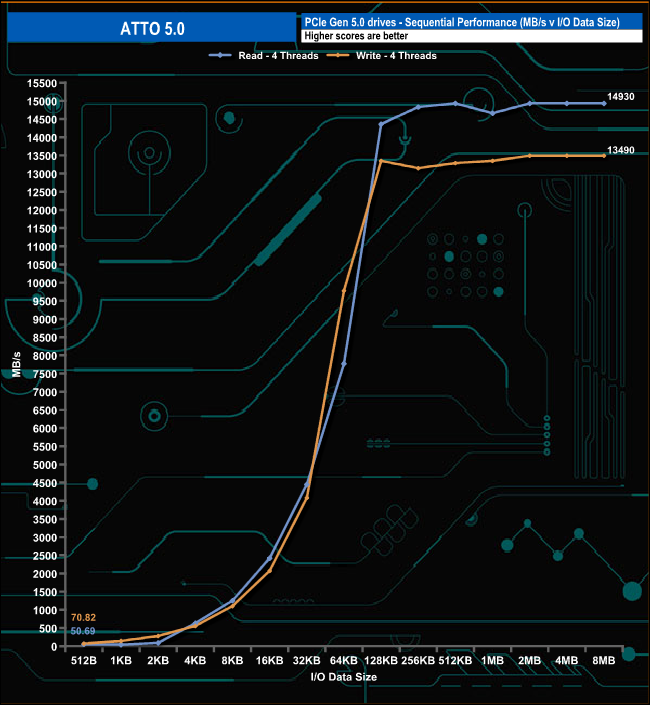
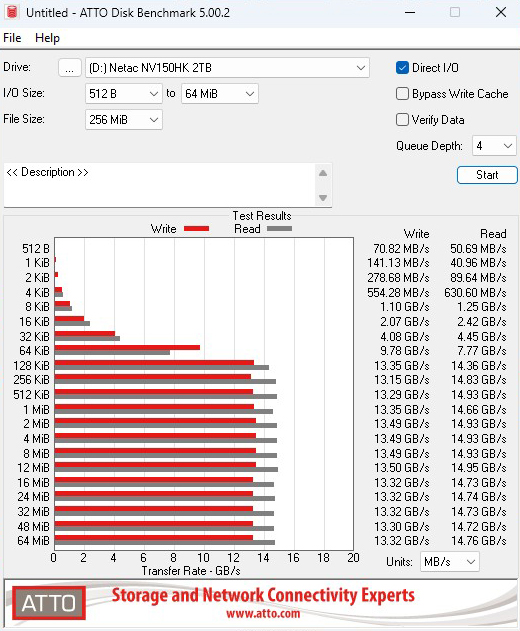
ATTO 5.0 brings new features, enhancements and changes for more accurate testing of the latest drives. Using this, we were able to confirm and even better, the official maximum Sequential figures with test results of 14,930MB/s and 13,490MB/s for reads and writes, respectively.
AS SSD is a great free tool designed just for benchmarking Solid State Drives. It performs an array of sequential read and write tests, as well as random read and write tests with sequential access times over a portion of the drive. It uses
incompressible data samples, which many drives struggle with, so results can be viewed as the worst-case scenarios.
AS SSD includes a sub suite of benchmarks with various file pattern algorithms, but this is difficult in trying to judge accurate performance figures.
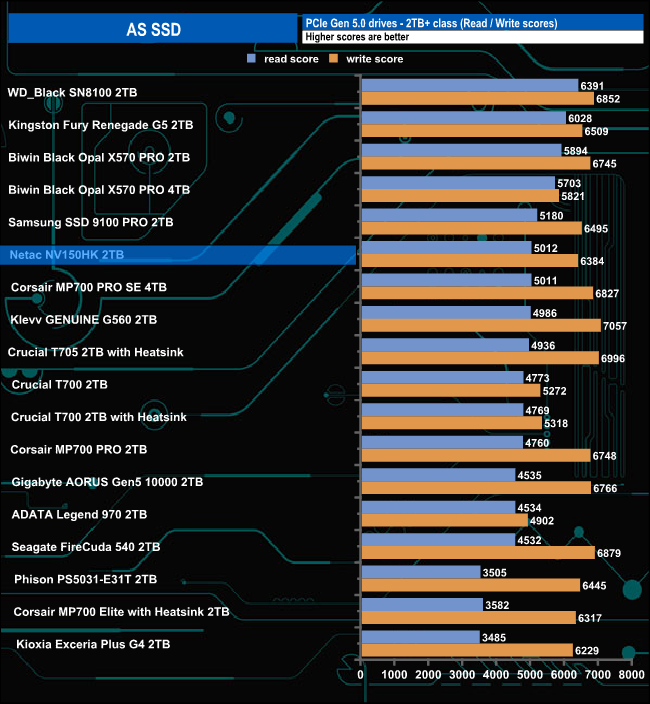
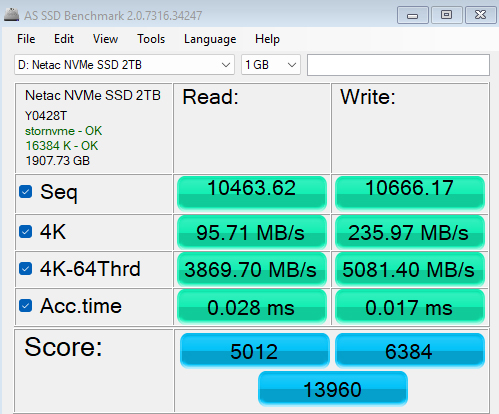
The Netac NV150HK's read score of 5012 sees the drive in sixth place in the results chart. Its write score of 6384 is much stronger.
We used CrystalDiskMark 8‘s custom settings to test the Sequential read and write performance of the drive through a range of queue depths. The setup for the tests is listed below.
128KB Sequential Read / Write.
Transfer Request Size: 128KB, Thread(s): 1, Outstanding I/O: 1-32.
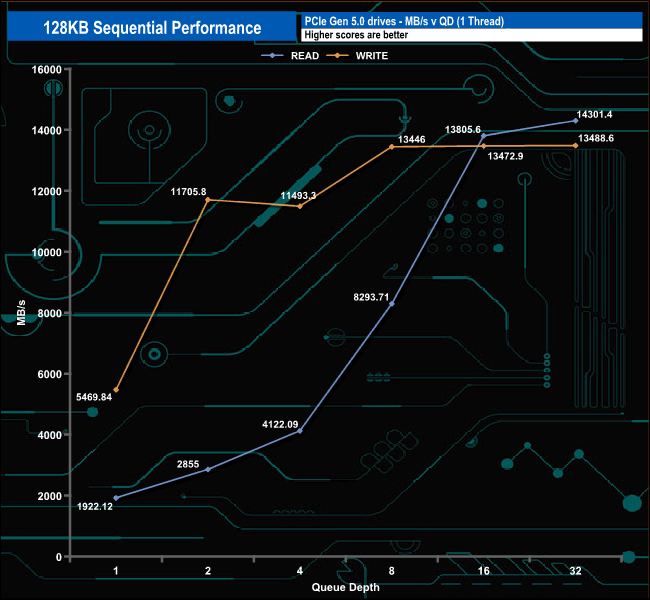
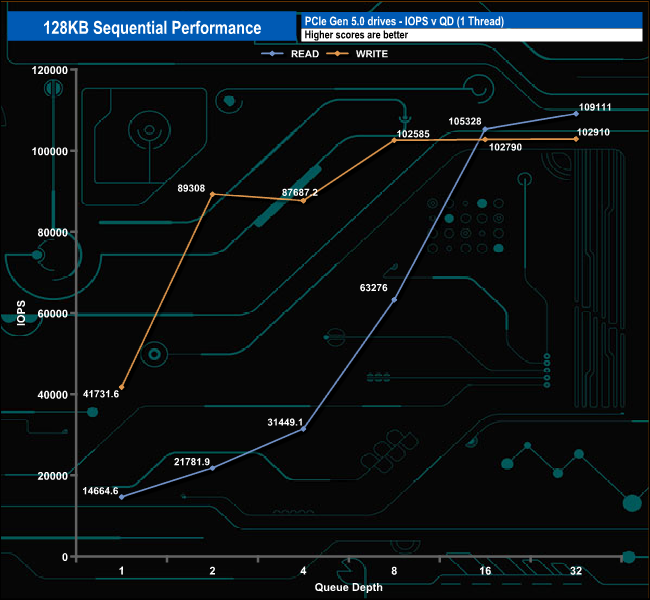
With our Sequential read/write tests, we could confirm the official maximums of 14,000MB/s & 13,000MB/s respectively, with test results of 14,301MB/s for reads and 13,488MB/s for writes, both figures better than the official maximum ratings.
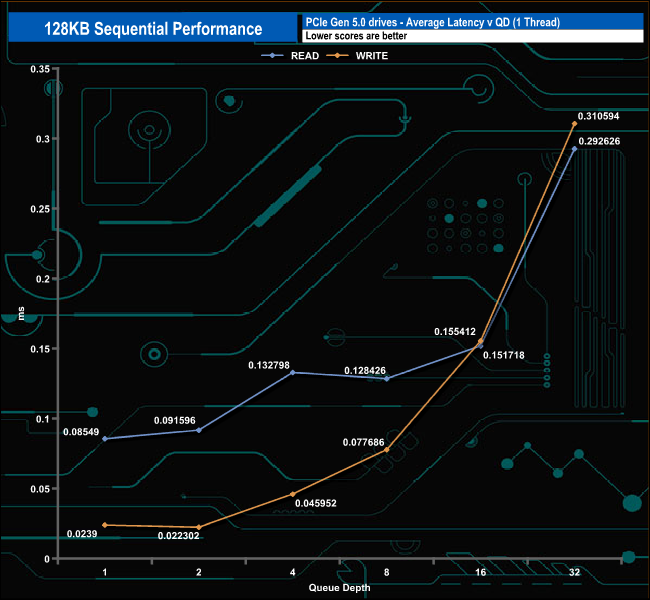
128KB Sequential Read v QD performance.
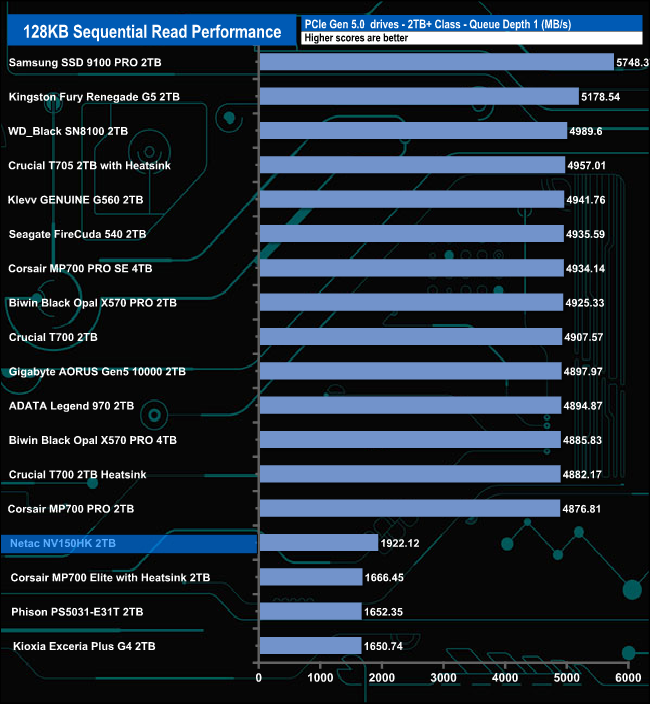
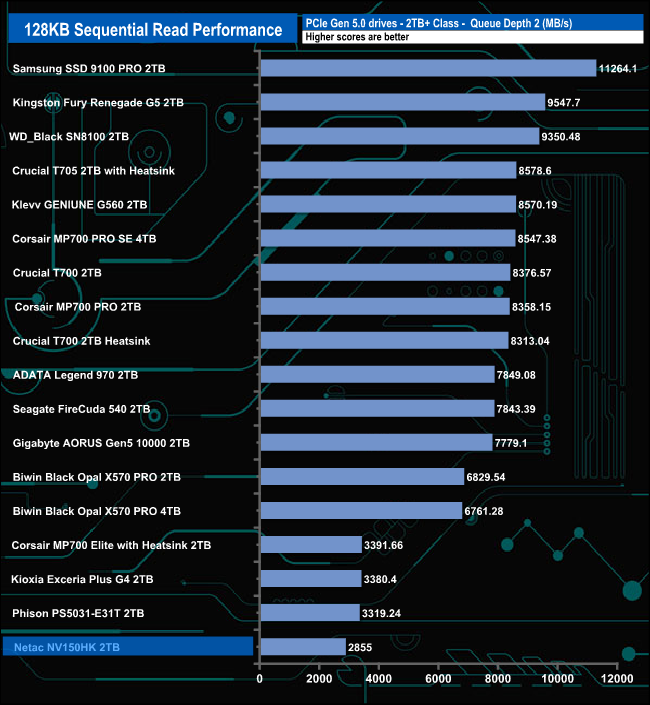
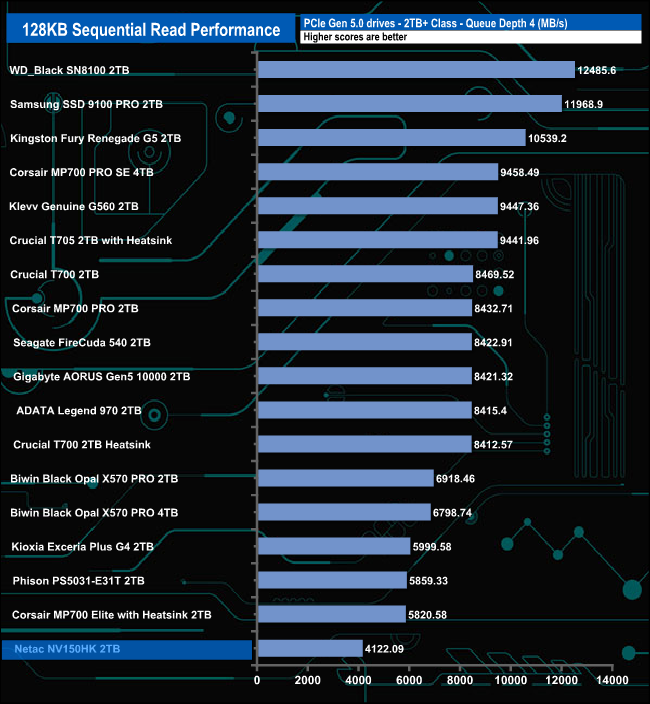
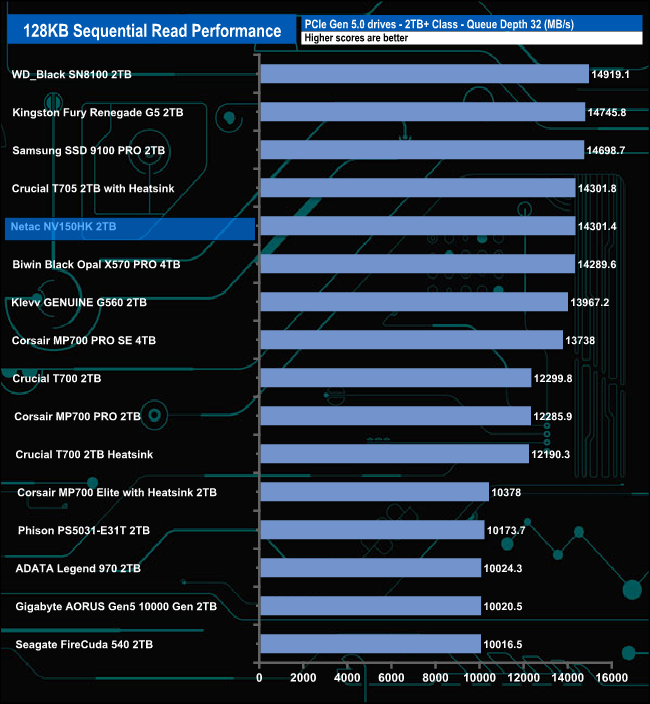
At lower queue depths (QD1-4), the performance of the NV150HK lags behind the majority of its competitors. However, at QD32, the drive's performance sees it rise rapidly up the chart into fifth position.
128KB Sequential Write v QD performance.
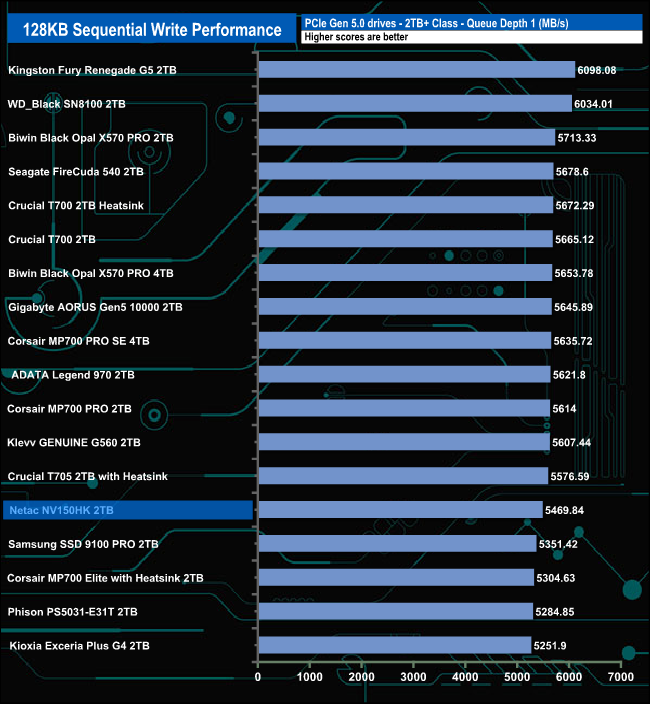
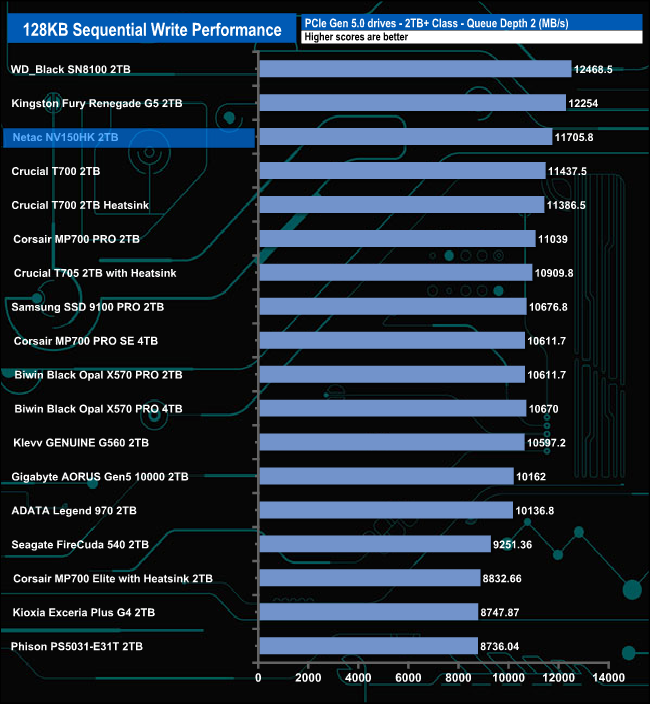
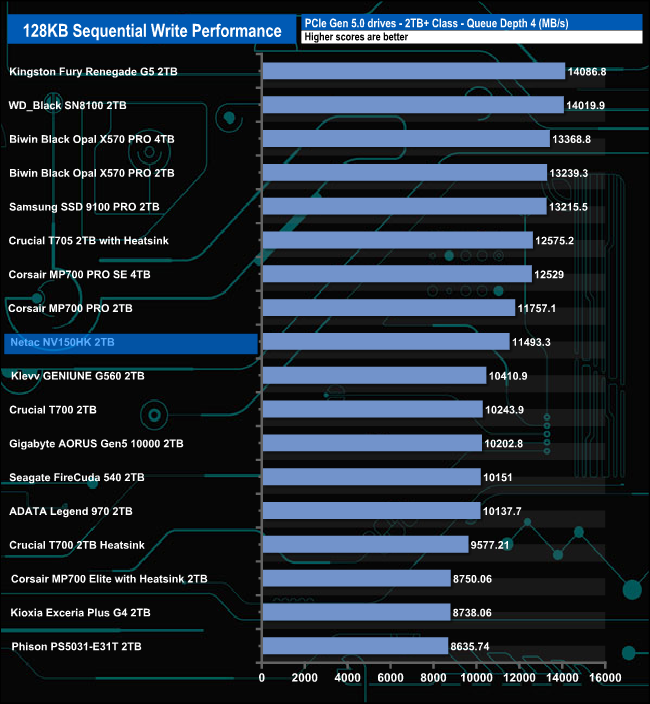
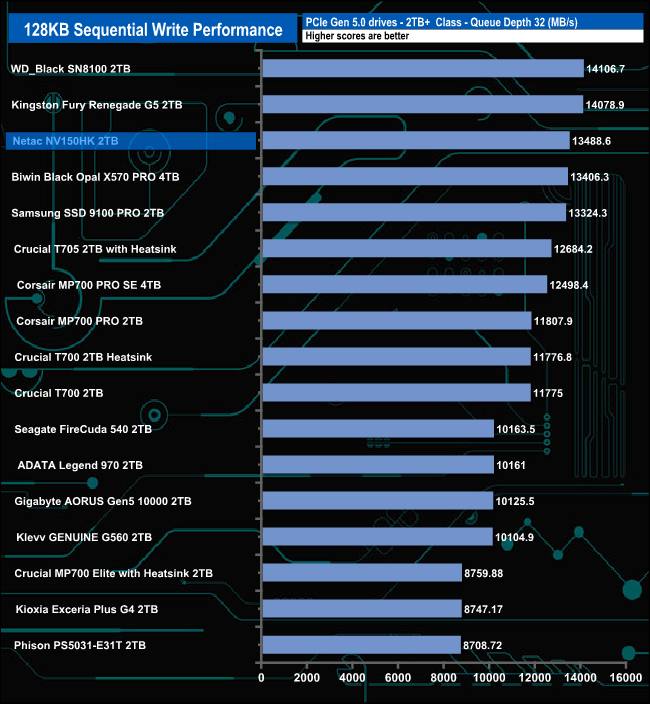
When it came to Sequential writes, at queue depth 1, the drive sits in the bottom half of the results chart. At QD2, the drive's performance sees it climb into third place behind WD's Black SN8100 and Kingston's Fury Renegade G5 drives. At QD4, the drive has dropped into a mid-table position, but at QD32 the drive sits in third place again.
We used CrystalDiskMark 8‘s custom settings to test the 4K random read performance of the drive through a range of queue depths. The setup for the tests is listed below.
Transfer Request Size: 4KB, Outstanding I/O: 1-32.
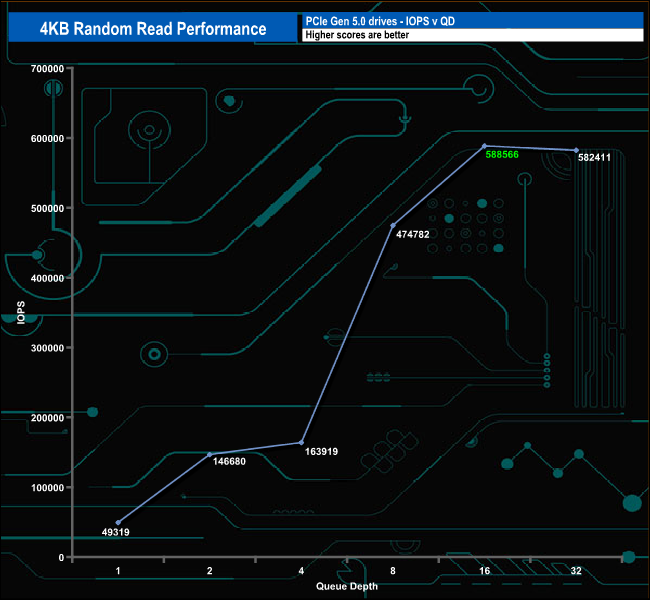
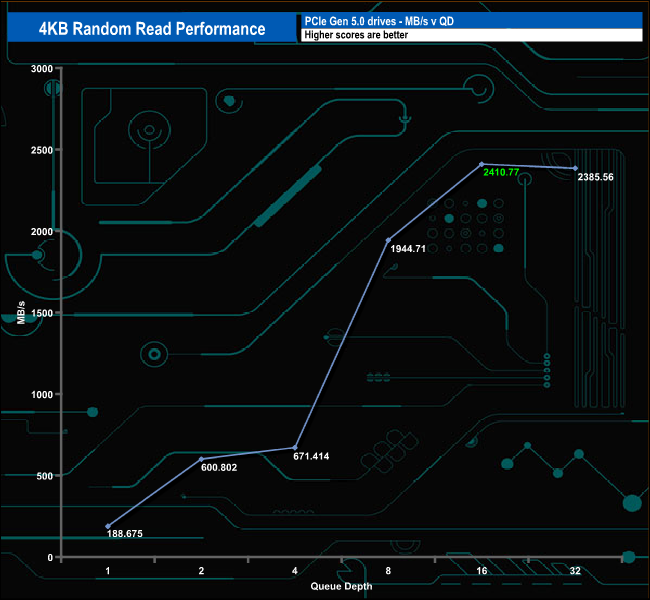
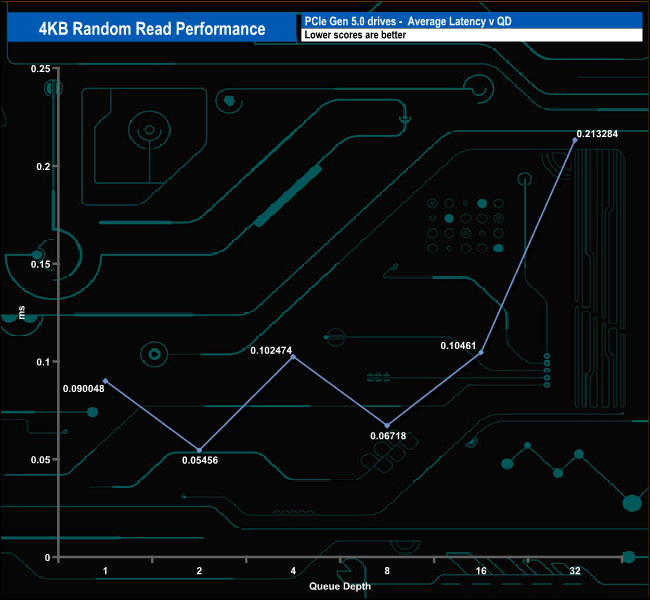
Netac rate the 4K random read performance of the NV150HK at up to 2M IOPS. Using our four-threaded test, we couldn't get close to that figure. The fastest performance we saw from the drive was 588,566 IOPS (QD16) before dropping back to 582,411 IOPS at the end of the test.
4K Random Read v QD Performance
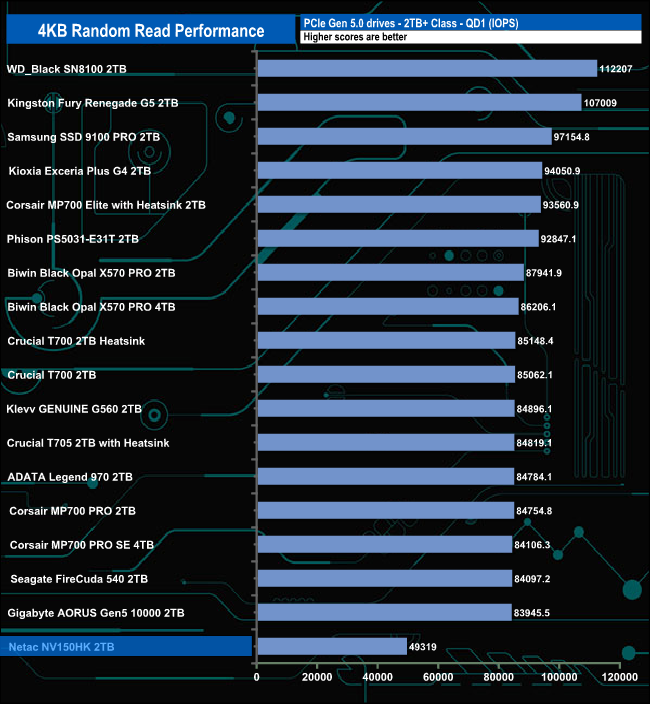
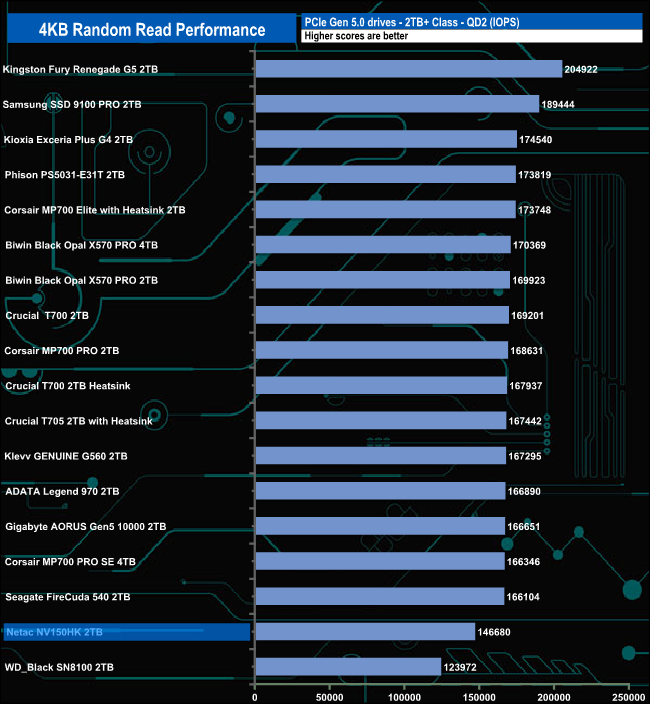
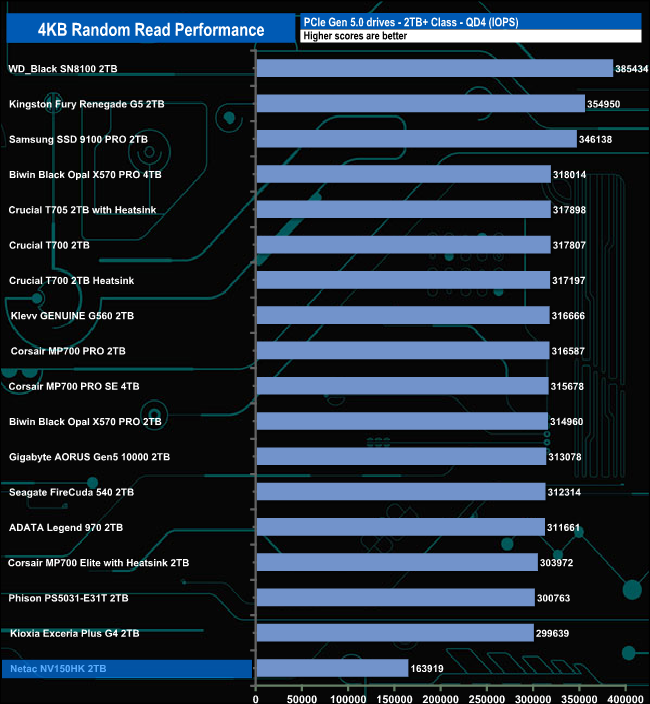
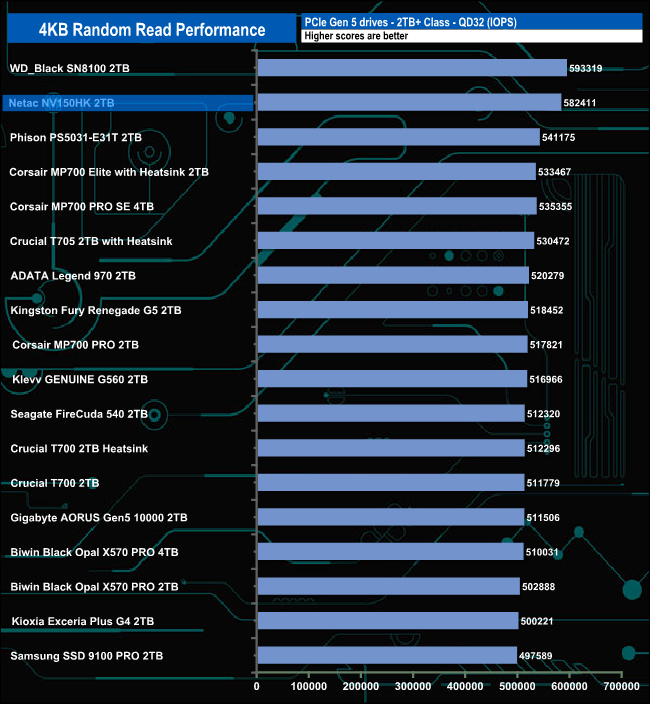
At queue depths, QD1 and QD4, the drive sits in last place and at QD2, it sits in penultimate place. But at QD32, the drive has rocketed up the chart to sit in second place behind WD's Black SN8100 drive.
We used CrystalDiskMark 8‘s custom settings to test the 4K random write performance of the drive through a range of queue depths. The setup for the tests is listed below.
Transfer Request Size: 4KB, Outstanding I/O: 1-32.
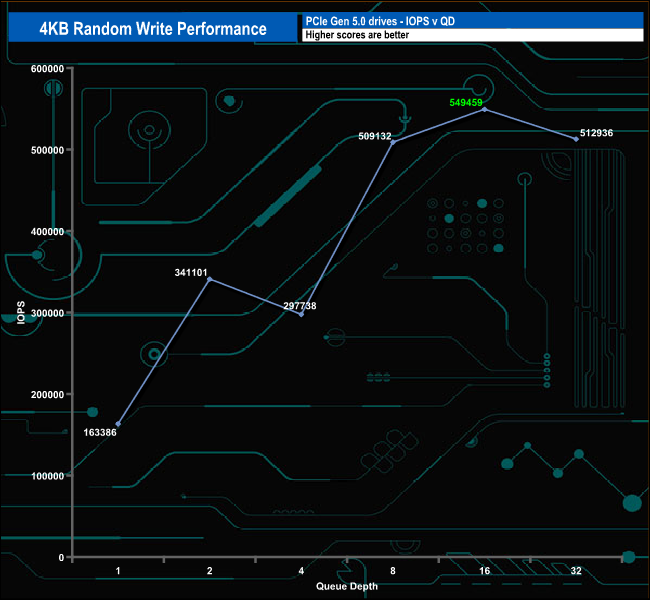
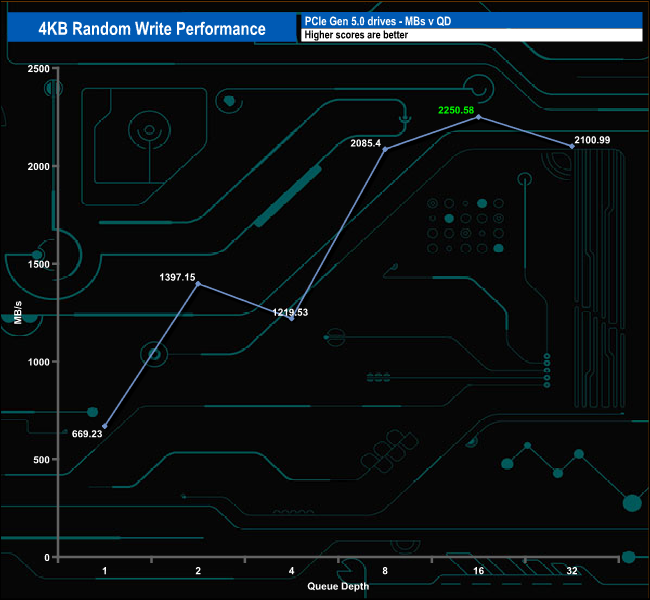
The NV150HK is rated at up to 1.8M IOPS for writes. Using our four threaded tests, the best we saw was 549,459 IOPS (QD16) before the performance dropped off to finish the test run at 512,936 IOPS.
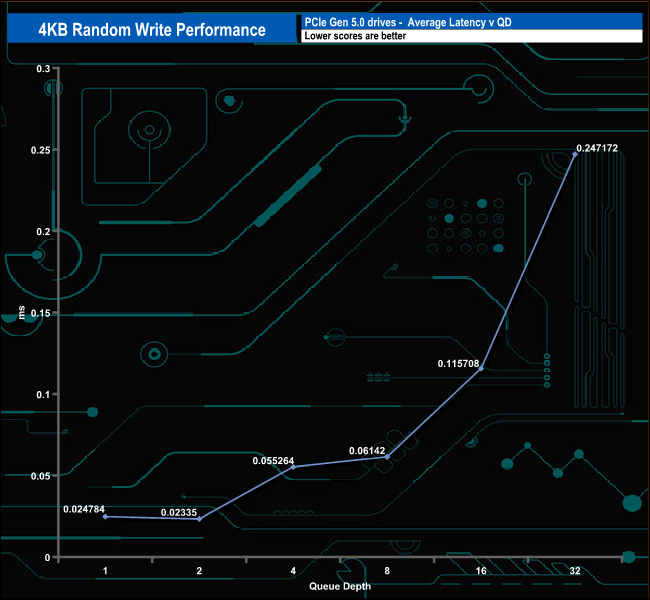
4K Random Write v QD Performance
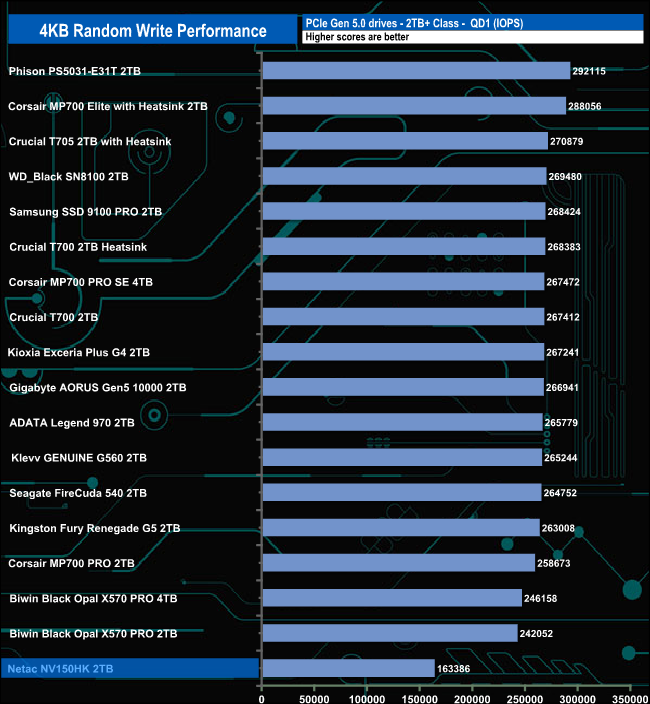
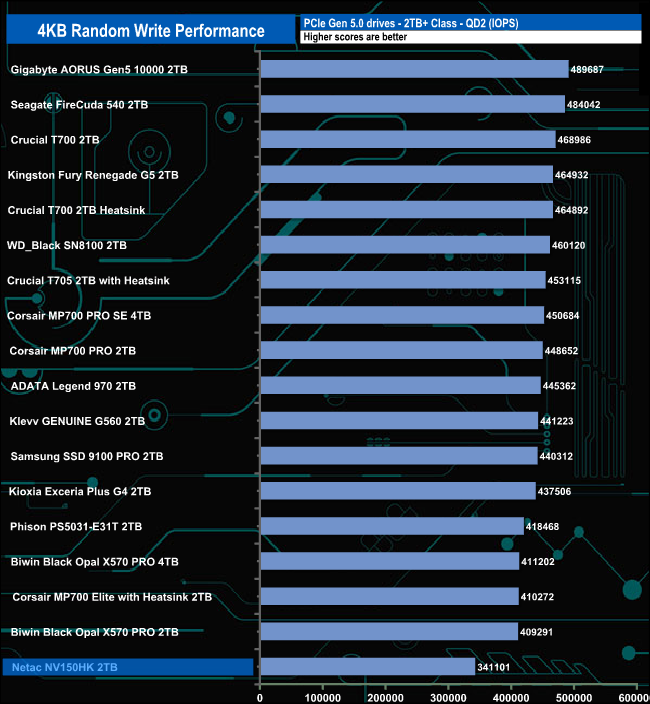
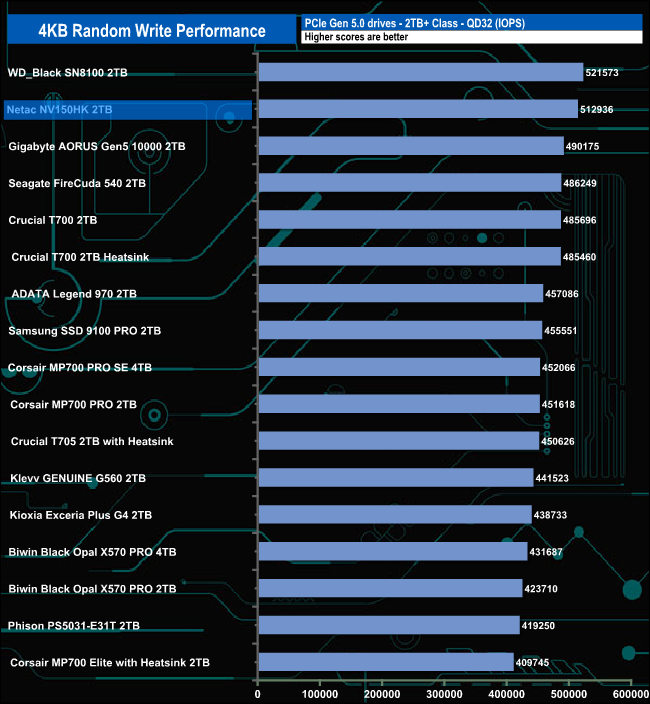
The drive works much better at deeper queue depths, as can be seen from the results graph. At QDs 1, 2 and 4, the drive sits in last spot on the graphs, but at QD32 it sits in second spot, behind WD's Black SN8100, both drives being a good deal faster than any other drive we've tested to date in this benchmark.
We used CrystalDiskMark 8’s custom settings to test the 4K 70/30 mixed read/write performance of the drive through a range of queue depths using a single thread and four threads.
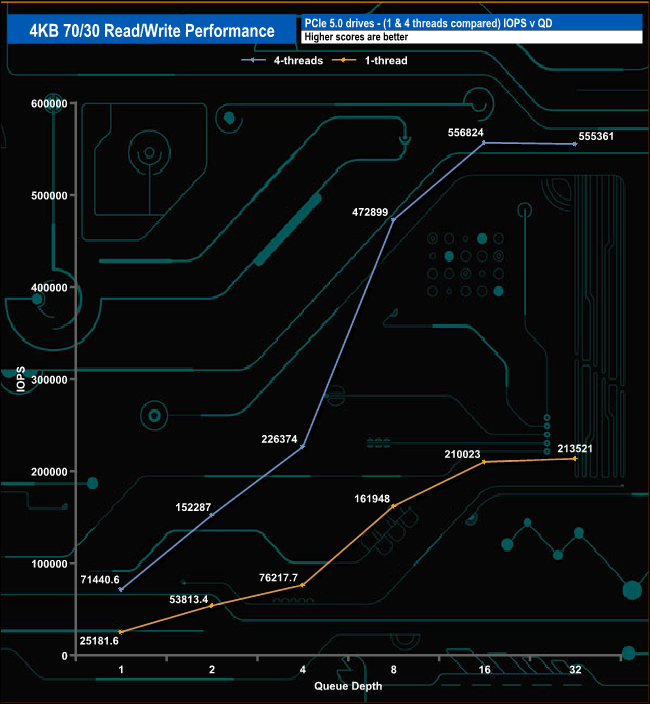
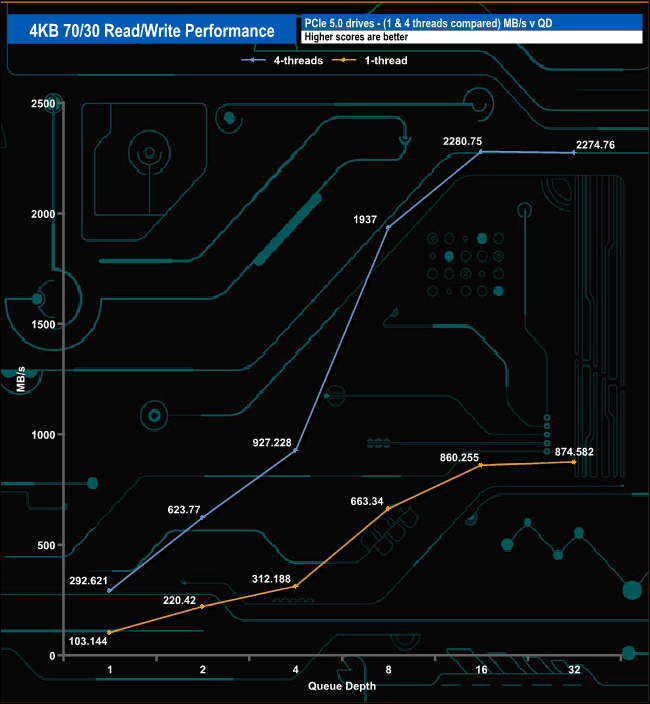
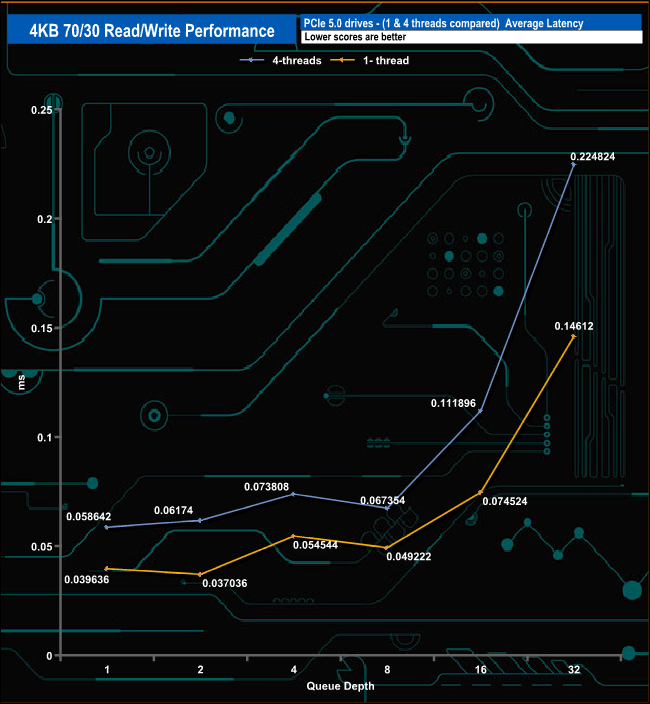
Using a single thread, the NV150HK's performance climbed from 25,181 IOPS (103.144MB/s) at QD1 to 213,521 IOPS (874.582MB/s) at QD32. Using four threads, the performance slowly rose from 71,440 IOPS (292.621MB/s) at QD1 to peak at QD16 at 556,824 IOPS (2,280MB/s) before dropping back to 555,361 IOPS (2,274.76MB/s) at QD32.
We used CrystalDiskMark 8 to test the random performance of the drive at lower queue depths (QD1 – QD8, where most of the everyday workloads occur) using 1 to 4 threads.
Random Read performance
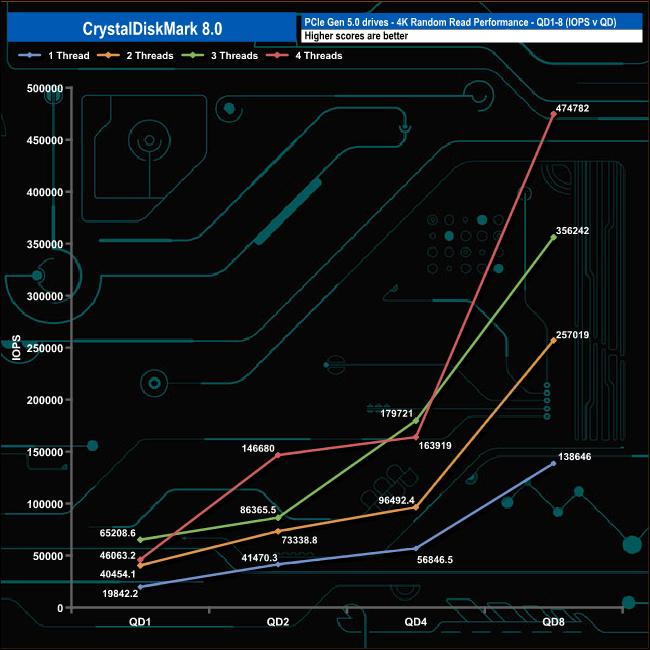
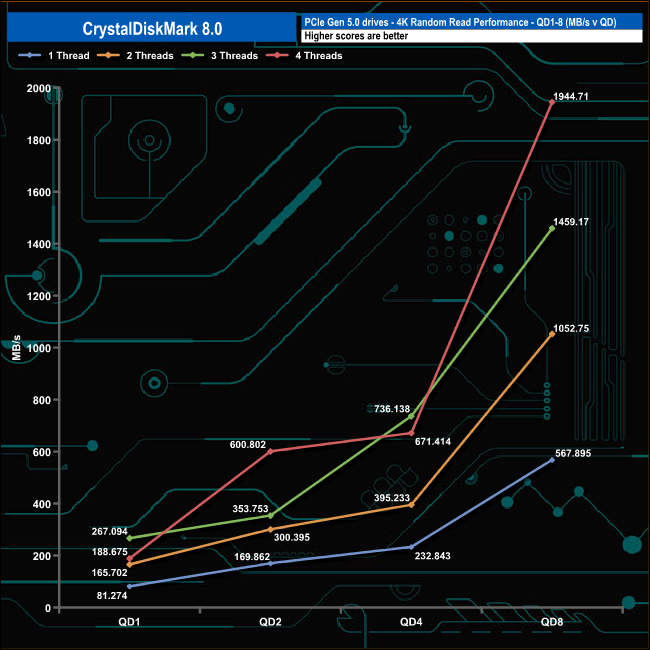
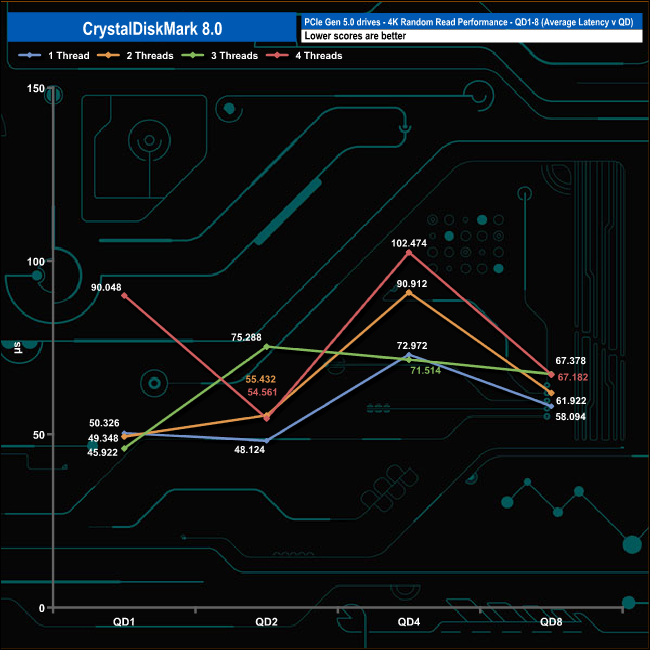
Using a single thread in the random read test, the drive gave a range of results from 19,842 IOPS at QD1 up to 138,646 IOPS at QD8. With two threads, the performance climbed slowly from QD1 to QD4 when the performance accelerated up to QD8, while using three threads, the gentle climb in performance lasted until QD2, then climbed very quickly up to QD8. Using four threads, the performance climbed quickly from QD1 to QD2, then slowed between QD2 and QD4. From there the performance rockets away until the end of the test at QD8.
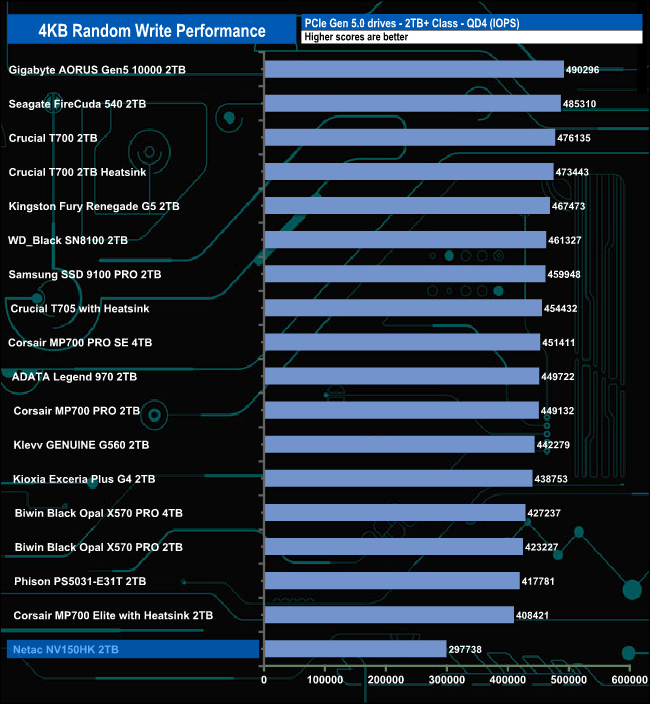
Random Write performance
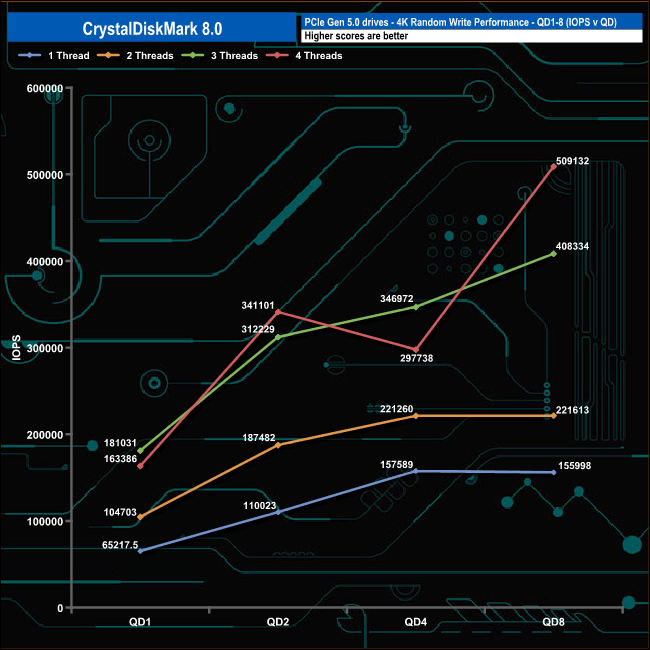
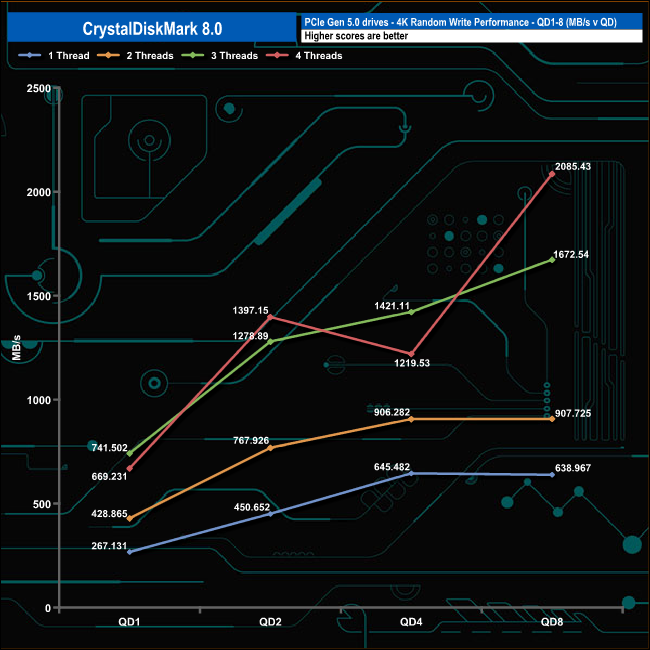
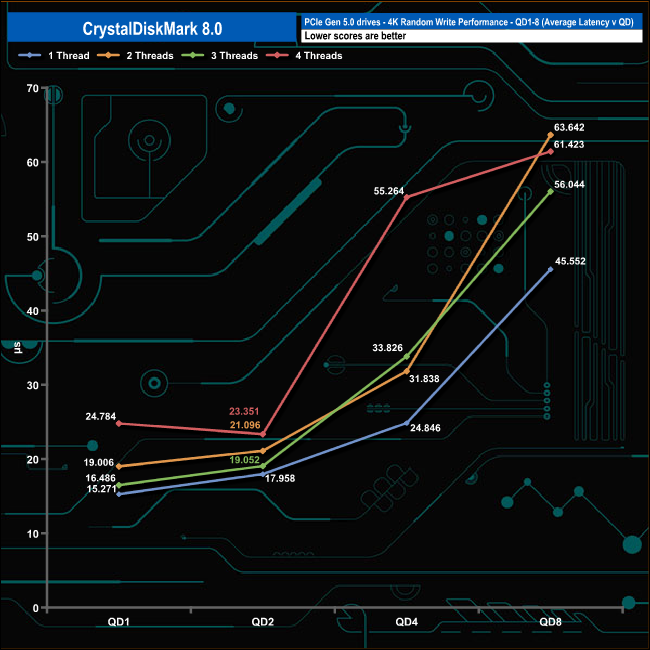
In the 4K write tests, the performance rose quickly from QD1 to QD2 for all four tested threads. Using one and two threads, the performance began to slow at QD4 and then plateaued out. Using three threads, the performance continued to climb until the end of the test. Using four threads, the performance dropped from 341,101 IOPS to 297,738 IOPS at QD2 before accelerating again to finish the test run at QD8 with 509,132 IOPS.
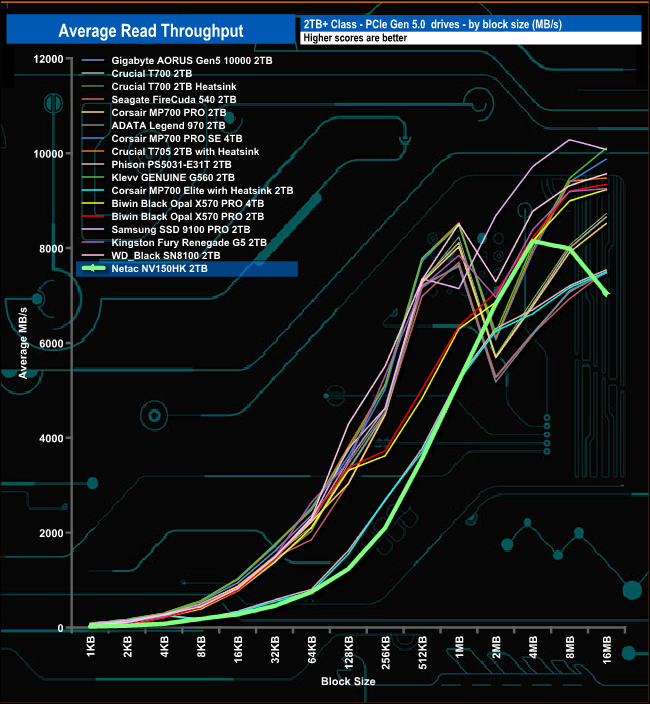
In our read-throughput test, the Netac NV150HK peaked at the 4MB block size at 8,148.52MB/s, a long way short of the official maximum of 14,000MB/s. After peaking, the performance began to drop, finishing the test run at 7,044.92 MB/s.
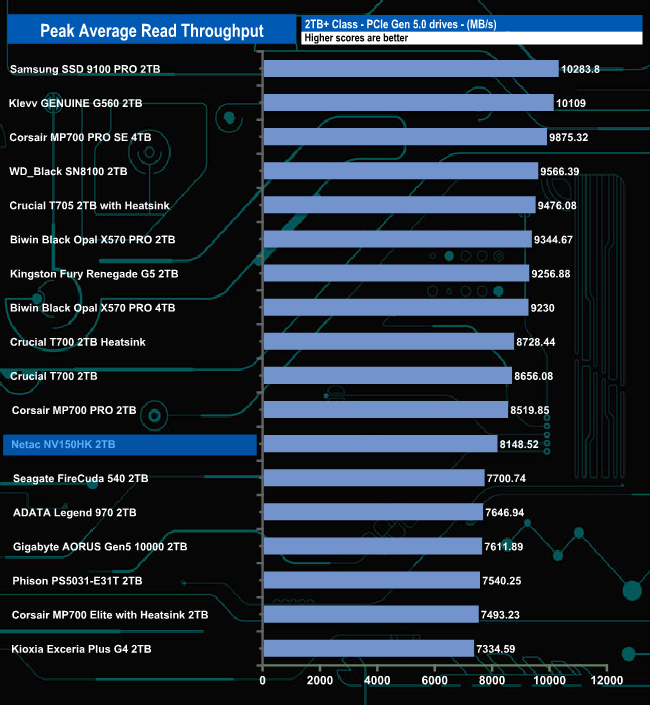
That 8,148.52MB/s test result sees the drive in a mid-table position.
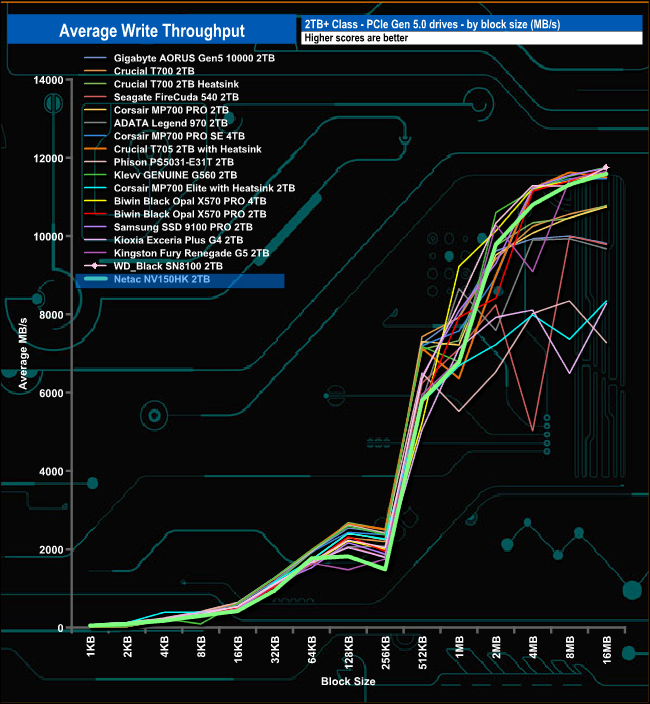
In the write throughput test, the drive peaked at 11,566MB/s at the end of the test run. But once again, it was short of the maximum official figure of 13,000MB/s.
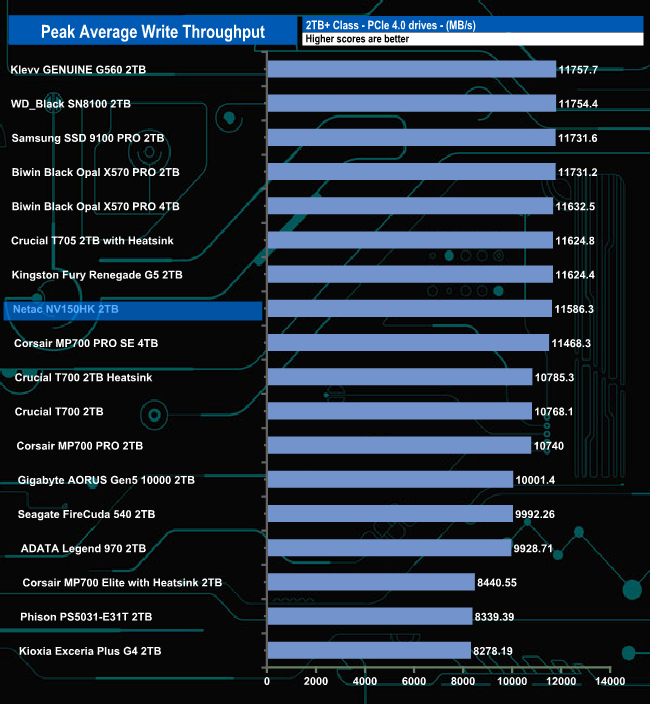
The peak write result we saw of 11,586.3MB/s puts the drive into eighth place on the results chart.
The PCMark 10 Full System Drive Benchmark uses a wide-ranging set of real-world traces from popular applications and common tasks to fully test the performance of the fastest modern drives. The benchmark is designed to measure the performance of fast system drives using the SATA bus at the low end and devices connected via PCI Express at the high end.
The goal of the benchmark is to show meaningful real-world performance differences between fast storage technologies such as SATA, NVMe, and Intel’s Optane. The Full System Drive Benchmark uses 23 traces, running 3 passes with each trace. It typically takes an hour to run.
Traces used:
Booting Windows 10.
Adobe Acrobat – starting the application until usable.
Adobe Illustrator – starting the application until usable Adobe Premiere Pro – starting the application until usable.
Adobe Photoshop – starting the application until usable.
Battlefield V – starting the game until the main menu.
Call of Duty Black Ops 4 – starting the game until the main menu.
Overwatch – starting the game until main menu.
Using Adobe After Effects.
Using Microsoft Excel.
Using Adobe Illustrator.
Using Adobe InDesign.
Using Microsoft PowerPoint.
Using Adobe Photoshop (heavy use).
Using Adobe Photoshop (light use).
cp1 Copying 4 ISO image files, 20 GB in total, from a secondary drive to the target drive (write test).
cp2 Making a copy of the ISO files (read-write test).
cp3 Copying the ISO to a secondary drive (read test).
cps1Copying 339 JPEG files, 2.37 GB in total, to the target drive (write test).
cps2 Making a copy of the JPEG files (read-write test).
cps3 Copying the JPEG files to another drive (read test).
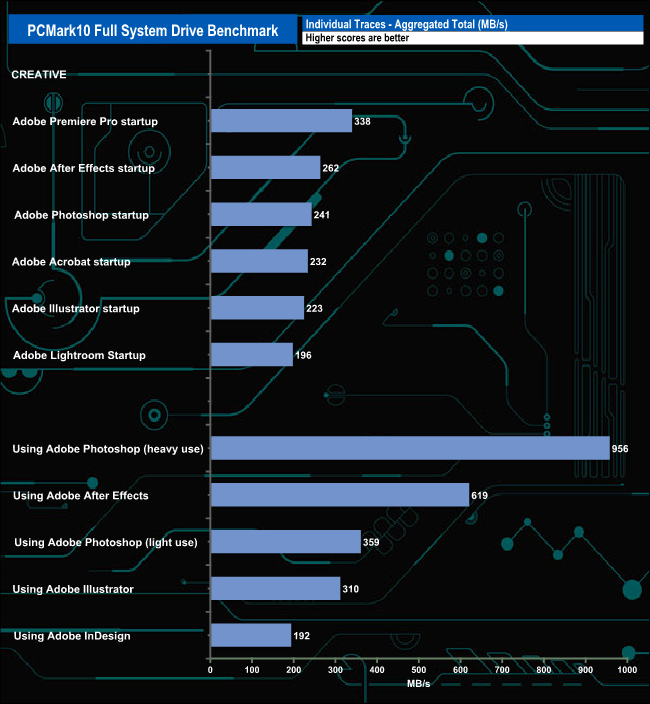
When tested using the Adobe startup traces in PCMark10's Full System Drive benchmark, the drive produced an average of 248MB/s for the six tests. The fastest of these tests was the Premiere Pro trace, at 338MB/s, while the slowest was the Lightroom startup trace, at 196MB/s.
Switching over to the Adobe usage traces, the drive averaged 487MB/s, which includes the 956MB/s result for the Adobe Photoshop heavy usage trace. The slowest of the five traces was the InDesign trace at 192MB/s.
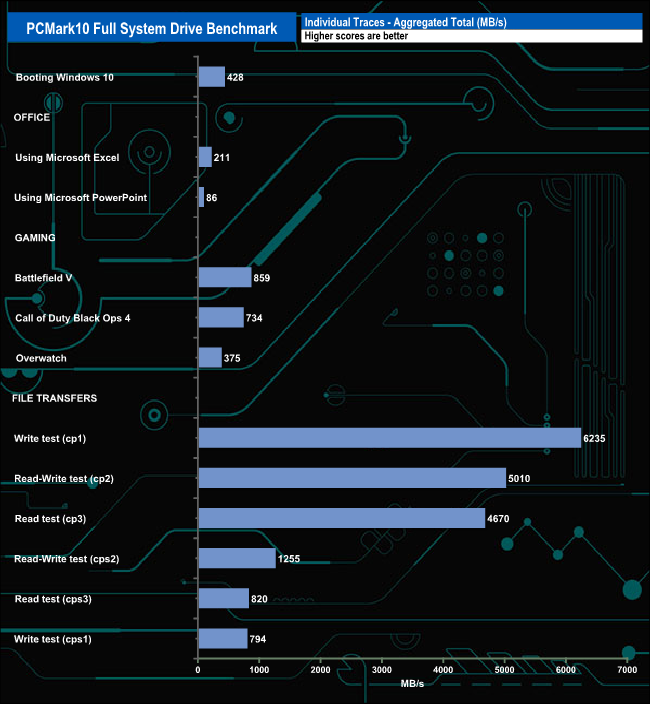
The three gaming traces produced an average result of 656MB/s, the fastest being Battlefield V at 859MB/s, next came Call of Duty Black Ops 4 at 734MB/s and last, Overwatch at 375MB/s. The drive averaged 3,130MB/s for the six file transfer tests, the fastest being 6,235MB/s for the cp1 read test.
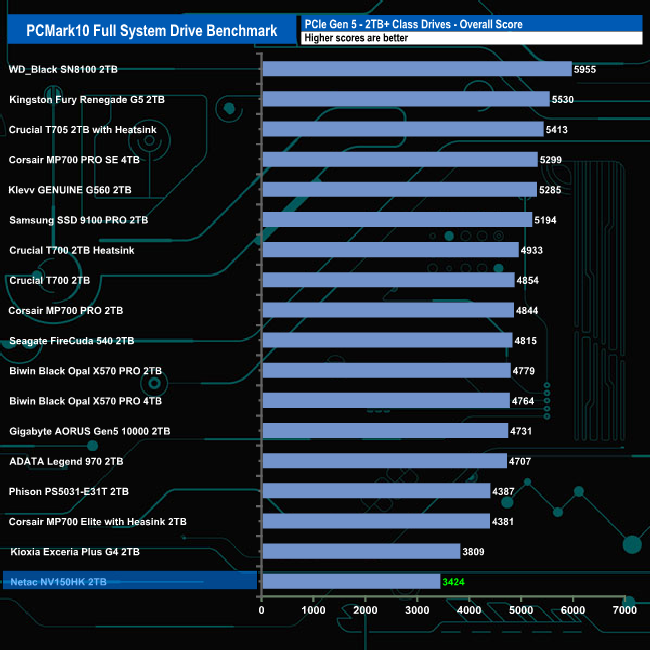
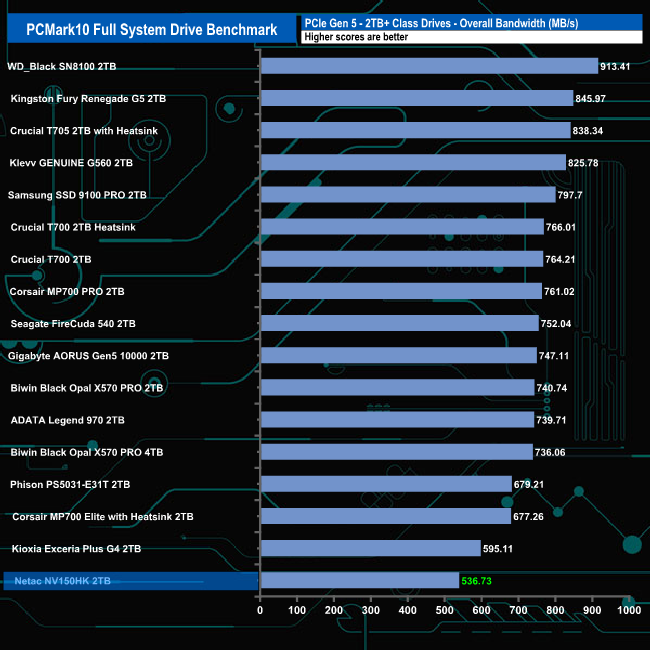
Overall, the Netac NV150HK doesn't seem to handle the PCMark10 benchmark too well; its overall bandwidth figure of 536.73MB/s sees it firmly at the bottom of the results chart.
The 3DMark Storage Benchmark uses traces recorded from popular games and gaming-related activities to measure real-world gaming performance.
Traces used:
Battlefield V
Loading Battlefield™ V from launch to the main menu.
Call of Duty Black Ops 4
Loading Call of Duty®: Black Ops 4 from launch to the main menu.
Overwatch
Loading Overwatch® from launch to the main menu.
Game Move
Copying the Steam folder for Counter-Strike®: Global Offensive from an external SSD to the system drive.
Game Recording
Recording a 1080p gameplay video at 60 FPS with OBS (Open Broadcaster Software) while playing Overwatch®.
Installing Game
Installing The Outer Worlds® from the Epic Games Launcher.
Game Saving
Saving progress in The Outer Worlds game.
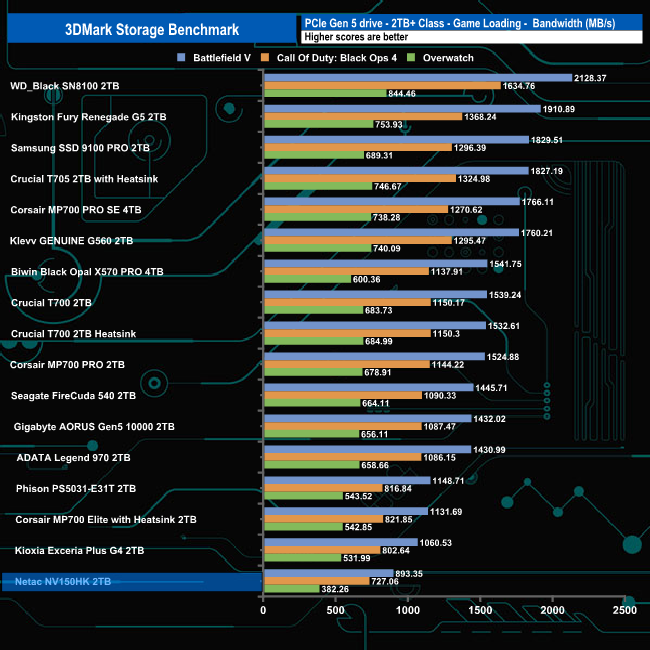
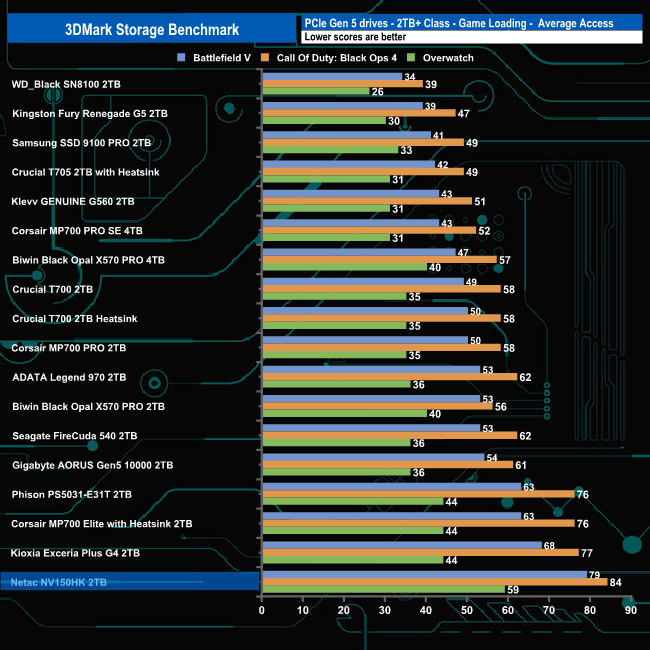
In 3DMark’s Storage Test, the Netac NV150HK had an average game loading bandwidth figure for the three games of 667.55MB/s with an average access time figure of 74µs (0.074ms), the fastest being Battlefield V at 893.35MB/s.
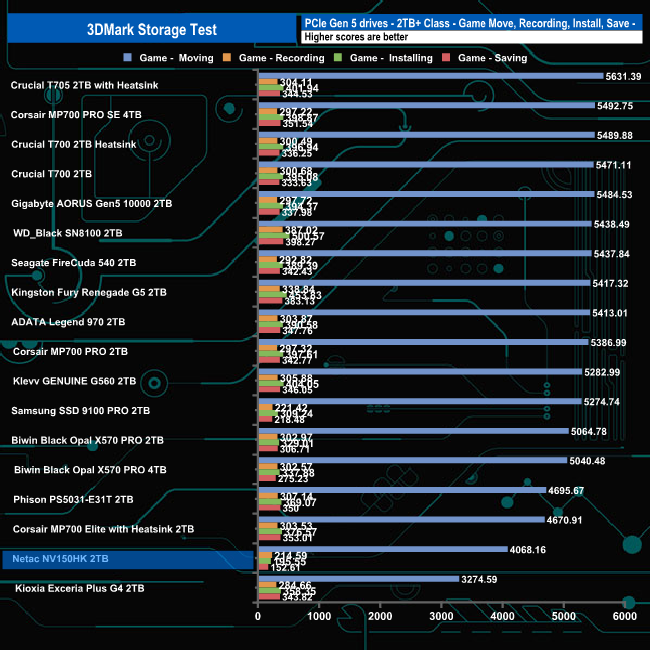
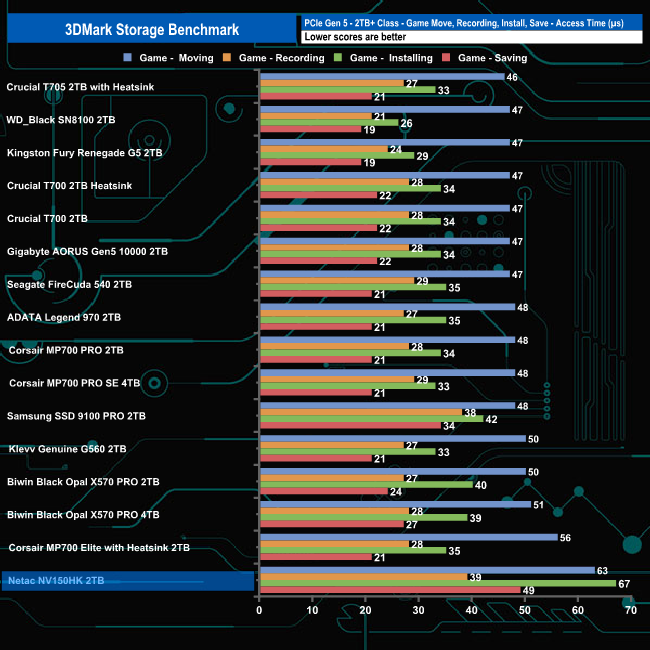
In the game, moving, recording, installing and saving test traces, the drive averaged 1,157.72MB/s at an average access time of 54µs (0.054ms) for the four tests.
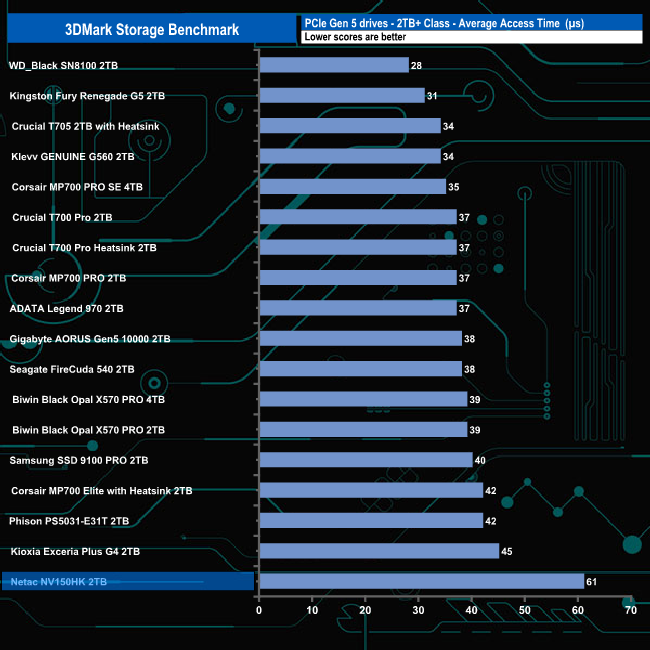
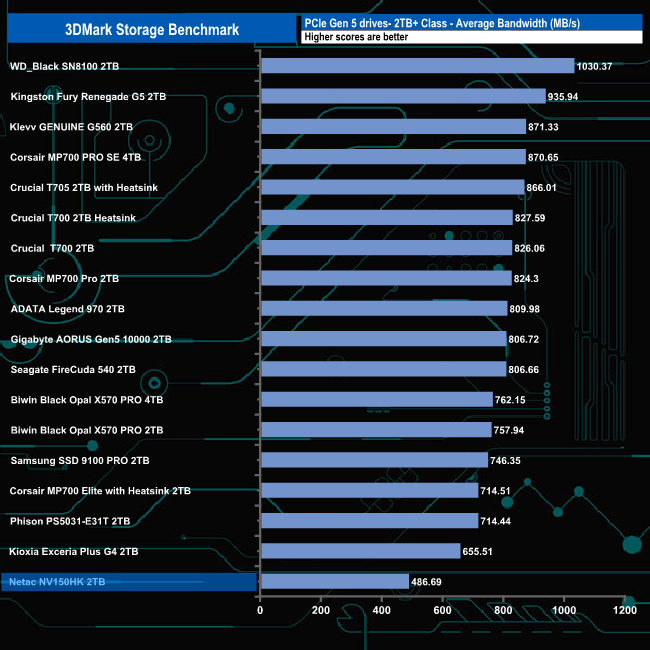
The overall average bandwidth figure for the 2TB Netac NV150HK for the complete benchmark run was 486.69MB/s (61µs total average access time), a result which sees the drive holding up the results chart.
The Final Fantasy XIV Endwalker Official Benchmark uses actual maps and playable characters to assign a score to your PC and rate its performance, including scene loading times.
The benchmark gives an overall load time as well as loading times by scene.
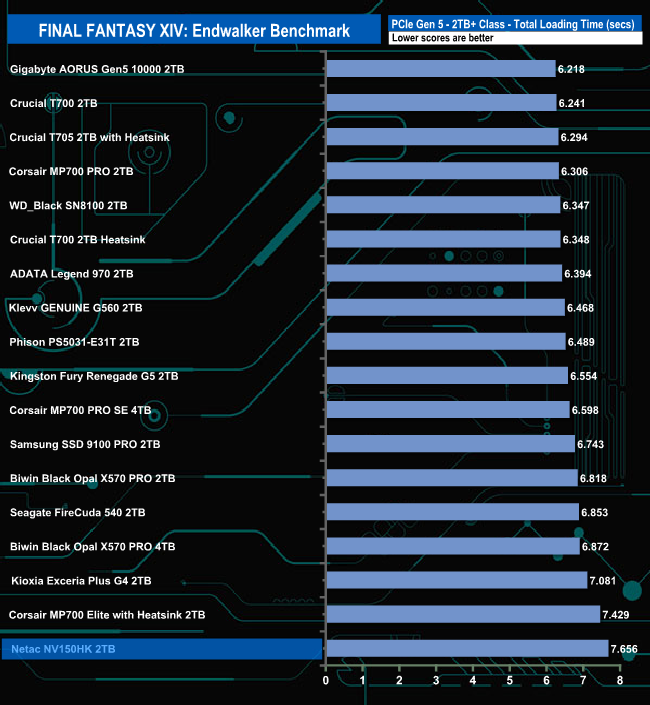
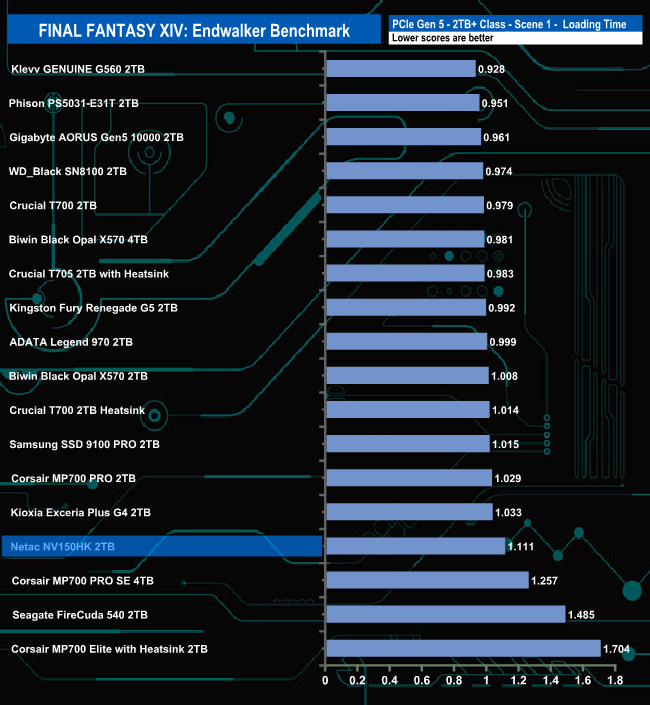
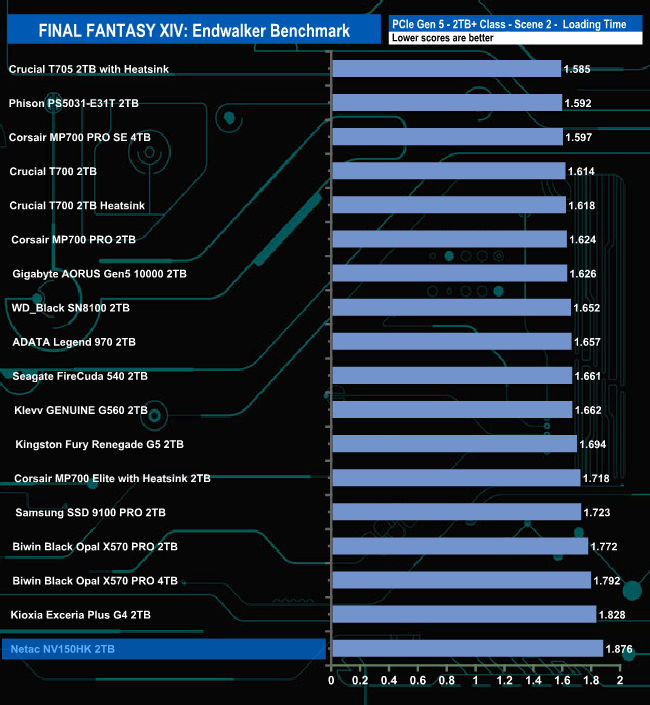
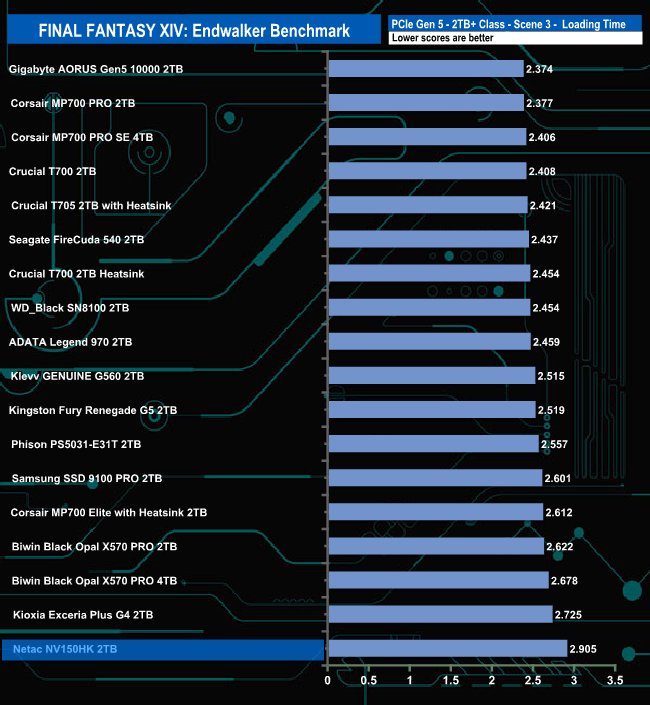
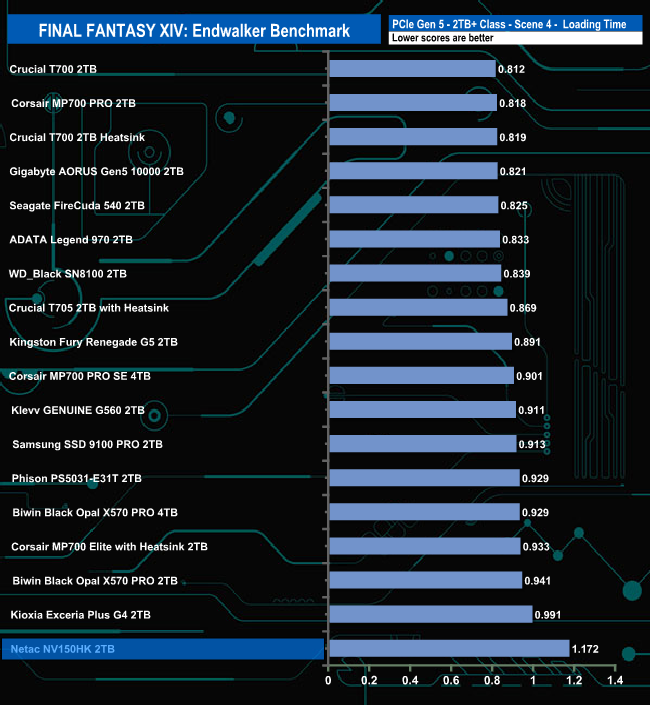
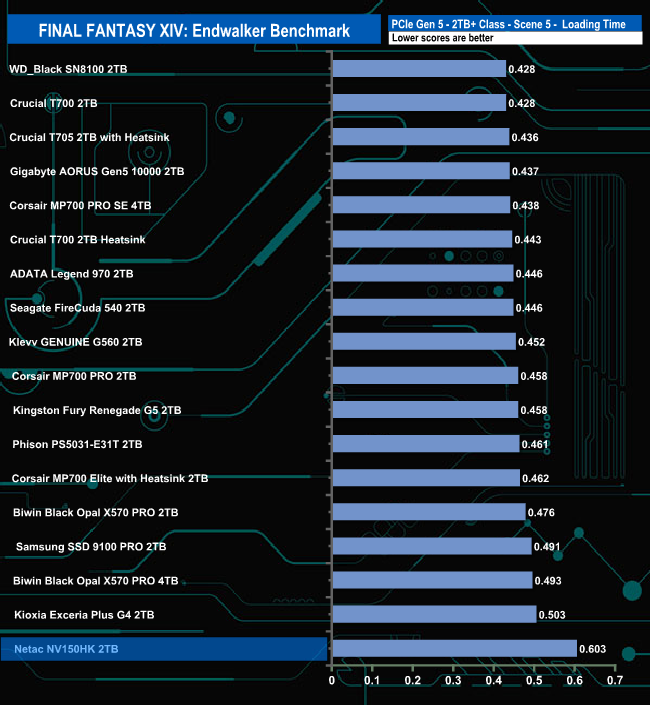
The drive doesn't seem to handle the Final Fantasy XIV Endwalker Official Benchmark very well, sitting in last place in all the result tables bar one, the Scene 1 result table.
We took note of the drive’s temperature during some of our benchmarking runs.
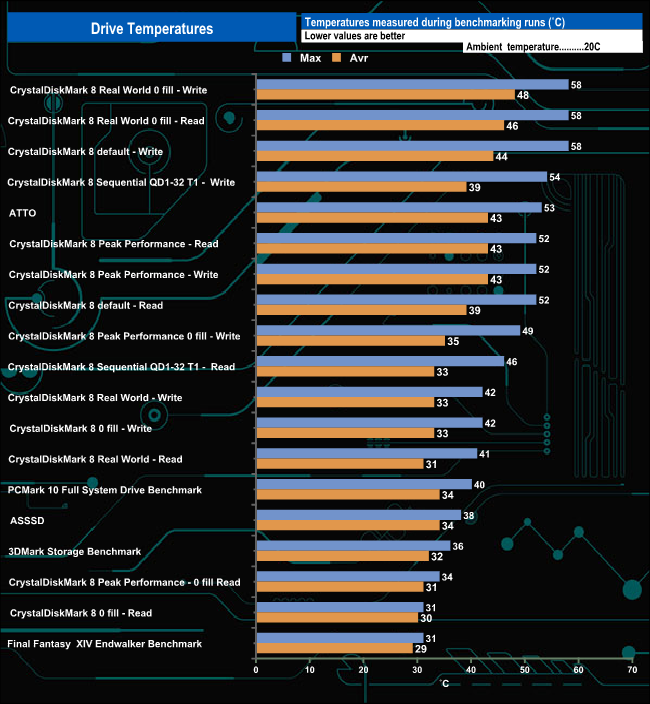
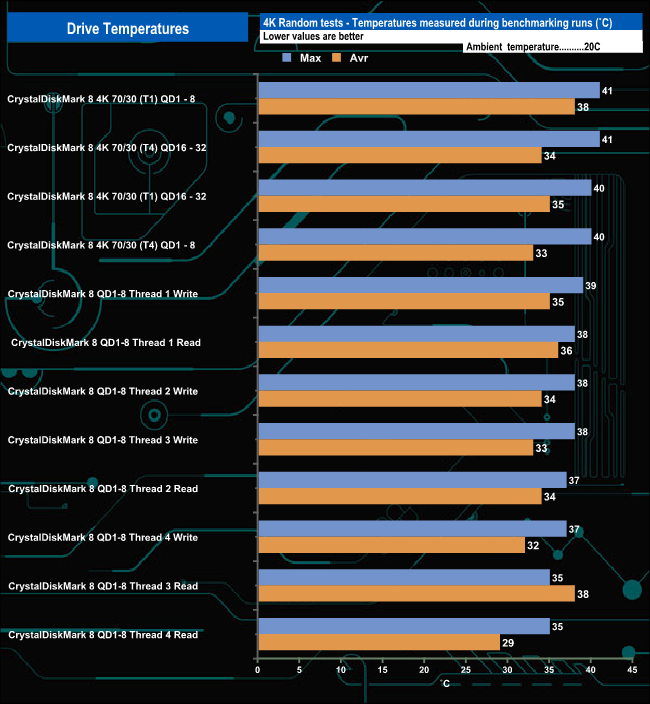
Netac has used a two-piece heatsink for the NV150HK. The heatsink is a finned design that sits in a cradle with the drive sandwiched between two thermal pads. The hottest the drive got was 58° C during runs of CrystalDiskMark 8 using the default write test and the read / write test of the Real World profile. For the bulk of our testing, the drive averaged 45.6° C, with the 4K focused tests averaging 38° C, both of these averages a decent distance from the 70° C maximum operating temperature of the drive.
To test real life performance of a drive we use a mix of folder/file types and by using the FastCopy utility (which gives a time as well as MB/s result) we record the performance of drive reading from & writing to a 2TB Kingston KC3000.
Transfer Details
Data file – 100GB.
File folder – 50GB – 28,523 files.
Movie demos 8K – 21GB – (11 demos).
Raw Movie Clips 4K – 16GB – (9 MP4V files).
Audio Folder – 10GB – 1,483 files – (1479 @ MP3, 4 @ .FLAC files).
Single large image – 5GB – 1.5bn pixel photo.
3D Printer File Folder – 4.25GB – (166 files – 105 @ .STL, 38 @ .FBX, 11 @ .blend, 5 @ .lwo, 4 @ .OBJ, 3@ .3ds).
AutoCAD File Folder – 1.5GB (80 files – 60 @ .DWG and 20 @.DXF).
![]()
![]()
The 2TB Netac NV150HK averaged 3,031MB/s when writing the 8 transfer tests, with the fastest being the 6,093MB/s for the 8K movie folder, with the slowest being the AutoCAD folder transfer at 200MB/s. Reading back the data, the average was 4,184MB/s, with the 100GB data file transfer the fastest at 5,814MB/s and again, the slowest was the 50GB File Folder at 298MB/s.
The NV150HK is Netac's first Gen 5 drive, designed for content creation, demanding desktop and gaming. The drive has official sequential read/write figures of up to 14,000MB/s and 13,000MB/s, respectively. The new drive lineup consists of three capacities at launch: 1TB, 2TB and 4TB.
The Netac NV150HK uses a Silicon Motion SM2508 eight-channel controller combined with Micron 232-Layer 3D TLC NAND. There is also, in the case of the 2TB drive, a 2GB LPDDR4-2133MHz DRAM cache IC.
Officially, the 2TB and 4TB NV150HK models are rated at up to 14,000MB/s for sequential reads and up to 13,000MB/s for writes. The 1TB drive achieves ratings of up to 13,000MB/s for reads and 8,000MB/s for writes. When it comes to 4K random performance, the 2TB and 4TB drives have the same up to 2,000,000 IOPS speed rating for random reads, while the 1TB drive is rated as up to 1,600,000 IOPS. Random writes are quoted as up to 1,800,000 IOPS for all three drives.
When tested with the ATTO v4 benchmark, the read result of 7,480MB/s came nowhere near the official 14,000MB/s, but this is more to do with the benchmark than the drive, as can be seen from the ATTO 5 results below. The write result of 12,060MB/s is close to the official maximum of 13,000MB/s. Using the latest v5 of ATTO, the drive produced a read result of 14,930MB/s, 930MB/s faster than the official maximum, while the write result of 13,490MB/s is a 490MB/s improvement over the official figure. Switching over to the CrystalDiskMark 8 default benchmark, we could confirm the official maximum figures with test results of 14,300MB/s for reads and 13,501MB/s for writes.
When it came to 4K random performance, we couldn't achieve figures anywhere close to the official 2M IOPS (reads) and 1.8M IOPS (writes) using our 4-threaded testing. The best we saw from testing was 588,566 IOPS (QD16) for reads and 549,459 IOPS (QD16) for writes. The best performance figures we saw from the drive came from using the default Peak Performance profile in CrystalDiskMark 8 with reads at 1,979,719 IOPS and writes at 1,789,690 IOPS.
Netac have used a two-piece heatsink (heatsink and cradle) to keep the NV150HK cool. This, together with intelligent thermal control algorithms, helps keep the drive under the official 70° C maximum operating temperature of the drive. The highest temperature we saw was 58° C during runs of CrystalDiskMark 8 using the default write test, along with the read / write test of the Real World profile. For the bulk of our testing, the drive averaged 45.6° C, with the 4K focused tests averaging 38° C.
We don't yet have a confirmed UK price, though Netac have told us the USD list price will be around $200.
Pros
- Overall performance.
- Heatsink design.
Cons
- Couldn't hit the official 4K figures with our testing.
KitGuru says: The NV150HK is Netac's first venture into the Gen 5 drive market. It performs well enough and seems to do better at deeper queue depths. Its heatsink is well designed, has good build quality, and it works well at keeping the drive cool.