The FireCuda 120 range is one of the lastest additions to Seagate's gaming product line-up. These SATA 6Gb/s drives use 96-layer 3D TLC NAND together with a Phison S12 controller. Coming in at £280 for the 2TB model reviewed here, is this SSD worth the asking price? The FireCuda 120 line-up comprises four capacities (at the time of writing); the entry-level 500GB model, 1TB, 2TB (the drive we are looking at here) and the flagship 4TB model. At the heart of the FireCuda 120 is a re-branded Phison S12 8-channel controller which looks after 96-layer BiCS4 3D TLC NAND. Seagate rate the FireCuda 120 Sequential performance as up to 560MB/s read and 540MB/s write across the range while 4K random read/writes are quoted at up to 100,000 IOPS and 90,000 IOPS respectively, again these figures are for all models. Endurance ratings for the FireCuda 120 range are pretty impressive. The 2TB FireCuda 120 is quoted as 2,800TB TBW with the entry-level 500GB drive rated at 700TB, the 1TB model 1,400TB and the 4TB drive 5,600TB. Seagate backs the FireCuda 120 with a 5-year warranty. Physical Specifications: Usable Capacity: 2TB. NAND Components: 96-layer BiCS4 3D TLC. NAND Controller: Phison S12. Interface: Serial ATA (SATA) 6Gb/s (SATA III) Form Factor: 2.5in, 7mm. Dimensions: 100 x 70 x 7mm Drive Weight: 50g. Firmware Version: SU0SC011 Seagate’s FireCuda 120 comes in a striking orange and white box with Seagate’s FireCuda dragon mascot prominently displayed along with a small image of the drive. At the top of the box is a sticker which displays the drive’s capacity and the Sequential read speed of the drive. The rear of the box is covered by multilingual bullet points about the Sequential Read/Write speeds and the drive's endurance. The drive is built on a 2.5in, 7mm format using a metal enclosure that clips together. Inside the components are built on a dual-sided 3/4 length PCB. One side of the PCB houses the controller, branded Seagate STXZA01F5578. Although branded Seagate, it's actually a re-branded Phison PS3112-S12 IC. The 8-channel controller supports 3D MLC/TLC and QLC NAND technologies and features LDPC, SmartECC and end to end data protection. Along with the controller are four 96-layer BiCS4 3D TLC packages (branded DA7BG65AWV) and a DRAM chip for cache duties. The other side of the PCB holds another DRAM chip and four more NAND packages. Seagate’s management software for the FireCuda is the SSD version of their SeaTools software. SeaTools SSD displays the drive’s health and supports firmware upgrading and secure erase. Although SeaTools SSD doesn’t come with any drive cloning utility built-in per se it does provide a link to download Seagate’s DiscWizard cloning software. For testing, the drives are all wiped and reset to factory settings by HDDerase V4. We try to use free or easily available programs and some real-world testing so you can compare our findings against your own system. This is a good way to measure potential upgrade benefits. Main system: Intel Core i7-7700K with 16GB of DDR4-3200 RAM, Sapphire R9 390 Nitro and an Asus Prime Z270-A motherboard. Other drives: Crucial BX100 1TB Crucial BX200 960GB Crucial M550 1TB Crucial MX200 1TB Crucial MX300 2TB Crucial MX300 Limited Edition 750GB Integral SVR-PRO 100 4TB Kingston SSDNow V310 960GB Kingston UV500 960GB Kioxia Exceria 960GB Kioxia TR200 960GB Samsung SSD840 EVO 1TB Samsung SSD850 EVO 1TB Samsung SSD860 EVO 4TB Samsung SSD860 QVO 4TB Samsung SSD860 PRO 4TB Samsung SSD870 QVO 4TB SK hynix SE3010 960GB Ultima Pro X 960GB Software: Atto Disk Benchmark. CrystalMark 3.0.3. AS SSD. IOMeter. Futuremark PC Mark 8 All our results were achieved by running each test five times with every configuration this ensures that any glitches are removed from the results. Trim is confirmed as running by typing fsutil behavior query disabledeletenotify into the command line. A response of disabledeletenotify =0 confirms TRIM is active. CrystalDiskMark is a useful benchmark to measure theoretical performance levels of hard drives and SSD’s. The Seagate FireCuda 120 doesn't seem to handle CrystalDiskMark's deeper queue depth test too well as sits in the bottom third of our results chart. The latest version of CrystalDiskMark, version 7, includes a couple of profiles that can be used for testing – Peak Performance and Real World. The result screens for these two profiles not only display MB/s results but also IOPS and latency. Looking at the Peak Performance results for Sequential read/write performance we could confirm both official Sequential performance figures. The drive is rated up to 560MB/s for reads and up to 540MB/s for writes. Under testing the 2TB FireCuda 120 produced read/write figures of 561MB/s and 542MB/s respectively. Seagate quote 4K random performance for the drive as up to 100,000 IOPS for reads and up to 90,000 IOPS for writes. In the Peak Performance profile, the best read figure produced by the drive was 99,458 IOPS with writes at 90,821 IOPS, confirming the official figures. We also used CrystalDiskMark 7 to test the random performance of the drive at lower queue depths (QD1 – QD8 where most of the everyday workloads occur) using 1 to 4 threads. Using a single thread the drive produced a read figure of 68,802 IOPS (281MB/s) at the QD8 mark. Using 2,3 and 4 threads the drive produced figures of 98,204 IOPS (402MB/s), 99,225 IOPS (406MB/s) and 99,503 IOPS (407MB/s) respectively. In the write tests, the most dramatic leap in performance was with a single thread from QD1 (34,926 IOPS) to QD4 (85,833), after which the performance tailed off slightly. The ATTO Disk Benchmark performance measurement tool is compatible with Microsoft Windows. Measure your storage systems performance with various transfer sizes and test lengths for reads and writes. Several options are available to customize your performance measurement including queue depth, overlapped I/O and even a comparison mode with the option to run continuously. Use ATTO Disk Benchmark to test any manufacturers RAID controllers, storage controllers, host adapters, hard drives and SSD drives and notice that ATTO products will consistently provide the highest level of performance to your storage. Seagate rate the Sequential read/write performance of the FireCuda 120 as up to 560MB/s and 540MB/s respectively. We could confirm those figure under testing with the ATTO benchmark with the drive producing a read figure of 561MB/s with writes at 542MB/s. AS SSD is a great free tool designed just for benching Solid State Drives. It performs an array of sequential read and write tests, as well as random read and write tests with sequential access times over a portion of the drive. AS SSD includes a sub suite of benchmarks with various file pattern algorithms but this is difficult in trying to judge accurate performance figures. The FireCuda 120's read score of 487 in AS-SSD is just enough to put the drive on the top of our results chart. Its write score of 534 is also the fastest SSD write score we have seen, but only just. IOMeter is another open-source synthetic benchmarking tool which is able to simulate the various loads placed on the hard drive and solid-state drive technology. We test with both random read and write 4k tests, as shown above. There are many ways to measure the IOPS performance of a Solid State Drive, so our results will sometimes differ from the manufacturer’s quoted ratings. We do test all drives in exactly the same way, so the results are directly comparable. Officially the FireCuda 120 is rated as up to 100,000 IOPS for 4K random reads and up to 90.000 IOPS for writes. Using our own 4K tests we couldn't quite hit those official maximums with a read figure of 93,310 IOPS and 83,236 IOPS for writes. 
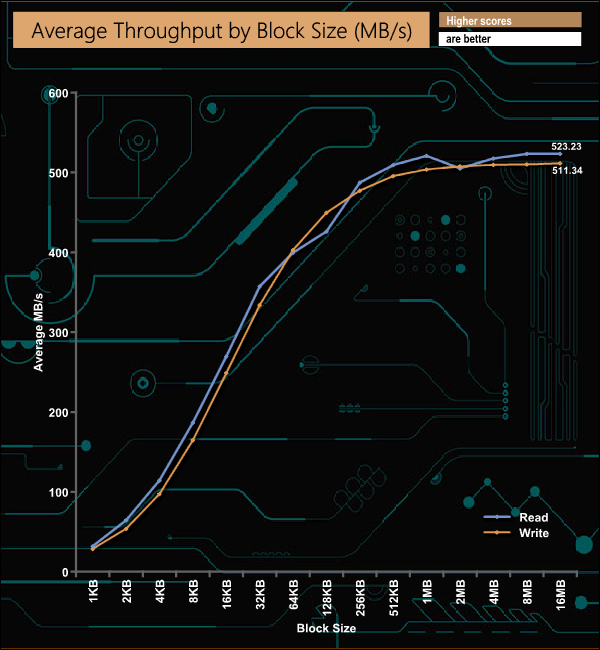
In our throughput tests the drive peaked at 523.25MB/s for reads and 511.34MB/s for writes, both figures a little shy of the official 560MB/s read and 540MB/s write maximums of the drive. For the long term performance stability test, we set the drive up to run a 20-minute 4K random test with a 30% write, 70% read split, at a Queue Depth of 256 over the entire disk. The 2TB Seagate FireCuda 120 averaged 84,476 IOPS for the test with an excellent performance stability result of 95%. The PCMark 10 Full System Drive Benchmark uses a wide-ranging set of real-world traces from popular applications and common tasks to fully test the performance of the fastest modern drives. The benchmark is designed to measure the performance of fast system drives using the SATA bus at the low end and devices connected via PCI Express at the high end. The goal of the benchmark is to show meaningful real-world performance differences between fast storage technologies such as SATA, NVMe, and Intel’s Optane. The Full System Drive Benchmark uses 23 traces, running 3 passes with each trace. It typically takes an hour to run. Traces used: Booting Windows 10. Adobe Acrobat – starting the application until usable. Adobe Illustrator – starting the application until usable Adobe Premiere Pro – starting the application until usable. Adobe Photoshop – starting the application until usable. Battlefield V – starting the game until the main menu. Call of Duty Black Ops 4 – starting the game until the main menu. Overwatch – starting the game until main menu. Using Adobe After Effects. Using Microsoft Excel. Using Adobe Illustrator. Using Adobe InDesign. Using Microsoft PowerPoint. Using Adobe Photoshop (heavy use). Using Adobe Photoshop (light use). cp1 Copying 4 ISO image files, 20 GB in total, from a secondary drive to the target drive (write test). cp2 Making a copy of the ISO files (read-write test). cp3 Copying the ISO to a secondary drive (read test). cps1Copying 339 JPEG files, 2.37 GB in total, to the target drive (write test). cps2 Making a copy of the JPEG files (read-write test). cps3 Copying the JPEG files to another drive (read test). The best performance in the creative group of tests was the 299MB/s from the Adobe Photoshop heavy use test trace, while the FireCuda 120 also showed pretty good performance in the Battlefield V (349MB/s) game test, as well as the cp1 write (494MB/s) the cp3 read (489MB/s) file transfer tests. To test the real-life performance of a drive we use a mix of folder/file types and by using the FastCopy utility (which gives a time as well as MB/s result) we record the performance of drive reading from & writing to a 256GB Samsung SSD850 PRO. We use the following folder/file types: 100GB data file. 60GB iso image. 60GB Steam folder – 29,521 files. 50GB File folder – 28,523 files. 12GB Movie folder – (15 files - 8 @ .MKV, 4 @ .MOV, 3 @ MP4). 10GB Photo folder – (304 files - 171 @ .RAW, 105 @ JPG, 21 @ .CR2, 5 @ .DNG). 10GB Audio folder – (1,483 files - 1479 @ MP3, 4 @ .FLAC files). 5GB (1.5bn pixel) photo. BluRay Movie - 42GB. 21GB 8K Movie demos - (11 demos) 16GB 4K Raw Movie Clips - (9 MP4V files). 4.25GB 3D Printer File Folder - (166 files - 105 @ .STL, 38 @ .FBX, 11 @ .blend, 5 @ .lwo, 4 @ .OBJ, 3@ .3ds). 1.5GB AutoCAD File Folder (80 files - 60 @ .DWG and 20 @.DXF). The Seagate FireCuda 120 handled our life file transfer tests without any real problems, with a couple of the transfers just creeping above the 500MB/s mark and with a few more just under. As is usually the case, the small files in the 60GB Steam, 50GB file and 10GB audio folders caused the performance to drop quite considerably. Seagate's FireCuda gaming range of SSDs comprises a pair of M.2 drives, the FireCuda 510 (reviewed here), the PCIe Gen 4 FireCuda 520 (reviewed here) and the latest addition to the range, the SATA 6Gb/s FireCuda 120. Four capacities make up the FireCuda 120 range; 500GB, 1TB, 2TB (the drive Seagate kindly supplied for review) and the flagship 4TB model. The FireCuda 120 uses a combination of a re-branded 8-channel Phison PS3112-S12 controller and 96-layer BiCS4 3D TLC NAND. Seagate rates the FireCuda 120 Sequential performance for all four drives as up to 560MB/s read and 540MB/s write while 4K random read/writes as quoted as up to 100,000 IOPS and 90,000 IOPS respectively, again these figures are for all models. We could confirm those Sequential performance figures using the ATTO benchmark, with the review drive producing reads of 561MB/s and writes at 542MB/s. Using our standard 4K test we couldn't quite hit the official maximum ratings of 100,000 IOPS for reads and 90.000 IOPS for writes, the drive producing test result figures of 93,310 IOPS for reads and 83,236 IOPS for writes. We got closer with version 7 of the CrystalDiskBenchmark with 99,458 IOPS for reads and 90,821 IOPS for writes. Perhaps the most impressive thing about the FireCuda 120 range is the endurance Seagate has given it. The 2TB FireCuda 120 is rated at 2,800TB TBW which is 400TB more than Samsung quotes for the 2TB version of the mighty 860 PRO. We found the 2TB Seagate FireCuda for £279.95 (inc VAT) on Overclockers UK HERE. Pros Overall performance. Endurance. Cons Pricey. KitGuru says: Seagate's FireCuda 120 offers an enticing combination of good overall performance and class leasing endurance with the added bonus of a five-year warranty.