


Solidigm's P41 Plus is a QLC-based SSD aimed squarely at the value end of the market. Featuring a DRAM-less design, it uses 144-layer NAND and a 4-channel controller. With the 1TB version coming it at just £70, is this drive worth picking up?
The P41 Plus comes in three capacities; entry-level 512GB, 1TB (the drive we are reviewing here) and a flagship 2TB model. The P41 Plus uses a combination of a Silicon Motion SM2269XT controller (4-channel PCIe Gen 4 x4) and Solidigm 144-layer 3D QLC NAND. It's a DRAMless design using Host Memory Buffer technology instead.
Solidigm rates the Sequential read/write performance of the 1TB P41 Plus as up to 4,125MB/s and 2,950MB/s respectively. The 512GB model is rated at up to 3,500MB/s for reads & 1,625MB/s for writes while the 2TB drive gets the same read rating as the 1TB model but with a faster write speed of up to 3,325MB/s.
As for 4K random performance, the 1TB P41 Plus is rated as up to 225,000 IOPS for reads and 520,000 IOPS for writes. The 2TB drive gets up to 390.000 IOPS and up to 540,000 IOPS for reads and writes respectively. The 512GB drive makes do with 115,000 IOPS reads and 390,000 IOPS writes.
The endurance of the 1TB drive is rated at 400TBW and the drive is backed by a 5-year warranty.
Physical Specifications:
- Usable Capacities: 1TB
- NAND Components: Solidigm 144-layer 3D QLC.
- NAND Controller: Silicon Motion SM2269XT.
- Cache: None/HMB.
- Interface: PCIe 4.0 x4, NVMe 1.4.
- Form Factor: M.2-2280.
- Dimensions: 80 x 20 x 2.2mm.
Firmware Version: 001C.
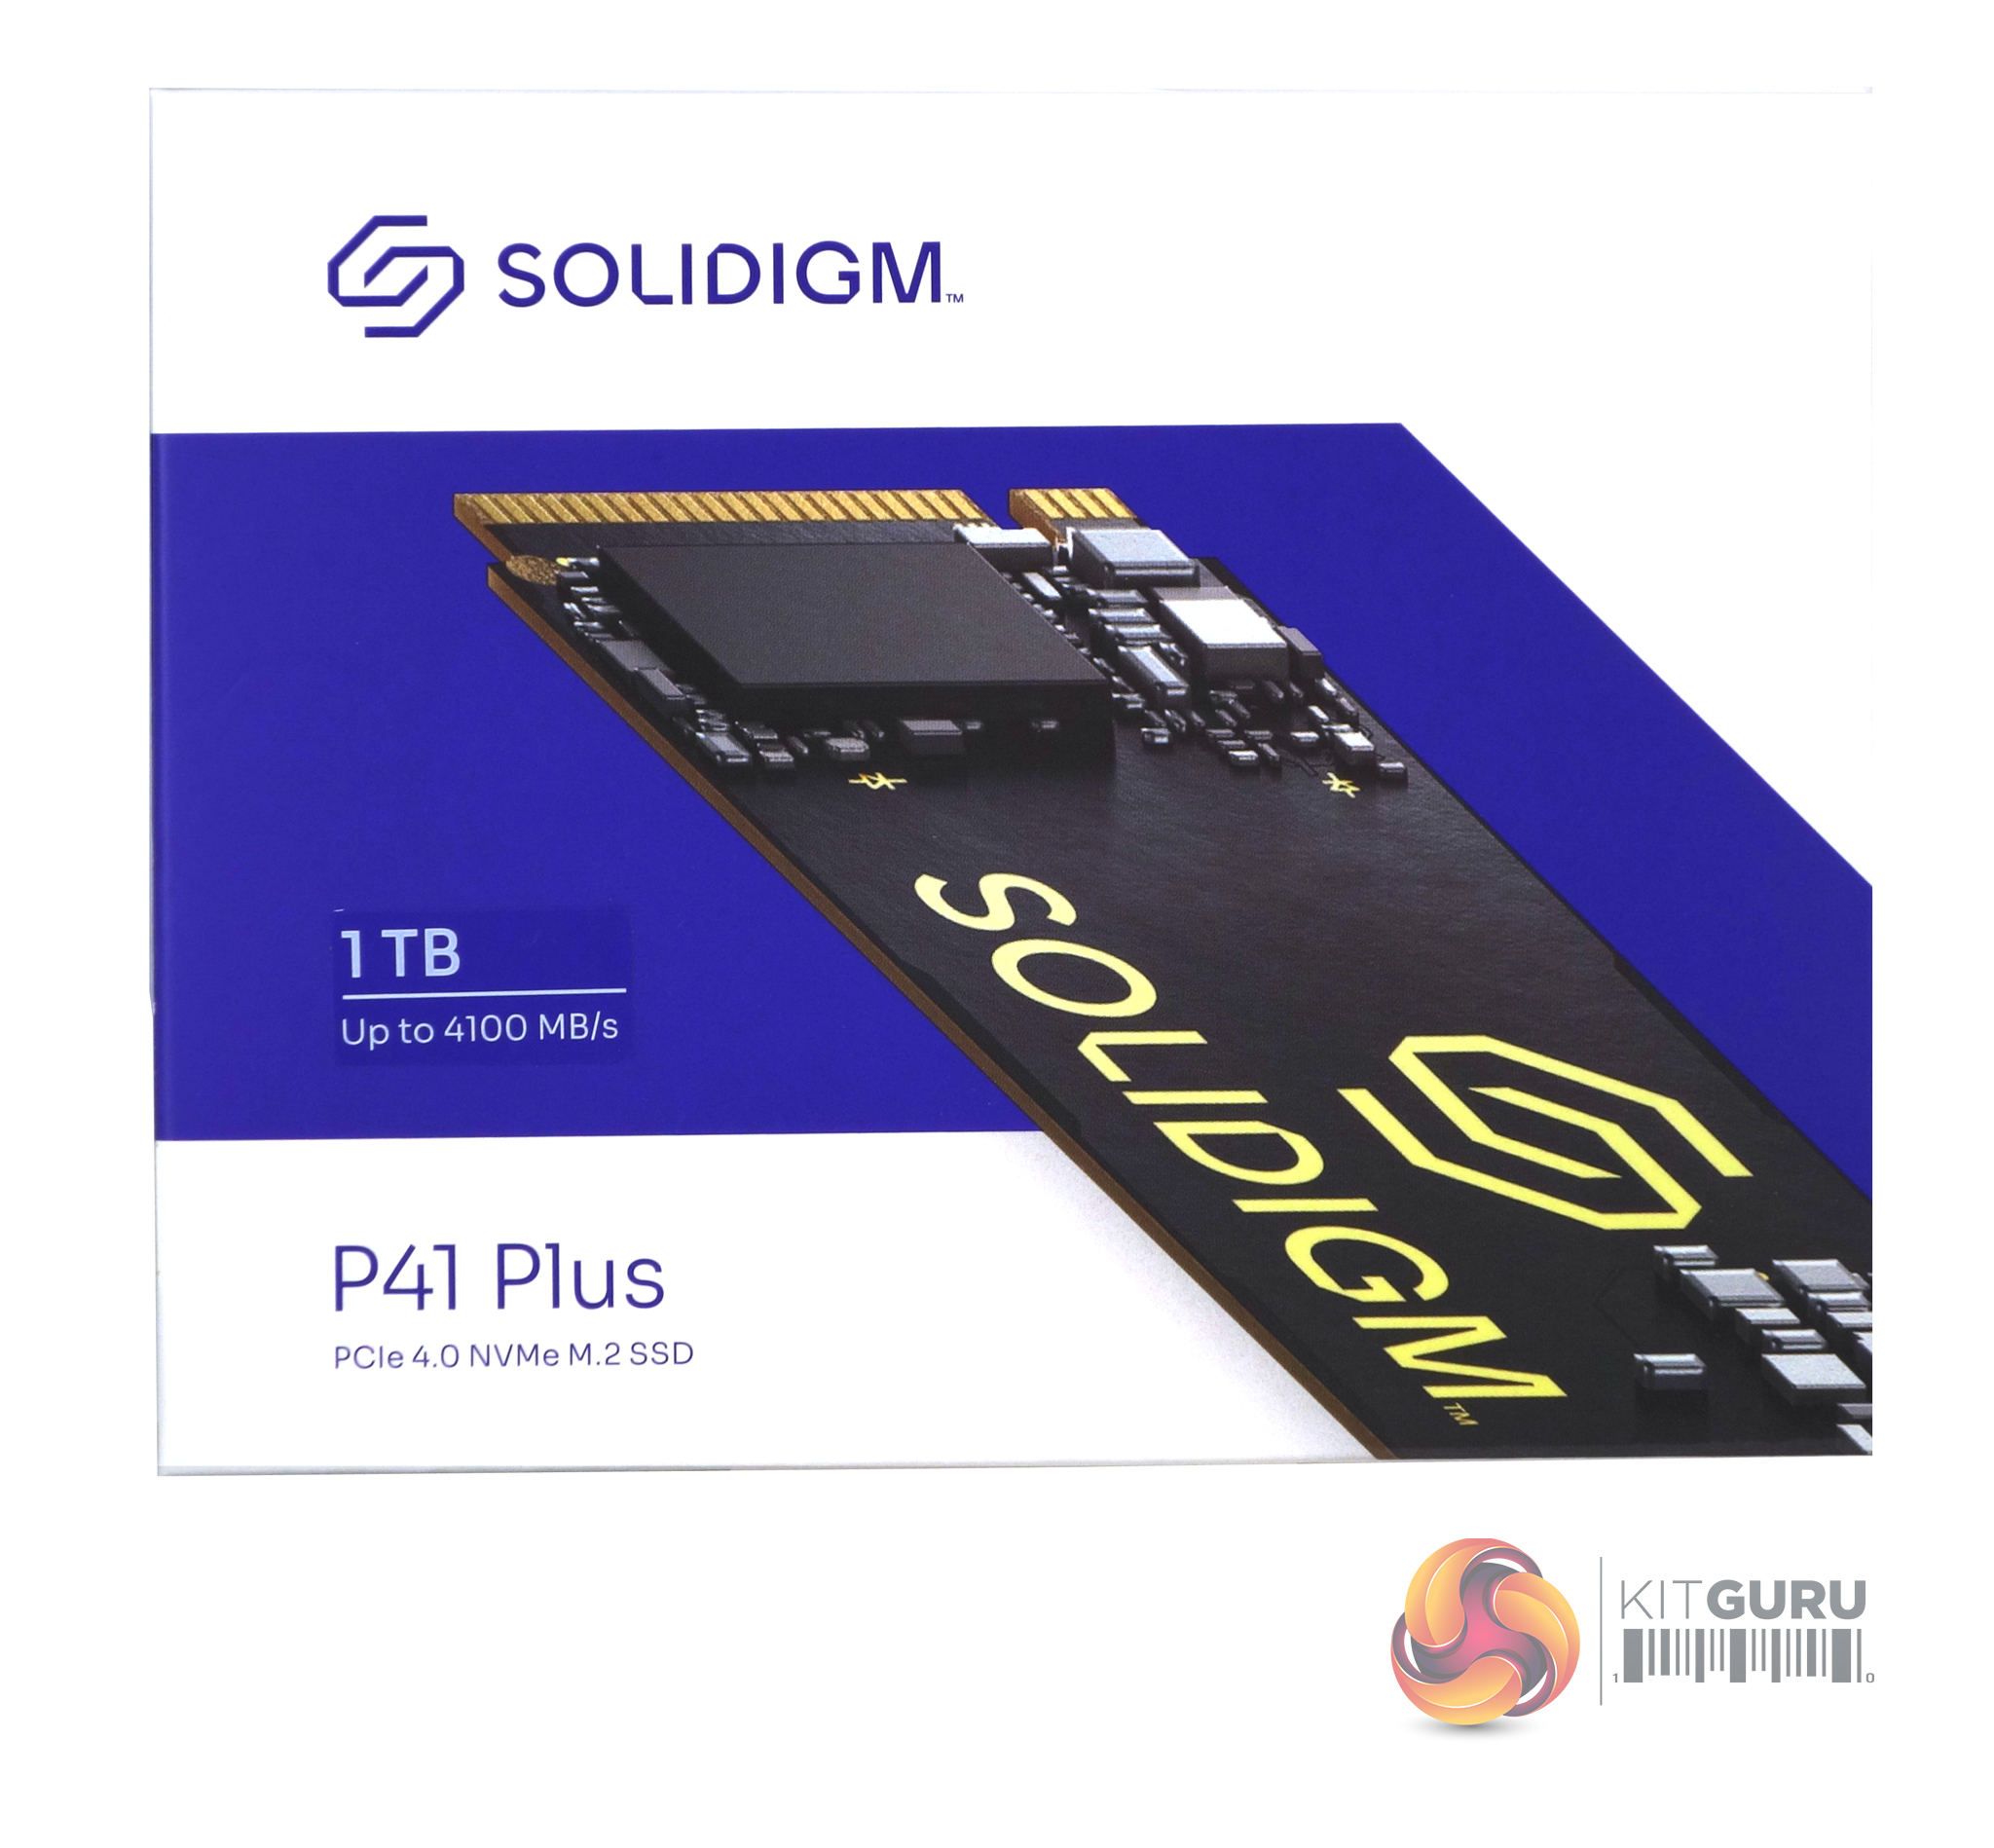
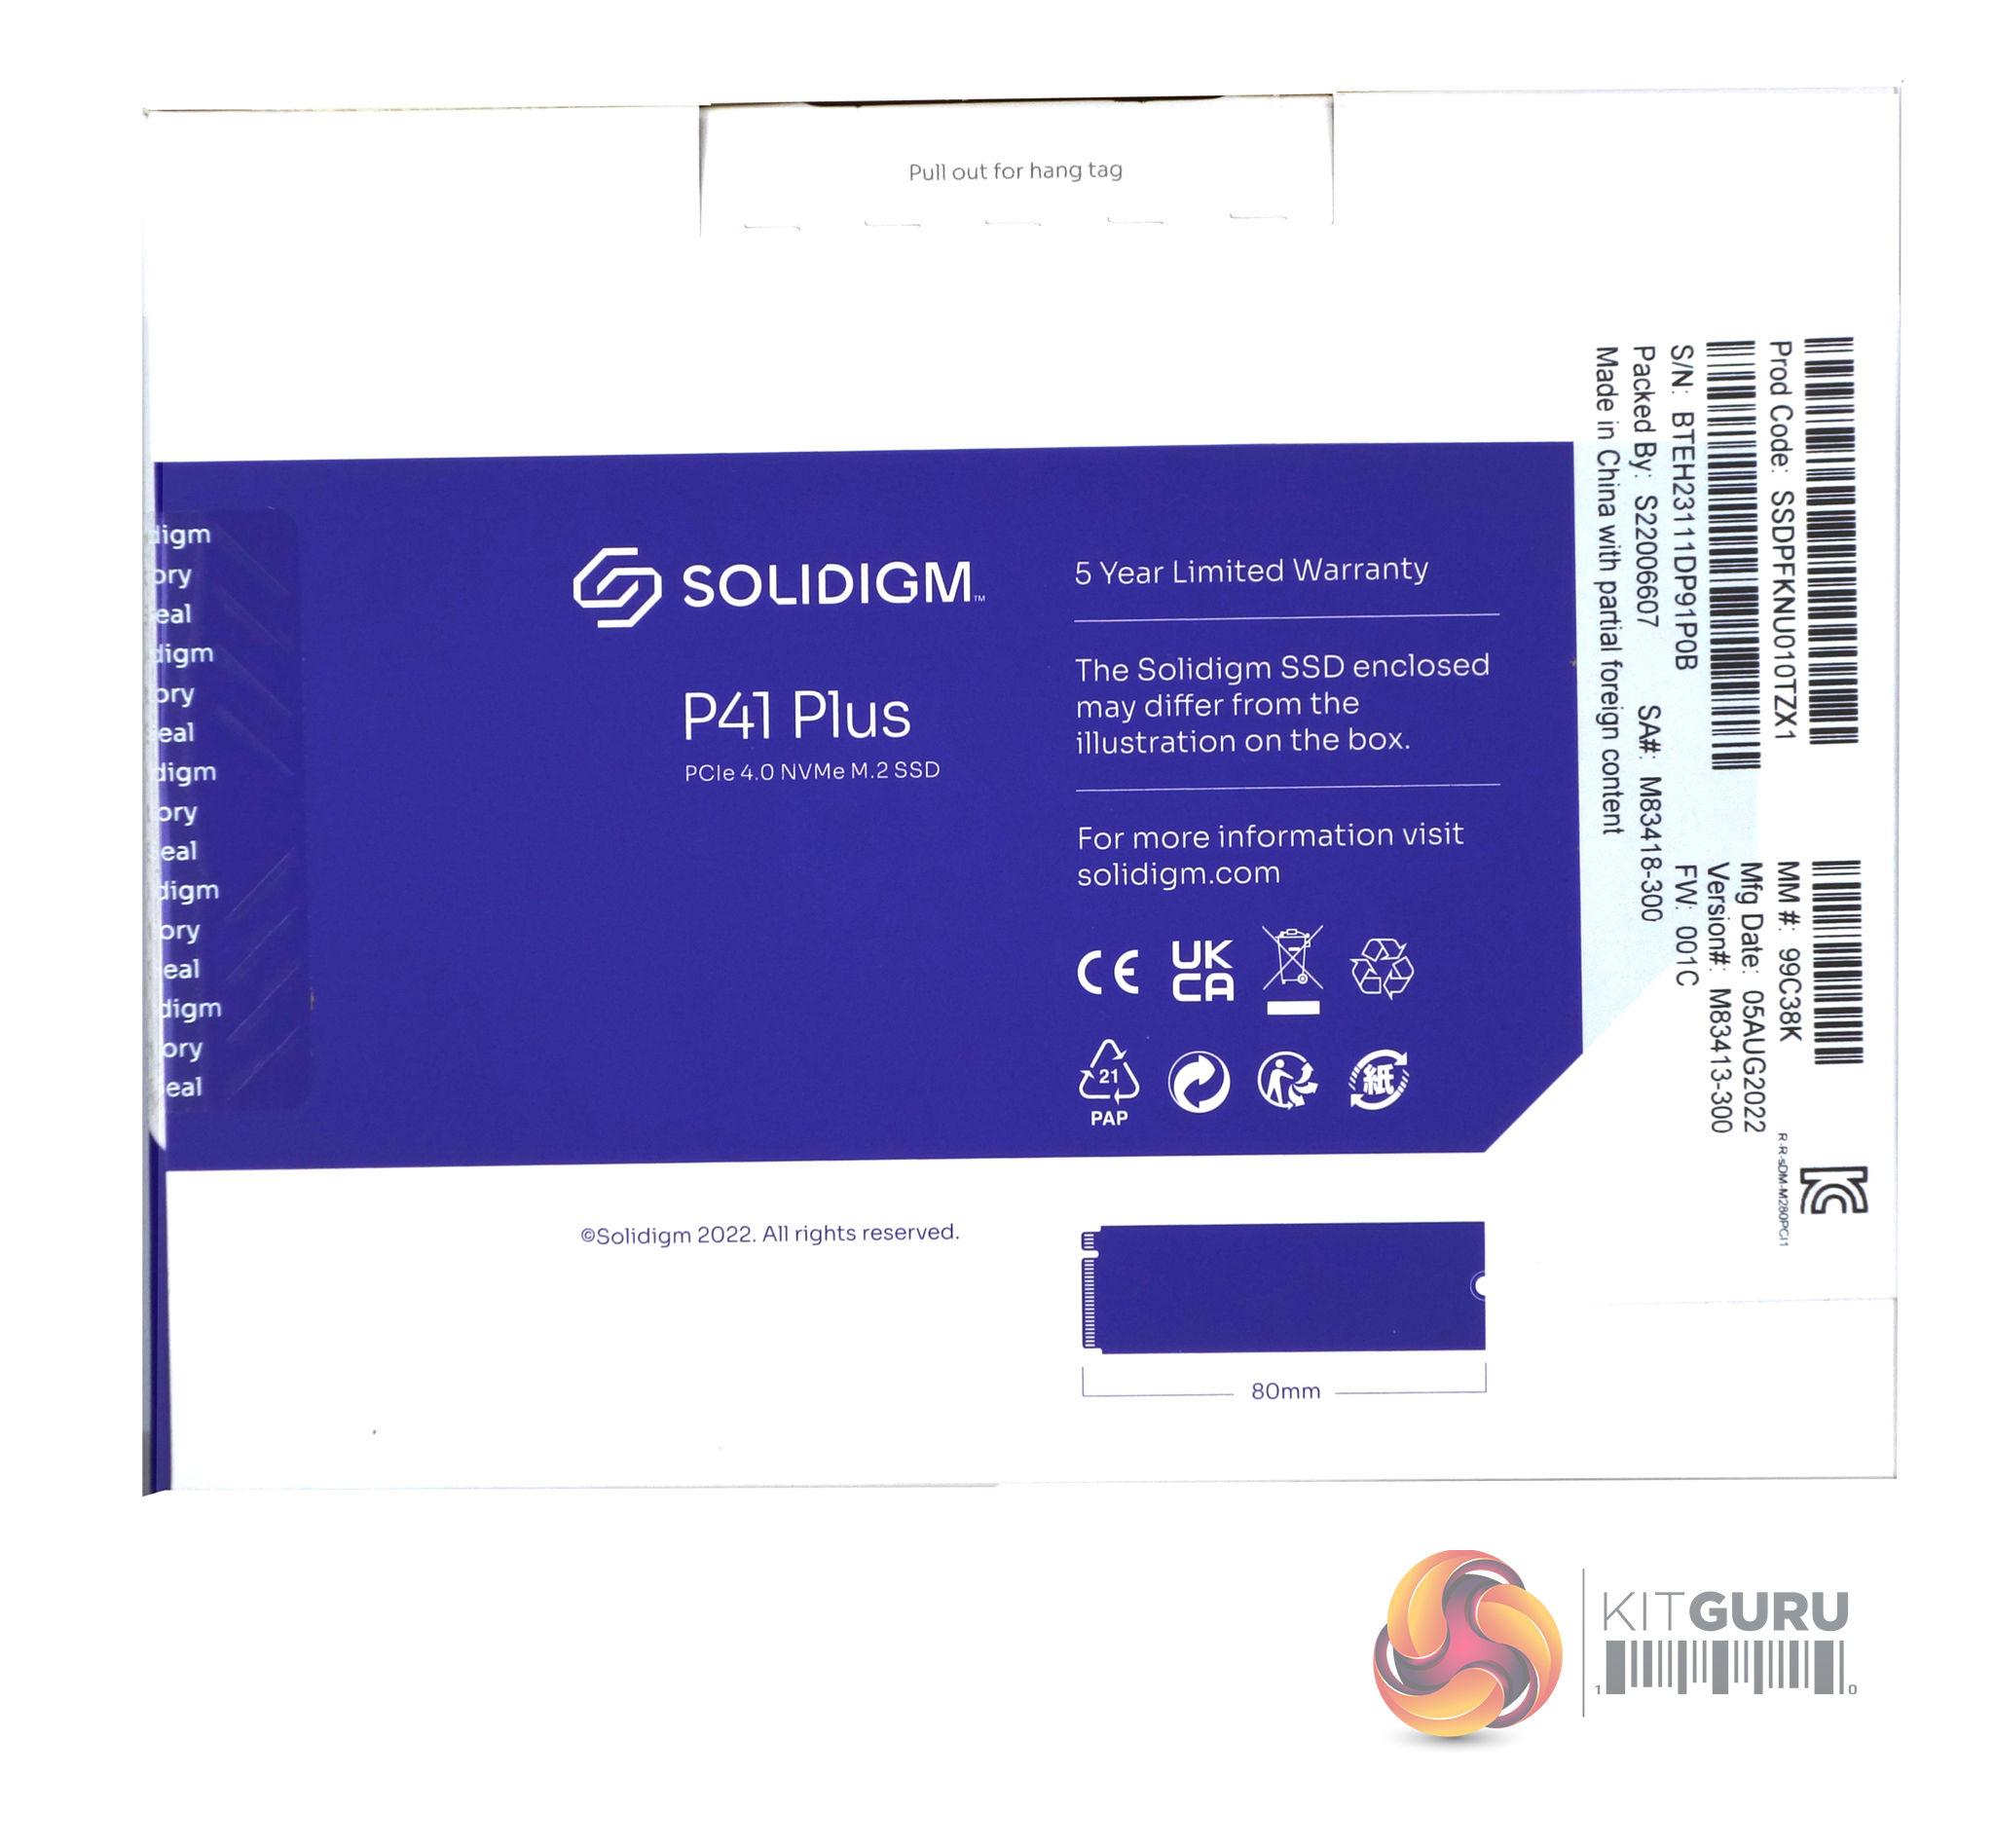
The Solidigm P41 Plus comes in a small but sturdy box with a close-up image of the drive on the front. To the left of the image is a sticker carrying the drive's size and its Sequential read speed rating (4,100MB/s). Under the product name is a line stating that the drive uses a PCIe 4.0 interface. This is repeated on the back of the box, along with a statement that the drive has a 5-year warranty. Towards the bottom edge of the box, there is a diagram showing the drive's length.
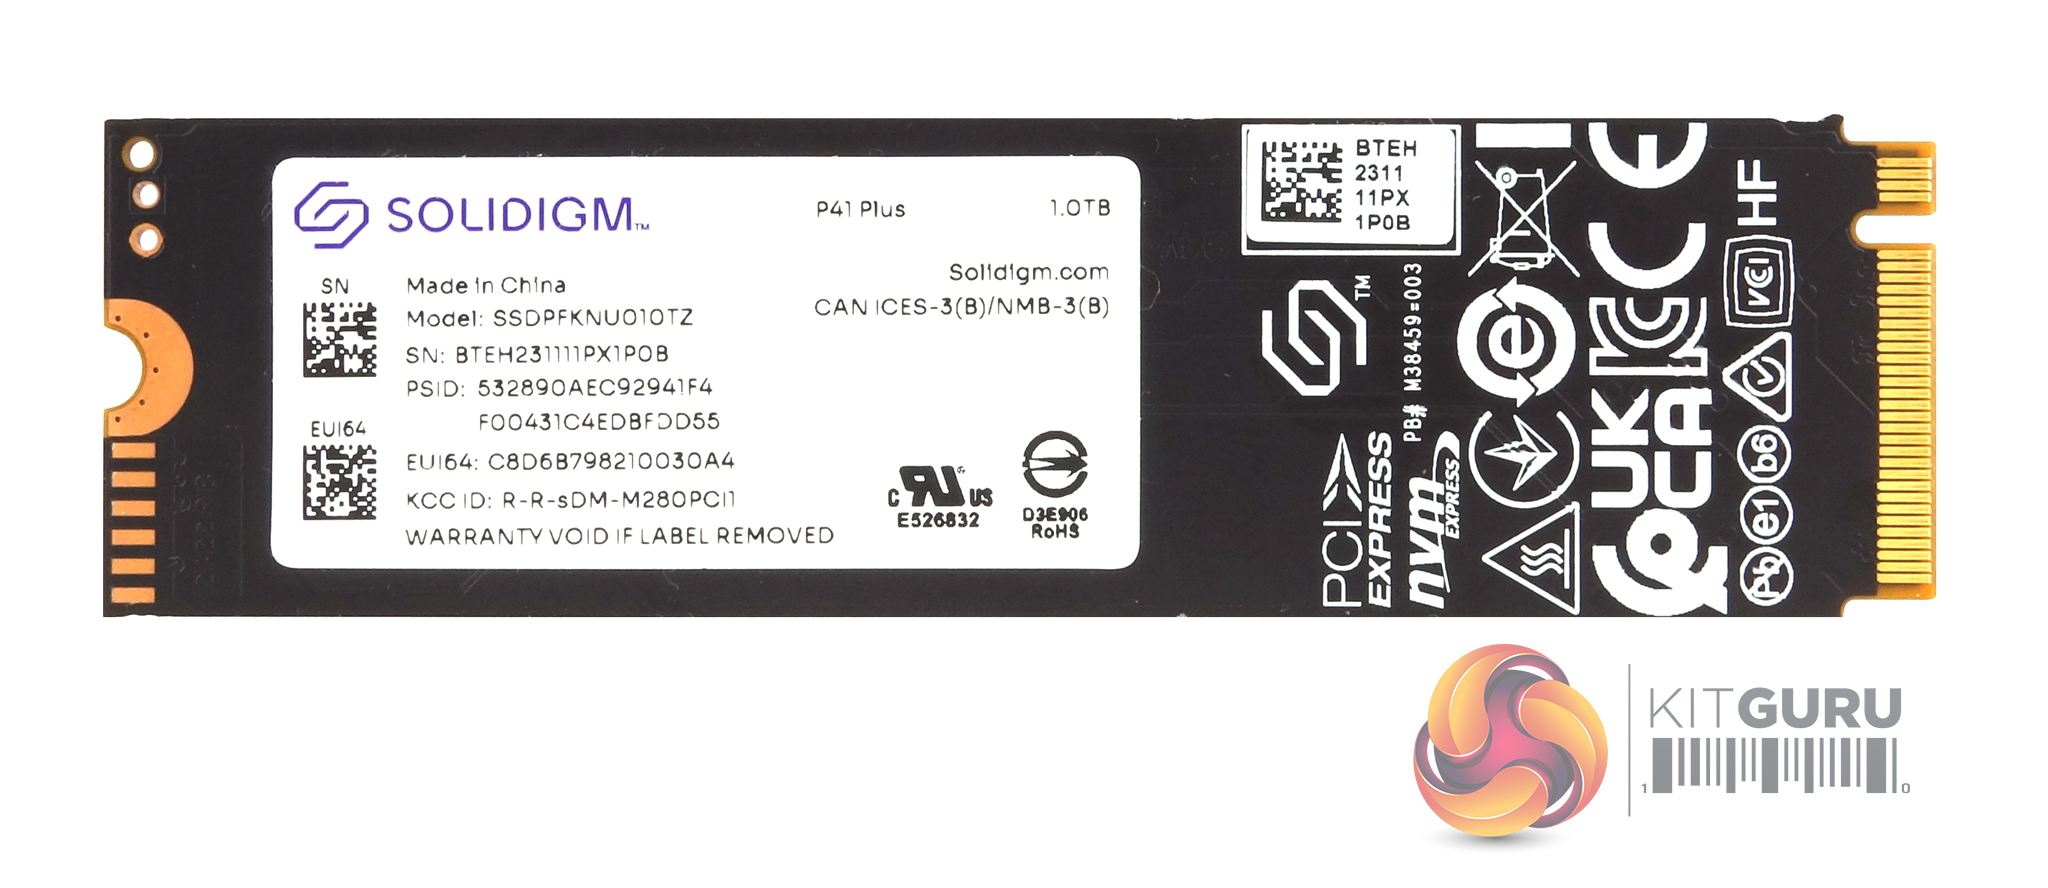
The 1TB Solidigm P41 Plus is a single-sided M.2 2280 design which doesn't have any form of heatsink installed.
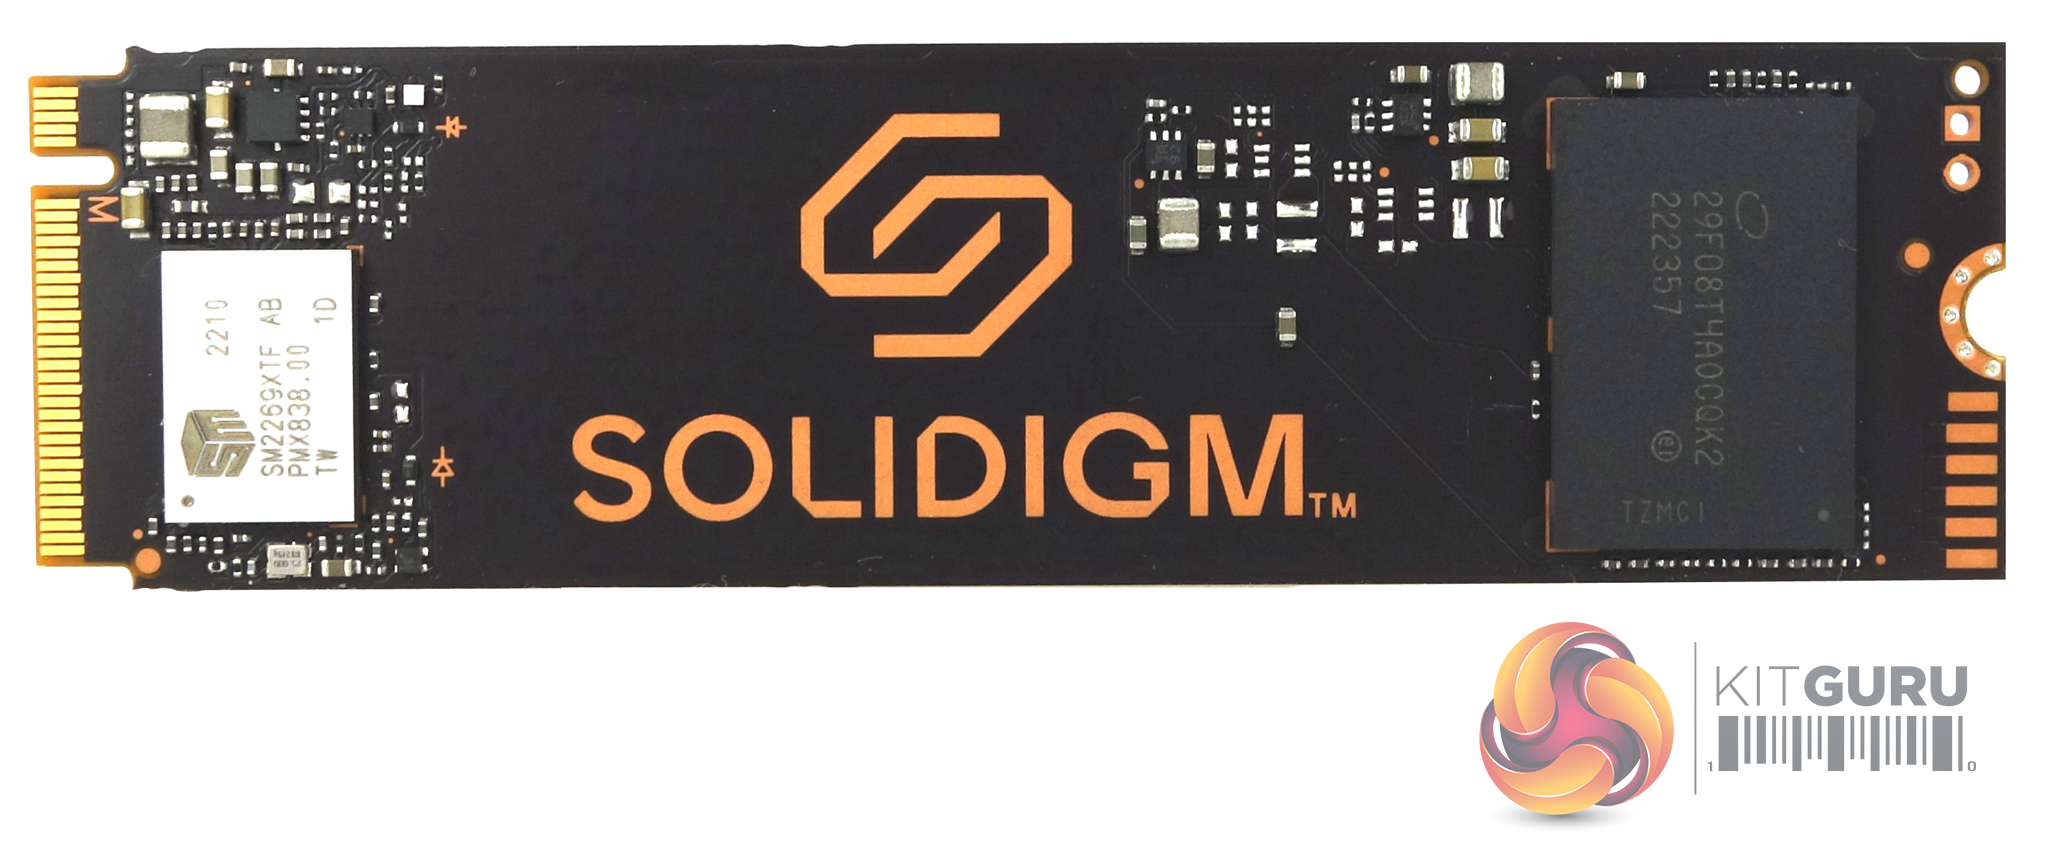
Under the full-length product label on the front of the drive sits a 4-channel Silicon Motion SM2269XT controller along with a single NAND package of Solidigm 144-layer 3D QLC NAND. As the P41 Plus is a DRAM-less design these are the only major components on the PCB.
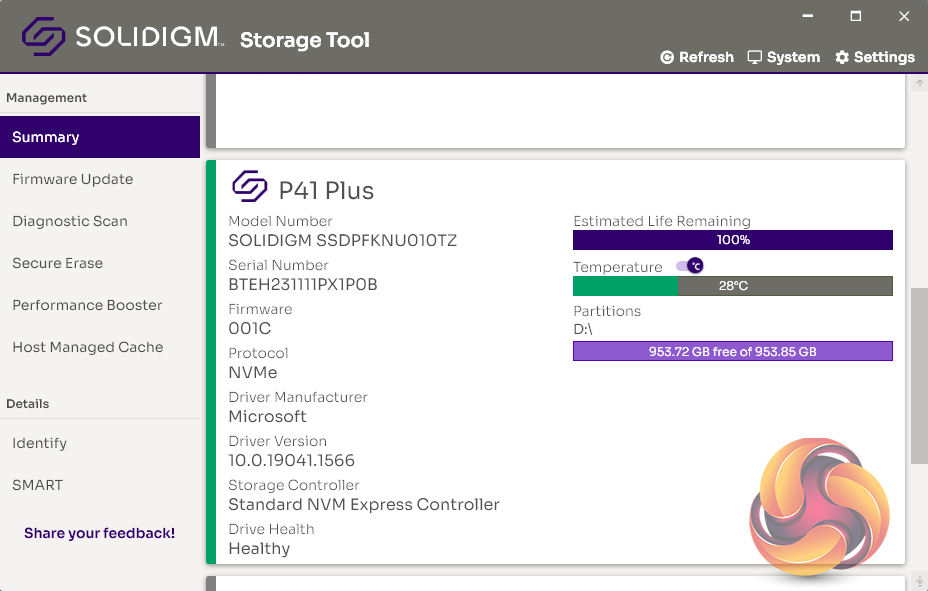
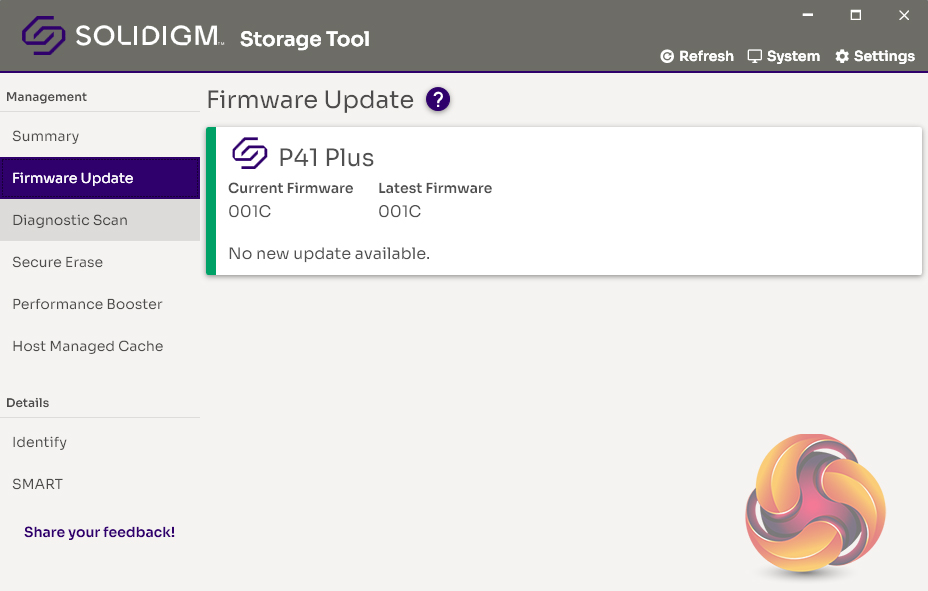
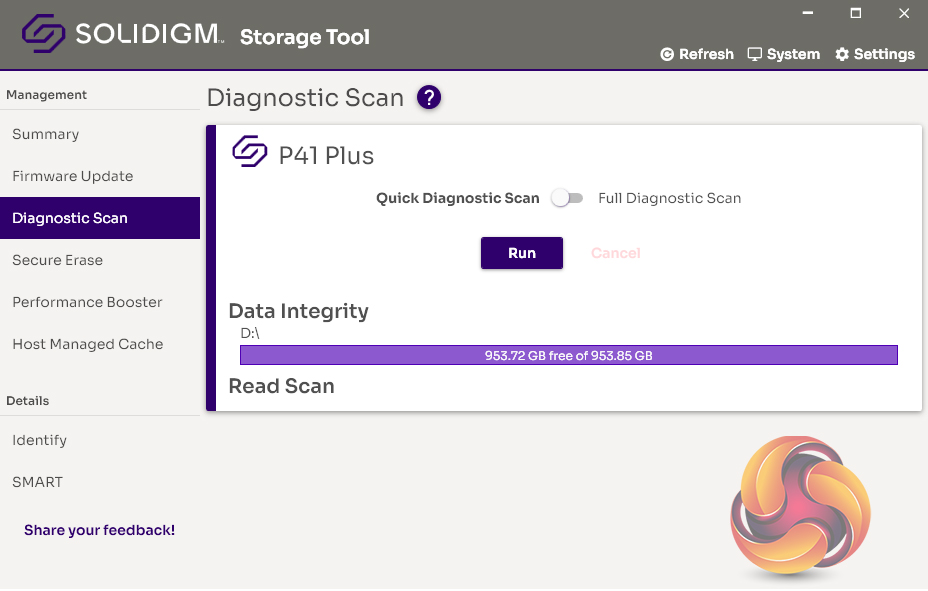
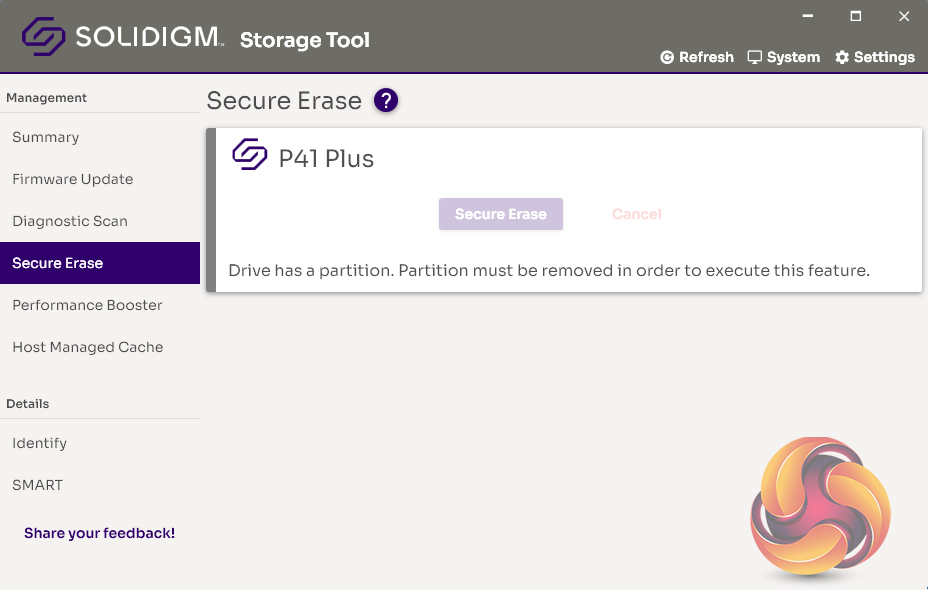
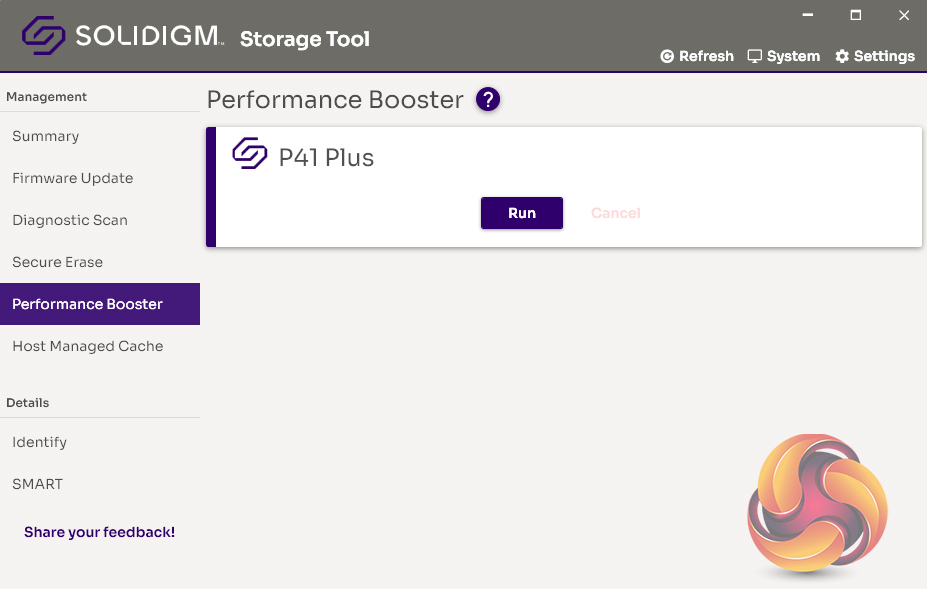
Solidigm's software utility goes by the name of the Synergy Storage Tool. It doesn't have the flashy GUI of some of its competitors but most of what you need is there including; drive information, drive health, diagnostic scans, firmware updates and secure erase.
For testing, the drives are all wiped and reset to factory settings by HDDerase V4. We try to use free or readily available programs and some real-world testing so you can compare our findings against your own system.
This is a good way to measure potential upgrade benefits.
Main system:
AMD Ryzen 5 3600X, 16GB DDR4-2400, Sapphire R9 390 Nitro and an MSI MPG X570 Gaming Edge WiFi motherboard.
Other drives
- Corsair MP600 PRO 2TB
- Corsair Force MP600 1TB
- Corsair MP600 PRO XT 2TB
- Crucial P5 Plus 1TB
- Gigabyte AORUS 7000e 2TB
- HP FX900 Pro 2TB
- Kingston KC3000 2TB
- Kioxia BG5 1TB
- Kioxia Exceria Pro 2TB
- MSI Spatium M480 2TB
- Patriot Viper VP4300 2TB
- Patriot Viper VPN4100 1TB
- PNY XLR8 CS3040 1TB
- PNY XLR8 CS3140 1TB
- Sabrent Rocket 4 Plus 1TB
- Sabrent Rocket 4 Plus 2TB
- Sabrent Rocket 4 Plus 4TB
- Samsung SSD980 PRO 1TB
- Samsung SSD980 PRO Heatsink 1TB
- Seagate FireCuda 520 1TB
- Seagate FireCuda 530 2TB
- Teamgroup T-Force Cardea Zero Z440 1TB
- Teamgroup T-Force Cardea A440 Pro Special Series 1TB
- WD Black SN770 1TB
- WD Black SN850 1TB
- WD Black SN850X Heatsink 2TB
- Software:
- Atto Disk Benchmark 4.
- CrystalMark 8.0.0.
- AS SSD 2.0.
- IOMeter.
- UL Solutions PC Mark 10.
- UL Solutions 3DMark Storage Benchmark
All our results were achieved by running each test five times with every configuration this ensures that any glitches are removed from the results. Trim is confirmed as running by typing fsutil behavior query disabledeletenotify into the command line. A response of disabledeletenotify =0 confirms TRIM is active.
CrystalDiskMark is a useful benchmark to measure theoretical performance levels of hard drives and SSD’s. We are using v8.0.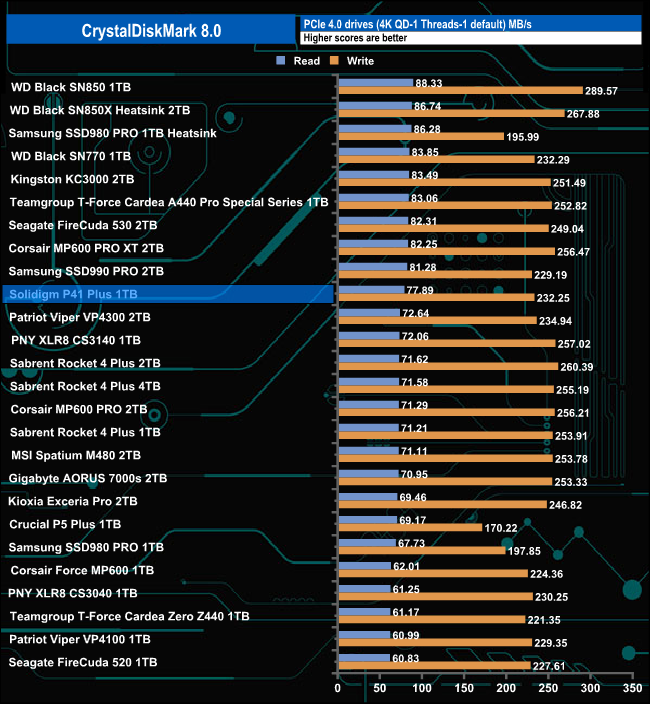
With a read score of 77.89MB/s for CrystalDiskMark 8's 4K QD1 test, Solidigm's P41 Plus just creeps into the top 10 in our results chart. Its write test result of 235.25MB/s isn't as strong, however.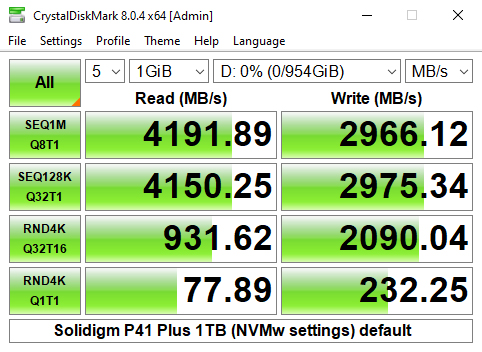
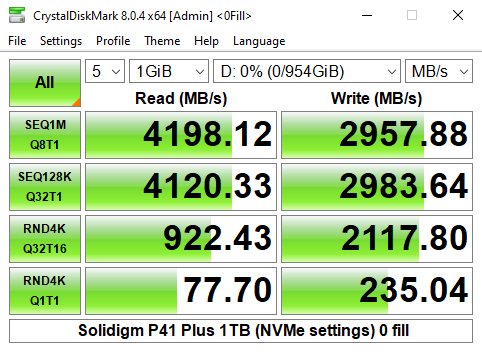
As you can see from the benchmark result screens we could confirm the official read/write figures of 4,125MB/s and 2,950MB/s respectively with a read result of 4,191.89MB/s and writes at 2,966.12MB/s.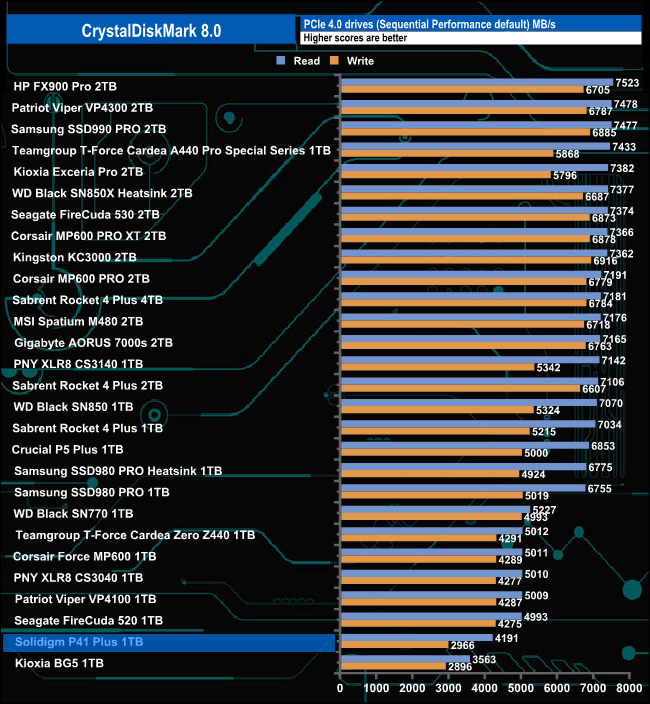
Although we managed to squeeze a wee bit more performance out of the drive under testing, it wasn't enough to lift it any higher up the results chart than the second-slowest position in our charts.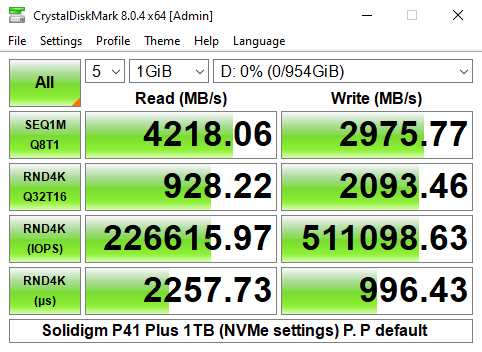
Switching over to the Peak Performance profile in CrystalDiskMark 8 we could again confirm the official Sequential ratings with a read test result of 4,218.06MB/s (which is 93MB/s faster than the official figure) and 2,975MB/s for writes.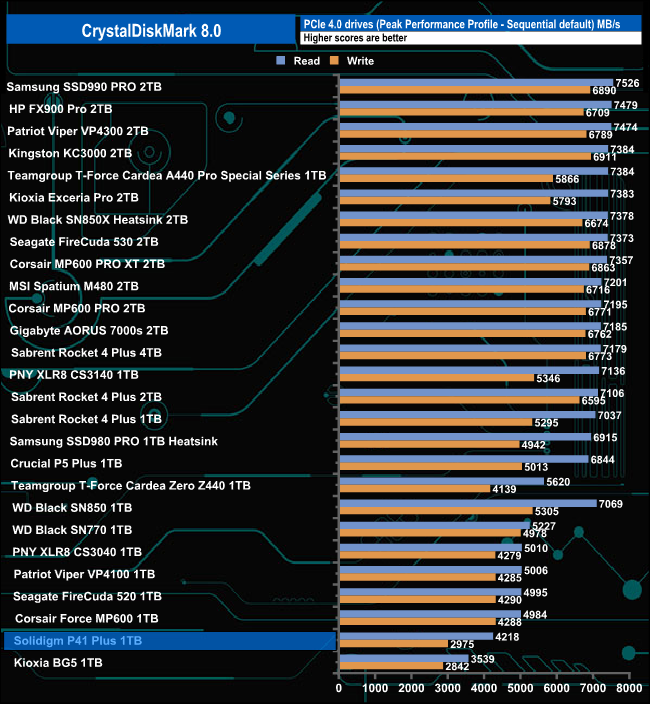
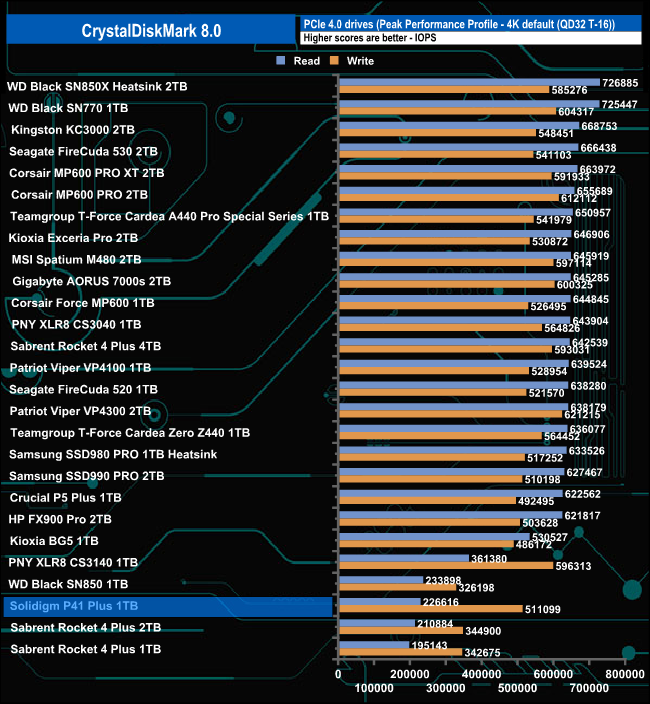
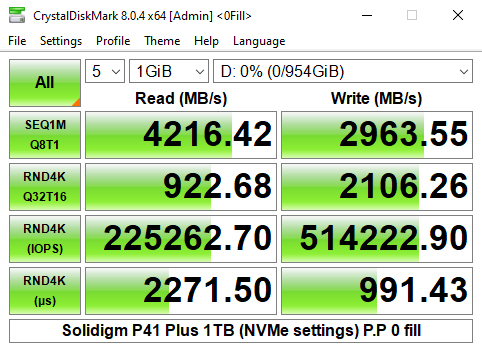
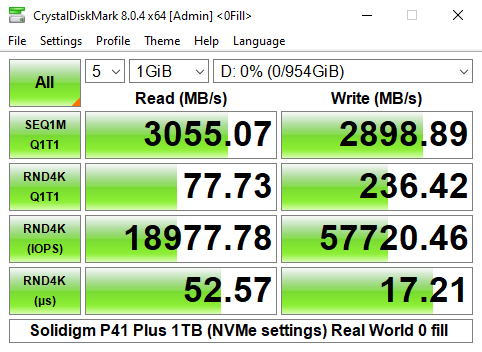
Using the Peak Performance profile of the CrystalDiskMark benchmark we could confirm the official random read rating of up to 225,000 IOPS with a best test read result of 226,616 IOPS (default data), while the best write result of 514,222 IOPS came using the 0 fill test settings and is just shy of the official maximum of 520,000 IOPS.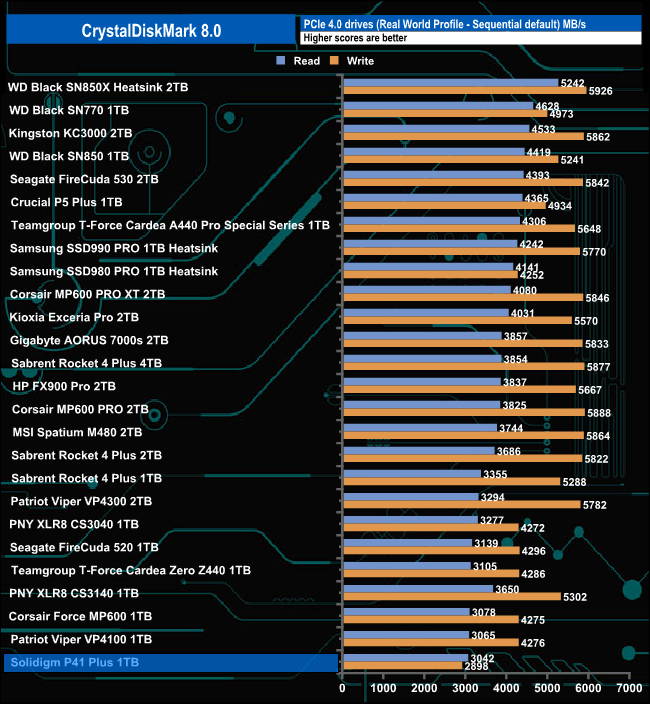
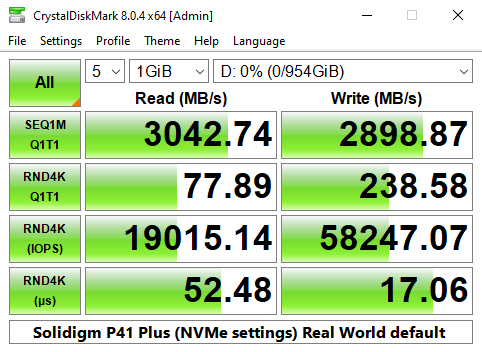
Using the Real World profile the drive produced Sequential read/write figures of 3.042MB/s and 2,898MB/s respectively.
The ATTO Disk Benchmark performance measurement tool is compatible with Microsoft Windows. Measure your storage systems performance with various transfer sizes and test lengths for reads and writes. Several options are available to customize your performance measurement including queue depth, overlapped I/O and even a comparison mode with the option to run continuously.
Use ATTO Disk Benchmark to test any manufacturer's RAID controllers, storage controllers, host adapters, hard drives and SSD drives and notice that ATTO products will consistently provide the highest level of performance to your storage.
We are using version 4.0 for our NVMe disk tests.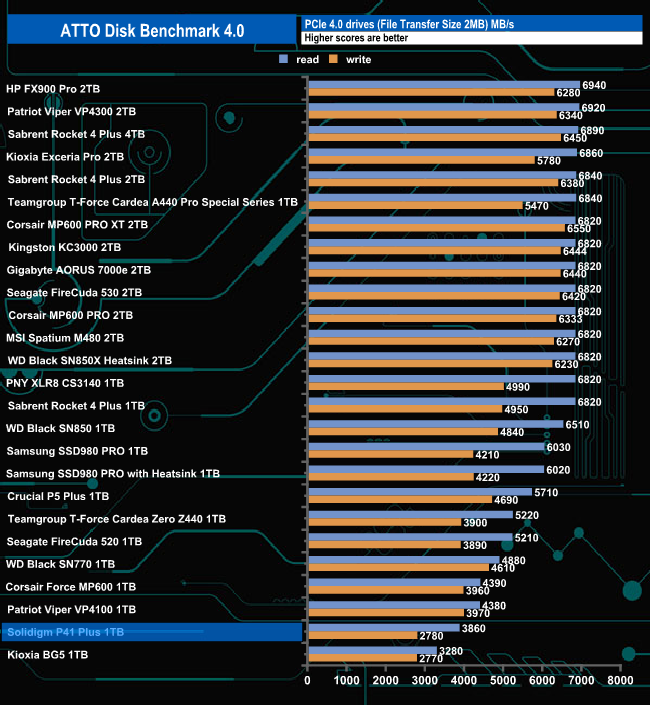
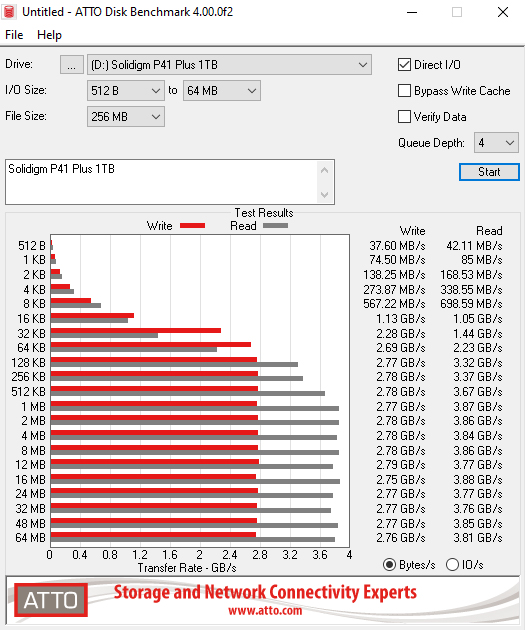
Using the ATTO benchmark, the best figures we got out of the drive were 3,860MB/s for reads and 2,780MB/s for writes, both short of the official maximums of up to 4,125MB/s and up to 2,950MB/s for read and write respectively.
AS SSD is a great free tool designed just for benching Solid State Drives. It performs an array of sequential read-and-write tests, as well as random read-and-write tests with sequential access times over a portion of the drive. AS SSD includes a sub suite of benchmarks with various file pattern algorithms but this is difficult in trying to judge accurate performance figures.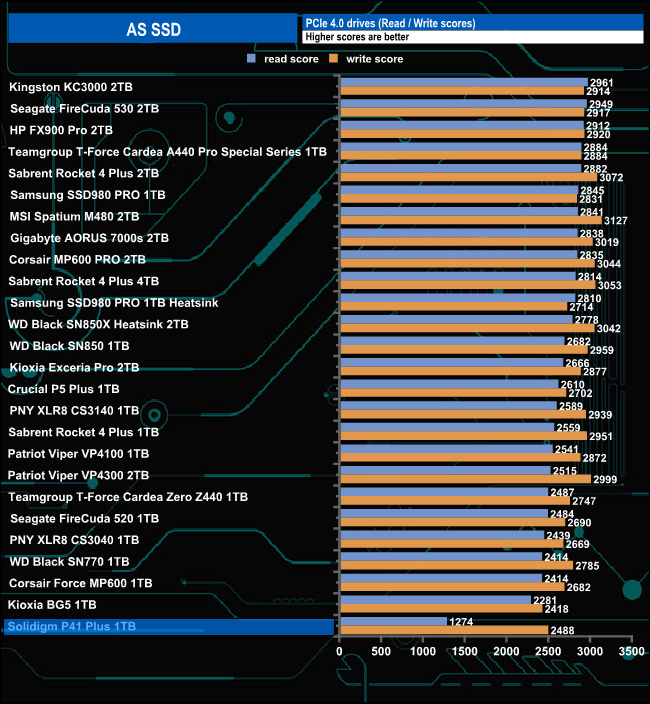
The Solidigm P41 Plus AS-SSD read score of 1274 sees the drive at the foot of the results table, however its write score is much stronger at 2488.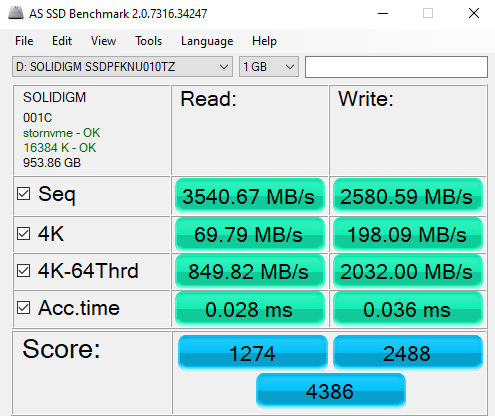
We used CrystalDiskMark 8‘s custom settings to test the Sequential read and write performance of the drive through a range of queue depths. The setup for the tests is listed below.
128KB Sequential Read / Write.
Transfer Request Size: 128KB, Thread(s): 1, Outstanding I/O: 1-32.
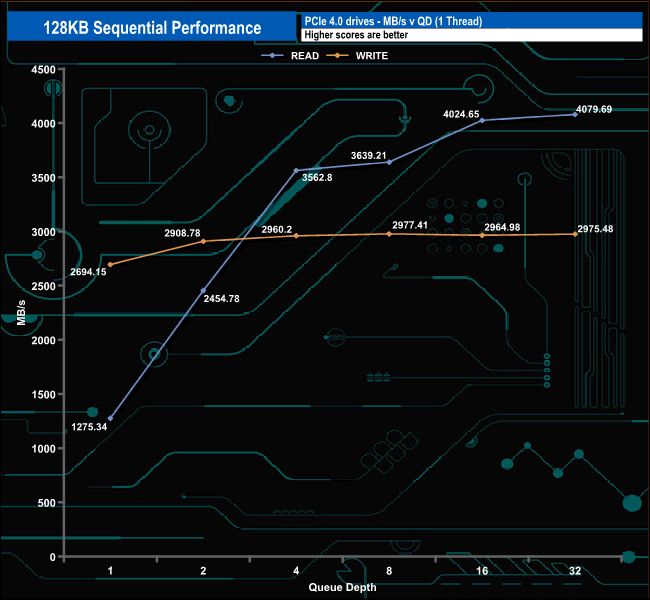
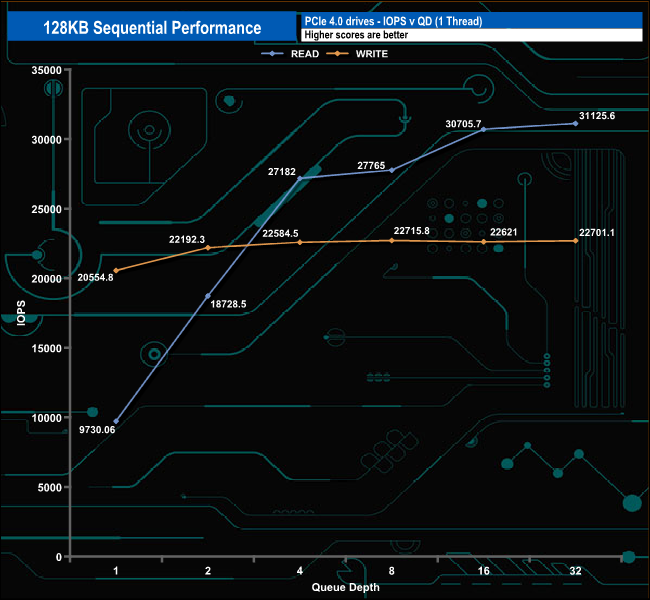
At 4,079MB/s, the Sequential read result is a little shy of the official 4,125MB/s while the peak write score of 2,977MB/s (QD8) is a little faster than the official maximum rating of 2,950MB/s. The read performance seemed to start to plateau out between QDs 4 and 8 but recovers by QD16.
128KB Sequential Read performance v QD.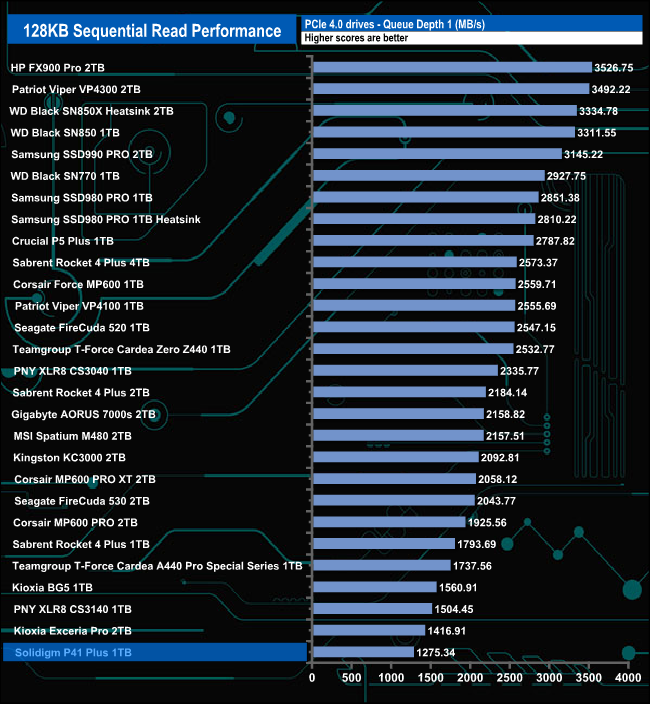
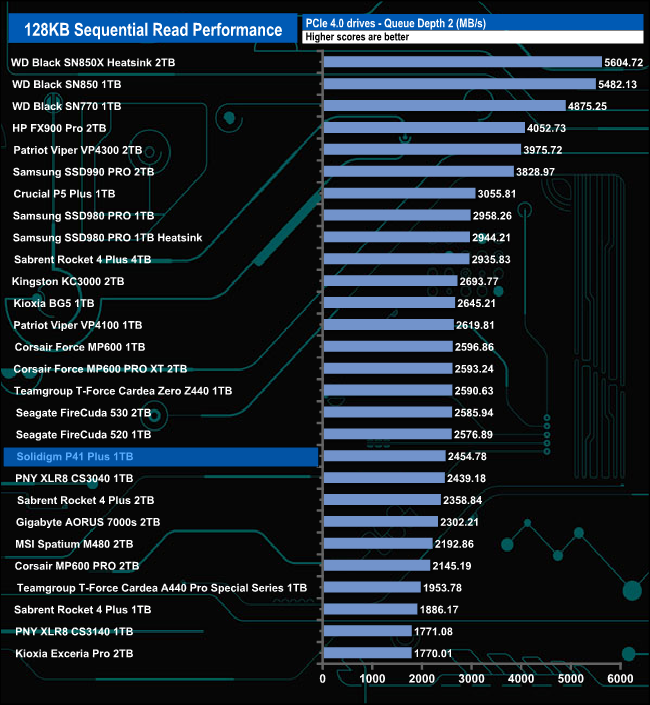
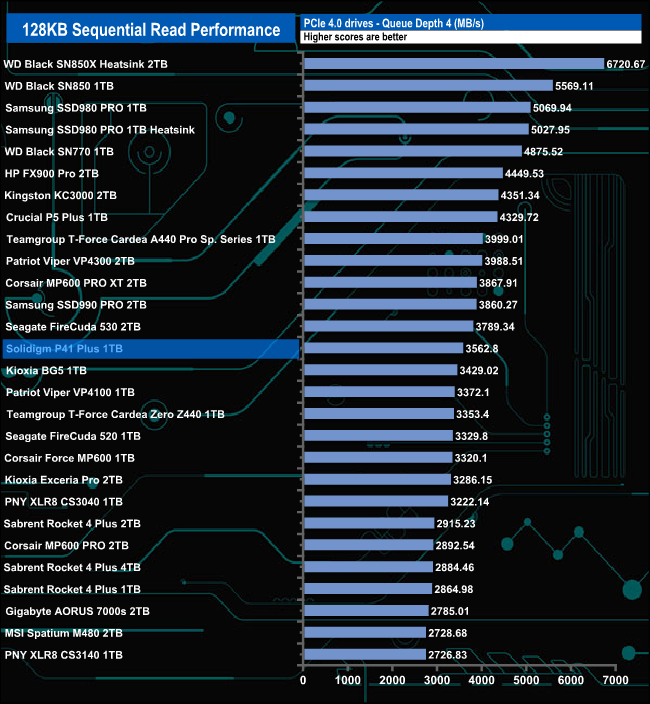
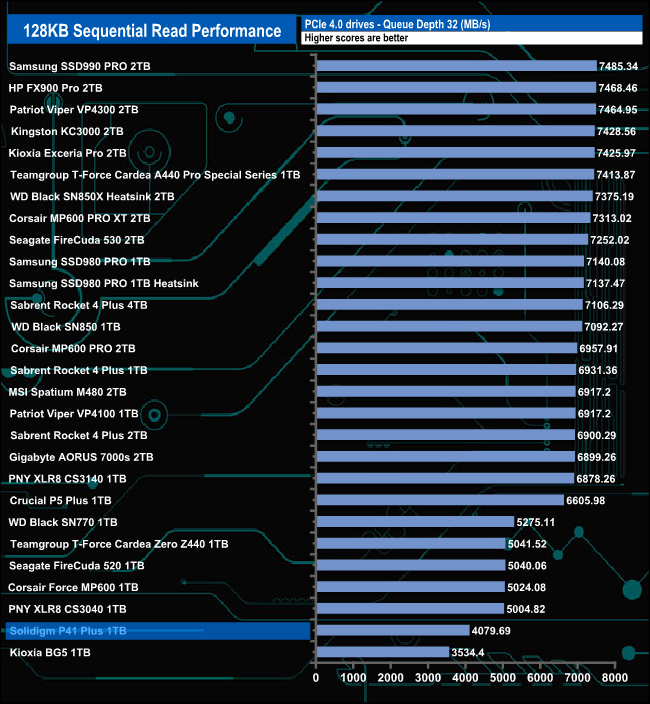
The P41 Plus seems to perform best at QD's 2 and 4 where it sits mid-table. At QD's 1 and 32 the drive sits at the bottom of the results chart.
128KB Sequential Write performance v QD.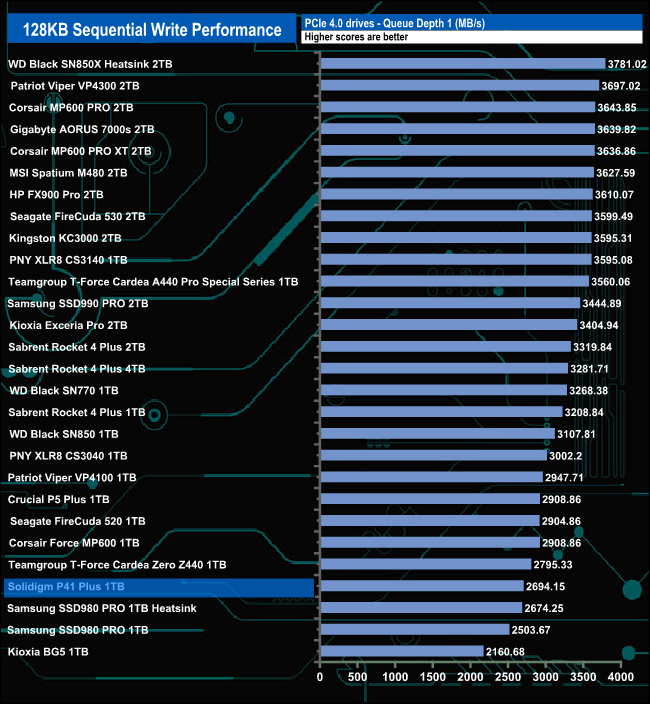
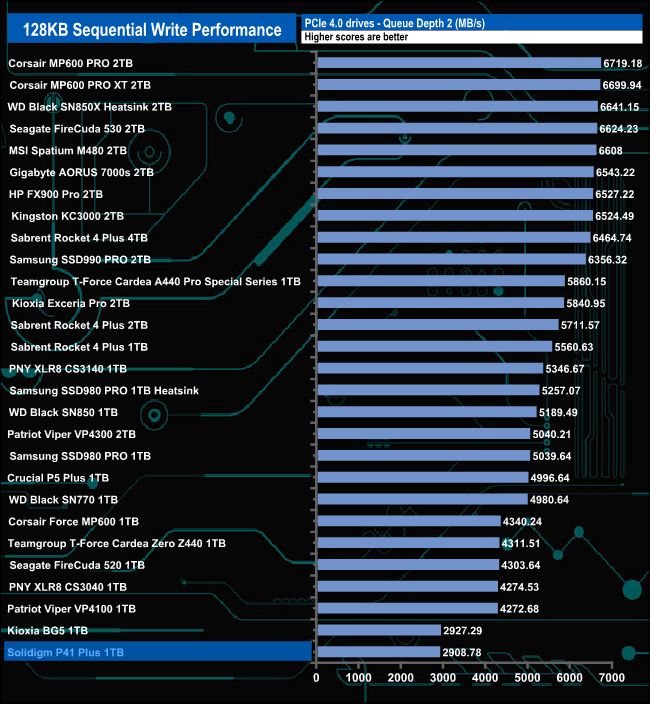
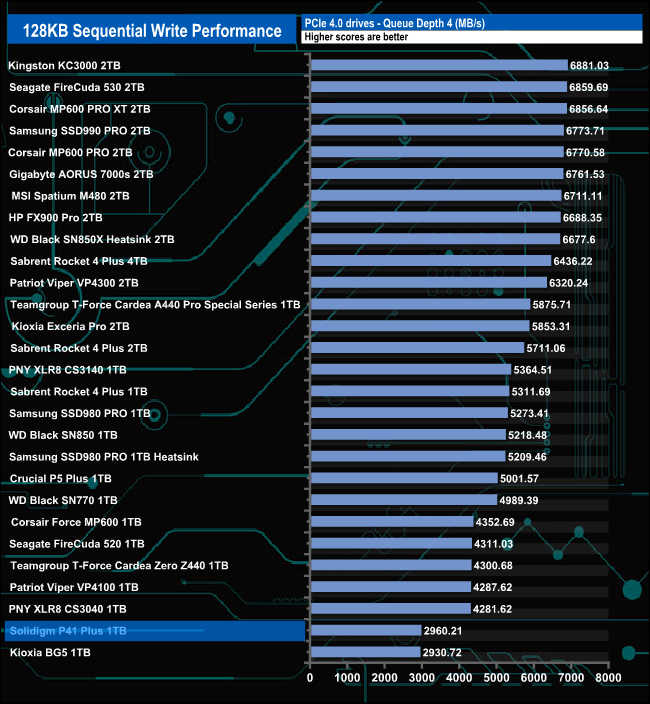
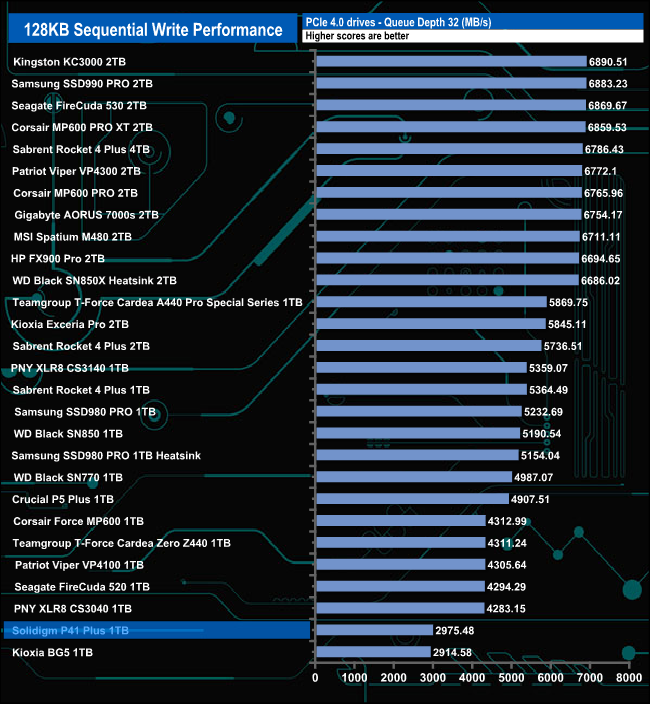
The 1TB P41 Plus sits very firmly in the bottom part of our results charts throughout the tested queue depths, performing strongest at QD1.
We used CrystalDiskMark 8‘s custom settings to test the 4K random read performance of the drive through a range of queue depths. The setup for the tests is listed below.
Transfer Request Size: 4KB, Outstanding I/O: 1-32.
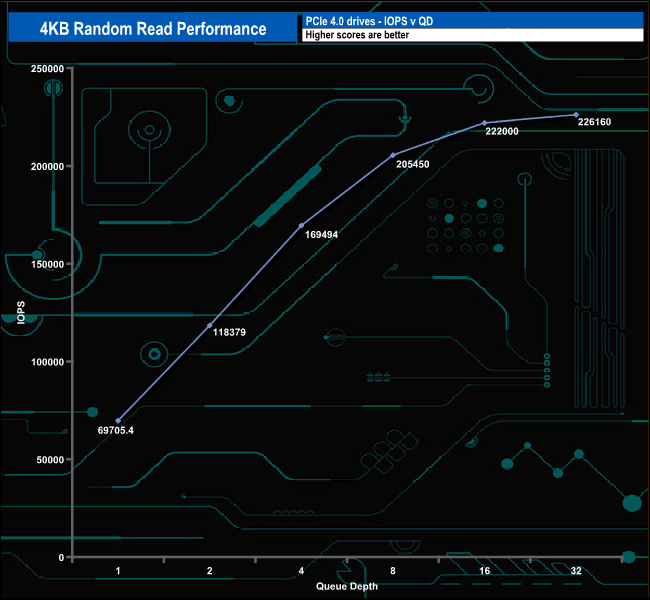

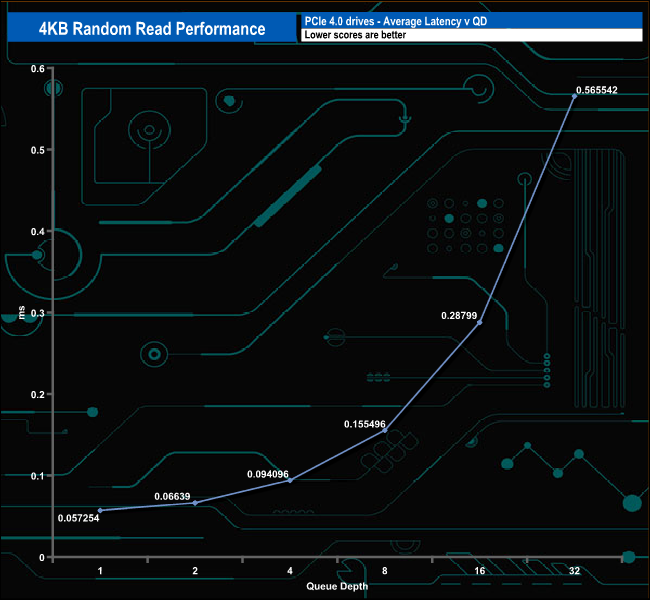
In our 4K random read tests, we could confirm the maximum official rating of 225,000 IOPS with a test result of 226,160 IOPS (926.353MB/s) at QD32.
4K Random Read v QD Performance compared.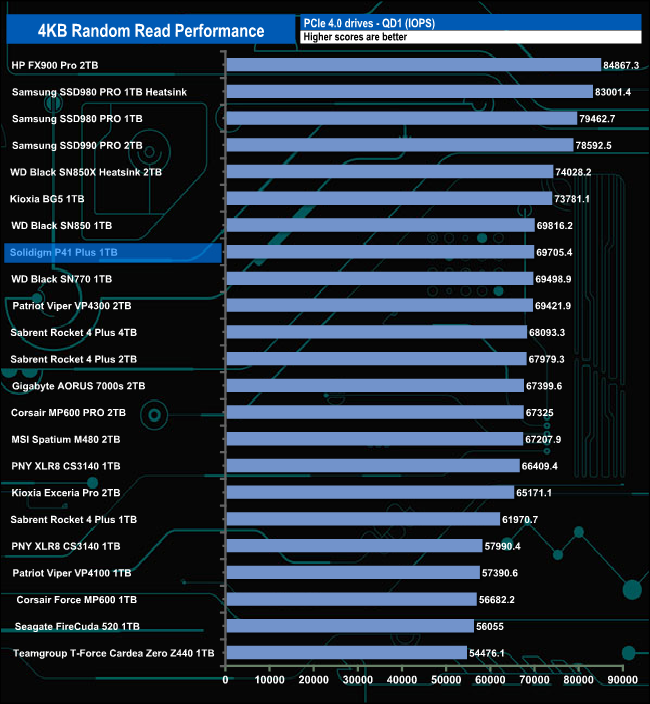
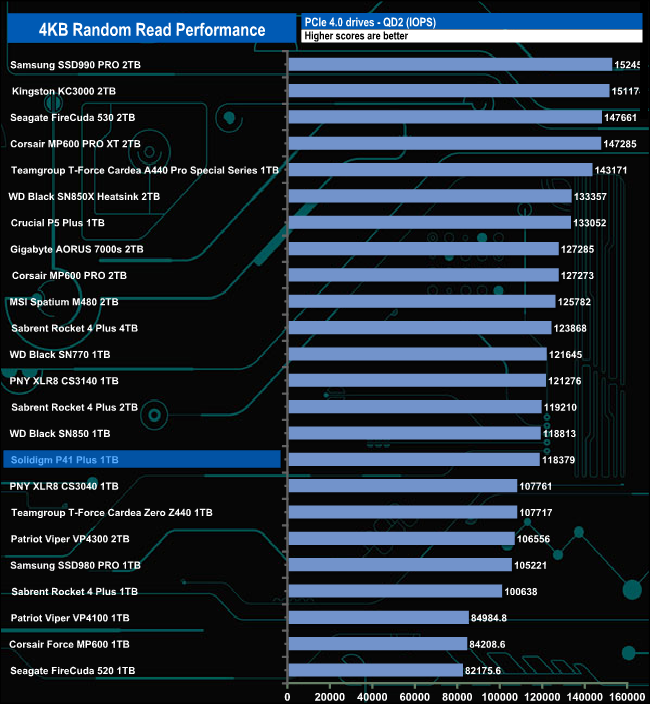
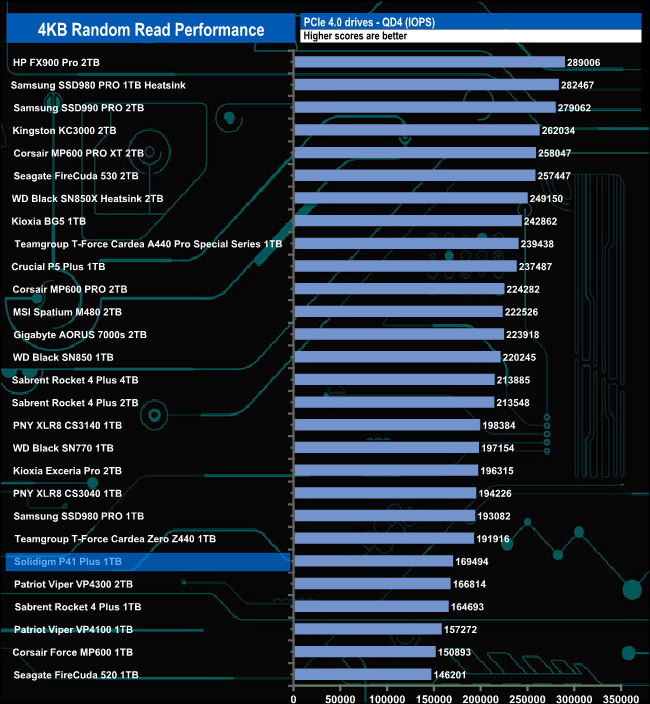
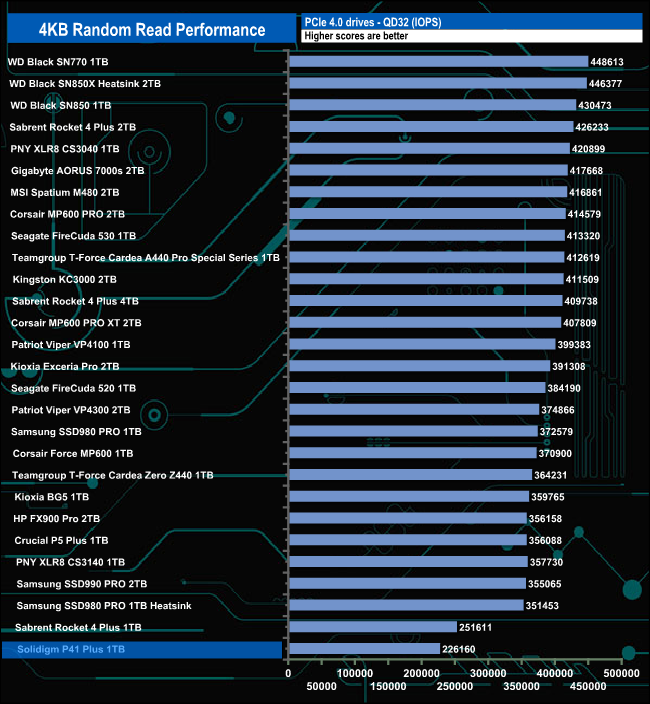
At QD1 the P41 Plus sits in the top 10 of the results chart but as the tested queue depth deepens the drive drops down the chart until at QD32 it sits in last place on the chart.
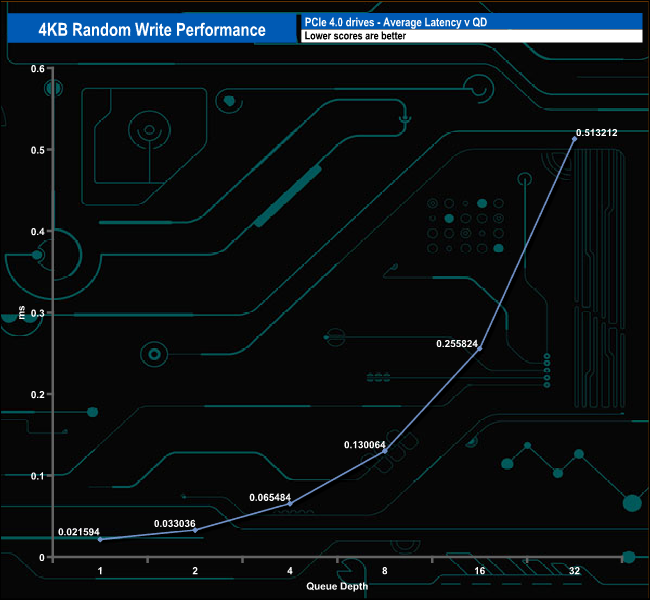
We used CrystalDiskMark 8‘s custom settings to test the 4K random write performance of the drive through a range of queue depths. The setup for the tests is listed below.
Transfer Request Size: 4KB, Outstanding I/O: 1-32.
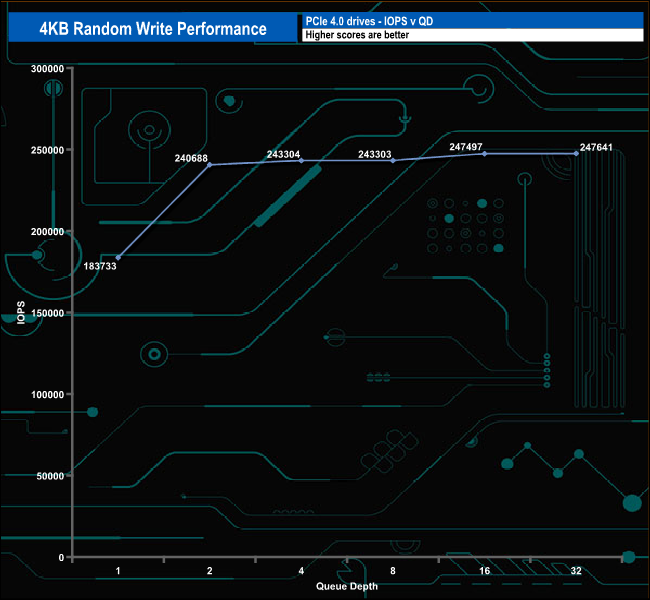
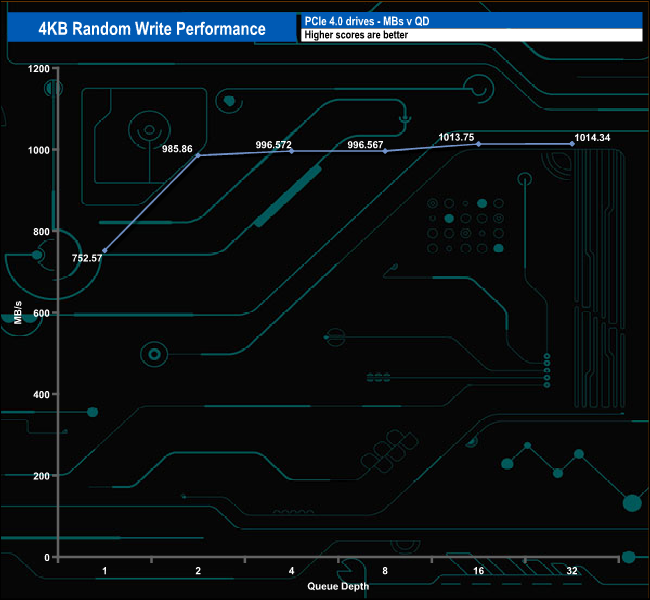
The best random write figure we saw in our 4-threaded random write test was 247,641 IOPS (1014.34MB/s) at QD32 which is way off the official maximum figure of 520,000 IOPS. We did a quick test at QD32 using 8 threads and got a result of 420,582 IOPS, still short of the official maximum.
4K Random Write QD Performance compared.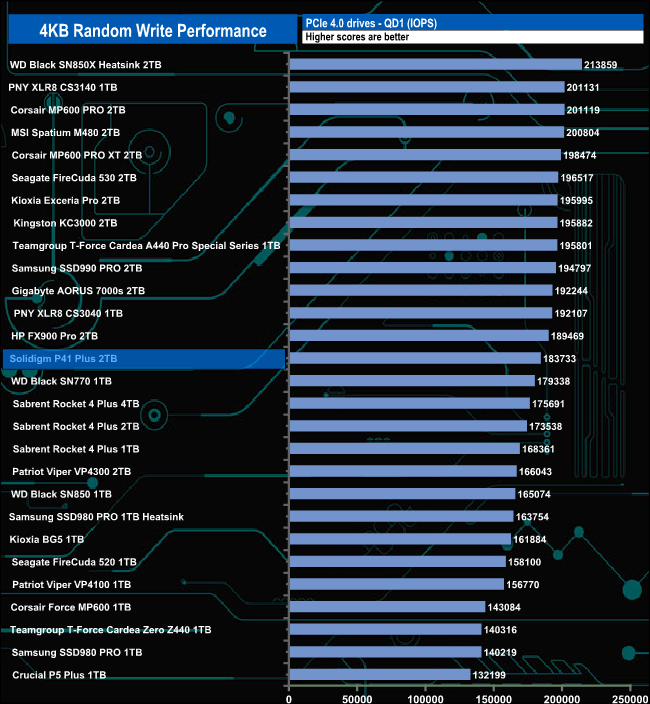
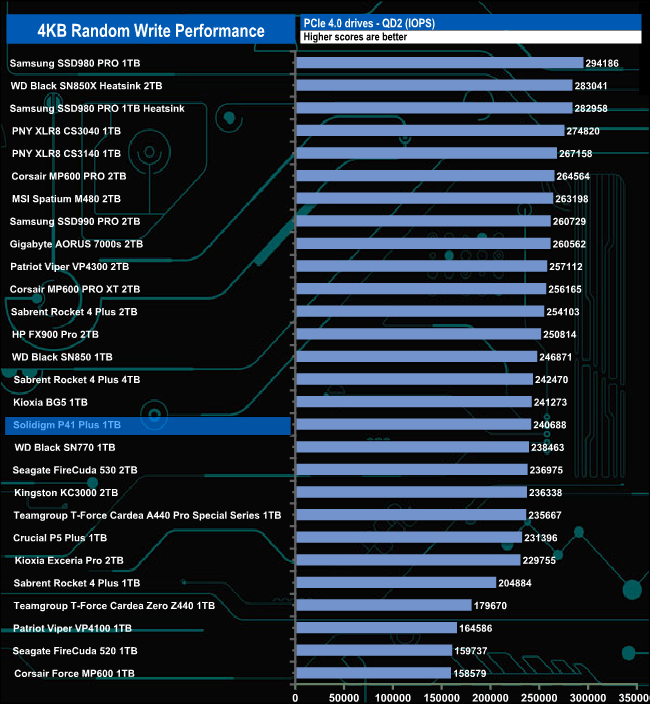
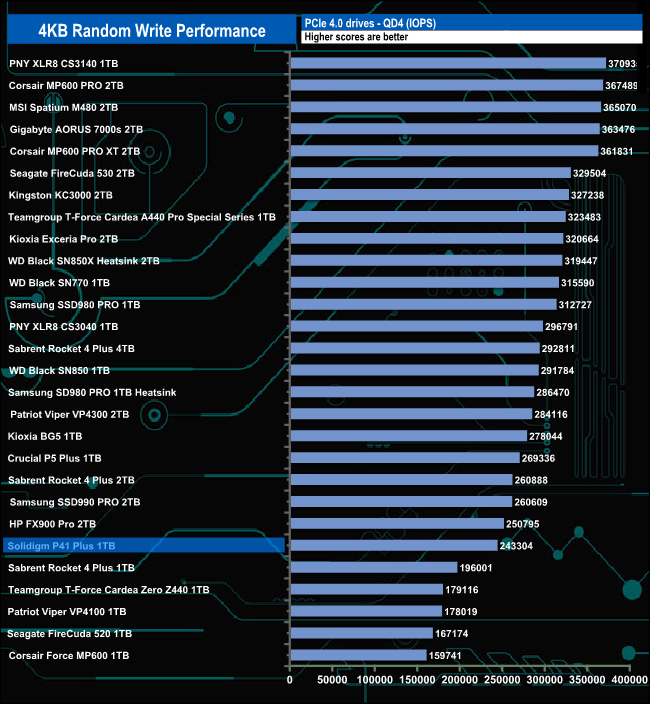
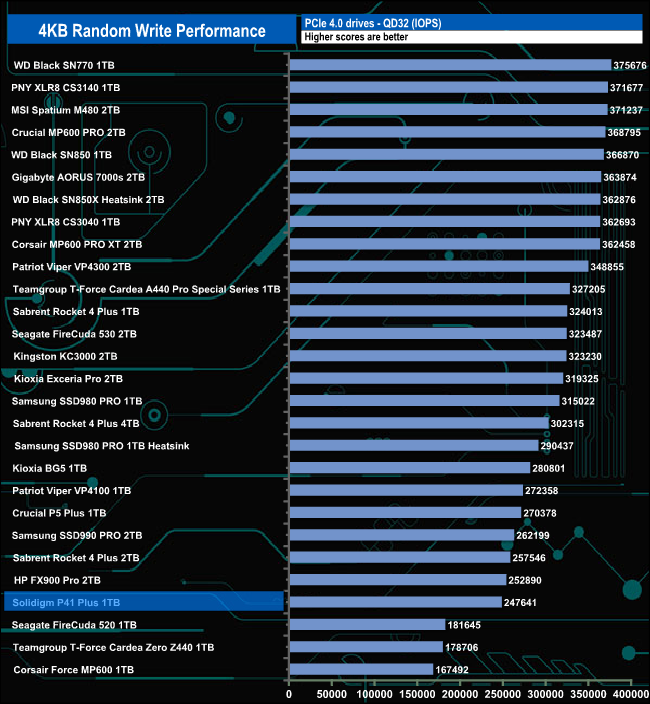
At QD1 the drive sits in mid-table and as the queue depth deepens the drive slowly falls down the chart so by QD32 it sits in the bottom half of the table.
We used CrystalDiskMark 8’s custom settings to test the 4K 70/30 mixed read/write performance of the drive through a range of queue depths using a single thread and four threads.
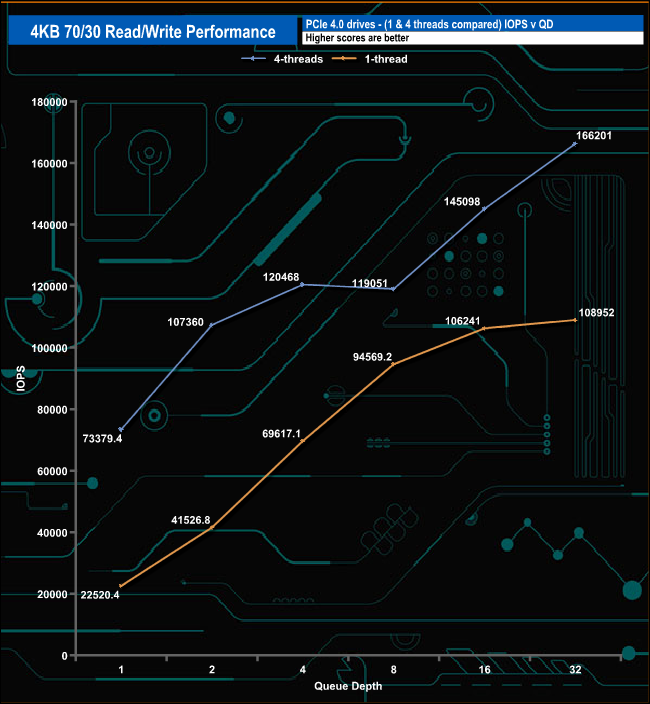
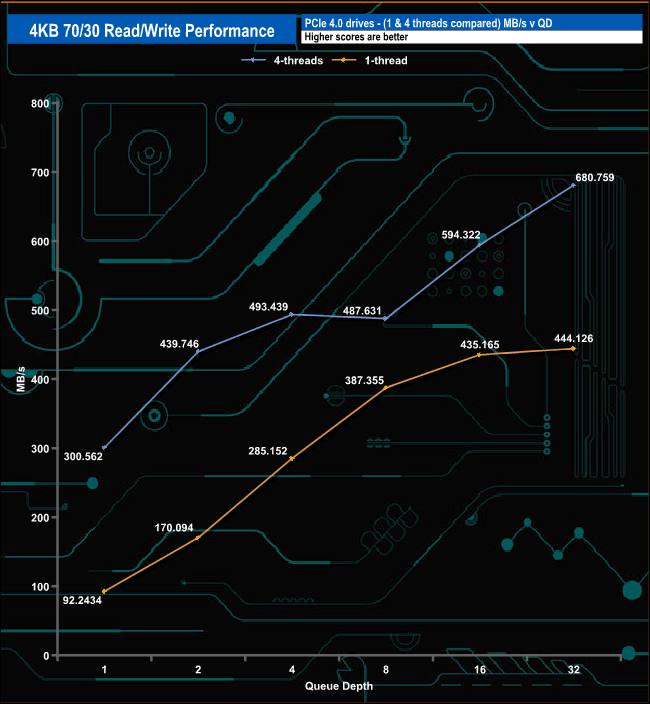
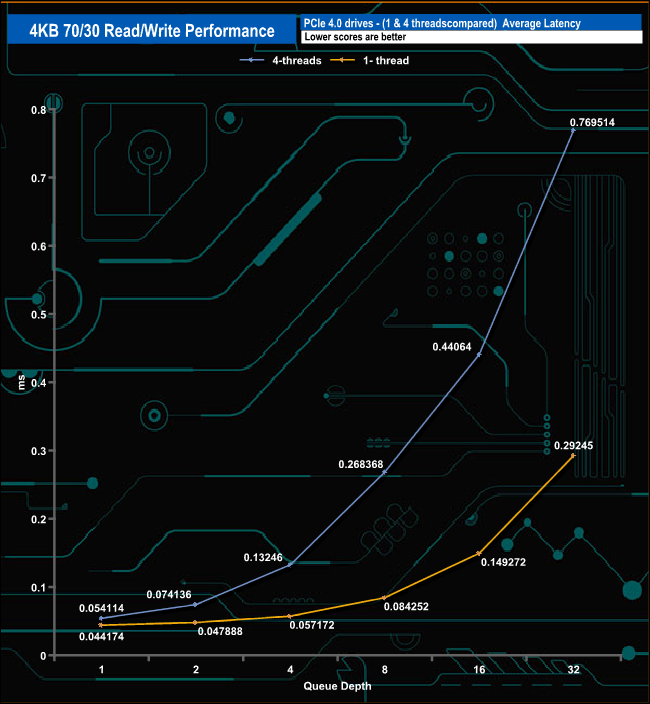
Using a single thread, the P41 Plus's performance climbs in a smooth curve from 22,520 IOPS at QD1 up to 108,952 IOPS at QD32. When tested using four threads the performance seems to plateau from QD4 through to QD8 before recovering to finish the test run at QD32 at 166,201 IOPS.
We used CrystalDiskMark 8 to test the random performance of the drive at lower queue depths (QD1 – QD8 where most of the everyday workloads occur) using 1 to 4 threads.
4K Random Read.
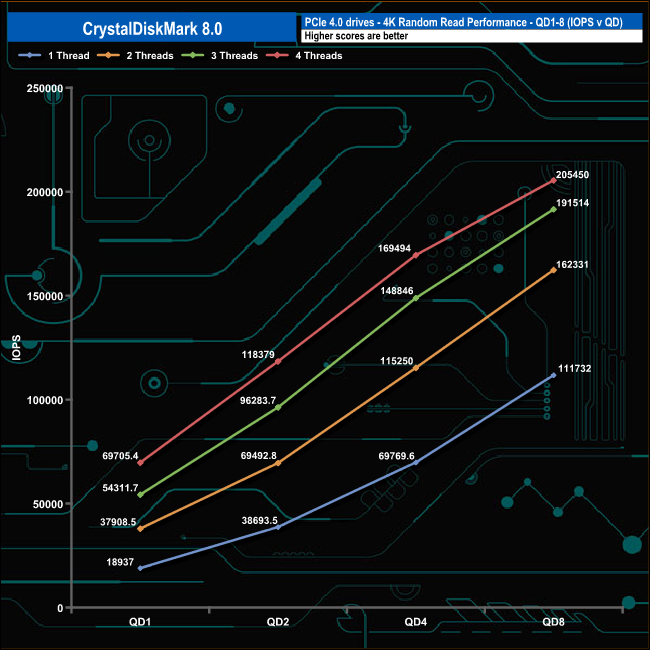
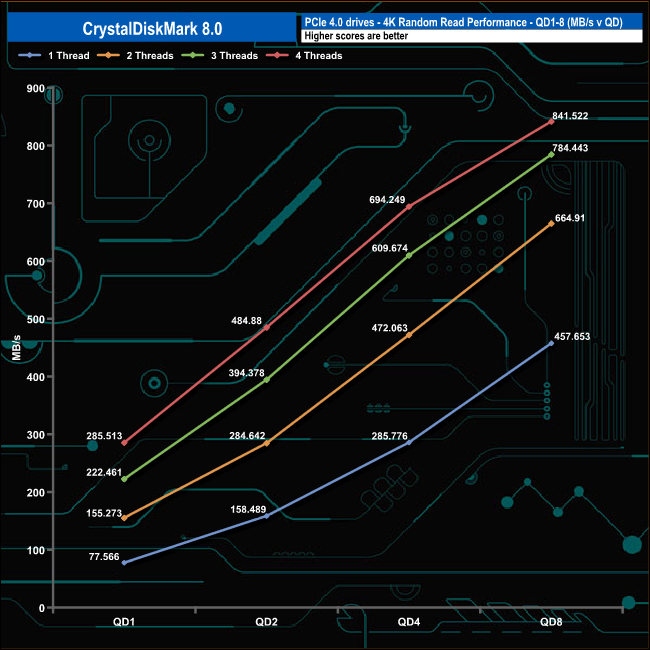
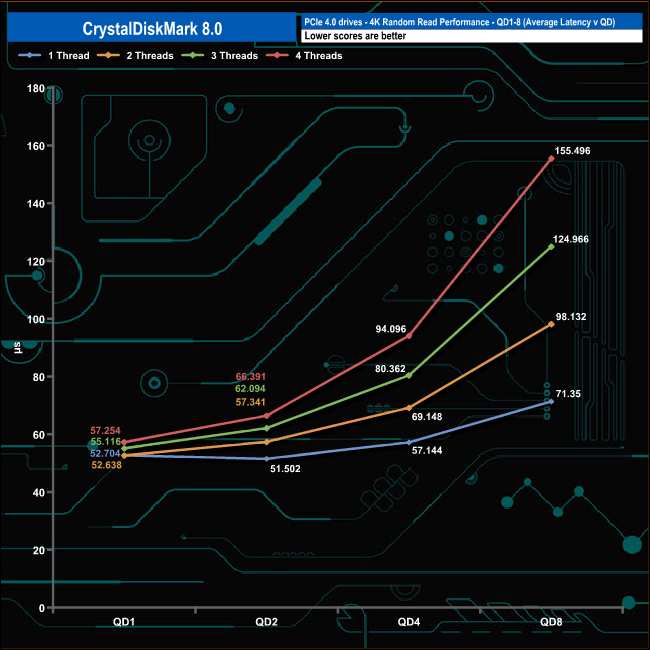
In our lower queue depth, 4K random read tests, the performance increases steadily as the queue depth deepens for each thread. At QD1 the performance ranged from a low point of 18,937 IOPS (77.56MB/s) for a single thread up to 69,705 IOPS (285.51MB/s) for four threads. At QD8 a single thread produced 111.732 IOPS (457MB/s), two threads 162,231IOPS (664MB/s), three threads 191,514 IOPs (784MB/s) and finally with four threads, 205,450 IOPS (841MB/s).
4K Random Write.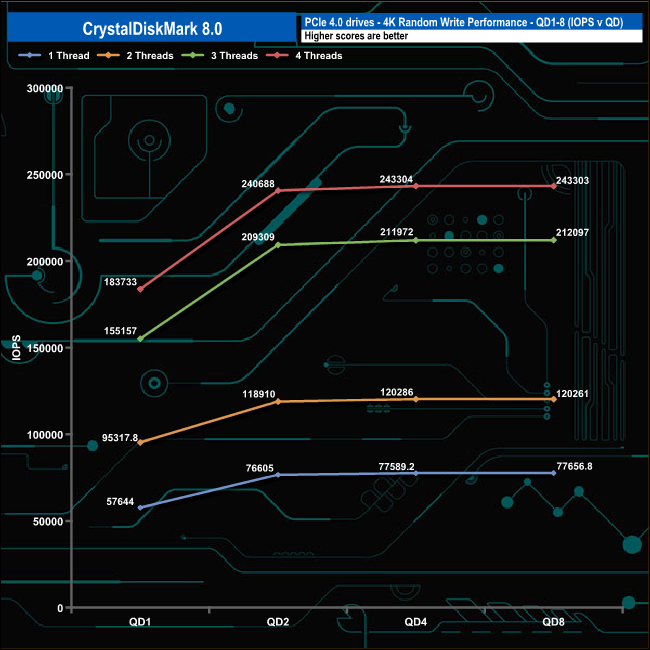
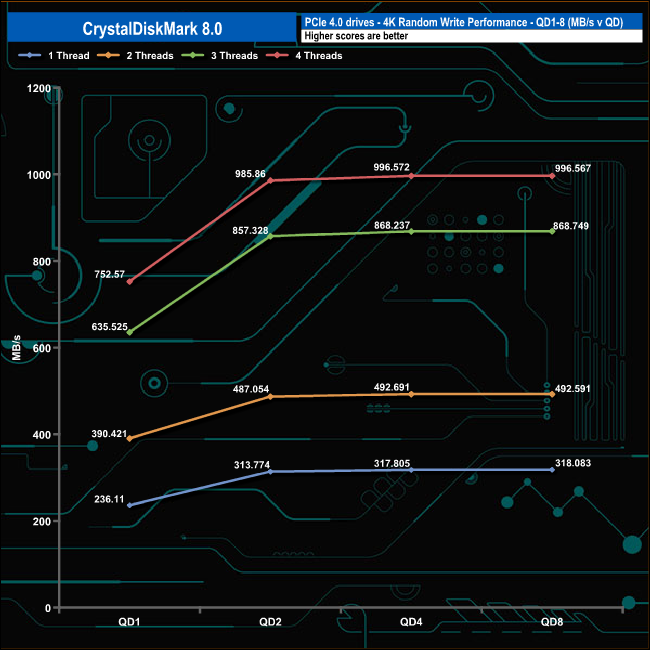
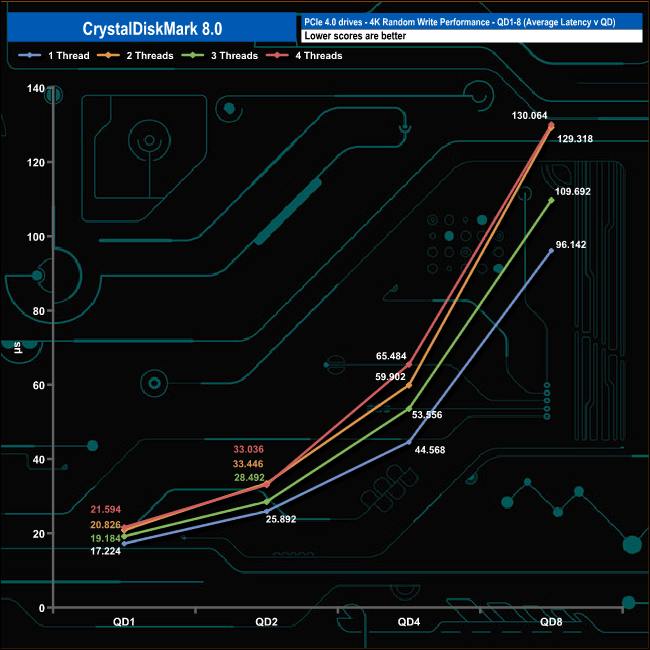
In the 4K write performance test the performance rose quickly from QD1 to QD2 but then levelled off for the remainder of the test run for all the tested threads.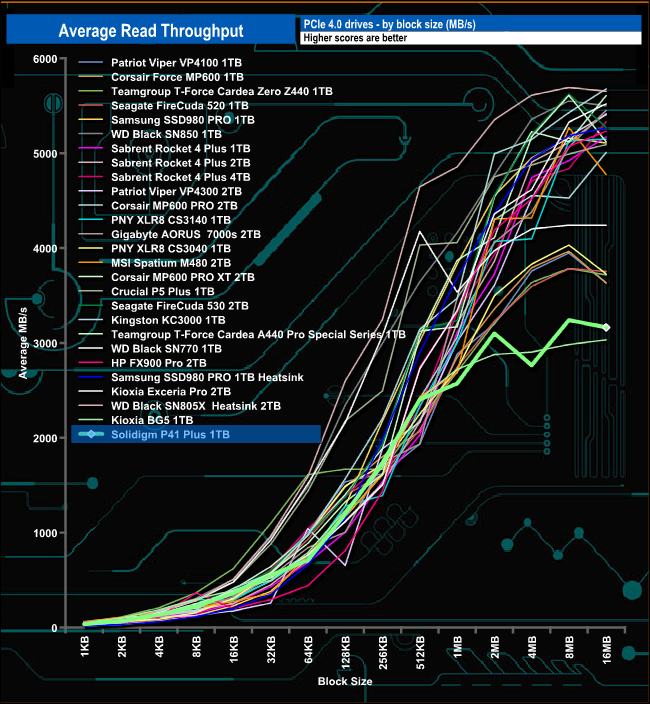
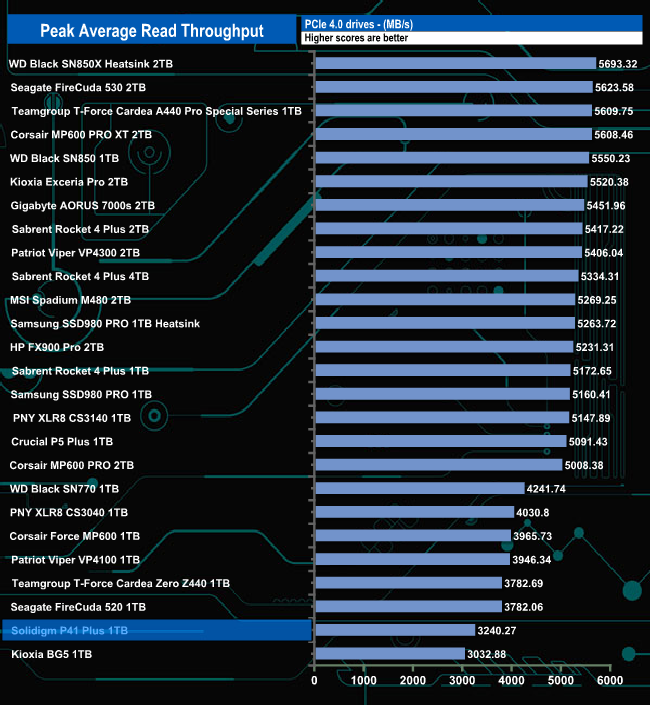
In our read-throughput tests, the P41 Plus peaked at the 8MB block mark at 3,240MB/s, a good deal short of the maximum official figure of 4,125MB/s. The performance drops back to finish the test run at 3,164MB/s.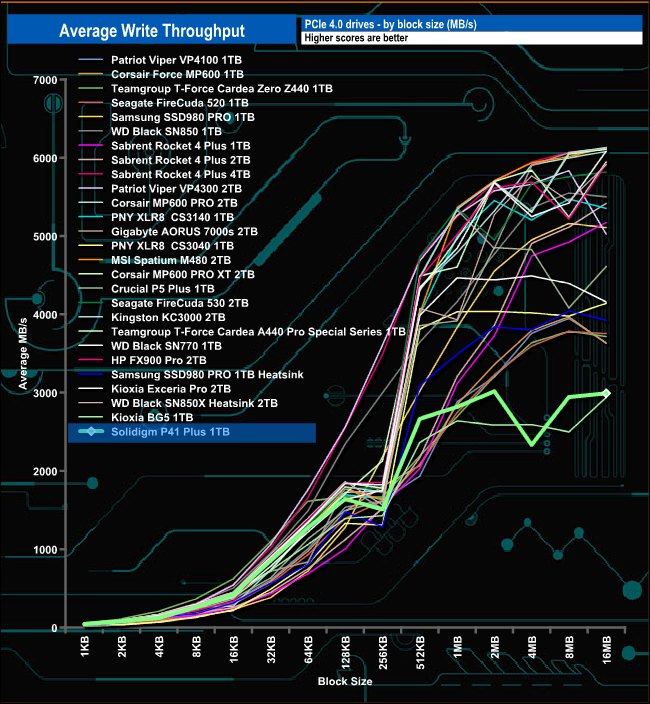
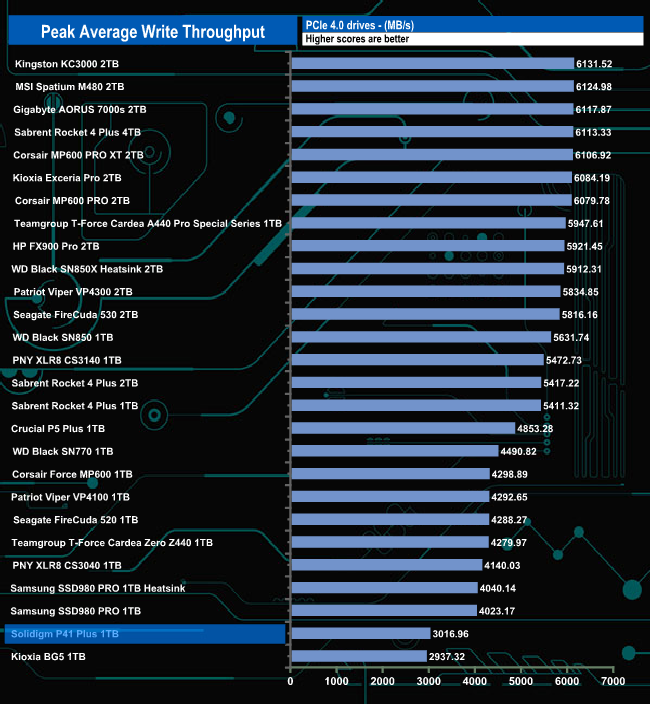
During the write throughput test, the drive peaked at 3,016MB/s (2MB block) before finishing the test run at 2,991MB/s, both figures bettering the official write maximum of 2,950MB/s.
The PCMark 10 Full System Drive Benchmark uses a wide-ranging set of real-world traces from popular applications and common tasks to fully test the performance of the fastest modern drives. The benchmark is designed to measure the performance of fast system drives using the SATA bus at the low end and devices connected via PCI Express at the high end.
The goal of the benchmark is to show meaningful real-world performance differences between fast storage technologies such as SATA, NVMe, and Intel’s Optane. The Full System Drive Benchmark uses 23 traces, running 3 passes with each trace. It typically takes an hour to run.
Traces used:
- Booting Windows 10.
- Adobe Acrobat – starting the application until usable.
- Adobe Illustrator – starting the application until usable Adobe Premiere Pro – starting the application until usable.
- Adobe Photoshop – starting the application until usable.
- Battlefield V – starting the game until the main menu.
- Call of Duty Black Ops 4 – starting the game until the main menu.
- Overwatch – starting the game until the main menu.
- Using Adobe After Effects.
- Using Microsoft Excel.
- Using Adobe Illustrator.
- Using Adobe InDesign.
- Using Microsoft PowerPoint.
- Using Adobe Photoshop (heavy use).
- Using Adobe Photoshop (light use).
- cp1 Copying 4 ISO image files, 20 GB in total, from a secondary drive to the target drive (write test).
- cp2 Making a copy of the ISO files (read-write test).
- cp3 Copying the ISO to a secondary drive (read test).
- cps1Copying 339 JPEG files, 2.37 GB in total, to the target drive (write test).
- cps2 Making a copy of the JPEG files (read-write test).
- cps3 Copying the JPEG files to another drive (read test).
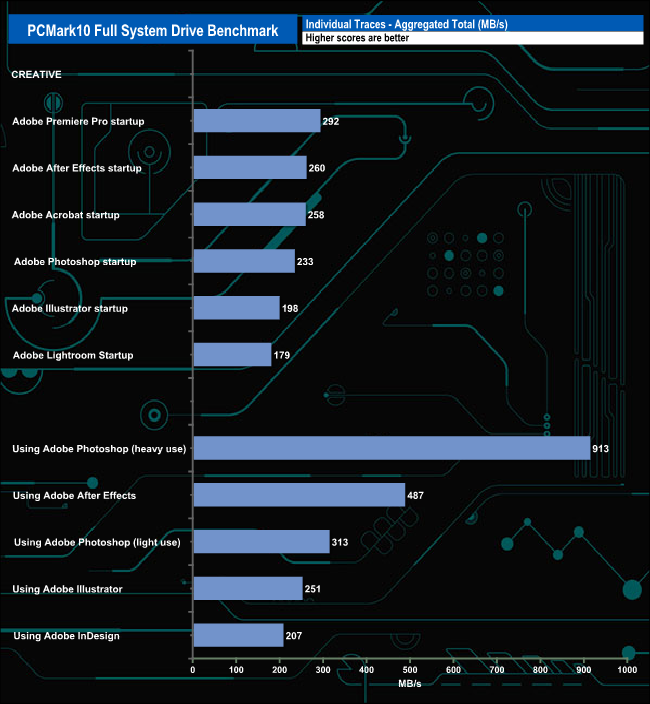
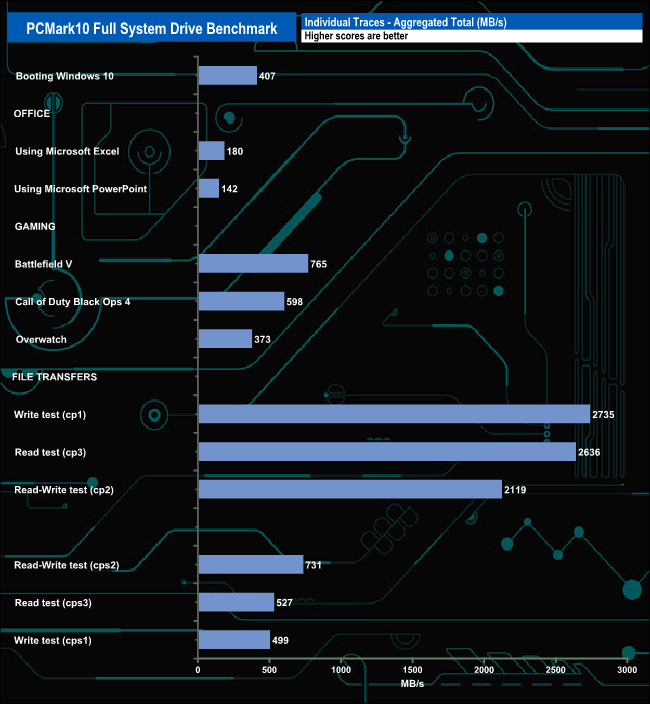
The 1TB P41 Plus averaged 236MB/s for the six Adobe start-up test traces, the fastest being the 292MB/s for the Premier Pro setup. The average for the five usage traces was 434MB/s, the fastest result was the 913MB/s for the Adobe Photoshop heavy usage. When it came to the file transfers, the fastest was the cp1 Write test at 2,735MB/s.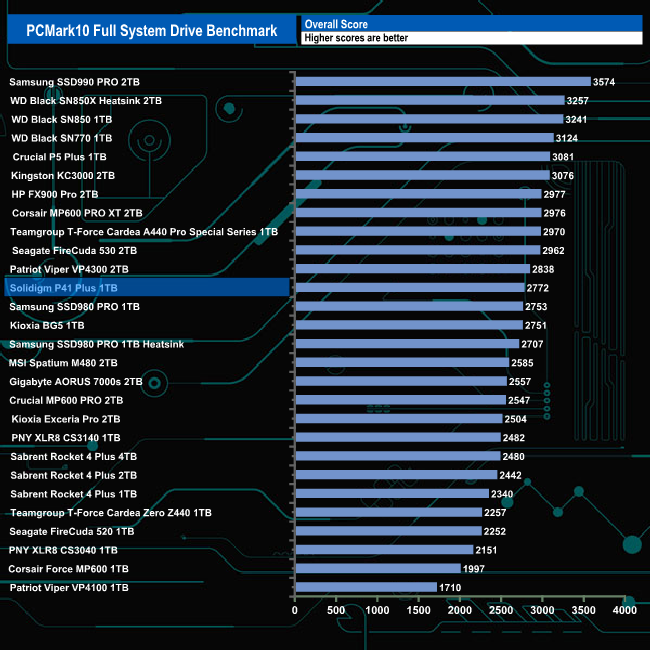
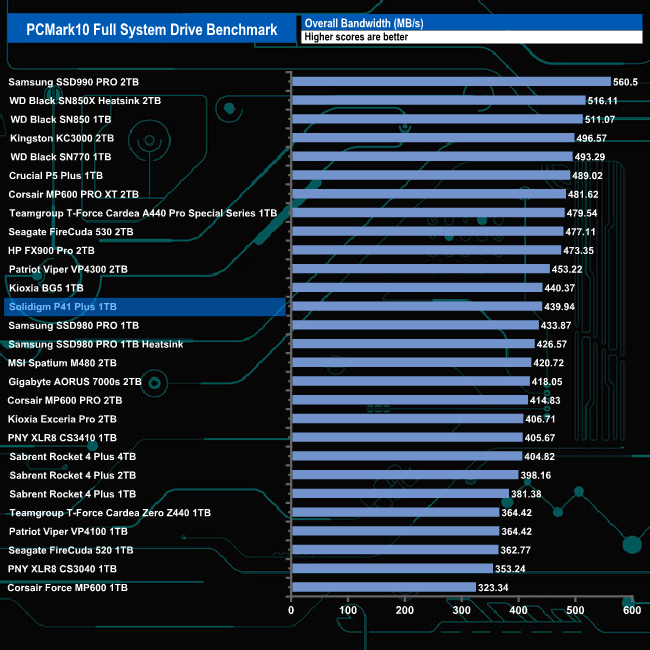
The overall bandwidth figure of 439.94MB/s sees the drive sitting in a mid-table position.
The 3DMark Storage Benchmark uses traces recorded from popular games and gaming-related activities to measure real-world gaming performance.
Traces used –
Battlefield V
Loading Battlefield™ V from launch to the main menu.
Call of Duty Black Ops 4
Loading Call of Duty: Black Ops 4 from launch to the main menu.
Overwatch
Loading Overwatch from launch to the main menu.
Game Move
Copying the Steam folder for Counter-Strike®: Global Offensive from an external SSD to the system drive.
Game Recording
Recording a 1080p gameplay video at 60 FPS with OBS (Open Broadcaster Software) while playing Overwatch®.
Installing Game
Installing The Outer Worlds® from the Epic Games Launcher.
Game Saving
Saving progress in The Outer Worlds game.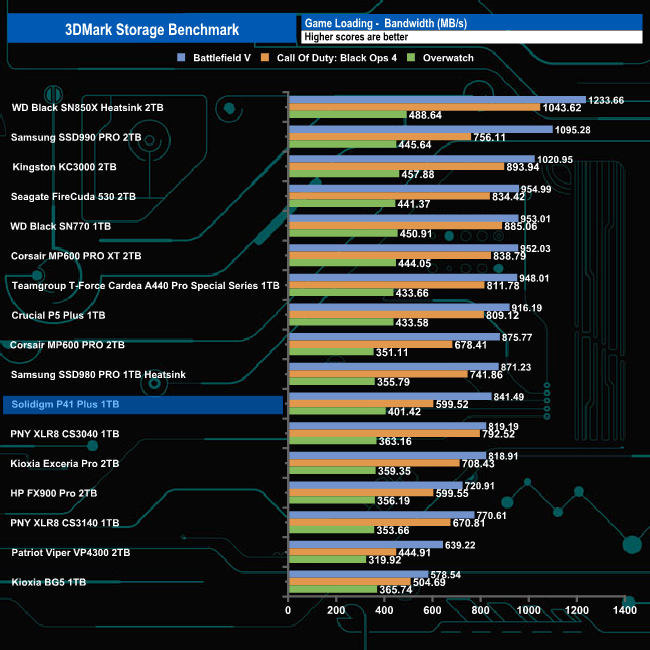
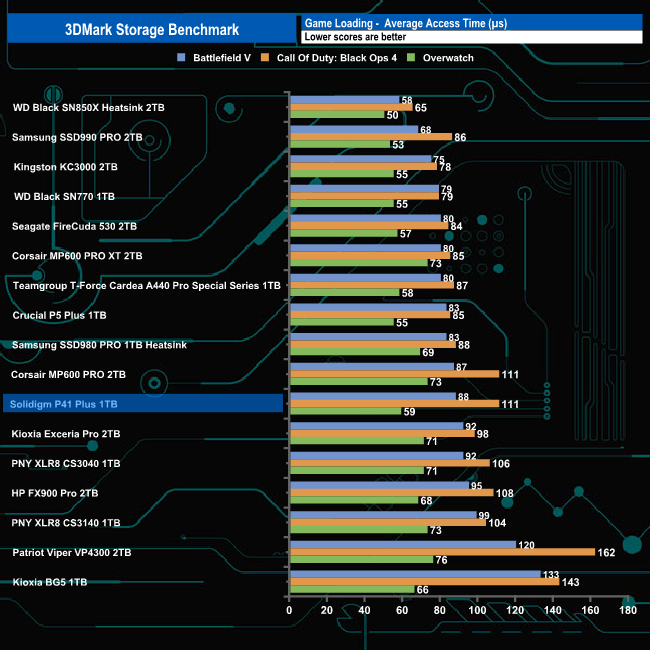
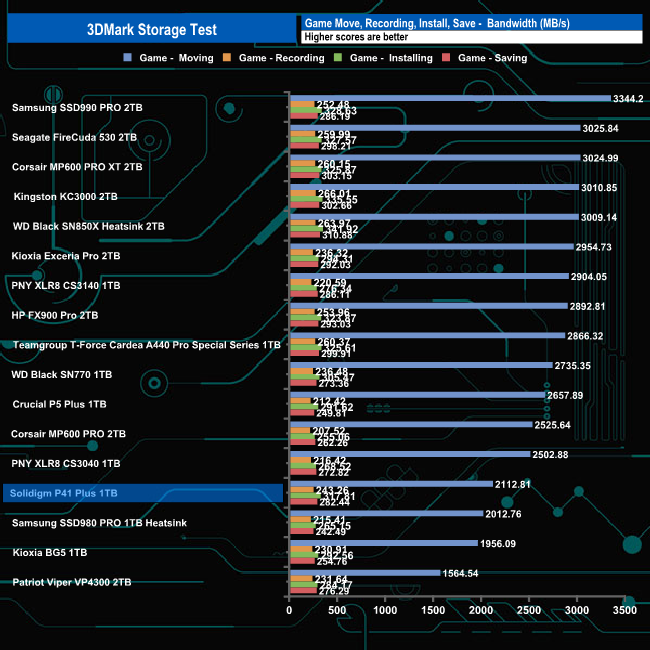
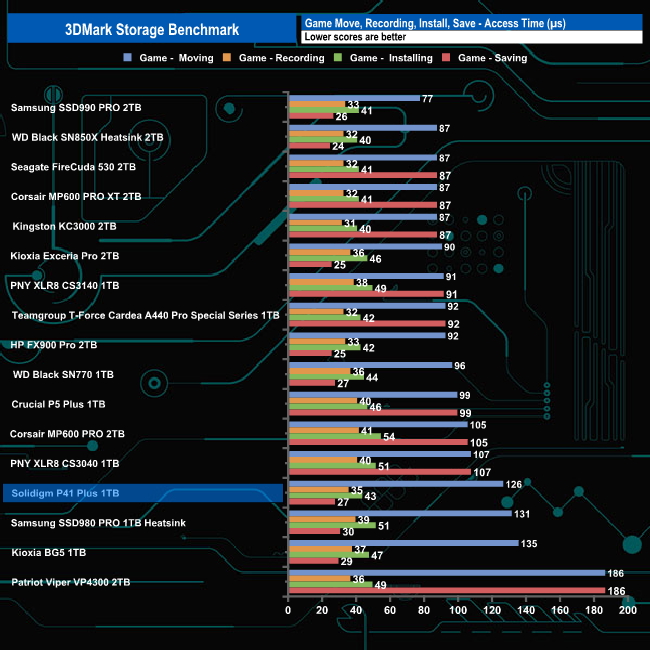
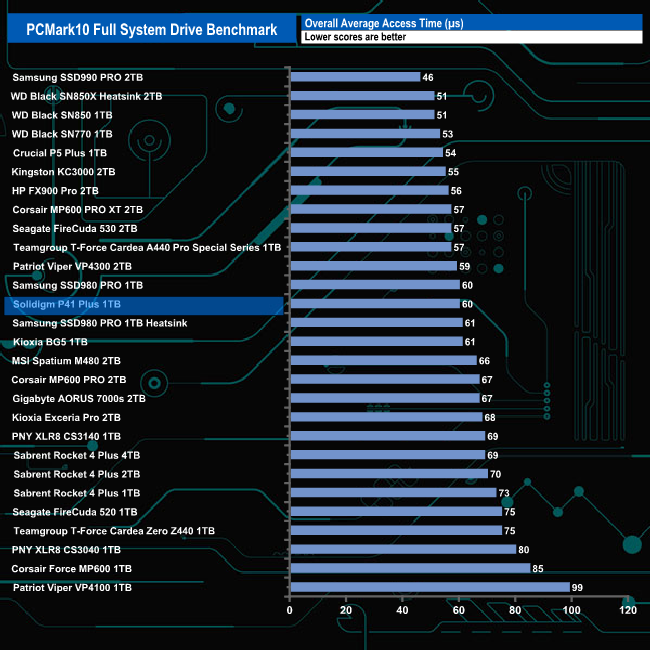
In 3DMark’s Storage Test, the 1TB P41 Plus had an average bandwidth figure of 614MB/s for the three-game load tests (Battlefield V, Call of Duty: Black Ops 4 and Overwatch) with an average access time of 86µs for the same three games.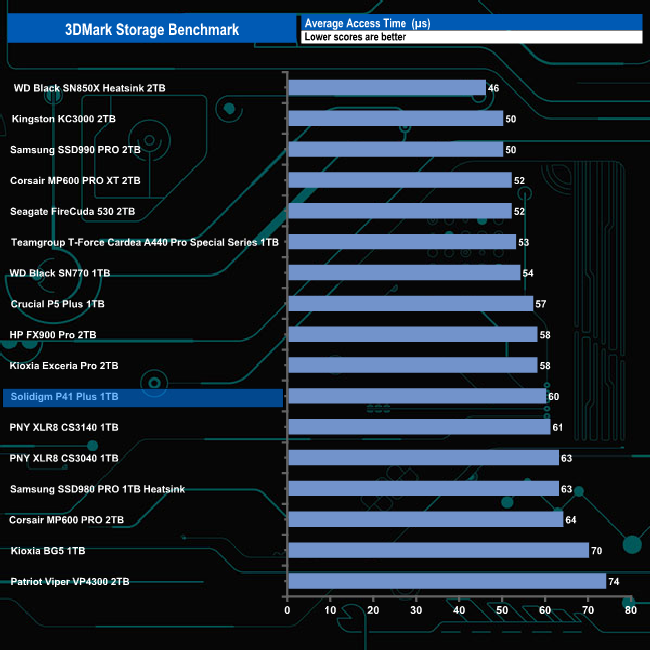
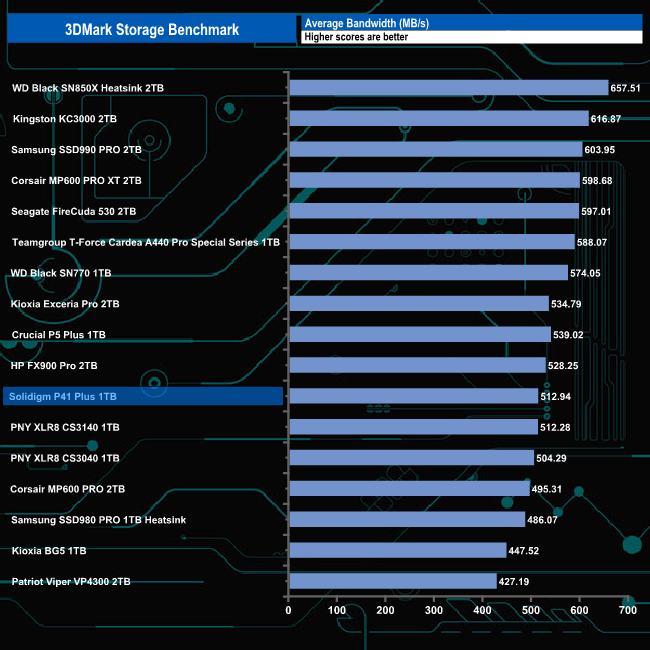
The overall average bandwidth figure of 512.94MB/s for the complete test run puts the drive in the lower half of the results chart.
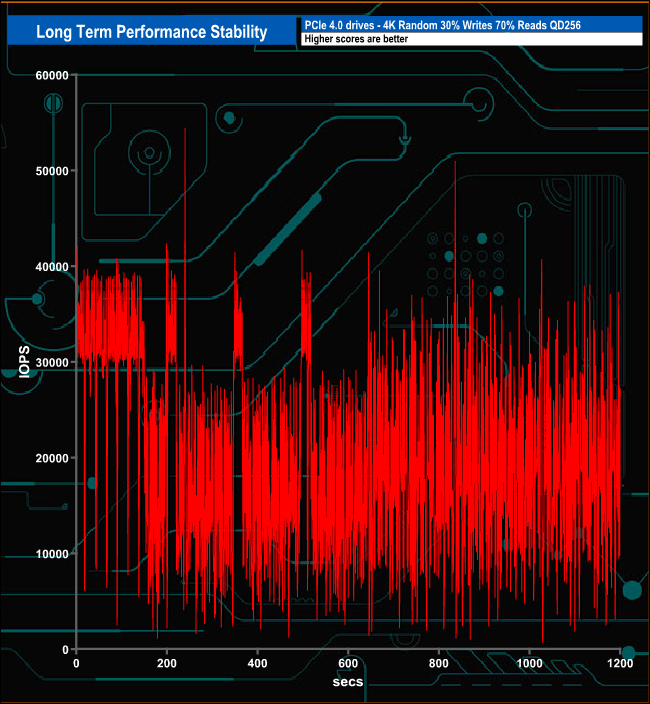
For the long-term performance stability test, we set the drive up to run a 20-minute 4K random test with a 30% write, 70% read split, at a Queue Depth of 256 over the entire disk. The 1TB P41 Plus averaged 20,105 IOPS for the test with performance stability of 51%.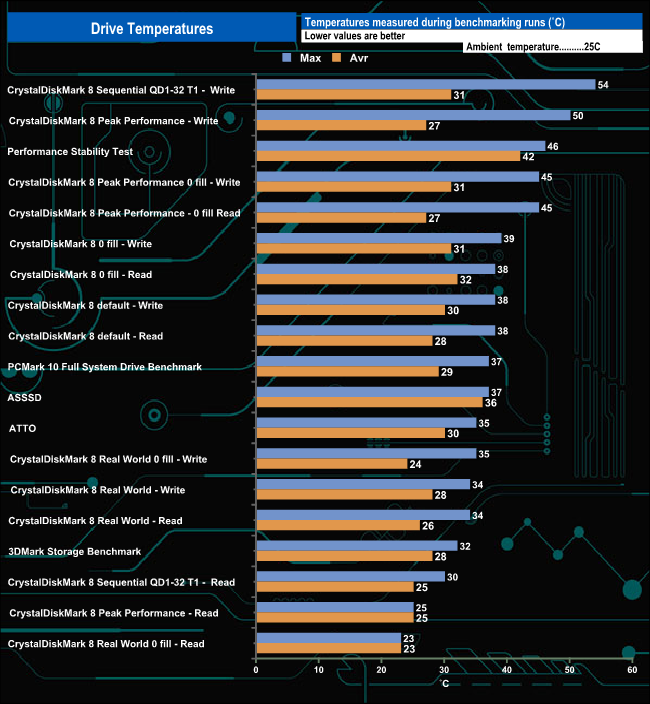
We took note of the drive’s temperature during some of our benchmarking runs. The Solidigm P41 Plus doesn't come with any form of a physical heat sink and Solidigm claim it has been optimised for thermal efficiency and reduced throttling which seems to be confirmed by our test results.
The hottest the drive got was when being pushed extremely hard during repeated runs of the CrystalDiskMark 8 Sequential write tests where the drive got to 54° C, 16° C below the stated maximum of 70° C but there didn't appear to be any throttling issues. For the bulk of our testing, the temperature averaged around 35° C, well below that 70° C maximum operating temperature.
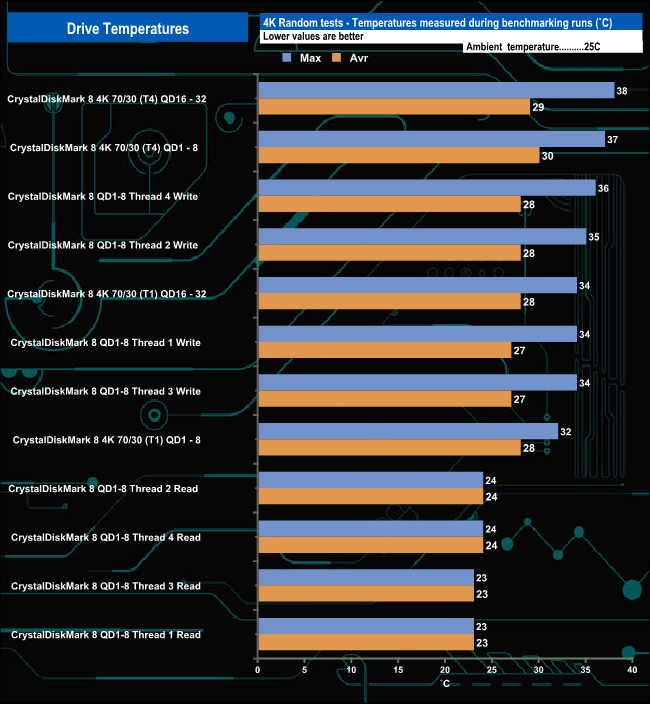
During the dedicated 4K random testing, the drive averaged 26° C. The hottest the drive got under this series of tests was the 38° C seen during the 4K 70/30 read/write mix test at QD's 16-32 using four threads.
To test real-life performance of a drive we use a mix of folder/file types and by using the FastCopy utility (which gives a time as well as MB/s result) we record the performance of the drive reading from & writing to a 256GB Samsung SSD850 PRO.
- 100GB data file.
- 60GB iso image.
- 60GB Steam folder – 29,521 files.
- 50GB File folder – 28,523 files.
- 21GB 8K Movie demos.
- 12GB Movie folder – 24 files (mix of Blu-ray and 4K files).
- 11GB 4K Raw Movie Clips (8 MP4V files).
- 10GB Photo folder – 621 files (mix of png, raw and jpeg images).
- 10GB Audio folder – 1,483 files (mix of mp3 and .flac files).
- 5GB (1.5bn pixel) photo.
- Blu-ray movie
![]()
![]()
The Solidigm P41 Plus averaged 535MB/s for writes when dealing with the larger file size transfers and 448MB/s when reading the data back. It's not quite as efficient when dealing with smaller file sizes, averaging 280MB/s for writes and 394MB/s for reads.
To get a measure of how much faster PCIe NVMe drives are than standard SATA SSD's we use the same files but transfer to and from a 2TB Kioxia Exceria Plus drive.![]()
![]()
Writing to and reading from an NVMe drive saw transfer speeds rocket and overall transfer times dropped dramatically as you might expect. Nine of the transfers topped over 2GB/s when writing to the drive with three, the BluRay movie, 5GB image and the 12GB Movie folder going over 2.9GB/s. Of the remaining four tests, three topped 1GB/s with the slowest being the 50GB file folder. The fastest read speed was 2.800MB/s when dealing with the 8K Movie scenes folder.
Solidigm came into being at the end of 2021 as a result of SK Hynix's acquisition of Intel's SSD business and the Dalian NAND flash facility in China. The P41 Plus is the first Solidigm-branded SSD to be launched and is aimed at the ever-growing and increasingly competitive value end of the PCIe Gen 4 market.
The P41 Plus is built around a 4-channel controller and QLC NAND. The controller is a Silicon Motion SM2269XT. Built on a 12nm process using a dual-core ARM R8 CPU, the DRAM-less SM2269XT (it uses Host Memory Buffer technology) uses a 7mm x 11mm package and is the company's mainstream PCIe Gen4 controller. It supports four 1,600MT/s NAND channels and can be used with either TLC or QLC NAND.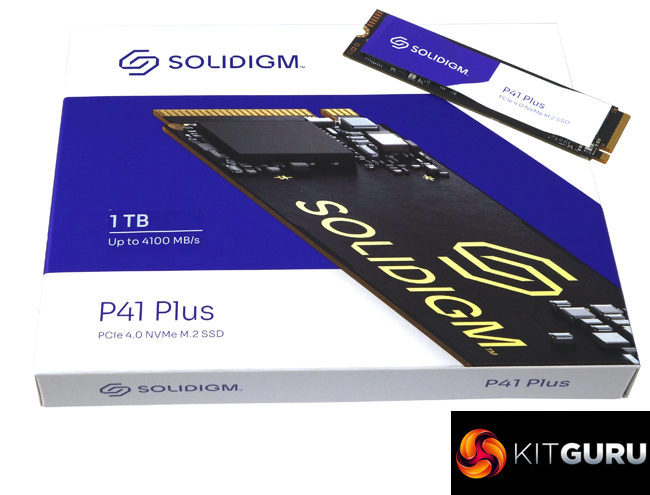
Solidigm rates the Sequential performance of the 1TB drive as up to 4,125MB/s for reads and up to 2,950MB/s for writes. Using both the ATTO (3,860MB/s reads, 2,780MB/s writes) and AS-SSD (3,530MB/s reads, 2,580MB/s writes) benchmarks we couldn't confirm those official maximums. However, using the default CrystalDiskMark 8 test we could confirm the official figures with test results of 4,191MB/s and 2,966MB/s for reads and writes respectively.
When it comes to 4K random performance the 1TB P41 Plus is officially rated as up to 225,000 IOPS for reads and 520,000 IOPS for writes. With our 4-threaded tests, we could confirm the random read figure with a test score of 226,160 IOPS but fell well short of the official write figure with a best test result of 247,641 IOPS. Using the Peak Performance profile in CrystalDiskMark 8 we could once again confirm the official read maximum with a test result of 226,615 IOPS (default-test) but once again fell short of the maximum official write figure but this time not by much with a test result of 514,222 IOPS (0 fill test).
We found the 1TB Solidigm P41 Plus on CCL Computers for £70.20 (inc VAT) HERE.
Discuss on our Facebook page HERE.
Pros:
- Solid Sequential performance.
- Solidigm Storage Tool.
- Competitive Pricing.
Cons:
- DRAM-less design.
- Not the fastest Gen4 drive we've seen.
KitGuru says: Solidigm's first branded Gen4 drive performs pretty well for the market segment it is aimed at and is competitively priced and it needs to be as it's entering a segment that is rapidly becoming very competitive.