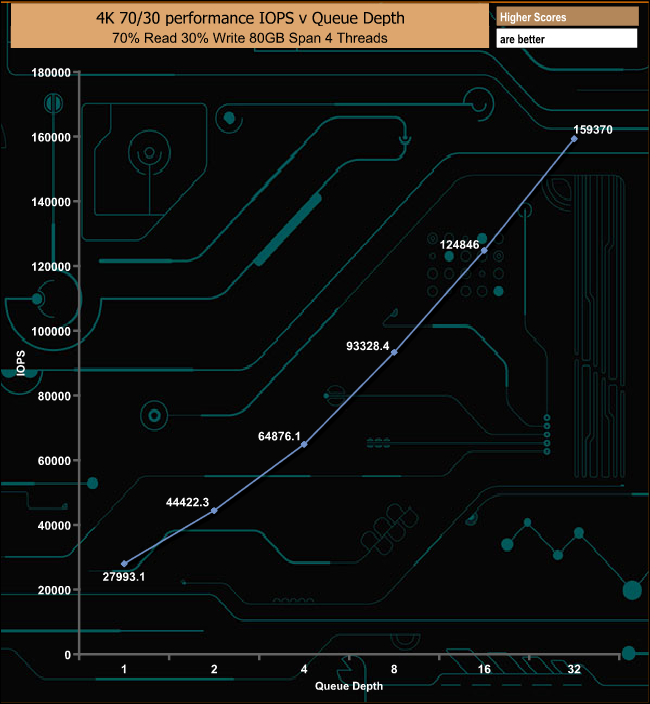
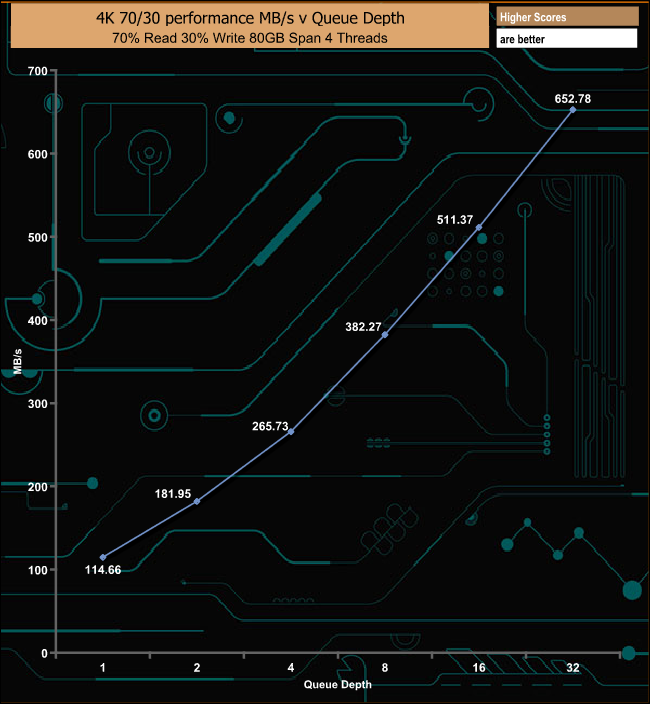
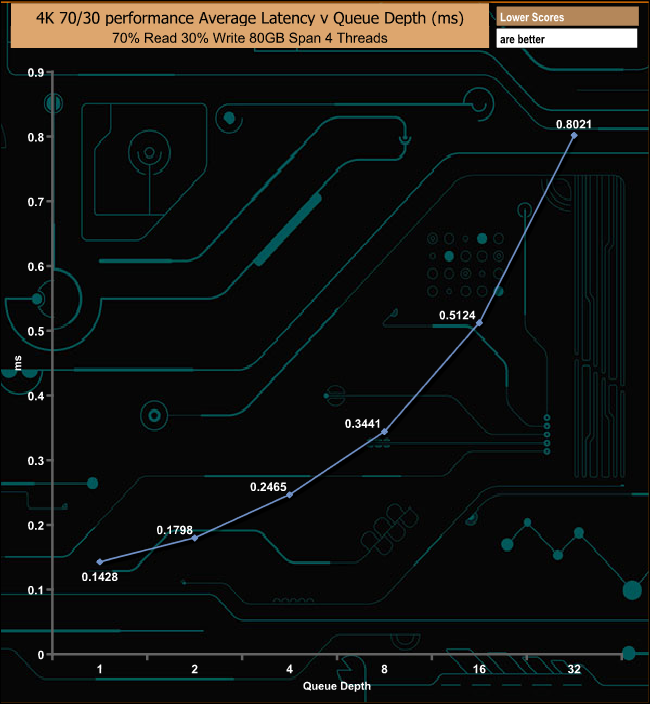
One of the leading lights in the NAS device world, Synology, now have their own NVMe M.2 SSD range - the 400GB SNV3000 series. Designed to be used as a cache drive in their NAS devices, the M.2 22110 SNV3500 SNV3400-400G comes with power loss protection, while the SNV3400-400G built on the more familiar M.2 2280 format, does not have such protection. The drives use a combination of the enterprise edition (DC) of one of the most popular current PCIe 3.0 controller's, Phison's PS5012-E12 and Kioxia BiCS3 64-layer 3D TLC NAND. Synology rate both the SNV3400-400G and the SNV3500 as up to 3,100MB/s (QD32) for Sequential reads and up to 550MB/s (QD32) for writes. Random read/write performance is quoted as up to 205,000 IOPS and 40,000 IOPS respectively at a QD of 256. Typical power consumption figures for the SNV3400-400G are; 3.2W for both active read and writes with a 2W idle rating while the SNV3500-400G figures are; 3.7W typical active read, 3.4W typical active write and again a 2W idle rating. Synology rates the endurance of the SNV3400-400G as 500TB TBW (works out at around 0.68 DWPD) and supports the drive with a 5-year warranty. Physical Specifications: Usable Capacities: 400GB. NAND Components: Kioxia BiCS3 64-layer 3D TLC NAND. NAND Controller: Phison PS5012-E12DC. Cache: 4GB DDR4. Interface: PCIe 3.0 x4, NVMe. Form Factor: M.2 2280. Dimensions: 22 x 80 x 3.5mm. Firmware Version: ECEM12.4. Synology's SNV3400-400G comes in a compact box, free of any images of the drive, not surprising as the drive is labelled as an enterprise drive. On the right-hand side of the box front is a panel with three bullet points about the drive; Consistent performance, validated compatibility and minimum service disruption. On the left-hand side under the product name is a line informing that the drive is for Synology servers. At the bottom of the box is a band displaying the drives capacity and the fact it's one of the SNV3400 series. The back of the box displays warranty information and repeats the capacity and product family information. The SNV3400-400G is built on a dual-sided M.2 2280 format. One side of the PCB houses the Phison PS5012-E12DC controller, two 128GB packages of Kioxia BiCS3 64-layer TLC NAND (coded TA7AG55A IV) and a single 4GB DDR4 (SK Hynix H5AN4G8NBJR) cache IC. The other side of the PCB just houses two more NAND packages. The DC is the enterprise optimised version of Phison's 2nd generation PS5012-E12 8-channel PCIe NVMe SSD controller. Built on a 28mn process the controller supports Phison's 3rd generation LPDC EEC correction engine, AES 256 bit hardware-based encryption and end to end data protection. For testing, the drives are all wiped and reset to factory settings by HDDerase V4. We try to use free or easily available programs and some real-world testing so you can compare our findings against your own system. This is a good way to measure potential upgrade benefits. Main system: AMD Ryzen 5 3600X, 16GB DDR4-2400, Sapphire R9 390 Nitro and an MSI MPG X570 Gaming Edge Wifi motherboard Other drives: Corsair Force MP500 480GB Gigabyte Aorus RGB 512GB Intel Optane SSD900P 480GB Intel Optane SSD905P 480GB Intel SSD760p 512GB Kingston A1000 480GB Kioxia RD400 512GB Kioxia RC500 500GB Lexar NM600 480GB Lexar NM610 500GB Plextor M9Pe(Y) 512GB Plextor M8PeG 512GB Western Digital Blue SN500 500GB Western Digital Black PCIe 512GB Software: Atto Disk Benchmark 4. CrystalMark 7.0.0. AS SSD 2.0. IOMeter. Futuremark PC Mark 8 All our results were achieved by running each test five times with every configuration this ensures that any glitches are removed from the results. Trim is confirmed as running by typing fsutil behavior query disabledeletenotify into the command line. A response of disabledeletenotify =0 confirms TRIM is active. CrystalDiskMark is a useful benchmark to measure theoretical performance levels of hard drives and SSD’s. We are using versions 6.0 and 7.0. Synology's SNV3400-400G's performance in CrystalDiskMark’s deeper queue depth 4K test leaves it the bottom half of the results chart. From looking at the two benchmark result screens, it seems that the controller has a preference for handling compressible data. Using this type of data sees a big boost in the random read performance at queue depths 1 (1 thread) and 32 (8 threads). In the QD1 test, the read performance of the drive leaves it at the bottom of the result charts. However, its write performance at this queue depth is much better than its read. The latest version of CrystalDiskMark, version 7, includes a couple of profiles that can be used for testing – Peak Performance and Real World. The result screens for these two profiles not only display MB/s results but also IOPS and latency. Looking at the Peak Performance results for Sequential read/write performance we could confirm the official 3,100MB/s and 550MB/s respectively. When tested using the default test, the drive produced a read figure of 3,413MB/s with writes at 609MB/s, both bettering the official ratings. When it comes to random performance the SNV3400-400G is rated as up to 205,000 IOPS for reads and up to 40,000 IOPS for writes (at QD256). The CrystalDiskMark test runs at a shallower QD and the best read figure we saw was 285,578 IOPS when using compressible data while the best write figure of 143,086 IOPS came when testing at the benchmarks default settings. We also used CrystalDiskMark 7 to test the drive at lower queue depths (where most of the everyday workloads occur) using 1 to 4 threads. The random read performance climbs smoothly through each of the tested queue depths apart from the 4-threaded test when the performance dips a little at QD2 before recovering and carrying on climbing through the remaining queue depths. In the write tests, after initial climbs, though queue depths 1 and 2, the drive displays very consistent performance through queue depths 4 and 8. The ATTO Disk Benchmark performance measurement tool is compatible with Microsoft Windows. Measure your storage systems performance with various transfer sizes and test lengths for reads and writes. Several options are available to customize your performance measurement including queue depth, overlapped I/O and even a comparison mode with the option to run continuously. Use ATTO Disk Benchmark to test any manufacturers RAID controllers, storage controllers, host adapters, hard drives and SSD drives and notice that ATTO products will consistently provide the highest level of performance to your storage. We are using version 4.0 for our NVMe disk tests. When the review SNV3400-400G was tested with the ATTO benchmark we could confirm the official Sequential read/write figures of up 3,100MB/s and 550MB/s respectively as the drive produced a read figure of 3,180MB/s with writes coming in at 579MB/s. AS SSD is a great free tool designed just for benching Solid State Drives. It performs an array of sequential read and write tests, as well as random read and write tests with sequential access times over a portion of the drive. AS SSD includes a sub suite of benchmarks with various file pattern algorithms but this is difficult in trying to judge accurate performance figures. Although designed as a cache drive, when tested with the AS-SSD benchmark the SNV3400-400G's read score of 1428 was good enough to fill the 5th slot in our results chart for 400GB-500GB class drives. IOMeter is another open-source synthetic benchmarking tool which is able to simulate the various loads placed on the hard drive and solid-state drive technology. There are many ways to measure the IOPS performance of a Solid State Drive, so our results will sometimes differ from the manufacturer’s quoted ratings. We do test all drives in exactly the same way, so the results are directly comparable. We test 128KB Sequential read and write and random read and write 4k tests. The test setup’s for the tests are listed below. Each is run five times. 128KB Sequential Read / Write. Transfer Request Size: 128KB Span: 8GB Thread(s): 1, Outstanding I/O: 1-32 Test Run: 20 minutes per test. 4K Sustained Random Read / Write. Transfer Request Size: 4KB Span: 80GB Thread(s): 4, Outstanding I/O: 1-32 Test Run: 20 minutes per test 4K Random 70/30 mix Read/Write. Transfer Request Size: 4KB Span: 80GB Reads: 70% Writes: 30% Thread(s): 4 Outstanding I/O: 2 – 32 Test Run: 20 minutes. When we tested the drive with our own Sequential tests, it produced a peak read figure of 2,030.47MB/s (QD32), some way short of the official 3,100MB/s. Tested writes on the other hand at a peak of 638.69MB/s (QD2) exceeded the official 550MB/s. 128KB Sequential Read v QD Performance Comparison. The drive's performance in relation to the drives around it in our result chart's is pretty consistent although it does drop back at QD4 but recovers pretty quickly. 128KB Sequential Write v QD Performance Comparison. Although it sits at the bottom of the charts throughout the tested queue depths, with the exception of QD1 (535.94MB/s), the SNV3400-400G produces faster speeds than the official 550MB/s. With our 4-threaded 4K random read test, the best figure we saw was 200,197 IOPS (QD32), a little short of the official 205,000 IOPS (QD256). 4K Random Read v QD Performance Compared. The SNV3400-400G maintains its mid-table position in our results chart throughout the test run. The official 4K random write figure of 40,000 IOPS came with the drive tested at a queue depth of 256. We test at a lot shallower queue depths so our results are a good deal higher than the official one. The best we saw from the drive was 104,189 IOPS at a queue depth of 8. 4K Random Write v QD Performance Compared. When it comes to 4K random write performance, the SNV3400-400G shows very good consistency through the tested queue depths. The Synology SNV3400-400G handles our 70/30 read/write mixed test reasonable well, reaching 159,370 IOPS (652.78MB/s) at QD32 where the test run ends. In our throughput test, the SNV3400-400G peaks at the end of the test at 2,281.54MB/s, some way short of the official 3,100MB/s. In the write throughput test, the drive peaks at the 256KB block mark at 700.83MB/s, some 150MB/s faster than the official rating of 550MB/s, before slowly dropping back to finish the test run at 610MB/s. The PCMark 10 Full System Drive Benchmark uses a wide-ranging set of real-world traces from popular applications and common tasks to fully test the performance of the fastest modern drives. The benchmark is designed to measure the performance of fast system drives using the SATA bus at the low end and devices connected via PCI Express at the high end. The goal of the benchmark is to show meaningful real-world performance differences between fast storage technologies such as SATA, NVMe, and Intel’s Optane. The Full System Drive Benchmark uses 23 traces, running 3 passes with each trace. It typically takes an hour to run. Traces used: Booting Windows 10. Adobe Acrobat – starting the application until usable. Adobe Illustrator – starting the application until usable Adobe Premiere Pro – starting the application until usable. Adobe Photoshop – starting the application until usable. Battlefield V – starting the game until the main menu. Call of Duty Black Ops 4 – starting the game until the main menu. Overwatch – starting the game until the main menu. Using Adobe After Effects. Using Microsoft Excel. Using Adobe Illustrator. Using Adobe InDesign. Using Microsoft PowerPoint. Using Adobe Photoshop (heavy use). Using Adobe Photoshop (light use). cp1 Copying 4 ISO image files, 20 GB in total, from a secondary drive to the target drive (write test). cp2 Making a copy of the ISO files (read-write test). cp3 Copying the ISO to a secondary drive (read test). cps1Copying 339 JPEG files, 2.37 GB in total, to the target drive (write test). cps2 Making a copy of the JPEG files (read-write test). cps3 Copying the JPEG files to another drive (read test). The best performance in PCMark 10's Full System Drive Benchmark creative group of tests of was the 392MB/s from the Adobe Photoshop heavy use test trace while the SVN3400-400G also showed a surprisingly strong result of 516MB/s in the Battlefield V game test. Best performance in the file transfer tests was the 1,694MB/s for the cp3 read test. For the long term performance stability test, we set the drive up to run a 20-minute 4K random test with a 30% write, 70% read split, at a Queue Depth of 256 over the entire disk. The 400GB SNV3400-400G averaged 123,560 IOPS for the test with a performance stability of 79%, which the sort of figure want you'd want to see from a cache drive. To test real life performance of a drive we use a mix of folder/file types and by using the FastCopy utility (which gives a time as well as MB/s result) we record the performance of drive reading from & writing to a 256GB Samsung SSD850 PRO. We use the following folder/file types: 100GB data file. 60GB iso image. 60GB Steam folder – 29,521 files. 50GB File folder – 28,523 files. 12GB Movie folder – (15 files - 8 @ .MKV, 4 @ .MOV, 3 @ MP4). 10GB Photo folder – (304 files - 171 @ .RAW, 105 @ JPG, 21 @ .CR2, 5 @ .DNG). 10GB Audio folder – (1,483 files - 1479 @ MP3, 4 @ .FLAC files). 5GB (1.5bn pixel) photo. BluRay Movie - 42GB. 21GB 8K Movie demos - (11 demos) 16GB 4K Raw Movie Clips - (9 MP4V files). 4.25GB 3D Printer File Folder - (166 files - 105 @ .STL, 38 @ .FBX, 11 @ .blend, 5 @ .lwo, 4 @ .OBJ, 3@ .3ds). 1.5GB AutoCAD File Folder (80 files - 60 @ .DWG and 20 @.DXF). Our real-life file transfers didn’t cause the Synology SNV3400-400G any real problems. It was very consistent when writing the larger file sizes to disk. It also handled the small bity files of the 10GB Audio, 50GB file and 60GB Steam folders reasonable well. To get a measure of how much faster PCIe NVMe drives are than standard SATA SSDs we use the same files but transfer to and from a 512GB Toshiba OCZ RD400: Using the NVMe drive to transfer the files to and from the SNV400-400G saw the read speeds dramatically increase while the write speeds increase was very small in comparison, but the performance was still very consistent when dealing with the larger file sizes. Synology has a number of NAS devices in its Plus range that support SSD caching via M.2 ports. When these were first introduced, they only supported SATA M.2 drives but more recent models have brought with them support for drives using NVMe architecture. Until now that meant using a 3rd party drive that met Synology's compatibility criteria. But now with the SNV3000 series, Synology has an SSD that is tailor-made for dealing with demanding cache workloads in the company's NAS devices. Currently (at the time of writing) Synology's SNV3000 range comprises just two drives, the SNV3400-400G we are looking at here built on an M.2 2280 format, and the SNV3500 which is an M.2 22110 drive. Both models are 400GB in capacity. The reason for the SNV3500's longer PCB is that it comes with power loss protection and the extra space is to hold the dedicated power-loss capacitors. At the heart of the drives is a Phison PS5012-E12DC controller. The DC is the enterprise-focussed version of Phion's very widely used chip. This is used in combination with four 128GB packages of Kioxia BiCS3 64-layer TLC NAND. The drives can be fitted to compatible Synology NAS boxes, or if the NAS doesn't have M.2 port but does have a PCIe x8 slot, either Synology's E10M20-T1 or M2D20 PCIe adapter cards. The E10M20-T1 is a dual 22110 / 2280 port M.2 SSD & 10GbE combo adapter card while the M2D20 just supports a pair of M.2 22110 / 2280 drives. As for performance, Synology rate the Sequential performance of the SNV3400-400G (the SNV3500 is the same) as up to 3,100MB/s for reads and up to 550MB/s for writes. Both figures come from the drives being tested at a queue depth of 32. Using the ATTO benchmark we could confirm those figures as the tested drive produced a read performance of 3,180MB/s, with writes at 579MB/s. Synology rate the random 4K performance of the drive as up to 205,000 IOPS for reads and up to 40,000 IOPS for writes, both figures achieved from testing at a queue depth of 256. Our standard 4-threaded 4K tests are run at a much shallower QD, the best read figure we saw was 200,197 IOPS (QD32) with the best write performance at 104,189 IOPS (QD8). When it comes to typical power consumption, Synology rate the SNV3400-400G as 3.2W for active reads and writes while the power loss protected SNV3500-400G is a little higher at 3.7W active reads and 3.4W active writes. Both drives are rated at 2W idle. The TBW endurance of the SNV3000 series is quoted as 500TB (which works out at around 0.68 DWPD) and Synology backs the drives with a 5-year warranty. We found the Synology SNV3400-400G on Span.com for £164.40 (inc VAT) HERE. The SNV3500-400G costs £189.60. Discuss on our Facebook page HERE. Pros Sequential read performance. Optimised for NAS use. Endurance. Cons Single low capacity choice (at the time of writing). Pricey. KitGuru says: As Synology offer NAS devices with M.2 slots supporting NVMe SSDs for use as cache drives, it makes perfect sense for the company to add M.2 NVMe SSDs designed for such a purpose to their product line-up.