 KitGuru KitGuru.net – Tech News | Hardware News | Hardware Reviews | IOS | Mobile | Gaming | Graphics Cards


MSI Afterburner developer “Unwinder” has revealed an upcoming beta release featuring a voltage and frequency curve editor heat map. This new tool allows users to record and visualize how Nvidia GeForce RTX graphics cards scale their clock speeds and voltage levels in real time.
Brought to our attention by Uniko's Hardware and VideoCardz, the developer of MSI Afterburner launched beta 4 of v4.6.7 of its overclocking tool. To access the heat map, users must press “M” within the editor to show the Nvidia GPU Boost algorithm navigating its predefined frequency-scaling points. The utility uses yellow gradients to highlight the most frequently hit voltage and frequency targets. Below, you can see the data captured for both the GeForce RTX 5090 and GeForce RTX 4090, highlighting clear generational differences in V/F scaling:
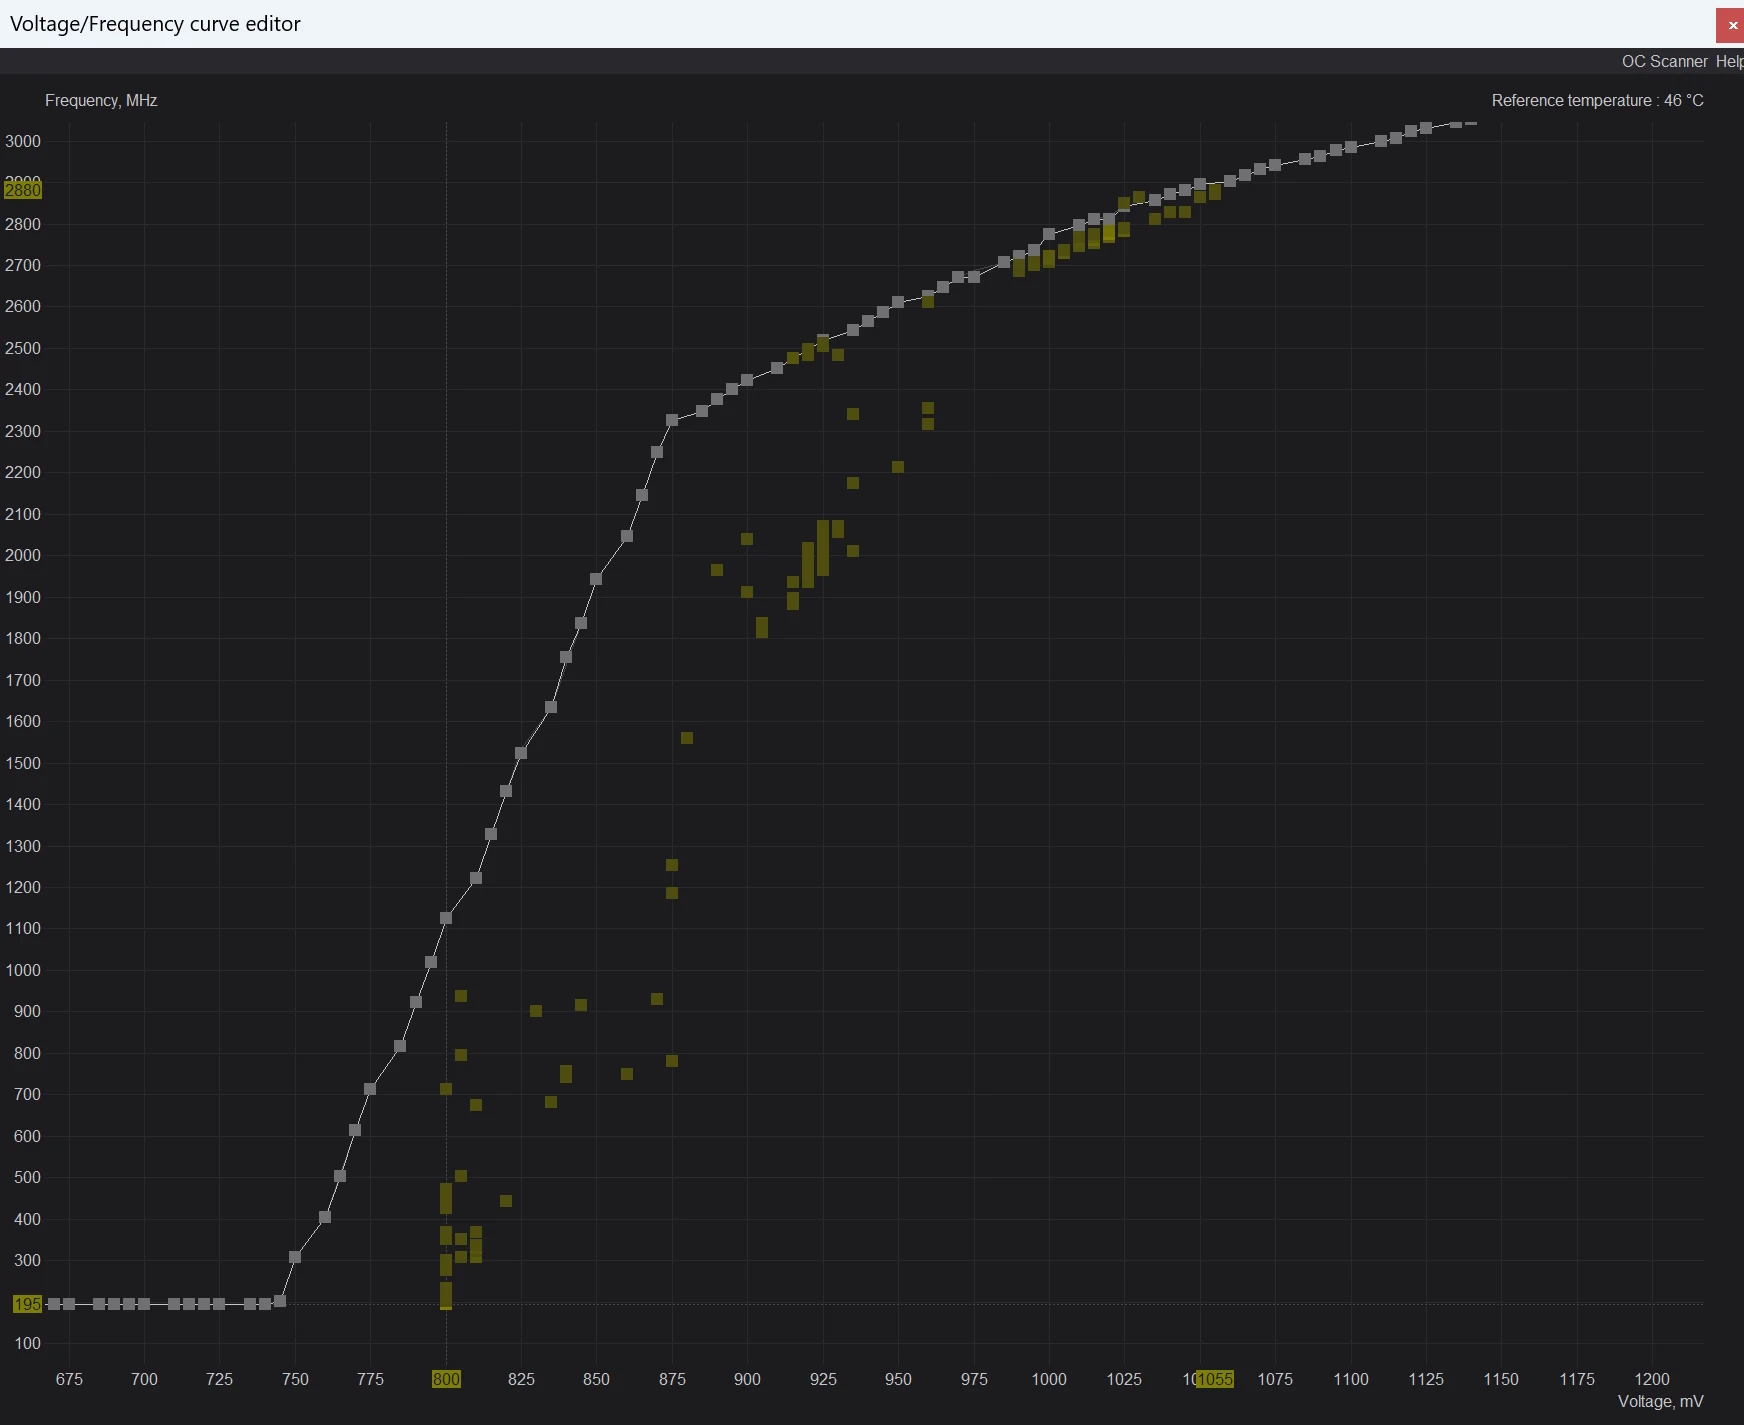
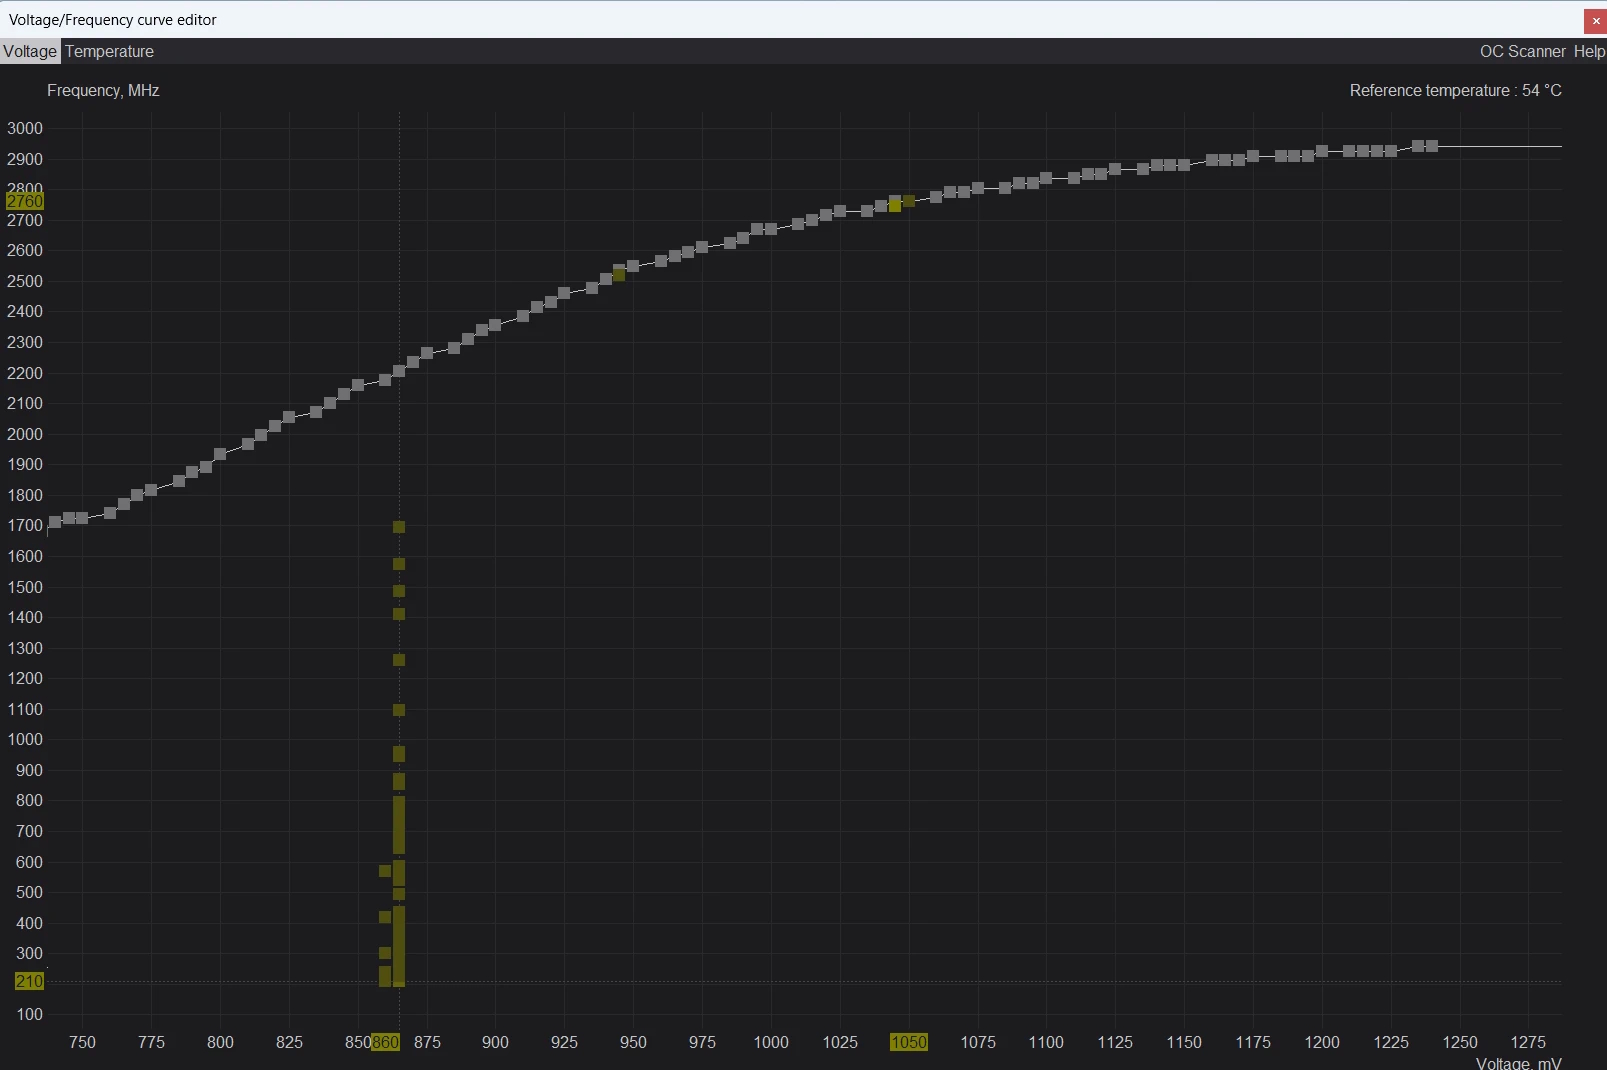
Image credit: Unwinder (Guru3D)
Unwinder noted that Nvidia introduced significant changes to dynamic voltage and frequency scaling (DVFS) starting with its Blackwell architecture. While older architectures jumped directly between target V/F points without using intermediate values, Blackwell handles transitions along a more gradual curve, switching its V/F targets considerably faster.
KitGuru says: This update should provide overclockers with much finer insights into how different GPU architectures behave. Will you download the new beta version of Afterburner, or wait for the new feature to reach the stable branch?