

Testing methodology
To get accurate data from comparing various fan configurations, it was very important I devised a scientific and easily repeatable test. Most importantly, however, any test would have to be relevant to the average consumer – so using a £5,000 custom watercooled PC would not have been the smartest move, for example.
Accordingly, I devised a simple test where the only changing variable was the number of fans used, or how they were mounted. Here's what I did:
First, I built the system for testing in the Kolink Aviator V chassis. This case features three fans out-of-the-box, with two fans intaking at the front of the chassis. This means the components are supplied with a high level of air. In the system I used an Intel i7-5820K, MSI X99A SLI Plus motherboard, 16GB of Panram Ninja V DDR4, a Sapphire R9 285 ITX GPU, an OCZ Trion SSD and a Corsair RM750x PSU.
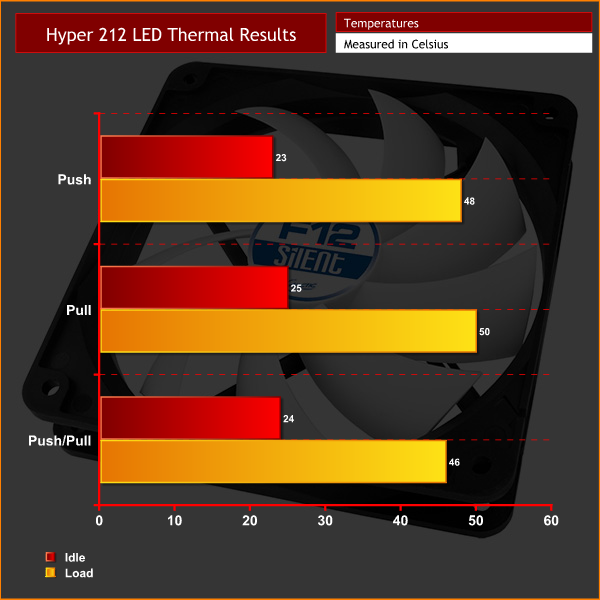
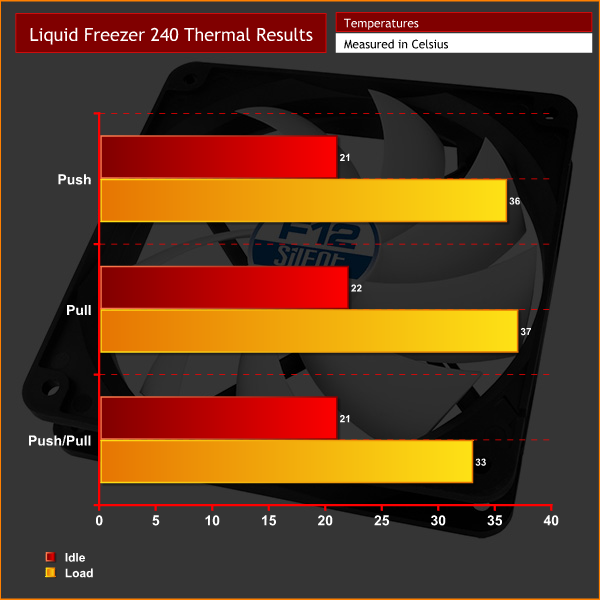
As for the all-important CPU cooler, I decided to pick two – the Cooler Master Hyper 212 LED air cooler, as well as the Arctic Liquid Freezer 240 all-in-one liquid cooler. This way we can assess whether fan configuration makes much difference whether you are using a radiator or a more typical heatsink tower.
For the Hyper 212 LED, I used CoolerMaster's Air Balance 120mm fans for this test. I used the included F12 fans for the Liquid Freezer 240.
In terms of actual testing, I performed three tests per cooler – obviously testing out push, pull and push/pull fan configurations. To get a temperature reading, I ran Prime 95's (version 26.6) Small FFTs test for 10 minutes before noting down the maximum CPU temperature. I also used an NZXT Grid+ V2 fan controller to lock all the system's fans – CPU and chassis fans – to 50% speed, ensuring PWM control does not influence the testing today.
Results
Well if your within a few c of your cpus maximum temperature your cooling is either insufficient or your overclock is too high
I’ve got my PC (4770k @4.5GHz + 970) setup with a slightly positive interior pressure, and have found this works best for me. I use 2 140mm Fractal R3’s in the front and 1 120mm on the bottom (wood floor, plenty of room) for intake, 1 140 in the back and 2 120’s + radiator on top for exhaust. All inside the Define R5. Use a Lepa something or other AIO. Seeing max temps around 66C on the CPU. Not bad imo.
3770K stock with corsair h75 push pull config with noctua nt-h1 thermalpaste, 65-72 celsius under 100%load, room temp 20C.
I always ask myself a thing when i read about cooler testing: if Amd FX 9590 is the hottest cpu, why use Intel ?
Using a double thickness 240mm with push I get 45C under full load on a 3770.
The difference is mostly just from the flow patterns inside the cooler, higher flowrates change how the air moves within the cooler allowing it to transfer more heat. Basically all that stuff on turbulent or laminar flow and Reynolds number you learned at school.
shouldnt need to test its pretty obvious when it comes to physics push > pull and push/pull > push with just 1 fan.
I agree, a 9590 is a higher heat load but more people use Intel products so this wold be more relatable, and with this being an older HED chip, it would be more likely more people would be running something like this. There is a valid argument either way
Use an infra-red temperature meter (eg in-ear body temperature gadget is what I use). Then work out which parts of the computer are at which temperatures.
Then, using the push-fan, direct the cold intake air towards those hot units: cpu, gpu, hdd, power-supply, etc. I used cut-pieces of (plastic) cola bottles to direct this flow. The dvantage of push-fan is the use of an air-filter to prevent dust rubbish moving into the computer.
Any other air-leaks were sealed with tape & putty-stuff (post-it putty). Other people pipe in cold, fresh air from outside the room (outside & under the building, etc).
I also tried humidified air, to increase the loading of the heat extraction of the “fresh” air. Humidified air can come from a fish-tank, or from a ultra-sonic humidifier injecting water into the air stream.
Extracted-air is higher temperature (& humidity?) than room temperature. So I directed this extracted air out of he room, along with the noise of the PC. Pull-fans help overcome the restrictive friction of any air tubes needed.
Looking at the numbers, push/pull clearly did best under load (this is what you expect from physics too). Cooling under load is what’s important. (I assume the RPMs spin down in idle.)
commence operation vacuu-suck
ye, push is better than pull cause a bit more surface area and more wind force.
Yup. Little difference unless in the push config where someone wants to cool a device such as a hard disk or video card.
As someone mentioned below, the only difference also is in dust control. I have a design that minimizes dust using an all Pull config.
Slim margins, but push confirmed as better than pull. Throwing air in with push obviously works better than the lazy path of least resistance airflow drawn through by a pull fan.
The unconvincing gain of push/pull tallies with the results for pressure vs. flow fans, so long as the back pressure is not limiting the flow, the extra suck from push/pull is not going to make a huge difference.
A two stage tower with mid fan would probably benefit from push and mid
I have a little Question about the Arctic Liquid Freezer in Push/Pull config.
How does it fit in the Kolink Aviator V Case?
Did you put it in the Top Slot or remove the Hard Disk Frame to mount it in Front?
hello, personally i have the same cooler but not the case.
My case is a h440v2, i have removed 3 hard disk “slots” on the front to make a push & pull.
I got it by 11 months, all is ok, but i want to test in future the changes with push or pull on the top.