

Biwin has entered the Gen5 SSD arena with the X570 PRO, a drive which sits in the company's Black Opal premium gaming product line. Rated at up to 14,000MB/s for Sequential reads, it is the current flagship of the company's SSD range.
Powered by a Silicon Motion SM2508 8-channel controller, the X570 PRO uses 232-layer 3D TLC NAND together with an LPDDR4 DRAM cache chip (the size of which is based on drive capacity at the ratio of 1GB per 1TB). At launch, the X570 PRO range consists of three capacities; 1TB, 2TB and a flagship 4TB (the drive we are reviewing here) model.
Biwin rates the Sequential read performance of all three capacities as up to 14,000MB/s. As for Sequential writes, the 1TB and 2TB drives are rated up to 13,000MB/s and the 1TB drive, 10,500MB/s.
Random reads are quoted as up to 2000K IOPS for the 4TB and 2TB drives with the 1TB drive getting a rating of up to 1600K IOPS. Random writes are quoted as up to 1600K IOPS for all three drives.
The endurance figures quoted for the range are impressive with the 4TB drive getting a 3,000 TBW rating, 1,500 TBW for the 1TB drive and 750 TBW for the 1TB model. The drives are backed by a 5-year warranty.
Physical Specifications:
- Usable Capacities: 4TB.
- NAND Components: 232-layer TLC NAND.
- NAND Controller: Silicon Motion SM2508.
- Cache: 4GB LPDDR4.
- Interface: PCIe Gen 5 x4, NVMe 2.0.
- Form Factor: M.2 2280.
- Dimensions: 80 x 22 x 2.5 mm.
- Drive Weight: 9g.
Firmware Version: FWX1221A
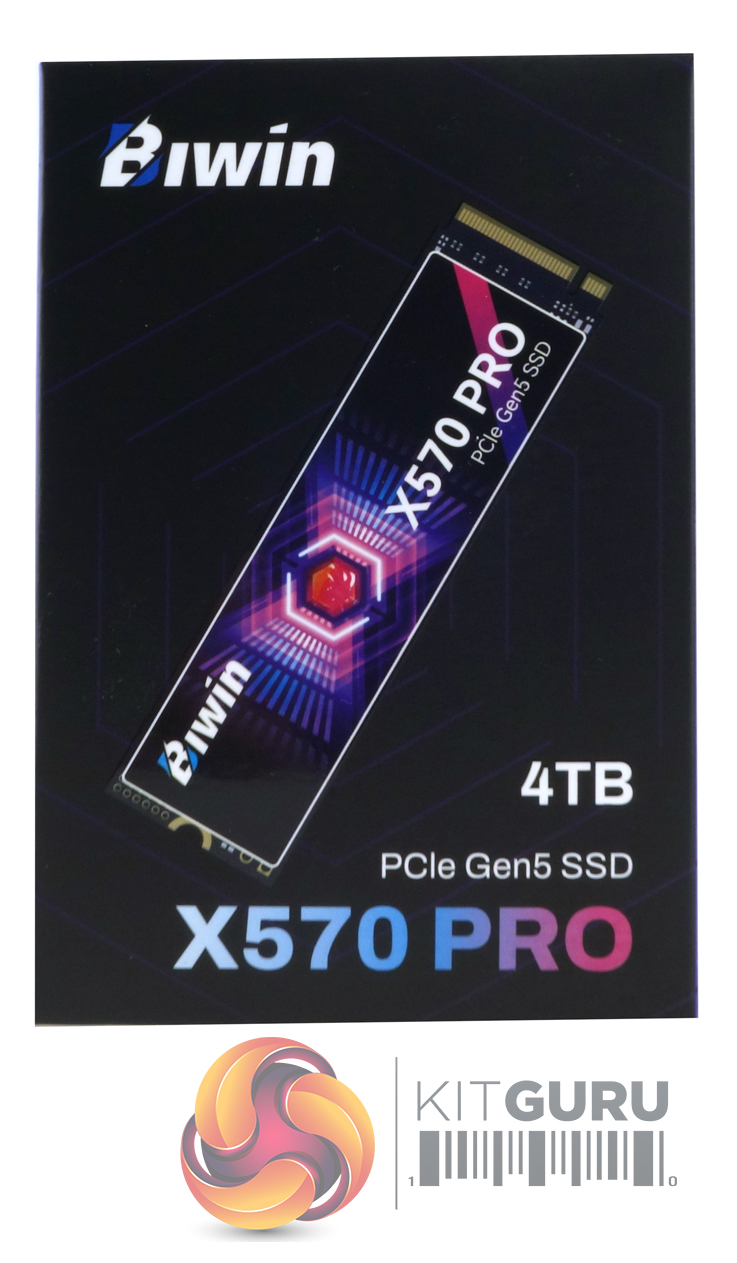
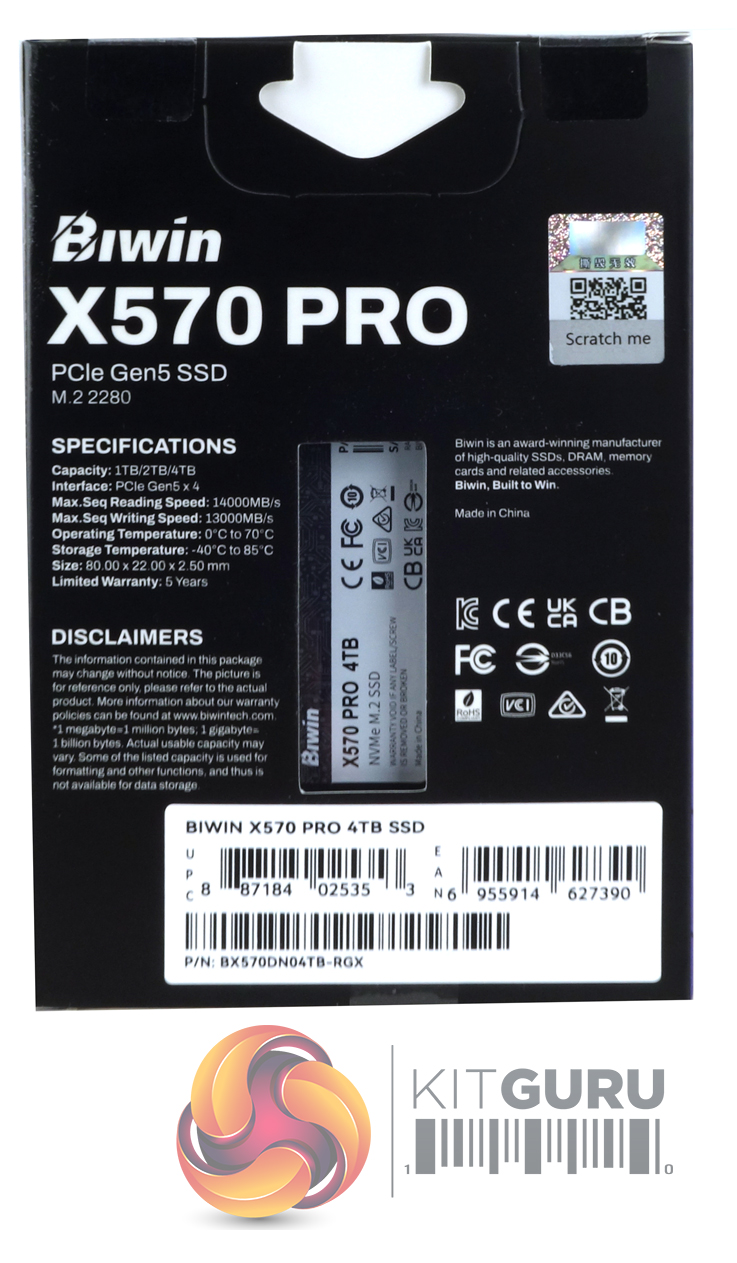
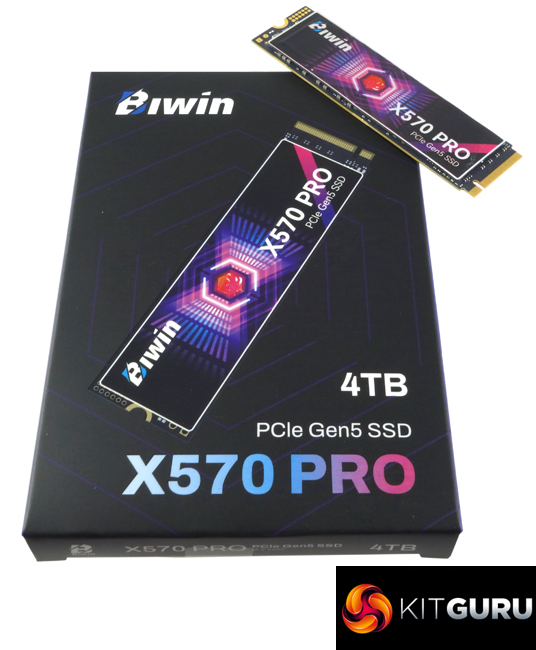
The drive comes in a compact box with a clear image of the drive on the front. Under the image is the drive capacity. The rear of the box has a limited specification list for the drive, next to this is a window which shows the product label on the rear of the drive. To the right of this is a QR code that gives you access to the Quick Start Guide, warranty and additional product information.
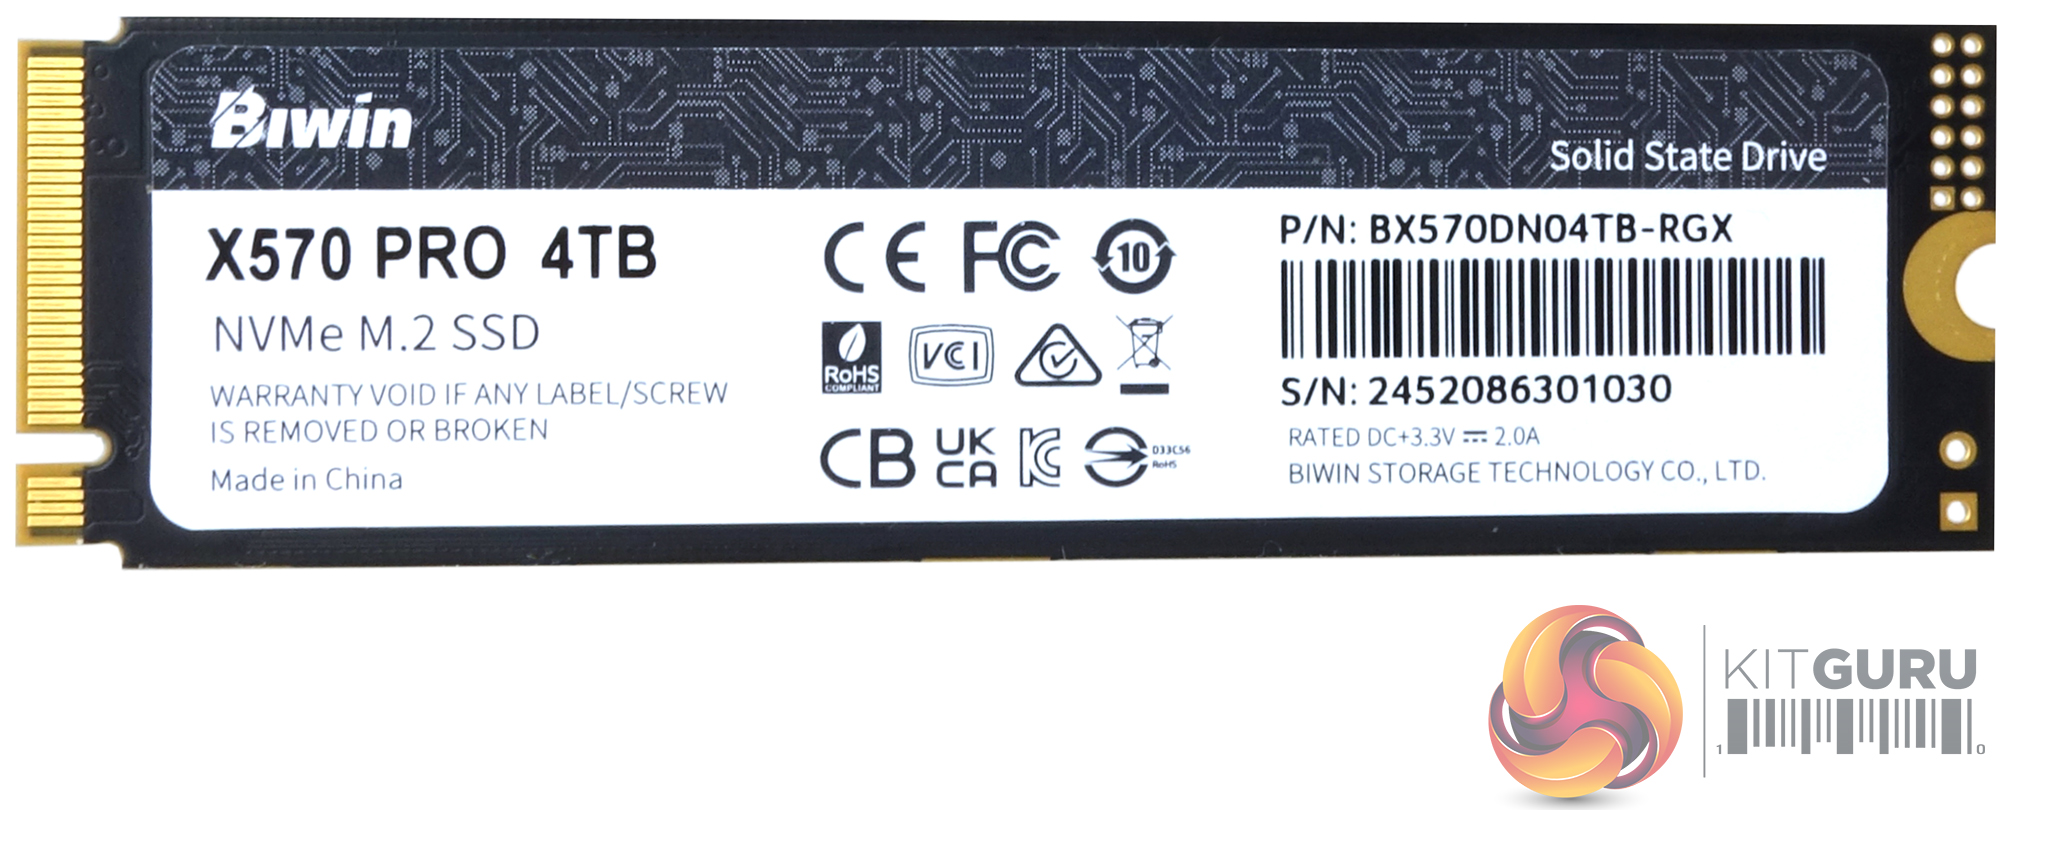
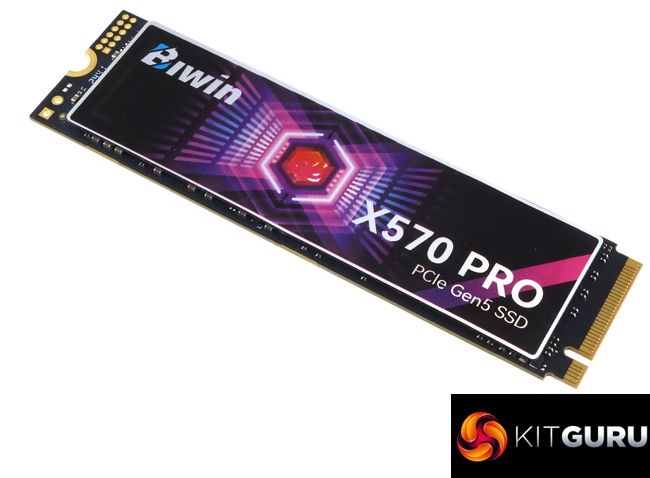
The 4TB X570 PRO is built on a single-layer PCB (components on one side of the PCB). The drive doesn't have a heatsink but the front product label sits on a graphene thermal pad to keep the drive cool. On one side of the PCB sits the Silicon Motion’s SM2508 controller, two 232-layer TLC NAND packages and a 4GB DRAM IC.
We've not seen Silicon Motion’s SM2508 controller before but the 8-channel controller has been designed to offer both high performance and power efficiency. Built on a 6nm process the SM2508 uses a quad-core ARM Cortex R8 CPU that supports four 32Gb/s PCIe lanes. The NAND channels have a bus rate of up to 3,600 MT/s each which provides the up to 14.5 GB/s and 14 GB/s sequential (read and write respectively) and up to 2.5M/2.5M IOPS random read/write performance.
Using a 6nm process allows the SM2508 to be very efficient when it comes to power consumption (Silicon Motion claim 30% active power reduction over previous generation IC).
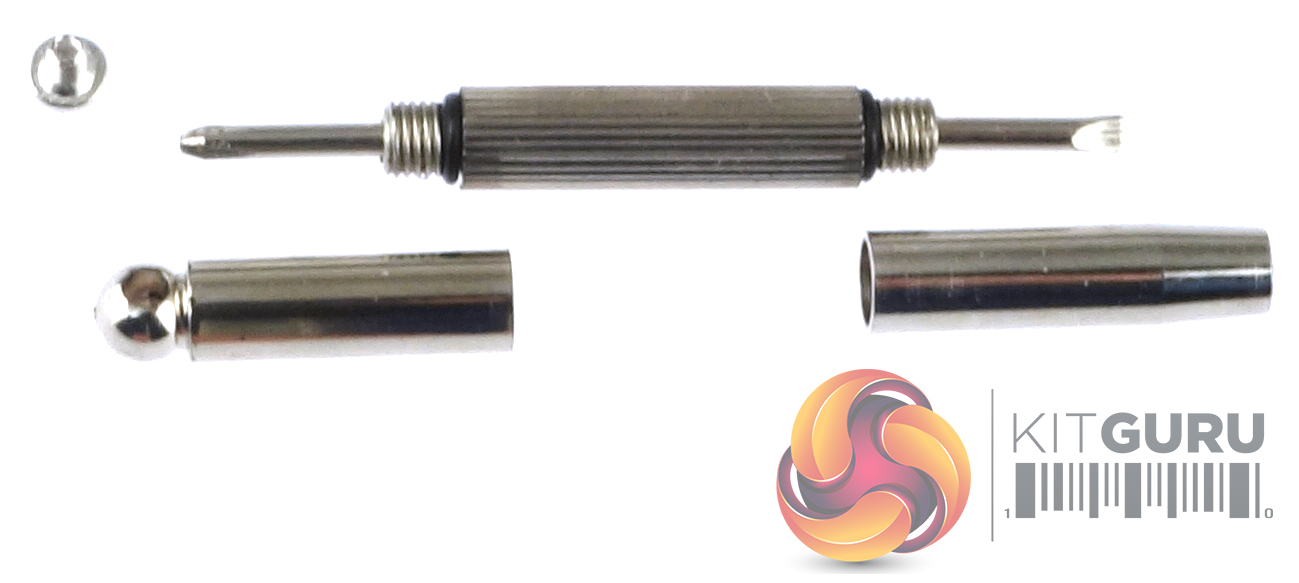
You don't even have to dig out a screwdriver to install the drive as a handy little screwdriver is bundled with the drive along with a fixing screw.
For testing, the drives are all wiped and reset to factory settings by HDDerase V4. We try to use free or easily available programs and some real-world testing so you can compare our findings against your own system.
This is a good way to measure potential upgrade benefits.
Main system:
AMD Ryzen 7 7700X, 32GB DDR5-6000, Nvidia GeForce RTX 3050 and a Gigabyte AORUS X670E Xtreme motherboard.
Other drives
ADATA Legend 970 2TB
Corsair MP700 PRO SE 4TB
Corsair MP700 PRO 2TB
Corsair MP700 Elite 2TB
Crucial T705 2TB
Crucial T700 2TB
Crucial T700 with Heatsink 2TB
Gigabyte AORUS 10000 2TB
Klevv Genuine G360 2TB
Seagate FireCuda 520 2TB
Software:
Atto Disk Benchmark 4.
CrystalMark 8.0.0.
AS SSD 2.0.
UL Solutions PC Mark 10.
UL Solutions 3DMark Storage Benchmark.
Final Fantasy XIV Endwalker Official Benchmark.
All our results were achieved by running each test five times with every configuration this ensures that any glitches are removed from the results. Trim is confirmed as running by typing fsutil behavior query disabledeletenotify into the command line. A response of disabledeletenotify =0 confirms TRIM is active.
CrystalDiskMark is a useful benchmark to measure the theoretical performance levels of hard drives and SSDs. We are using v8.0.5.
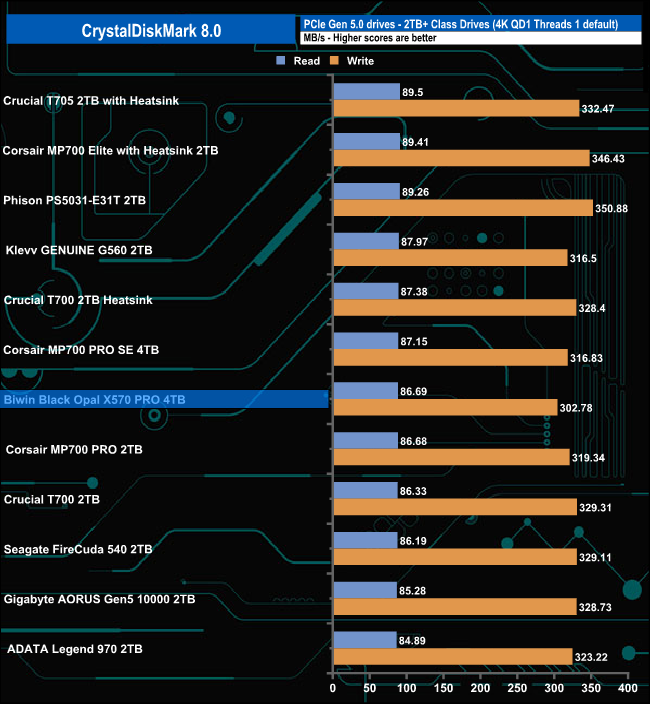
Biwin's Black Opal X570 PRO sits mid-table in the CrystalDiskMark 8 4K QD1 T1 test, with a read score of 86.69MB/s and 302.78MB/s for writes.
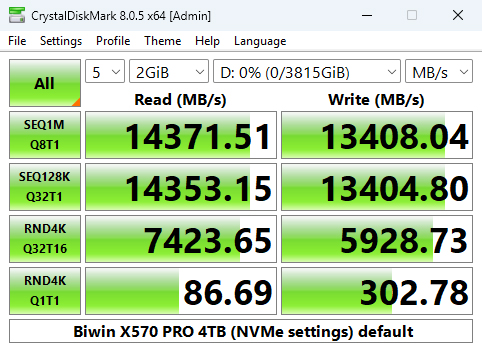
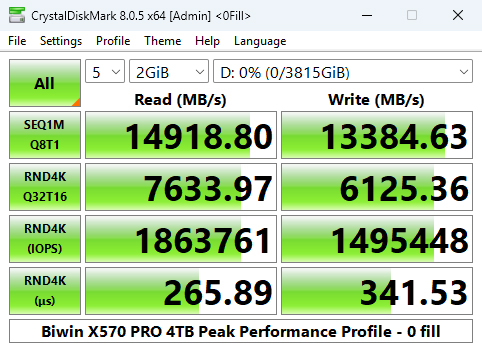
As can seen from the benchmarking screens we can confirm the official sequential ratings of the drive of up to 14,000MB/s for reads and up to 13,000MB/s for writes and even better them with default test figures of 14,371.51MB/s for reads and 13,408.04MB/s for writes.
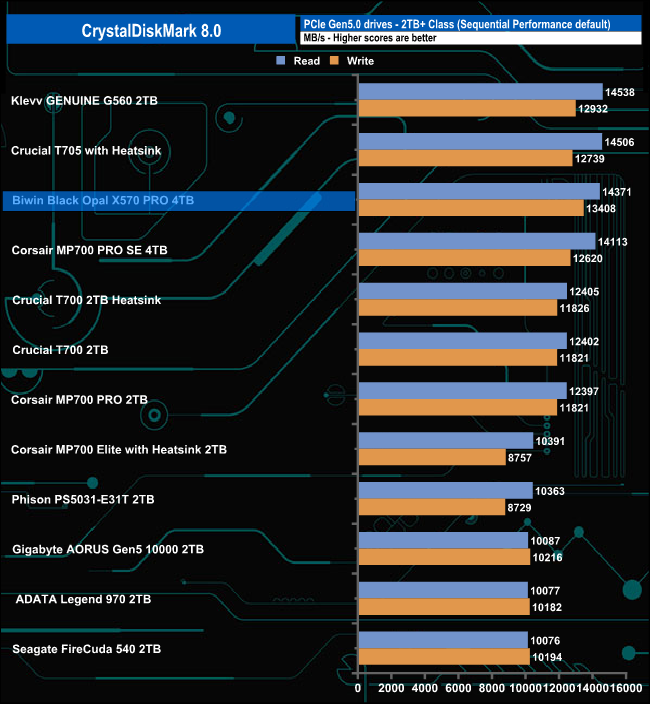
That 14,371.51MB/s read result places the 4TB X570 PRO in third place on the results chart. However, its write result of 13,408.04MB/s is the fastest we've seen for a Gen5 consumer drive to date.
Peak Performance Profile
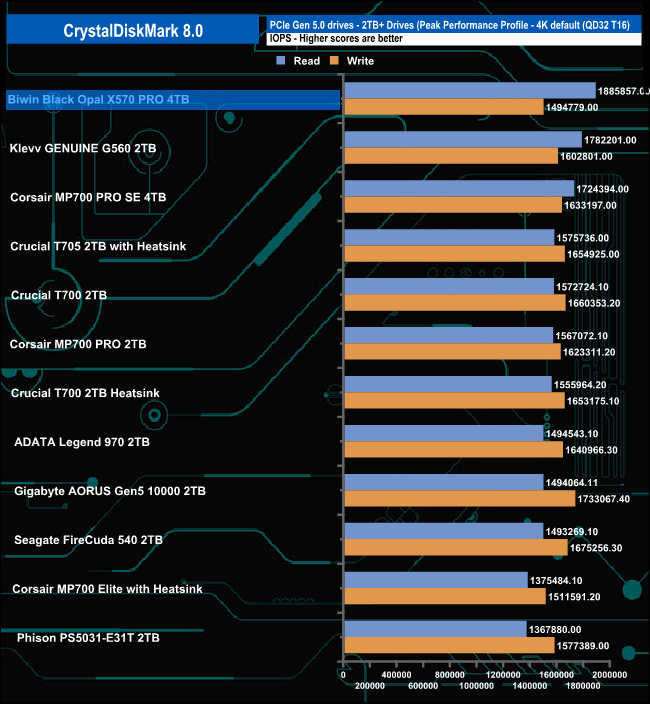
The 4TB X570 PRO is officially rated as up to 2000K IOPS for random reads and up to 1600K IOPS for random writes. Using the Peak Performance profile test of CrystalDiskMark 8 we couldn't quite get to those official maximums. The best read result we saw was 1,885,857 IOPS with the best write figure at 1,494,779 IOPS. Although we couldn't confirm the official figures, the random read result is the fastest we've seen to date for a consumer Gen 5 drive.
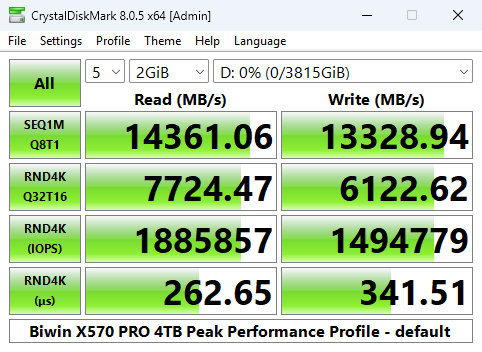
Once again we could confirm the official sequential figures with Peak Performance profile test results of 14,361MB/s for reads and 13,328MB/s for writes.

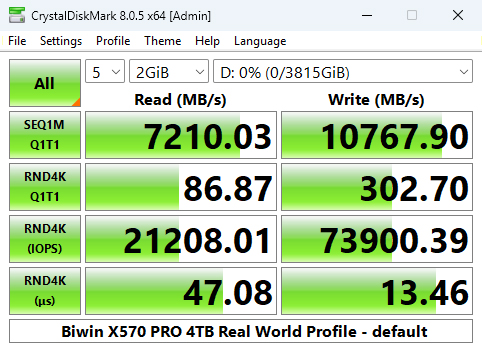
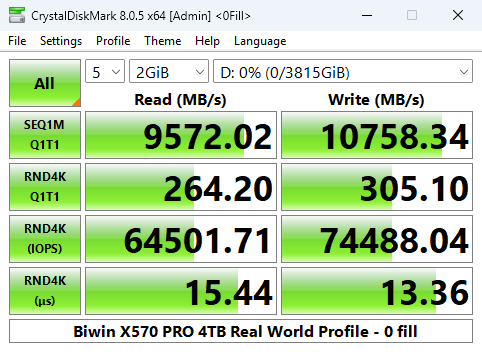
Real World Profile
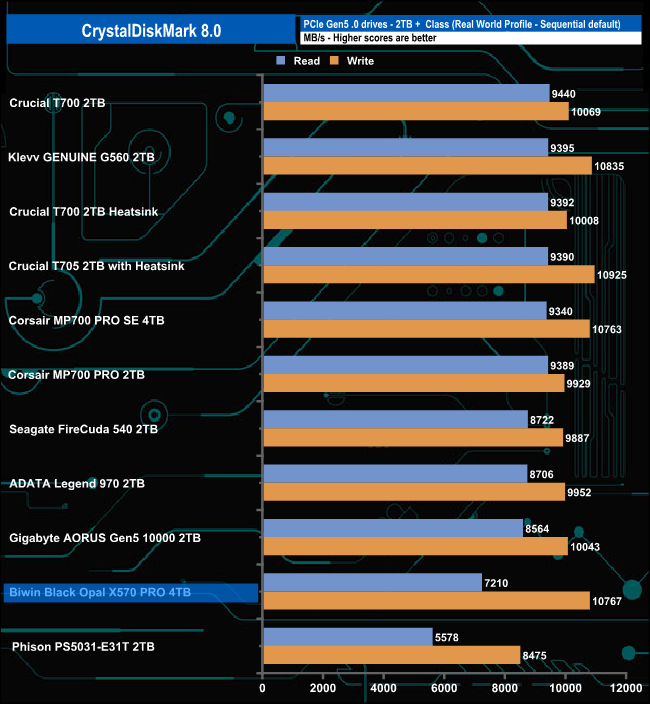
The X570 PRO sits in the penultimate place in the CrystalDiskMark 8 Real World result table with a read score of 7,216MB/s. However, its write score of 10.767MB/s is the third fastest we've seen for a Gen 5 SSD in this test.
The ATTO Disk Benchmark performance measurement tool is compatible with Microsoft Windows. Measure your storage system performance with various transfer sizes and test lengths for reads and writes. Several options are available to customize your performance measurement including queue depth, overlapped I/O and even a comparison mode with the option to run continuously. Use ATTO Disk Benchmark to test any manufacturers RAID controllers, storage controllers, host adapters, hard drives and SSD drives and notice that ATTO products will consistently provide the highest level of performance to your storage. ATTO uses RAW or compressible data.
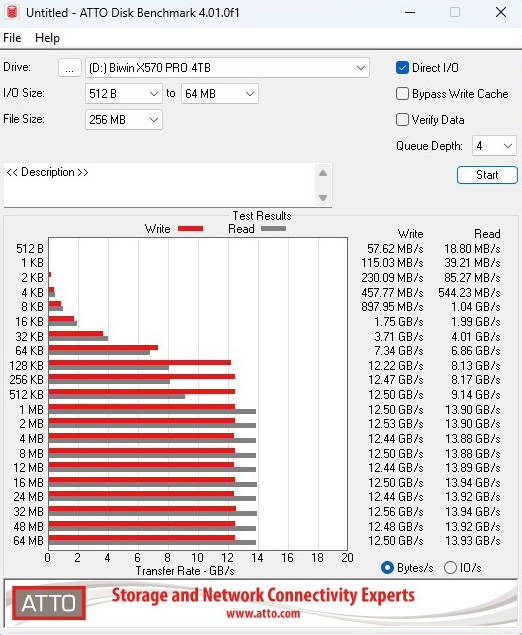
We are using version 4.1 for our NVMe disk tests with a set length of 256mb and test both the read and write performance.
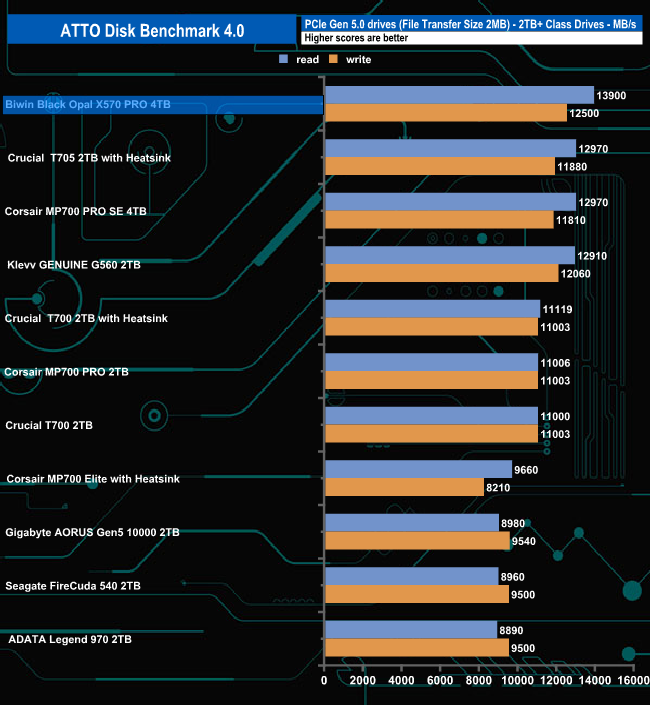
Using the ATTO benchmark we couldn't hit the official read and write sequential figures of up to 14,000MB/s and 13,00MB/s for read and writes respectively but with test figures of 13,900MB/s for reads and 12,500MB/s for writes, we got close. Those result figures may be shy of the official maximums but they are good enough to put the drive in top spot on the results chart.
AS SSD is a great free tool designed just for benching Solid State Drives. It performs an array of sequential read-and-write tests, as well as random read-and-write tests with sequential access times over a portion of the drive. It uses
incompressible data samples which many drives struggle with, so results can be viewed as the worst-case scenarios.
AS SSD includes a sub suite of benchmarks with various file pattern algorithms but this is difficult in trying to judge accurate performance figures.
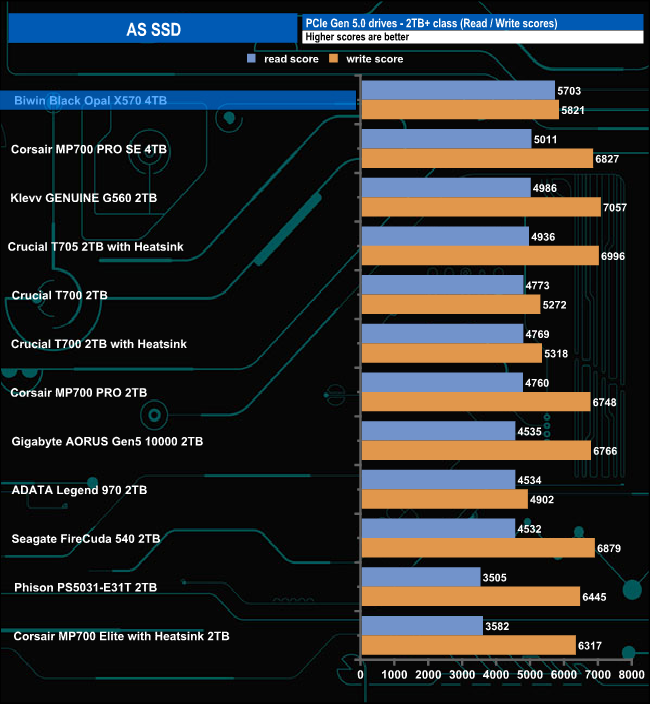
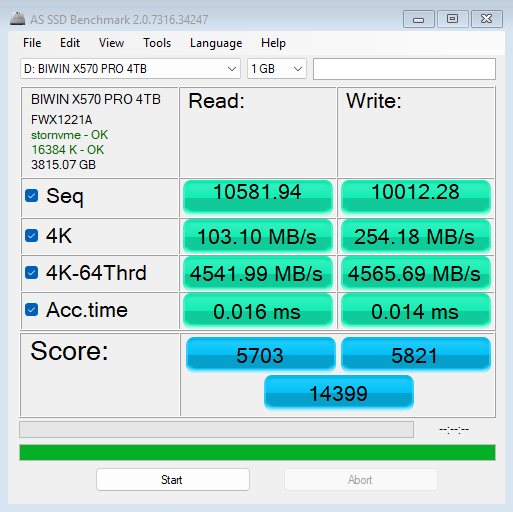
The X570 PRO's read score of 5703 in the AS SSD benchmark sees it in first place in the results table by some distance from the next best, Corsair's MP700 PRO SE drive. However, its write score of 5821 isn't anywhere near as impressive.
We used CrystalDiskMark 8‘s custom settings to test the Sequential read and write performance of the drive through a range of queue depths. The setup for the tests is listed below.
Transfer Request Size: 128KB, Thread(s): 1, Outstanding I/O: 1-32.
128KB Sequential Read / Write.
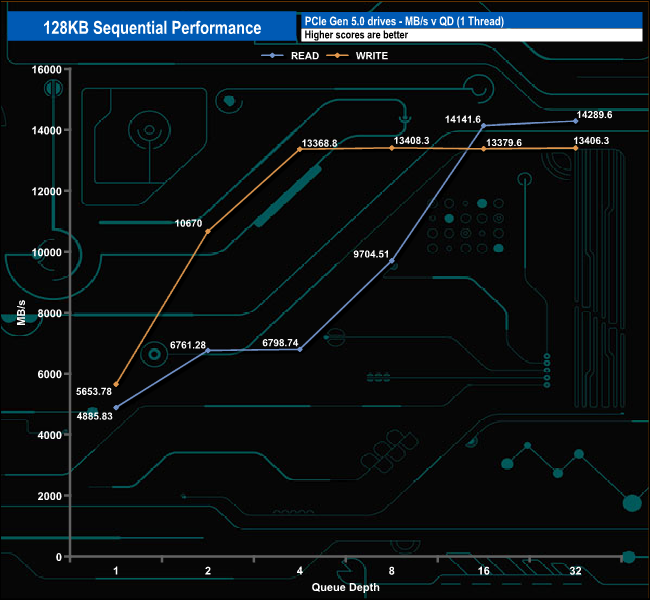

Using this Sequential test, the results confirmed the official Sequential ratings of the drive of up to 14,000MB/s and 13,000MB/s for read and write respectively with figures of 14,289MB/s for reads (QD32) and 13,408MB/s (QD8) for writes.
128KB Sequential Read Performance v QD Compared
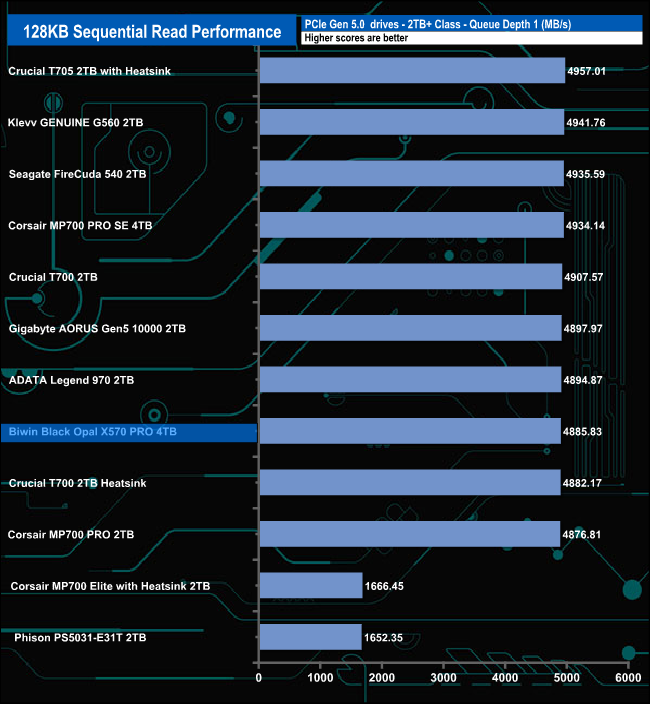
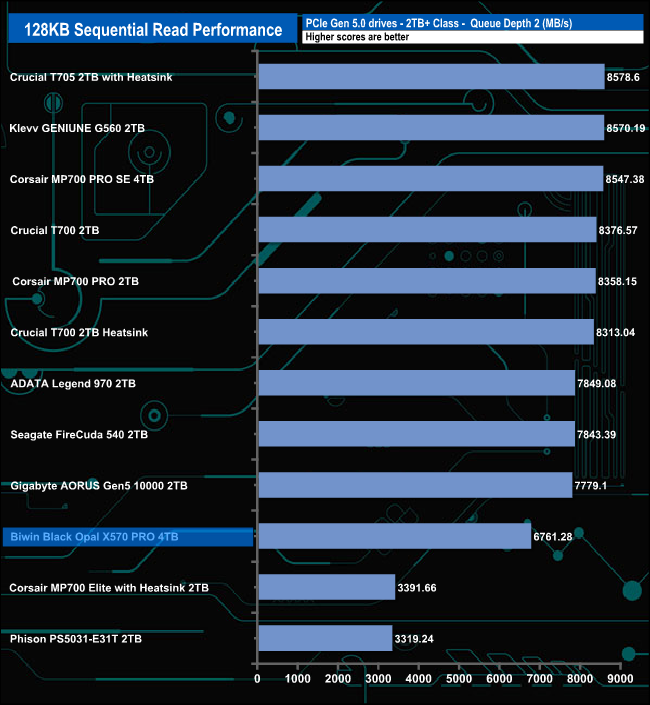
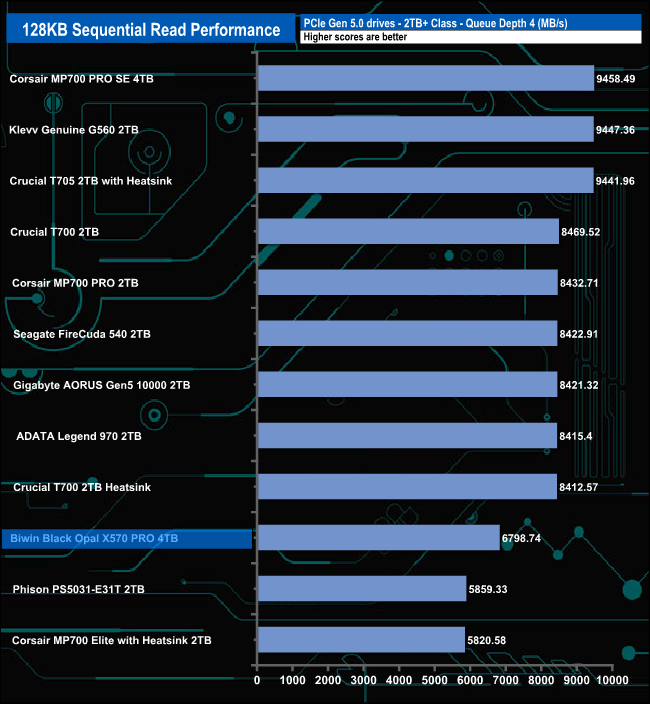
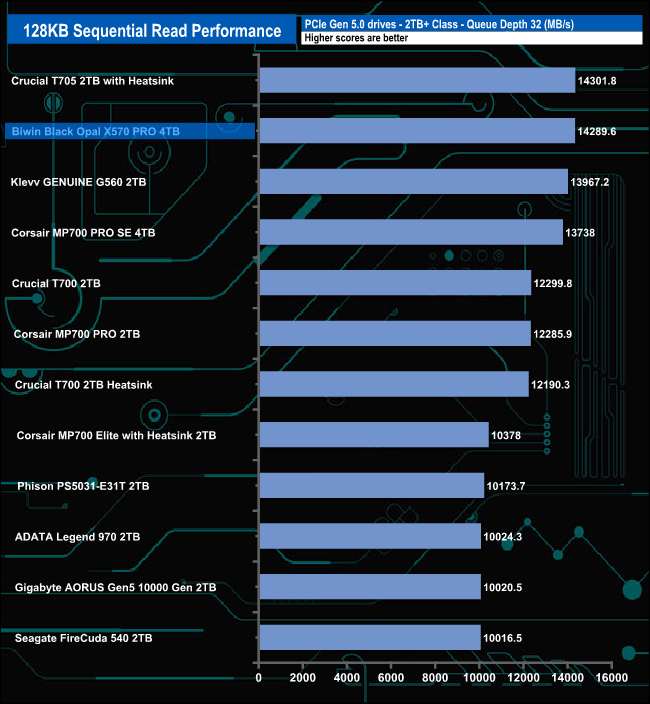
At QDs 1, 2 and 4 the drive sits in the lower half of the results table but at QD32 it rockets up the table to sit in second place behind the heatsink-equipped version of Crucial's T705.
128KB Sequential Write Performance V QD Compared
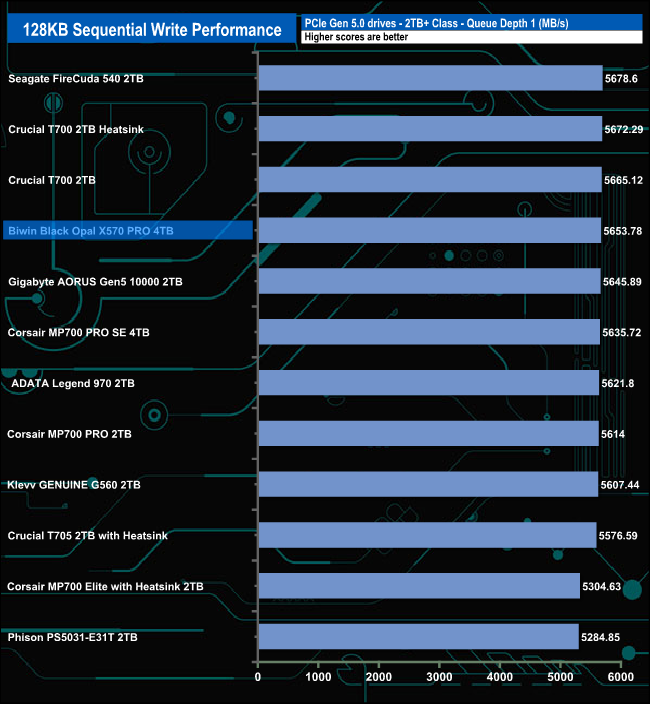
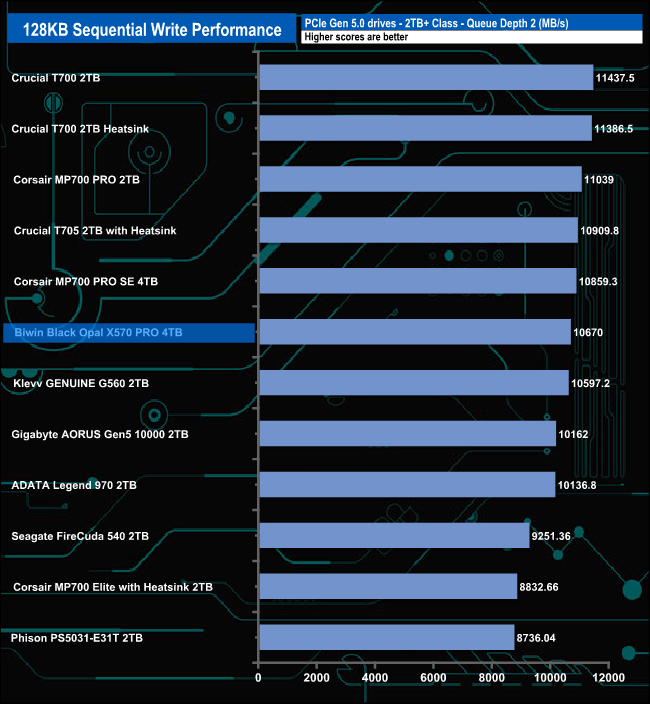
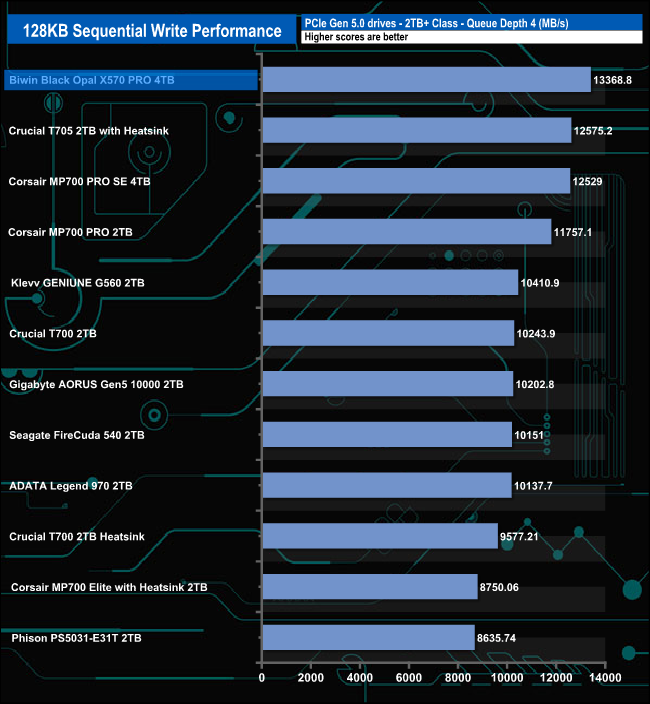
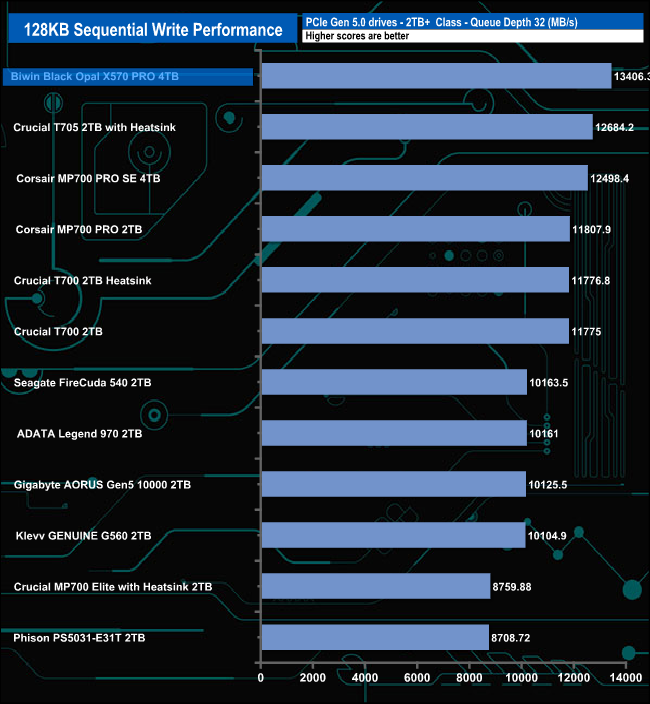
When it comes to the Sequential writes the drive sits in fourth place at QD1 but drops down the table a couple of spots at QD2. However, at QD4 the drive sits in the top spot, a position it also holds at QD32, both by quite a margin from the Crucial T705 (heatsink version).
We used CrystalDiskMark 8‘s custom settings to test the 4K random read performance of the drive through a range of queue depths. The setup for the tests is listed below.
Transfer Request Size: 4KB, Outstanding I/O: 1-32.
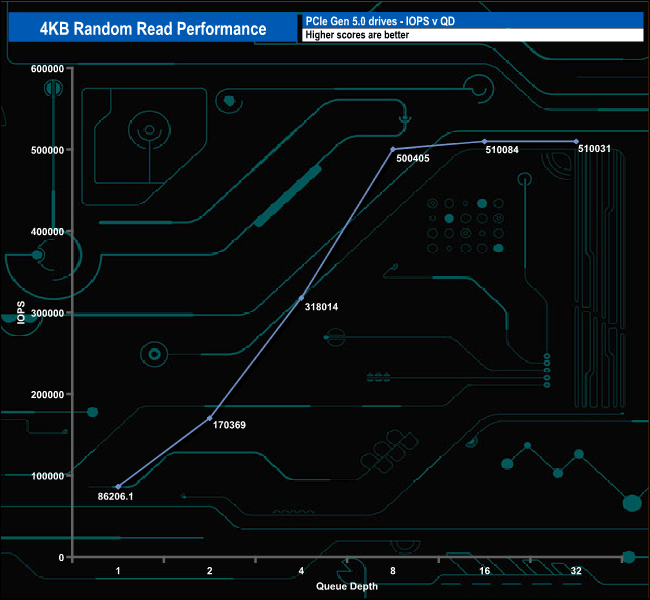
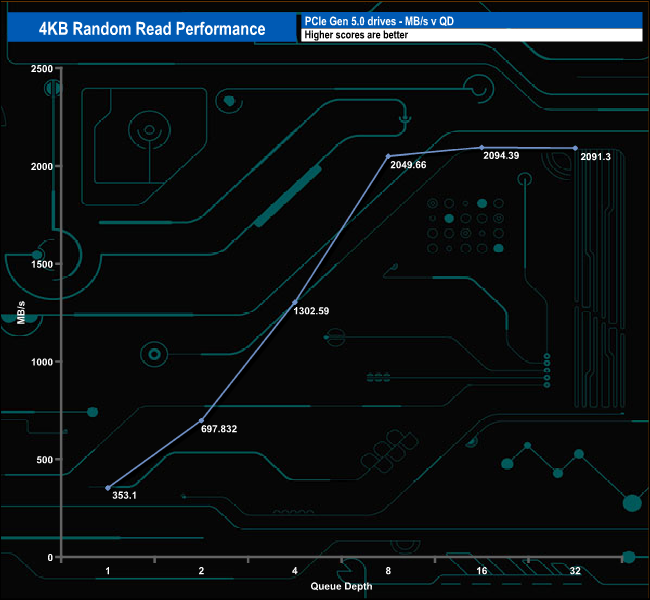

Using our 4-threaded tests we couldn't anywhere close to the official maximum random read figure of up to 2,000,000 IOPS, the best we saw was 510,084 IOPS (2,094MB/s) at QD16 before the performance dropped back to finish the test run (QD32) at 510,031 IOPS.
4K Random Read v QD Performance Compared
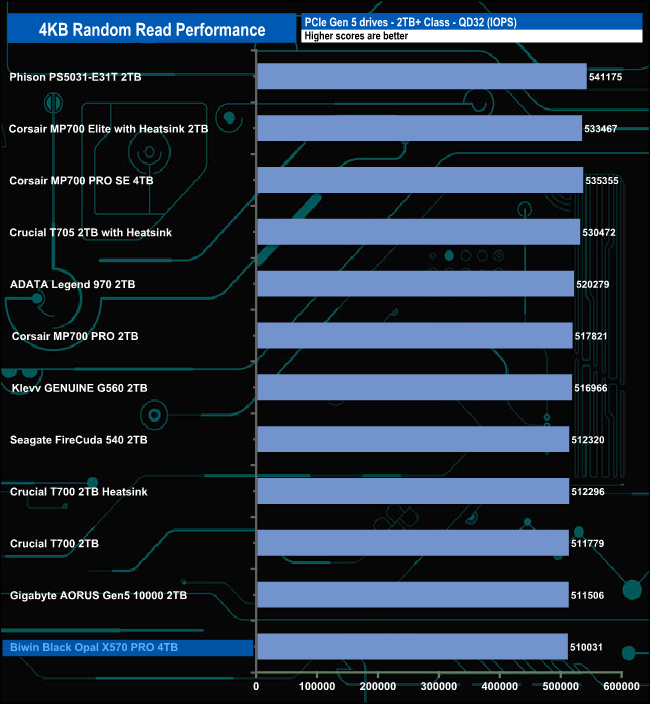
At QDs 1 & 2 the drive sits in third place behind Corsair's MP700 Elite (heatsink version) and Phison's reference PS5031-E31T design. At QD4 it rises up to the top spot but by QD32 it drops down to sit in last place in the table.
We used CrystalDiskMark 8‘s custom settings to test the 4K random write performance of the drive through a range of queue depths. The setup for the tests is listed below.
Transfer Request Size: 4KB, Outstanding I/O: 1-32.
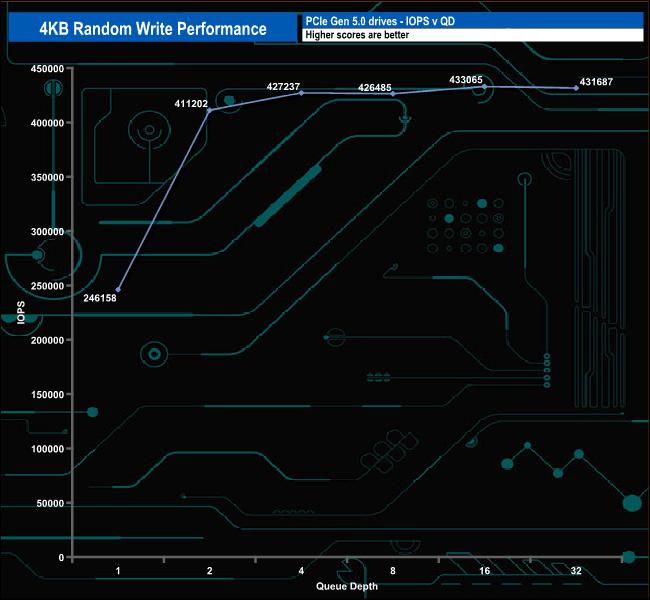
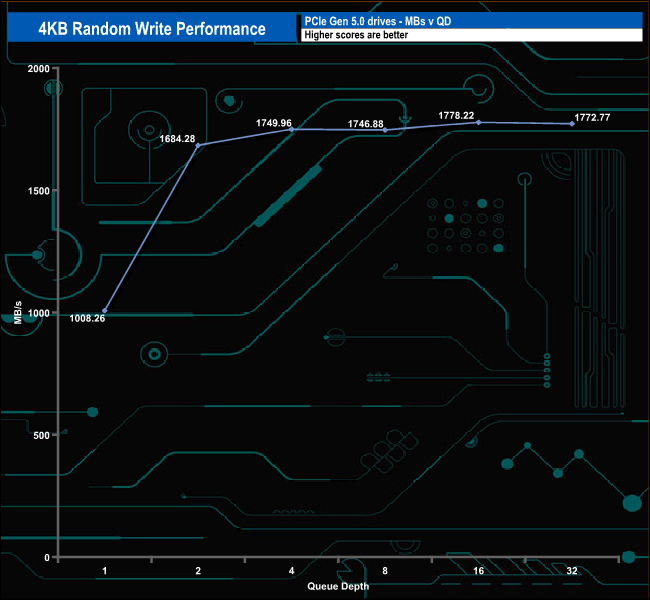
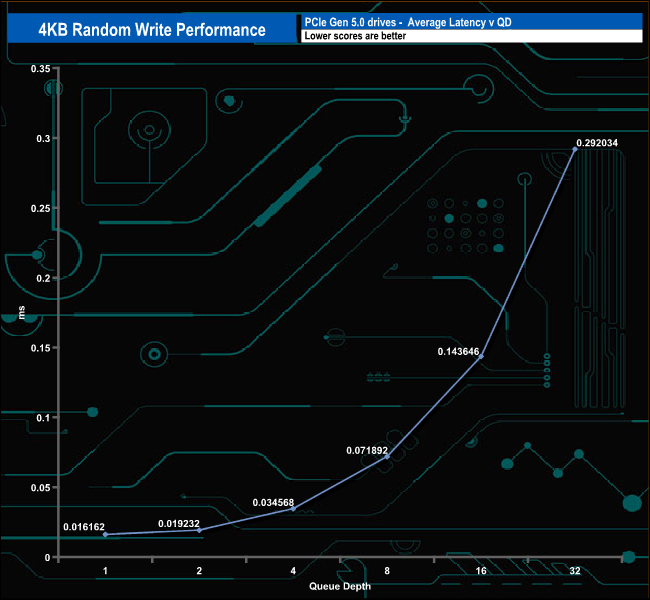
As with the random read results, we couldn't get close to the official maximum of 1,600,000 IOPS using our four threaded tests. The best we saw was 433,065 IOPS at QD16. After this peak, the performance dropped slightly to finish the test run at QD32 at 431,687 IOPS.
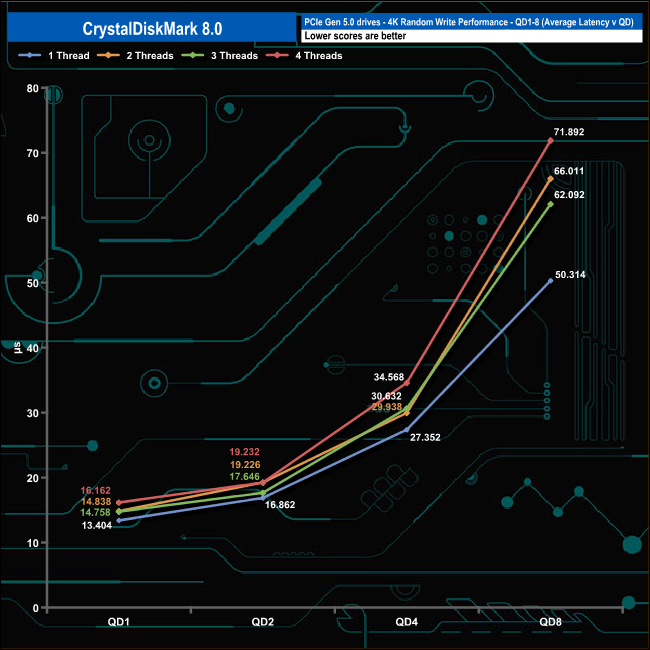
4K Random Write v QD Performance Compared
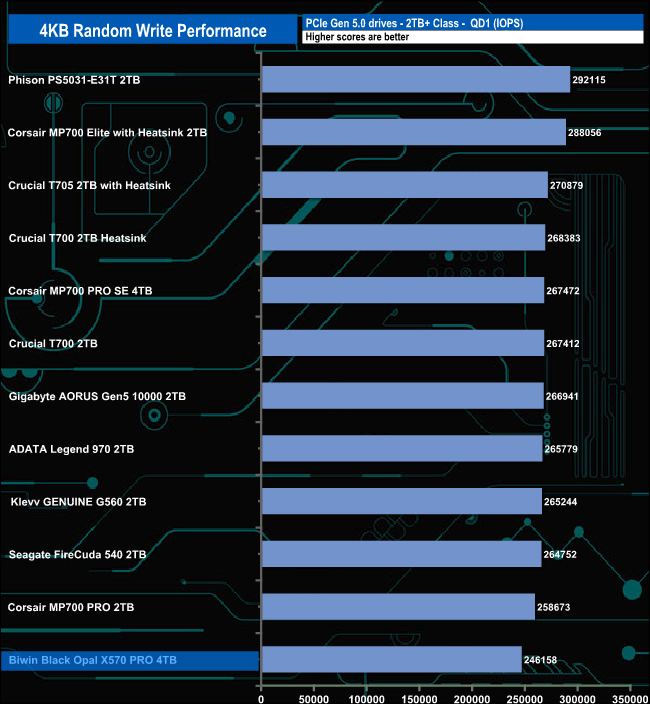
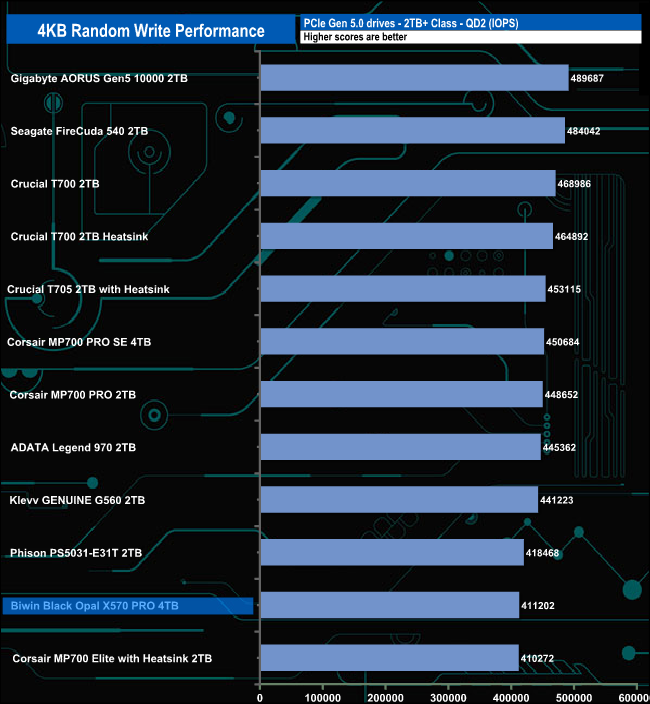
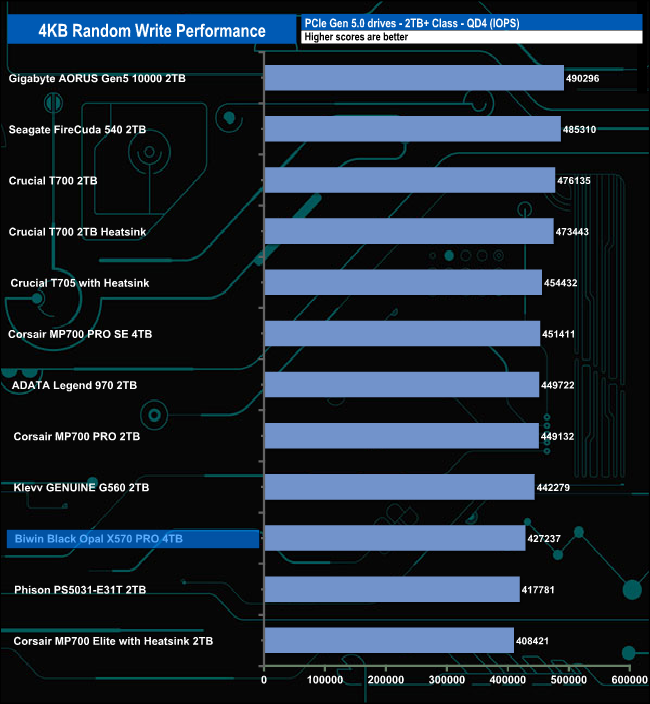
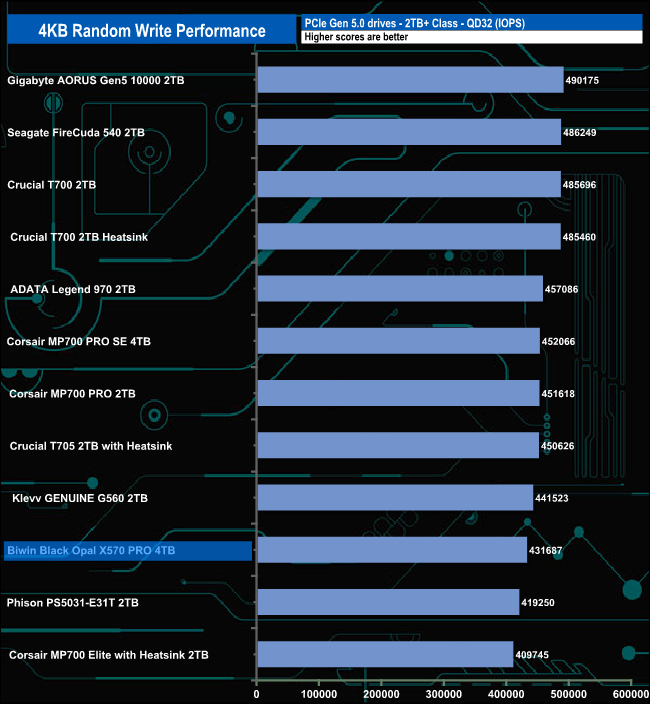
The tested random write performance of the drive isn't as good as the random reads. It sits in the bottom half of the results table for all the tested queue depths and props up the table at QD1.
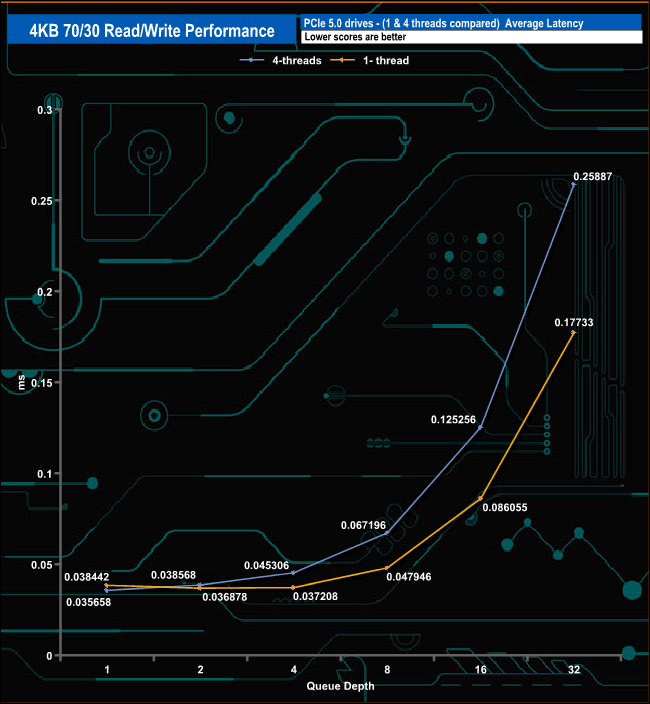
We used CrystalDiskMark 8’s custom settings to test the 4K 70/30 mixed read/write performance of the drive through a range of queue depths using a single thread and four threads.
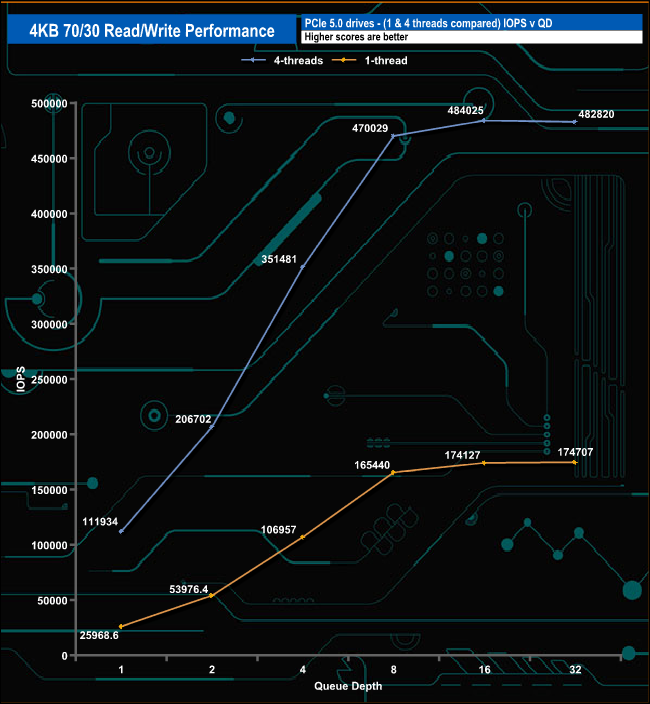
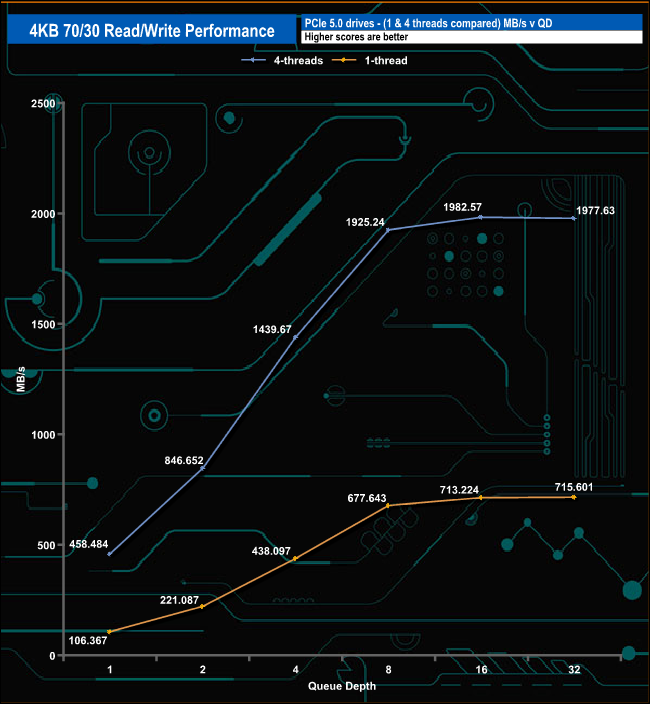
Using a single thread the X570 PRO produced results that ranged from 25,968 IOPS (106.36MB/s) at QD1 up to 174,707 IOPS (715.224MB/s) at QD32. The drive's performance seems to begin to level off after QD8 with only a 580 IOPS improvement between QDs 16 and 32.
Using four threads, the produces a test result of 111,934 IOPS (458.48MB/s) at QD1 rising to a peak of 484,025 IOPS (1,982.57MB/s) at QD16 before falling back slightly to finish the test run at 482,820 IOPS at QD32.
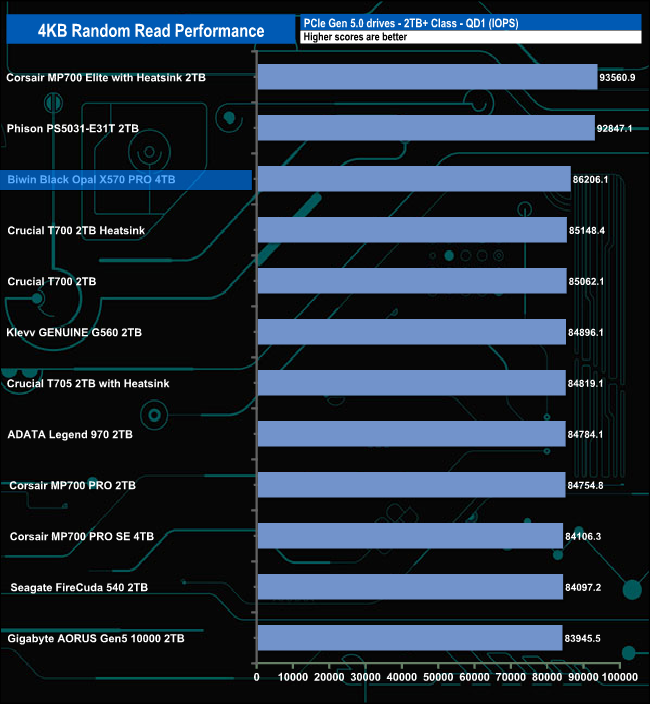
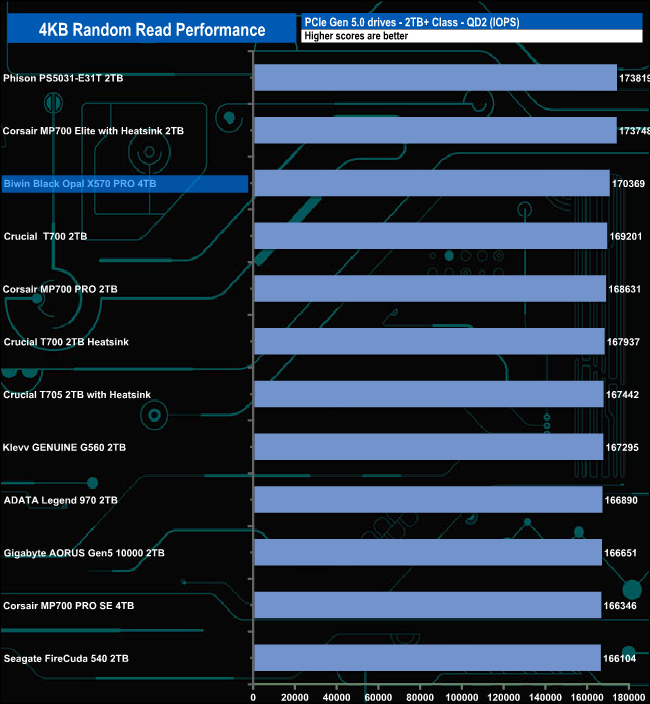
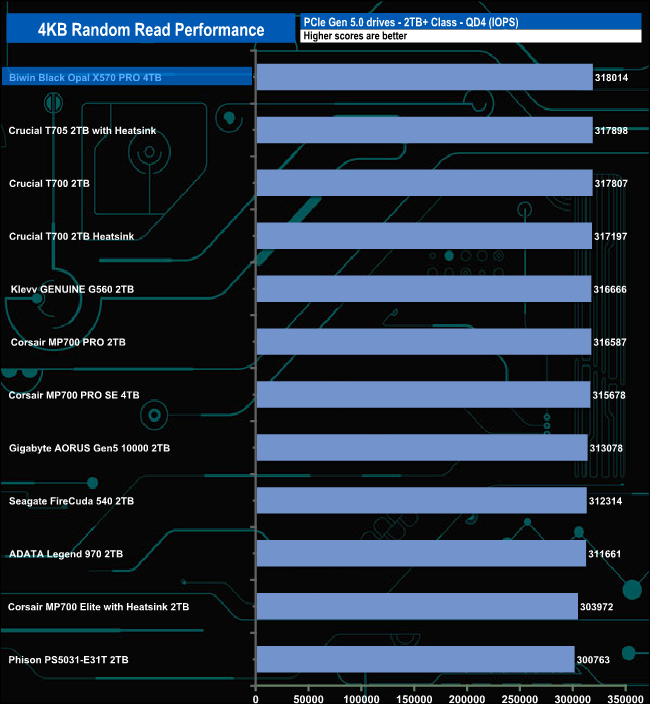
We used CrystalDiskMark 8 to test the random performance of the drive at lower queue depths (QD1 – QD8 where most of the everyday workloads occur) using 1 to 4 threads.
Random Read
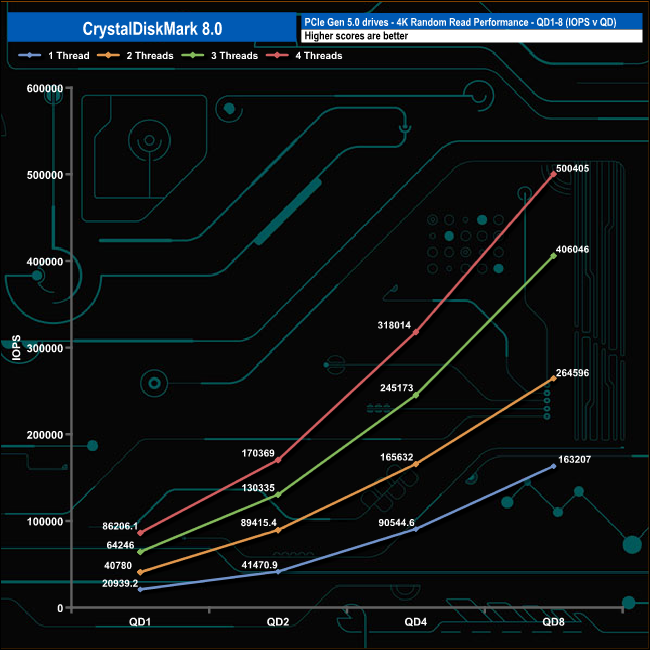
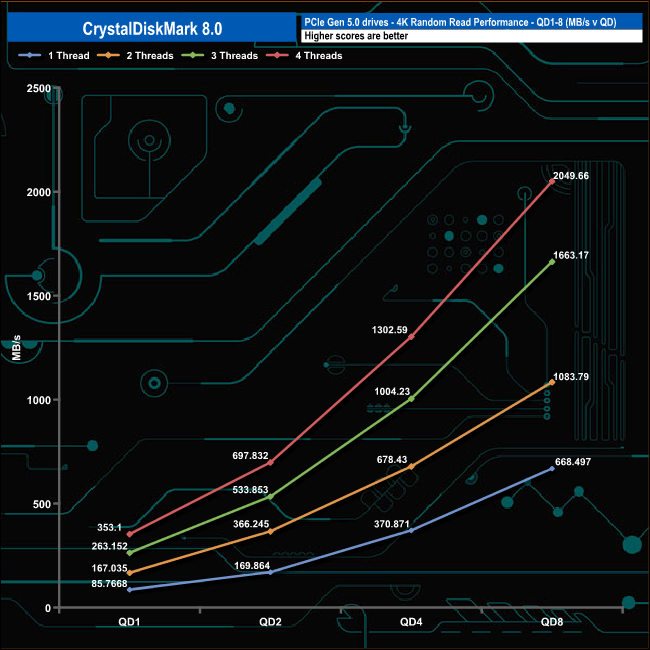
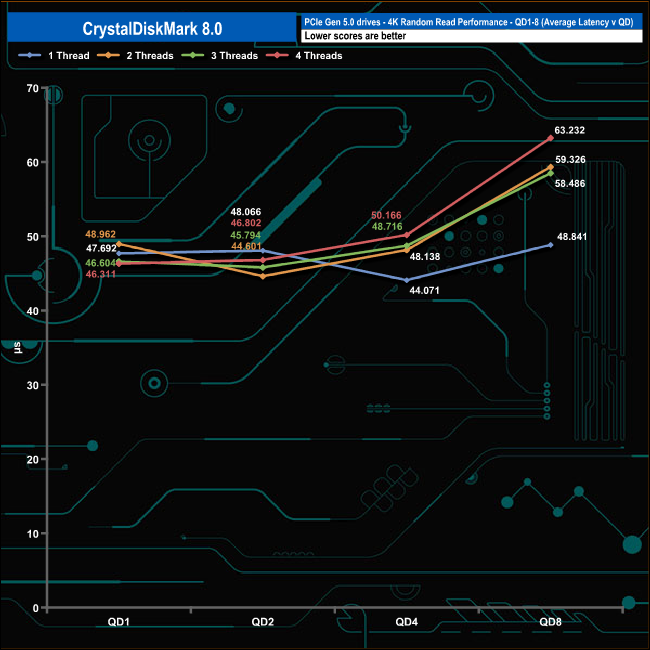
In the random read tests, all four of the tested threads displayed smooth increases in performance as the queue depth deepened. Test results at QD1 ranged from 20,939 IOPS (85.7MB/s) with a single thread up to 86,206 IOPS (353.1MB/s) using four threads.
Random Write
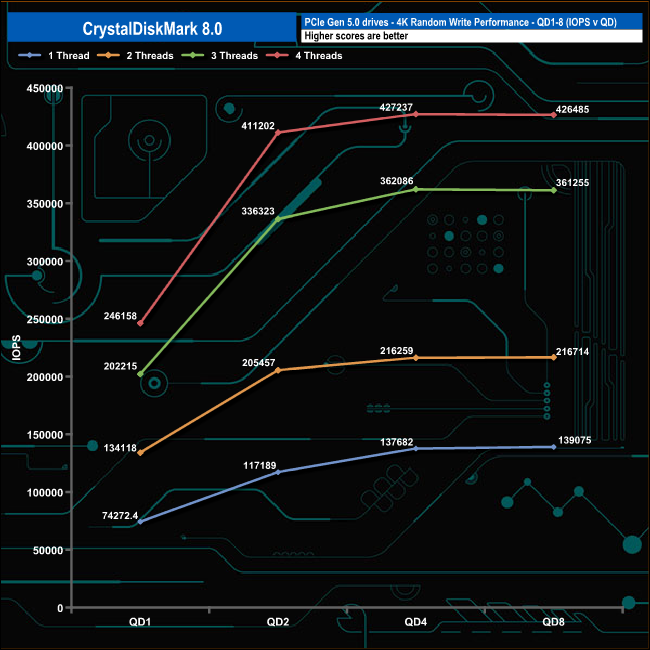
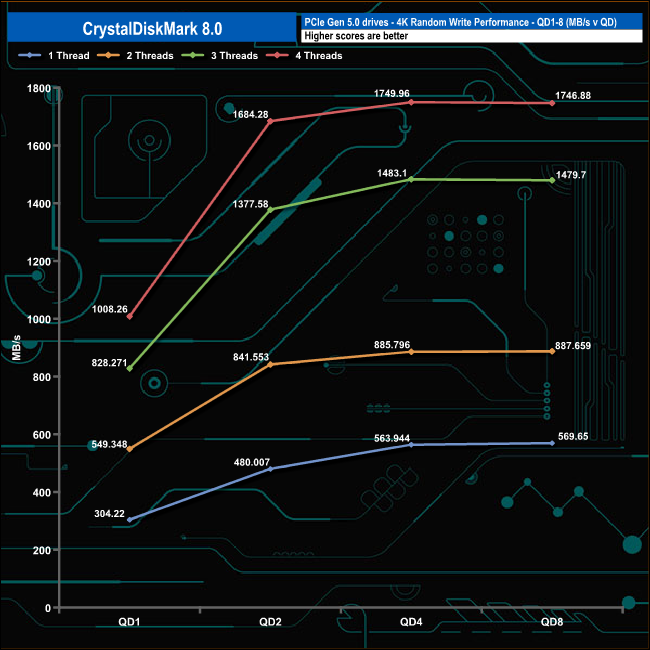
In the 4K write tests the performance rose quickly from QD1 to QD2 (with three and four threads being the fastest) and then a slower rise from QD2 to QD4 before the performance began to level off.
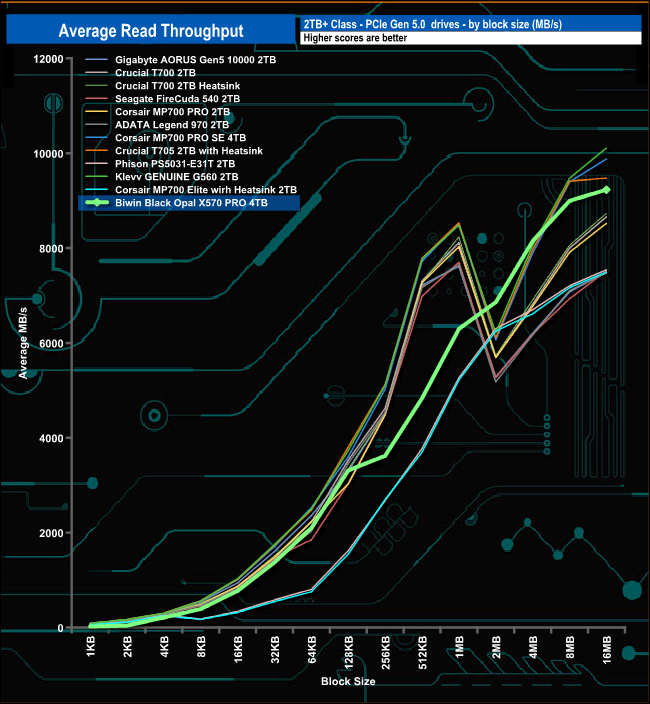
In our read-throughput tests, the performance of the X570 PRO climbed pretty smoothly through the block marks, peaking at the end of the test run at 9,320MB/s.
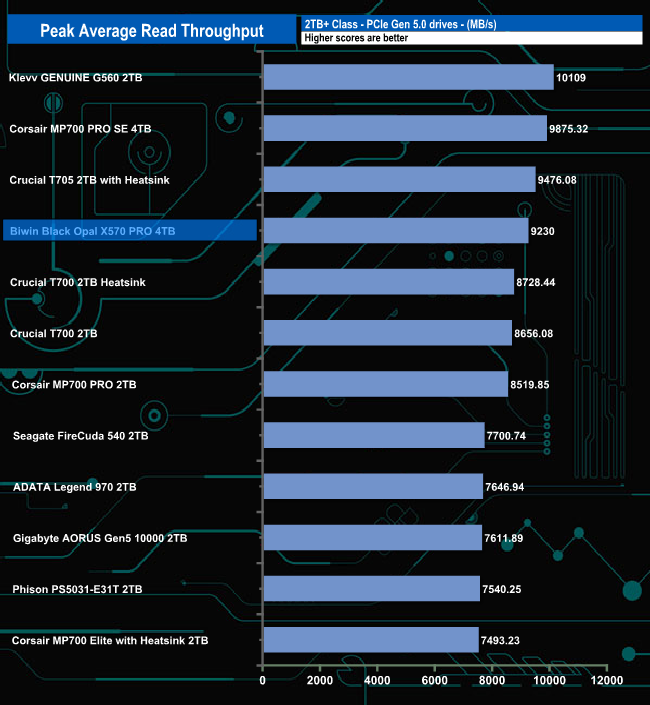
Even though the peak read result is nowhere near the official maximum figure of 14,000MB/s, it's still good enough to place the drive in the fourth spot on the results table.
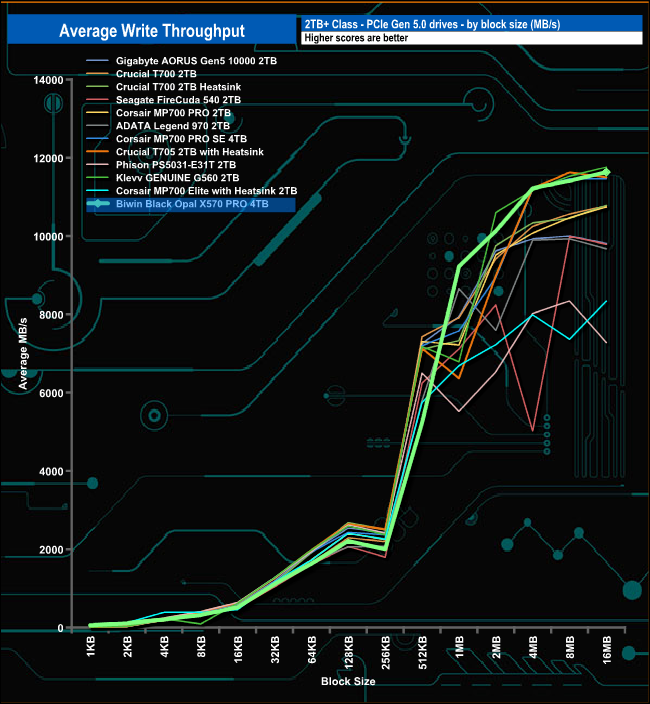
In the write-throughput test, the drive starts to plateau out between 128KB and 256KB before picking up the pace again, peaking at the end of the test run at 11,632MB/s. As with the read result, this is short of the official maximum of 13,000MB/s but it is closer to the official figure than the preak read result.
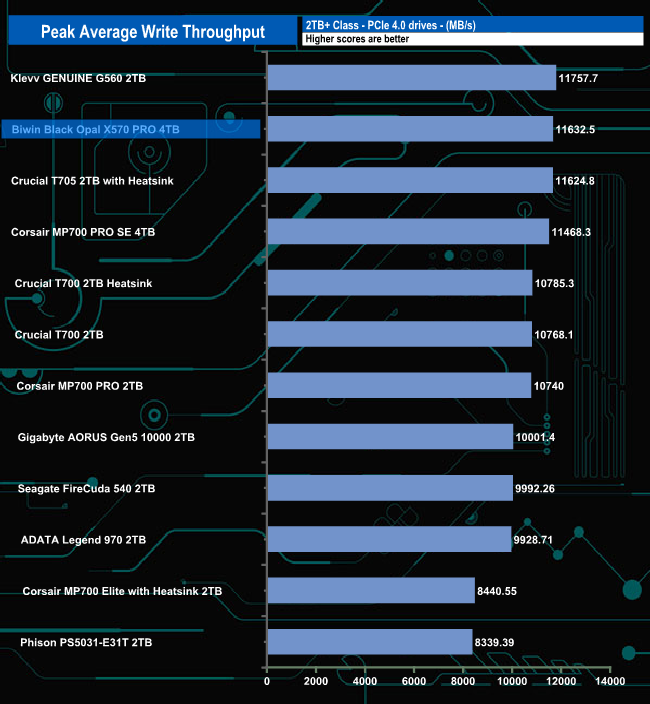
Although the tested peak write result of 11,632MB/s is somewhat short of the official maximum it is still good enough to put the drive in second place behind Klevv's GENUINE G560.
The PCMark 10 Full System Drive Benchmark uses a wide-ranging set of real-world traces from popular applications and common tasks to fully test the performance of the fastest modern drives. The benchmark is designed to measure performance of fast system drives using the SATA bus at the low end and devices connected via PCI Express at the high end.
The goal of the benchmark is to show meaningful real-world performance differences between fast storage technologies such as SATA, NVMe, and Intel’s Optane. The Full System Drive Benchmark uses 23 traces, running 3 passes with each trace. It typically takes an hour to run.
Traces used:
Booting Windows 10.
Adobe Acrobat – starting the application until usable.
Adobe Illustrator – starting the application until usable Adobe Premiere Pro – starting the application until usable.
Adobe Photoshop – starting the application until usable.
Battlefield V – starting the game until the main menu.
Call of Duty Black Ops 4 – starting the game until the main menu.
Overwatch – starting the game until main menu.
Using Adobe After Effects.
Using Microsoft Excel.
Using Adobe Illustrator.
Using Adobe InDesign.
Using Microsoft PowerPoint.
Using Adobe Photoshop (heavy use).
Using Adobe Photoshop (light use).
cp1 Copying 4 ISO image files, 20 GB in total, from a secondary drive to the target drive (write test).
cp2 Making a copy of the ISO files (read-write test).
cp3 Copying the ISO to a secondary drive (read test).
cps1Copying 339 JPEG files, 2.37 GB in total, to the target drive (write test).
cps2 Making a copy of the JPEG files (read-write test).
cps3 Copying the JPEG files to another drive (read test).
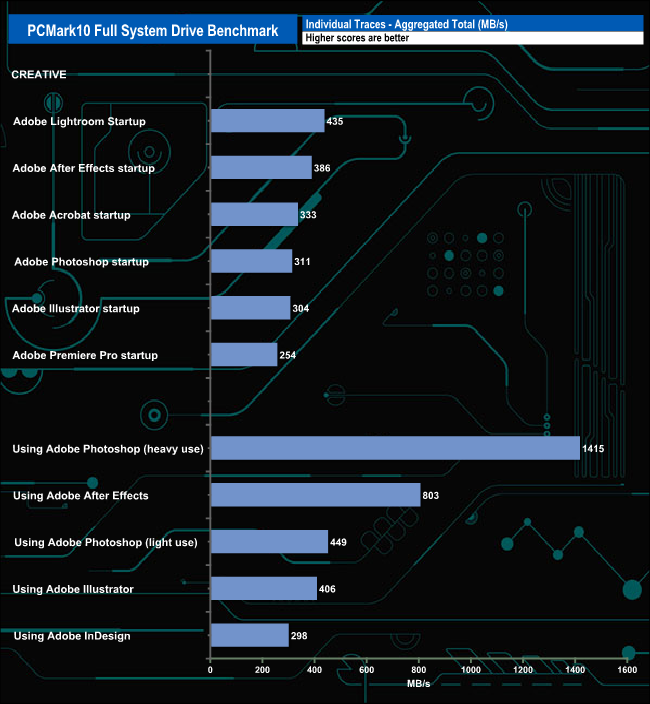
The drive averaged 342.16MB/s for the six Adobe startup traces, the fastest being 435MB/s for the Lightroom startup test trace, with the slowest being the Premiere Pro startup test at 254MB/s.
When tested with the Adobe usage traces the X570 PRO averaged 674.2MB/s for the five tests, which includes the 1,415MB/s result for the Adobe Photoshop heavy usage trace. The slowest of the five traces was the InDesign trace at 298MB/s
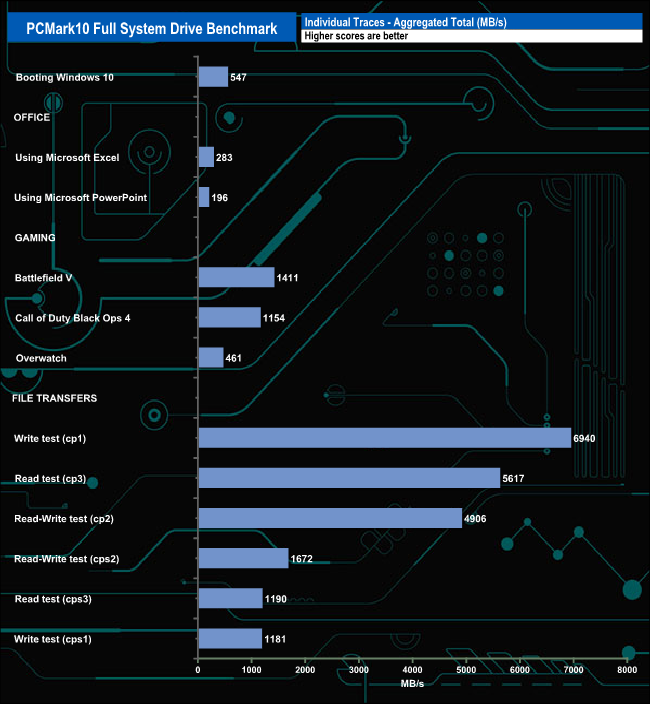
The drive averaged 988MB/s for the three gaming tests. The fastest was Battlefield V at 1,411MB/s, next up was Call Of Duty Black Ops 4 at 1,154MB/s and the slowest of the three was Overwatch at 461MB/s
In the file transfer tests the X570 PRO averaged 3,584MB/s for the six tests with the fastest being the Write Test (cp1) at 6,940MB/s.
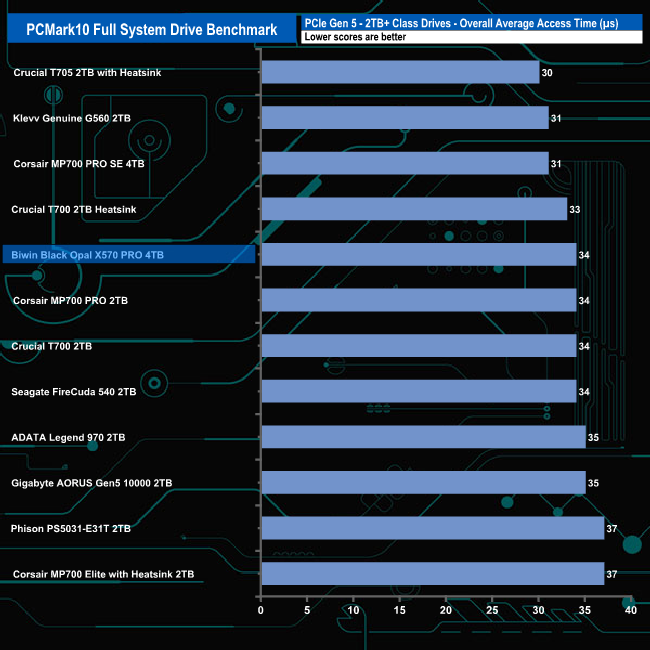
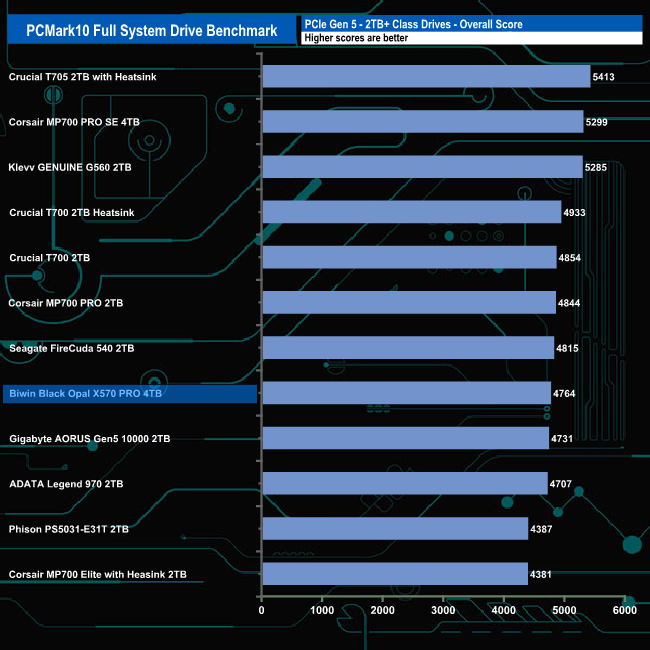
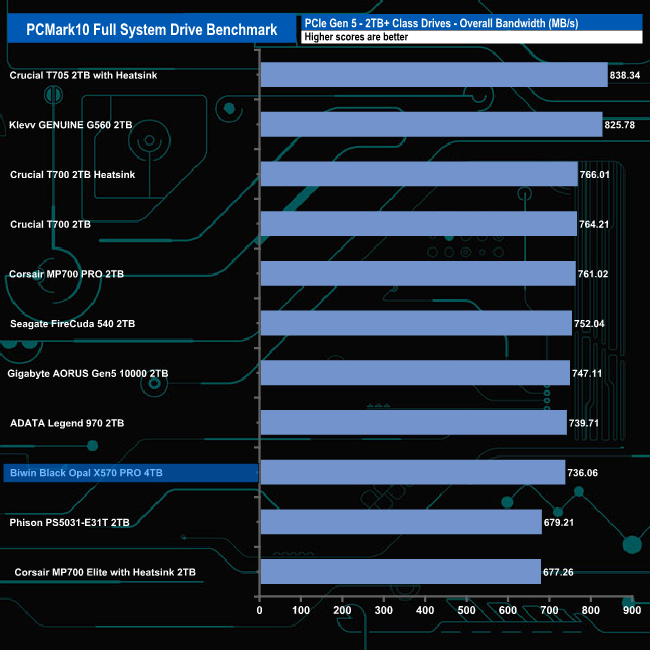
With an overall bandwidth figure of 736MB/s, the X570 PRO sits in third from last position in the results table but there is only a 102MB/s gap between it and the heatsink version of the Crucial T705 which tops the table.
The 3DMark Storage Benchmark uses traces recorded from popular games and gaming-related activities to measure real-world gaming performance.
Traces used:
Battlefield V
Loading Battlefield™ V from launch to the main menu.
Call of Duty Black Ops 4
Loading Call of Duty®: Black Ops 4 from launch to the main menu.
Overwatch
Loading Overwatch® from launch to the main menu.
Game Move
Copying the Steam folder for Counter-Strike®: Global Offensive from an external SSD to the system drive.
Game Recording
Recording a 1080p gameplay video at 60 FPS with OBS (Open Broadcaster Software) while playing Overwatch®.
Installing Game
Installing The Outer Worlds® from the Epic Games Launcher.
Game Saving
Saving progress in The Outer Worlds game.
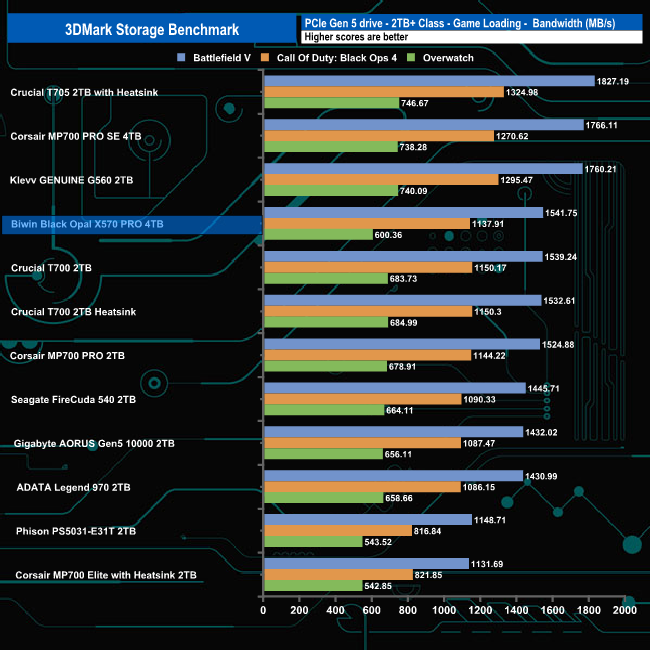
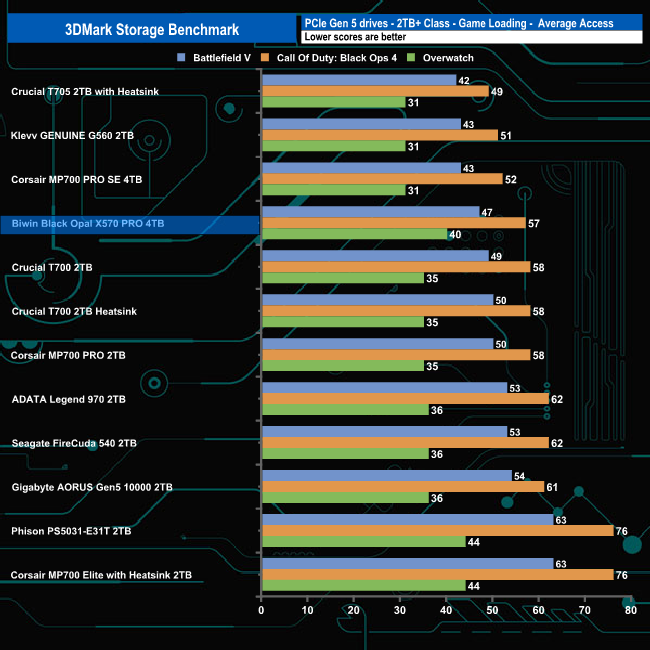
In 3DMark’s Storage Test, the drive had an average game loading bandwidth figure for the three games of 1,093MB/s (good enough for fourth place in the results table), with an average access time figure of 48µs (0.048m/s).
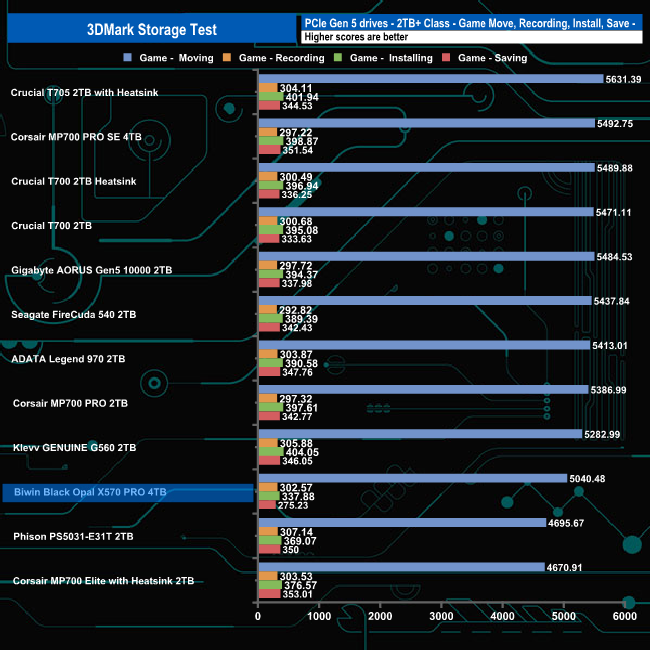
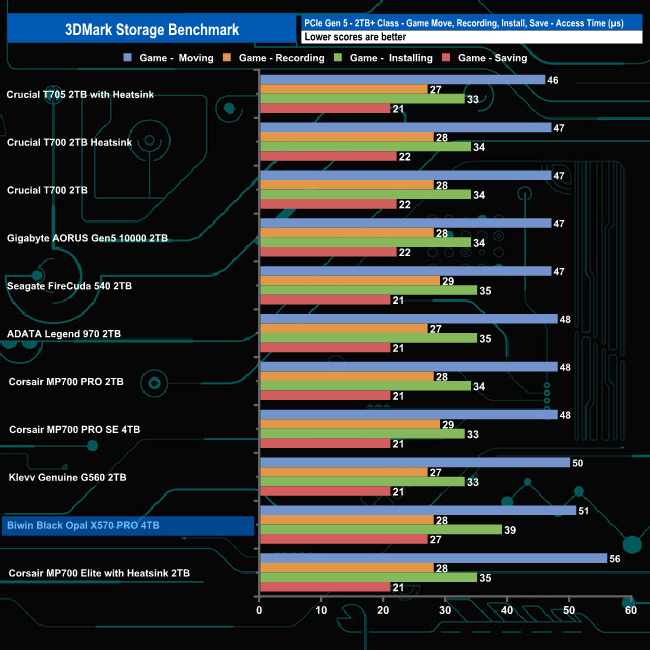
In the game moving, recording, installing and saving test traces the drive averaged 1,489.04MB/s with an average access time of 29µs (0.029m/s) for the four tests which see the drive in the penultimate spot in the table.
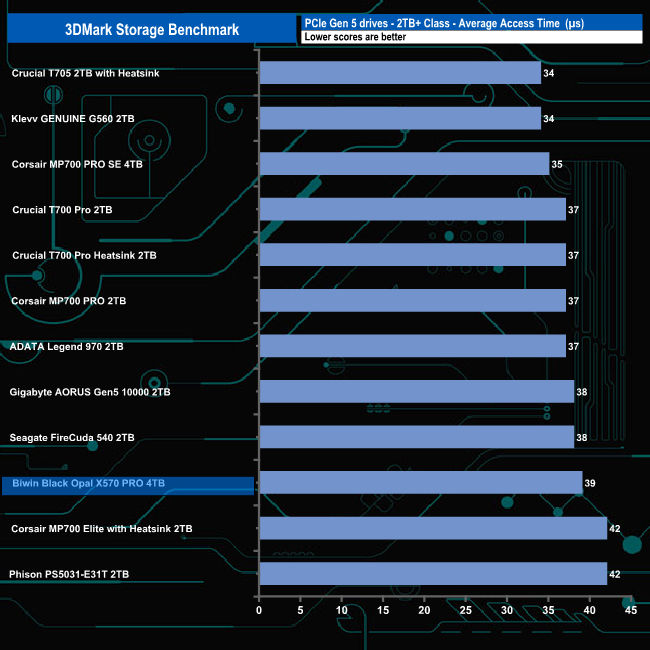
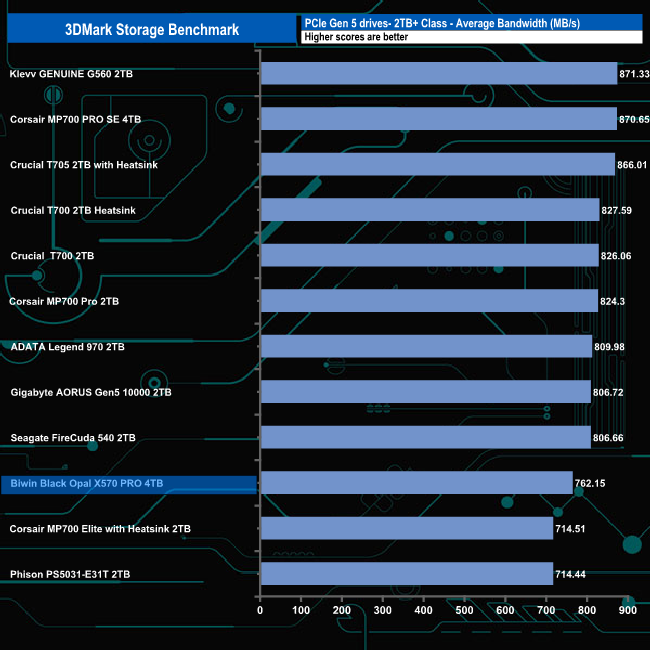
The average bandwidth figure for the 4TB X570 PRO for the complete benchmark run was 762.15MB/s, a result which sees the drive sitting close the the bottom of the results chart.
The Final Fantasy XIV Endwalker Official Benchmark uses actual maps and playable characters to assign a score to your PC and rate its performance including scene loading times.
The benchmark gives an overall load time as well as loading times by scene.
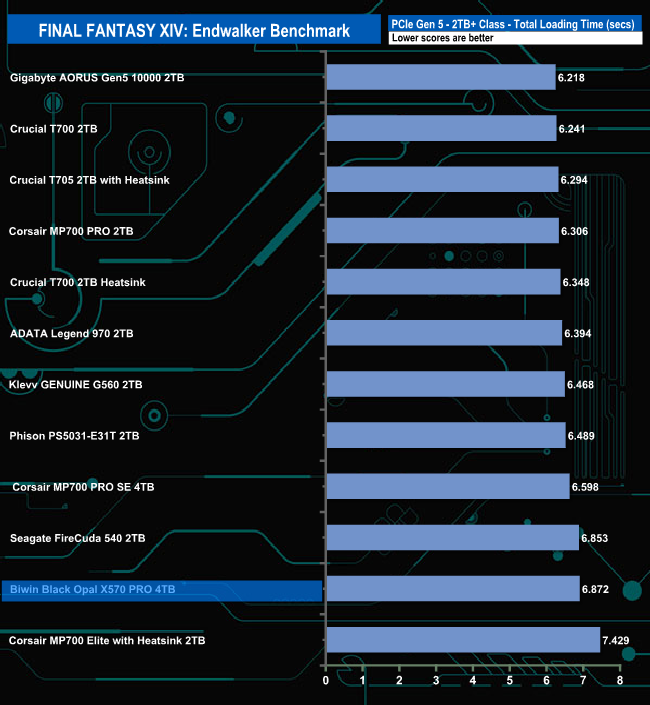
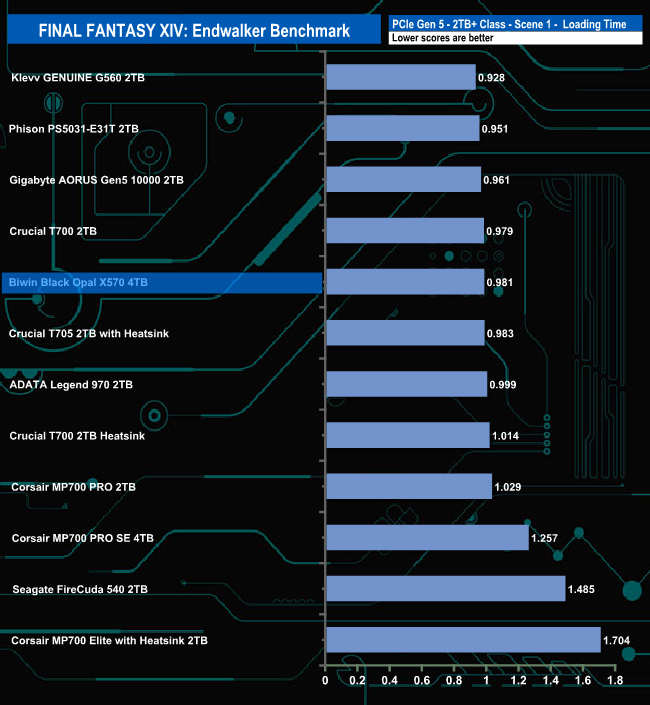
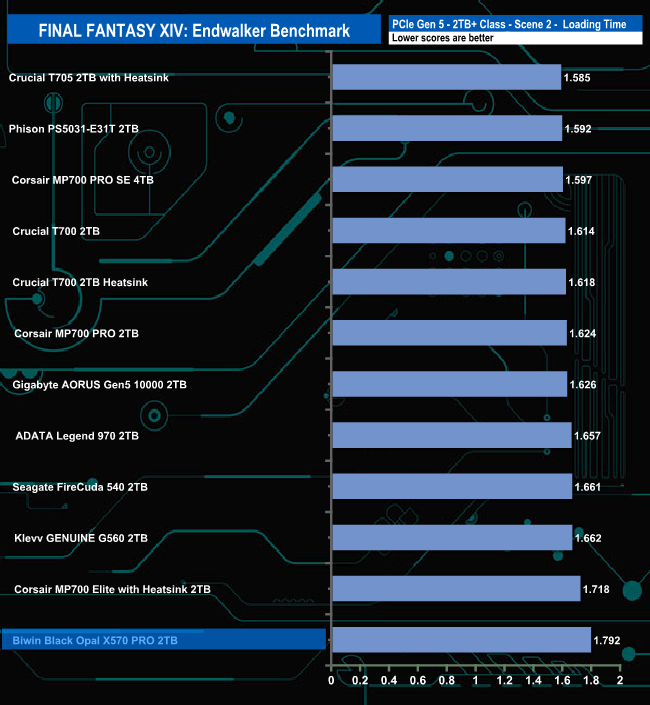
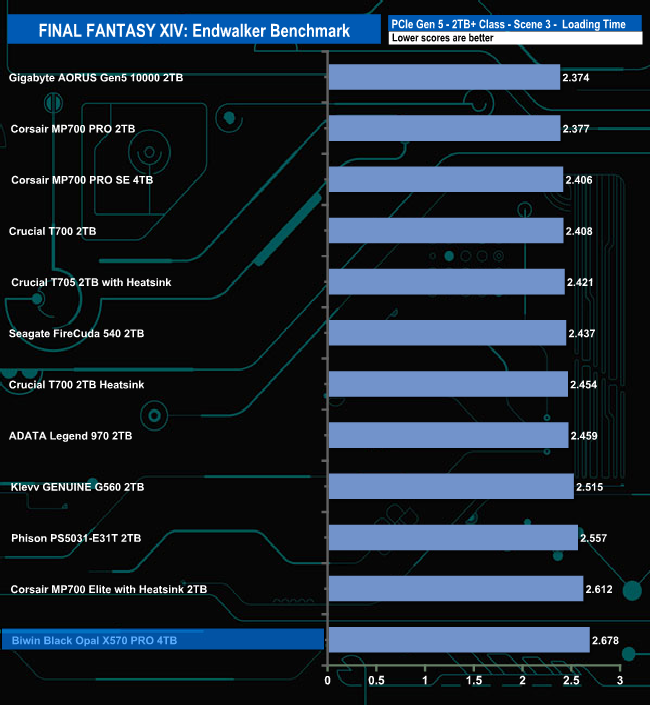
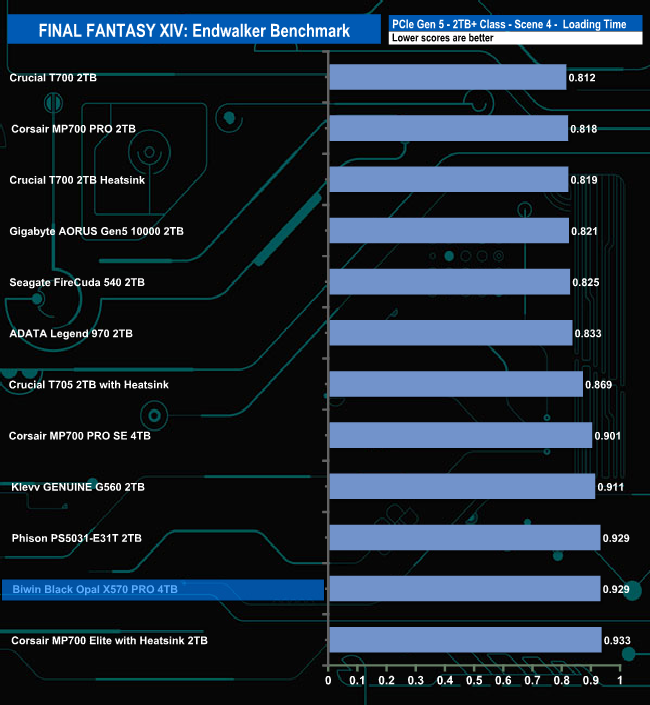
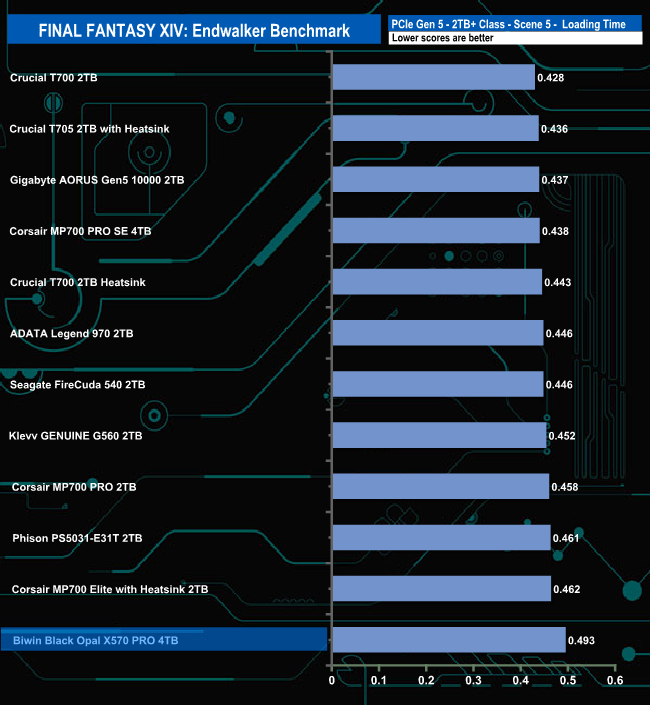
The drive doesn't seem to handle the Final Fantasy XIV Endwalker Official Benchmark particularly well as it ends up in the penultimate position in the overall results chart. The drive appears to handle the Load Scene 1 test the best out of the five traces.
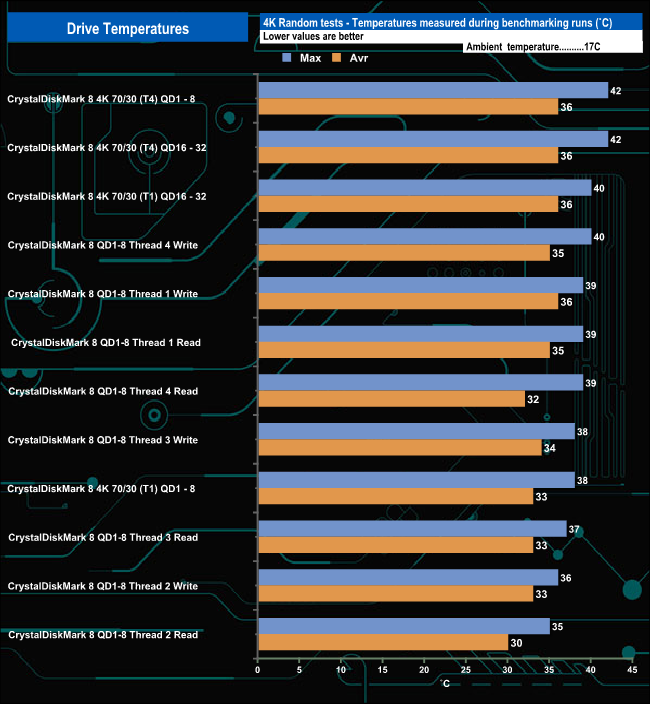
We took note of the drive’s temperature during some of our benchmarking runs.
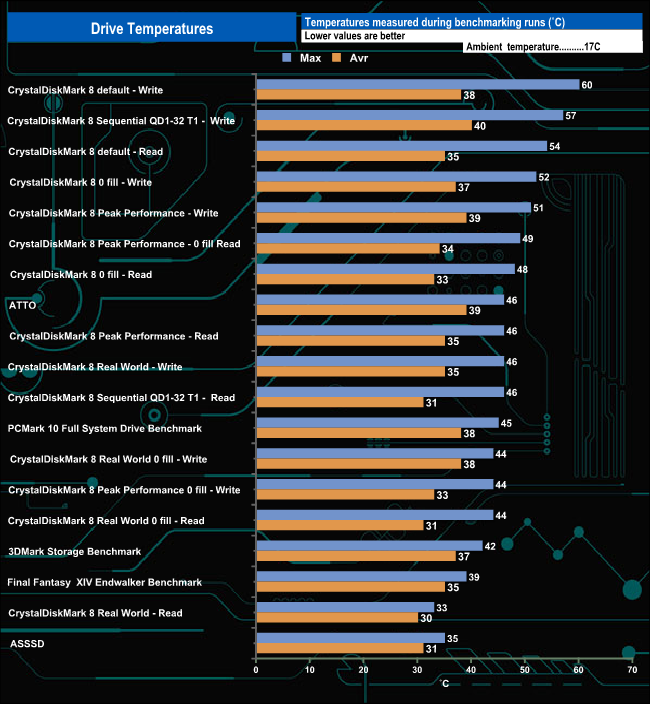
Biwin's Black Opal X570 PRO doesn't come with a heatsink but it does use a graphene thermal pad under the product label, the combination of this and the 6nm design of the controller works well to keep the drive cool, well cool for a Gen5 drive.
The hottest the drive got was when being pushed hard during some of the CrystalDiskMark 8's Write tests where it got to 60° C. For the bulk of our testing the drive averaged 46° C with the 4K focussed tests averaging 38° C.
To test real life performance of a drive we use a mix of folder/file types and by using the FastCopy utility (which gives a time as well as MB/s result) we record the performance of drive reading from & writing to a 2TB Kingston KC3000.
Transfer Details
Data file – 100GB.
File folder – 50GB – 28,523 files.
Movie demos 8K – 21GB – (11 demos).
Raw Movie Clips 4K – 16GB – (9 MP4V files).
Audio Folder – 10GB – 1,483 files – (1479 @ MP3, 4 @ .FLAC files).
Single large image – 5GB – 1.5bn pixel photo.
3D Printer File Folder – 4.25GB – (166 files – 105 @ .STL, 38 @ .FBX, 11 @ .blend, 5 @ .lwo, 4 @ .OBJ, 3@ .3ds).
AutoCAD File Folder – 1.5GB (80 files – 60 @ .DWG and 20 @.DXF).
![]()
![]()
The 4TB Biwin Black Opal X570 PRO averaged 4,216MB when writing the 8 transfer tests, with the fastest being the 7,123MB/s (2.4sec) for the 4K movie folder with the slowest being the 50GB File Folder transfer at 518MB/s (14sec). Reading back the data the average was 5,196MB/s with the 4K movie folder again being the fastest at 6,810MB/s (2.5sec).
Biwin, the Chinese OEM manufacturer of high-performance memory and storage solutions, has just released the company's first Gen 5 SSD, the Black Opal X570 PRO, Black Opal being Biwin's gaming division. The X570 PRO model lineup consists of three capacities, 1TB, 2TB and the flagship 4TB drive.
All three drives have the same Sequential read rating of up to 14,000MB/s, with the 4TB and 2TB drives getting up to 13,000MB/s ratings for Sequential writes while the 1TB drive makes do with 10,500MB/s. As for random performance, all three drives are rated as up to 1,600,000 IOPS for writes with the 2TB and 4TB drives having the same up to 2,000,000 IOPS figure for reads with the 1TB getting up to 1,600,000 IOPS.
At the heart of the X570 PRO is a controller we've never met before and one that carries promise to shake up the Gen 5 market sector as it offers both power efficiency and performance. Silicon Motion’s SM2508 PCIe 5.0 8-channel controller is built on a 6nm process which is key for its power efficiency. The SM2508 uses quad-core ARM Cortex R8 CPU architecture supporting a flash interface running at up to 3600 MT/s. The X570 PRO has the controller combined with 232-layer 3D TLC NAND. The 4TB X570 PRO is a single-sided design using two NAND packages.
Using the default CrystalDiskMark 8 tests we could not only confirm the official up to 14,000MB/s and 13,000MB/s Sequential read/write maximum figures but we got a little more out of the drive with test results of 14,371MB/s for reads and 13,408MB/s for writes.
When it came to random performance we couldn't get close to the official 2,000,000 IOPS maximum figure with our 4-threaded tests. The best random read figure we saw was 510,084 IOPS at QD16. The best write performance also came at QD16, 433,065 IOPS. Switching over to the default Peak Performance Profile in CrystalDiskMark 8, we still couldn't confirm the official maximums but got a lot closer to them with a best read result of 1,885,857 IOPS with 1,494,779 IOPS for writes.
To keep the X570 PRO cool, the drive uses a graphene thermal pad under the product label which together with the 6nm design of the controller works well. The hottest the drive got while under testing was 60° C when it was being pushed hard.
We found the 4TB version of the Biwin Black Opal X570 PRO on Amazon for £499.99 (inc VAT) HERE but until the 7th of March, there is a £60 discount voucher available for the 4TB drive.
Pros
- Overall performance.
- Endurance.
Cons
- Write speeds in some benchmark tests.
KitGuru says: The Biwin Black Opal X570 PRO is an impressive first Gen 5 drive from the company. It offers very good overall performance and thanks to its use of the latest Silicon Motion 6nm Gen 5 controller it doesn't need the usual bulky heatsink as the drive stays cool enough just using a graphene thermal pad.