
Kingston's latest addition to the Fury line of SSD drives is an important one. The Fury Renegade G5 is the company's first consumer drive to use a PCIe 5.0 interface, and we check out the 2TB model that's launching for around £290.
The new Fury Renegade G5 model lineup at launch comprises three capacities: a 1TB entry drive, 2TB (the drive we are reviewing here) and a flagship 4TB model. The Renegade G5 uses a Silicon Motion SM2508 controller combined with what we think is 218-layer 3D TLC NAND.
Kingston quotes the sequential read/write performance of the 2TB drive as up to 14,700MB/s and up to 14,000MB/s respectively. The 1TB drive gets up to 14,200MB/s read and 11,000MB/s write ratings, and the 4TB drive is up to 14,800MB/s reads and the same 14,000MB/s write figure as the 2TB drive.
As for 4K random performance, all three drives have the same up to 2,200K IOPS for reads, the 2TB and 4TB drives get the same up to 2,200K IOPS for writes, with the 1TB drive rated as up to 2,150K IOPS for random writes.
Power consumption for the 2TB model is officially quoted as 0.27W average and 7W maximum. Kingston quotes an endurance figure for the 2TB drive as 2.0PB, and they back the drive with a 5-year warranty.
Physical Specifications:
- Usable Capacities: 2TB.
- NAND Components: 218-layer 3D TLC NAND,
- NAND Controller: Silicon Motion SM2508.
- Cache: 2GB LGDDR4.
- Interface: PCIe Gen 5 x4, NVMe 2.0.
- Form Factor: M.2, 2280.
- Dimensions: 80 x 22 x 2.3mm.
- Drive Weight: 7.7g.
Firmware Version: SGW00110
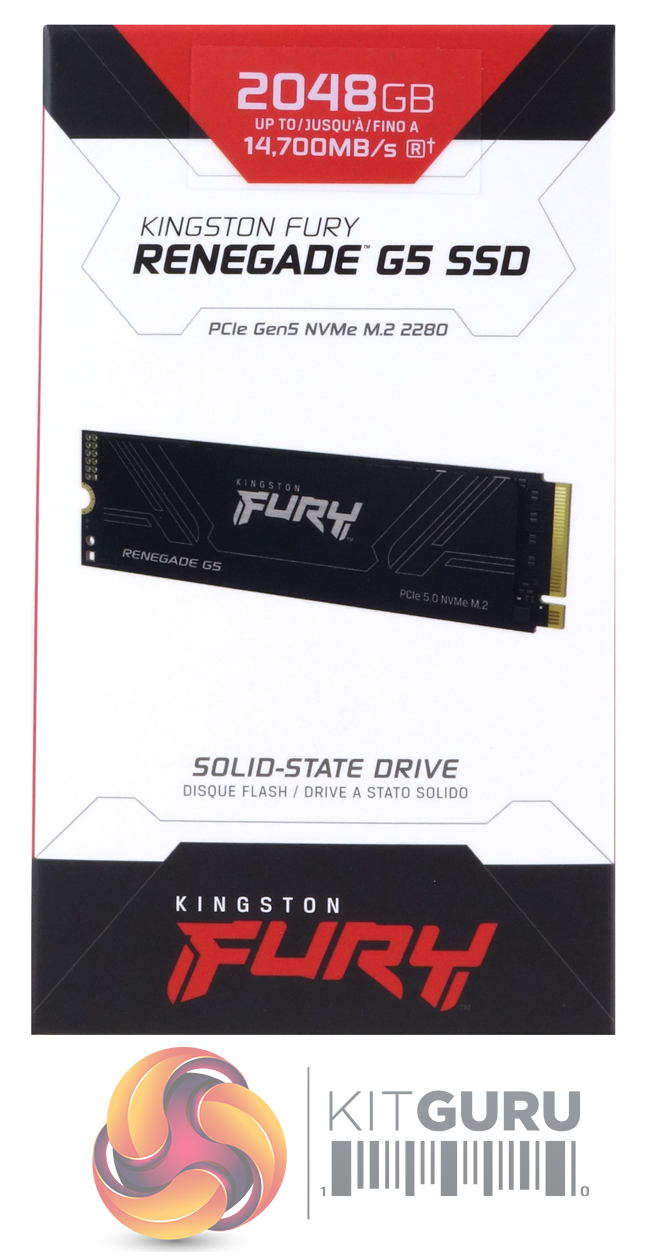
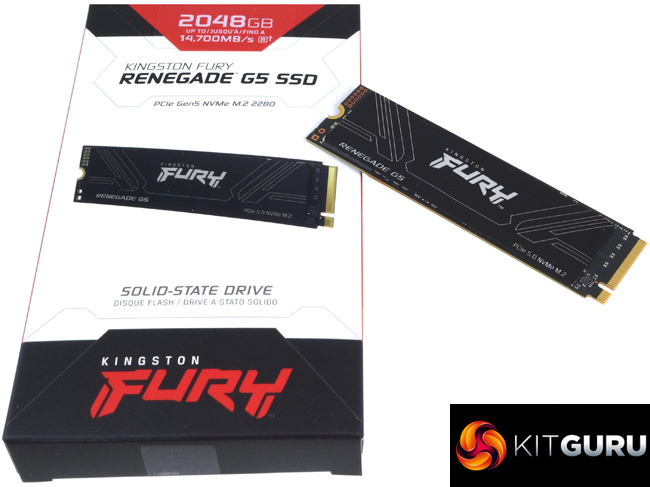
The front of the box has a large, clear image of the drive on it. Above the image is a line of text displaying that the drive is a PCIe 5.0 NVMe M.2 design. At the top of the box is a label which shows the drive's capacity and its maximum sequential read speed.
On the back, there is a small window to show the drive in the box. The rest of the rear panel is covered in multilingual marketing notes.
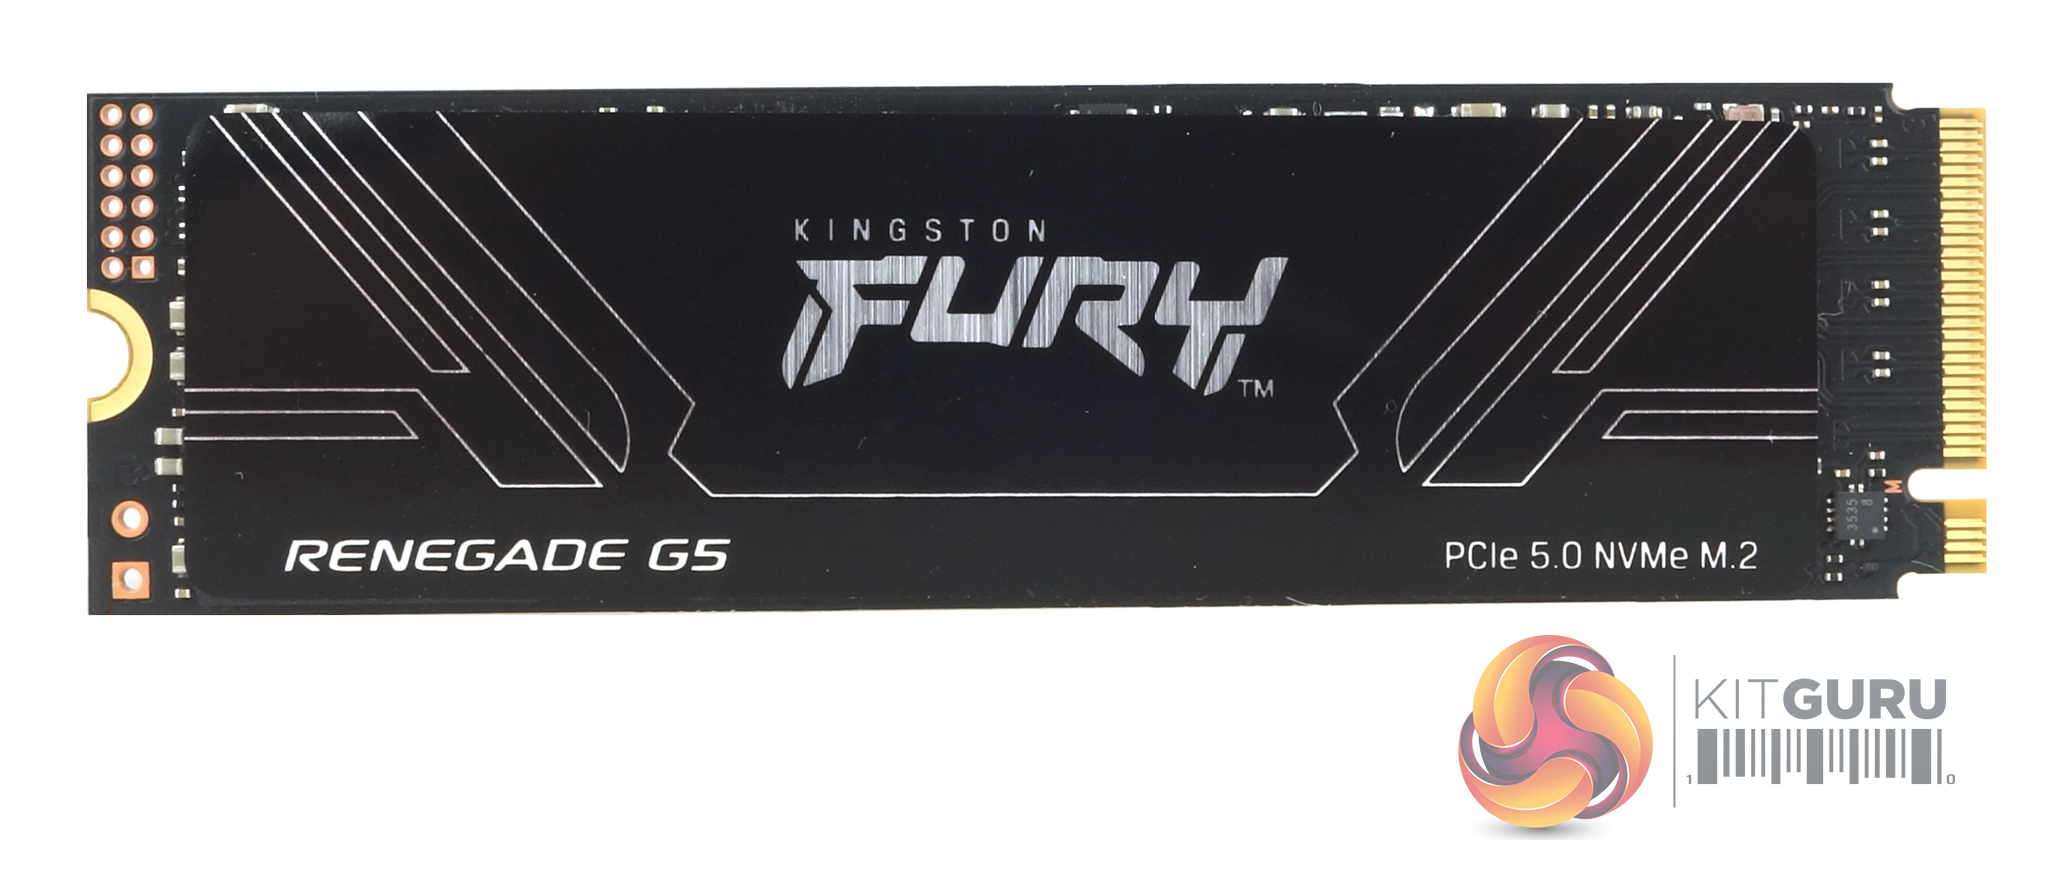
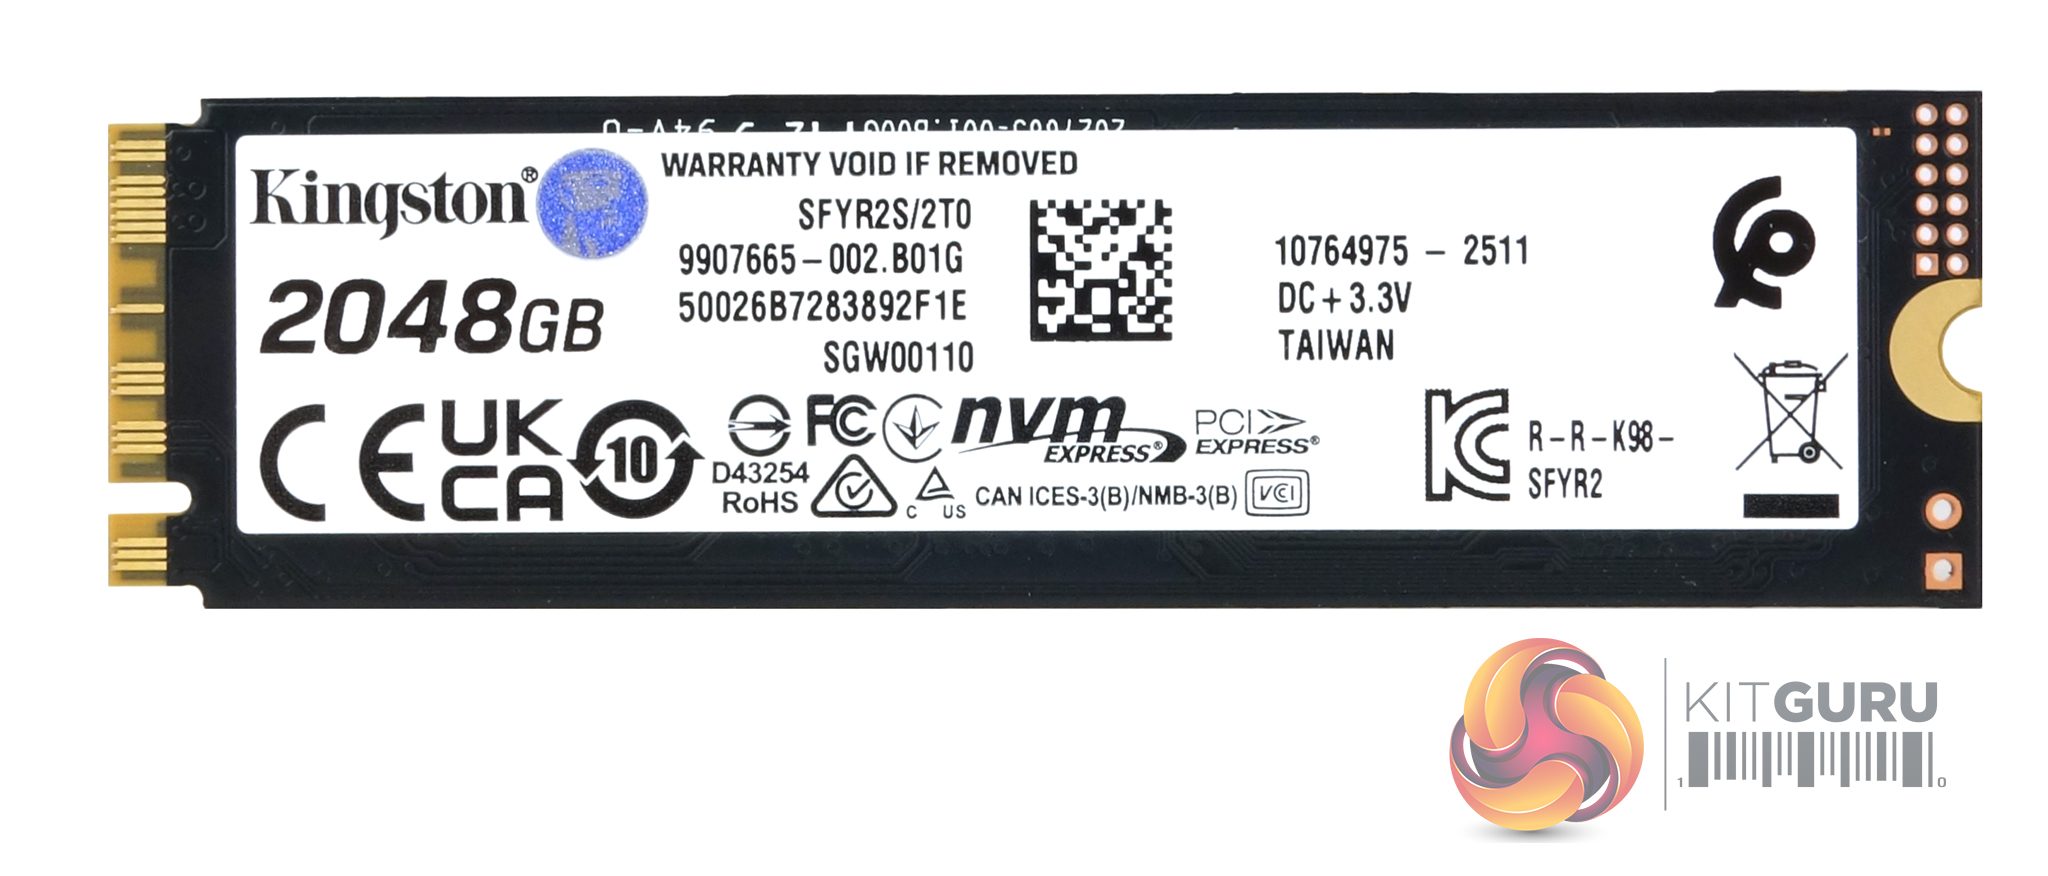
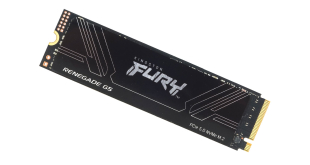
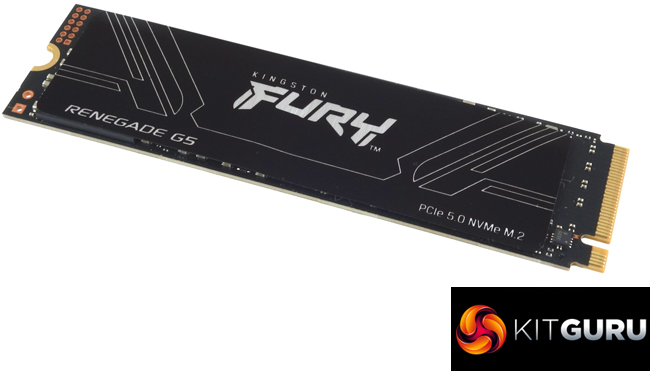
Kingston Fury Renegade G5 is a single-sided design, so all components are on one side of the 12-layer PCB.
Along with the Silicon Motion SM2508 eight-channel controller, there are two Kingston-branded 1TB NAND packages. We couldn't decode the serial number, but searching around the web, it seems it could be re-branded 218-layer 3D TLC NAND. There is also a 2GB low-power DDR4 DRAM IC.
The 8-channel controller has been designed to offer both high performance and power efficiency. Using a 6nm process together with a proprietary built-in smart clock-gating mechanism, which intelligently and automatically powers down unused blocks, allows the SM2508 to be very efficient when it comes to power consumption (Silicon Motion claim 30% active power reduction over the previous generation IC). The SM2508 uses a quad-core ARM Cortex R8 CPU that supports four 32Gb/s PCIe lanes. The NAND channels have a bus rate of up to 3,600 MT/s each which provides up to 14.5 GB/s and 14 GB/s sequential (read and write, respectively) performance and up to 2.5M/2.5M IOPS random read/write performance.
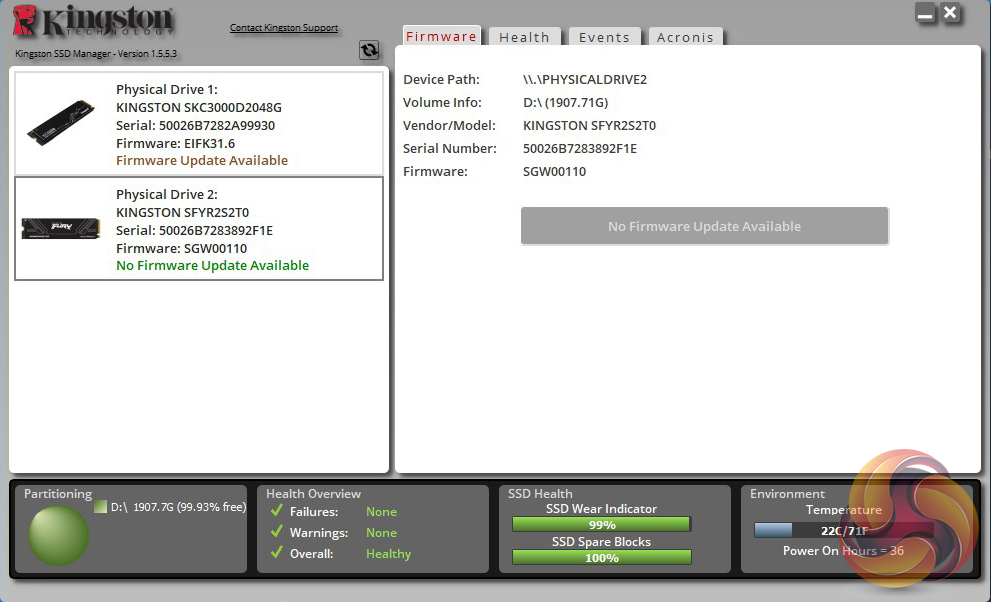
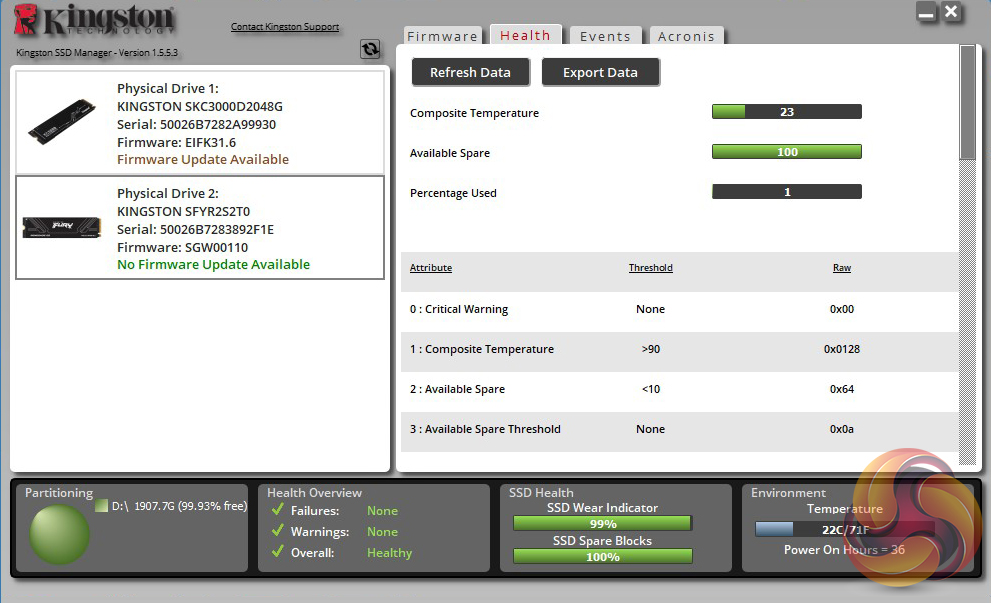
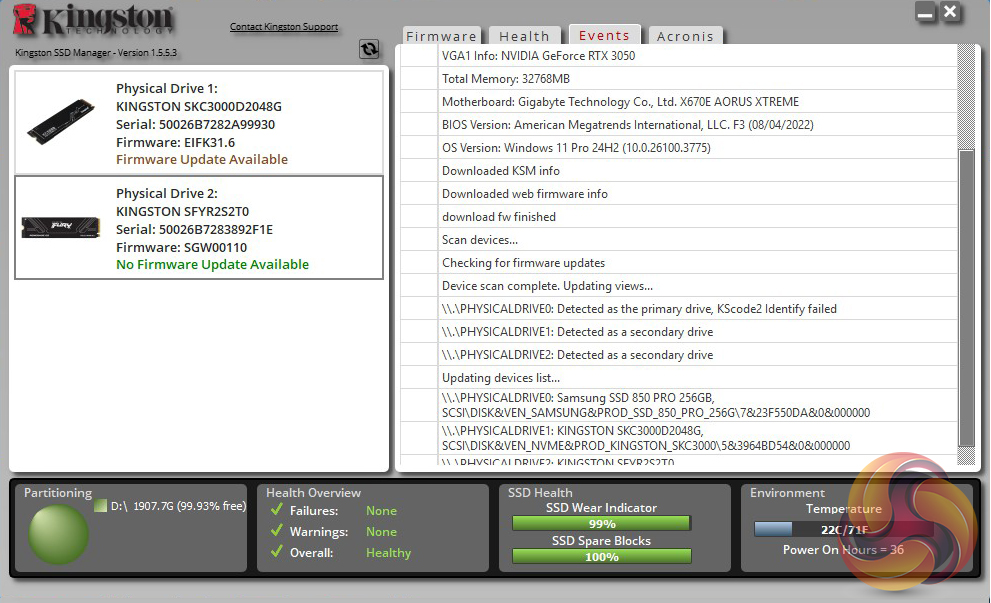
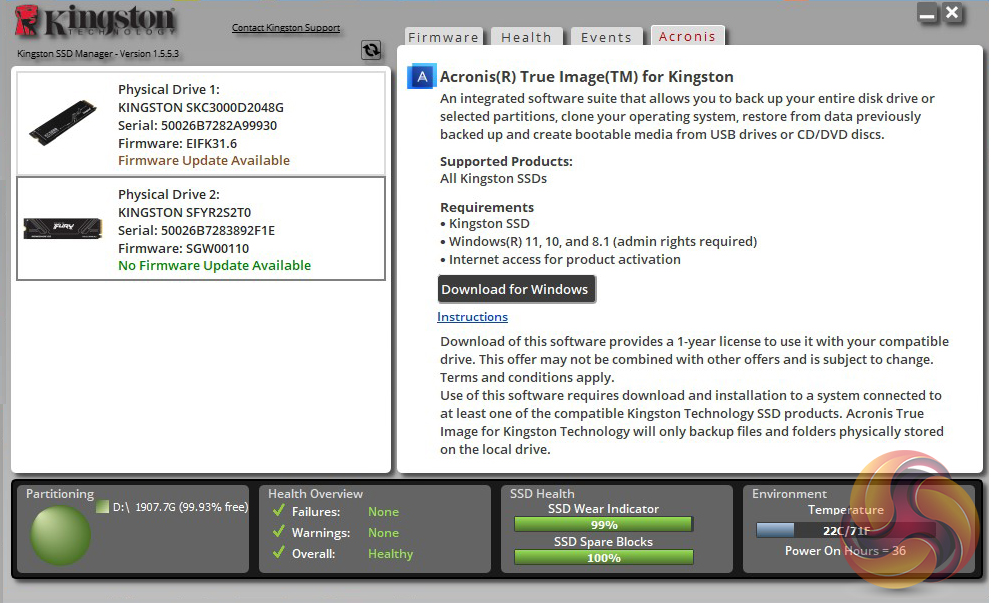
Kingston’s SSD management utility is called SSD Manager (version v1.5.5.3 at the time of testing the drive). It automatically detects any firmware updates, displays drive status, temperatures and SMART information, as well as a link to download Acronis imaging/cloning software.
For testing, the drives are all wiped and reset to factory settings by HDDerase V4. We try to use free or easily available programs and some real-world testing so you can compare our findings against your own system.
This is a good way to measure potential upgrade benefits.
Main system:
AMD Ryzen 7 7700X, 32GB DDR5-6000, Nvidia GeForce RTX 3050 and a Gigabyte AORUS X670E Xtreme motherboard.
Other drives
Biwin Black Opal X570 PRO 4TB
Biwin Black Opal X570 PRO 2TB
ADATA Legend 970 2TB
Corsair MP700 PRO SE 4TB
Corsair MP700 PRO 2TB
Corsair MP700 Elite 2TB
Crucial T705 2TB
Crucial T700 2TB
Crucial T700 with Heatsink 2TB
Gigabyte AORUS 10000 2TB
Kioxia Exceria Plus G4 2TB Gen 5
Klevv Genuine G360 2TB
Samsung SSD 9100 PRO 2TB
Seagate FireCuda 520 2TB
Software:
Atto Disk Benchmark 4.
CrystalMark 8.0.0.
AS SSD 2.0.
IOMeter.
UL Solutions PC Mark 10.
UL Solutions 3DMark Storage Benchmark.
Final Fantasy XIV Endwalker Official Benchmark.
All our results were achieved by running each test five times with every configuration this ensures that any glitches are removed from the results. Trim is confirmed as running by typing fsutil behavior query disabledeletenotify into the command line. A response of disabledeletenotify =0 confirms TRIM is active.
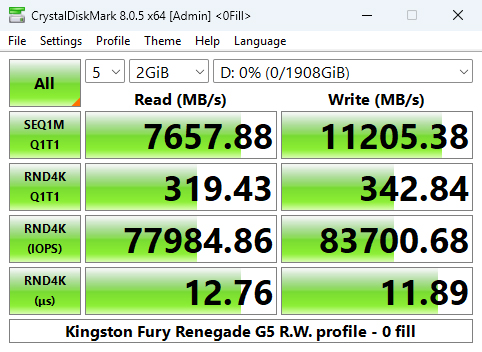
CrystalDiskMark is a useful benchmark to measure theoretical performance levels of hard drives and SSDs.. We are using v8.0.5.
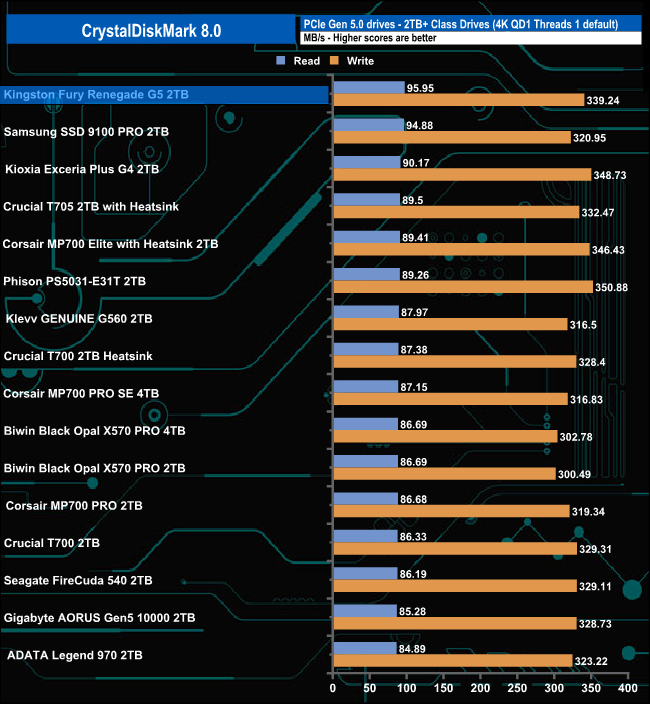
With a read result of 95.95MB/s in the CrystalDiskMark 8 4K QD1 T1 test, Kingston's Fury Renegade G5 is in first place on the results chart. Its write score of 339.24MB/s is the fourth fastest we've seen in this test.
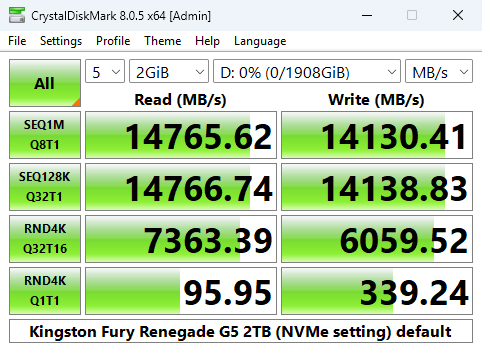
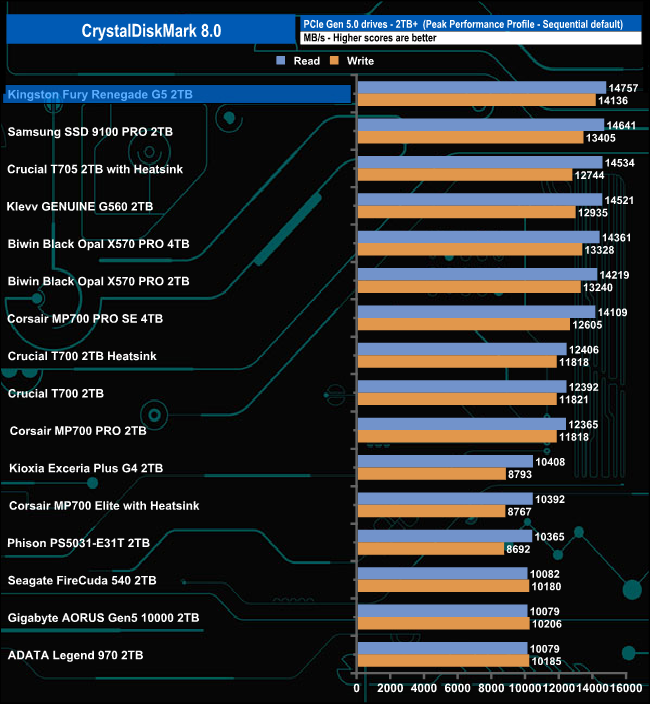
A glance at the benchmark result screens shows that we could confirm the official Sequential ratings of up to 14,700MB/s for reads and up to 14,000MB/s for writes, with test results of 14,765MB/s and 14,130MB/s for reads and writes, respectively.
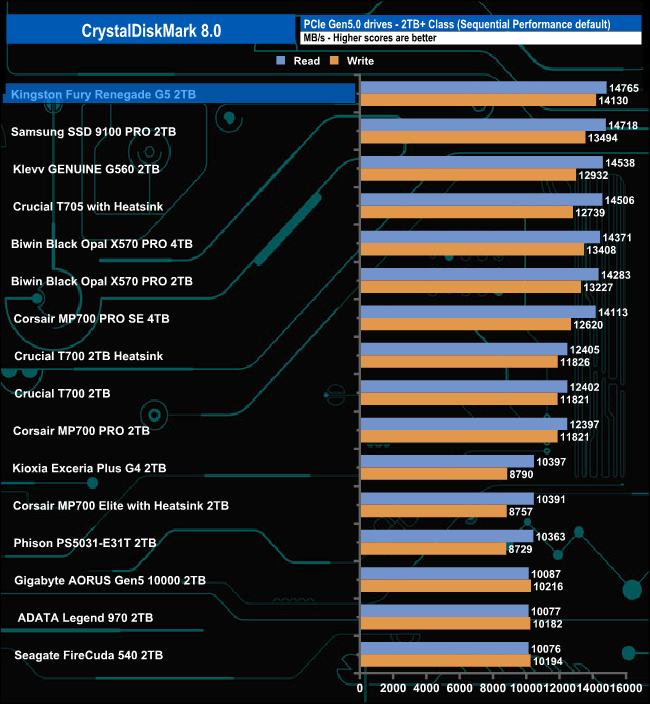
That 14,765MB/s read result places the 2TB Fury Renegade G5 in first place on the results chart, the write test is also the fastest we've seen to date in this test.
Peak Performance profile benchmark
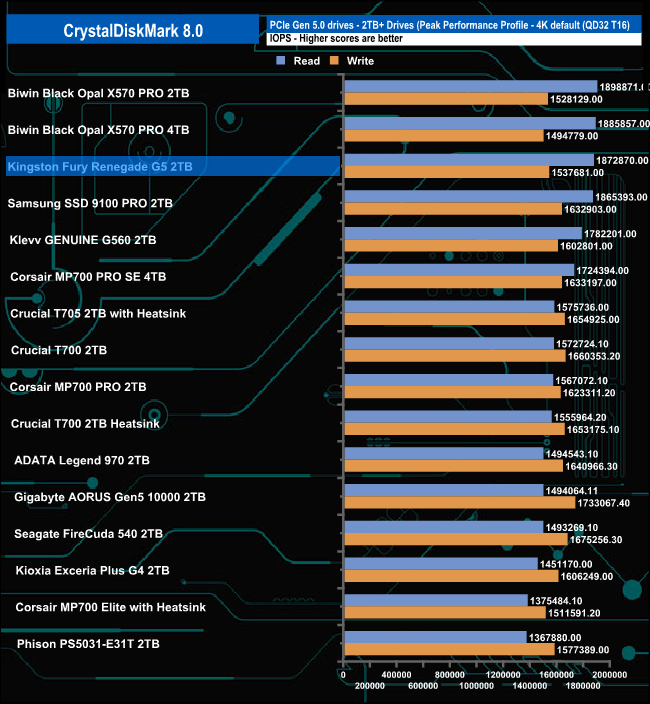
The 2TB Fury Renegade G5 is officially rated as up to 2,200K IOPS for random reads and random writes. Using the Peak Performance profile test of CrystalDiskMark 8, we couldn't get to those official maximums. The best read result we saw was 1,872,870 IOPS with the best write figure at 1,537,681 IOPS, which sees the drive in third spot on the result graph.
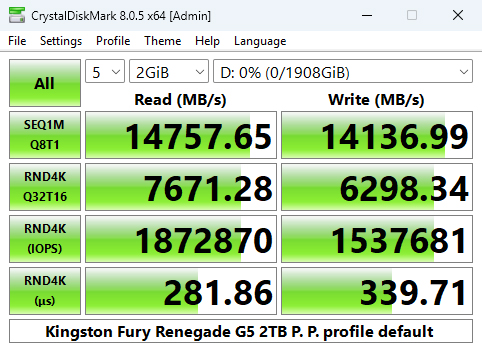
Once again, we could confirm the official sequential figures with Peak Performance profile test results of 14,757MB/s for reads and 14,136MB/s for writes.
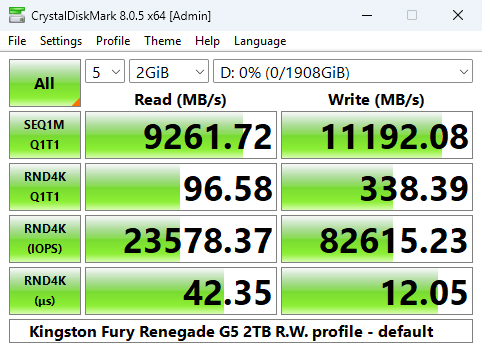
Real World profile benchmark
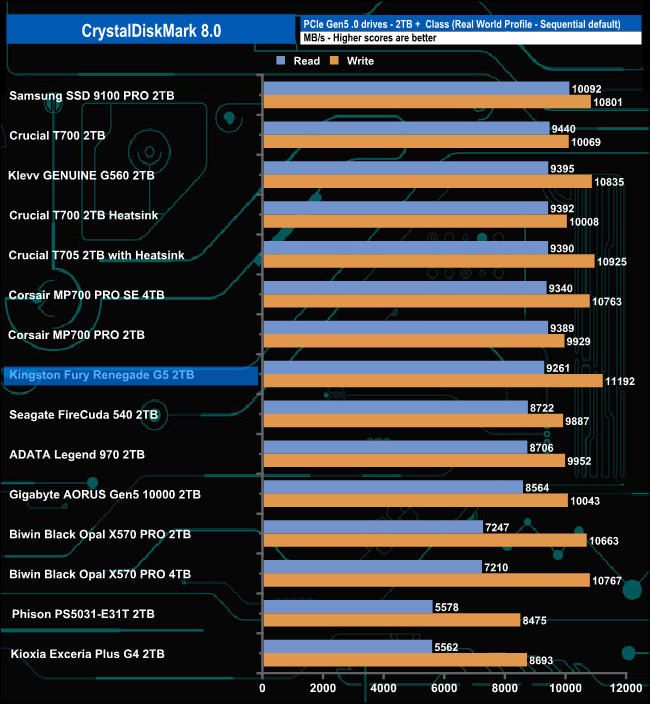
The 2TB Kingston Fury Renegade G5 ‘s read score in the CrystalDiskMark 8 Real World benchmark sees the drive in a mid-table position, but its write test result of 11,192MB/s is the fastest we've seen to date in this test.
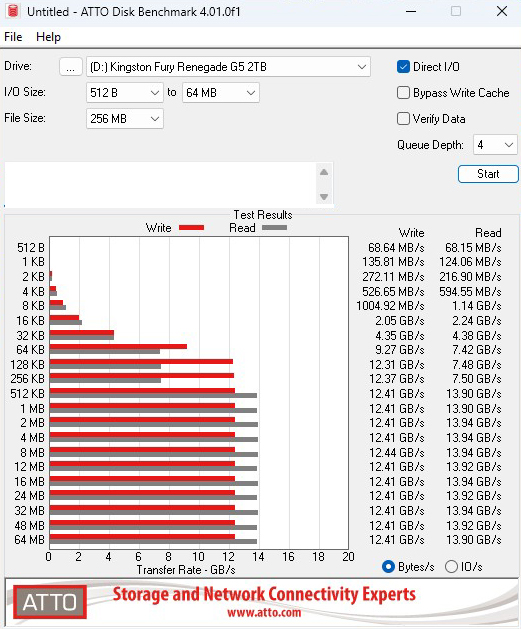
The ATTO Disk Benchmark performance measurement tool is compatible with Microsoft Windows. Measure your storage system's performance with various transfer sizes and test lengths for reads and writes. Several options are available to customise your performance measurement, including queue depth, overlapped I/O and even a comparison mode with the option to run continuously. Use ATTO Disk Benchmark to test any manufacturer's RAID controllers, storage controllers, host adapters, hard drives and SSD drives and notice that ATTO products will consistently provide the highest level of performance to your storage. ATTO uses RAW or compressed data.
We are using version 4.1 for our NVMe disk tests with a set length of 256MB and test both the read and write performance.
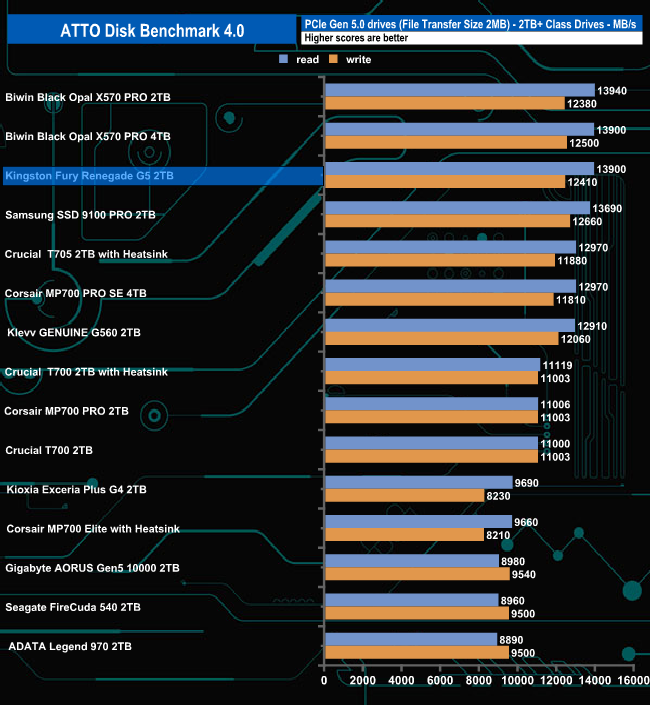
Using the ATTO benchmark, we couldn't hit the official read and write sequential figures of up to 14,700MB/s and 14,00MB/s for reads and writes, respectively, but with test figures of 13,900MB/s for reads and 12,410MB/s for writes, we got close. Those result figures may be shy of the official maximums, but they are good enough to put the drive in third spot on the results chart.
AS SSD is a great free tool designed just for benchmarking Solid State Drives. It performs an array of sequential read and write tests, as well as random read and write tests with sequential access times over a portion of the drive. It uses incompressible data samples, which many drives struggle with, so results can be viewed as the worst-case scenarios.
AS SSD includes a sub suite of benchmarks with various file pattern algorithms but this is difficult in trying to judge accurate performance figures.
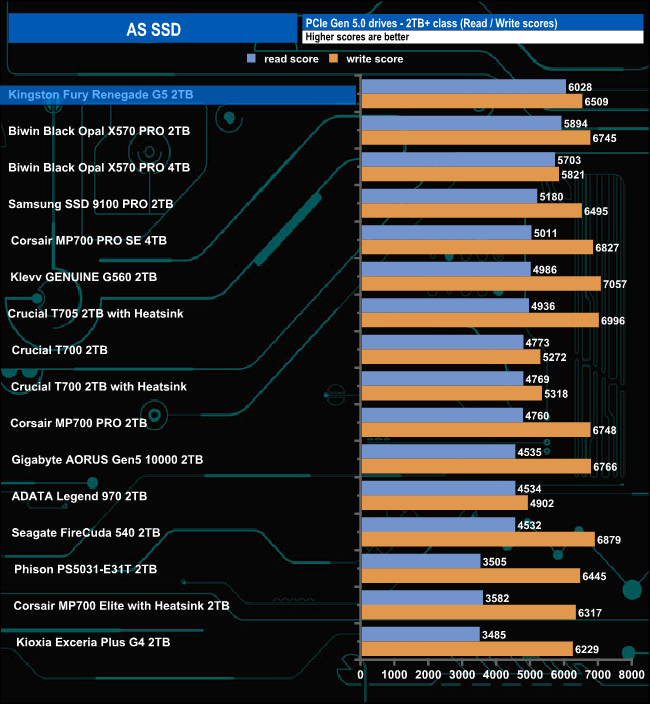
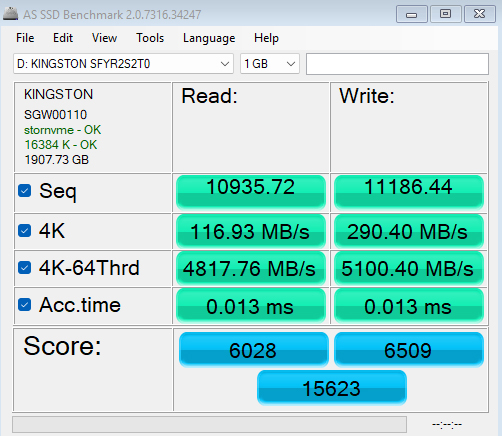
The Kingston Fury Renegade G5's read score of 6028 in the AS SSD benchmark sees it in first place in the results table. However, its write score of 6509 isn't as strong.
We used CrystalDiskMark 8‘s custom settings to test the Sequential read and write performance of the drive through a range of queue depths. The setup for the tests is listed below.
128KB Sequential Read / Write.
Transfer Request Size: 128KB, Thread(s): 1, Outstanding I/O: 1-32.
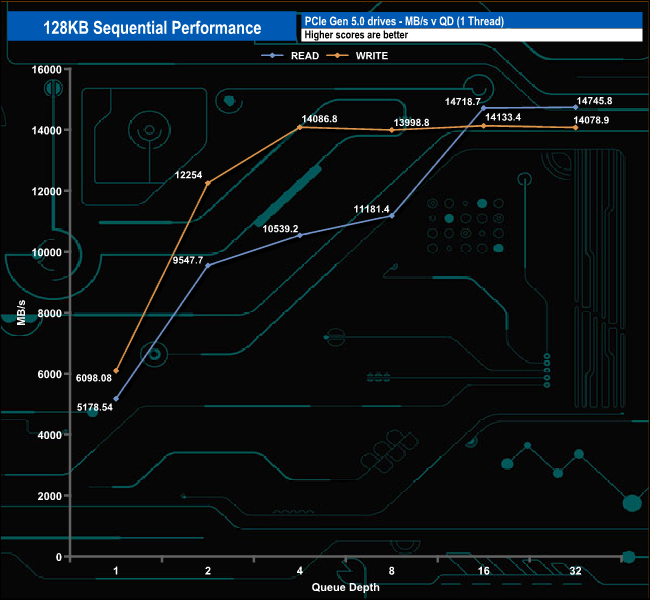
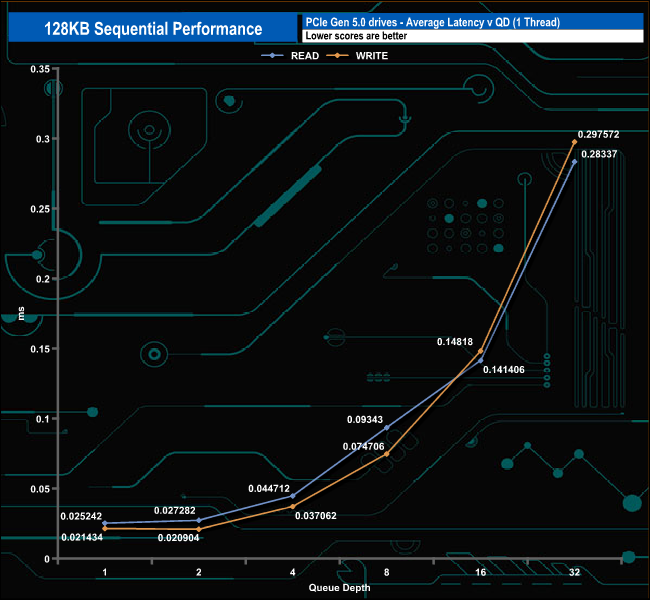
Using this Sequential test, the results confirmed the official Sequential ratings of the drive of up to 14,700MB/s and 14,000MB/s for read and write, respectively, with figures of 14,745MB/s for reads (QD32) and 14,133MB/s (QD16) for writes.
128KB Sequential Read v QD performance compared
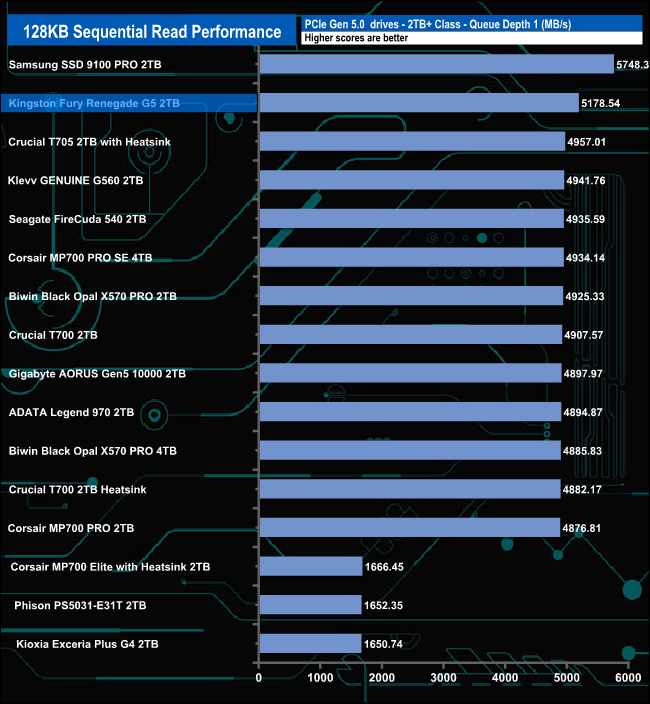
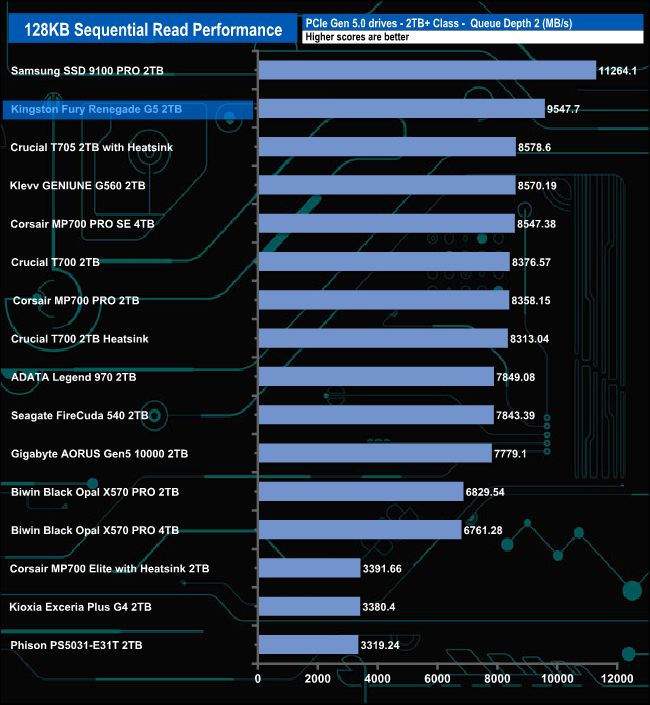
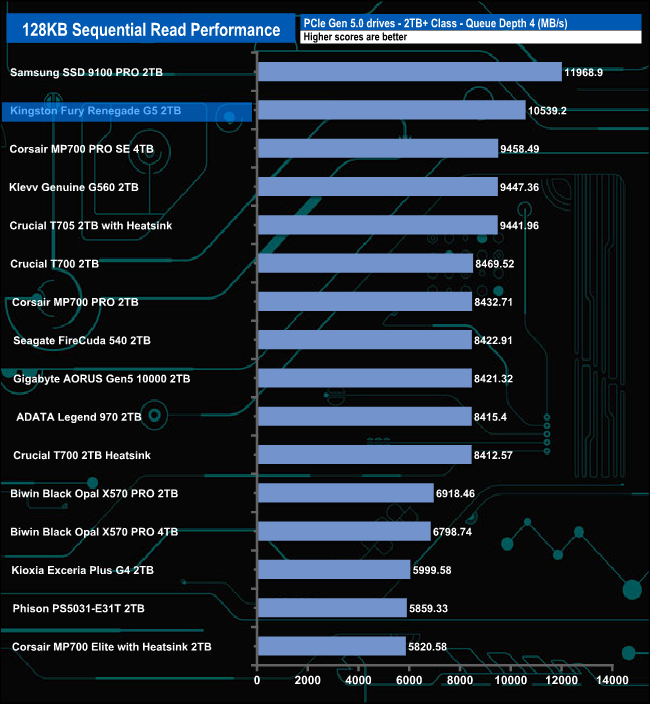
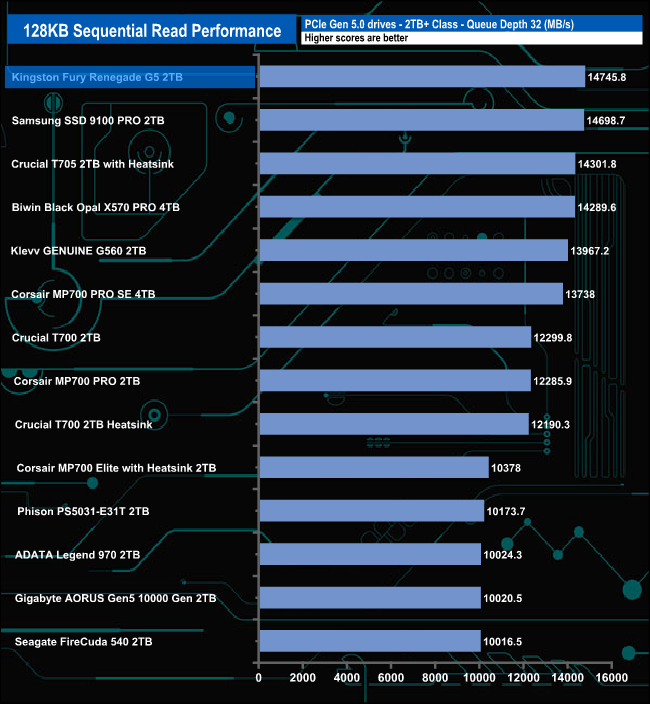
At QDs 1, 2 and 4, the drive sits in second place in the results charts, but at QD32 it's the fastest drive we've seen to date in this test.
128KB Sequential Write v QD performance compared
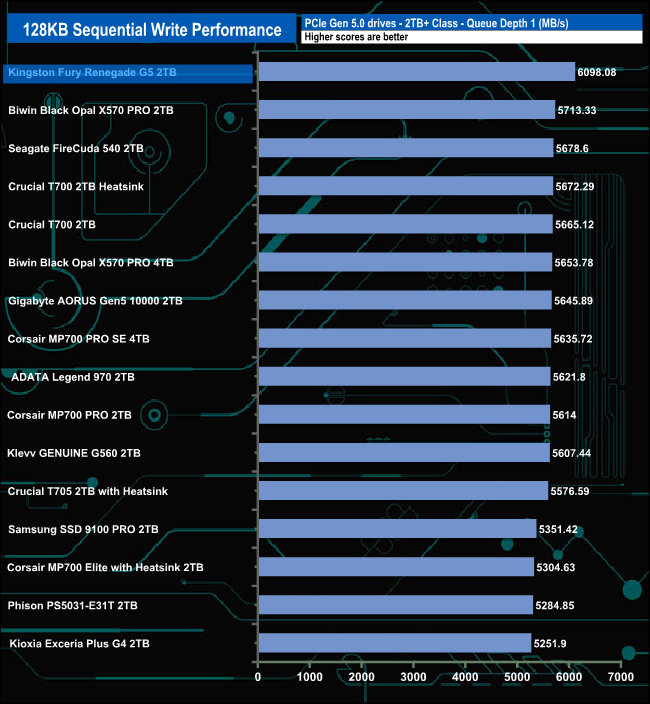
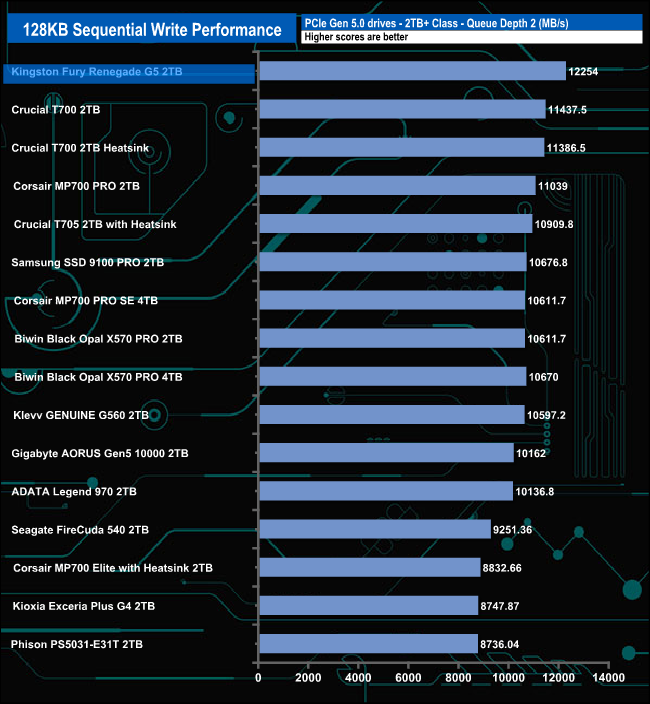
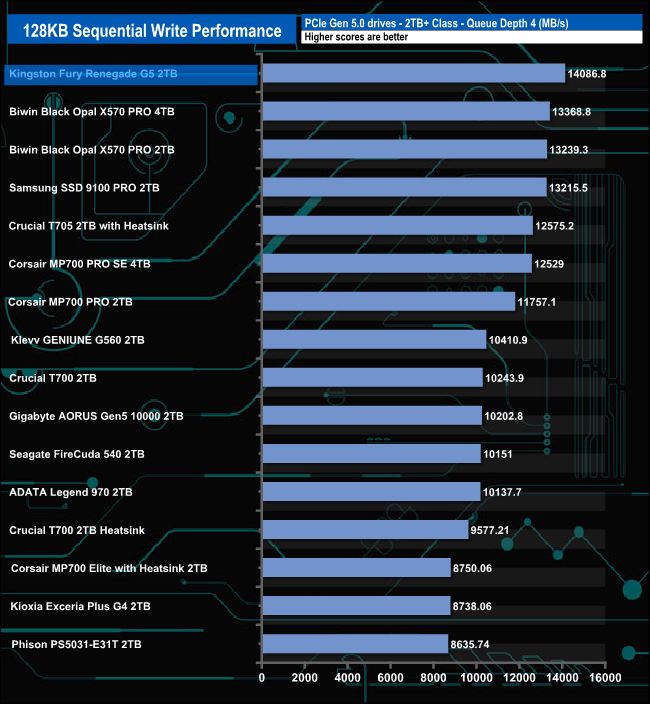
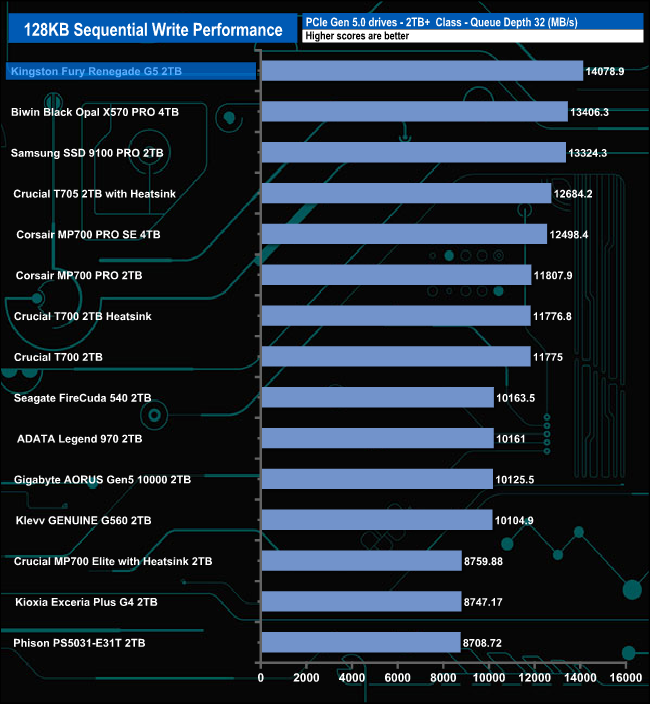
When it comes to the Sequential writes, the drive is very consistent, sitting in the top spot of the results chart across all the tested queue depths.
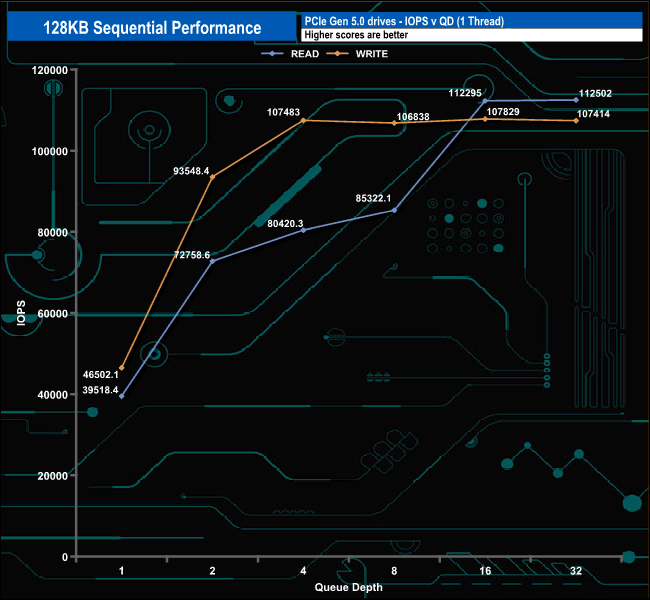
We used CrystalDiskMark 8‘s custom settings to test the 4K random read performance of the drive through a range of queue depths. The setup for the tests is listed below.
Transfer Request Size: 4KB, Outstanding I/O: 1-32.
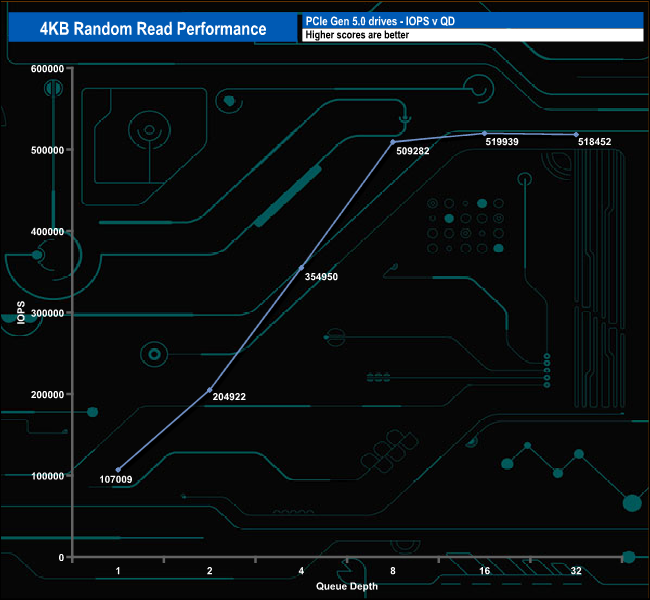
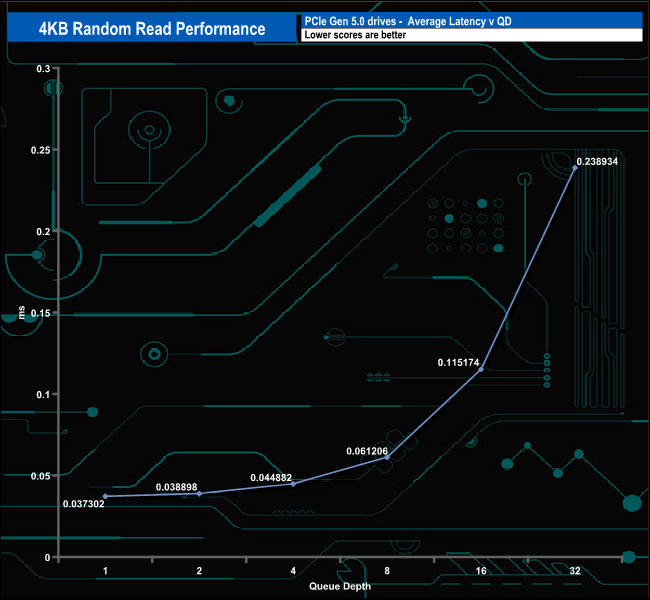
Using our 4-threaded random read 4K tests, we couldn't get close to the official maximum of 2,200,000 IOPS. The best test result was 519,939 IOPS at a queue depth of 16 before the performance backed off a little to finish the test run at 518,452 IOPS (QD32).
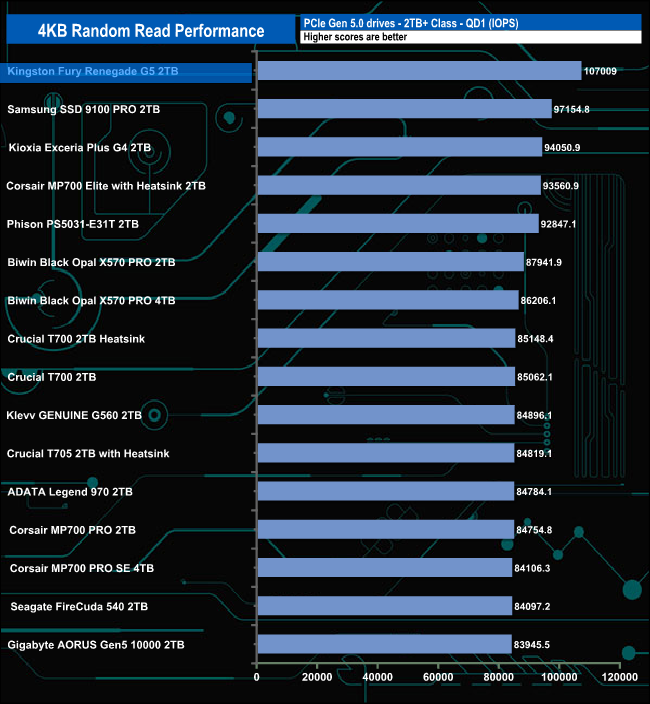
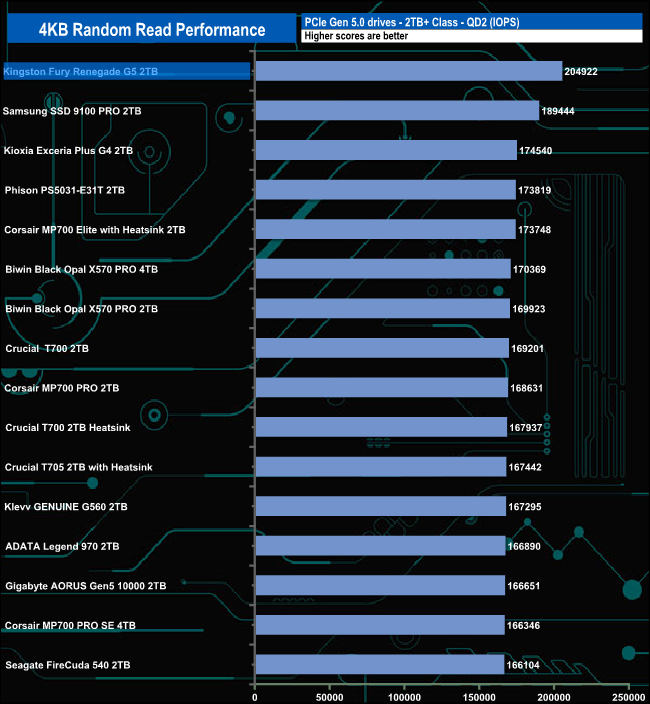
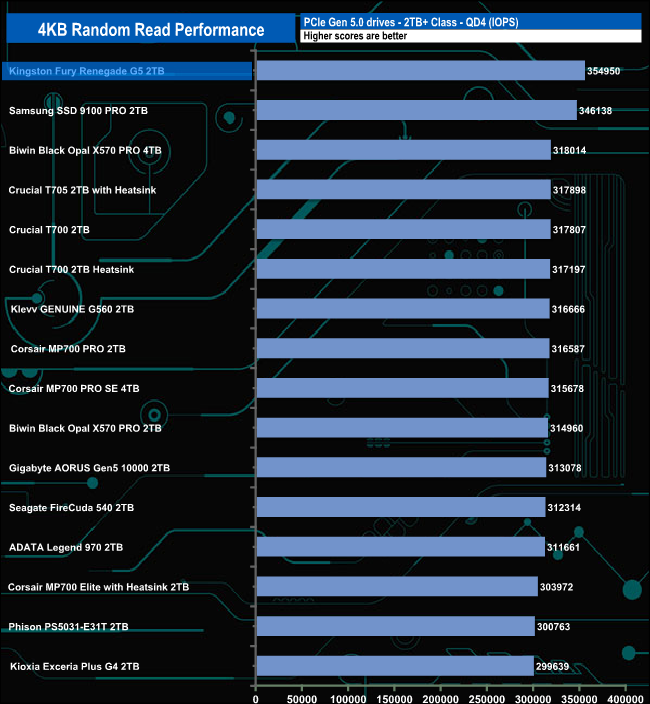
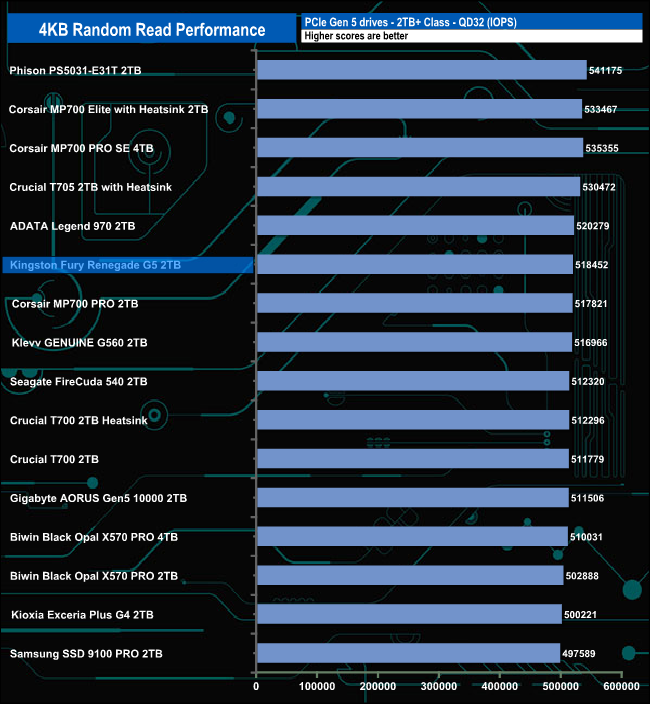
Even though our 4K random read test results were nowhere close to the official maximum figure at any stage, the drive sits in the top spot at QD1, 2 and 4, by quite a margin. However, at QD32, it has slipped down the chart, ending up in sixth place.
We used CrystalDiskMark 8‘s custom settings to test the 4K random write performance of the drive through a range of queue depths. The setup for the tests is listed below.
Transfer Request Size: 4KB, Outstanding I/O: 1-32.
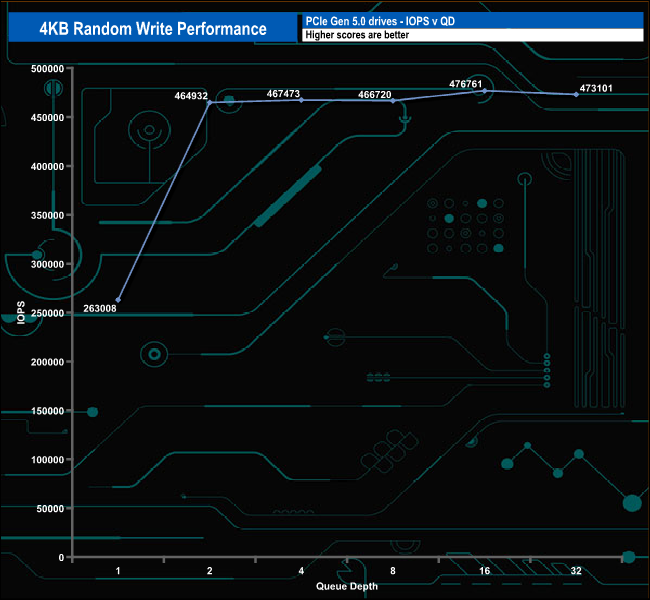
The best result we saw from our 4K random write results was even further away from the official maximum IOPS figure (2,200,000 IOPS) than the random reads at 476,761 IOPS (QD16). The drive finished the test run at 473,101 IOPS (QD32).
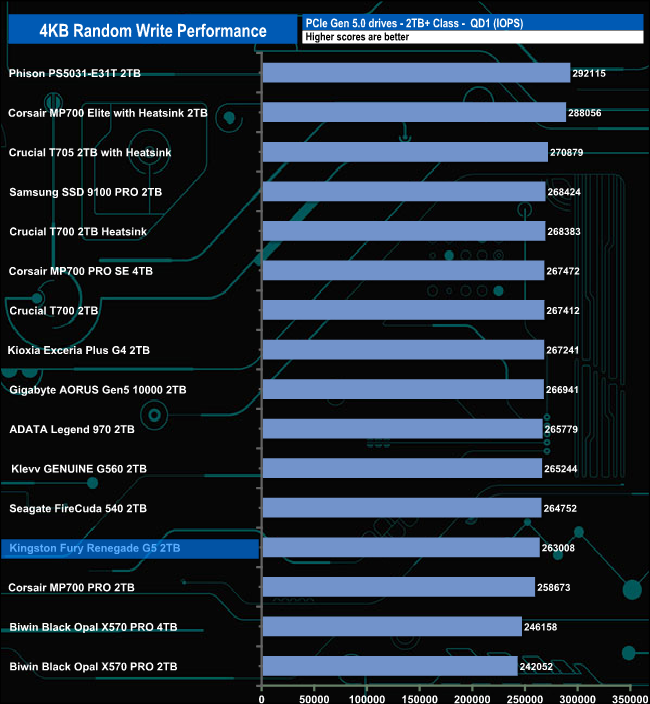

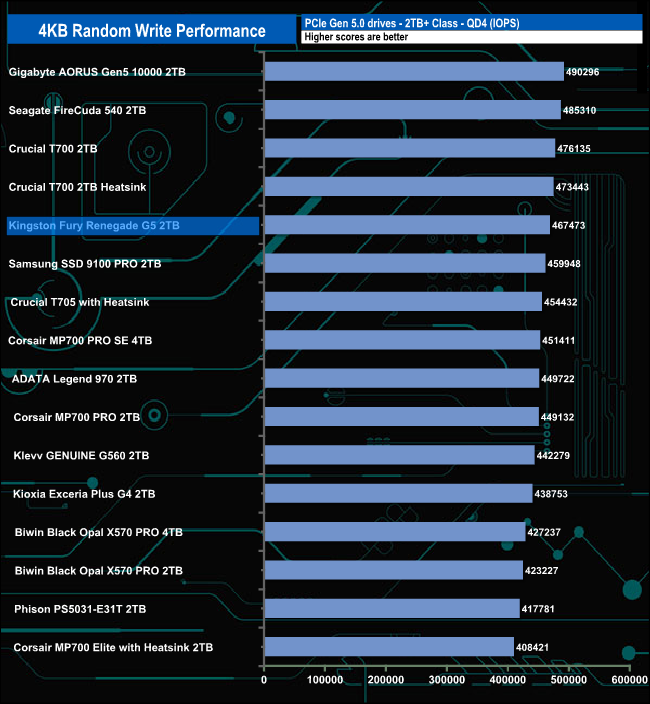
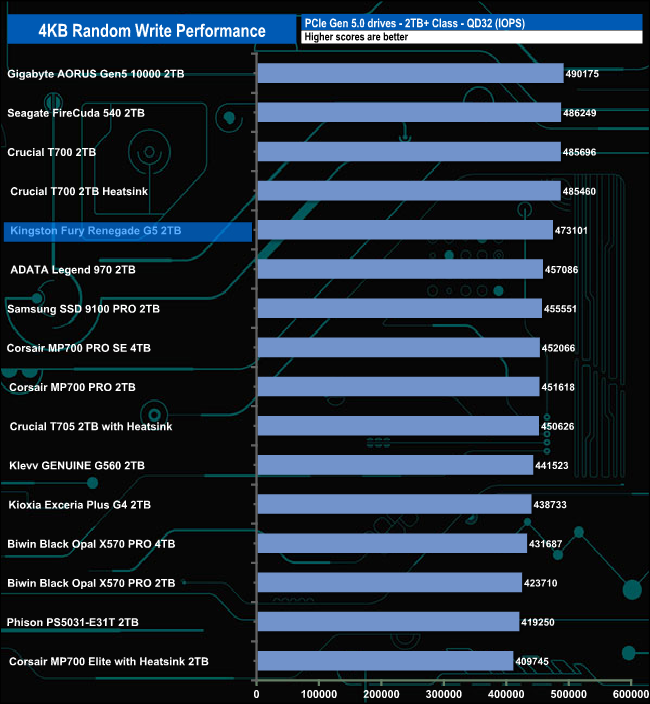
At QD1, the drive sits close to the bottom of the chart, but as the tested queue depths deepen, the performance improves, placing the drive in the top five for all the remaining tested queue depths.
We used CrystalDiskMark 8’s custom settings to test the 4K 70/30 mixed read/write performance of the drive through a range of queue depths using a single thread and four threads.
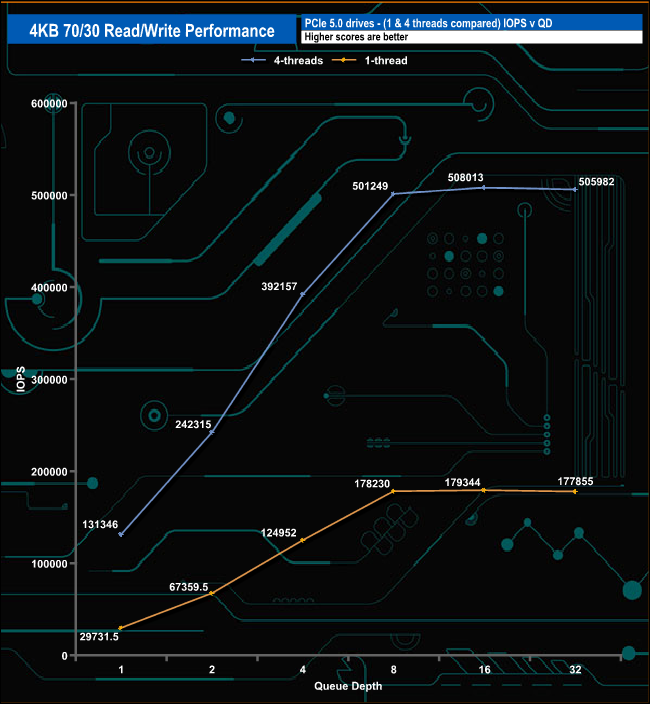

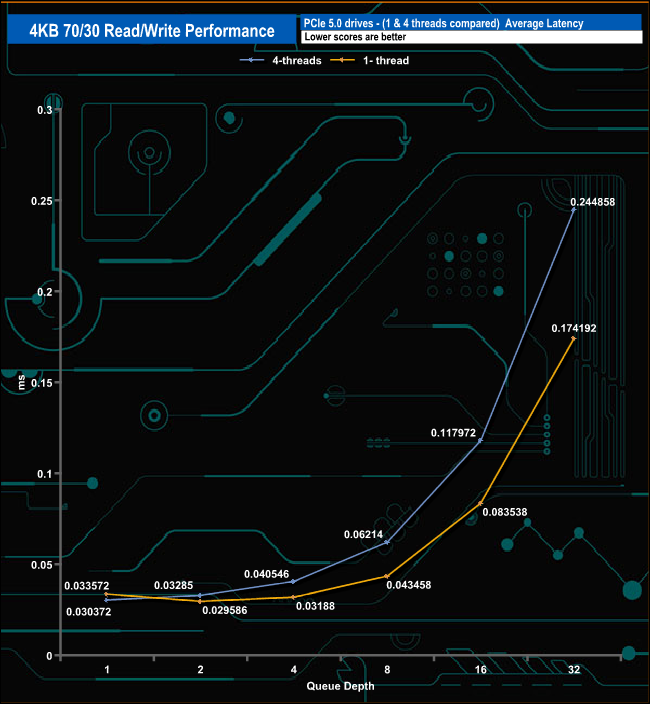
In our 4K 70/30 read/write tests, the 2TB Kingston Fury Renegade G5 peaked at the QD16 mark using both single and four threads, before the performance began to drop back. Using four threads, the drive accelerates from 131,346 IOPS (537.994MB/s) at QD1 up to 508,013 IOPS (2,080MB/s) at QD16. From this point, the rate of performance begins to slow, finishing the test run at 505,982 IOPS (2,072MB/s) at QD32.
Switching over to a single thread, the drive climbs from 29,731 IOPS (121.79MB/s) up to 179,344 IOPS (734.59MB/s) at QD16. The drive finishes the test run at QD32 with the performance dropping back to 177,855 IOPS (728.49MB/s).
We used CrystalDiskMark 8 to test the random performance of the drive at lower queue depths (QD1 – QD8 where most of the everyday workloads occur) using 1 to 4 threads.
Random Reads
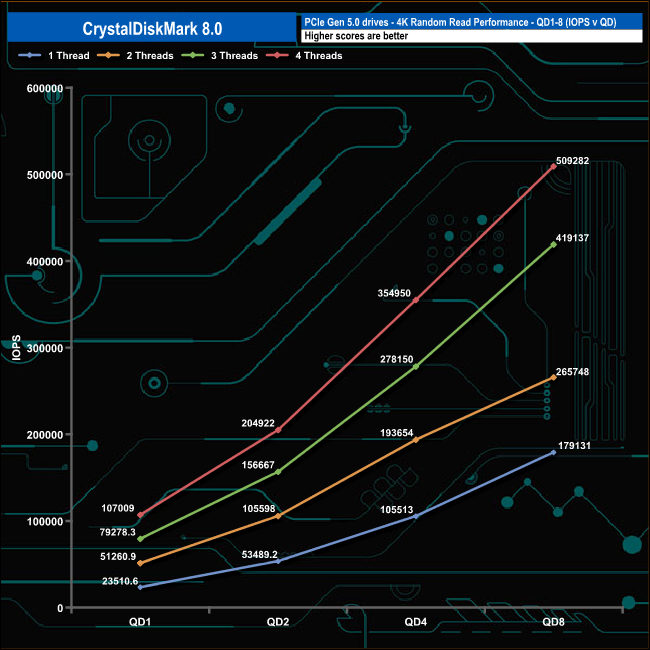
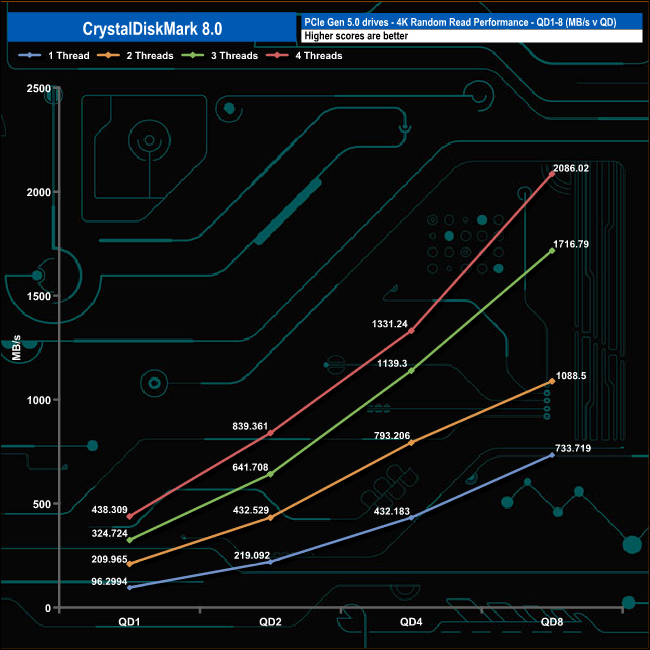

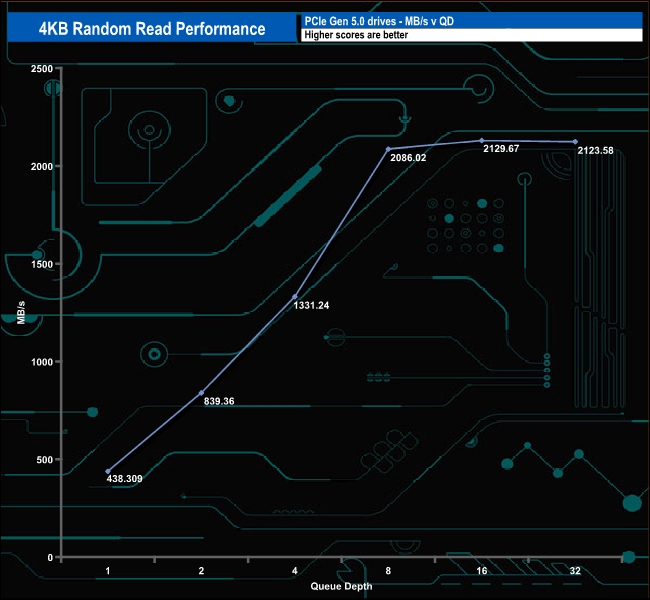
In the QD1-QD8 random read tests, the drive produced smooth increases in performance as the queue depth deepened without any noticeable dramas. At QD1, the drive speed ranges from 23,510 IOPS (96.29MB/s) using a single thread up to 107,009 IOPS (438.30MB/s) using four threads. At a QD of 8, the single-thread performance had increased to 179,131 IOPS (733.71MB/s) while the four-threaded test reached 509,282 IOPS (2,086MB/s).
Random Write
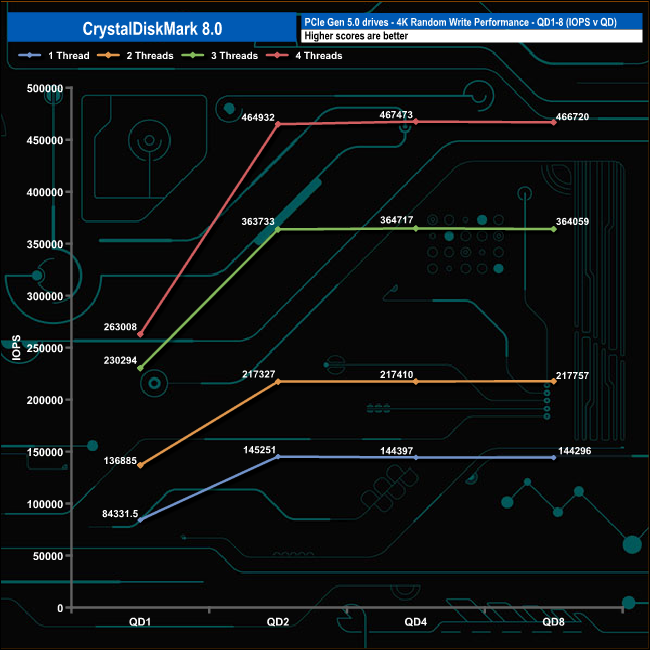
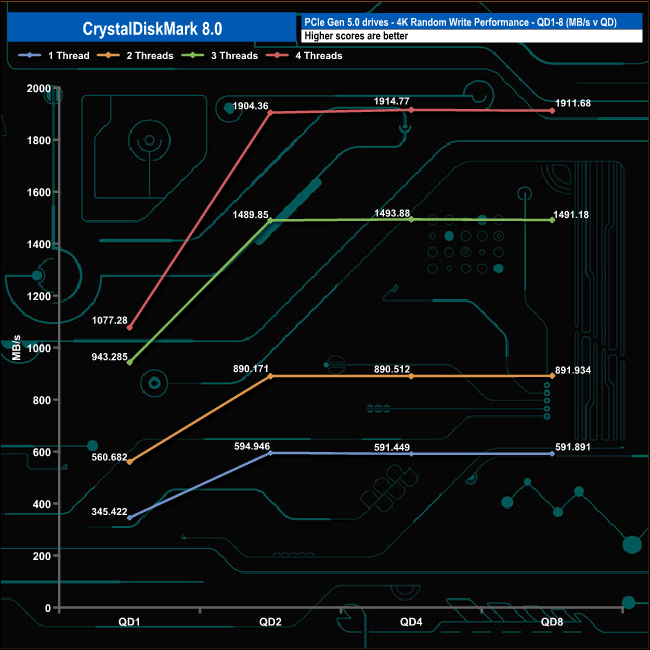
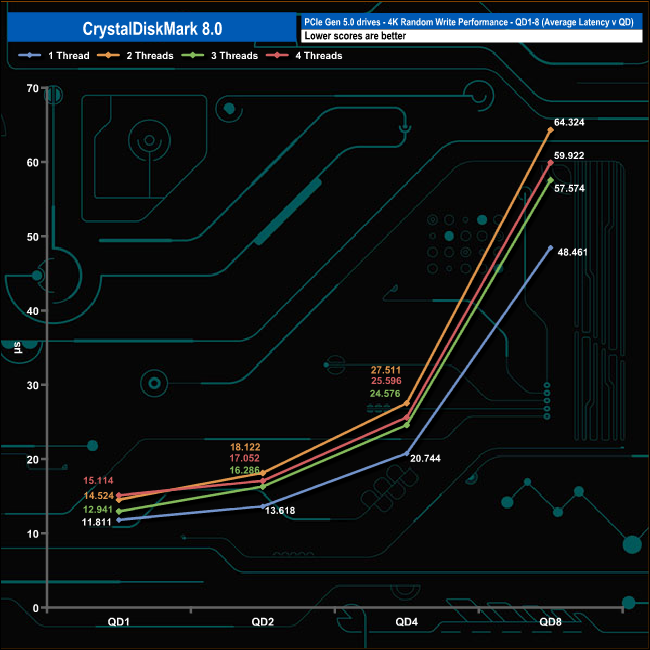
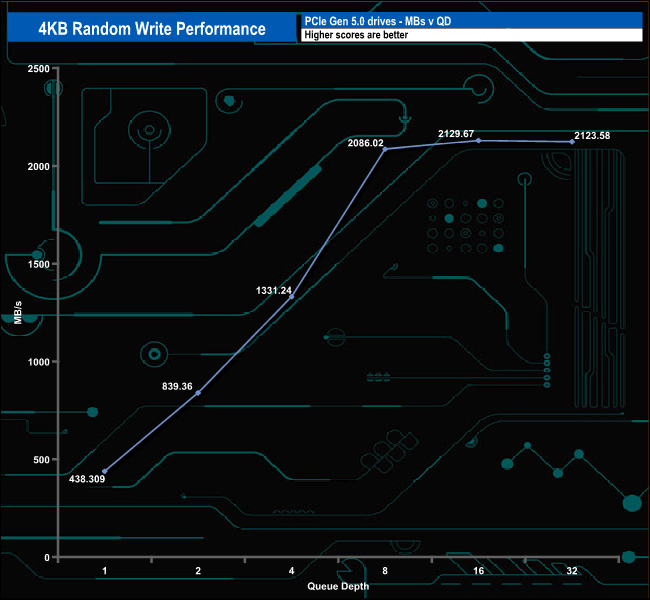
In the 4K write tests, the performance rose quickly from QD1 to QD2 for all four tested threads, with the fastest rise seen in the three and four-threaded tests. Using three and four threads, between QDs 2 and 4, the rate of increase slowed, and between QD4 and 8, the performance began to plateau. Using one and two threads, the performance began to level off after QD2.
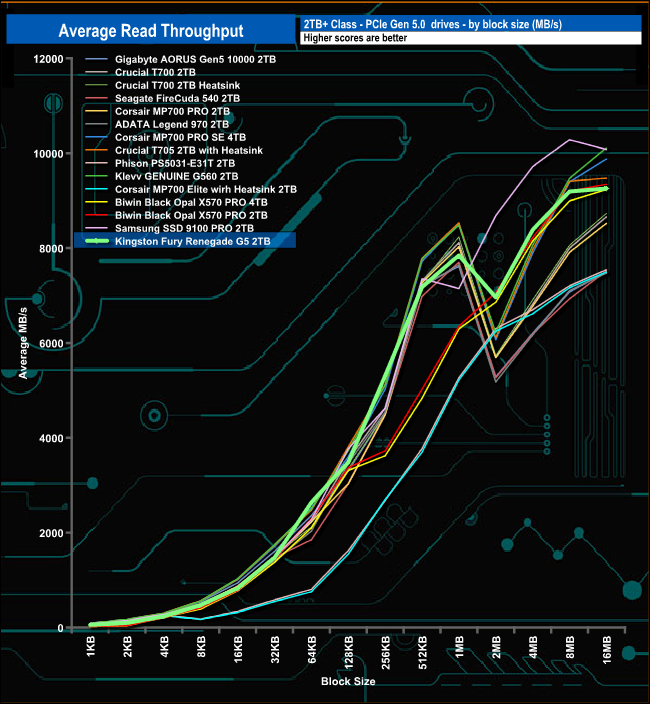
In our read-throughput test, the drive peaked at the 16MB block size at 9,256.88MB/s, quite some way short of the official maximum of 14,700MB/s.
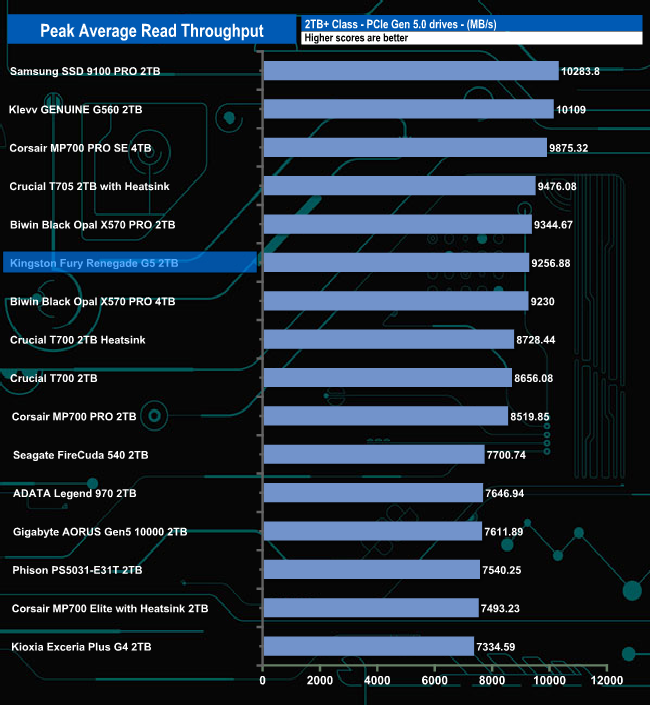
Although the read throughput result is short of the official maximum, it still puts the drive into sixth place in the results chart.
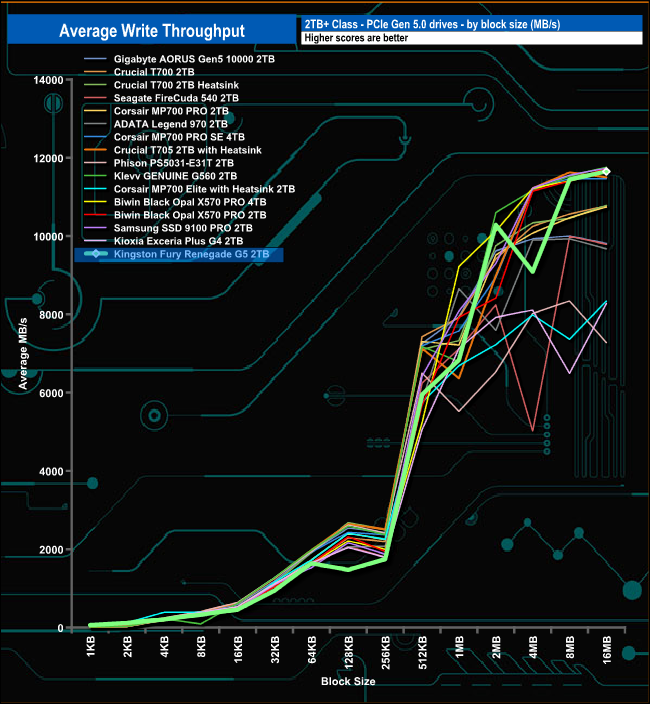
In the write throughput test, the performance drops at the 4MB block mark, but it soon recovers to peak at the end of the test with a result of 11,624MB/s, which, as with the read throughput test, is some way off the official maximum of 14,000MB/s.
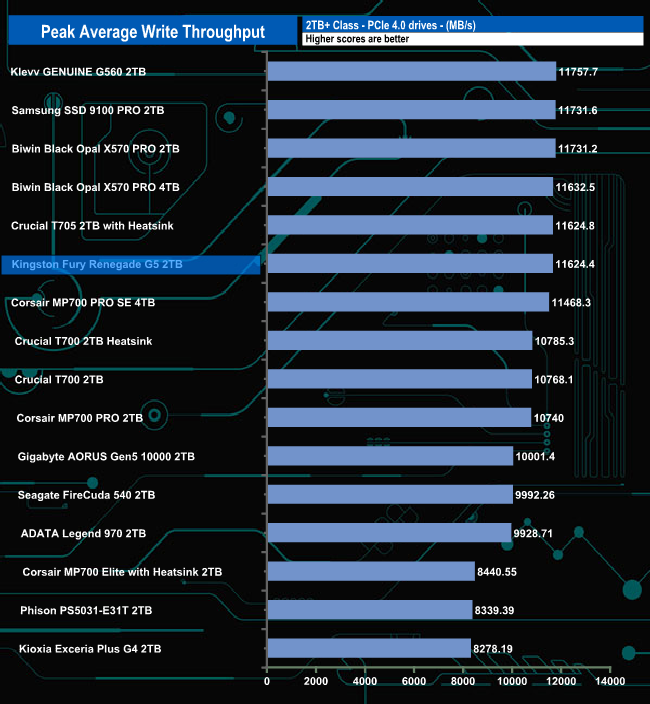
The peak write result of 11,624MB/s is way short of the official maximum of 14,000MB/s but as with the read result, it sits in sixth place in the results chart.
The PCMark 10 Full System Drive Benchmark uses a wide-ranging set of real-world traces from popular applications and common tasks to fully test the performance of the fastest modern drives. The benchmark is designed to measure performance of fast system drives using the SATA bus at the low end and devices connected via PCI Express at the high end.
The goal of the benchmark is to show meaningful real-world performance differences between fast storage technologies such as SATA, NVMe, and Intel’s Optane. The Full System Drive Benchmark uses 23 traces, running 3 passes with each trace. It typically takes an hour to run.
Traces used:
Booting Windows 10.
Adobe Acrobat – starting the application until usable.
Adobe Illustrator – starting the application until usable Adobe Premiere Pro – starting the application until usable.
Adobe Photoshop – starting the application until usable.
Battlefield V – starting the game until the main menu.
Call of Duty Black Ops 4 – starting the game until the main menu.
Overwatch – starting the game until main menu.
Using Adobe After Effects.
Using Microsoft Excel.
Using Adobe Illustrator.
Using Adobe InDesign.
Using Microsoft PowerPoint.
Using Adobe Photoshop (heavy use).
Using Adobe Photoshop (light use).
cp1 Copying 4 ISO image files, 20 GB in total, from a secondary drive to the target drive (write test).
cp2 Making a copy of the ISO files (read-write test).
cp3 Copying the ISO to a secondary drive (read test).
cps1 Copying 339 JPEG files, 2.37 GB in total, to the target drive (write test).
cps2 Making a copy of the JPEG files (read-write test).
cps3 Copying the JPEG files to another drive (read test).
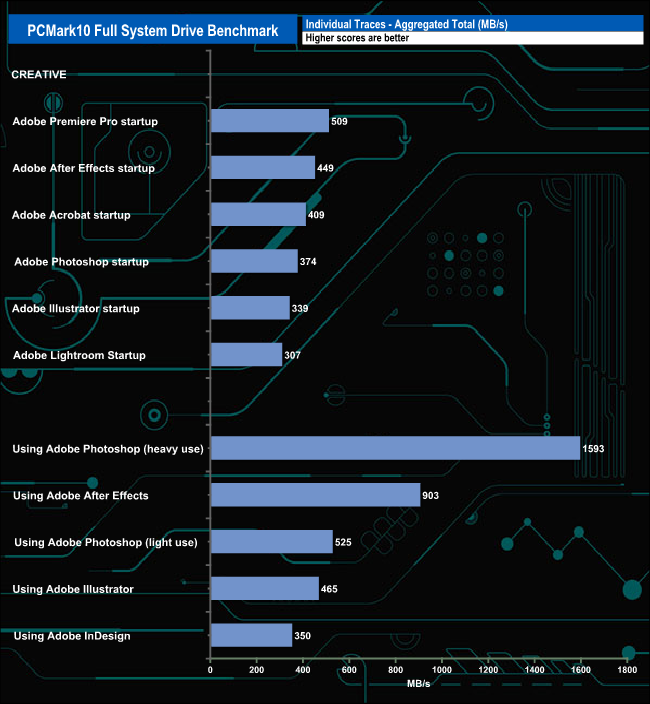
When tested using the Adobe startup traces in PCMark10's Full System Drive benchmark, the drive produced an average of 397MB/s for the six tests. The fastest of these tests was the Premiere Pro trace, at 509MB/s, while the slowest was the Lightroom startup trace, at 307MB/s.
Switching over to the Adobe usage traces, the drive averaged 767MB/s, which includes the 1,593MB/s result for the Adobe Photoshop heavy usage trace. The slowest of the five traces was the InDesign trace at 350MB/s.
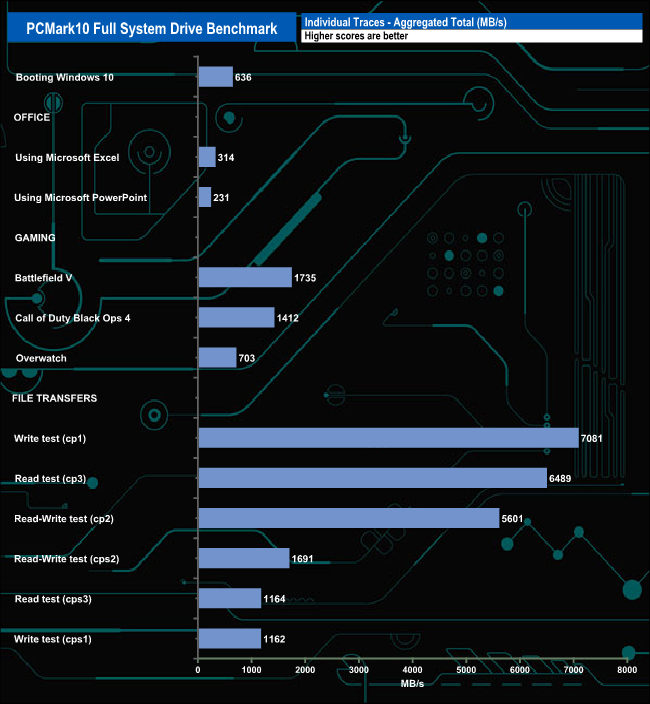
The three gaming traces produced an average result of 1,283MB/s, the fastest being Battlefield V at 1,735MB/s, next came Call Of Duty Black Ops 4 at 1,412MB/s and last and quite some way back, Overwatch at 703MB/s.
The drive averaged 3,964MB/s for the six file transfer tests, the fastest being 7,081MB/s for the cp1 write test.
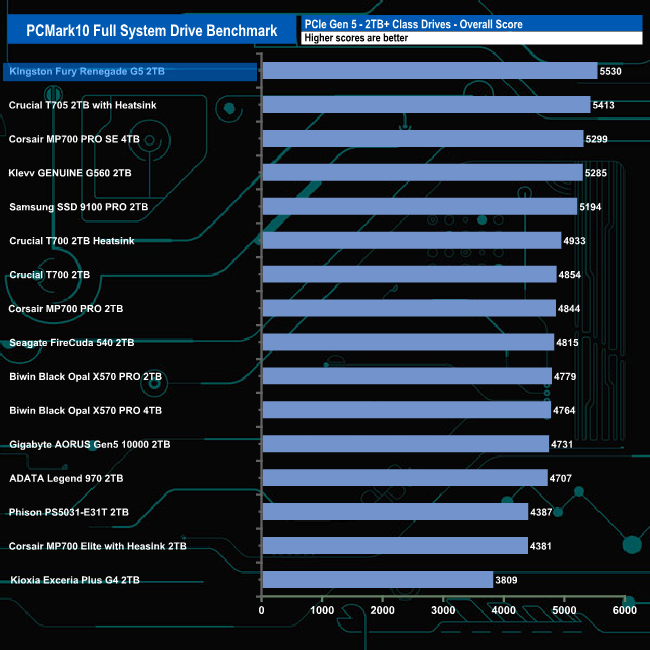
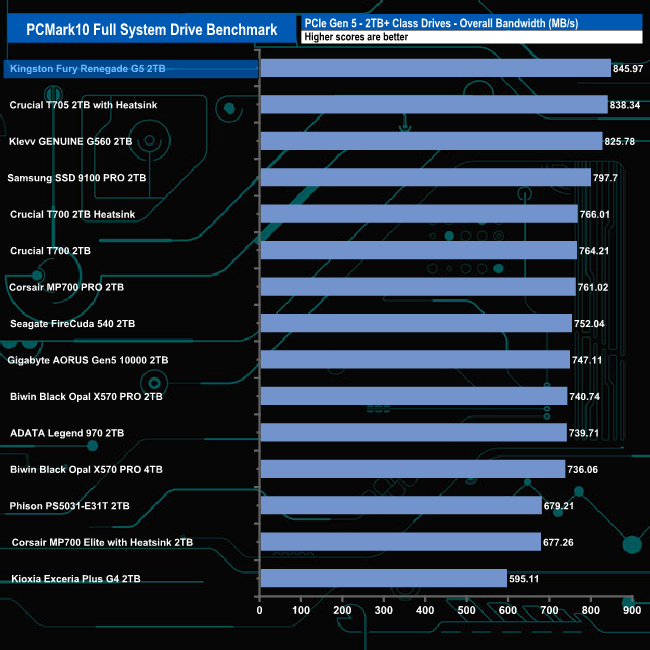
Kingston's Fury Renegade G5 slots straight into to top spot in the overall bandwidth chart with a test result of 845.97MB/s.
The 3DMark Storage Benchmark uses traces recorded from popular games and gaming-related activities to measure real-world gaming performance.
Traces used:
Battlefield V
Loading Battlefield™ V from launch to the main menu.
Call of Duty Black Ops 4
Loading Call of Duty®: Black Ops 4 from launch to the main menu.
Overwatch
Loading Overwatch® from launch to the main menu.
Game Move
Copying the Steam folder for Counter-Strike®: Global Offensive from an external SSD to the system drive.
Game Recording
Recording a 1080p gameplay video at 60 FPS with OBS (Open Broadcaster Software) while playing Overwatch®.
Installing Game
Installing The Outer Worlds® from the Epic Games Launcher.
Game Saving
Saving progress in The Outer Worlds game.
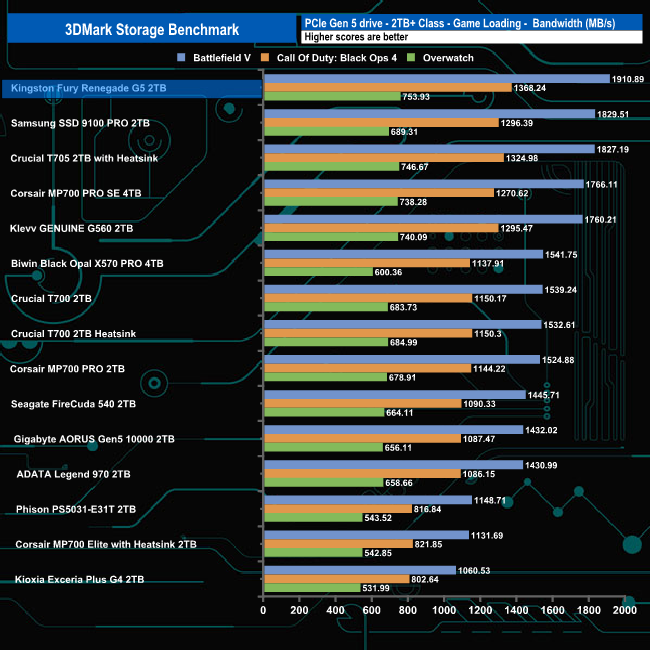
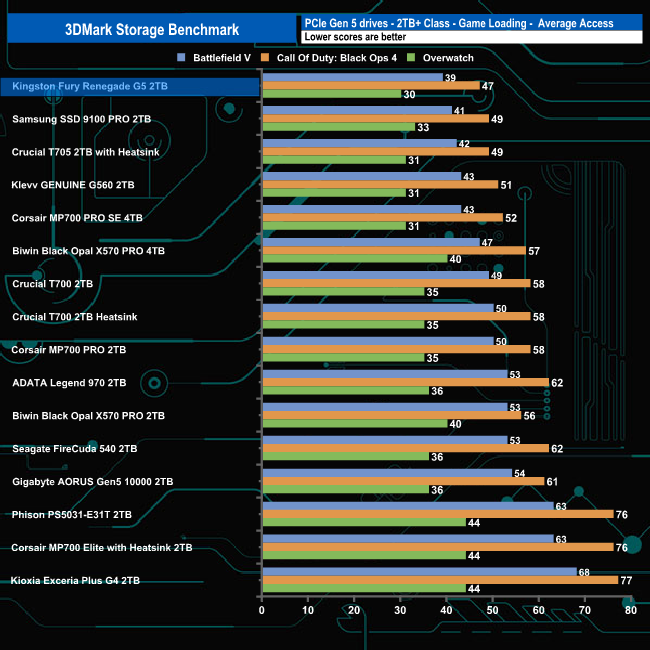
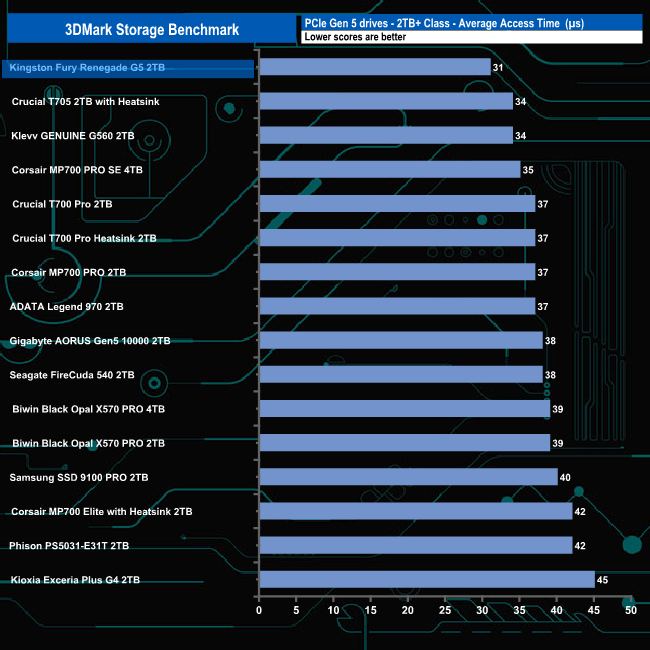
In 3DMark’s Storage Test, the Fury Renegade G5 had an average game loading bandwidth figure for the three games of 1,344.35MB/s, the fastest we've seen to date in this part of the test with an average access time figure of 38µs (0.038m/s), also the fastest figure we've seen to date for the game loading test traces.
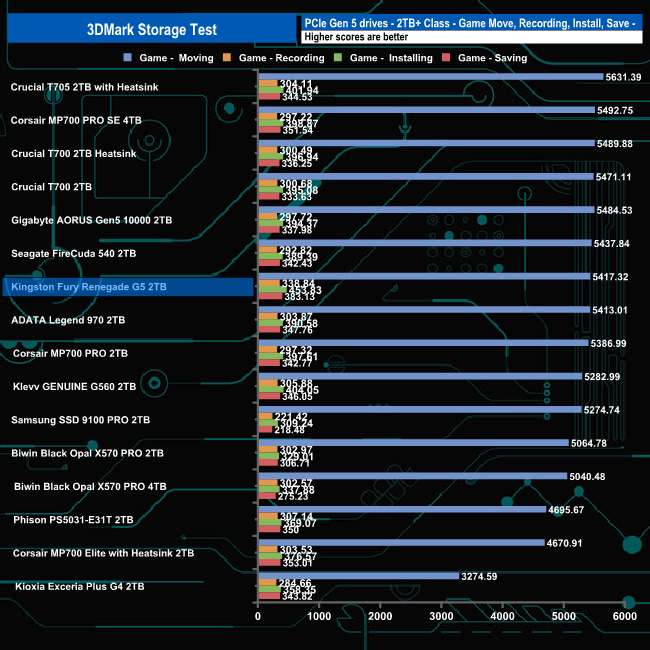
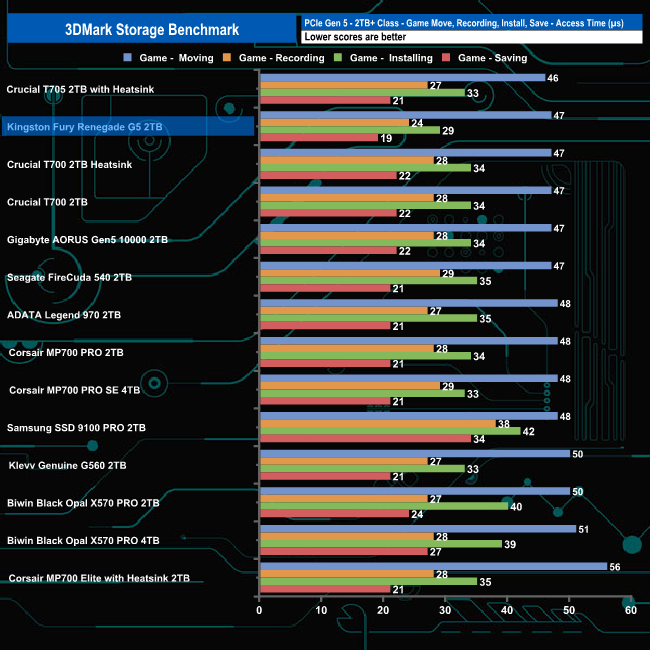
In the game moving, recording, installing and saving test traces, the drive averaged 1,647.78MB/s with an average access time of 29µs (0.029m/s) for the four tests.
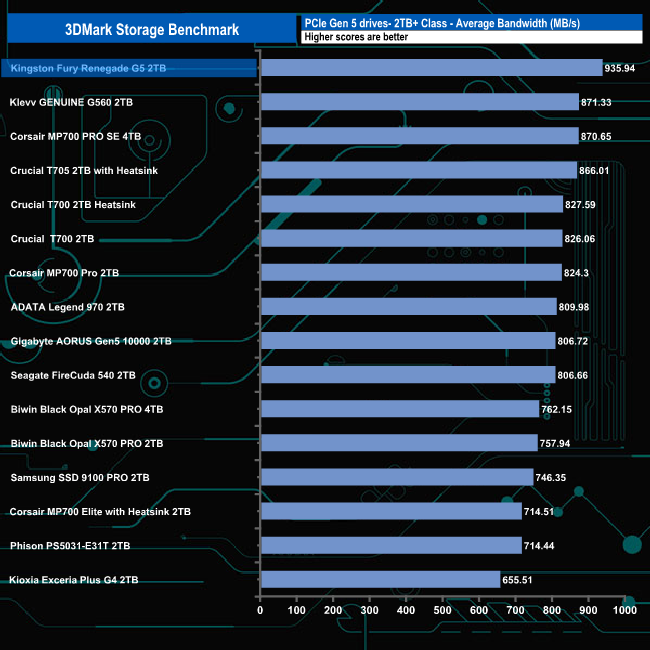
The overall average bandwidth figure for the 2TB Kingston Fury Renegade for the complete benchmark run was 934.94MB/s (31µs total average access time), a result which sees the drive topping the table by some margin.
The Final Fantasy XIV Endwalker Official Benchmark uses actual maps and playable characters to assign a score to your PC and rate its performance, including scene loading times.
The benchmark gives an overall load time as well as loading times by scene.
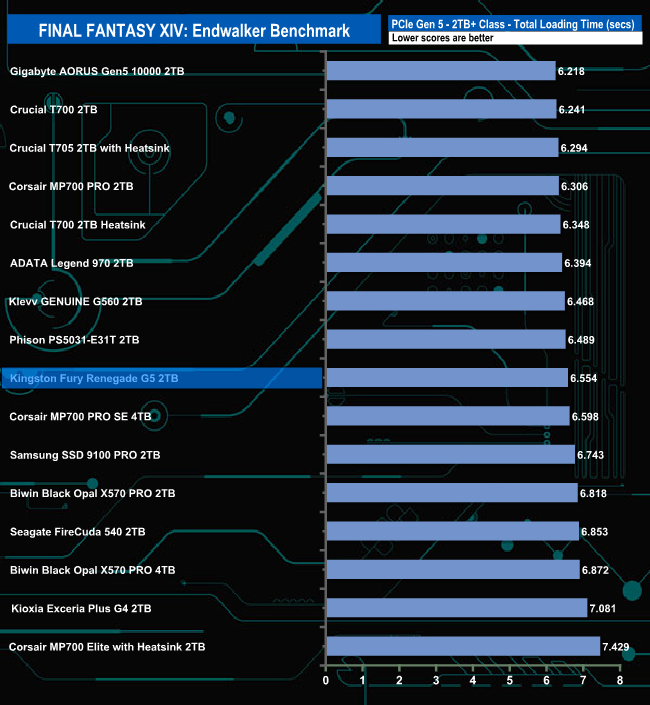
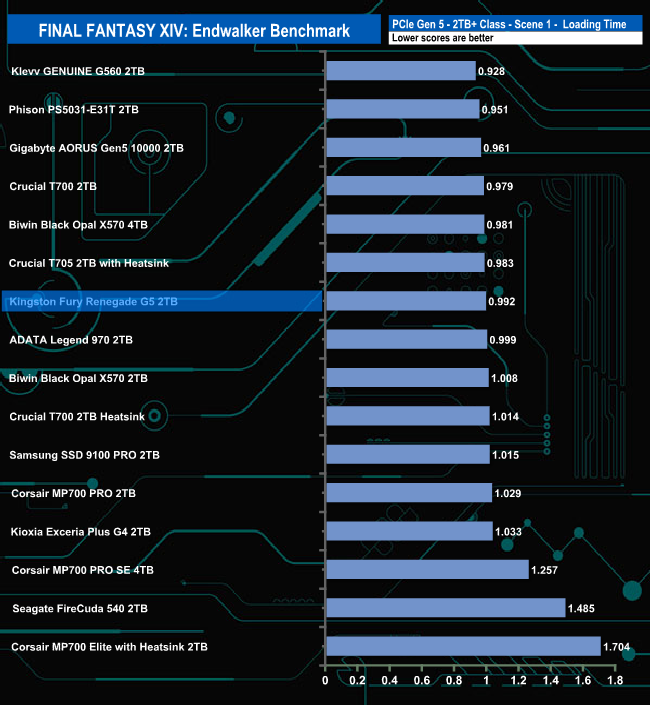
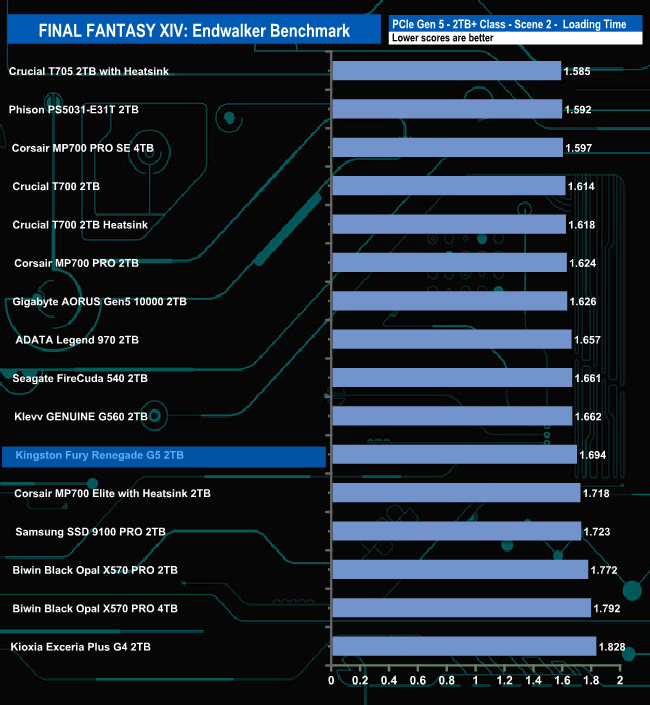
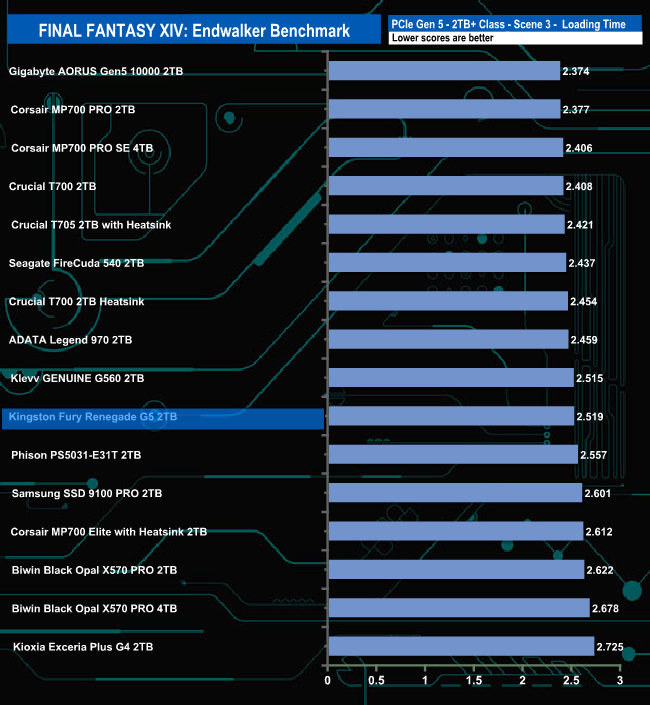
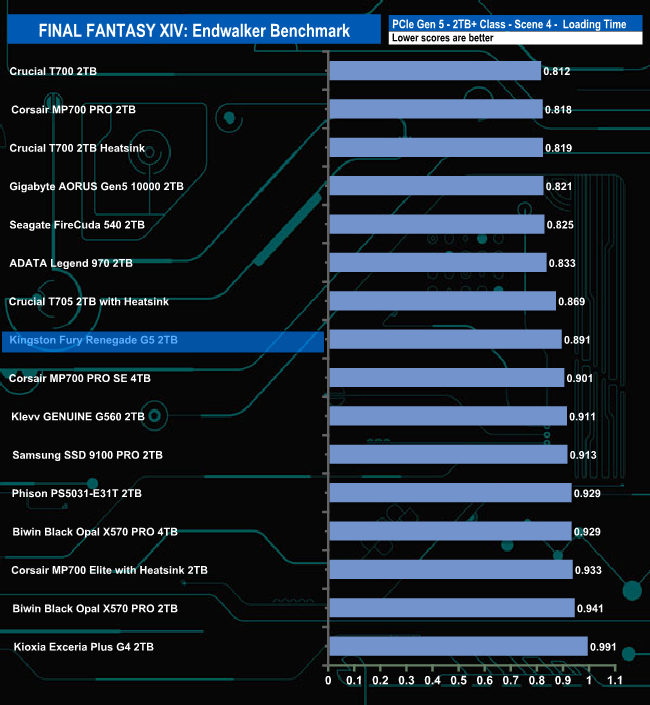
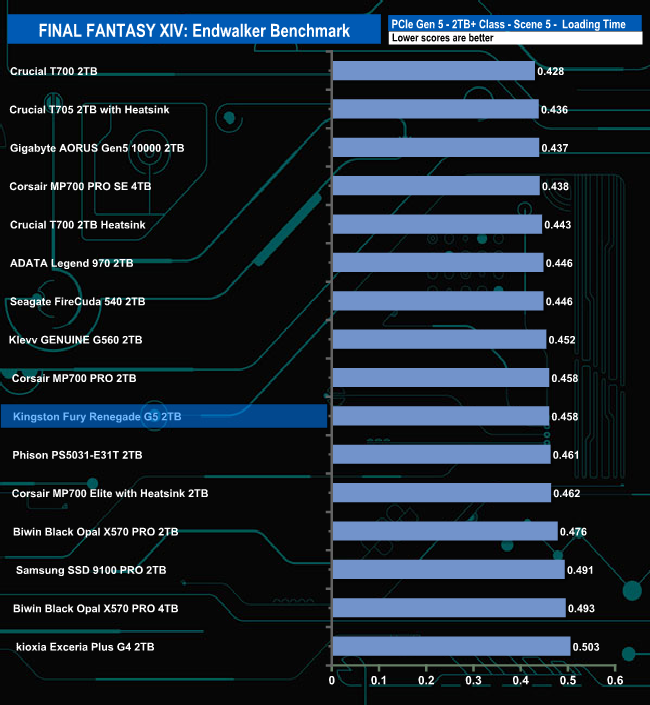
The drive doesn't seem to handle the Final Fantasy XIV Endwalker Official Benchmark that well as it ends up in a mid-table position in the overall results chart. The drive appears to handle the Scene 1 load test the best out of the five traces.
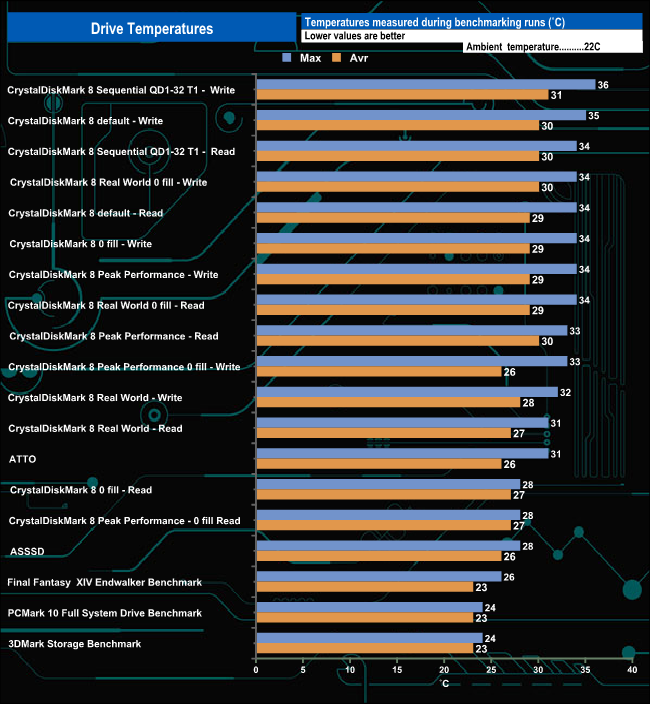
We took note of the drive’s temperature during some of our benchmarking runs. Kingston's Fury Renegade G5 is another of the latest breed of Gen 5 drives that don't need a whopping great heatsink of a cooler. We tested the drive sitting under the chunky heatsink of the Gigabyte AORUS X670E Xtreme motherboard, which our test rig uses.
The drive has a few design features to combat the Achilles heel of high-end Gen5 drives, which is heat generation. Chief amongst these is the Silicon Motion SM2508 controller, which uses a TSMC 6nm process, unlike the 12nm process that previous generation controllers used, which allows better thermal management.
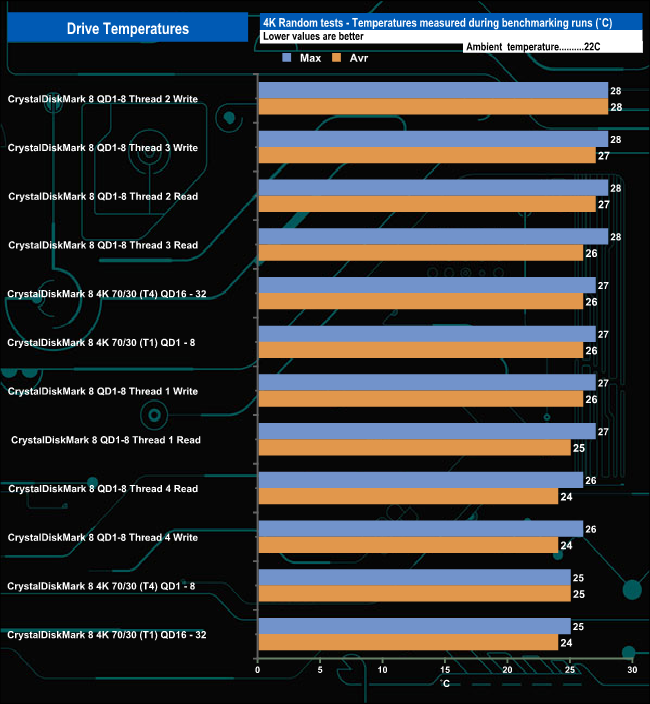
It works well enough, as the hottest the drive got while benchmarking was 36° C during a CrystalDiskMark 8 Sequential Write QD1-32 T1 test run. For the bulk of our testing, the drive averaged 31° C, with the 4K focused tests averaging 27° C, both of these averages a long way from the 70° C maximum operating temperature of the drive.
To test real life performance of a drive we use a mix of folder/file types and by using the FastCopy utility (which gives a time as well as MB/s result) we record the performance of drive reading from & writing to a 2TB Kingston KC3000.
Transfer Details
Data file – 100GB.
File folder – 50GB – 28,523 files.
Movie demos 8K – 21GB – (11 demos).
Raw Movie Clips 4K – 16GB – (9 MP4V files).
Audio Folder – 10GB – 1,483 files – (1479 @ MP3, 4 @ .FLAC files).
Single large image – 5GB – 1.5bn pixel photo.
3D Printer File Folder – 4.25GB – (166 files – 105 @ .STL, 38 @ .FBX, 11 @ .blend, 5 @ .lwo, 4 @ .OBJ, 3@ .3ds).
AutoCAD File Folder – 1.5GB (80 files – 60 @ .DWG and 20 @.DXF).
![]()
![]()
The 2TB Kingston Fury Renegade G5 averaged 4,247MB when writing the 8 transfer tests, with the fastest being the 7,076MB/s for the 4K movie folder, with the slowest being the 50GB File Folder transfer at 570MB/s (94 sec)/
Reading back the data, the average was 4,506MB/s with the 5GB image transfer the fastest at 5,930MB/s and again, the slowest was the 50GB File Folder at 1,207MB/s.
When we recently reviewed Samsung's first Gen 5 SSD, we mentioned that it has taken quite some time for some of the very well-known drive manufacturers to get involved in the Gen 5 market sector, and it seems as if the latest batch of controllers has given them a nudge in the right direction.
Kingston's first consumer PCIe 5.0 x4 has arrived in the shape of the Fury Renegade G5, a drive aimed at the performance end of the market with quoted sequential performance of up to 14,800MB/s for reads (4TB model) and up to 14,000MB/s for writes.
The Fury Renegade G5 is built around a SiliconMotion SM2508 controller, one of the new breed of eight-channel controllers that manage the neat trick of blending performance with cooler running and better power efficiency, which is why the initial Fury Renegade G5 doesn't come with a big old heatsink pre-installed.
At launch, the drive comes in three capacities: 1TB, 2TB (the drive we are reviewing) and a 4TB flagship model. Kingston rates the sequential performance of the 2TB drive as up to 14,700MB/s for reads and up to 14,000MB/s for writes. The 1TB model has read/write figures of up to 14,200MB/s and up to 11,000MB/s respectively. The 4TB flagship model has the same up to 14,000MB/s sequential write rating as the 2TB drive but has slightly better read performance of up to 14,800MB/s.
All three drives have the same 4K random read rating of up to 2,200,000 IOPS, and while the 2TB and 4TB have the same speed rating for random writes, the 1TB drive has to make do with up to 2,150,000 IOPS random write performance.
Kingston rates the sequential performance of the 2TB drive as up to 14,700MB/s for reads and up to 14,000MB/s for writes. When we tested the drive with the ATTO benchmark, the best we saw from the drive was 13,900MB/s for reads and 12,410MB/s for writes, good enough to place the drive in third spot on the graph.
Switching over to the CrystalDiskMark 8 default benchmark, we could confirm the official maximum figures with test results of 14,765MB/s for reads and 14,130MB/s for writes – the fastest sequential speeds we've seen for a consumer Gen 5 drive to date using this benchmark.
When it came to 4K random performance, we couldn't get anywhere close to the official figures using our 4-threaded testing. Kingston rates the 4K random performance of the 2TB Fury Renegade G5 as up to 2,200K IOPS for both reads and writes. The best we saw from testing was 519,939 IOPS and 476,761 IOPS (both QD16) for reads and writes, respectively. The best performance figures we saw from the drive came from using the default Peak Performance profile in CrystalDiskMark 8 with reads (default) at 1,872,870 IOPS and writes at 1,537,681 IOPS.
The Fury Renegade G5 doesn't use a heatsink, but it stayed cool under the heatsink of the Gigabyte AORUS X670E Xtreme motherboard we used for testing. The hottest the drive got while benchmarking was 36° C during a CrystalDiskMark 8 sequential Write QD1-32 T1 test run. For the bulk of our testing, the drive averaged 31° C, with the 4K focused tests averaging 27° C, both of these averages a long way from the 70° C maximum operating temperature of the drive.
We found the 2TB Kingston Fury Renegade G5 on ebuyer for £289.98 (inc VAT) HERE.
Pros
- Overall performance.
- Thermal design.
- 5-year warranty.
Cons
- Tested 4K performance couldn’t match the official maximum figures.
KitGuru says: It might have been a long time coming, but the Fury Renegade G5, Kingston's first PCIe 5.0 drive, combines very fast performance with impressive thermals. It's a very good drive, though it doesn't come cheap!