

Kingston's NV2 is an entry-level Gen 4 SSD with a DRAM-less design. It uses a four-channel controller and 144-layer QLC NAND, helping it to come in at under £50 for the 1TB model here in the UK. What sort of performance do you get for the money? We find out today.

Kingston's NV2 drive is available in four capacities; 250GB, 500GB, 1TB (the drive we are reviewing) and the 2TB flagship drive. At the heart of the drive is a Silicon Motion SM2267XT 4-channel controller. It's a DRAM-less design, using Host Memory Buffer technology instead.
Kingston only supplies Sequential read/write figures in the specification sheet for the drive. The 250GB drive gets a read rating of up to 3,000MB/s with writes rated up to 1,300MB/s. The 500GB and the 1TB drives have the same up to 3,500MB/s for reads and up to 2,100MB/s for writes. The 2TB drive has the same read speed as the 500GB and 1TB drives but with an uprated 2,800MB/s for write performance.
Kingston quotes a TBW endurance figure for the 1TB drives as 320TB. The 2TB model gets a rating of 640TB, the 500GB drive, 160TB and the 250GB drive 80TB. Kingston back the drive with a 3-year warranty which is a bit mean these days when 5-year warranties are usually the norm.
Physical Specifications:
- Usable Capacities: 1TB.
- NAND Components: 144-layer QLC NAND.
- NAND Controller: Silicon Motion SM2267XT.
- Cache: None – (HMB) Host Memory Buffer.
- Interface: PCIe 4.0 x4 NVMe.
- Form Factor: M2 2280.
- Dimensions: 22 x 80 x 2.2mm.
- Drive Weight: 7g.
Firmware Version: SBM02103.
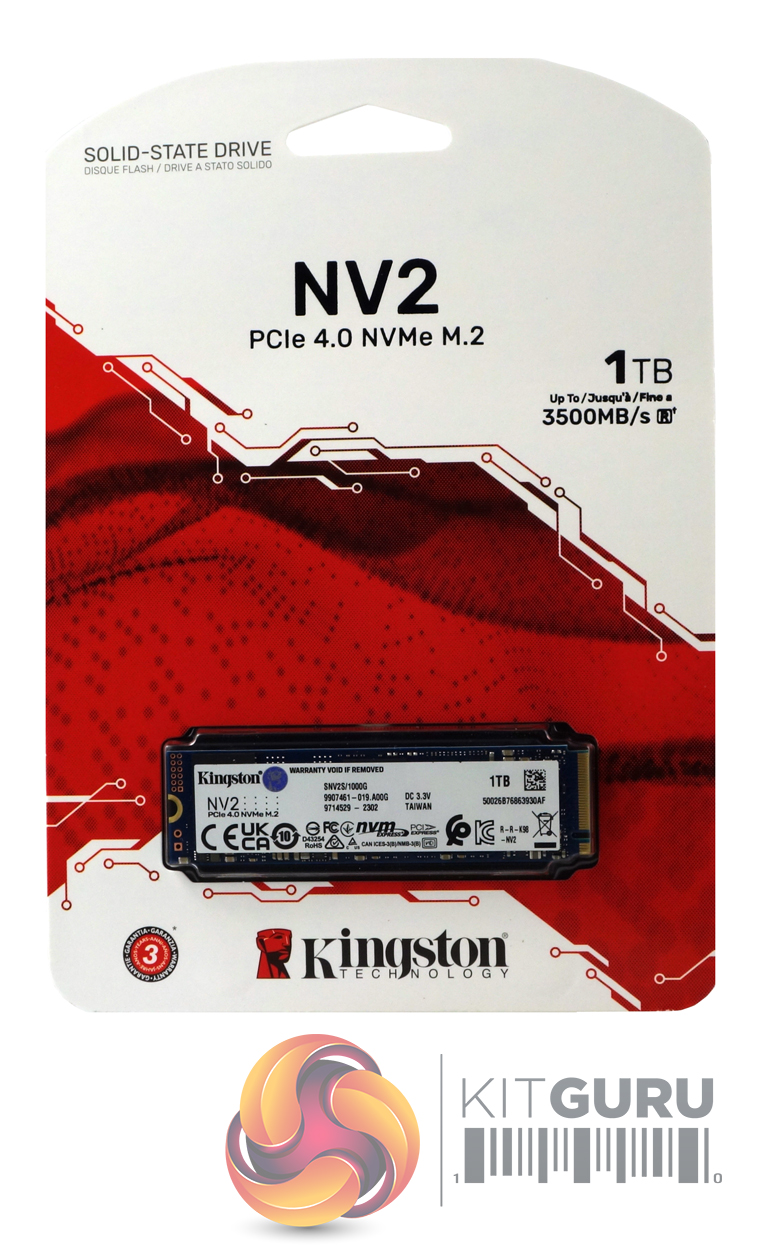
Kingston’s NV2 drive is packaged in a blister pack with the drive sitting in a plastic tray. On the top right of the cardboard backing is the drive's capacity and Sequential maximum speed (up to 3,500MB/s). Under the drive is a logo displaying the fact that Kingston backs the drive with a 3-year warranty. The rear of that packaging houses some multi-lingual marketing notes.
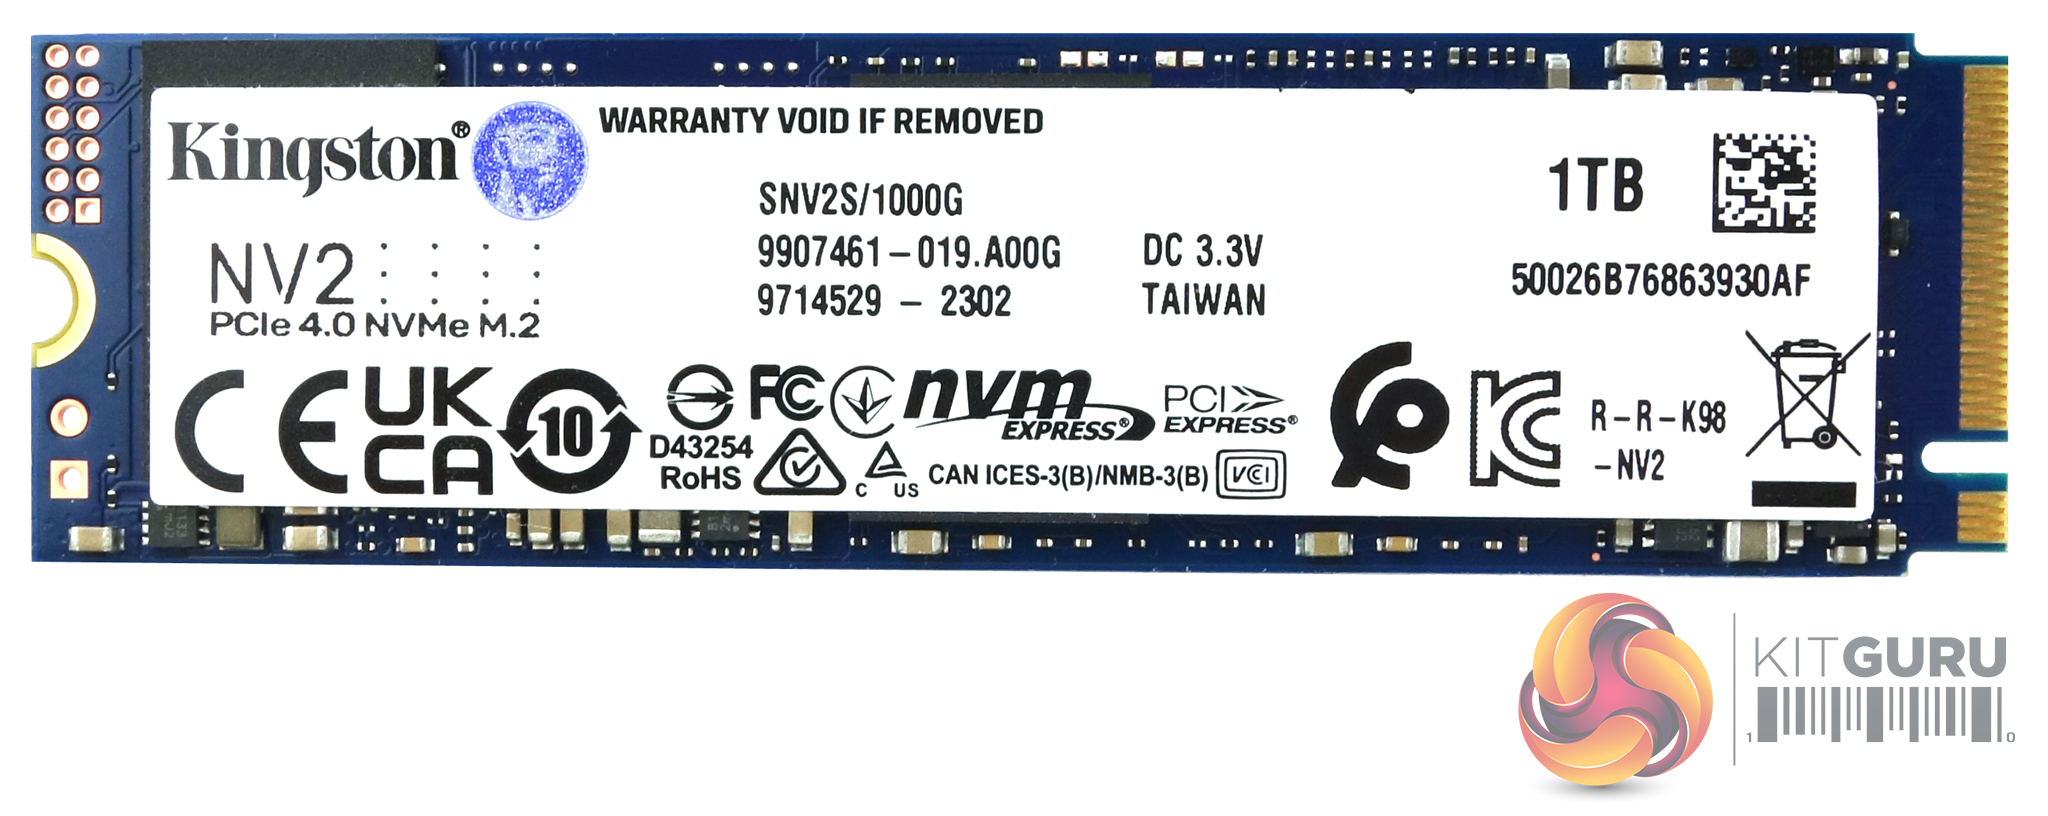

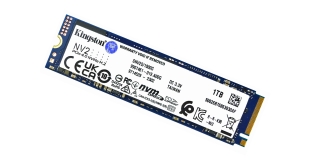
The NV2 1TB drive is built on a single-sided M.2 2280 format.
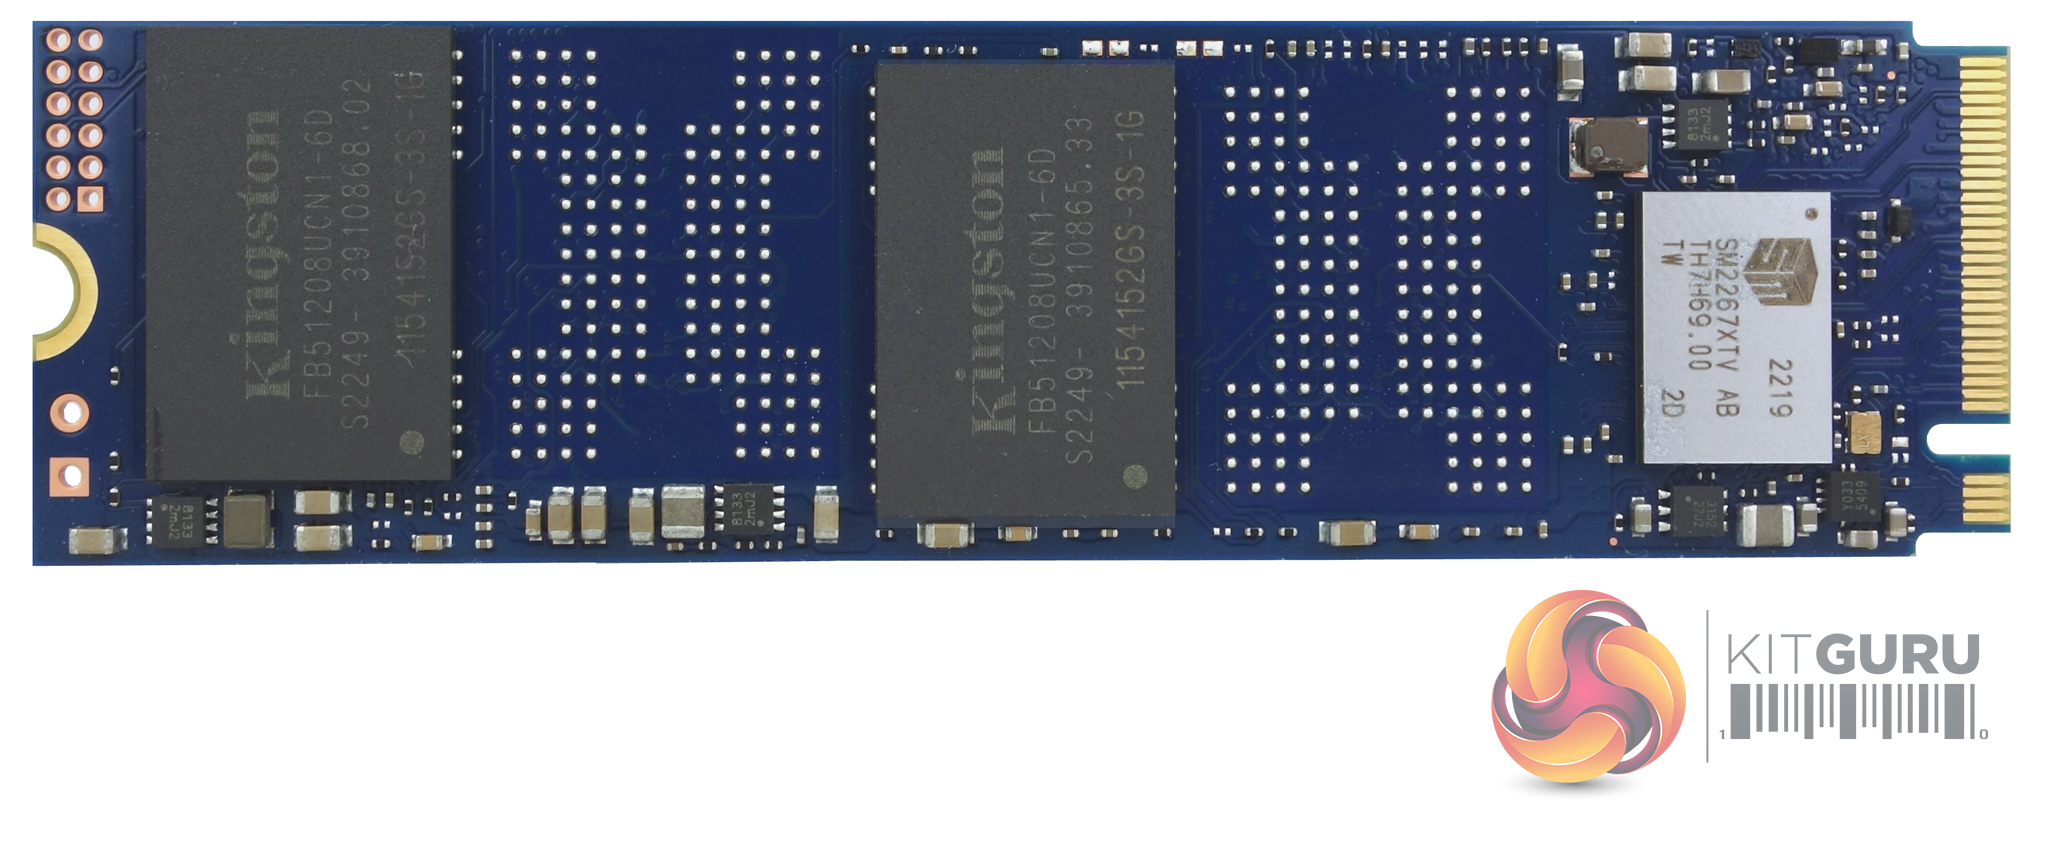
Being a DRAM-less design, the only major components on the PCB are the Silicon Motion SM2267XT controller and a pair of NAND packages (labelled Kingston FB51208UCN1-6D). By using a Flash ID utility these were identified as Intel 144-layer QLC NAND.
The SM2267XT is the DRAM-less version of Silicon's SM2267 controller. Instead of an onboard DRAM chip, it uses HMB (Host Memory Buffer) technology. Built on a 28nm process, the 4-channel SM2267XT uses 2 ARM Corex R5 CPU's supporting a NAND channel speed of 1,200MT/s,
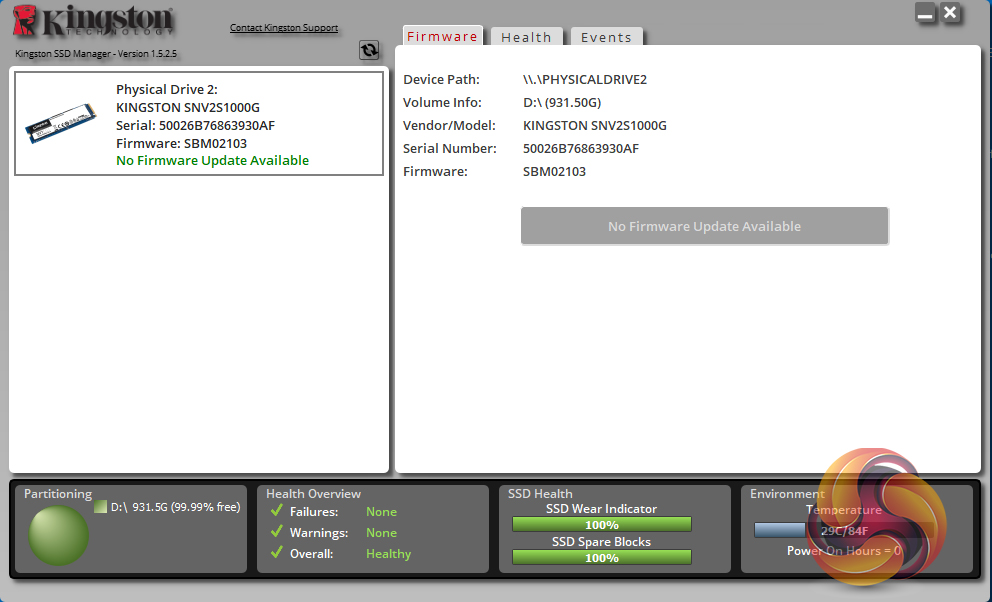
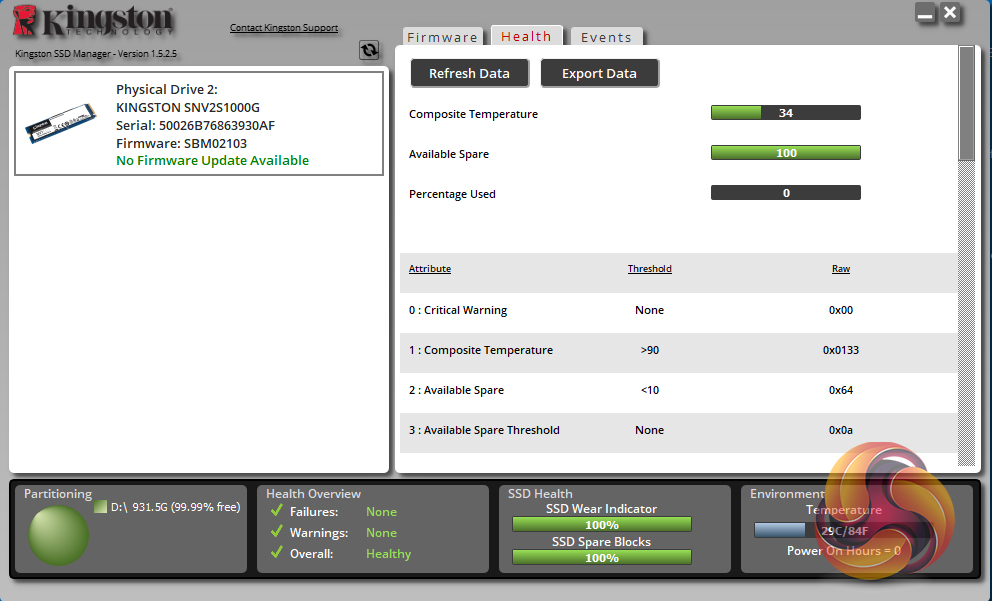

Kingston’s SSD management utility is called SSD Manager, (version v1.5.2.5) at the time of testing the drive) It automatically detects any firmware updates as well as displaying drive status, temperatures and SMART information
For testing, the drives are all wiped and reset to factory settings by HDDerase V4. We try to use free or easily available programs and some real-world testing so you can compare our findings against your own system.
This is a good way to measure potential upgrade benefits.
Main system:
AMD Ryzen 5 3600X, 16GB DDR4-2400, Sapphire R9 390 Nitro and an MSI MPG X570 Gaming Edge Wifi motherboard
Other drives: 1TB class.
Corsair Force MP600 1TB
Crucial P5 Plus 1TB
Kioxia BG5 1TB
Patriot Viper VPN4100 1TB
PNY XLR8 CS3040 1TB
PNY XLR8 CS3140 1TB
Sabrent Rocket 4 Plus 1TB
Samsung SSD980 PRO 1TB
Samsung SSD980 PRO Heatsink 1TB
Seagate FireCuda 520 1TB
Solidigm P41 Plus 1TB
Solidigm P44 Pro 1TB
Teamgroup T-Force Cardea Zero Z440 1TB
Teamgroup T-Force Cardea A440 Pro Special Series 1TB
WD Black SN770 1TB
Software:
Atto Disk Benchmark 4.
CrystalMark 8.0.0.
AS SSD 2.0.
IOMeter.
UL Solutions PC Mark 10.
UL Solutions 3DMark Storage Benchmark.
Final Fantasy XIV Endwalker Official Benchmark.
All our results were achieved by running each test five times with every configuration this ensures that any glitches are removed from the results. Trim is confirmed as running by typing fsutil behavior query disabledeletenotify into the command line. A response of disabledeletenotify =0 confirms TRIM is active.
CrystalDiskMark is a useful benchmark to measure the theoretical performance levels of hard drives and SSDs. We are using v8.0.
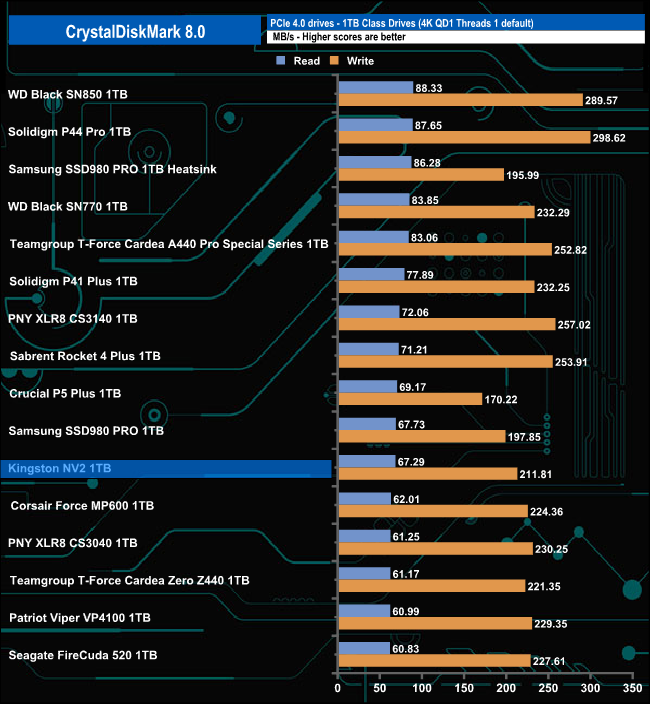
The read result of 67.29MB/s from CrystalDiskMark 8's 4K QD1 test sees the NV2 in the bottom half of our results chart. Its write score of 211.81MB/s is much stronger though.
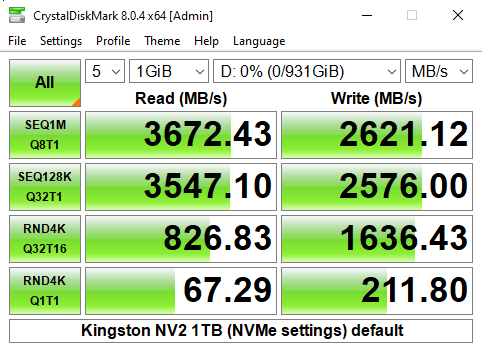
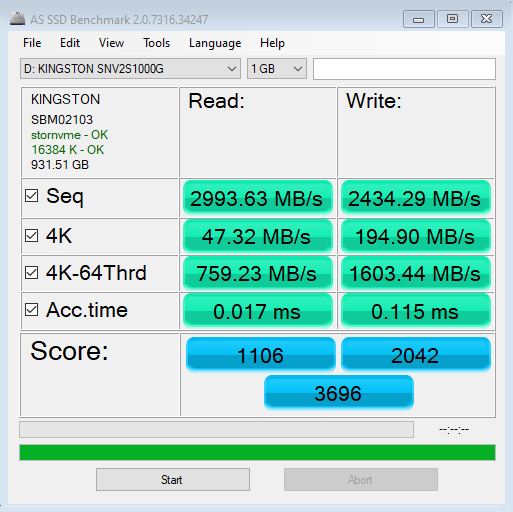
As you can see from the benchmark result screens we were able to confirm Kingston's official figures for the 1TB NV2 of up to 3,500MB/s for reads and up to 2,100MB/s for writes with test results of 3,672MB/s for reads and 2,621MB/s for writes.
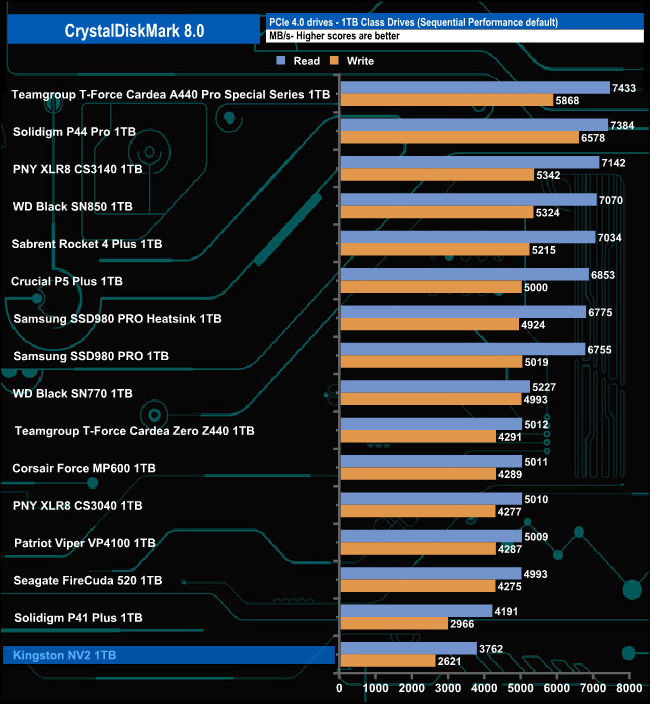
Even though our test results bettered the official maximum Sequential figures the drive sits in last place in our results chart.
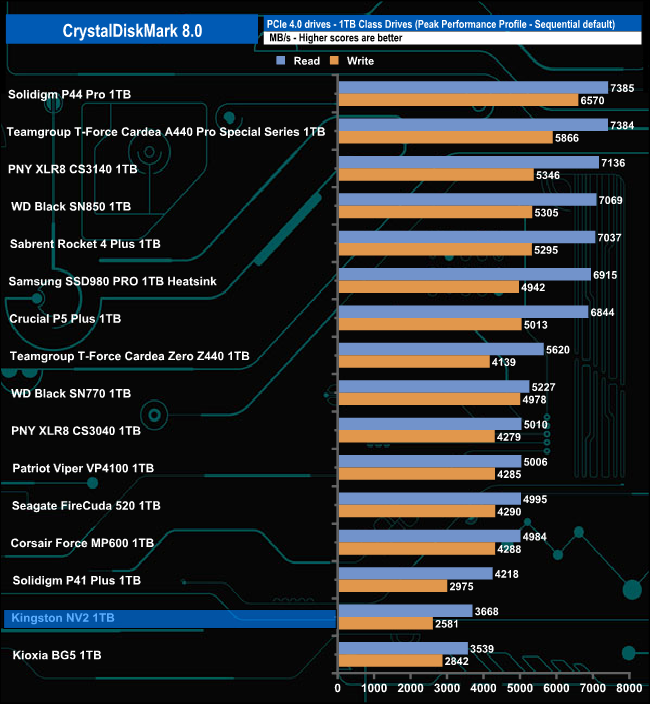
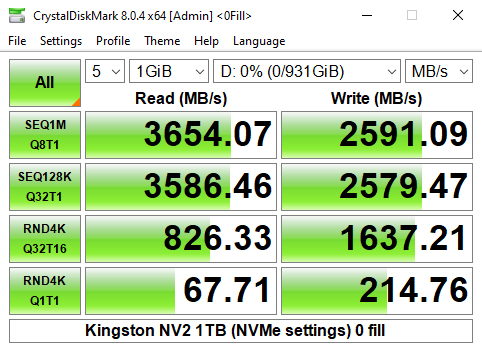
Using the Peak Performance profile in CrystalDiskMark 8 we could once again confirm the maximum official figures with the best read/write results of 3,668MB/s and 2,581MB/s respectively.
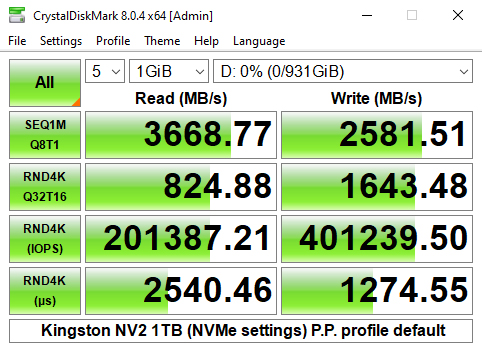
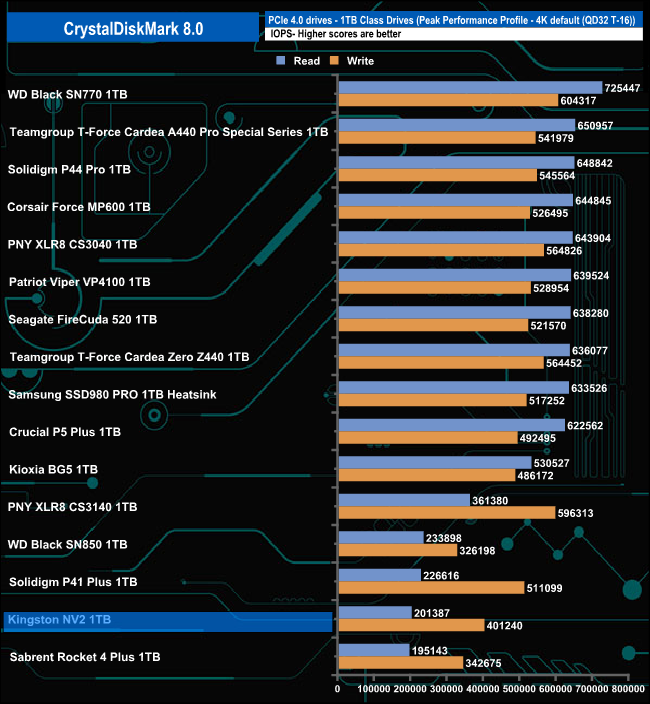
Kingston hasn't disclosed any official 4K random figures for the drive. The best results we saw came from a mix of data types. The best-read figure we saw, 201,561 IOPS came with the drive being tested with compressible data while the best write score of 401,239 IOPS came when the drive was dealing with incompressible data.
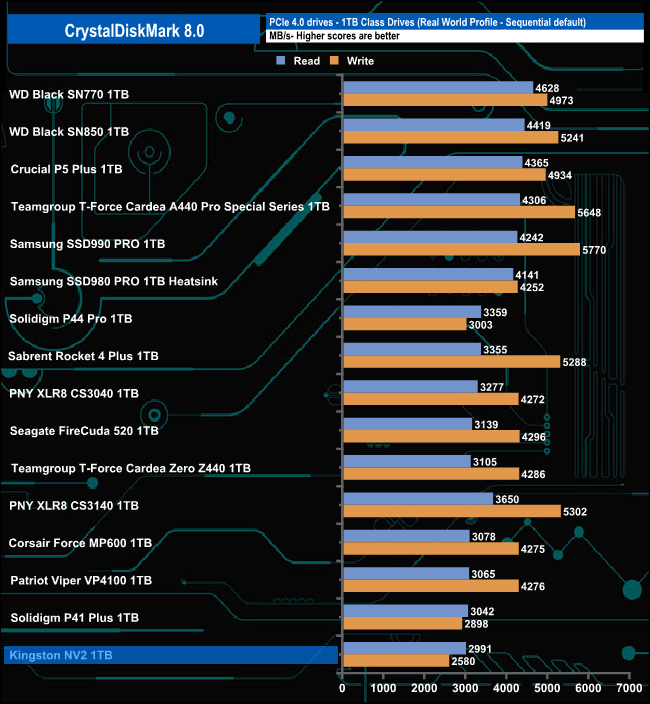
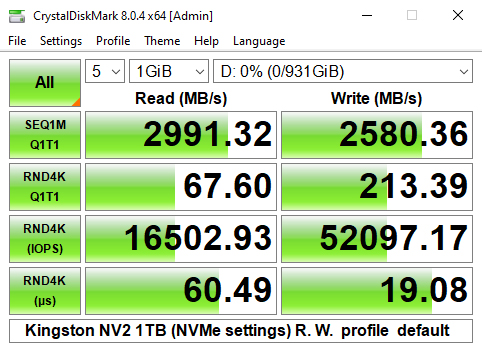
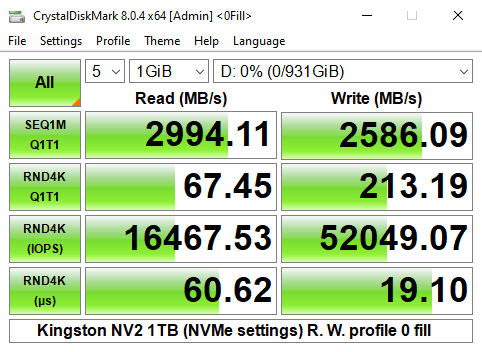
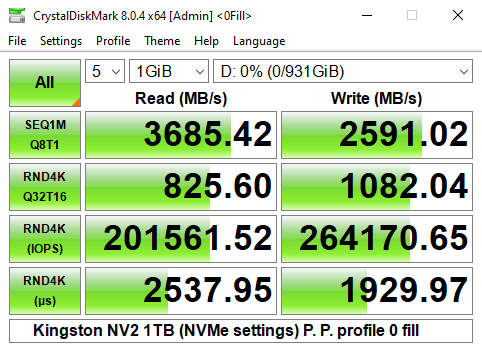
Using the Real World profile, the best Sequential read figure we saw was 2,994MB/s, some way short of the official maximum speed for the drive of 3,500MB/s. However, the best write result of 2,586MB/s bettered the official figure by some 486MB/s.
The ATTO Disk Benchmark performance measurement tool is compatible with Microsoft Windows. Measure your storage systems performance with various transfer sizes and test lengths for reads and writes. Several options are available to customize your performance measurement including queue depth, overlapped I/O and even a comparison mode with the option to run continuously. Use ATTO Disk Benchmark to test any manufacturer's RAID controllers, storage controllers, host adapters, hard drives and SSD drives and notice that ATTO products will consistently provide the highest level of performance to your storage.
We are using version 4.1 for our NVMe disk tests.
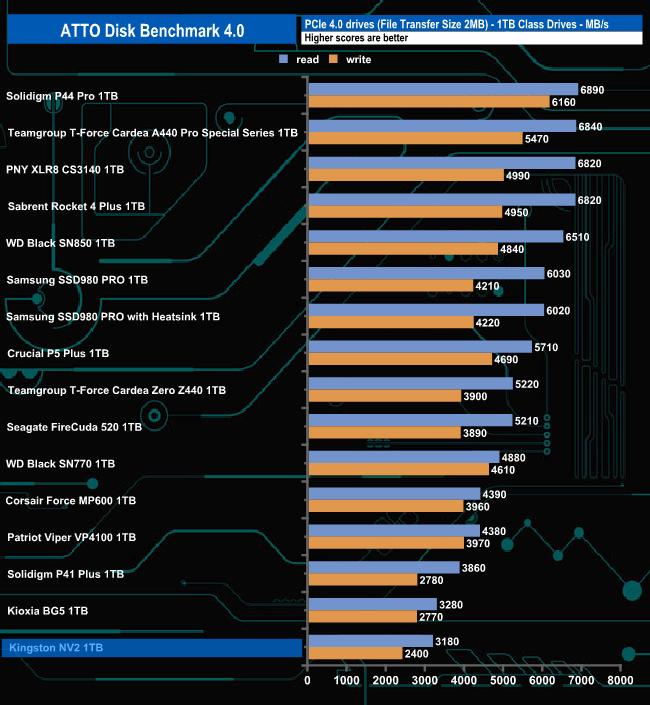
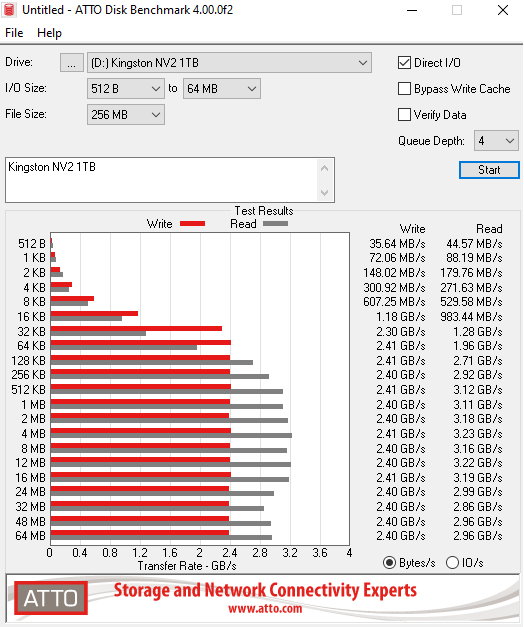
Using the ATTO benchmark we couldn't quite hit the official maximum Sequential read speed of 3,500MB/s with a result of 3,180MB/s. However, when it came to write performance, the result of 2,400MB/s was faster than the official maximum.
AS SSD is a great free tool designed just for benching Solid State Drives. It performs an array of sequential read-and-write tests, as well as random read-and-write tests with sequential access times over a portion of the drive. It uses
incompressible data samples which many drives struggle with, so results can be viewed as the worst-case scenarios.
AS SSD includes a sub suite of benchmarks with various file pattern algorithms but this is difficult in trying to judge accurate performance figures.
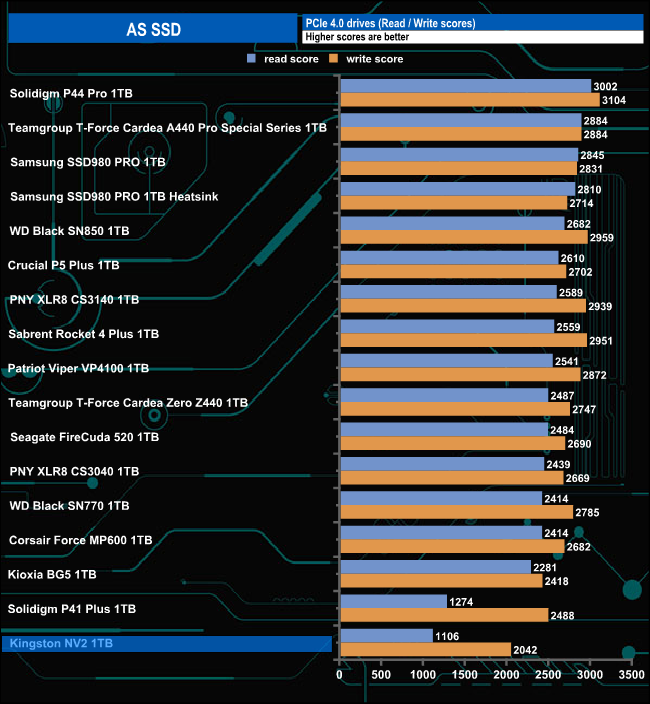
With a read score of 1106 in ASSSD, the 1TB NV2 sits firmly in last place in our results chart. Its write score is significantly faster at 2042.
We used CrystalDiskMark 8‘s custom settings to test the Sequential read and write performance of the drive through a range of queue depths. The setup for the tests is listed below.
128KB Sequential Read / Write.
Transfer Request Size: 128KB, Thread(s): 1, Outstanding I/O: 1-32.
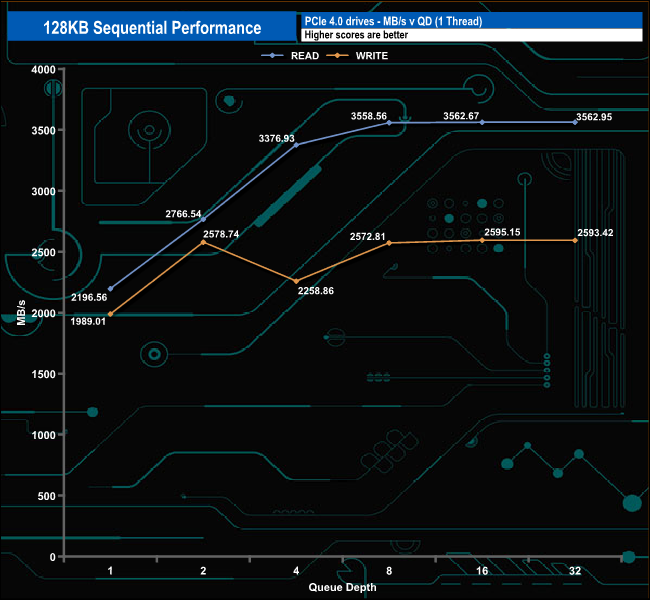
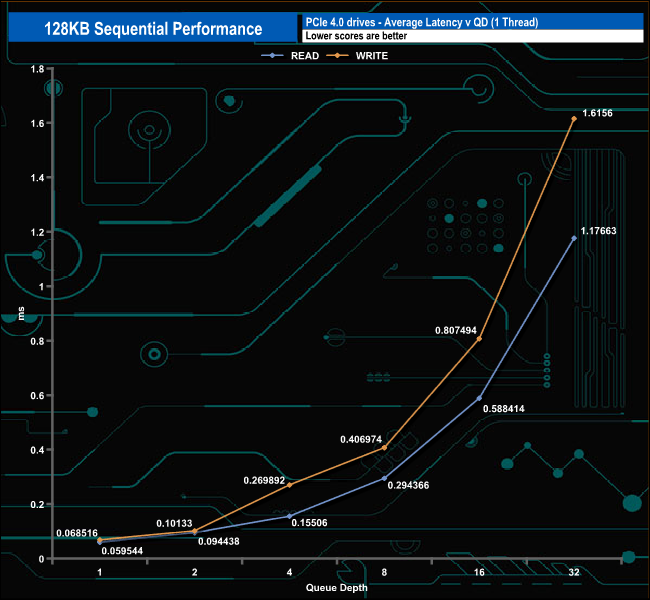
When it came to Sequential read performance, the drive's performance levelled off at QD8 finishing the test run at QD32 just 4MB/s faster at 3,562MB/s, which confirms the official maximum speed rating of 3,500MB/s.
The Sequential write performance fell away at QD4 but recovered by QD8. The drive's performance peaked at QD16 with a result of 2,595MB/s before dropping back very slightly to finish the test run at 2,593MB/s. Both of these figures are some 400MB/s faster than the official write maximum of 2,100MB/s.
128KB Sequential Read v QD performance compared.
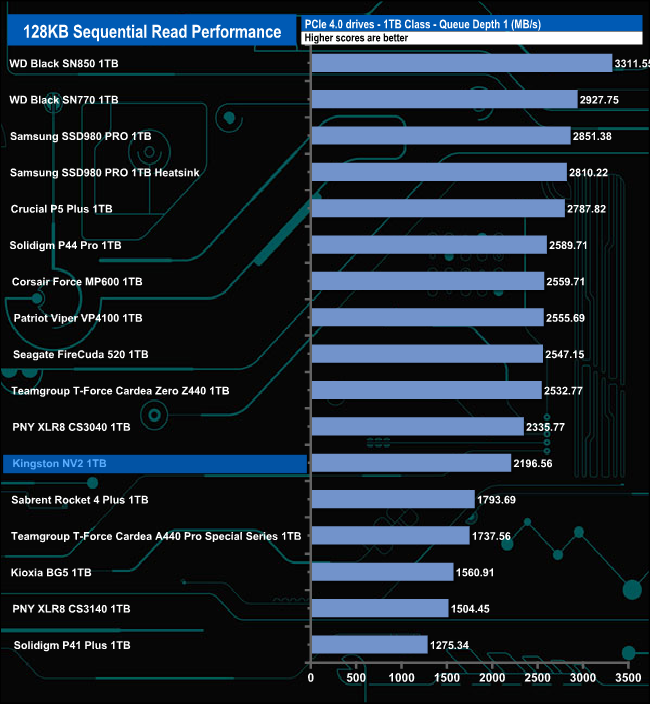
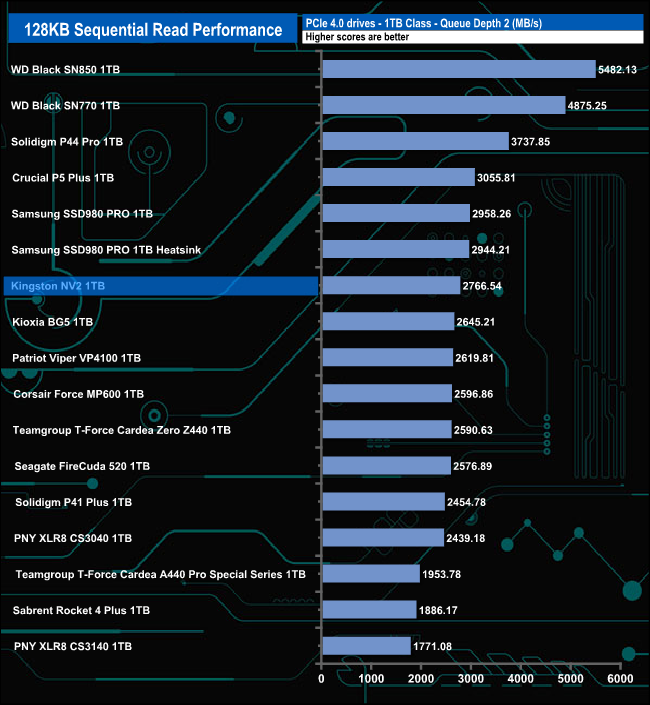
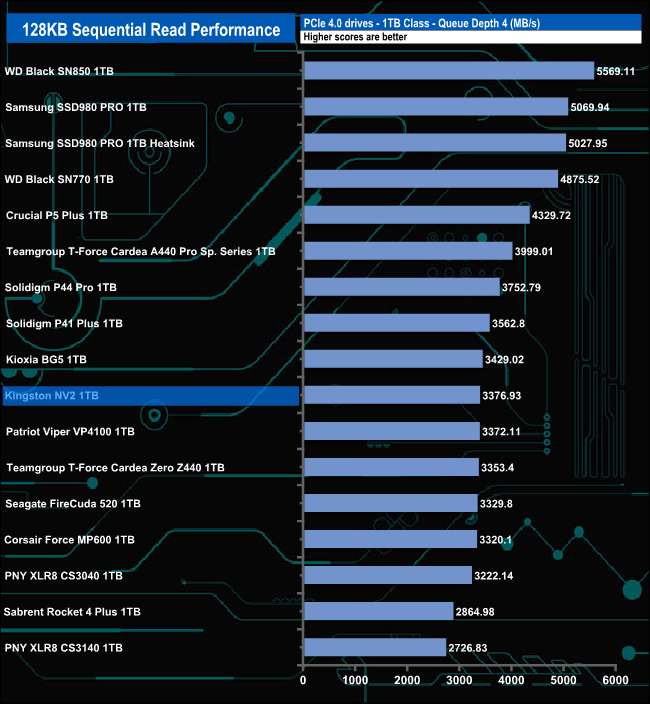
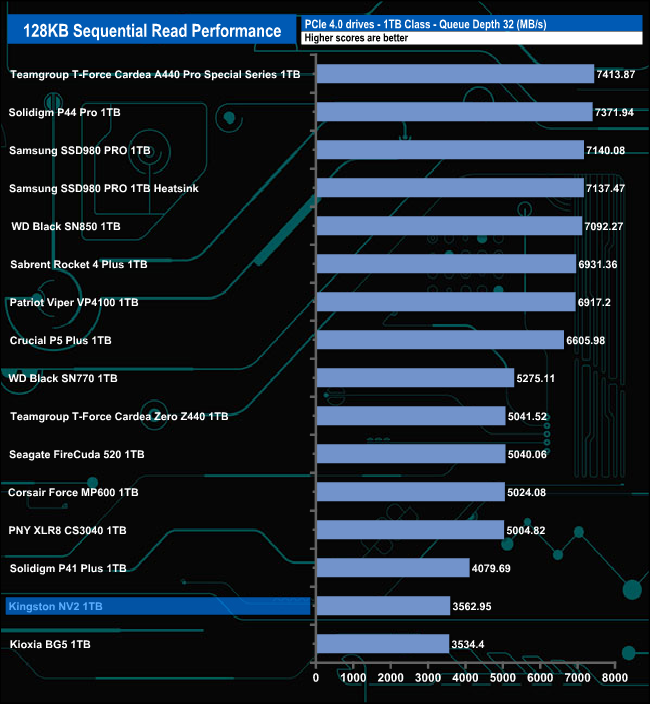
The NV2's best performance in the queue depth tests came at QD2 where its result of 2,766MB/s puts it in the top half of the 1TB class consumer drives we've tested to date. As the QD deepens the drive slips down the chart.
128KB Sequential Write v QD performance compared.
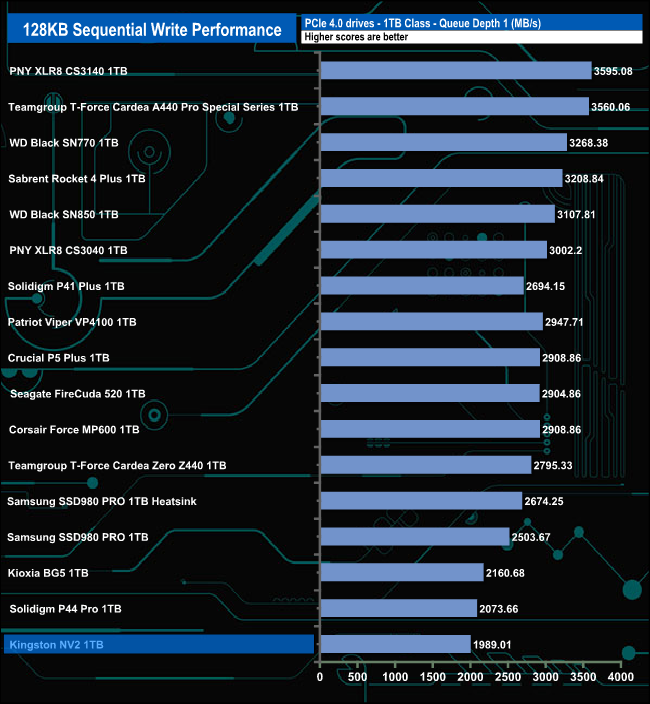
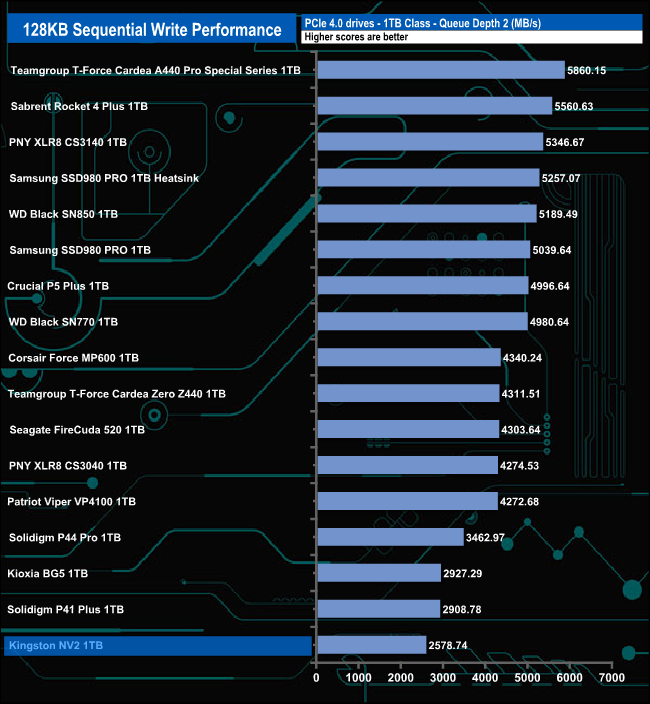

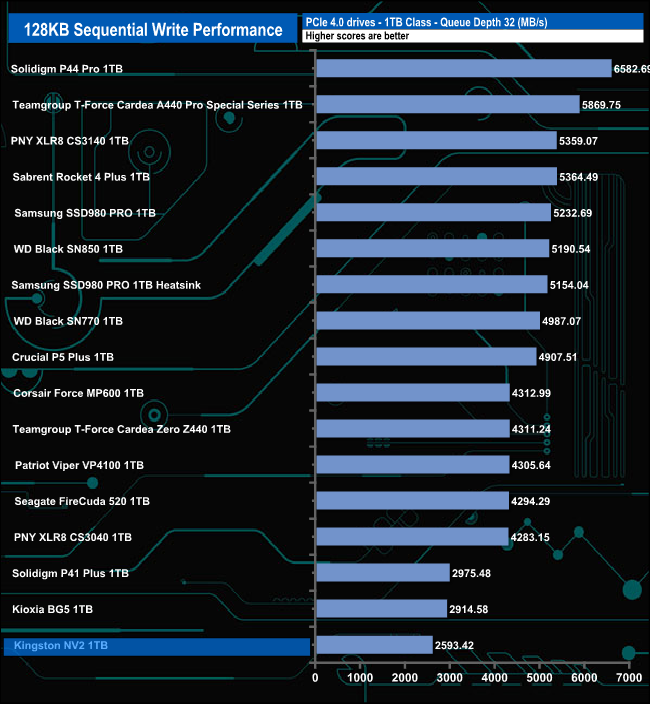
In comparison to the Sequential read QD results when it comes to Sequential writes, the drive stays firmly on the bottom of the performance graph through all the tested queue depths.
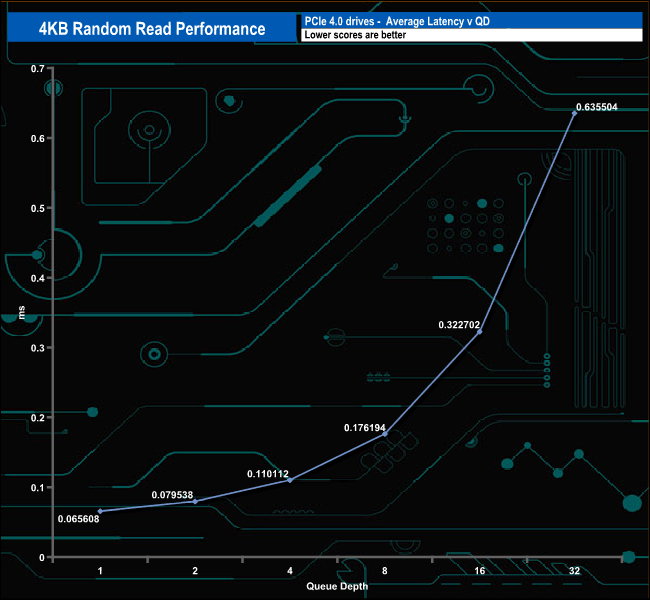
We used CrystalDiskMark 8‘s custom settings to test the 4K random read performance of the drive through a range of queue depths. The setup for the tests is listed below.
Transfer Request Size: 4KB, Outstanding I/O: 1-32.
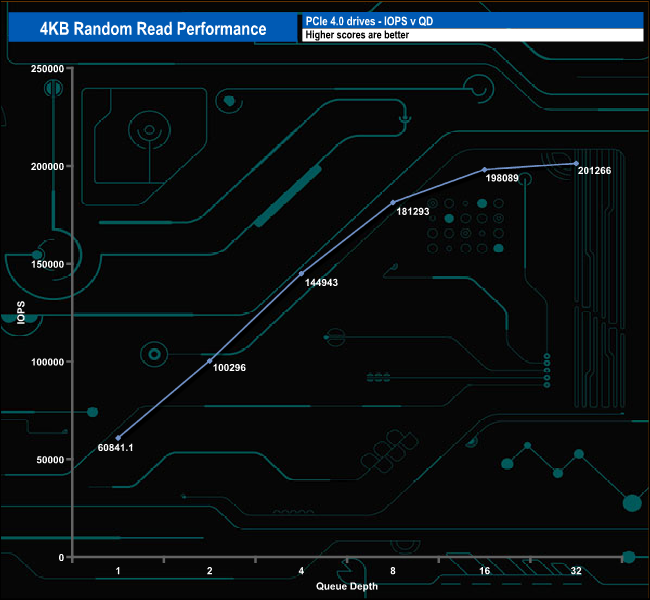
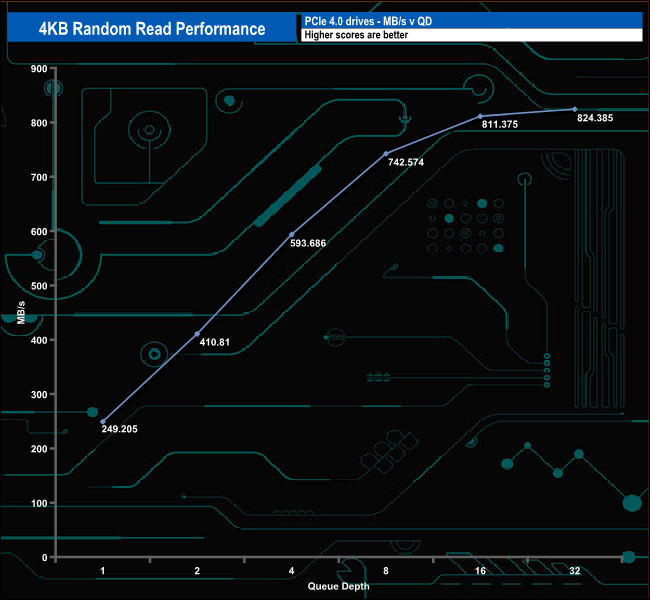
Kingston doesn't provide any random performance figures on the specification sheet for the NV2. Using our 4-threaded tests, the best performance figure we saw for random reads was 201,266 IOPS (824.385MB/s) at QD32.
Random 4K Read performance v QD compared.
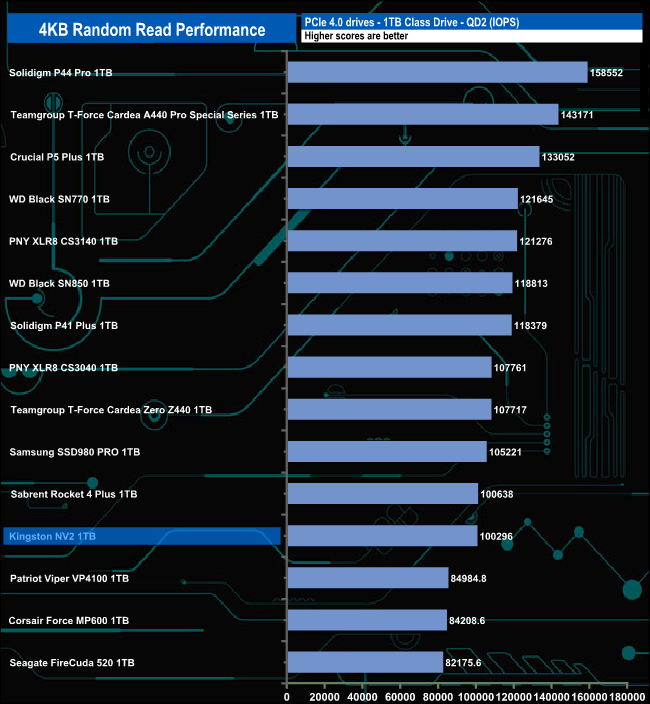

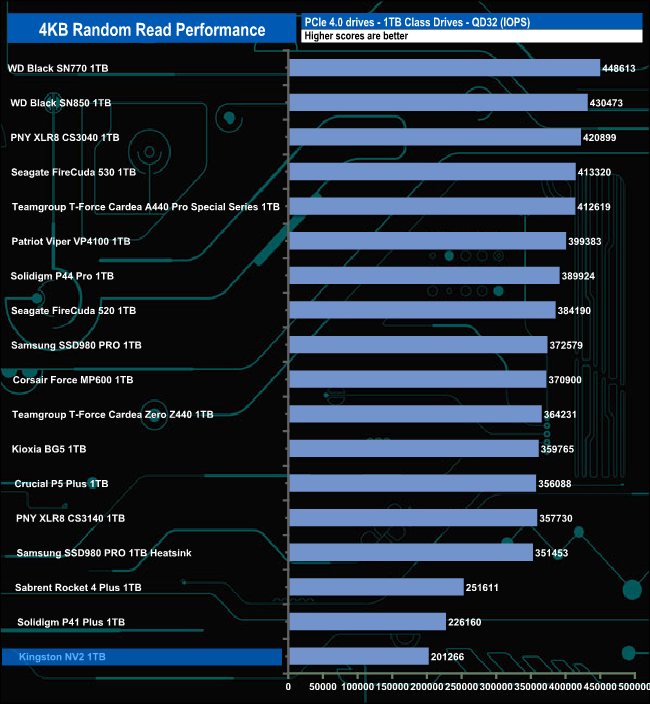
The NV2 sits in the bottom half of the results chart at QDs 1 and 2 but by the time it gets to QD4 and beyond it's sitting firmly at the base of the charts.
We used CrystalDiskMark 8‘s custom settings to test the 4K random write performance of the drive through a range of queue depths. The setup for the tests is listed below.
Transfer Request Size: 4KB, Outstanding I/O: 1-32.
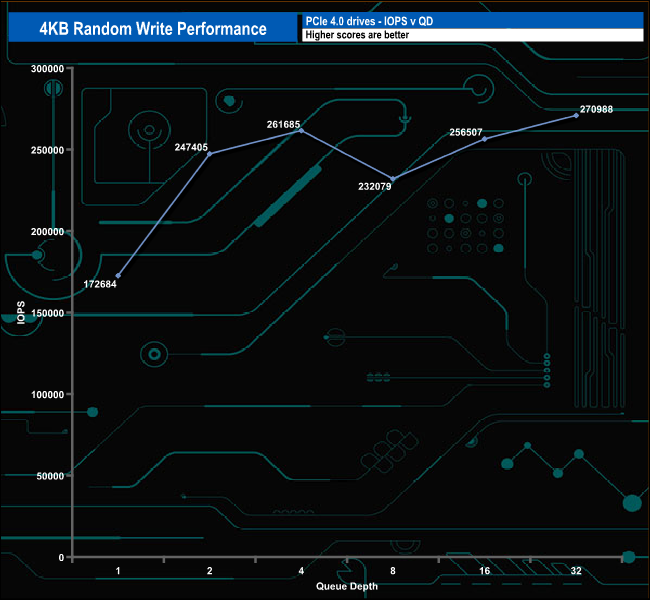
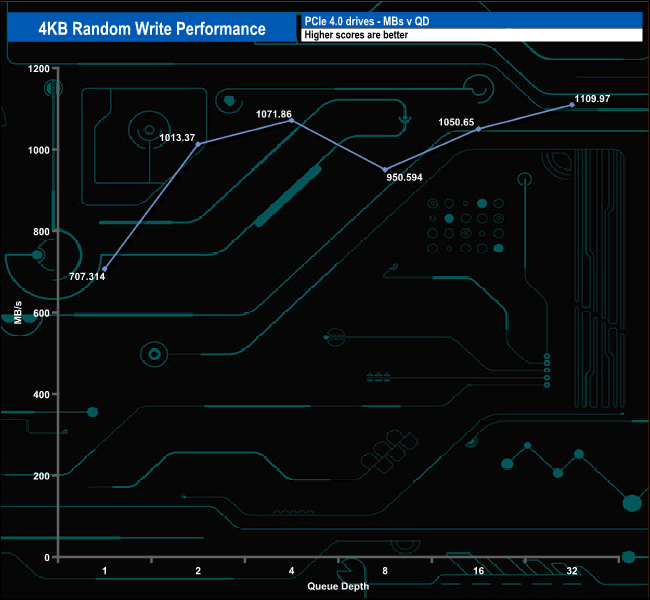
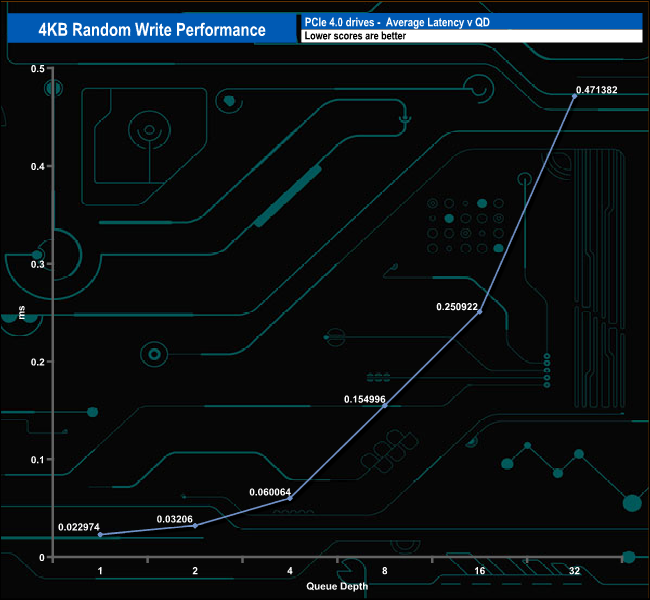
When it came to random writes, the best figure we saw came at QD32 at 270,988 IOPS (1,109.97MB/s). At QD8 the performance drops off (232,079 IOPS) but recovers back by QD16.
Random 4K write performance v QD compared.

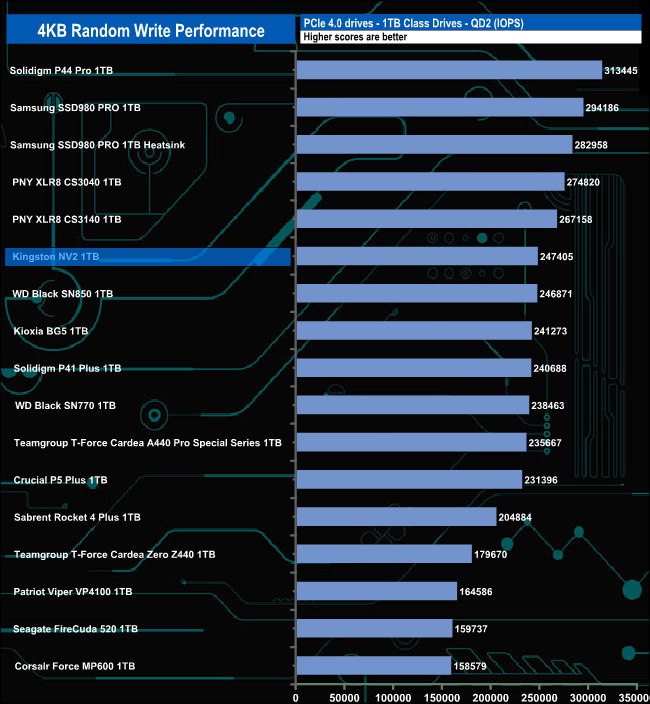
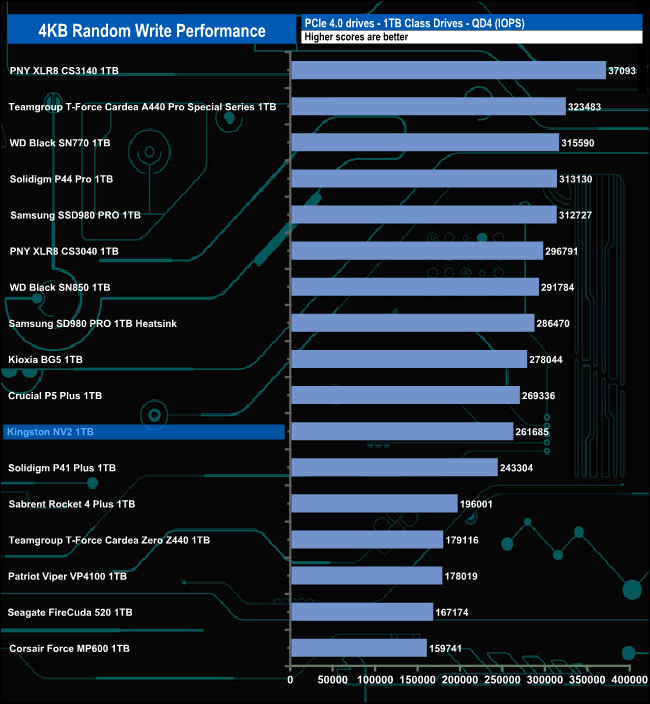
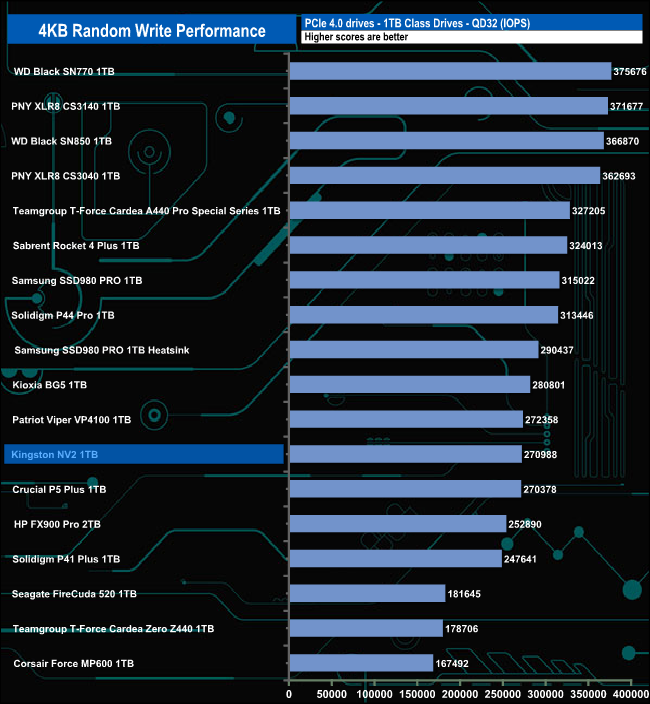
The drive offers pretty consistent performance at QDs 1 & 2 but as the queue depth deepens the drive begins to drop down the results graph.
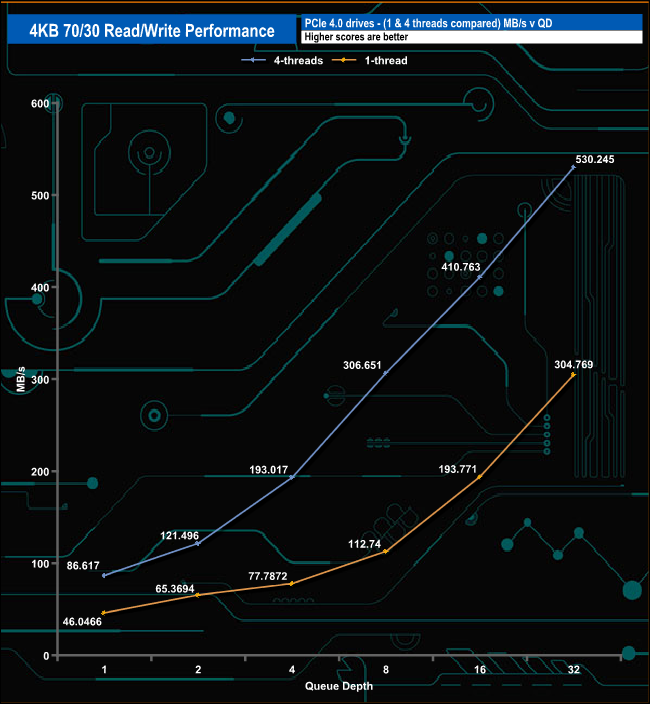
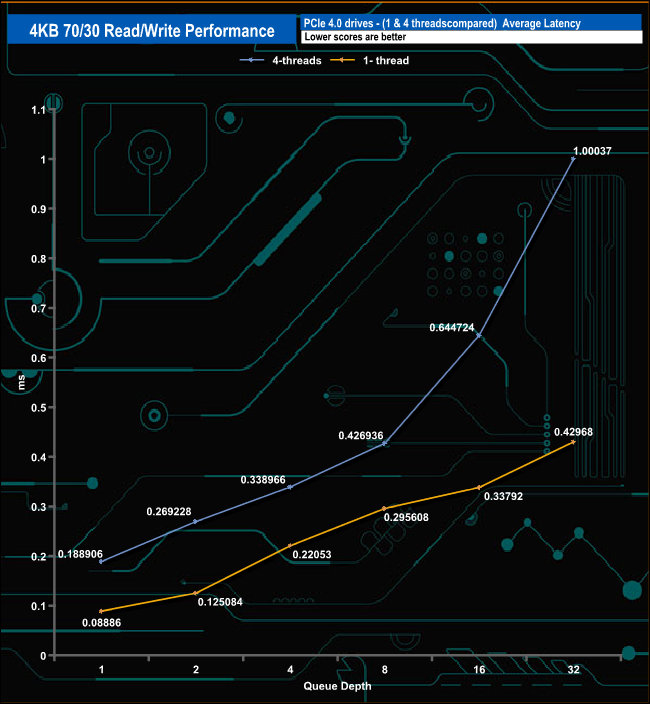
We used CrystalDiskMark 8’s custom settings to test the 4K 70/30 mixed read/write performance of the drive through a range of queue depths using a single thread and four threads.
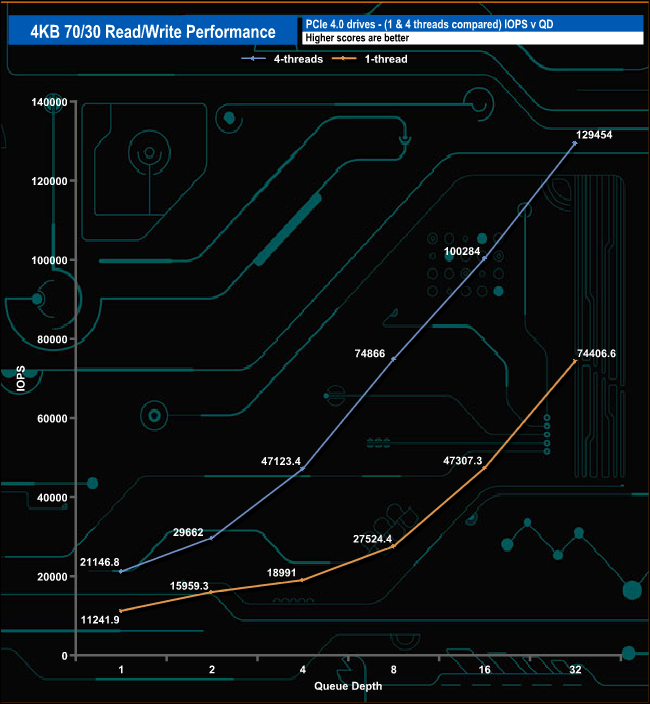
Using a single thread, the performance of the NV2 climbs pretty slowly from 11,241 IOPS at QD1 to 18,991 IOPS at QD4 where the drive picks up speed as the queue depth deepens to finish at 74,406 IOPS at QD32. Using four threads the performance starts climbing rapidly from QD2.
We used CrystalDiskMark 8 to test the random performance of the drive at lower queue depths (QD1 – QD8 where most of the everyday workloads occur) using 1 to 4 threads.
Random Read
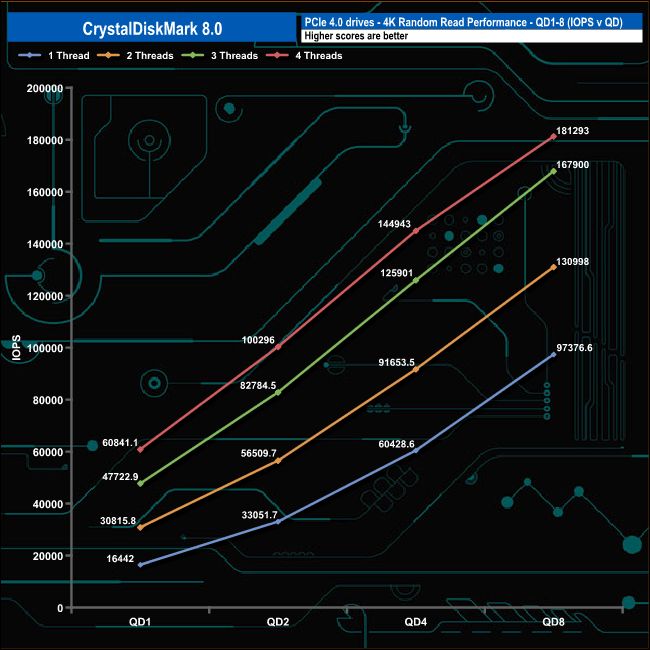
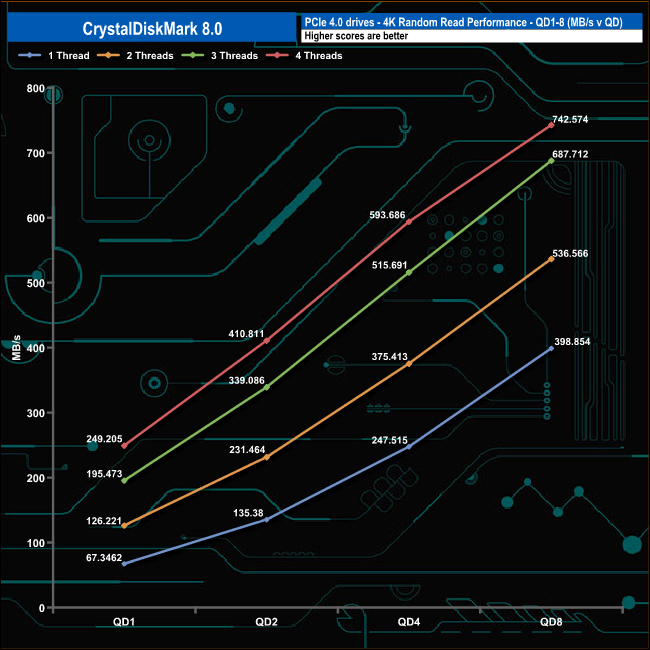
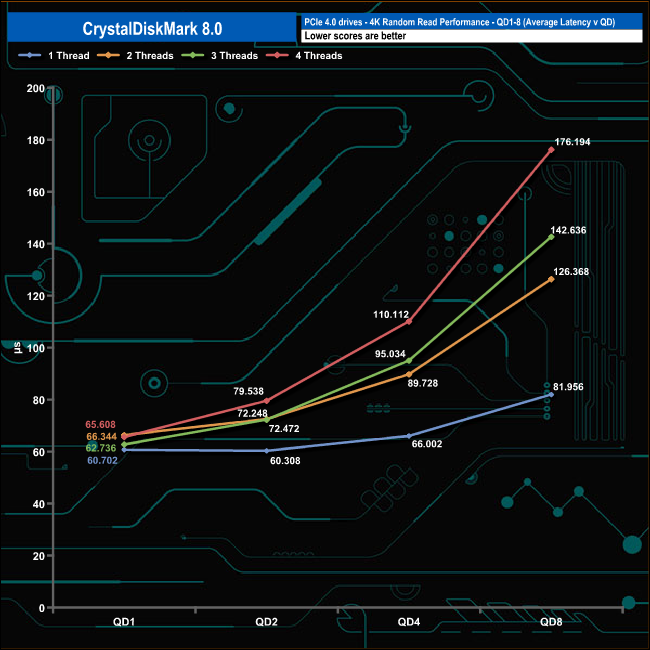
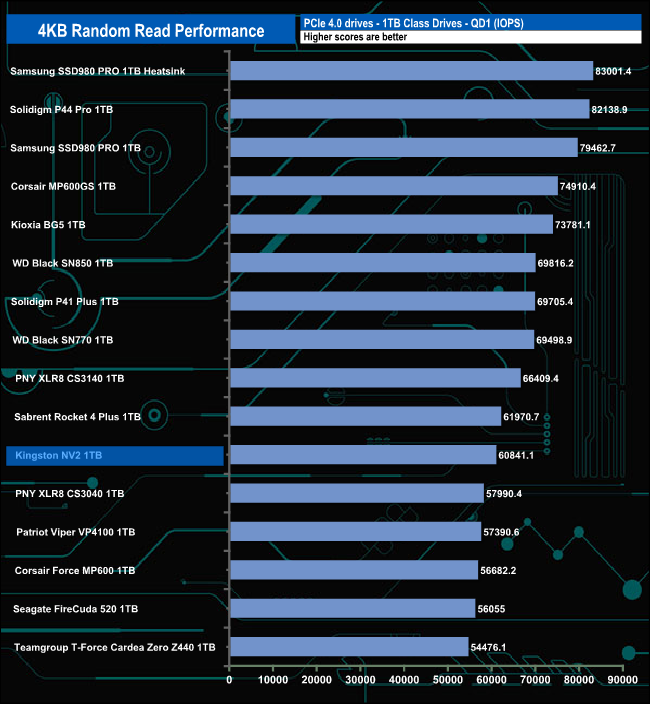
In our lower queue depth, 4K random read tests there are no unexpected shocks as the performance smoothly increases as the queue depth deepens for each tested thread. At QD1 the performance ranged from a low point of just 16,442 IOPS (67.34MB/s) for a single thread up to 60,841 IOPS (249MB/s) for four threads.
At QD8 a single thread produced 97,376 IOPS (398MB/s), two threads 130,998 IOPS (536MB/s), three threads 167,900 IOPs (687MB/s) and finally with four threads, 181,293 IOPS (742MB/s).
Random Write
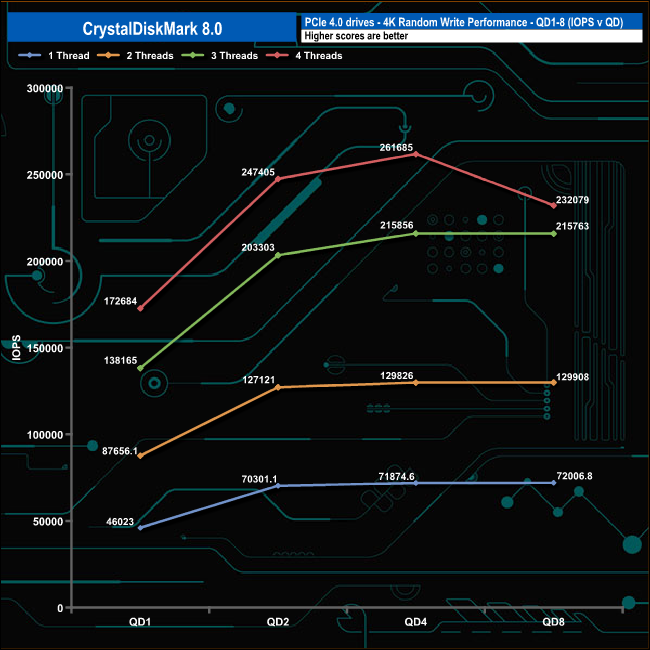
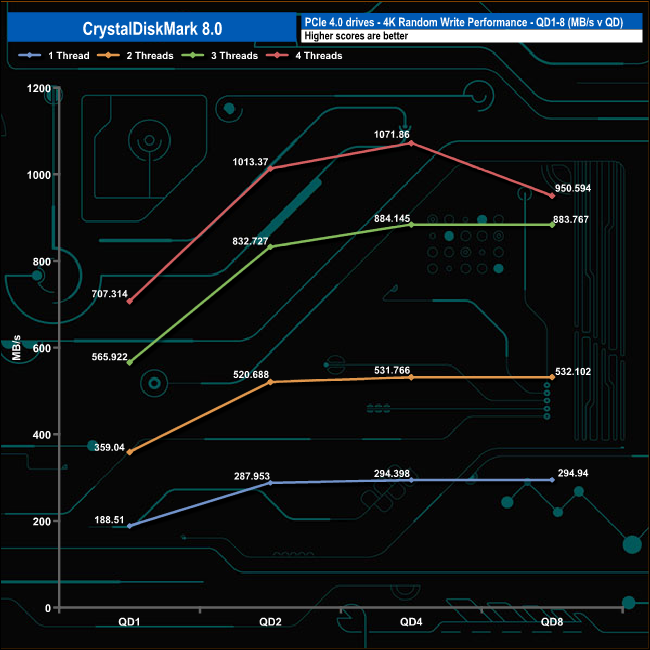
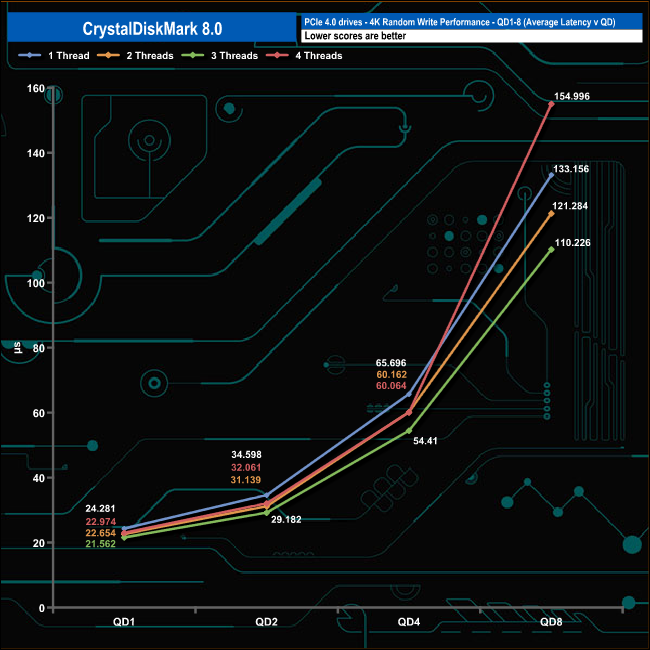
In the 4K write performance tests the performance rose pretty slowly from QD1 to QD2 using one and two threads before levelling off for the remainder of the test run. Using three threads the drive climbed quickly between QDs 1 and 2 before the rate of acceleration slowed between QDs 2 and 3 before slowing down at QD8. Much the same thing happened using four threads but between QDs 4 and 8 the performance dropped sharply away.
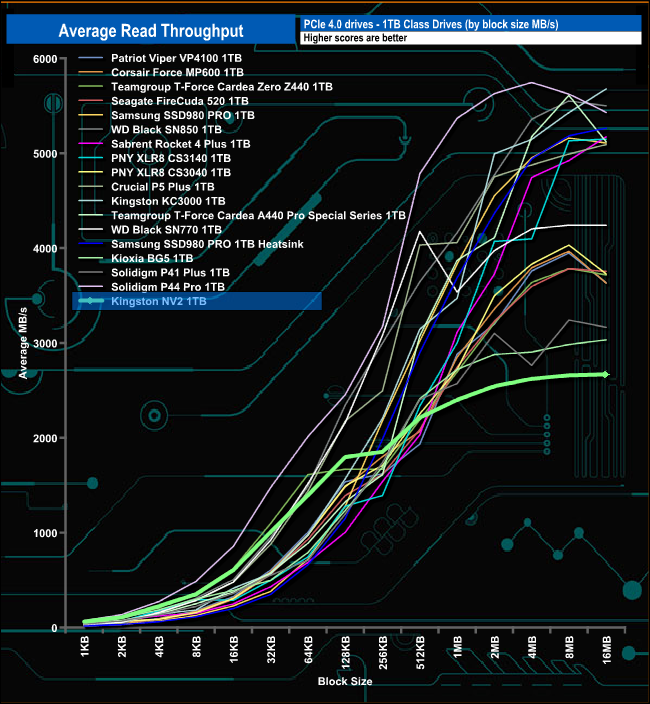
In our read-throughput test, the NV2 peaked at 2,688MB/s (16MB Block) well short of the official maximum of 3,500MB/s.

The 1TB NV2 drive is the slowest we've seen in our throughput test by quite some margin.
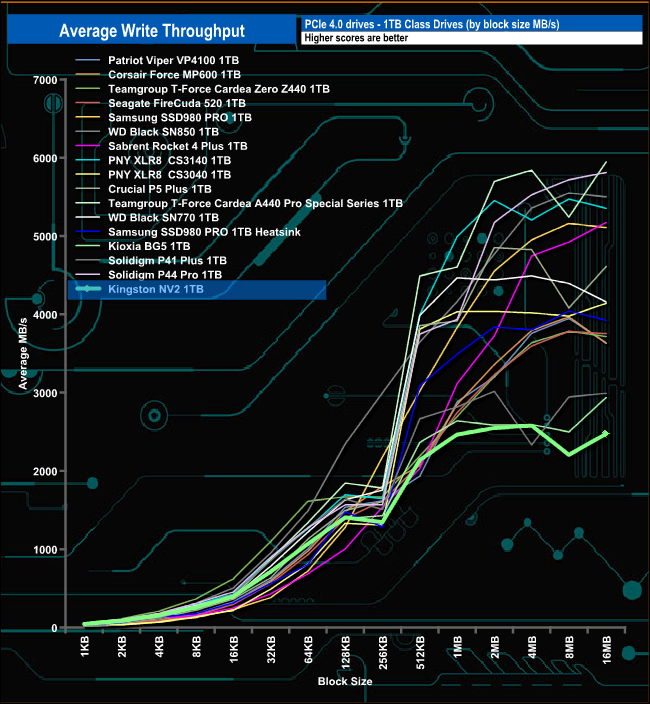
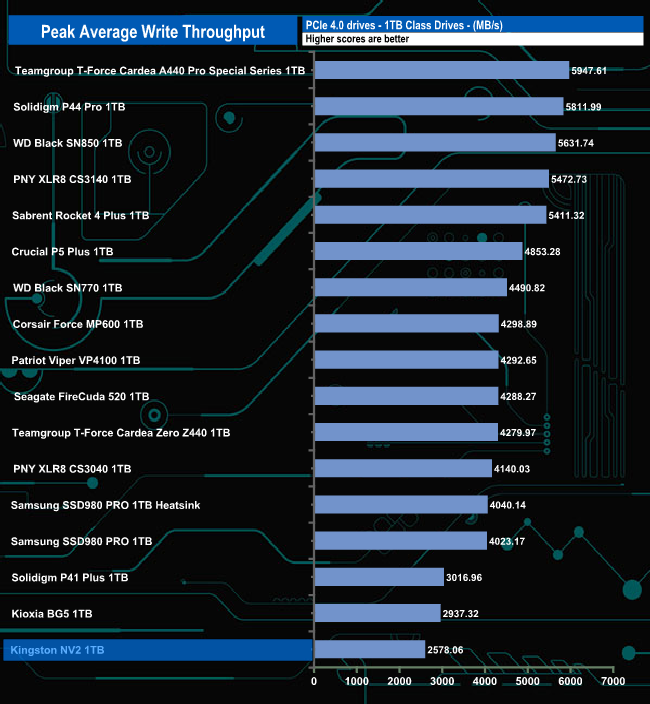
In our write throughput test the drive peaked at the 4MB Block mark at 2,578MB/s. The drive's performance then drops to 2,205MB/s before staging a recovery to finish the test run at 2,472.85MB/s. The peak result is once again shy of the official 2,800MB/s maximum figure.
The PCMark 10 Full System Drive Benchmark uses a wide-ranging set of real-world traces from popular applications and common tasks to fully test the performance of the fastest modern drives. The benchmark is designed to measure the performance of fast system drives using the SATA bus at the low end and devices connected via PCI Express at the high end.
The goal of the benchmark is to show meaningful real-world performance differences between fast storage technologies such as SATA, NVMe, and Intel’s Optane. The Full System Drive Benchmark uses 23 traces, running 3 passes with each trace. It typically takes an hour to run.
Traces used:
Booting Windows 10.
Adobe Acrobat – starting the application until usable.
Adobe Illustrator – starting the application until usable Adobe Premiere Pro – starting the application until usable.
Adobe Photoshop – starting the application until usable.
Battlefield V – starting the game until the main menu.
Call of Duty Black Ops 4 – starting the game until the main menu.
Overwatch – starting the game until the main menu.
Using Adobe After Effects.
Using Microsoft Excel.
Using Adobe Illustrator.
Using Adobe InDesign.
Using Microsoft PowerPoint.
Using Adobe Photoshop (heavy use).
Using Adobe Photoshop (light use).
cp1 Copying 4 ISO image files, 20 GB in total, from a secondary drive to the target drive (write test).
cp2 Making a copy of the ISO files (read-write test).
cp3 Copying the ISO to a secondary drive (read test).
cps1Copying 339 JPEG files, 2.37 GB in total, to the target drive (write test).
cps2 Making a copy of the JPEG files (read-write test).
cps3 Copying the JPEG files to another drive (read test).
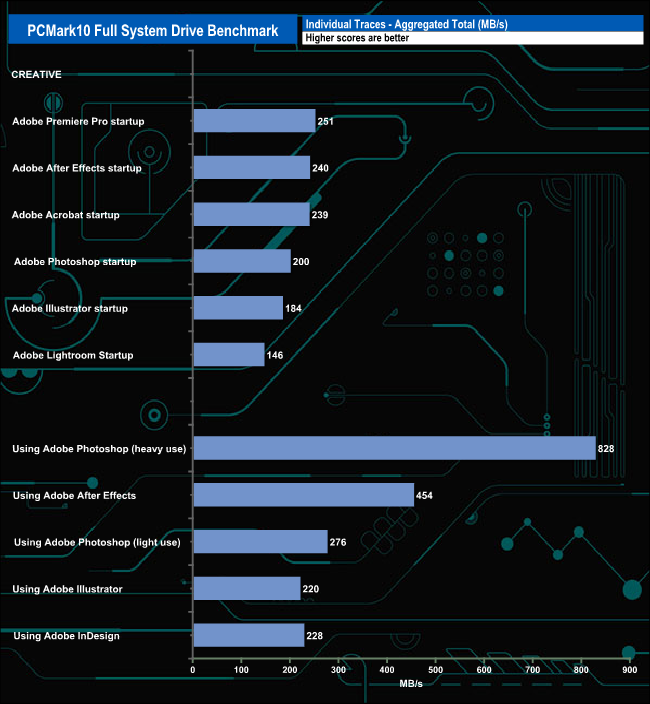
The NV2 handled the rigours of the PCMark 10 Full System Drive Benchmark reasonably well. The fastest individual trace result came from the Adobe Photoshop heavy usage trace at 828MB/s with the drive averaging 294.5MB/s for the other four usage traces. The six Adobe startup traces averaged 210MB/s with the fastest being Premiere Pro at 251MB/s and the slowest, Lightroom at 146MB/s.
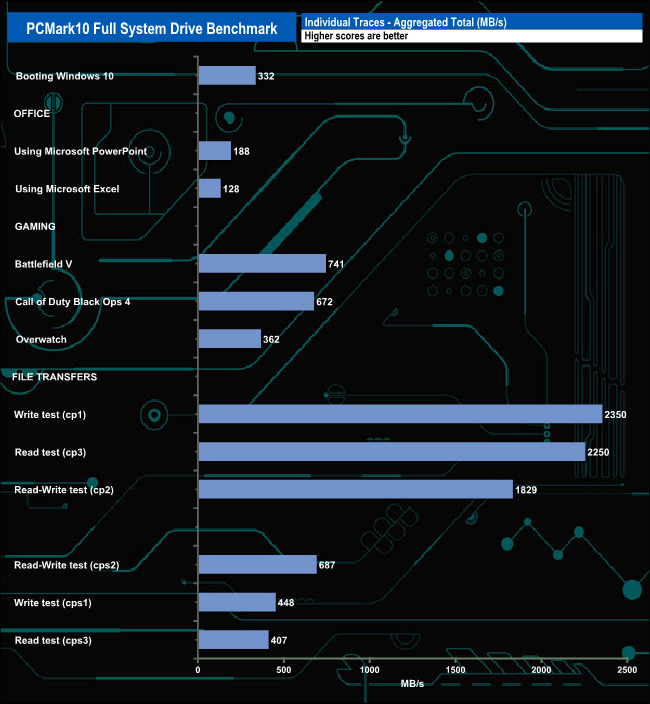
The drive averaged 591MB/s for the three gaming traces with the fastest being the Battlefield V trace at 741MB/s. When it came to the file transfers, the fastest was the cp1 Write test at 2,350MB/s.
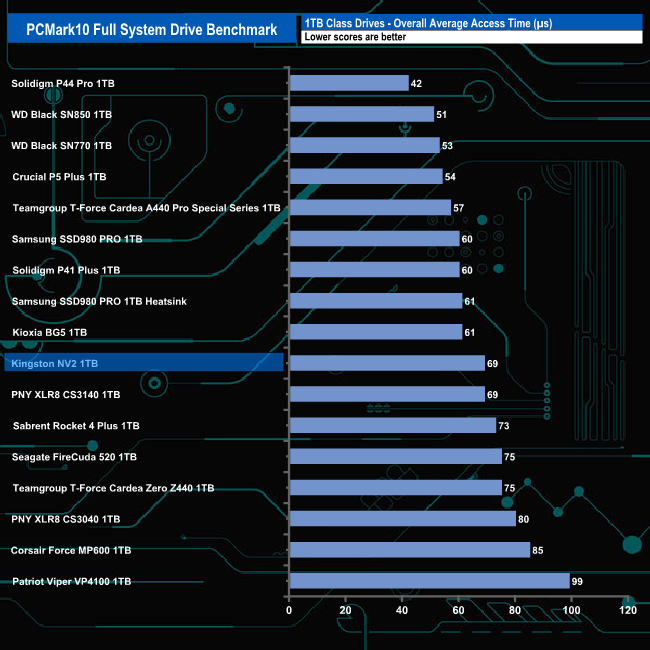
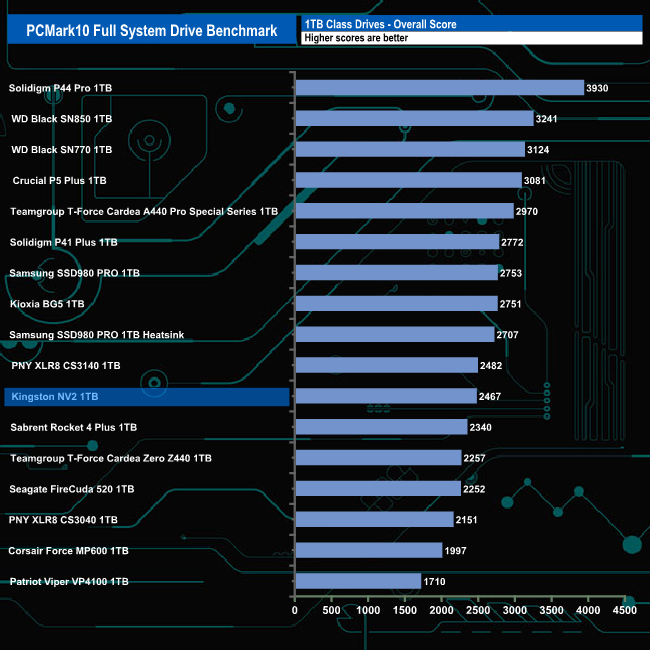
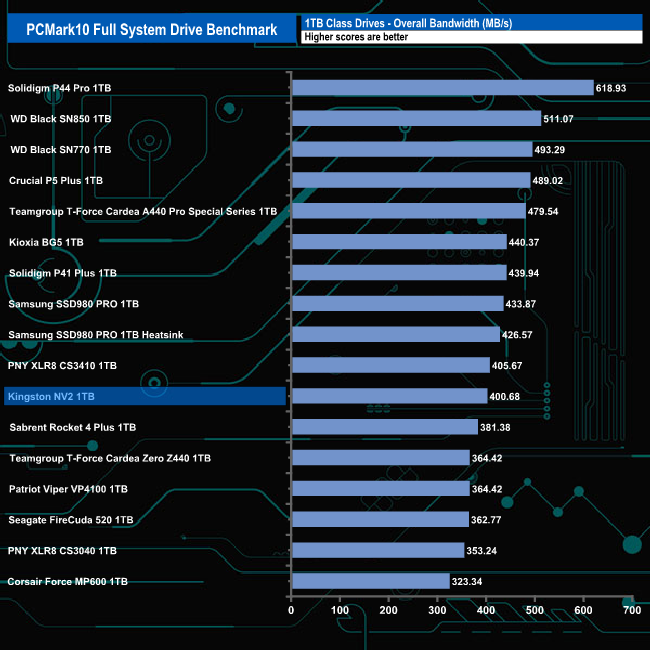
The overall bandwidth figure of 400.68 MB/s sees the drive sitting in the bottom half of the results chart.
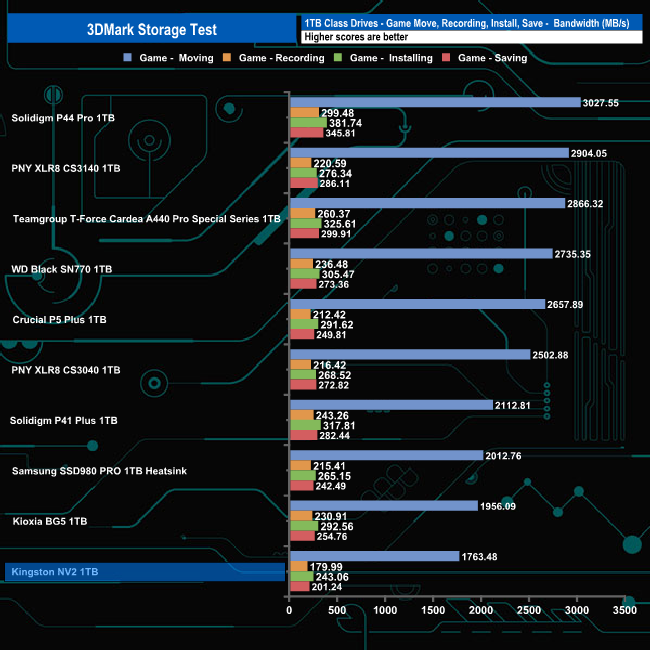
The 3DMark Storage Benchmark uses traces recorded from popular games and gaming-related activities to measure real-world gaming performance.
Traces used –
Battlefield V
Loading Battlefield™ V from launch to the main menu.
Call of Duty Black Ops 4
Loading Call of Duty®: Black Ops 4 from launch to the main menu.
Overwatch
Loading Overwatch® from launch to the main menu.
Game Move
Copying the Steam folder for Counter-Strike®: Global Offensive from an external SSD to the system drive.
Game Recording
Recording a 1080p gameplay video at 60 FPS with OBS (Open Broadcaster Software) while playing Overwatch®.
Installing Game
Installing The Outer Worlds® from the Epic Games Launcher.
Game Saving
Saving progress in The Outer Worlds game.
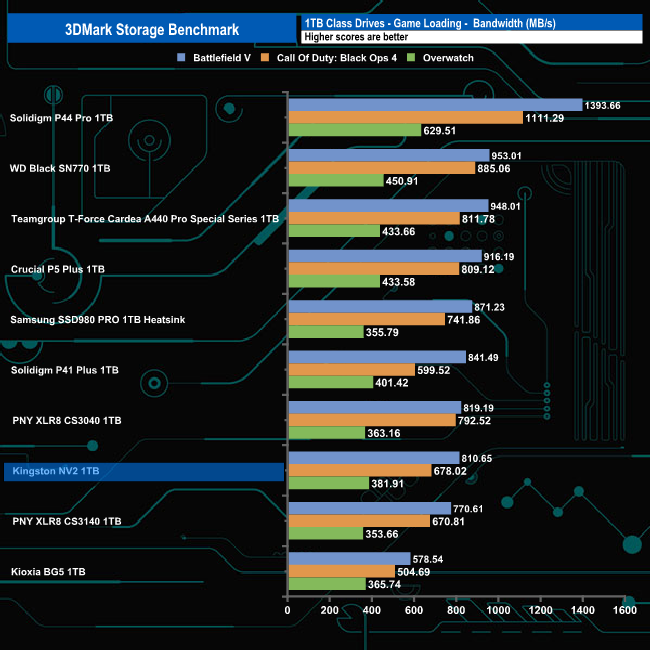
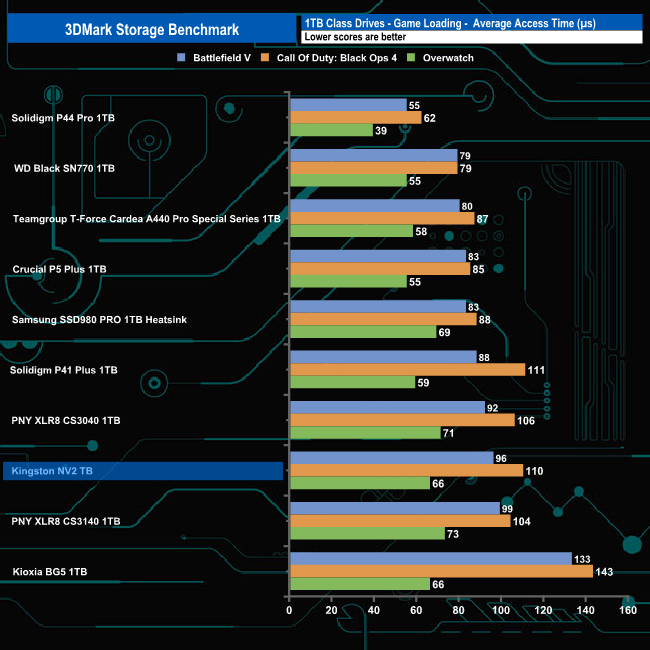
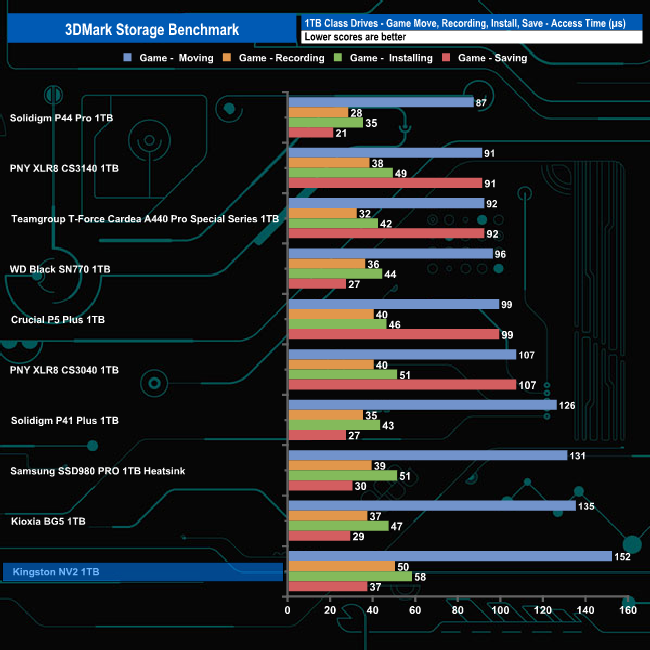
In 3DMark’s Storage Test, the 1TB NV2 had an average bandwidth figure of 623.53MB/s for the three-game load tests (Battlefield V, Call of Duty: Black Ops 4 and Overwatch) with an average access time of 90.66µs for the same three games.
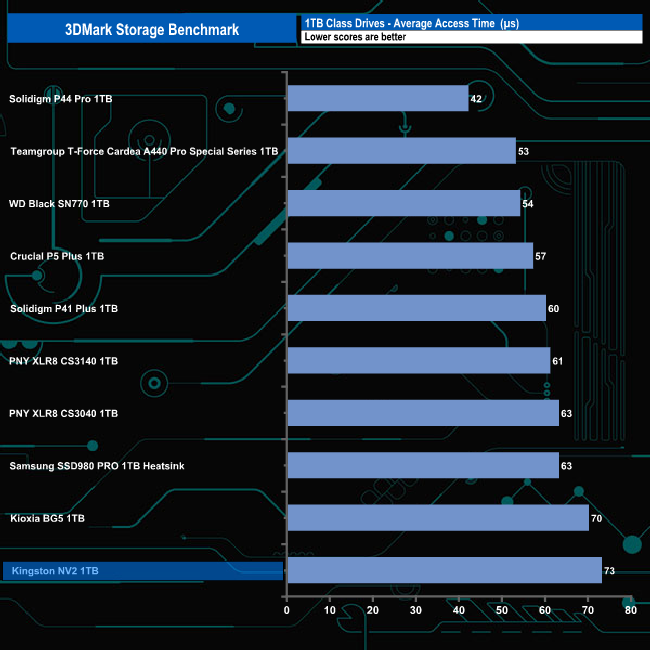
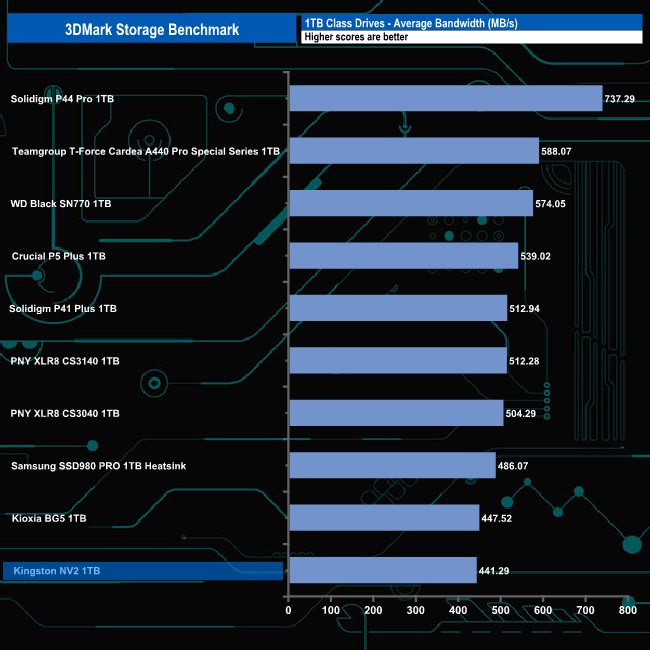
The overall average bandwidth figure of 441.29MB/s for the complete test run sees the drive in last position in the results chart.
The Final Fantasy XIV Endwalker Official Benchmark uses actual maps and playable characters to assign a score to your PC and rate its performance including scene loading times.
The benchmark gives an overall load time as well as loading times by scene.
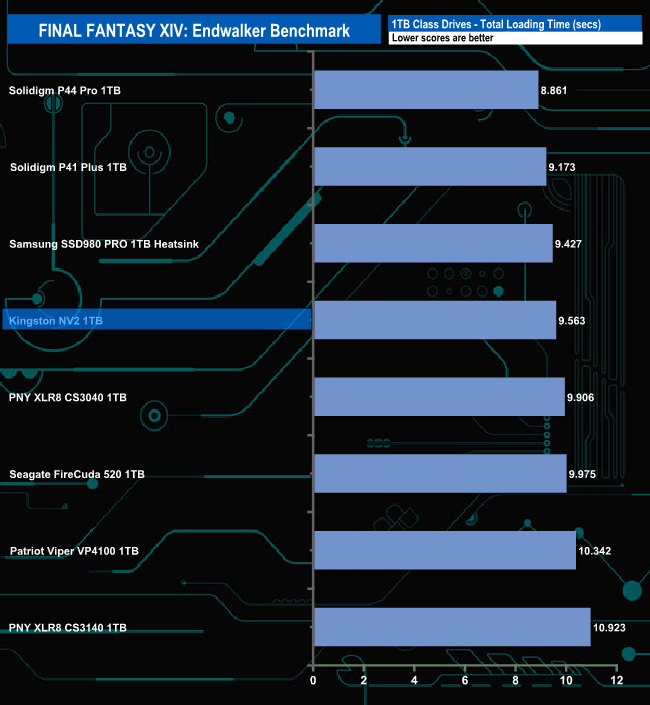
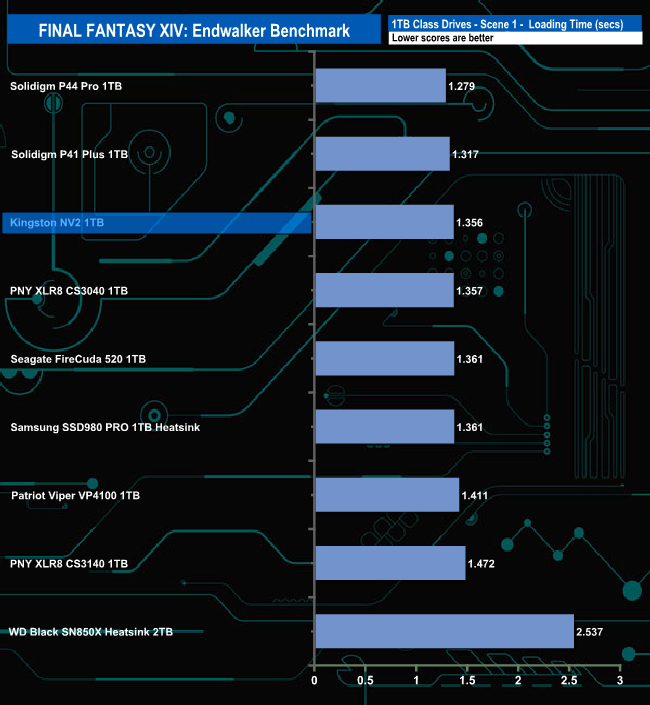
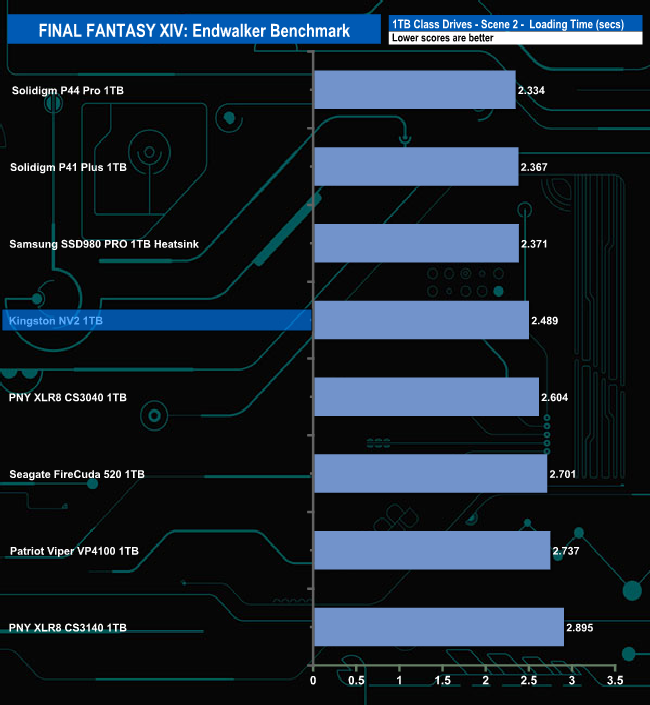
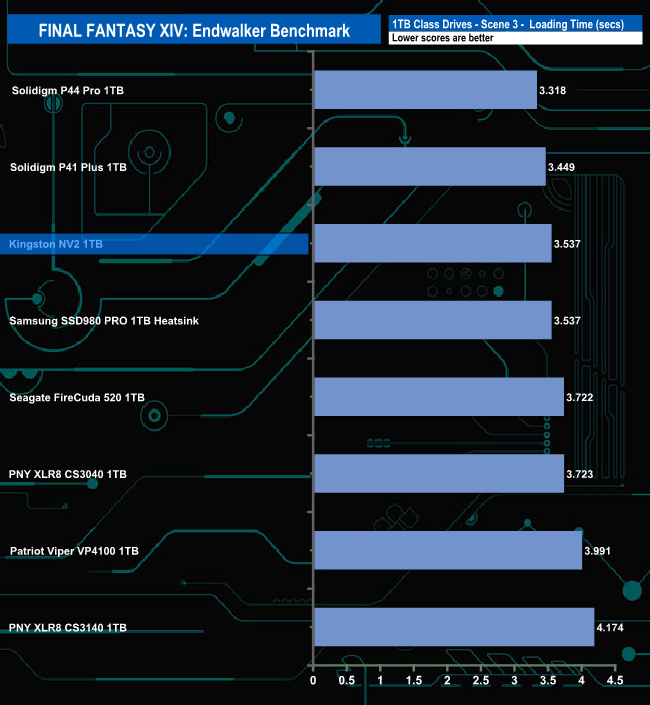
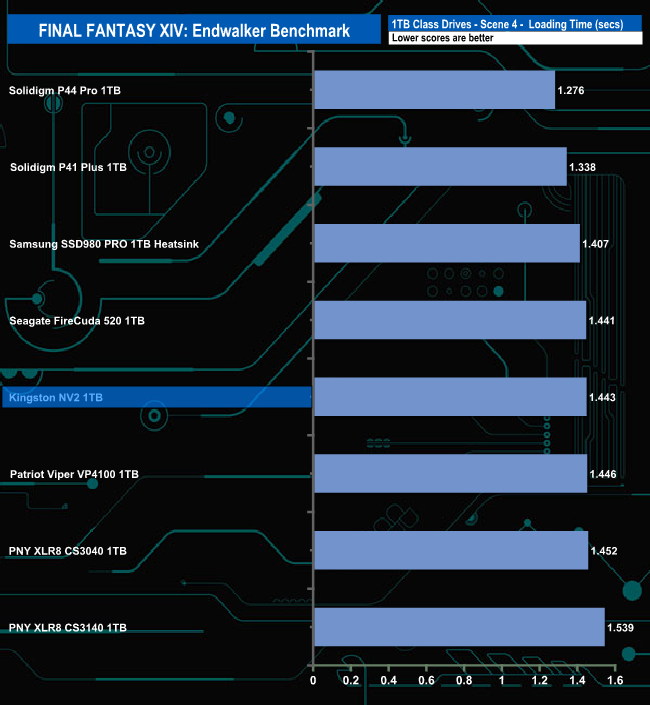
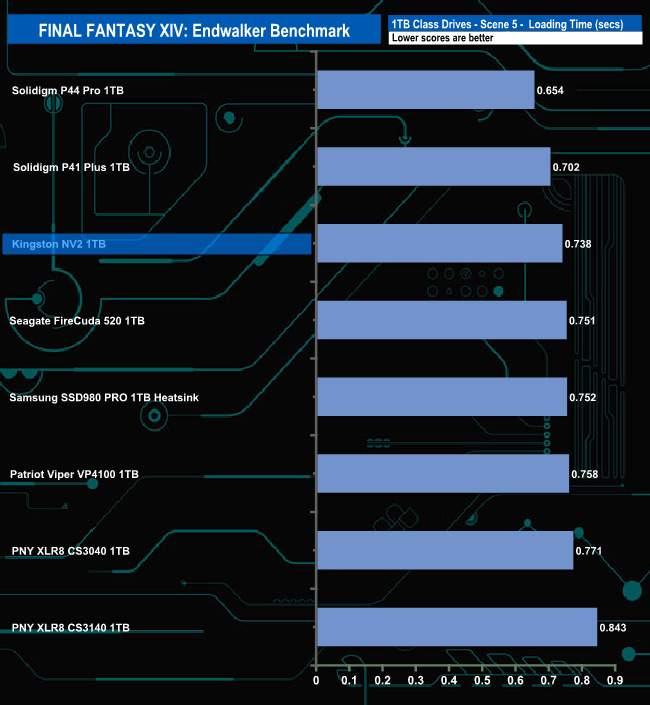
The Kingston NV2 does reasonably well with Final Fantasy XIV Endwalker Official Benchmark sitting mid-table for all of the scene load results charts.
We took note of the drive’s temperature during some of our benchmarking runs.
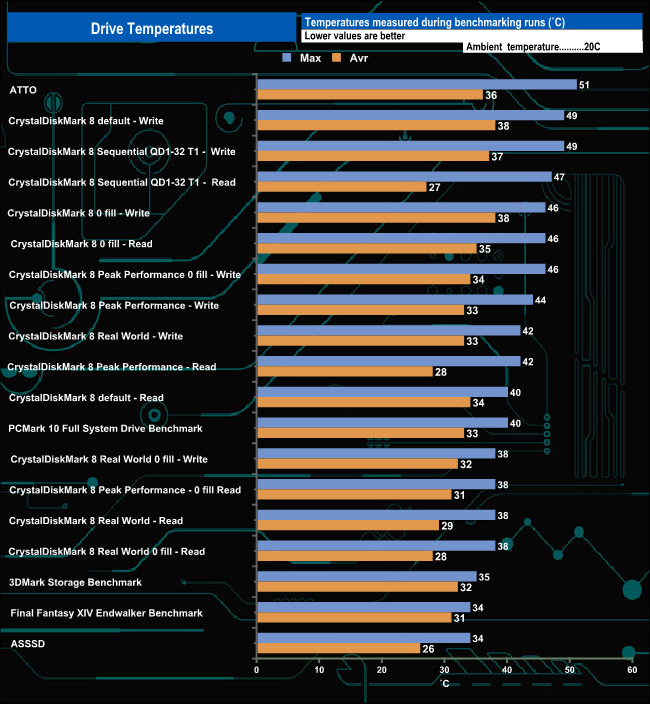
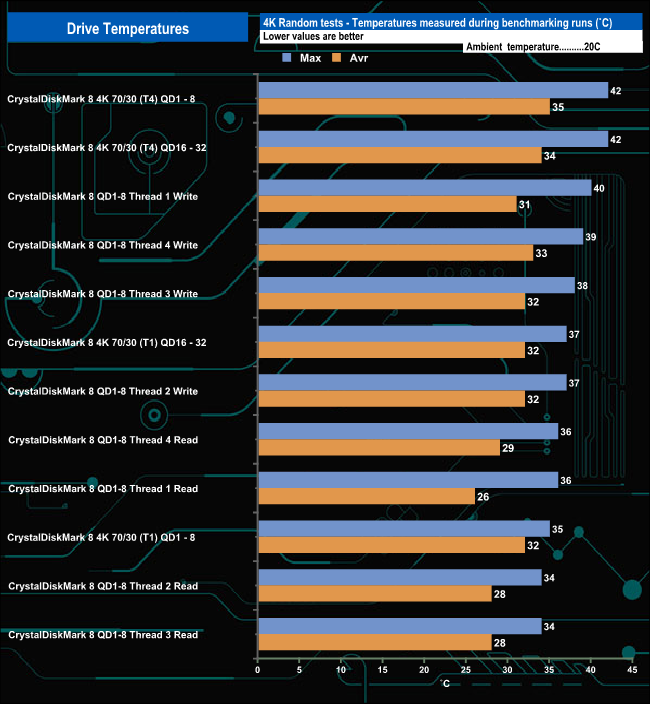
We took note of the drive’s temperature during some of our benchmarking runs. The Kingston NV2 doesn't come with any form of a physical heat sink but there didn't appear to be any throttling issues during our benchmarking of the drive. The hottest the drive got was during runs of the ATTO benchmark where it reached 51° C, below the 70° C maximum operating temperature. Overall the drive averaged 41° C during our testing.
To test the real-life performance of a drive we use a mix of folder/file types and by using the FastCopy utility (which gives a time as well as MB/s result) we record the performance of the drive reading from & writing to a 256GB Samsung SSD850 PRO.
Transfer Details
100GB data file.
60GB iso image.
60GB Steam folder – 29,521 files.
50GB File folder – 28,523 files.
12GB Movie folder – (15 files – 8 @ .MKV, 4 @ .MOV, 3 @ MP4).
10GB Photo folder – (304 files – 171 @ .RAW, 105 @ JPG, 21 @ .CR2, 5 @ .DNG).
10GB Audio folder – (1,483 files – 1479 @ MP3, 4 @ .FLAC files).
5GB (1.5bn pixel) photo.
BluRay Movie – 42GB.
21GB 8K Movie demos – (11 demos)
16GB 4K Raw Movie Clips – (9 MP4V files).
4.25GB 3D Printer File Folder – (166 files – 105 @ .STL, 38 @ .FBX, 11 @ .blend, 5 @ .lwo, 4 @ .OBJ, 3@ .3ds).
1.5GB AutoCAD File Folder (80 files – 60 @ .DWG and 20 @.DXF).
![]()
![]()
In our real-life transfer tests, the drive averaged 539MB/s when writing the larger file-size folders to the drive and 309MB/s when reading the data back. When it came to reading and writing the folders containing smaller bity files the drive was slower when it came to writes, averaging 416MB/s and faster when it came to reads at 442MB/s.
To get a measure of how much faster PCIe NVMe drives are than standard SATA SSD we use the same files but transfer to and from a 2TB Kioxia Exceria Plus drive:
![]()
![]()
Switching over to an all-NVMe architecture saw, as you can imagine, transfer speeds rocketing upwards. The NV2 averaged 2,118MB/s for writes and 2,332MB/s for read for the thirteen file transfers. The fastest write speed was 2,537MB/s for the 5GB image while the fastest read speed came from the 8K Movie Scenes folder at 2,705MB/s.
The entry-level Gen 4 SSD market segment is, by its nature, rapidly becoming a highly competitive one. Aiming for a slice of the action is Kingston with its NV2 drive, a successor to the PCIe Gen 3×4 NV1 drive.
The drive is a DRAM-less design using a 4-channel control which makes use of HMB (Host Memory Buffer) technology instead of a dedicated onboard DRAM IC.
As to the make of the controller and NAND, well that's where things get a bit interesting. It seems that Kingston is being flexible with the components the drive uses as long as the Sequential performance, interface and endurance ratings remain as per the specifications. So the drive has been reported as using either the Phison PS5021-E21T controller, or as in the case of our review sample, Silicon Motion's SM2267XT. Either way, it's a DRAM-less 4-channel controller with a NAND transfer rate of 1600 MT/s per channel. Similarly, it's been seen with two types of NAND, 112-Layer BiCS5 3D TLC or 144-layer QLC. Our review sample is sporting the QLC option.
Kingston rate the Sequential read/write performance of the 1TB NV2 as up to 3,500MB/s and 2,100MB/s respectively. When tested with the ATTO benchmark we got test results that confirmed and even bettered the official write rating at 2,400MB/s. Tested reads came up a little short of the official maximum at 3.180MB/s. However, switching over the CrystalDiskMark 8 benchmark we could confirm both official figures with default test results of 3,672MB/s and 2,621MB/s for read and writes respectively.
Kingston doesn't list any 4K random performance figures on the specification sheet for the drive, but the fastest we saw came from when the drive was tested with the Peak Performance profile of CrystalDiskMark 8. The fastest read figure, 201,561 IOPS, came from when the drive was using compressible data while the fastest write performance, 401,239 IOPS, came when the drive was being tested with incompressible data.
The drive doesn't come with any form of the heatsink and it does get warm when pushed but we didn't see any signs of throttling when the drive was being tested.
Kingston’s SSD management utility SSD Manager, may not be as feature-rich as some of its competitors but without all the bells and whistles and funky GUIs, it's still a pretty useful tool. It's regularly updated, will automatically detect any firmware updates as well as displaying drive status, temperatures and SMART information.
We found the 1TB Kingston NV2 on Box for £43.49 (inc VAT) HERE.
Pros
- Price.
- Decent real-life performance.
Cons
- 3-year warranty is a bit mean.
- Not the fastest Gen 4 drive we've seen.
- Components may differ.
KitGuru says: It may not set the world on fire with its performance and the hardware might be different from our review sample, but at the end of the day, it's still a 1TB Gen 4 drive for under fifty quid.