
We recently reviewed PNY's latest M.2 NVMe drive aimed at the high-end section of the market, the Gen 4 XLR8 CS3140. Now it's the turn of a Gen 4 drive a little lower down on the XLR8 food chain – today we're looking at PNY's XLR8 CS3040, aimed at the mainstream market segment.
Just like the XLR8 CS3140, there are two versions of the drive; one with a large extruded aluminium heatsink aimed towards desktop users and one without, just with a product label better suited to compact PCs, notebooks or if you want to make use of any integrated drive cooling your motherboard may have. The XLR8 CS3040 has one more capacity option than its faster sibling in the shape of a 500GB entry-level model. The drive uses a combination of a Phison PS5016-E16 controller and 96-layer 3D TLC NAND.
All four drives in the range have the same 5,600MB/s Sequential read rating. The 2TB and 1TB (the drive we are reviewing here) have an official Sequential write speed of up to 4,300MB/s with the entry 500GB drive rated at up to 2,600MB/s and the 4TB flagship drive up to 3,900MB/s. There are no 4K random performance figures given on the specification sheet for the drive.
PNY quotes an 1800TBW endurance figure for the 1TB XLR8 CS3040 and PNY backs the drive with a 5-year warranty.
Physical Specifications:
- Usable Capacities: 1TB.
- NAND Components: 96-layer TLC NAND.
- NAND Controller: Phison PS5016-E16.
- Cache: 1GB DDR4-2666.
- Interface: PCIe Gen 4 x4, NVMe 1.3.
- Form Factor: M.2, 2280.
- Dimensions: 80 x 22 x 20mm.
- Drive Weight: 47g
Firmware Version: CS304130.
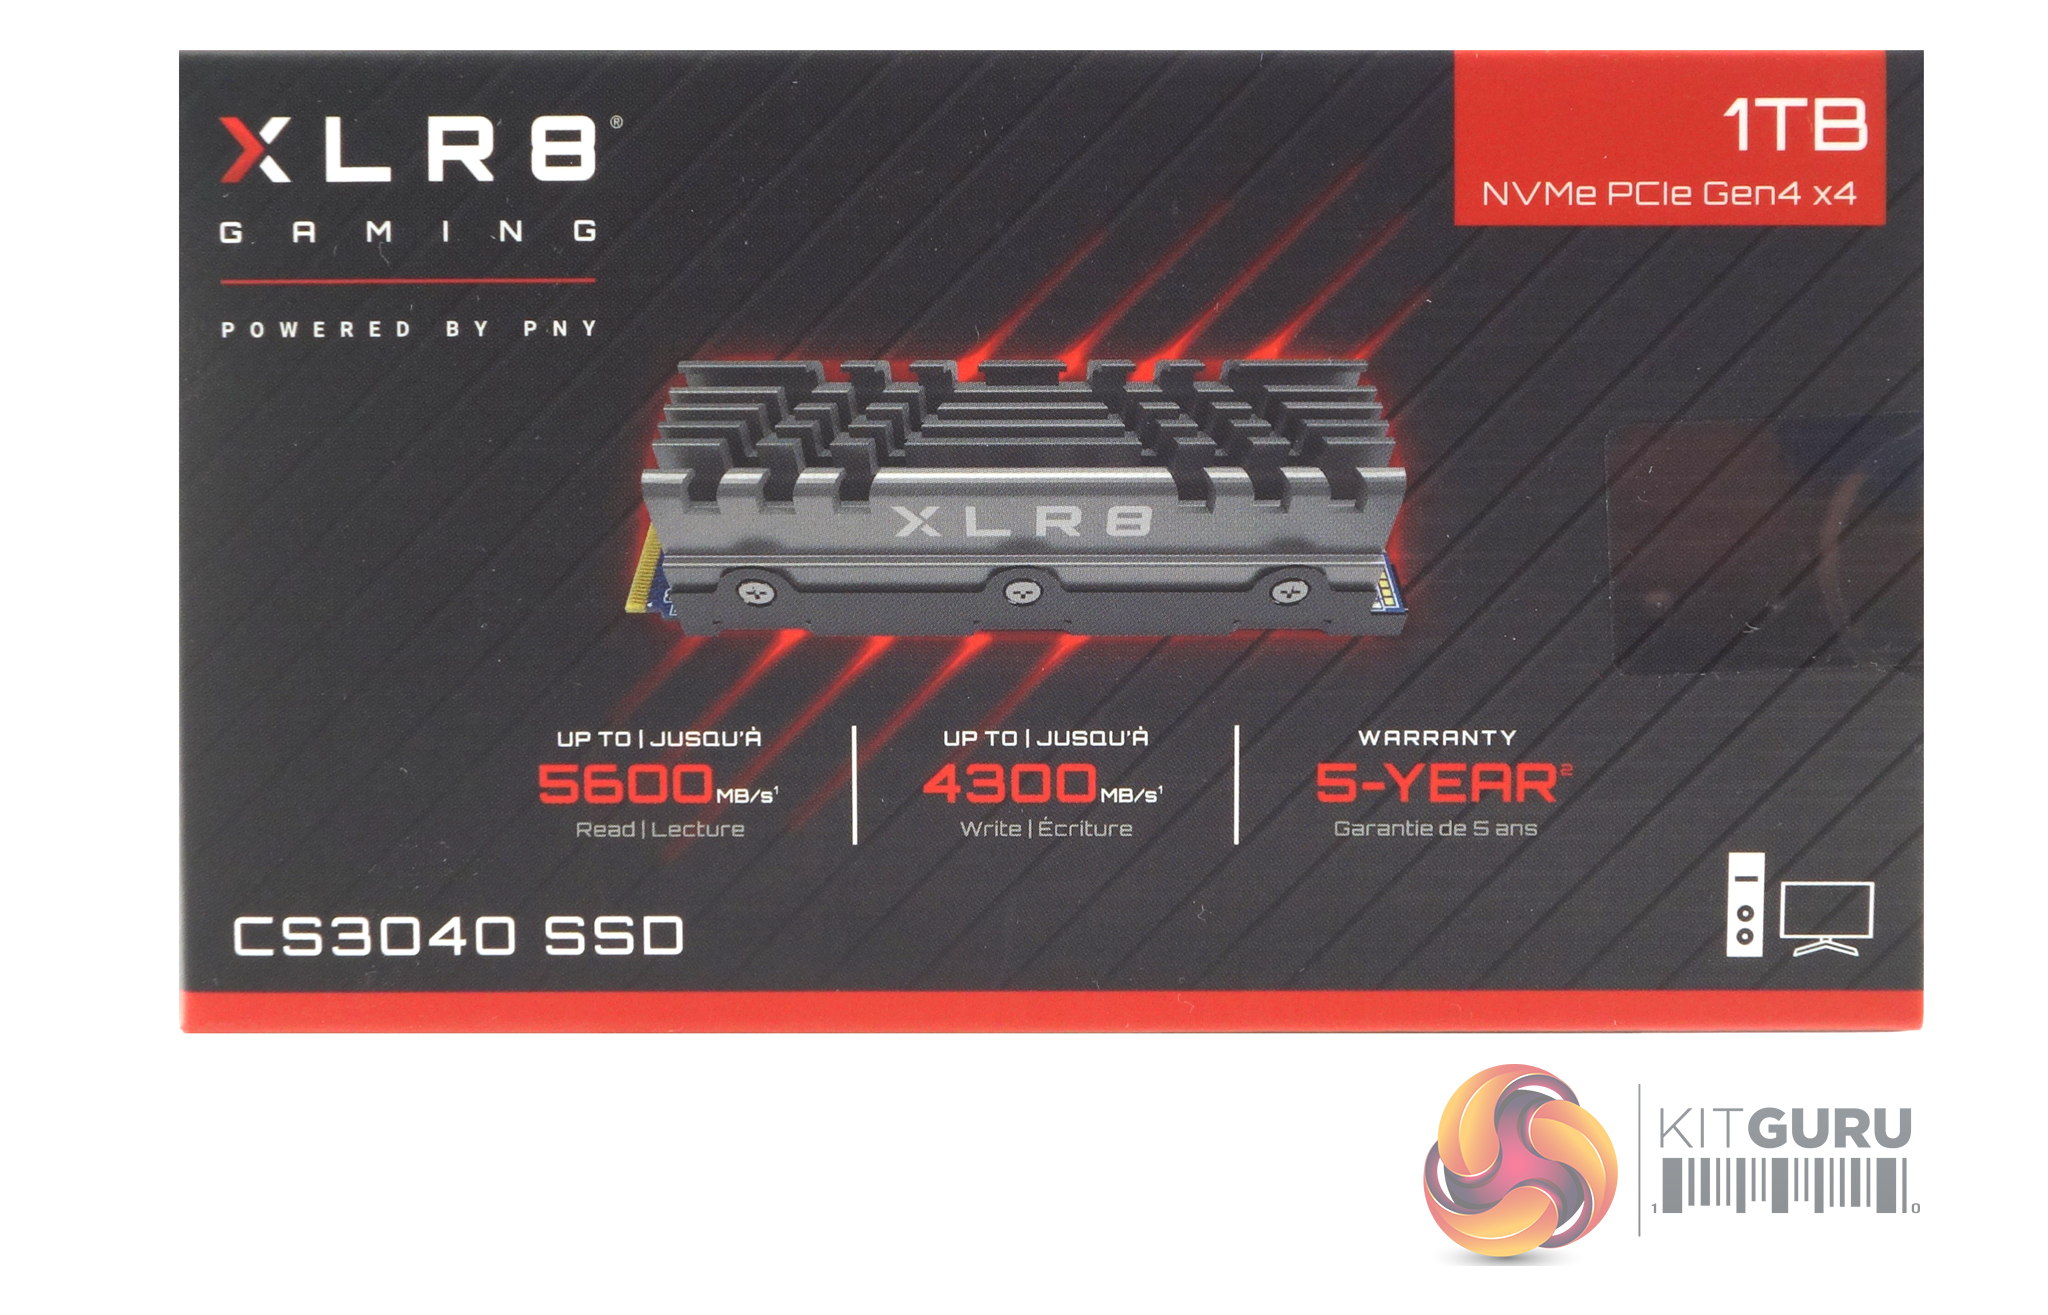

The PNY XLR8 CS3040 comes in a compact box with an image of the drive on the front, along with the drive’s capacity on the top right-hand corner. Under the drive image, we find the read and write sequential speeds (5,600MB/s reads, 4,300MB/s writes) along with the drive’s warranty length. The rear of the box has a very small product info panel but most of the back is taking up by multilingual marketing information.


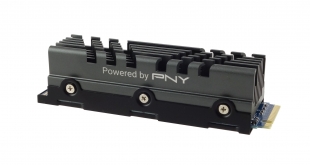
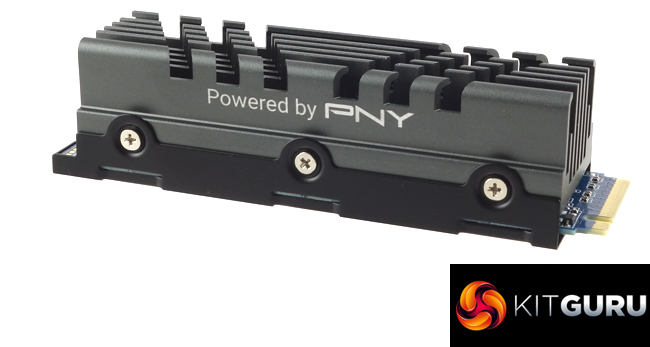
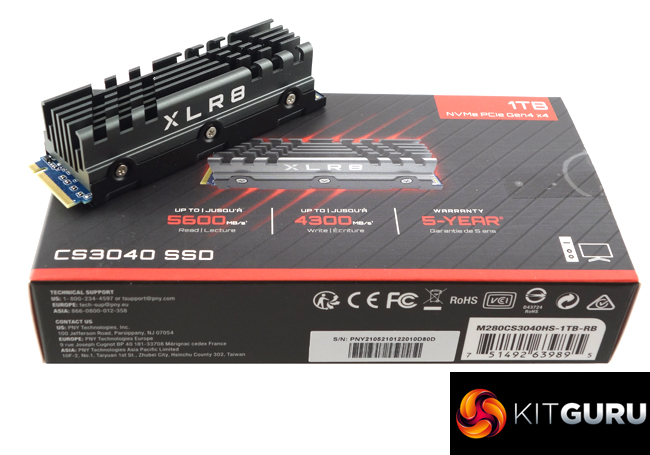
PNY sent us the heatsink version of the XLR8 CS3040 to review which has a chunky extruded aluminium heatsink weighing in at 45g covering the entire PCB. It's a two-part design with the heatsink itself connecting to a cradle that holds the drive via six tiny screws. To access the drive it's just a matter of undoing the six screws and very gently easing out the top part of the heatsink, although you do have to persuade the thermal pads that PNY are using, to let go of the drive.

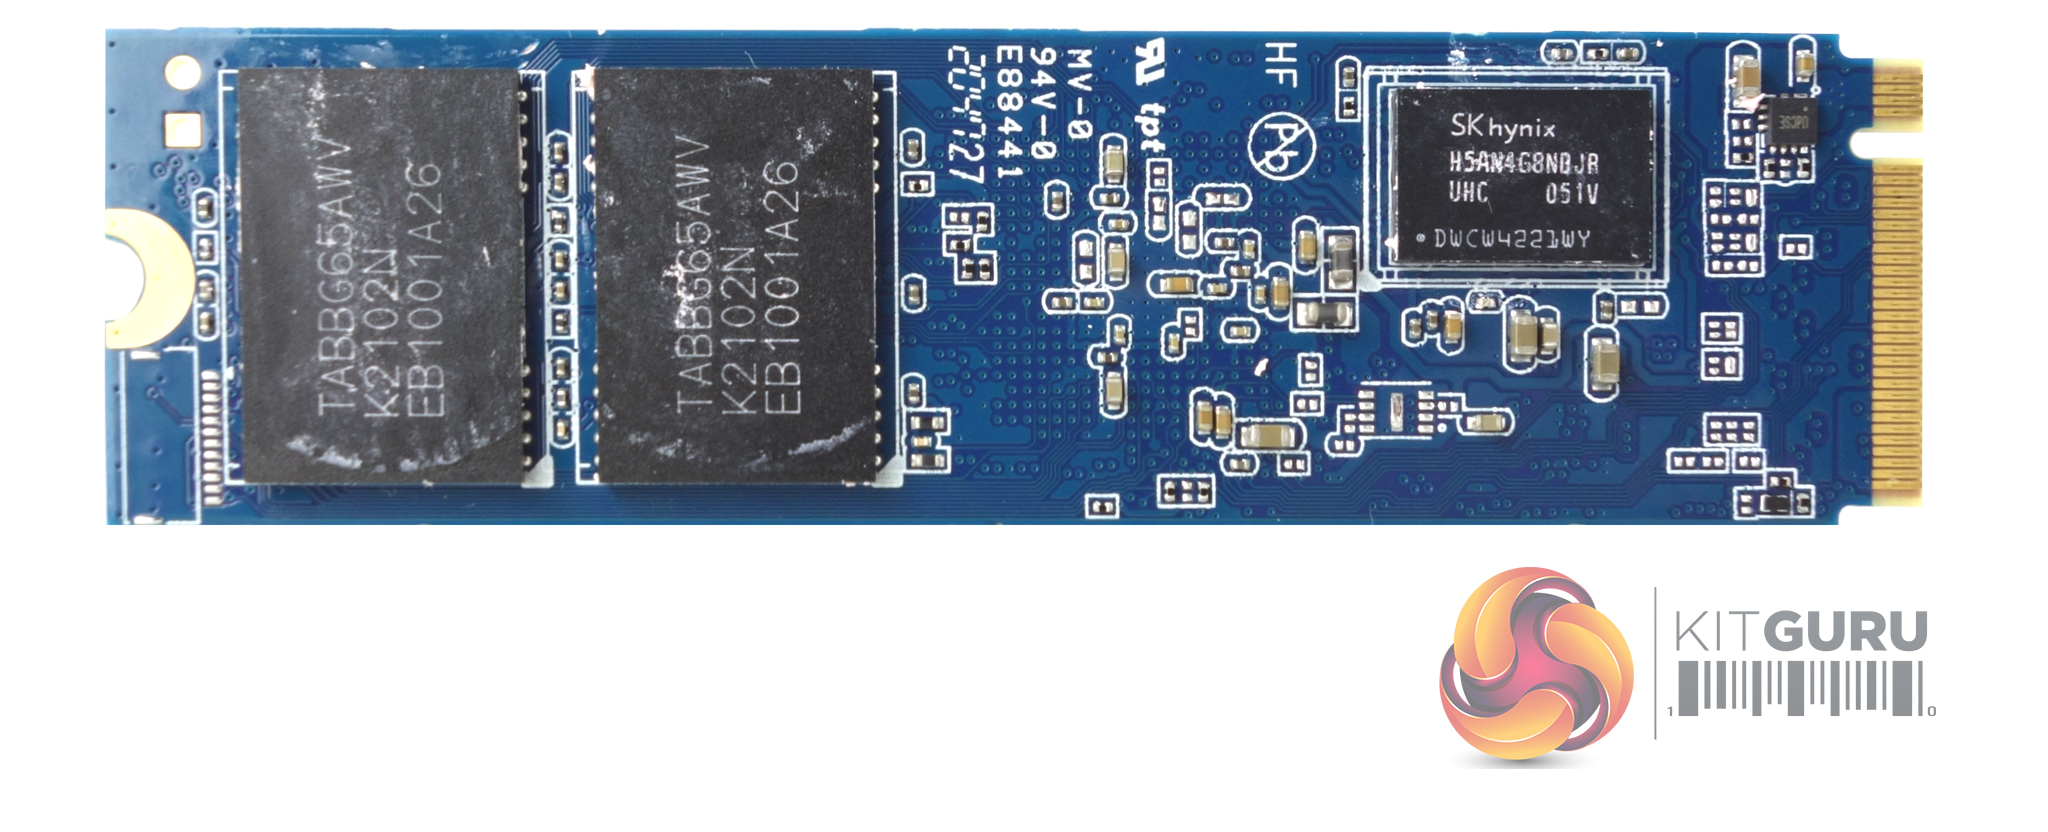
The 1TB version of the XLR8 CS3040 is built on a dual-sided M.2 2280 format. One side of the PCB holds two 256GB 96-Layer 3D TLC NAND packages (coded TABBG65AWV), the Phison PS5016-E16 controller and a 512MB DDR4-2666 SK hynix (H5AN4G8NBJR-UHC) cache chip. The other side of the board holds another two 96-Layer NAND packages and a second cache chip.
Phison’s PS5016-E16 was the world’s first PCIe Gen4 x4 controller. Built on a 28nm process using a 32-bit ARM Cortex R5 processor, the 8-channel PS5016-E16 supports 3D and QLC NAND at a maximum speed of 800MT/s per channel.
It supports Phison’s 4th generation LDPC ECC engine to protect data and also features integrated End-to-END data protection. Security is further enhanced with support for TCG, Opal 2.0, Pyrite, Sanitize and Crypto Erase technologies.

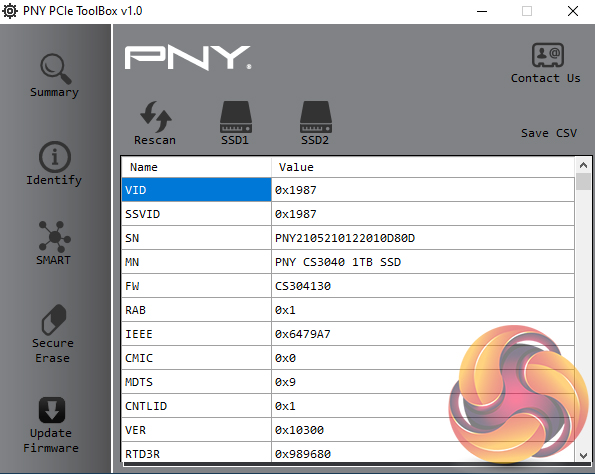


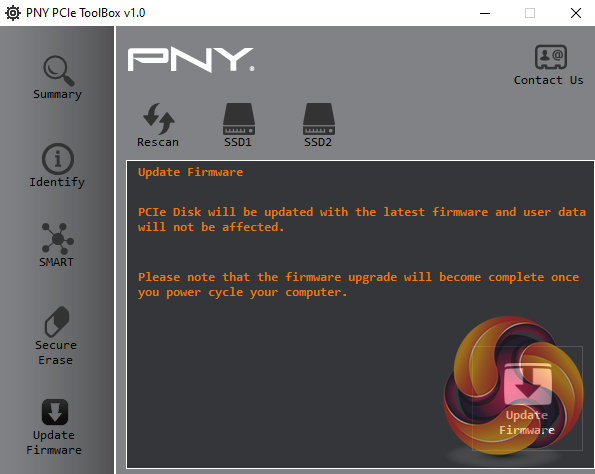
PNY's management utility for SSDs is the PCIe Toolbox. It might not be as bling loaded as some of its competitors but all the basics are covered including firmware updates and secure erase but there isn't any data migration tool built in.
For testing, the drives are all wiped and reset to factory settings by HDDerase V4. We try to use free or easily available programs and some real-world testing so you can compare our findings against your own system.
This is a good way to measure potential upgrade benefits.
Main system:
AMD Ryzen 5 3600X, 16GB DDR4-2400, Sapphire R9 390 Nitro and an MSI MPG X570 Gaming Edge Wifi motherboard
Other drives
Corsair MP600 PRO 2TB
Corsair Force MP600 1TB
Patriot Viper VP4300 2TB
Patriot Viper VPN4100 1TB
PNY XLR8 CS3140 1TB
Sabrent Rocket 4 Plus 1TB
Sabrent Rocket 4 Plus 2TB
Sabrent Rocket 4 Plus 4TB
Samsung SSD980 PRO 1TB
Seagate FireCuda 520 1TB
Teamgroup T-Force Cardea Zero Z440 1TB
WD Black SN850 1TB
Software:
Atto Disk Benchmark 4.
CrystalMark 6 & 8.0.0.
AS SSD 2.0.
Futuremark PC Mark 10.
All our results were achieved by running each test five times with every configuration this ensures that any glitches are removed from the results. Trim is confirmed as running by typing fsutil behavior query disabledeletenotify into the command line. A response of disabledeletenotify =0 confirms TRIM is active.
CrystalDiskMark is a useful benchmark to measure theoretical performance levels of hard drives and SSD’s. We are using v6.0. and v8.0
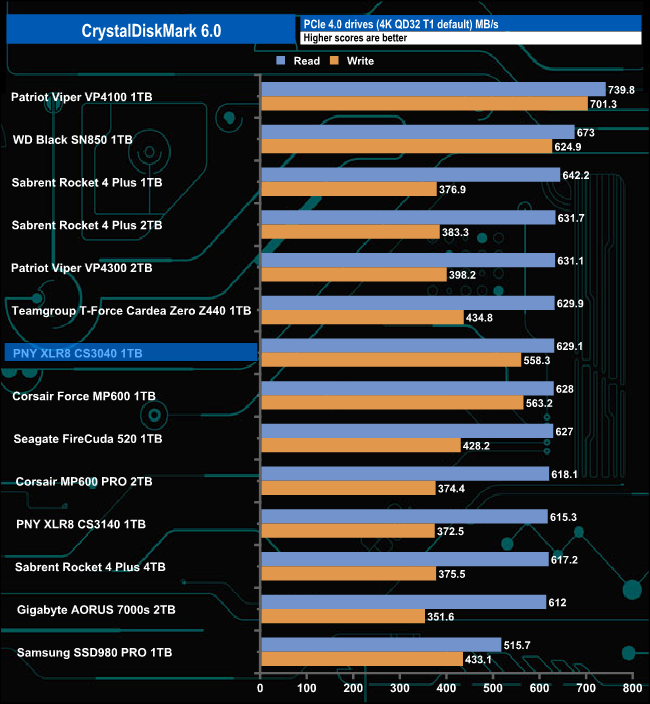
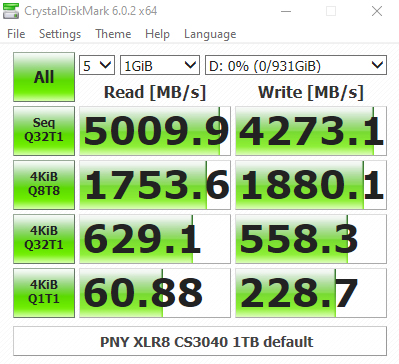
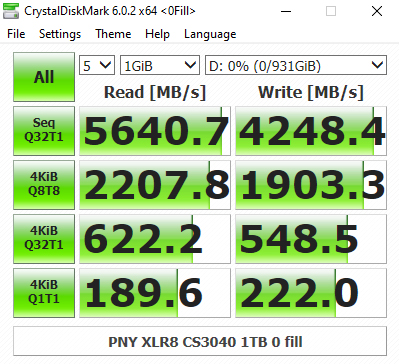
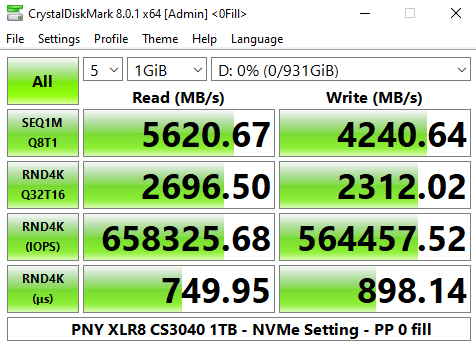
The PNY XLR8 CS3040 scores in CrystalDiskMark 6 see the drive placed in the middle of the results chart. Comparing the two CrystalDiskMark result screens shows that the Phison E16 controller that the XLR8 CS3040 uses is much more efficient when reading compressible sequential and 4K data at certain queue depths. We could also confirm the official maximum Sequential read figure of 5,600MB/s with a test result of 5,640MB/s. The write result of 4,273MB/s is a little shy of the official maximum of 4,300MB/s.
CrystalDiskMark 8
CrystalDiskMark 8 Peak Performance Profile

CrystalDiskMark 8 Real World Performance Profile

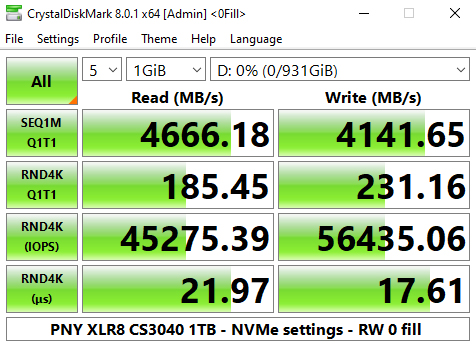
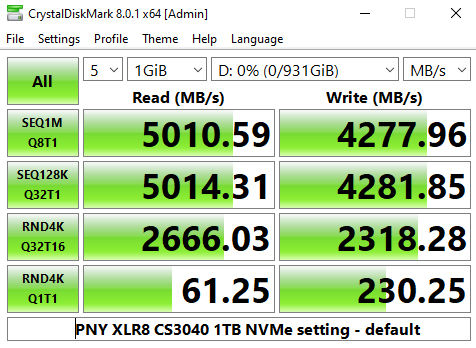
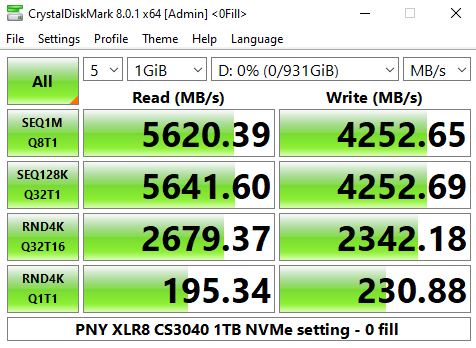
CrystalDiskMark 8 comes with a couple of interesting ready-made testing profiles as well as a dedicated NVMe setting. The best tested sequential figures for reads, 5,620MB/s confirms the official maximum figure while the best Sequential write test result of 4,279MB/s is a little shy of the official maximum of 4,300MB/s.
The best tested random 4K figures in CDM8 for the drive are 658,325.68 IOPS for reads and 546,826.17 IOPS for writes. Unfortunately, we couldn’t confirm how these figures match up to the official ones as PNY don’t have the random performance figures featured on any specification sheet for the drive we’ve seen.
The ATTO Disk Benchmark performance measurement tool is compatible with Microsoft Windows. Measure your storage systems performance with various transfer sizes and test lengths for reads and writes. Several options are available to customize your performance measurement including queue depth, overlapped I/O and even a comparison mode with the option to run continuously.
Use ATTO Disk Benchmark to test any manufacturers RAID controllers, storage controllers, host adapters, hard drives and SSD drives and notice that ATTO products will consistently provide the highest level of performance to your storage.
We are using version 4.0 for our NVMe disk tests.
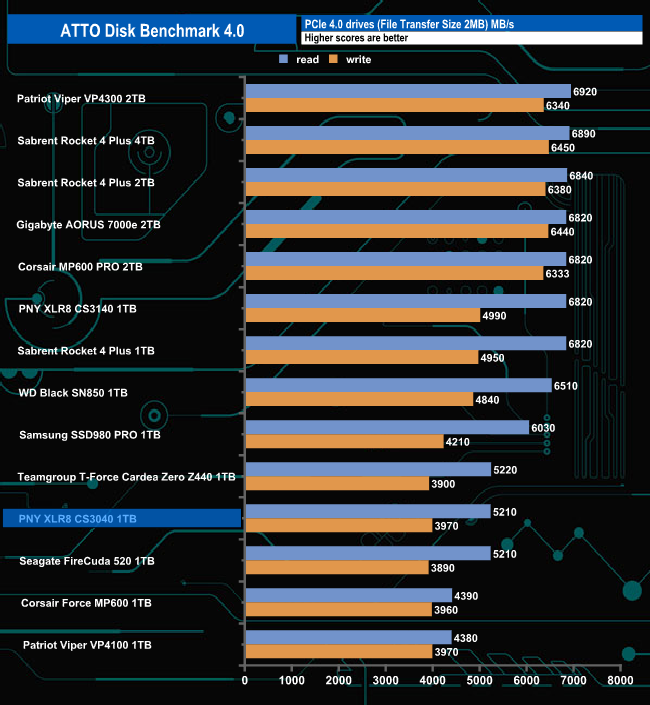
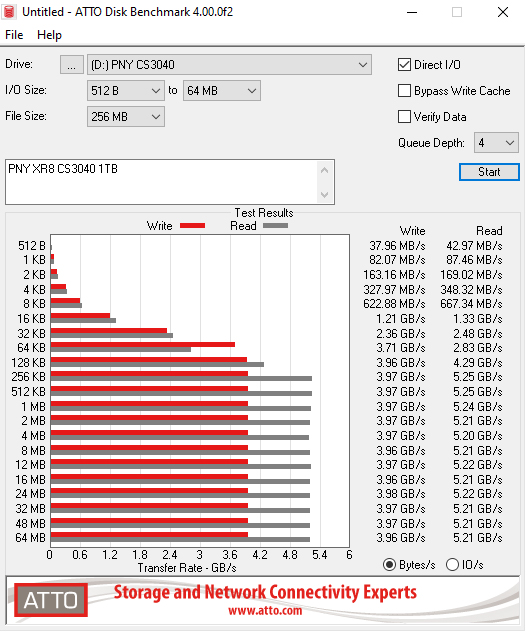
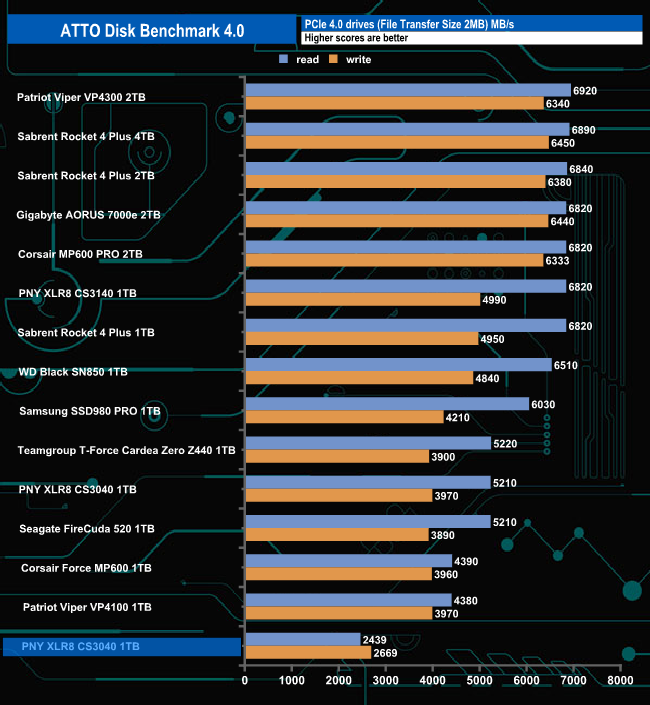
Testing the drive with the ATTO benchmark produced a read result of 5,210MB/s with writes at 3,970MB/s both figures short of the official maximums of 5,600MB/s and 4,300MB/s for read and writes respectively.
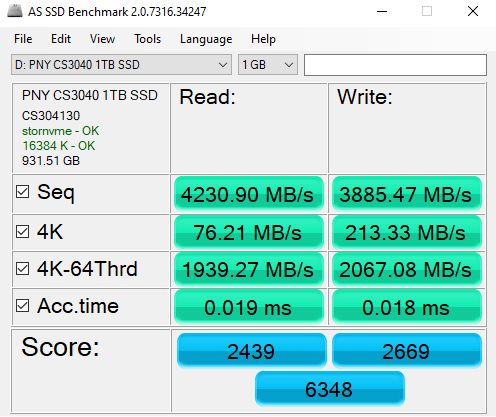
AS SSD is a great free tool designed just for benching Solid State Drives. It performs an array of sequential read and write tests, as well as random read and write tests with sequential access times over a portion of the drive. AS SSD includes a sub suite of benchmarks with various file pattern algorithms but this is difficult in trying to judge accurate performance figures.
The 1TB XLR8 CS3040 didn't seem to handle the rigours of the ASSSD benchmark very well at all, sitting in the last place in our results chart.
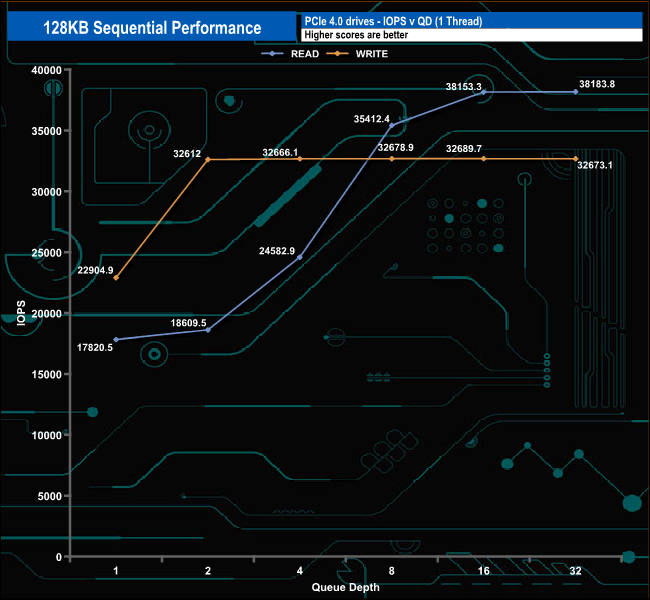
We used CrystalDiskMark 8‘s custom settings to test the Sequential read and write performance of the drive through a range of queue depths. The setup for the tests is listed below.
128KB Sequential Read / Write.
Transfer Request Size: 128KB, Thread(s): 1, Outstanding I/O: 1-32.
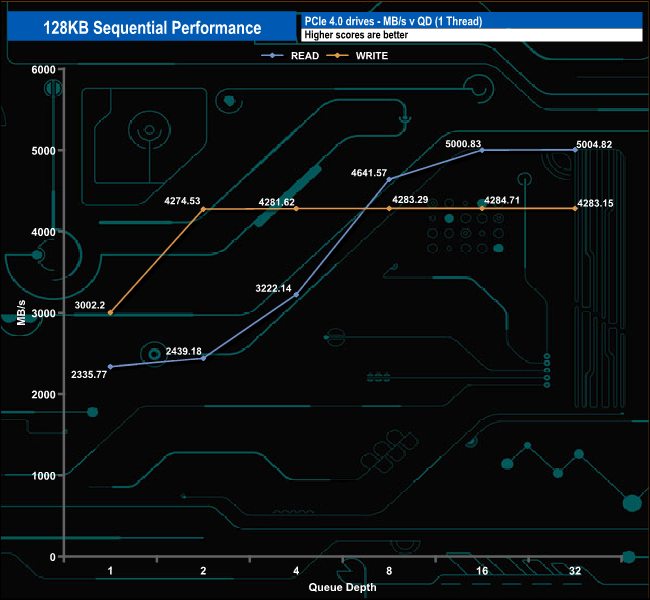
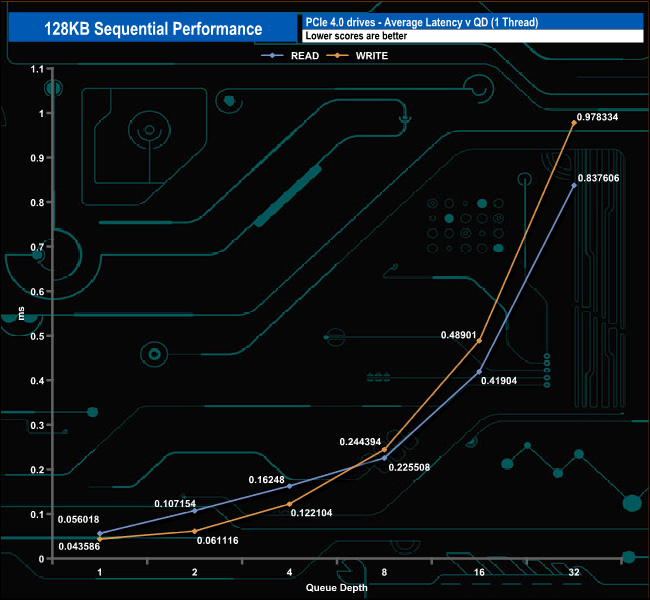
The XLR8 CS3040 produced a best sequential read figure of 5,004.82MB/s, a fair bit short of the official maximum of 5,600MB/s. The best sequential write figure we saw was 4,284.17MB/s which is not so far away from the official maximum of 4,300MB/s.
128KB Sequential Read MB/s v QD compared.
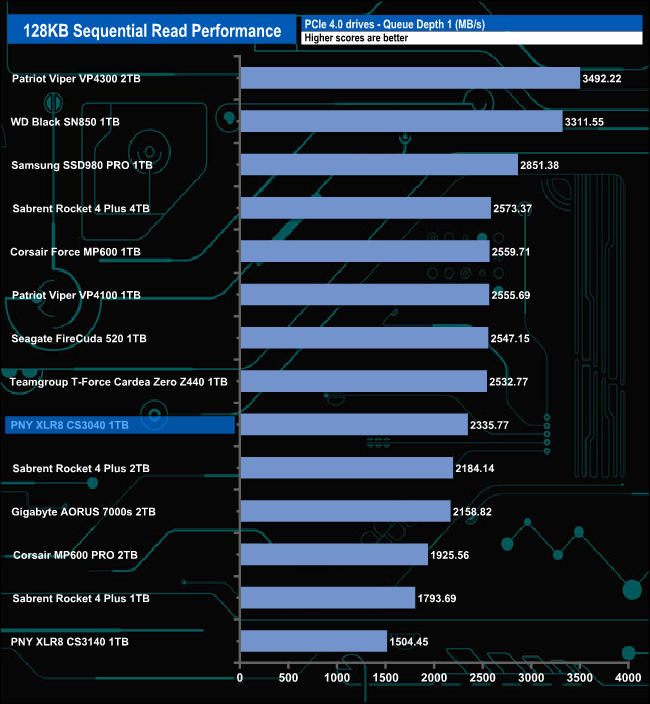
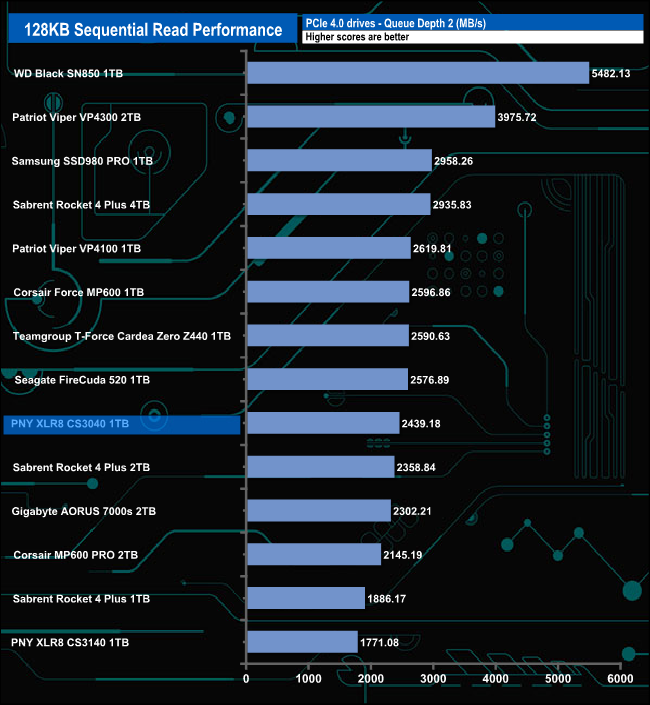
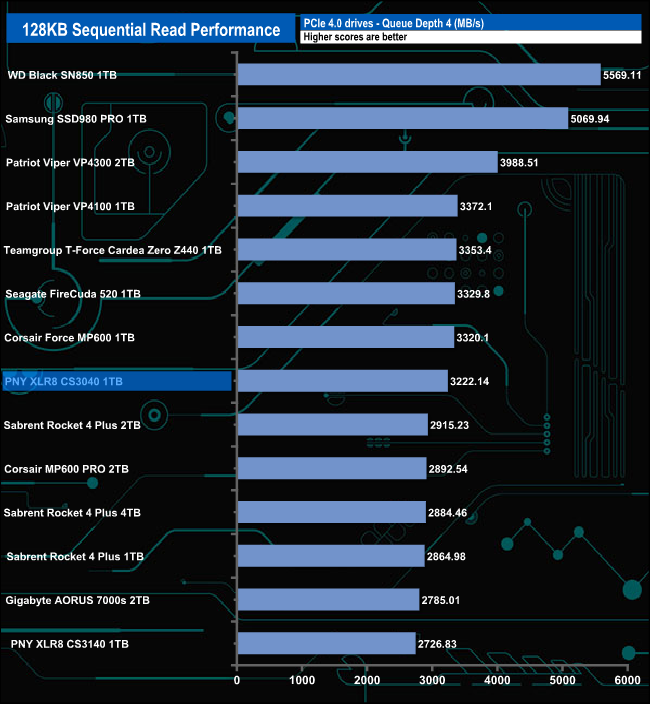
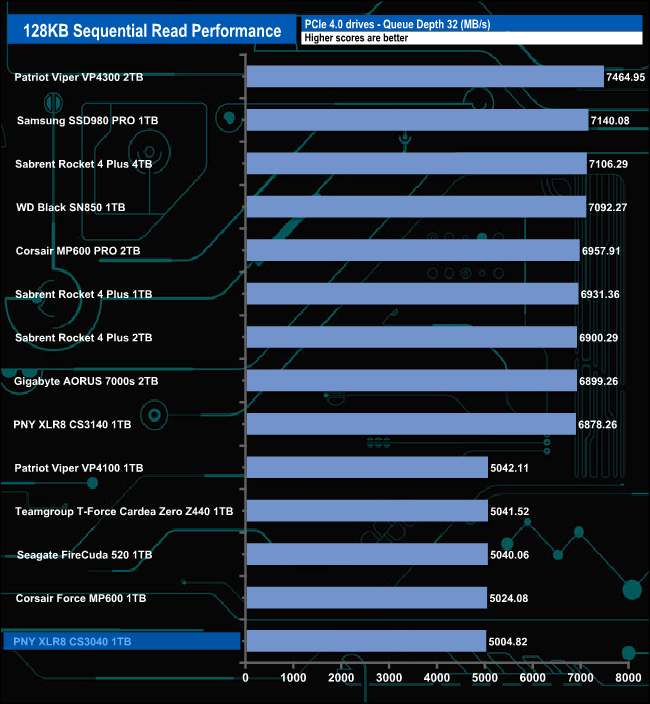
The XLR8 CS3040 sits at the halfway mark in result charts at QDs 1, 2 and 4 but by the QD32 test, it has dropped to the bottom of the list.
128KB Sequential Write MB/s v QD compared.
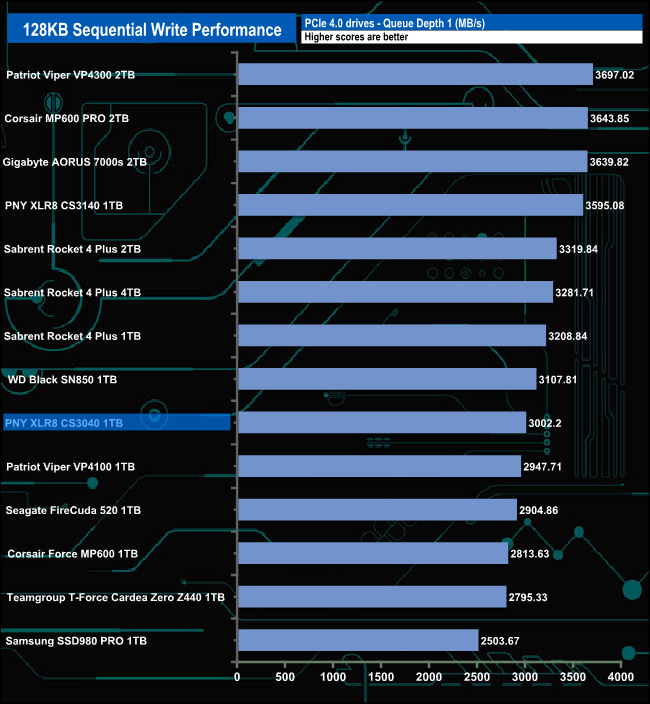
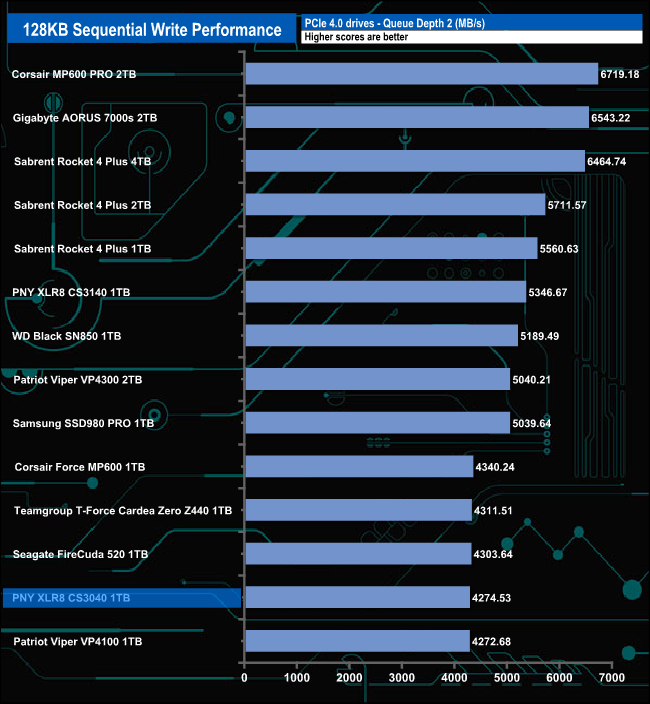
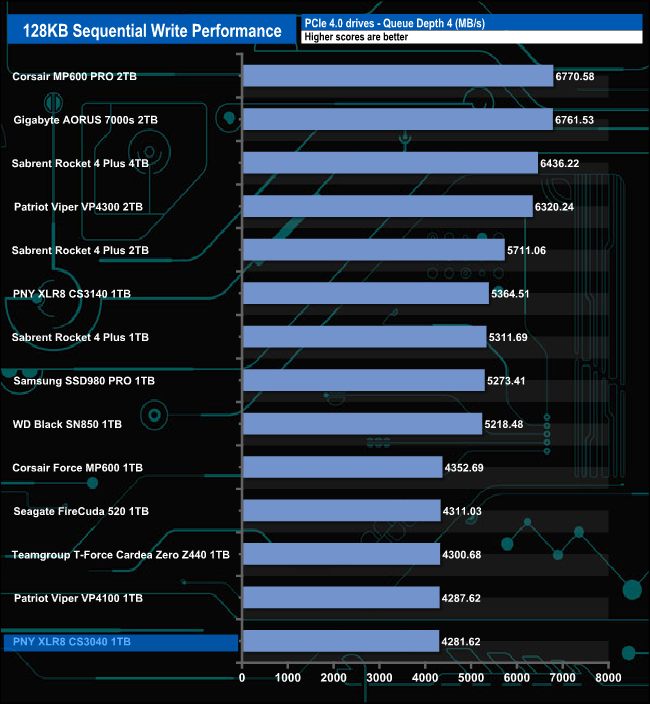
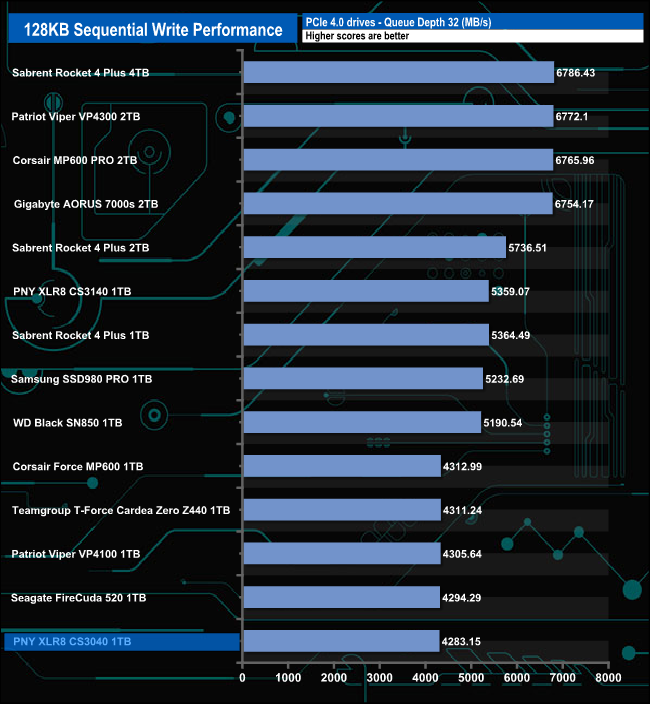
At a QD of 1, the PNY CS3040 sits in the bottom half of the results chart but at QD2 its is in last but one place and at QDs 4 and 32 it sits in last place.
We used CrystalDiskMark 8‘s custom settings to test the 4K random read performance of the drive through a range of queue depths. The setup for the tests is listed below.
4K Sustained Random Read
Transfer Request Size: 4KB, Outstanding I/O: 1-32.


PNY doesn’t put any random performance figures on any specification sheets we have seen for comparison with our test results. The best figure we saw in our 4-threaded testing was 420,899 IOPS (QD32).
4K Sustained Random Read IOPS v QD compared.

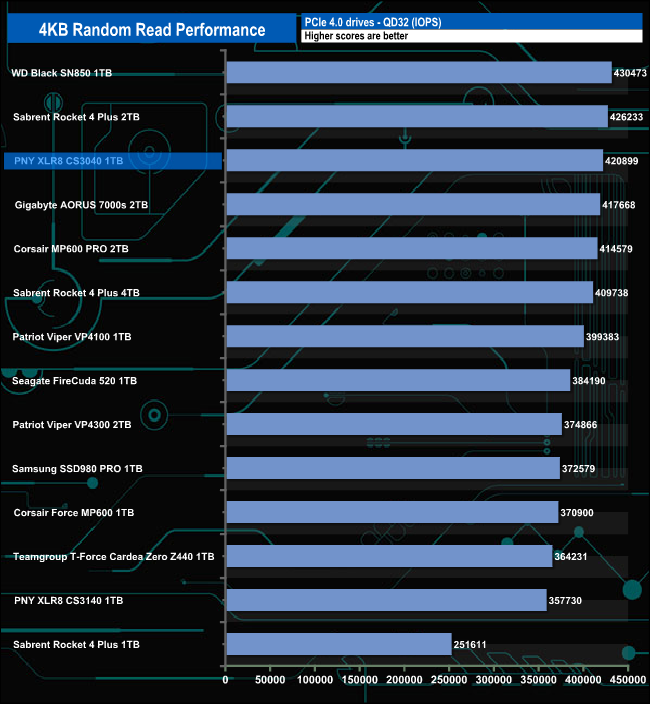
In comparison to the drives around it, the XLR8 CS3040 performs best at QD32 where it sits in third place behind WD's Black SN850 and the 2TB version of Sabrent's Rocket 4 Plus.
We used CrystalDiskMark 8‘s custom settings to test the 4K random read performance of the drive through a range of queue depths. The setup for the tests is listed below.
4K Sustained Random Write
Transfer Request Size: 4KB, Outstanding I/O: 1-32.
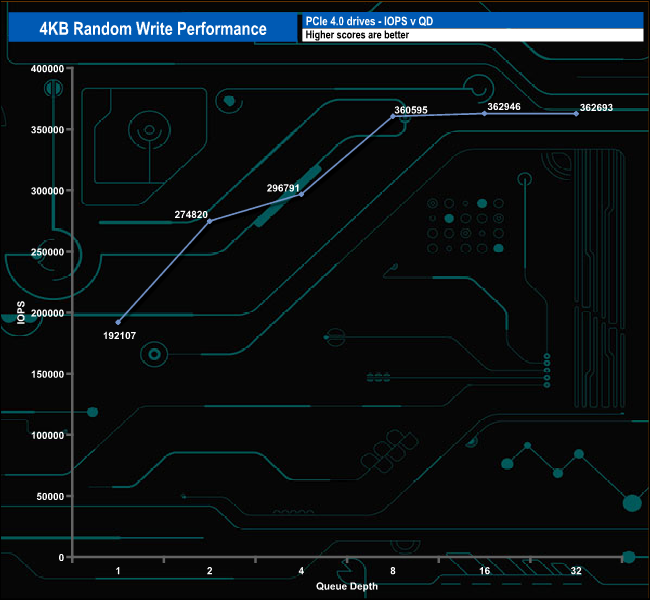
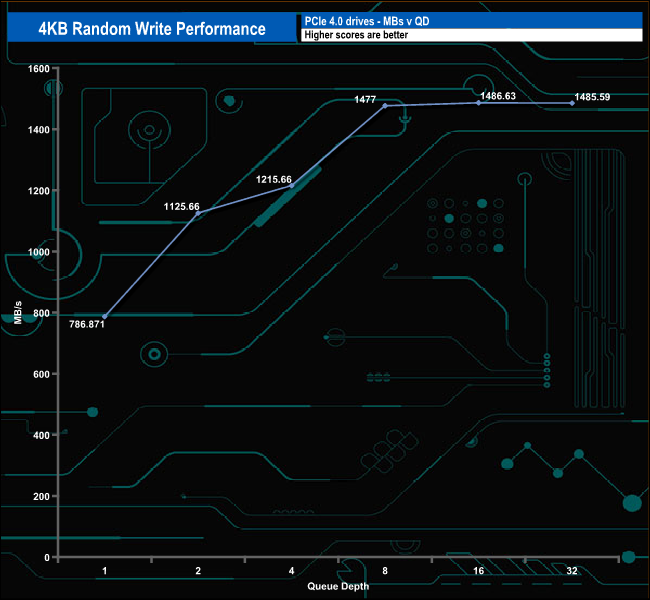
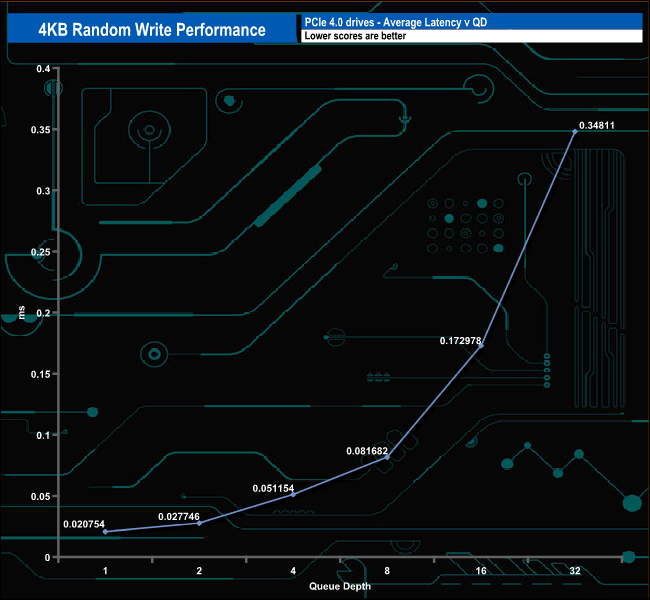
In the random 4K 4-treaded write test, the drive’s performance peaked at 362,946 IOPS (1,486MB/s) at a QD of 16 before dropping back slightly to finish the test at 362,693 IOPS (1,485MB/s).
4K Sustained Random Write IOPS v QD compared.
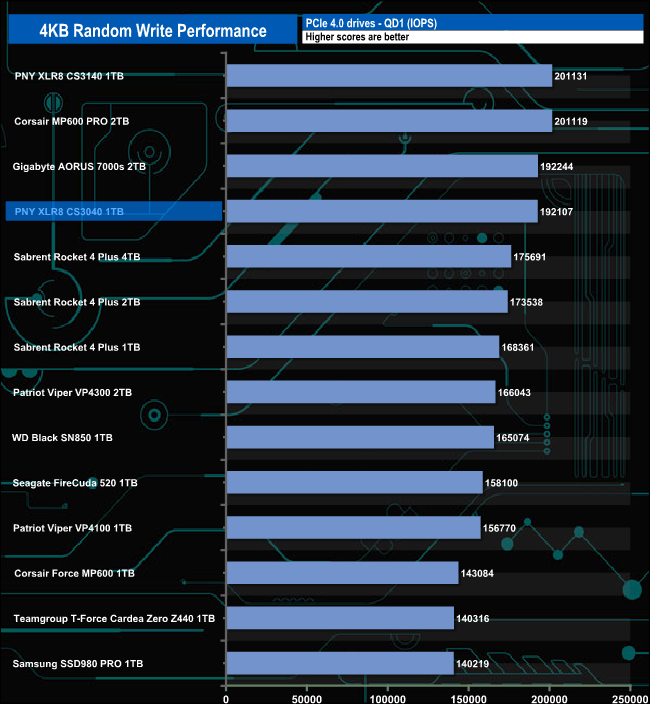
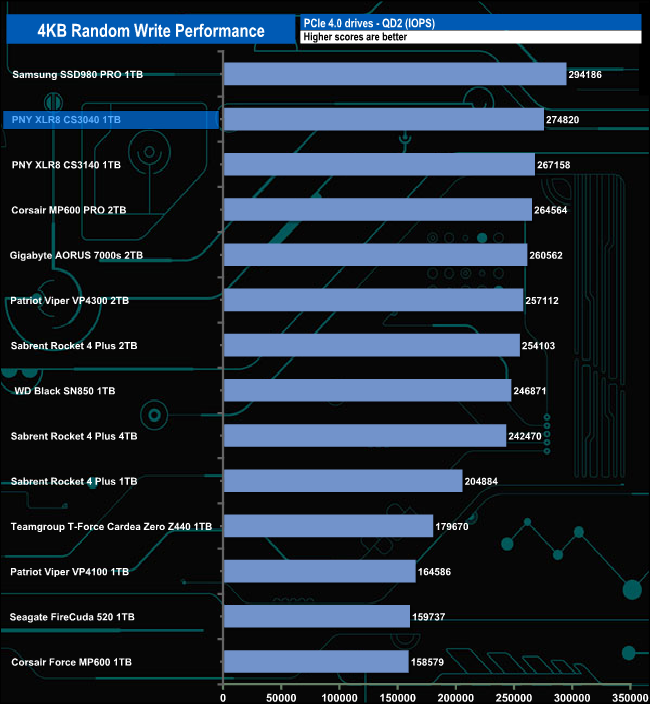
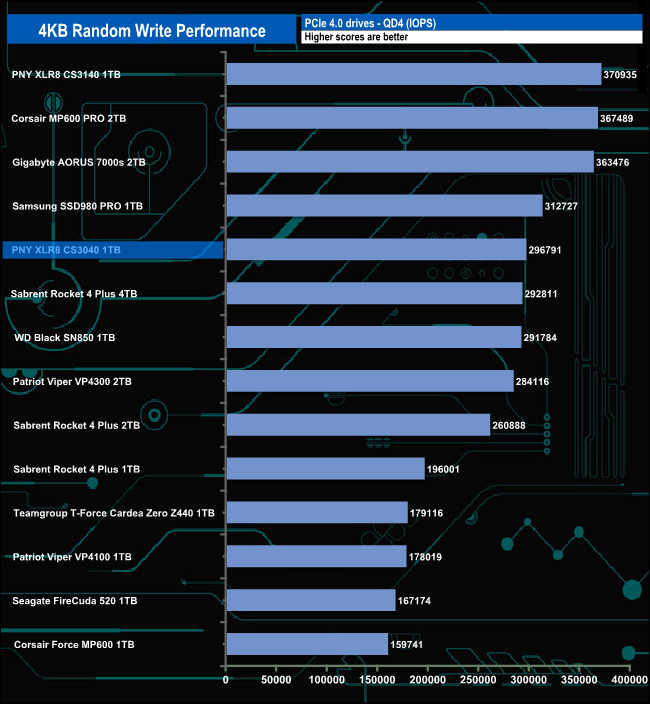
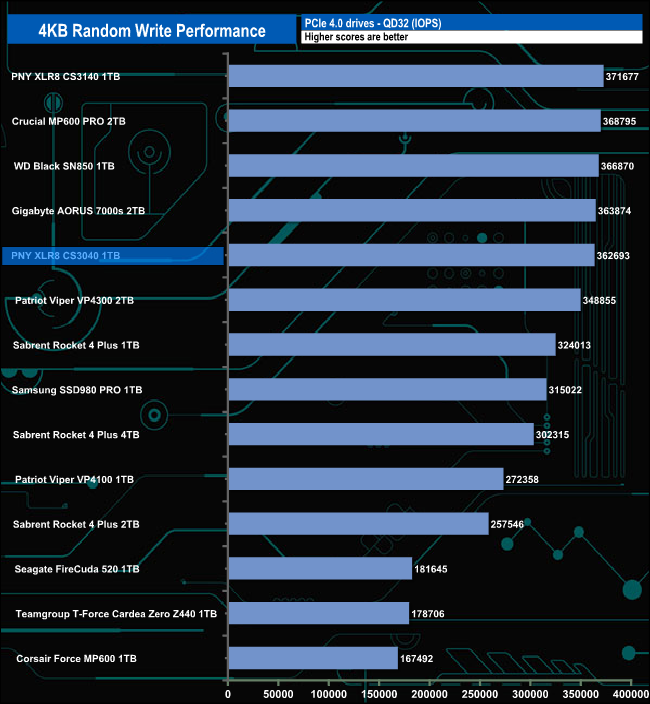
When it comes to 4K random write performance the XLR8 CS3040 sits in the top half of the results chart throughout all the tested queue depths with the best performance in relation to its competitors coming at QD4 where it sits in second place behind Samsung's SSD980 PRO drive.
We used CrystalDiskMark 8’s custom settings to test the 4K 70/30 mixed read/write performance of the drive through a range of queue depths.
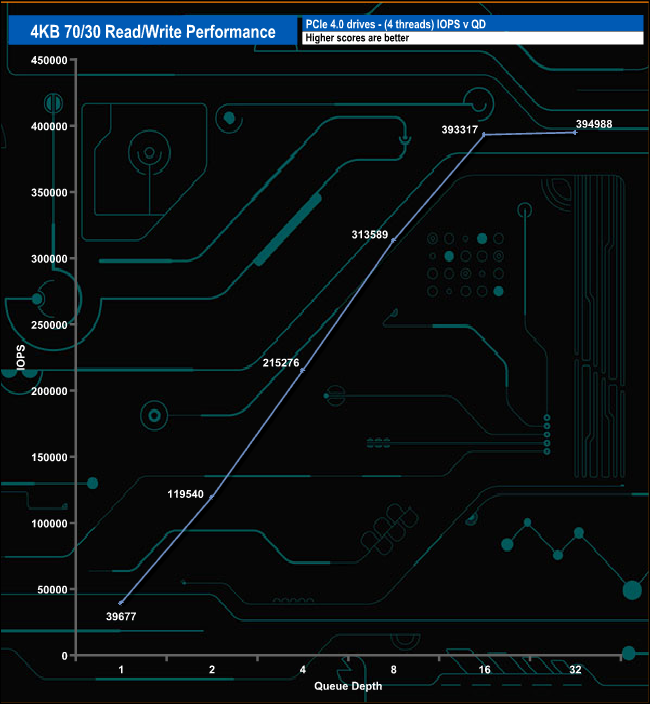
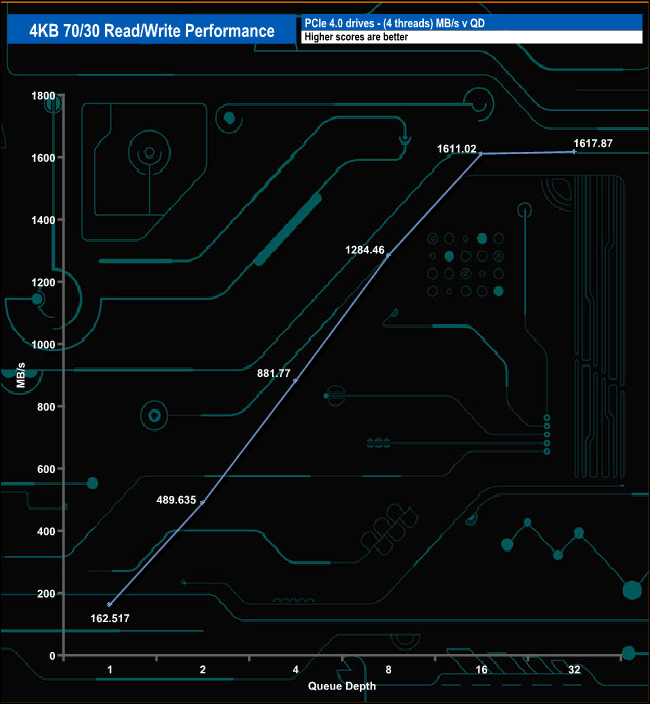
The drive handles our 4KB 70/30 mixed read/write tests very well up to QD16 (393,317 IOPS) where the performance begins to level out, finishing the test run at QD32 at 394,988 IOPS (1,617.87MB/s).
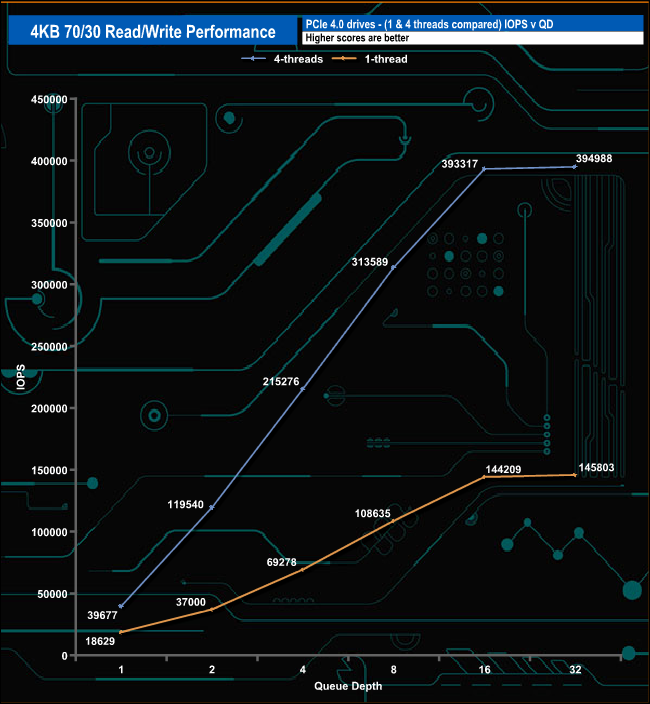
Using a single thread test, the drive peaks at 145,803 IOPS at QD32, but as with the four threaded test, the performance of the drive begins to level out at QD16.
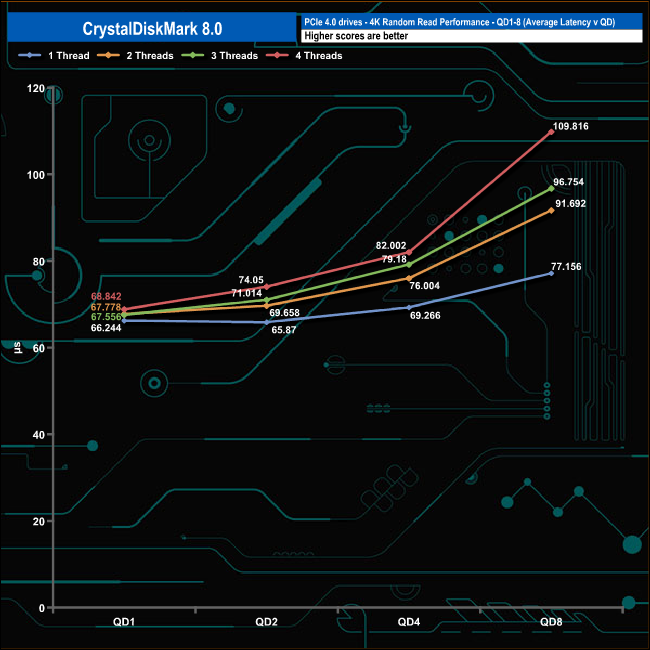
We used CrystalDiskMark 8 to test the random performance of the drive at lower queue depths (QD1 – QD8 where most of the everyday workloads occur) using 1 to 4 threads.
Random Reads
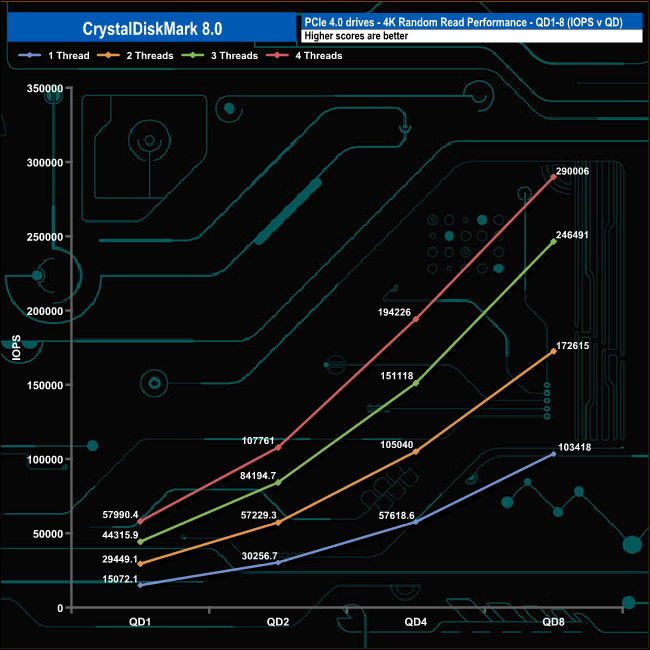
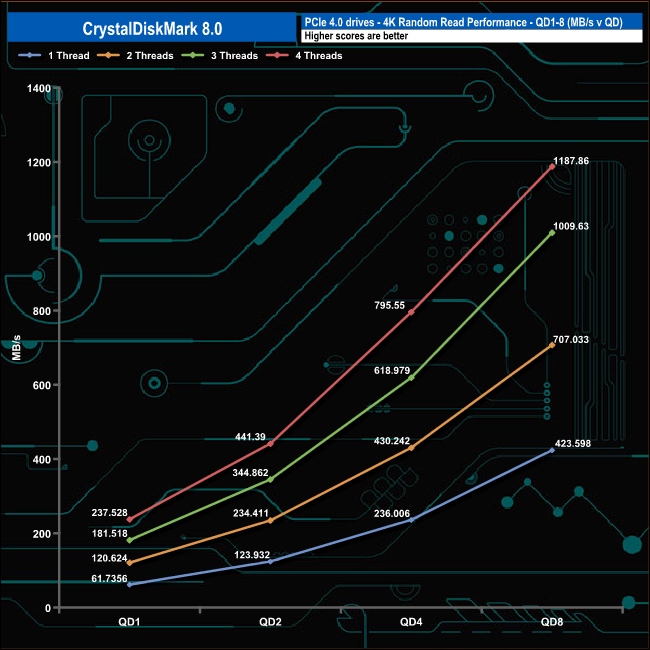
The drive powers through the read part of the test without displaying any problems. The drive’s performance increasing smoothly as the queue depth deepens in each of the tested threads.
Random Writes
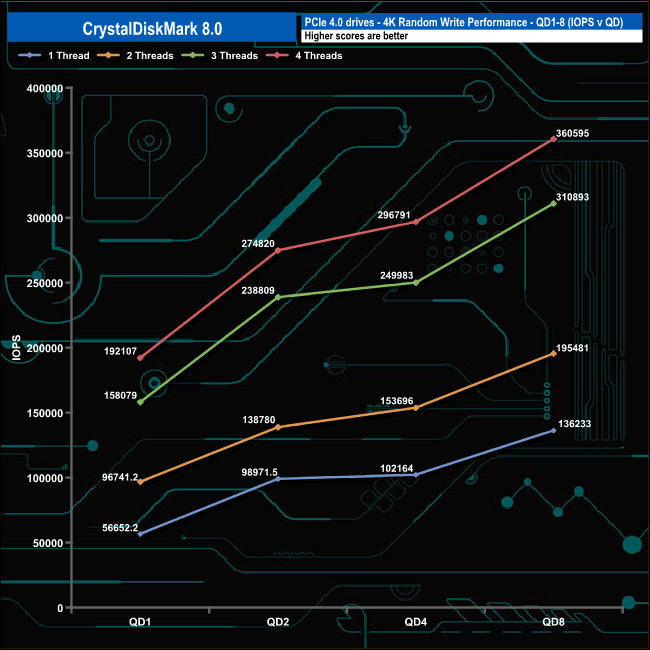
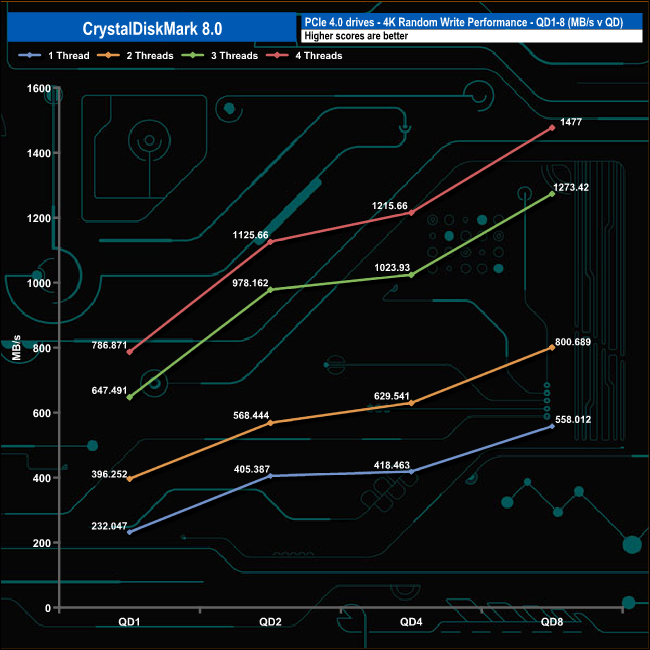
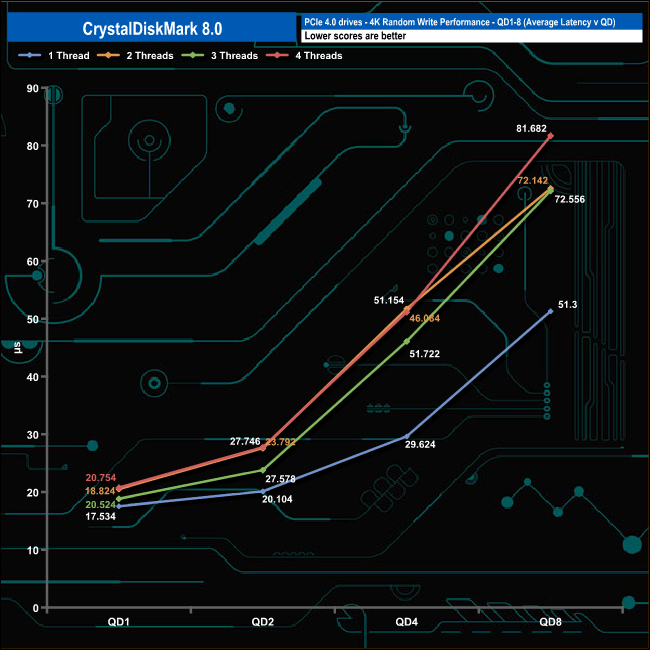
In the write tests, the drive's performance seems to slow down a little between QDs 2 and 4 in each of the tested threads before picking up again between QDs 4 and 8.
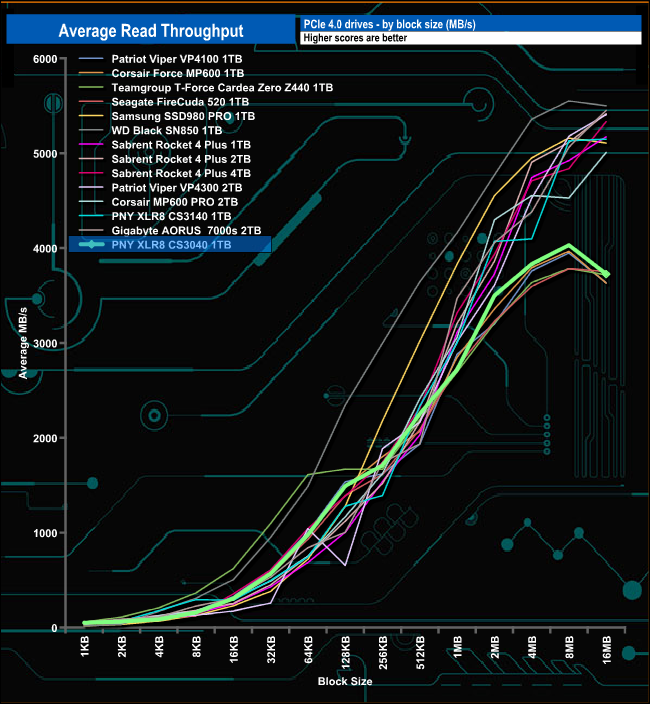
In our read throughput test, the drive peaked at the 8MB block mark at 4,030.8MB/s before dropping back to finish the test run at 3,725.88MB/s. That peak result is a fair bit short of the official maximum of 5,600MB/s
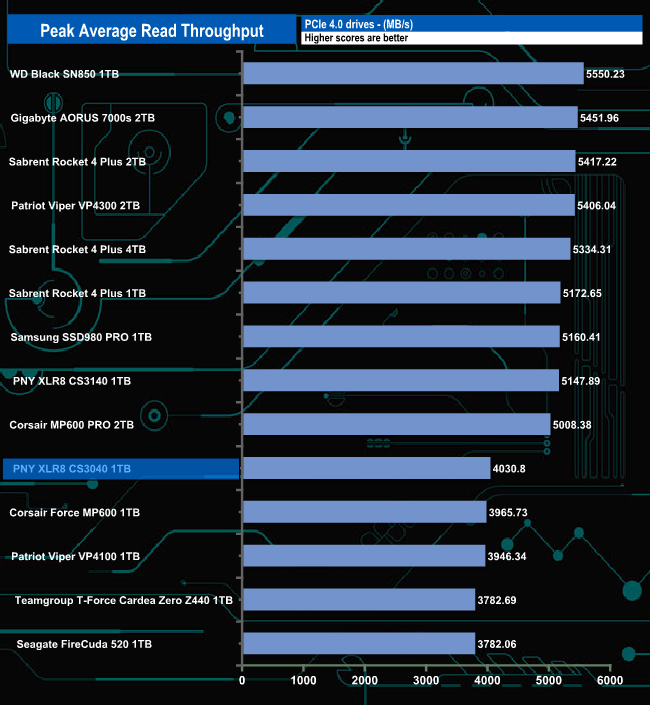
The 4,030MB/s read throughput result puts the XLR8 CS3040 into the bottom half of our result chart.
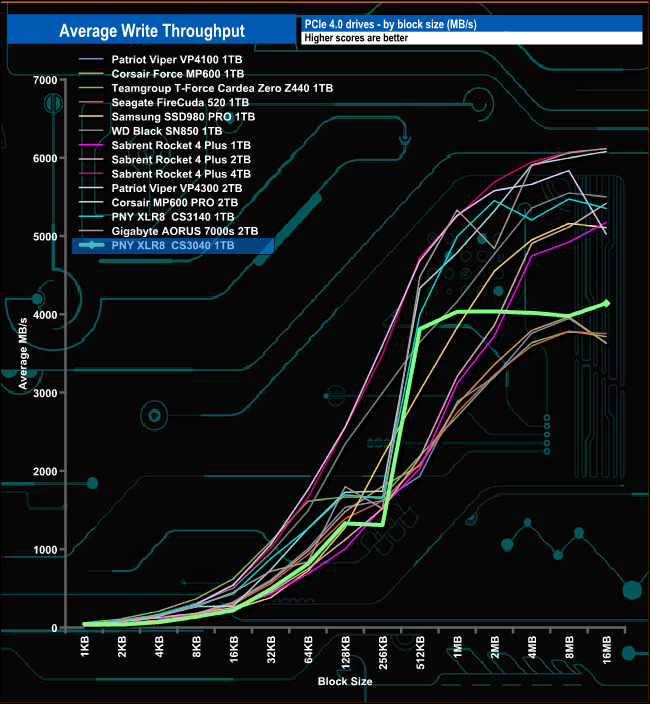
The drive peaked at 4,140MB/s (16MB block) in our write throughput test. The test result is just shy of the official maximum write figure of 4,300MB/s.
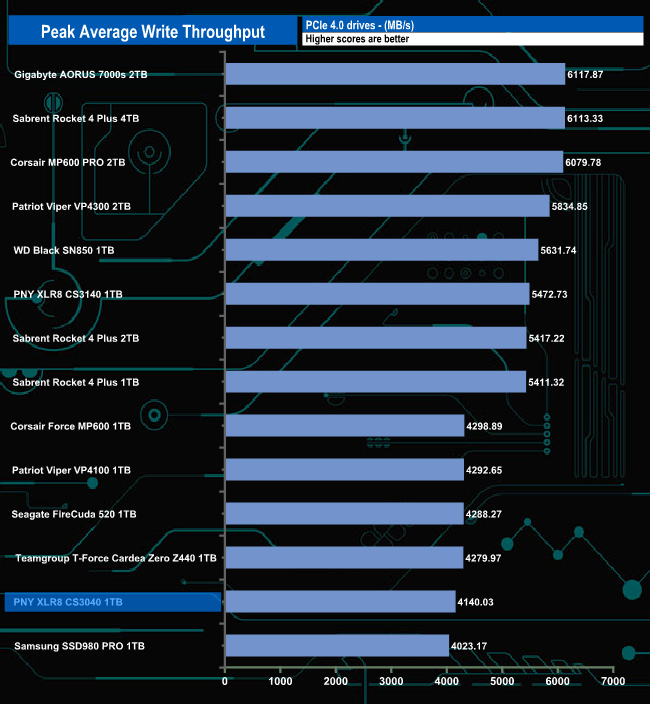
As with the read throughput result, the tested write figure of 4,140MB/s puts the drive into the bottom half of our results chart.
The PCMark 10 Full System Drive Benchmark uses a wide-ranging set of real-world traces from popular applications and common tasks to fully test the performance of the fastest modern drives. The benchmark is designed to measure the performance of fast system drives using the SATA bus at the low end and devices connected via PCI Express at the high end.
The goal of the benchmark is to show meaningful real-world performance differences between fast storage technologies such as SATA, NVMe, and Intel’s Optane. The Full System Drive Benchmark uses 23 traces, running 3 passes with each trace. It typically takes an hour to run.
Traces used:
Booting Windows 10.
Adobe Acrobat – starting the application until usable.
Adobe Illustrator – starting the application until usable Adobe Premiere Pro – starting the application until usable.
Adobe Photoshop – starting the application until usable.
Battlefield V – starting the game until the main menu.
Call of Duty Black Ops 4 – starting the game until the main menu.
Overwatch – starting the game until main menu.
Using Adobe After Effects.
Using Microsoft Excel.
Using Adobe Illustrator.
Using Adobe InDesign.
Using Microsoft PowerPoint.
Using Adobe Photoshop (heavy use).
Using Adobe Photoshop (light use).
cp1 Copying 4 ISO image files, 20 GB in total, from a secondary drive to the target drive (write test).
cp2 Making a copy of the ISO files (read-write test).
cp3 Copying the ISO to a secondary drive (read test).
cps1Copying 339 JPEG files, 2.37 GB in total, to the target drive (write test).
cps2 Making a copy of the JPEG files (read-write test).
cps3 Copying the JPEG files to another drive (read test).
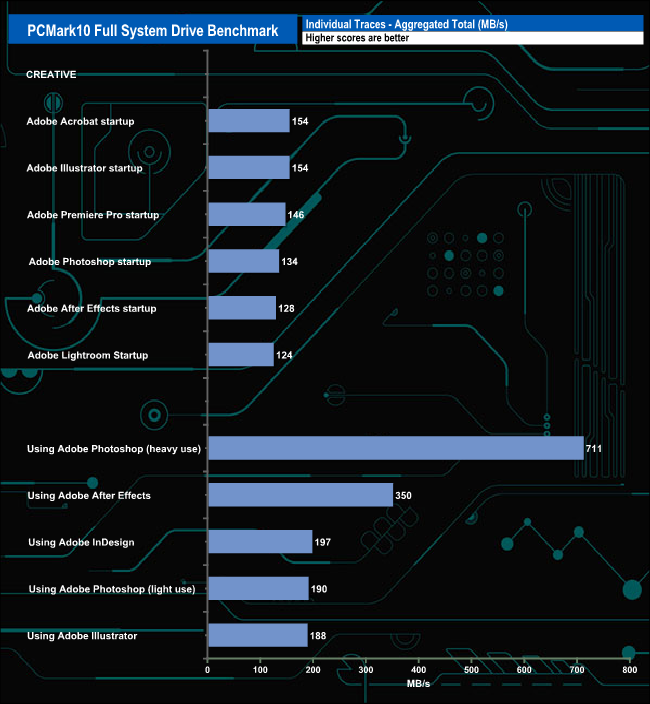
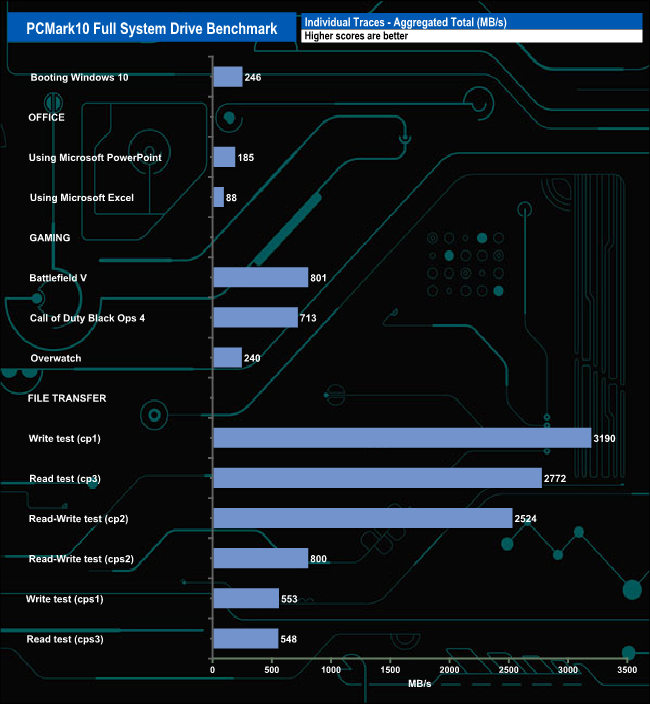
The PNY XLR8 CS3040 handled the PCMark10’s Full System Drive benchmark pretty well with some good scores for all the test traces. The 711MB/s for the Heavy Use Adobe Photoshop trace and the cp1 write test result of 3,190MB/s are a couple of results that stood out.
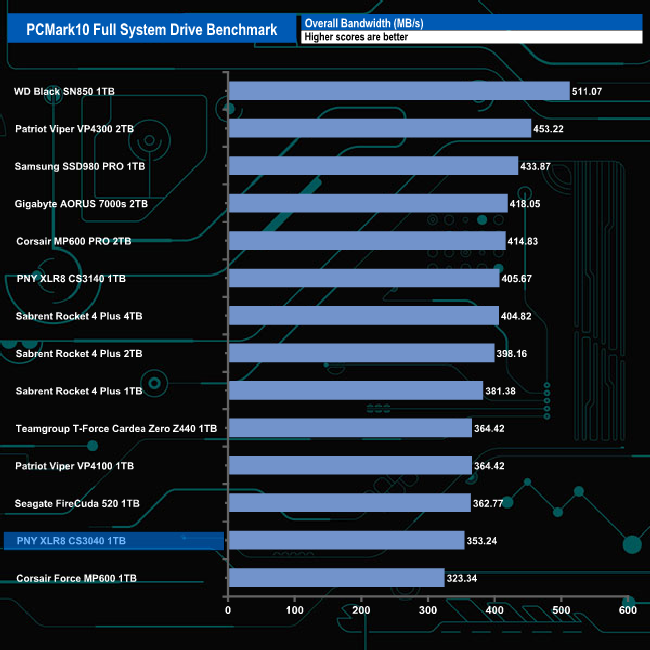
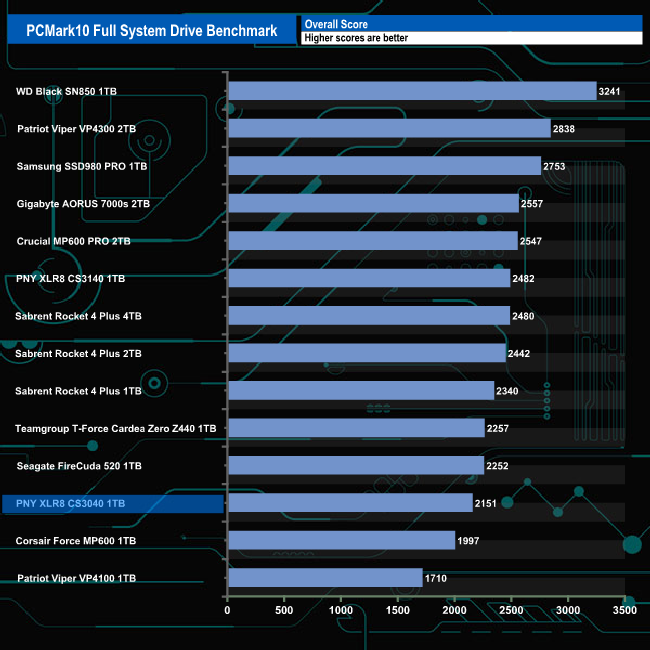
The overall bandwidth figure of 363.24MB/s sees the drive in the penultimate place in our results chart.
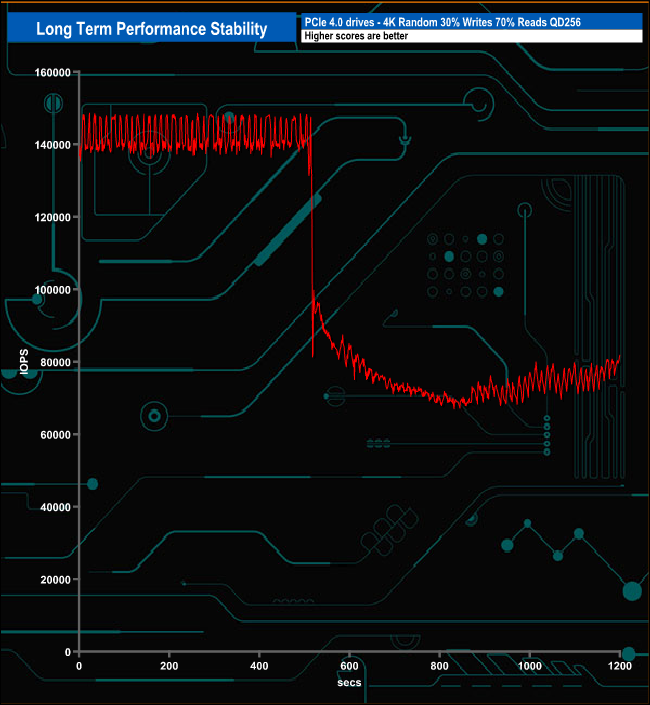
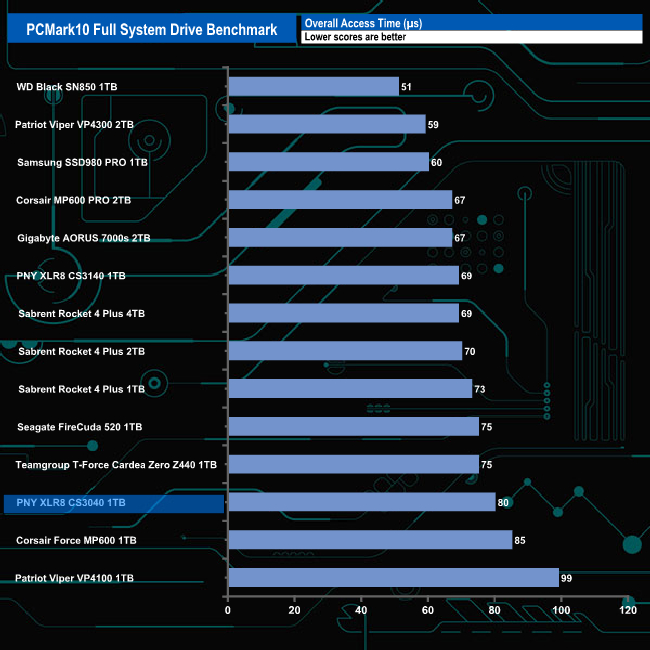
For the long term performance stability test, we set the drive up to run a 20-minute 4K random test with a 30% write, 70% read split, at a Queue Depth of 256 over the entire disk. The 1TB PNY XLR8 CS3040 averaged 104,279 IOPS for the test with a very good 70% performance stability.
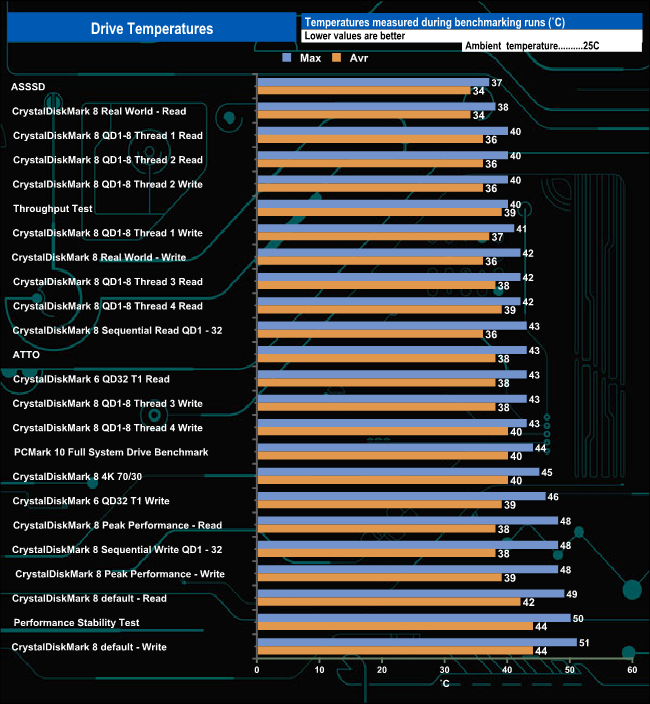
We took note of the drive’s temperature during some of our benchmarking runs. The well-designed extruded aluminium heatsink on the CS3040 keeps the temperature down even when the drive is being pushed hard during benchmarking. The hottest the drive got was 51° C (with a 25° C ambient temperature) during the write test run in CrystalDiskMark 8.
To test real-life performance of a drive we use a mix of folder/file types and by using the FastCopy utility (which gives a time as well as MB/s result) we record the performance of drive reading from & writing to a 256GB Samsung SSD850 PRO.
We use the following folder/file types:
100GB data file.
60GB iso image.
60GB Steam folder – 29,521 files.
50GB File folder – 28,523 files.
12GB Movie folder – (15 files – 8 @ .MKV, 4 @ .MOV, 3 @ MP4).
10GB Photo folder – (304 files – 171 @ .RAW, 105 @ JPG, 21 @ .CR2, 5 @ .DNG).
10GB Audio folder – (1,483 files – 1479 @ MP3, 4 @ .FLAC files).
5GB (1.5bn pixel) photo.
BluRay Movie – 42GB.
21GB 8K Movie demos – (11 demos)
16GB 4K Raw Movie Clips – (9 MP4V files).
4.25GB 3D Printer File Folder – (166 files – 105 @ .STL, 38 @ .FBX, 11 @ .blend, 5 @ .lwo, 4 @ .OBJ, 3@ .3ds).
1.5GB AutoCAD File Folder (80 files – 60 @ .DWG and 20 @.DXF).
![]()
![]()
PNY’s XLR CS3040 handled our real-life file testing without displaying any problems. It averaged 515.8MB/s when writing the larger test files to the drive and 444.4MB/s when reading the data back again.
To get a measure of how much faster PCIe NVMe drives are than standard SATA SSDs we use the same files but transfer to and from a 2TB Kioxia Exceria Plus drive:
![]()
![]()
Switching over to an all NVMe storage environment we see write speeds approaching 3GB/s, the fastest being the 2,995MB/s when writing the 100GB data file. Nine of the thirteen transfers were over 2GB/s when it came to both reads and writes.
The CS3040 is the mainstream Gen4 sibling to the high-end CS3140 in PNY’s XLR8 gaming portfolio of SSD drives. It uses a combination of a Phison PS5016-E16 controller (the CS3140 uses the 2nd generation PS5018-E18) and 96-layer 3D TLC NAND.
The drive is available in four capacities, 500GB 1TB, 2TB and 4TB and in two versions; one aimed at desktop use with a well designed extruded aluminium heatsink and the other with just a straightforward product label aimed towards notebook users, compact PC designs and those who want to use the integrated heatsink/cooling technology of a motherboard. The heatsink versions have ‘HS' in the SKU number.
The only official performance figures we could find for the drive (on the spec sheet and box) are for sequential read/writes with not a trace of any random figures. The drive is officially rated as up to 5,600MB/s for reads and up to 4,300MB/s for writes.
When we tested the drive with the ATTO benchmark, we got figures of 5,210MB/s and 3,970MB/s for sequential read and writes respectively, both shy of the official maximums. However, using the compressible data test in CrystalDiskMark 6 we could indeed confirm the official sequential read rating with a test result of 5,640.7MB/s. The write result was still a little shy of the official maximum at 4,248.4MB/s. It was the same story with CrystalDiskMark 8, the best read result of 5,620.67MB/s confirming the official figures with the best write performance figure of 4,252.65MB/s a little way off the official maximum.
PNY doesn’t state any 4K random performance figures for the drive but in our tests, the best read/write IOPS figures we got from the drive was when we used the Peak Performance profile in CrystalDiskMark 8 which produced figures of 658,325.68 IOPS and 546,826.17 IOPS for reads and writes respectively.
We found the heatsink version of the 1TB PNY XLR8 CS3040 on Lambdatek for £170.83 (inc VAT) HERE.
Pros
- Overall performance.
- 5-year warranty.
- Heatsink option.
Cons
- 4K performance a little disappointing in some of our tests.
- Faces some serious competition.
KitGuru says: The XLR8 CS3040 is PNY's drive to take on the mainstream Gen4 market, which might be a fairly new sector but is already very competitive. The fact that PNY offers the drive in two versions, one with a heatsink and one without gives them two bites at the cherry.