
Samsung's latest addition to its SSD ranks is the SSD 980, the long-awaited successor to the very popular SSD 970 EVO. A PCIe Gen 3 NVME drive, the SSD 980 is Samsung's first DRAM-less design. Priced at the £120 mark for the 1TB model reviewed here, can the SSD 980 live up to its predecessor?
The new drive comes in three capacities at launch; 250GB, 500GB and the flagship 1TB model we are looking at here. The SSD 980 uses a combination of 1** layer 3-bit V-NAND (TLC NAND) and an in-house Pablo controller.
Official Sequential performance figures for the 1TB drive are up to 3,500MB/s reads and 3,000 for writes. The 500GB model is rated at up to 3,100MB/s and 2,600MB/s for read/writes respectively while the 250GB entry model has a read speed of up to 2,900MB/s with writes at up to 1,300MB/s.
4K random performance for the drive range is listed at both QD1 (1 thread) and QD32 (16 threads). The 1TB model is rated as up to 17,000 IOPS and 54,000 IOPS at QD1 for read and writes respectively and up 500,000 IOPS for reads and 480,000 IOPS for writes at QD32. The 250B and 500GB drives have the same 17,000 IOPS read figure at QD1 with the 500GB rated at up to 54,000 IOPS for writes and the 250GB drive 53,000 IOPS. At QD32 the 500GB drive is rated as up to 400,000 IOPS and 470,000 IOPS for read and writes respectively with the 250GB drive a fair way behind at up to 230,000 IOPS reads and 320,000 IOPS writes.
Samsung quote TBW endurance figures for the 1TB drive of 600TB with the 500GB model rated at 300TB and the 250GB 150TB. The drives are backed by a 5-year warranty.
Physical Specifications:
- Usable Capacities: 1TB.
- NAND Components: 1**-layer V-NAND 3bit MLC (TLC).
- NAND Controller: Samsung Pedro.
- Cache: None DRAMless.
- Interface: PCIe Gen 3.
- Form Factor: 2280 M.2.
- Dimensions: 80.15 x 22.15 x 2.38 mm.
Firmware Version: 1B4QFXO7.
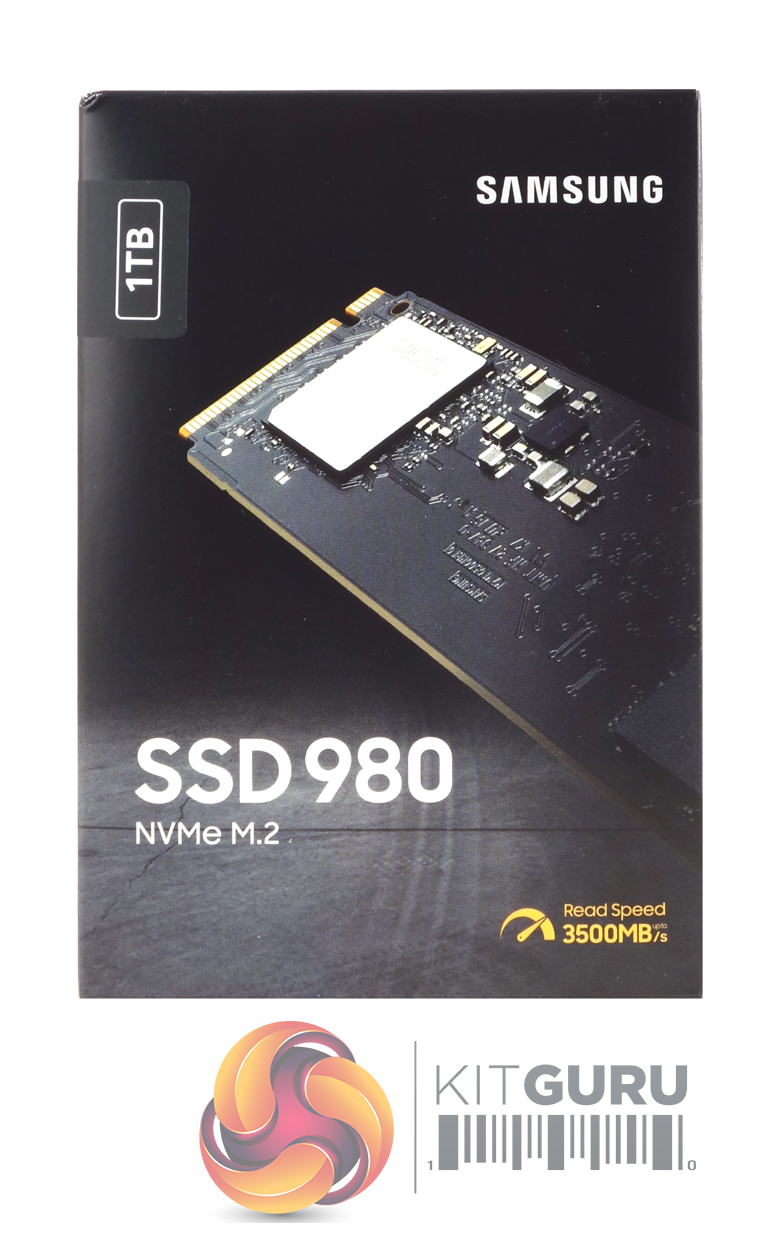
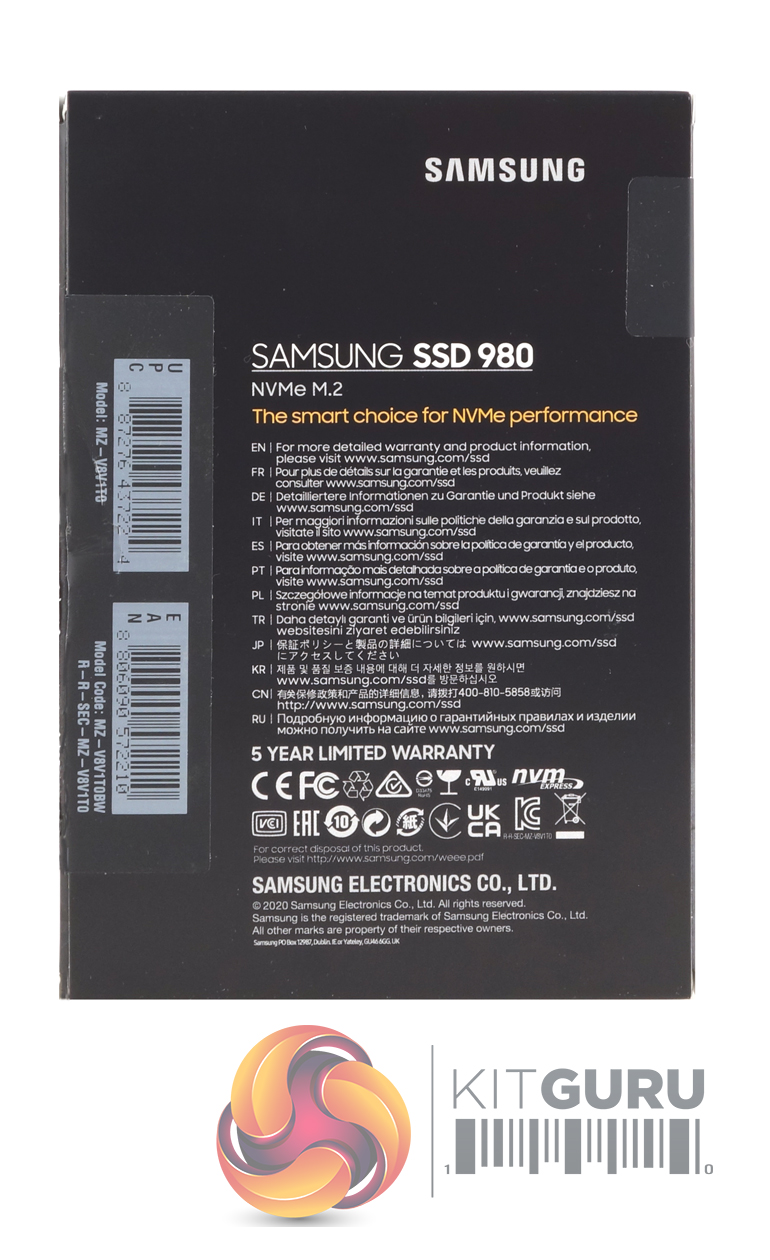
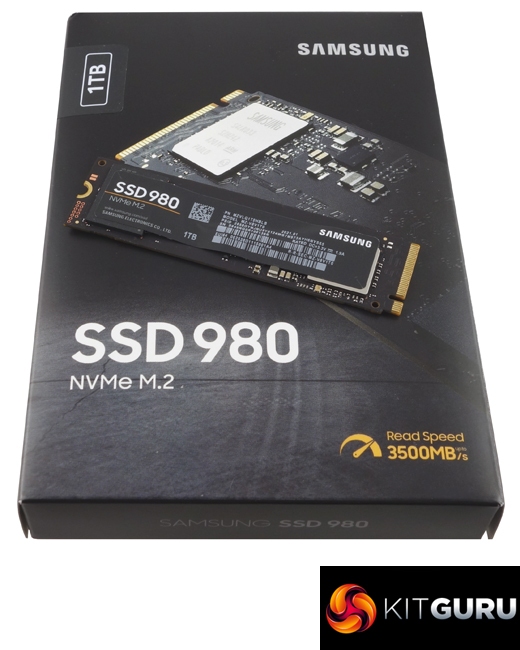
Samsung’s SSD 980 comes in a black box with a large image of the drive on the front with the focus on the controller. On the top left-hand side of the box, we find a sticker displaying the drive’s 1TB capacity. Also displayed is the drives 3,500MB/s Sequential read speed. The rear of the box has a multilingual information panel giving the web address for more detailed warranty information. Under this is a reminder that the drive has a 5-year limited warranty.
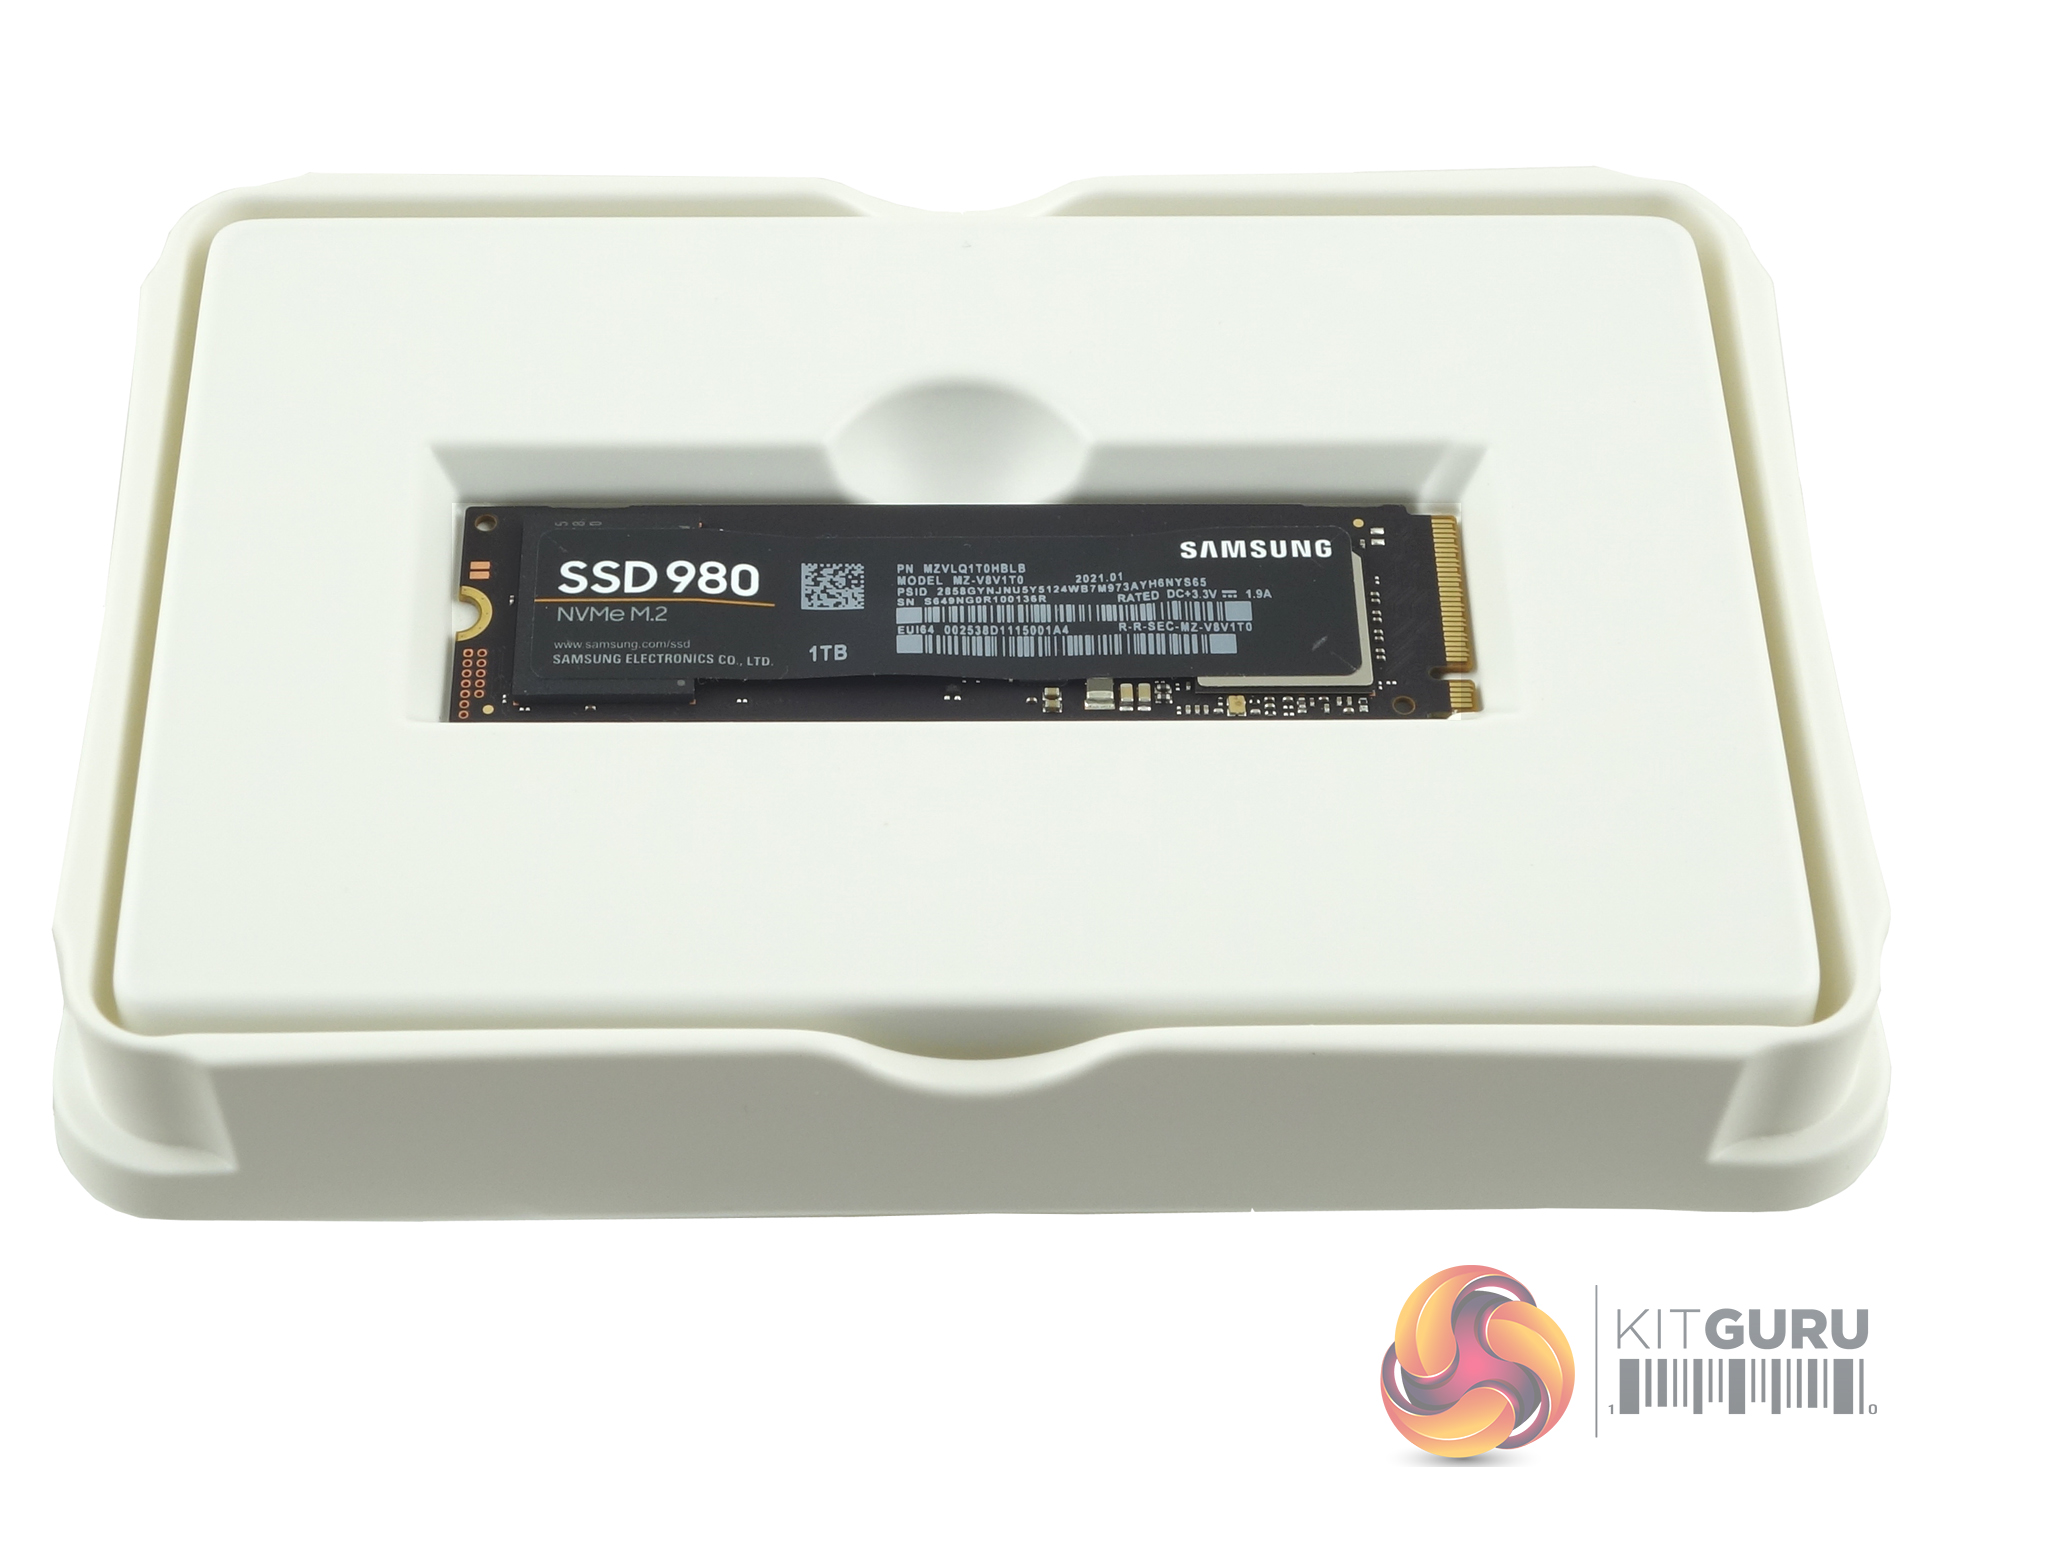
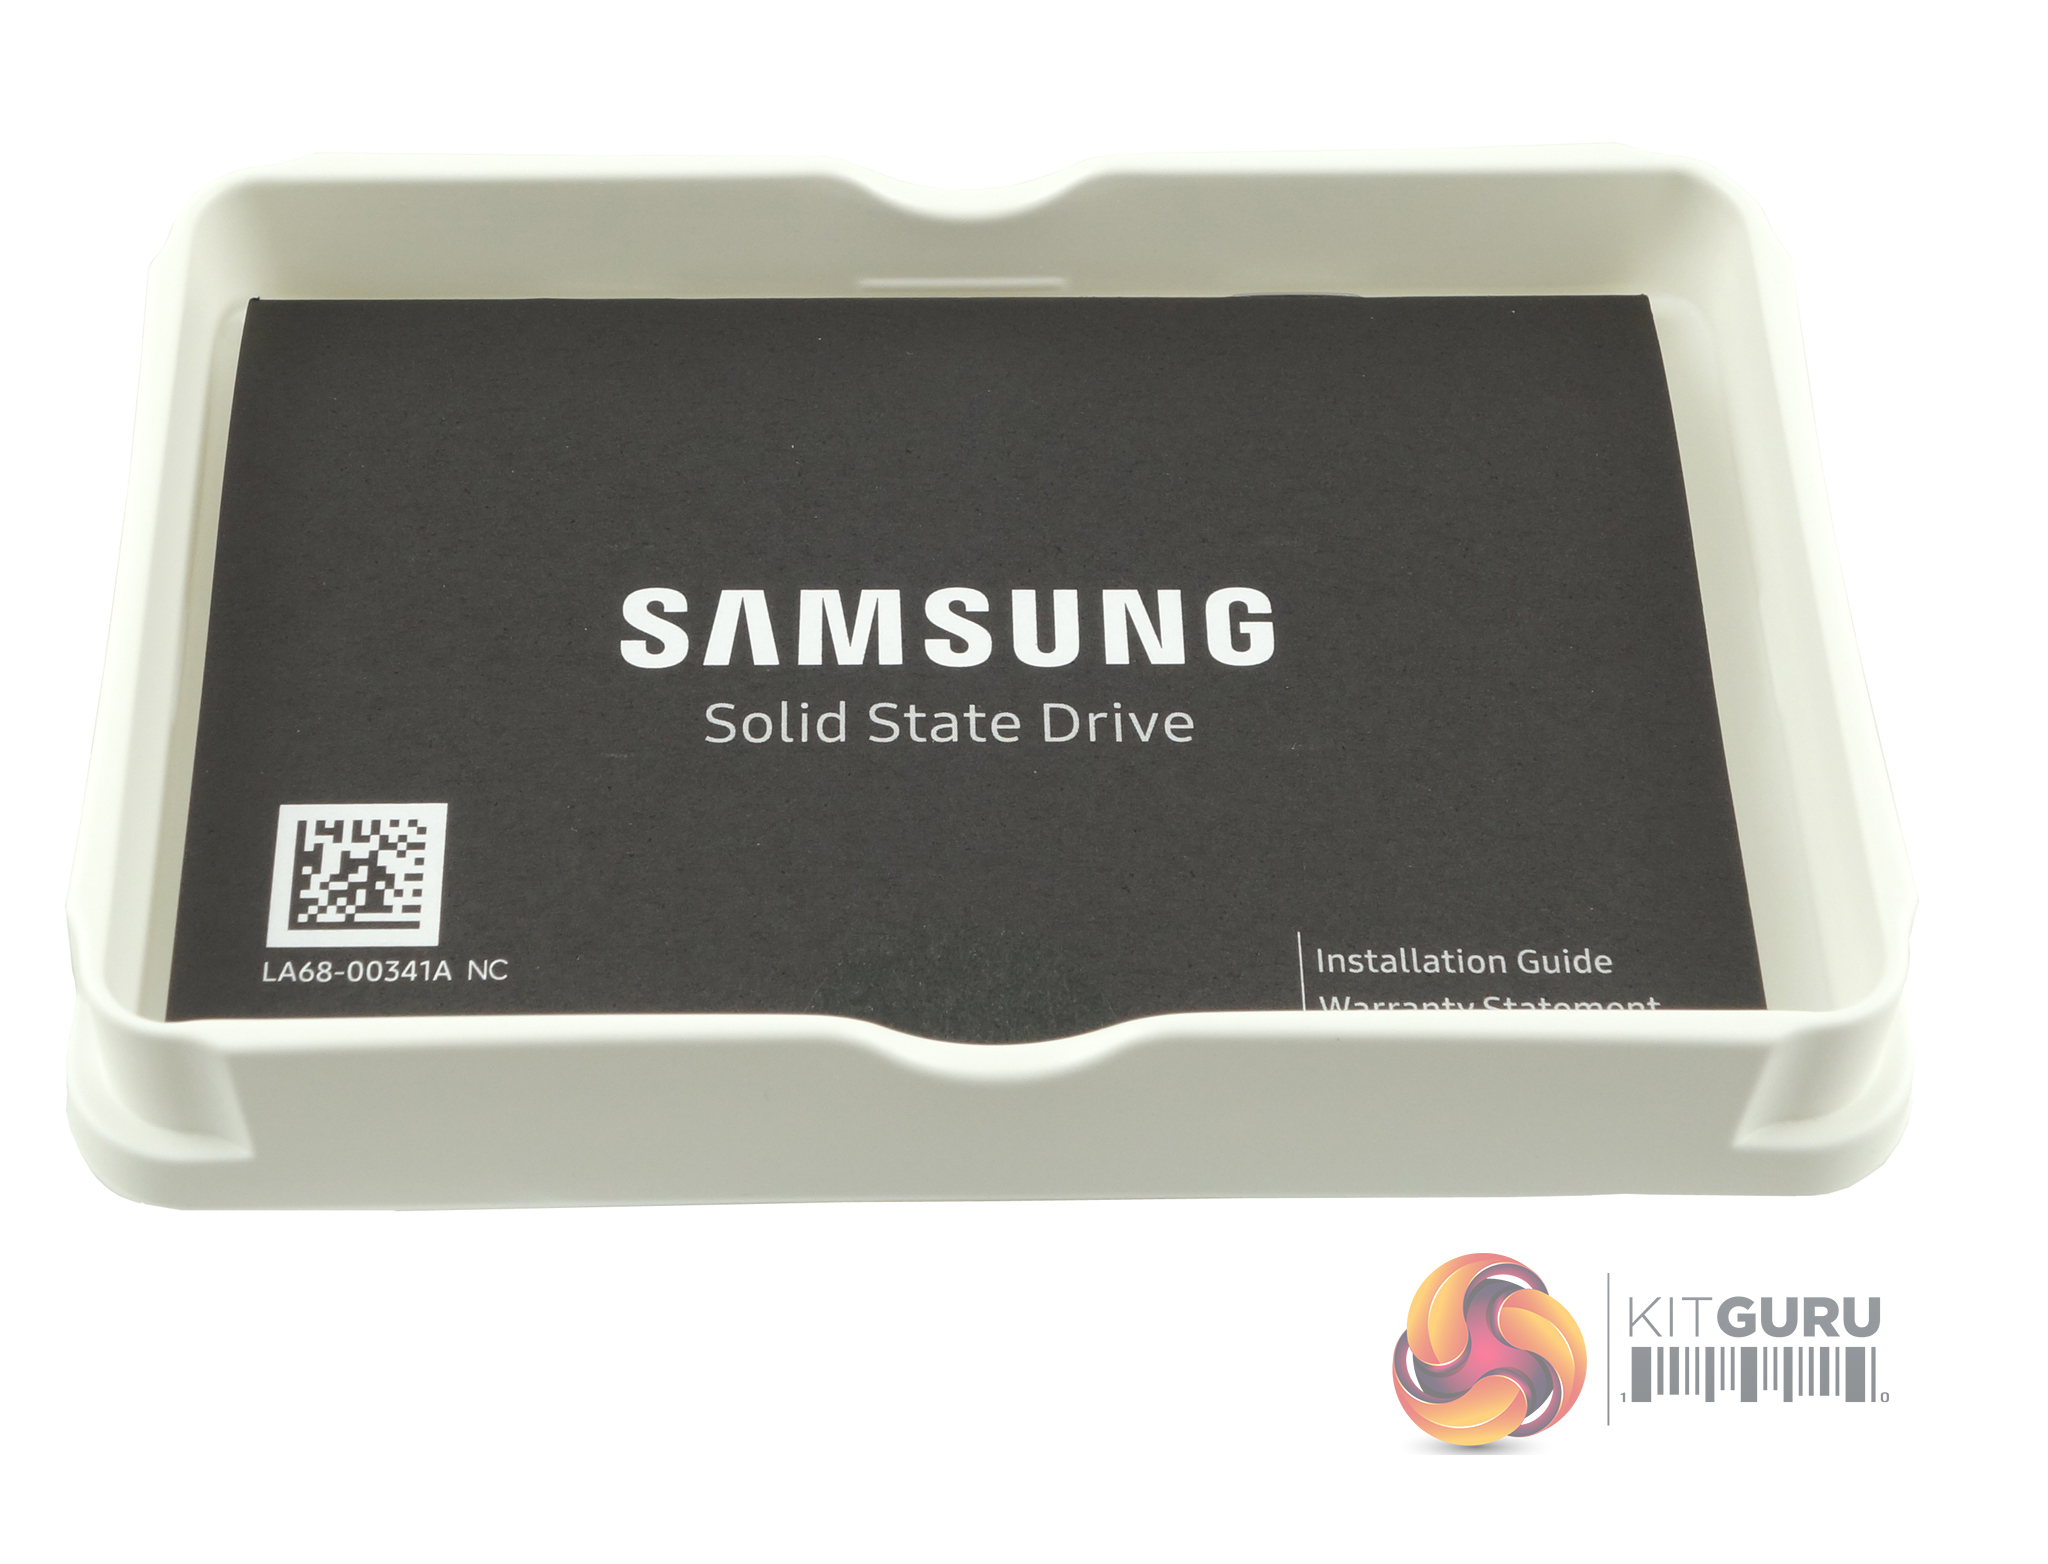
The drive itself comes tucked up in a plastic shell for extra protection. This outer shell fits into another piece of plastic which is home to the installation/warranty guide.
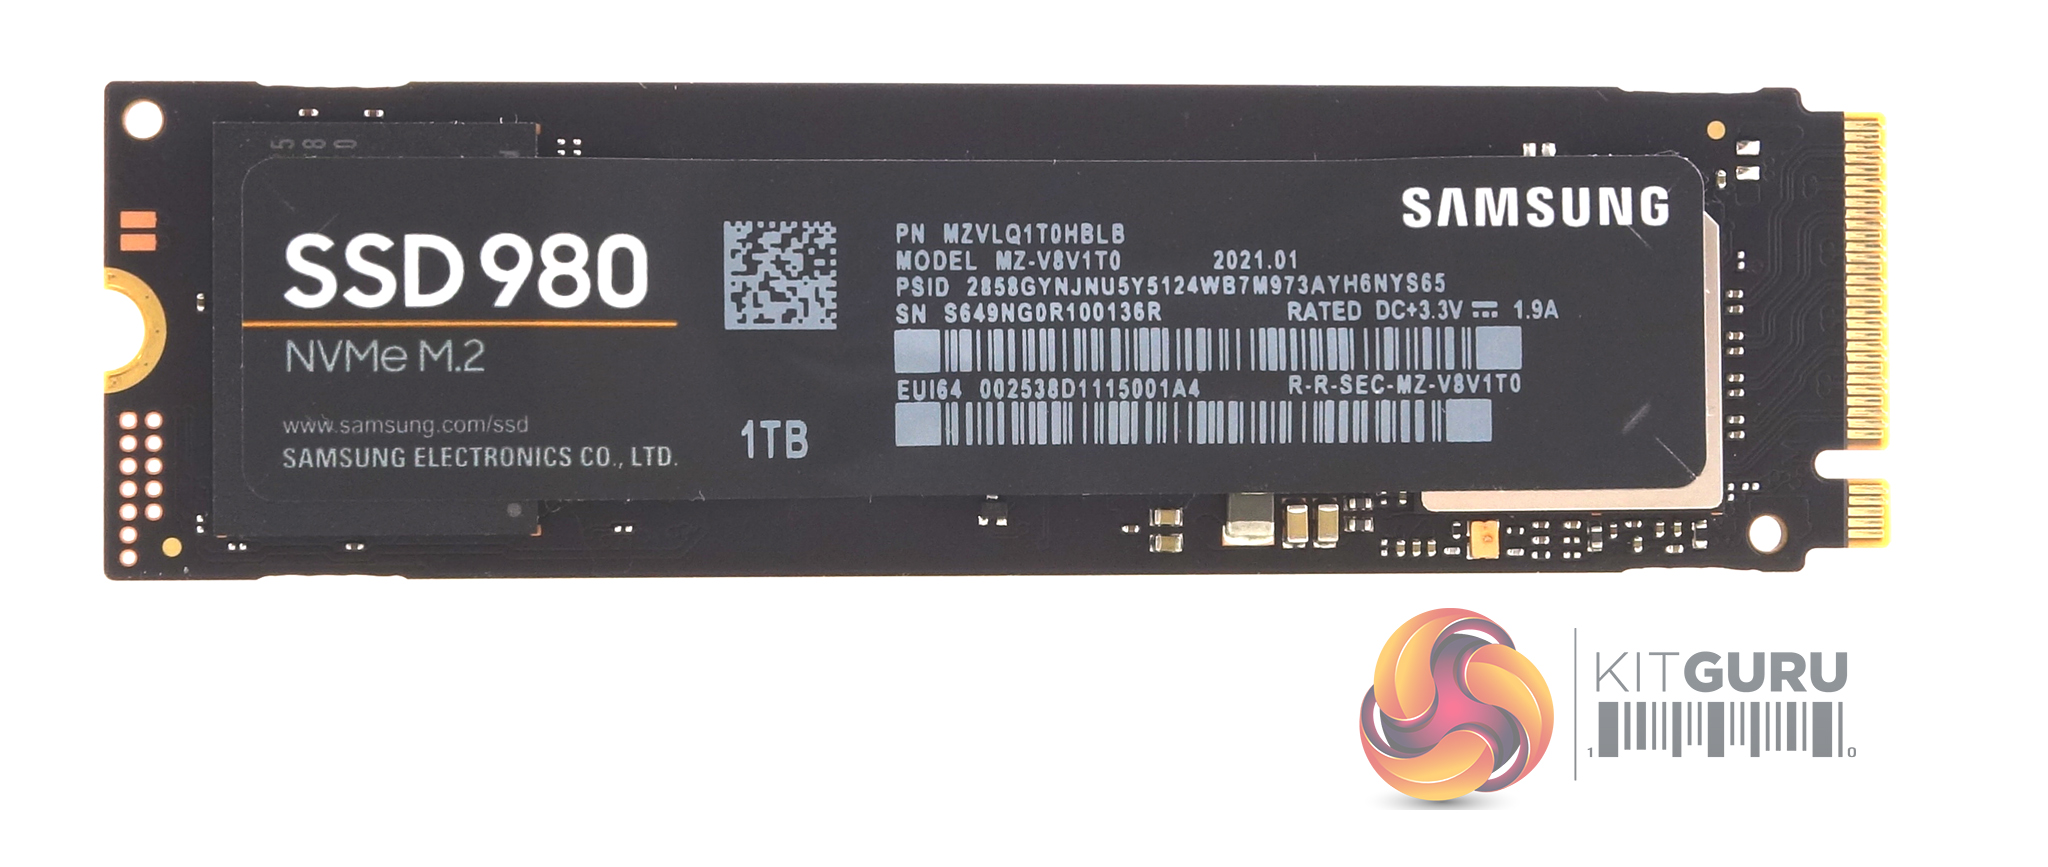
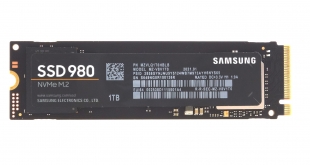
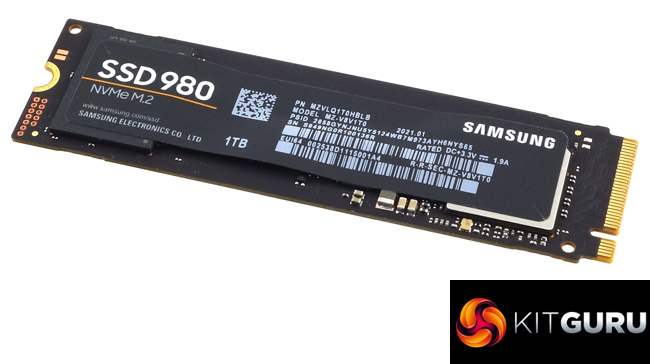
The 1TB SSD 980 is built on a single-sided M.2 2280 format PCB. Under the long product label on the top of the drive sits the Samsung Pablo controller (which has a nickel coating to help with heat dissipation) and a single package of Samsung’s 6th generation 1** layer 3-bit MLC (TLC) V-NAND. The sticker on the rear of the drive has a built-in copper layer to also help get rid of some of the heat generated by the drive when working.
For testing, the drives are all wiped and reset to factory settings by HDDerase V4. We try to use free or easily available programs and some real-world testing so you can compare our findings against your own system.
This is a good way to measure potential upgrade benefits.
Main system:
Intel Core i7-7700K with 16GB of DDR4-3200 RAM, Sapphire R9 390 Nitro and an Asus Prime Z270-A motherboard.
Other drives
Corsair MP400 2TB
Corsair Force MP510 960GB
Crucial P1 1TB
Kingston KC2000 1TB
Kingston KC2500 1TB
Patriot Viper VPR100 RGB 1TB
Patriot Viper VPN100 1TB
PNY CS3030 1TB
Seagate FireCuda 510 1TB
Samsung SSD970 PRO 1TB
Samsung SSD960 EVO 1TB
Samsung SSD960 EVO Plus 1TB
Kioxia Exceria Plus 2TB
Kioxia Exceria NVMe 1TB
Kioxia BG4 1TB
Kioxia XG6 1TB
Western Digital Black SN750 1TB
Western Digital Black SN750 1TB with Heatsink
Western Digital Blue SN550 1TB
Software:
Atto Disk Benchmark 4.0.0.
CrystalMark v6.0.0. / v7.0.0.
AS SSD 2.0.
IOMeter.
Futuremark PC Mark 8
All our results were achieved by running each test five times with every configuration this ensures that any glitches are removed from the results. Trim is confirmed as running by typing fsutil behavior query disabledeletenotify into the command line. A response of disabledeletenotify =0 confirms TRIM is active.
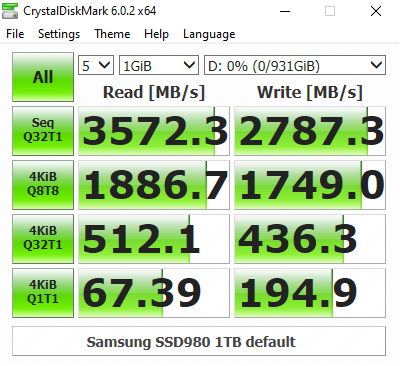
CrystalDiskMark is a useful benchmark to measure theoretical performance levels of hard drives and SSD’s. We are using v6.0. and 7.
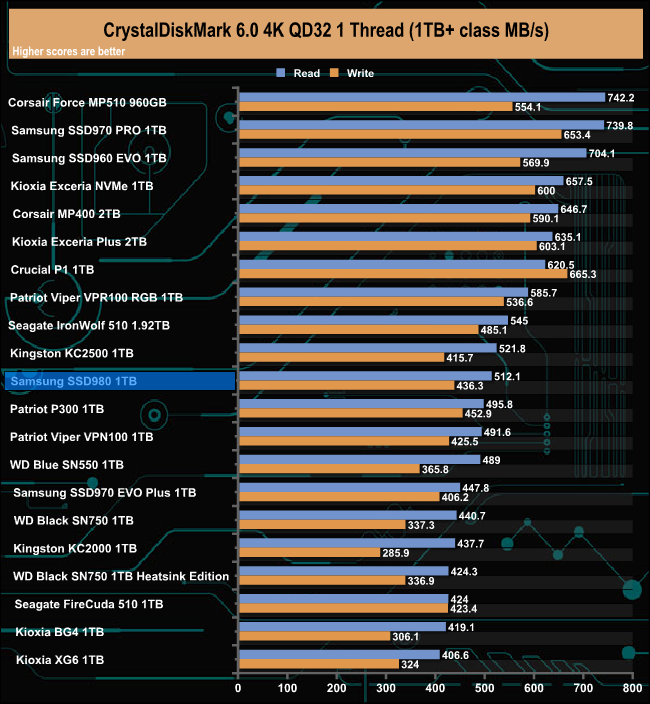
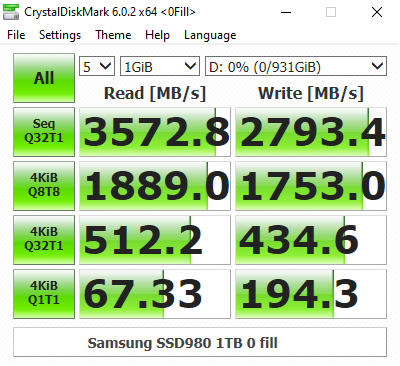
Testing the drive with CrystalDiskMark's 4K QD32 test produces a result that sees the drive sitting midway in our results chart. Looking at the pair of result screens it appears that the Samsung controller doesn't appear to have any preference for the type of data it's being asked to handle.
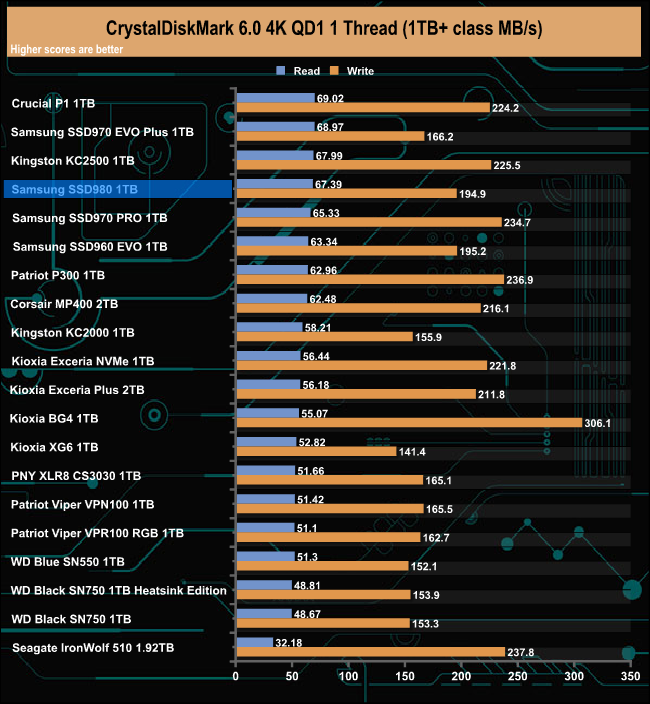
In relation to the other drives around it, the SSD 980 shows better performance in CrystalDiskMark's 4K QD1 test as it sits in the top five of drives tested to date.
CrystalDiskMark 7
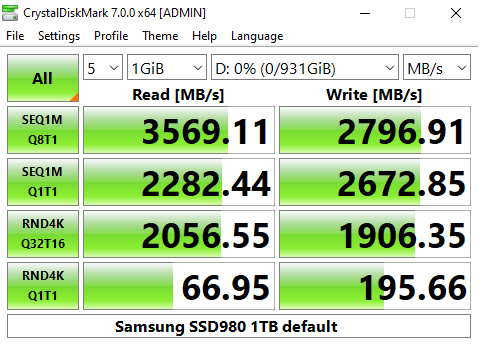
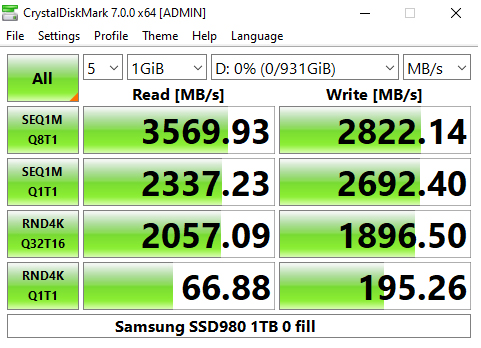
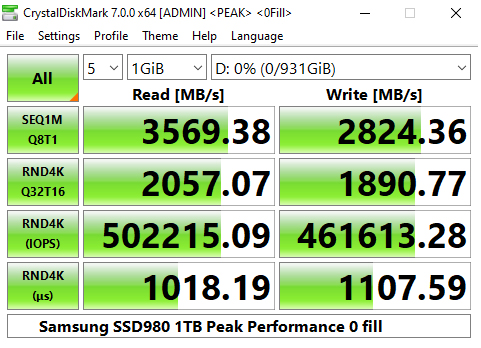
Samsung rate the 1TB SSD 980 as up to 3,500MB/s and 3,000 for Sequential read and writes respectively. We could confirm those figures with CrystalDiskMark 7 with a read performance figure of 3,569MB/s with writes a little shy of the maximum figure at 2,907MB/s.
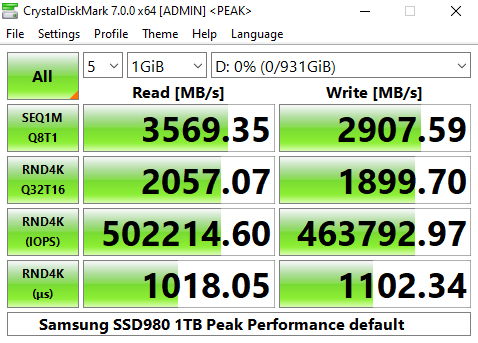
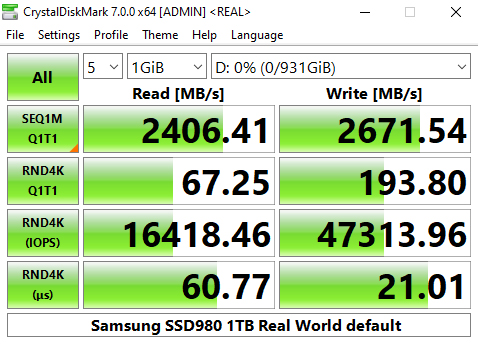
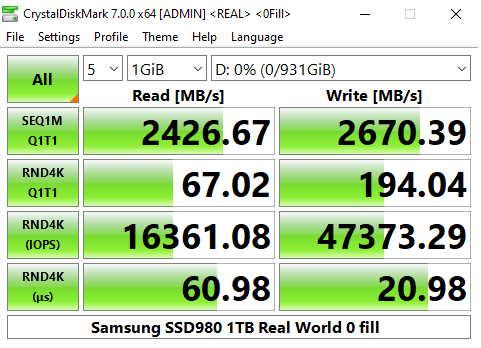
CrystalDiskMark 7 includes a couple of profiles that can be used for testing – Peak Performance and Real World. The result screens for these two profiles not only display MB/s results but also IOPS and latency.
The official 4K random read/write figures for the drive are up to 17,000 IOPS and 54,000 IOPS respectively at QD1 and up to 500,000 IOPS for reads and 480,000 IOPS for writes at QD32. Looking at the Peak Performance results we can confirm the official 4K random read figure with a test result of 502,214 IOPS with writes lower than the official maximum at 463,792 IOPS.
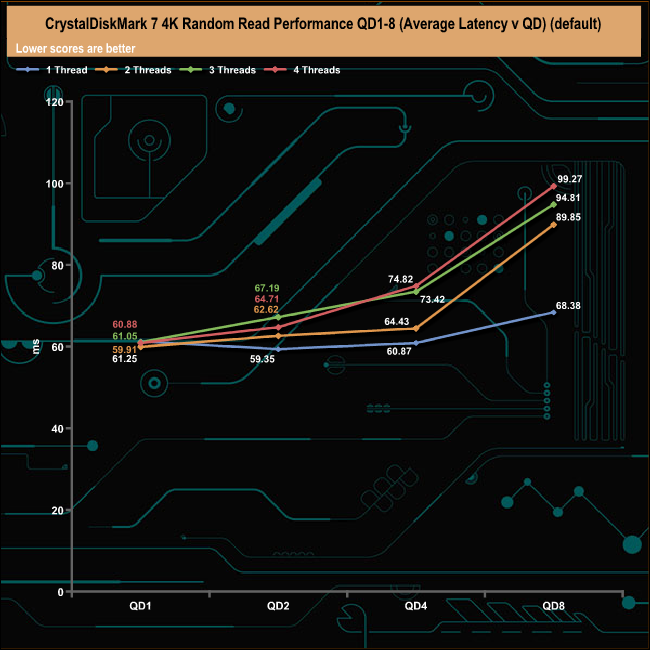
We also used CrystalDiskMark 7 to test the random performance of the drive at lower queue depths (QD1 – QD8 where most of the everyday workloads occur) using 1 to 4 threads.
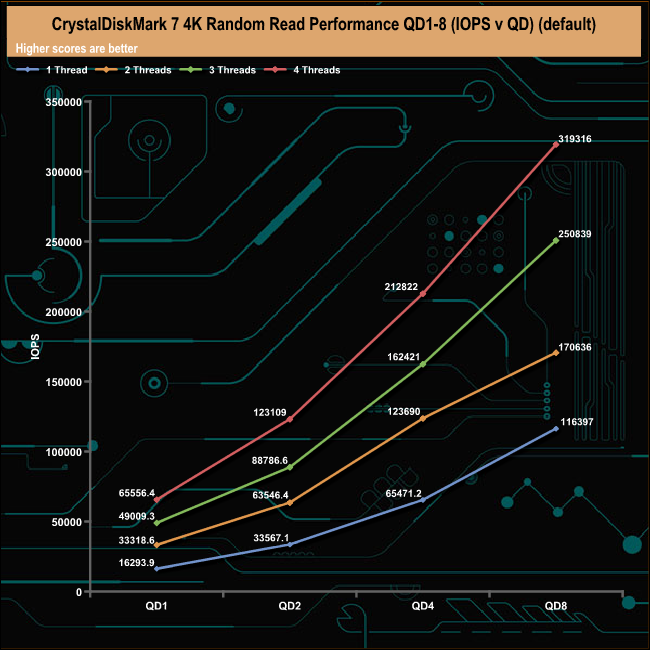
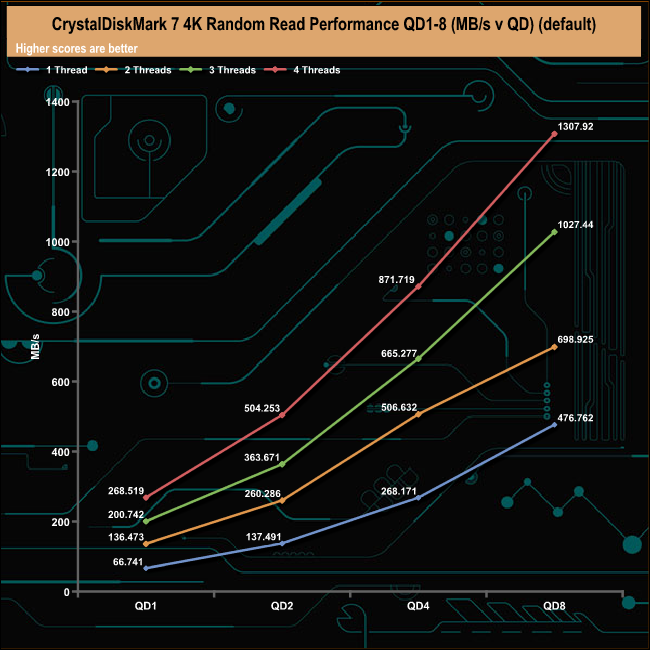
Using a single thread the drive produced a read figure of 16,293 IOPS (66.74MB/s) slightly below the official figure of 17,000 IOPS.

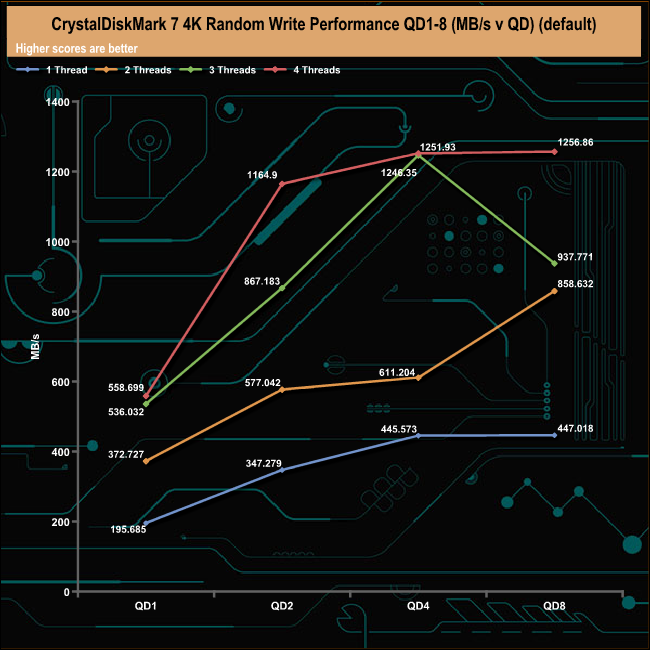

Samsung rate the SSD 980 at up 54,000 IOPS at QD1 with a single thread for random writes. When tested with CrystalDiskMark 7 the best we saw from the drive at QD1 was 47,774 IOPS (195MB/s). In the three threaded test run, we saw a drop off in performance from QDs 4 and 8.
The ATTO Disk Benchmark performance measurement tool is compatible with Microsoft Windows. Measure your storage systems performance with various transfer sizes and test lengths for reads and writes. Several options are available to customize your performance measurement including queue depth, overlapped I/O and even a comparison mode with the option to run continuously.
Use ATTO Disk Benchmark to test any manufacturers RAID controllers, storage controllers, host adapters, hard drives and SSD drives and notice that ATTO products will consistently provide the highest level of performance to your storage.
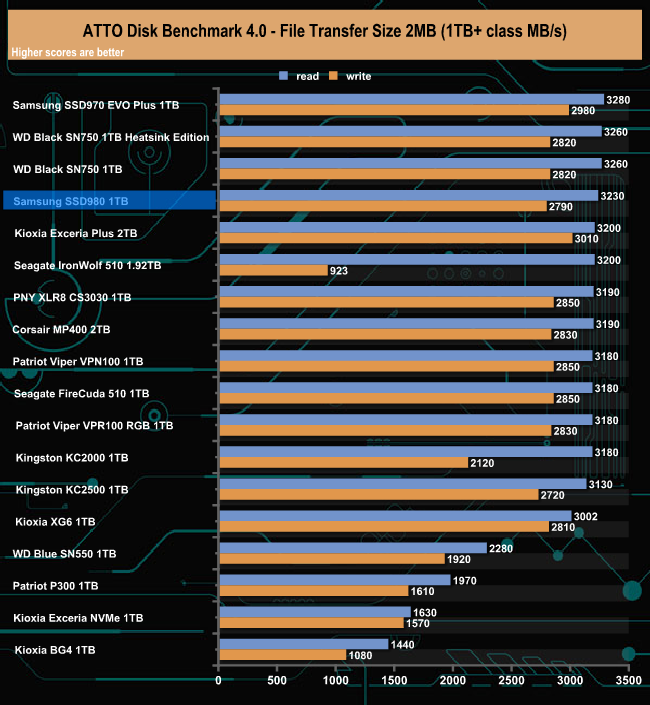
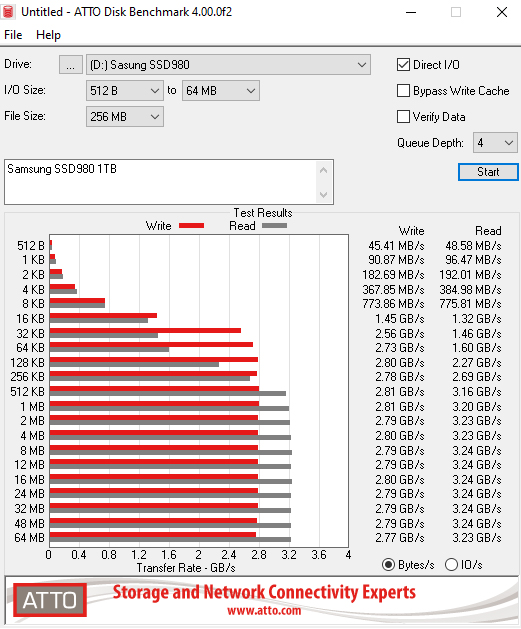
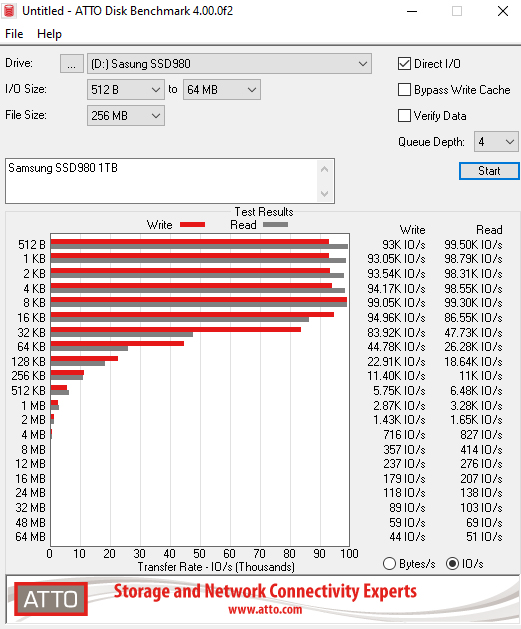
Official Sequential performance figures for the 1TB drive are up to 3,500MB/s reads and 3,000 for writes. Using the ATTO benchmark we couldn't quite reach those maximum figures with the tested drive producing figures of 3,230MB/s for reads and 2,790MB/s for writes.
AS SSD is a great free tool designed just for benching Solid State Drives. It performs an array of sequential read and write tests, as well as random read and write tests with sequential access times over a portion of the drive. AS SSD includes a sub suite of benchmarks with various file pattern algorithms but this is difficult in trying to judge accurate performance figures.
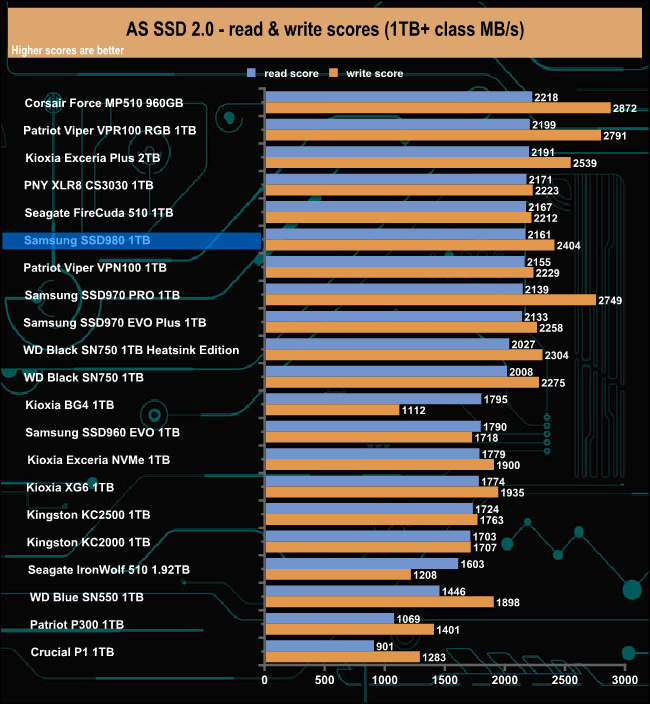
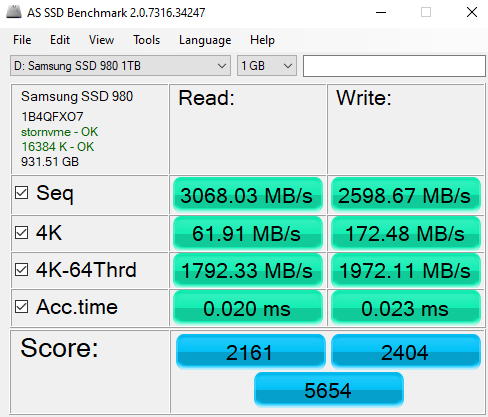
In the AS SSD benchmark, the drive produced a read score of 2161 but a more impressive write score of 2404, one of the fastest write scores we've seen to date for this class of drive.
IOMeter is another open-source synthetic benchmarking tool that is able to simulate the various loads placed on the hard drive and solid-state drive technology. There are many ways to measure the IOPS performance of a Solid State Drive, so our results will sometimes differ from the manufacturer’s quoted ratings. We do test all drives in exactly the same way, so the results are directly comparable.
We test 128KB Sequential read and write and random read and write 4k tests. The test setup’s for the tests are listed below. Each is run five times.
128KB Sequential Read / Write.
Transfer Request Size: 128KB Span: 8GB Thread(s): 1, Outstanding I/O: 1-32 Test Run: 20 minutes per test.
4K Sustained Random Read / Write.
Transfer Request Size: 4KB Span: 80GB Thread(s): 4, Outstanding I/O: 1-32 Test Run: 20 minutes per test.
4K Random 70/30 mix Read/Write.
Transfer Request Size: 4KB Span: 80GB Reads: 70% Writes: 30% Thread(s): 4 Outstanding I/O: 2 – 32 Test Run: 20 minutes.
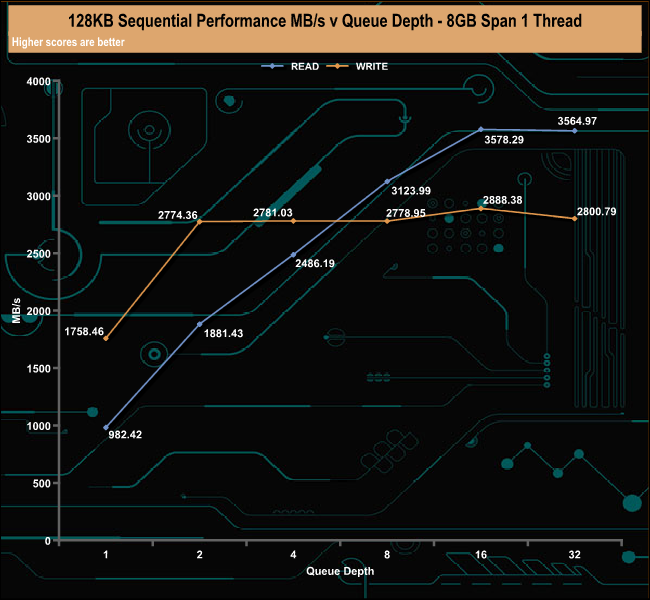
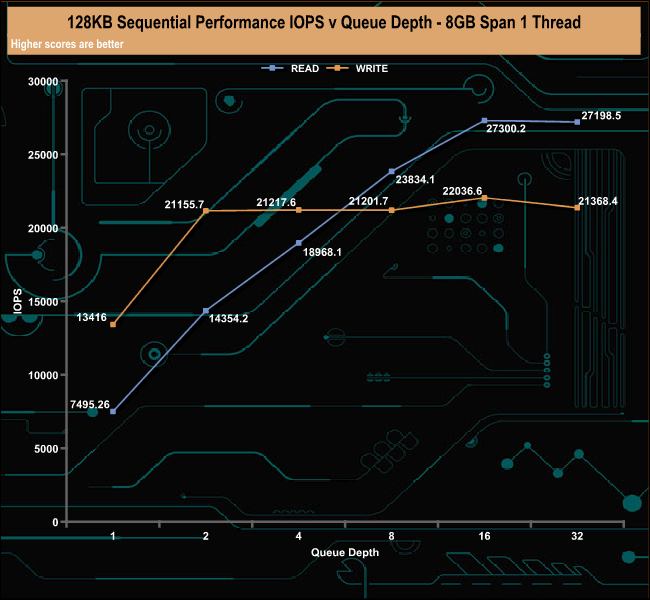
Samsung quote maximum read/write Sequential performance for the drive as up to 3,500MB/s for reads and 3,000 for writes. With our own Sequential testing, we could confirm that maximum read figure with a result of 3,564.97MB/s at QD32. Writes on the other hand came up short of the official figure at 2,800.79MB/s at QD32.
128KB Sequential Read v QD performance comparison
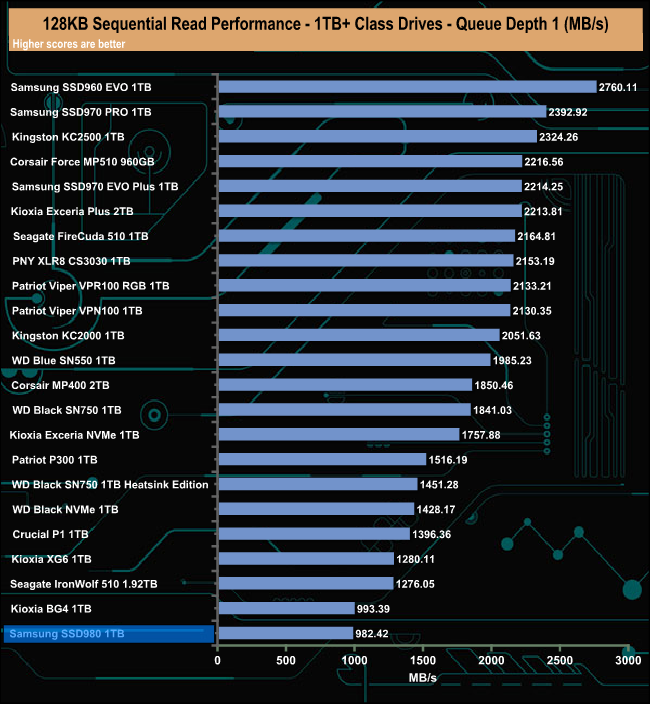
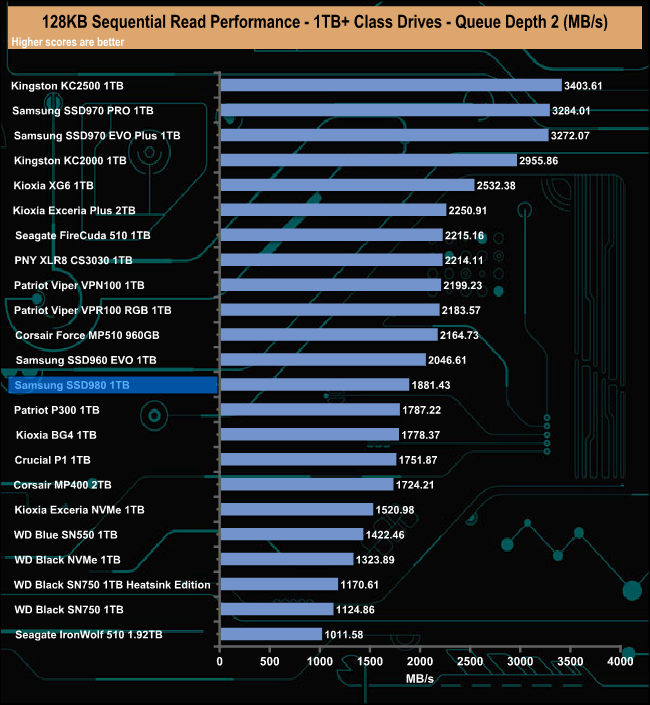
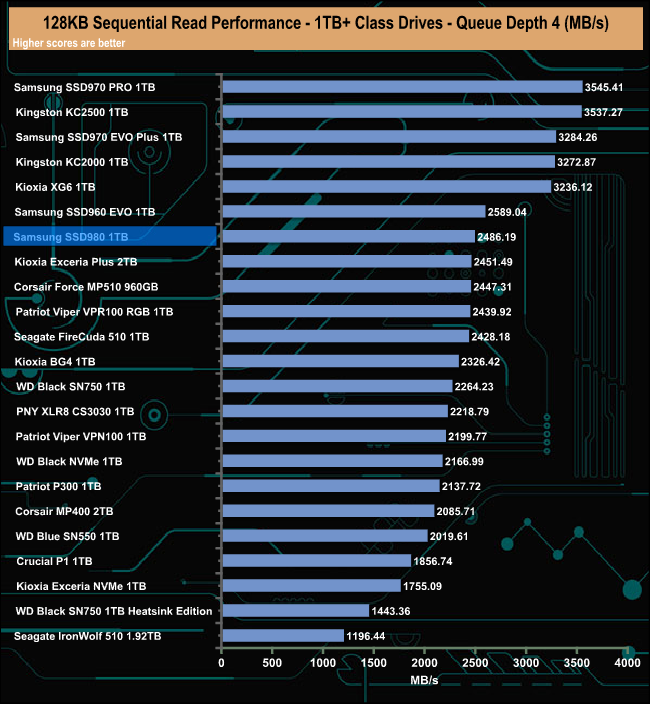
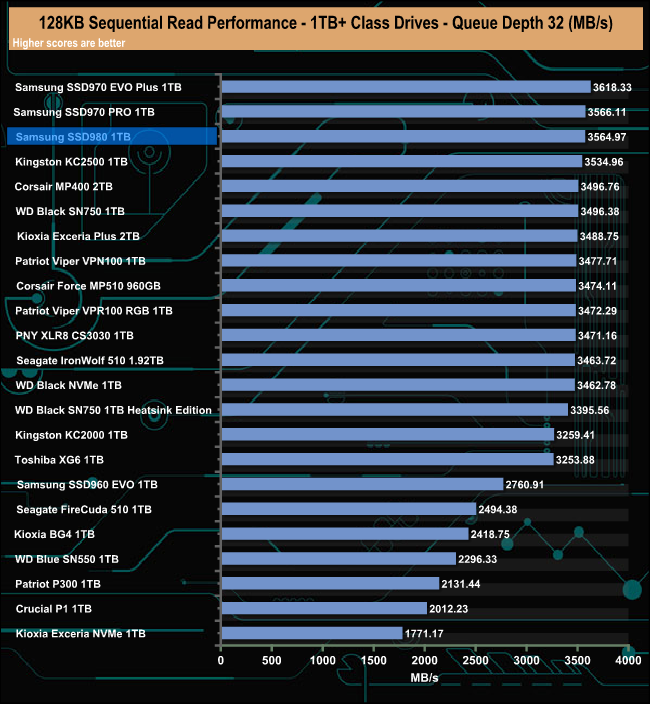
The drive sits at the bottom of our result chart at QD1 but rises steadily up it as the queue depth deepens, finally ending up in the third spot at QD32 behind two other Samsung drives, the SSD970 EVO and 970 PRO.
128KB Sequential Write v QD performance comparison
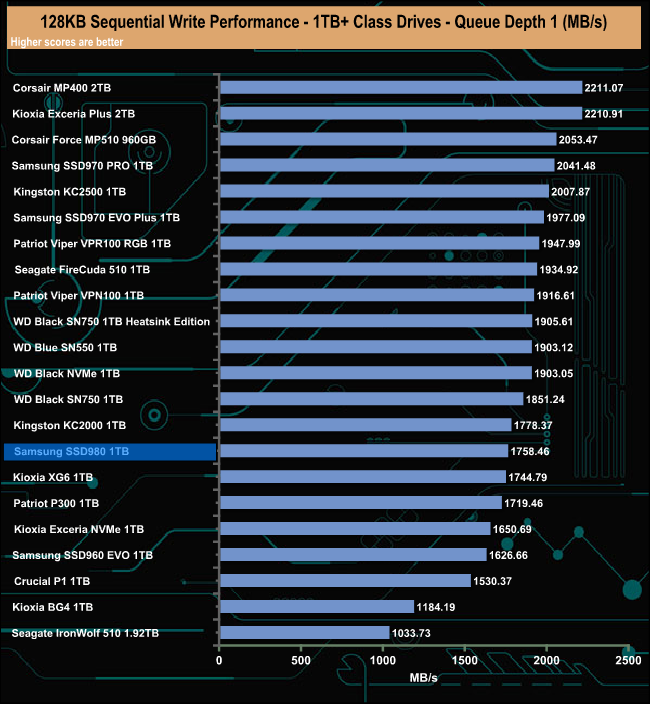
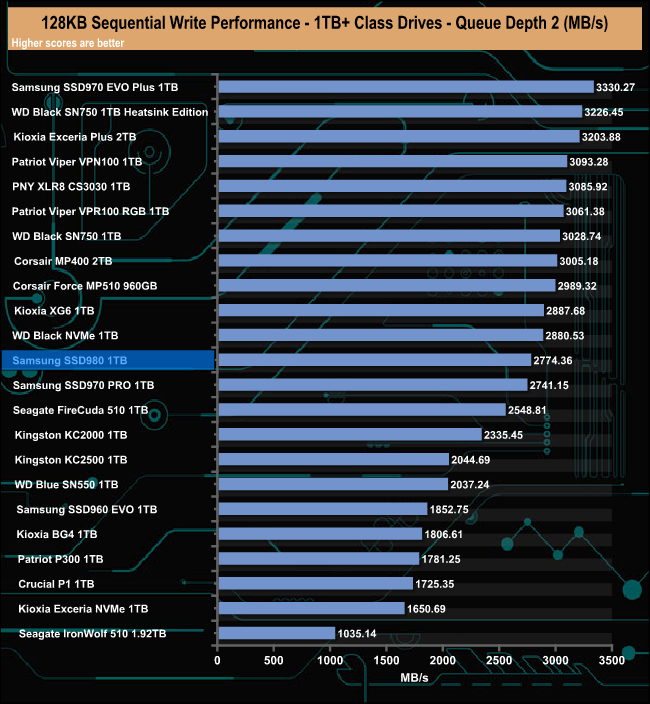
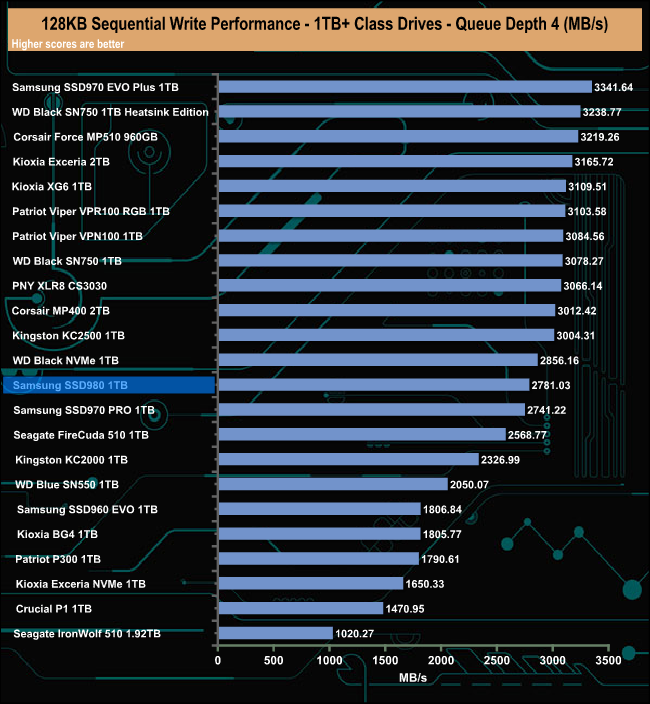
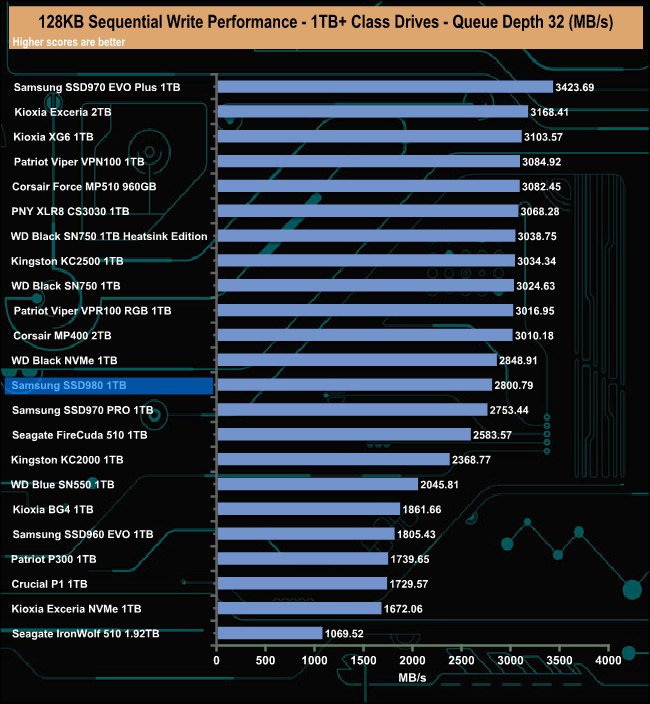
Compared to the drives around it, the Samsung SSD 980 pretty much holds station as the queue depth deepens.
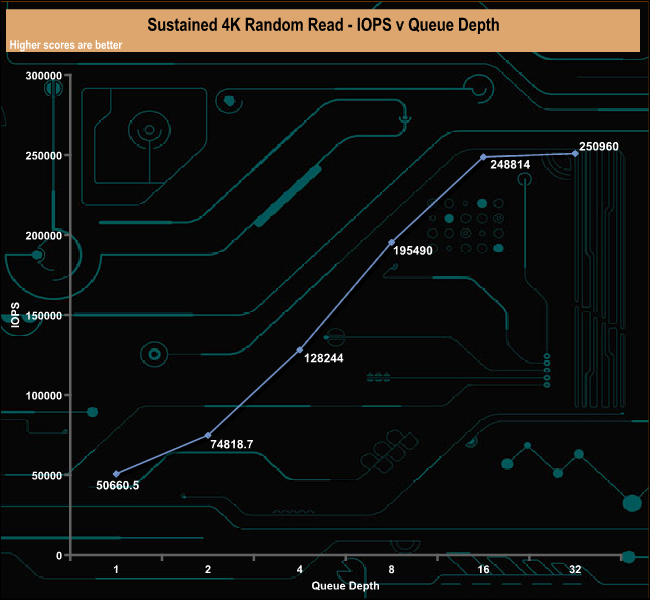
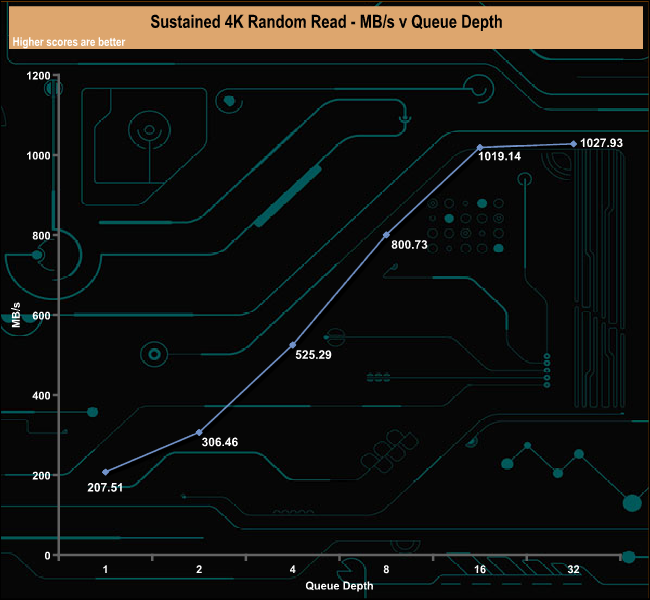

In our 4-threaded random read test, the drive peaked at 250,960 IOPS (1027.93MB/s). Samsung quote two 4K random read figures for the drive, up to 17,000 IOPS at QD1 using a single thread and up to 500,000 IOPS at QD32 using 16 threads. Our 4-threaded test results sit comfortably between the two official figures.
4K Sustained Random Read v QD comparison.

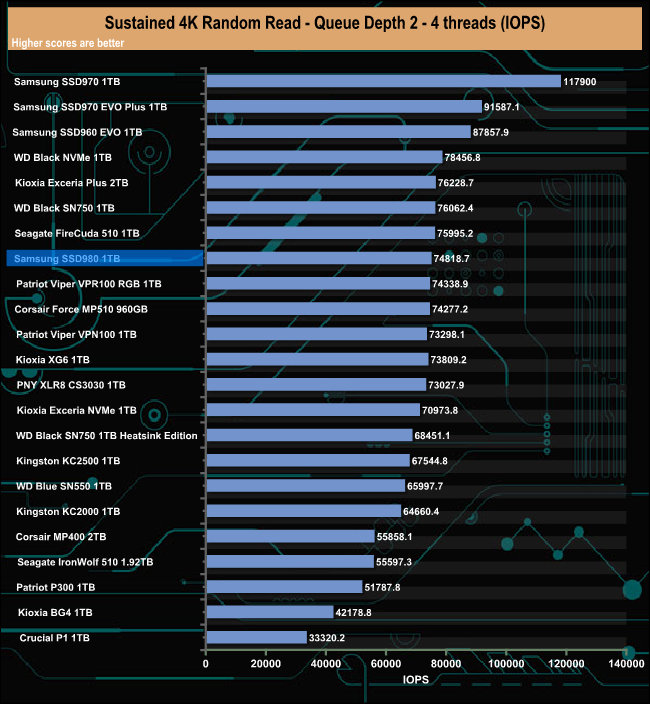
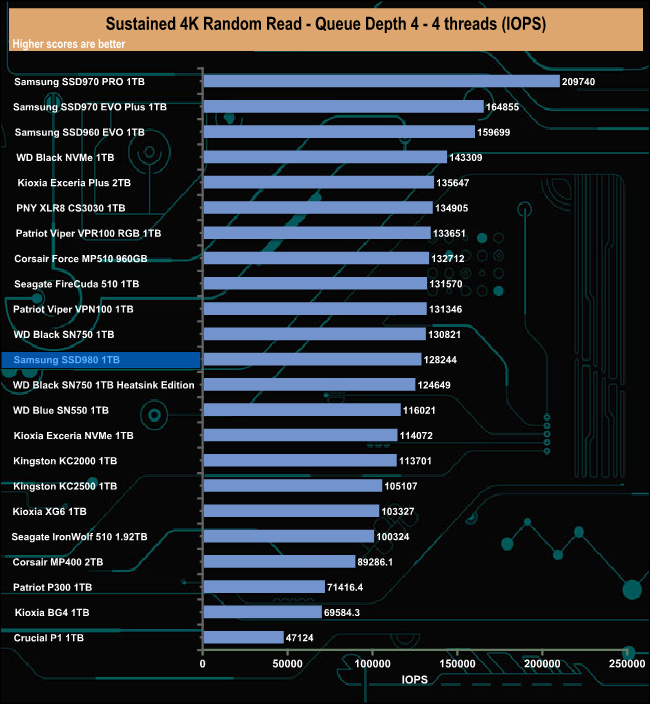
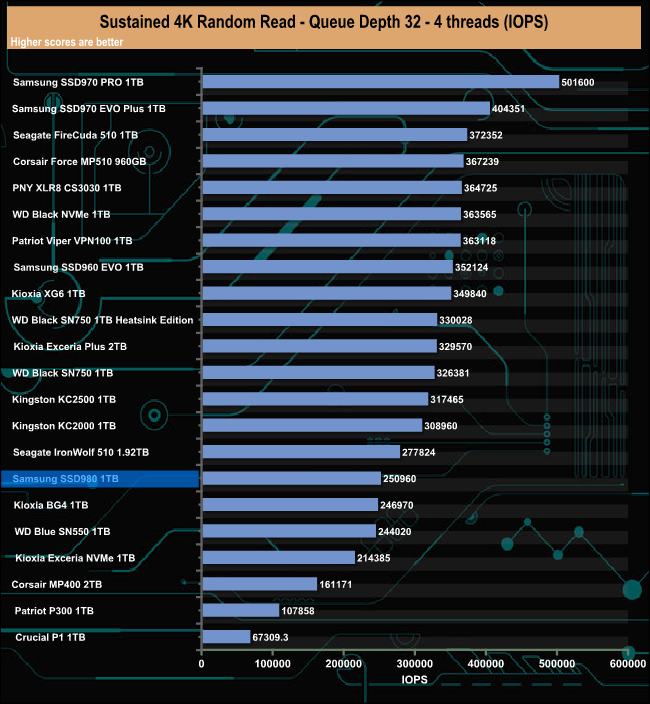
At QD1, the drive is the third-fastest we've seen to date but as the tested queue depths deepen the drive sinks further down the result's charts.
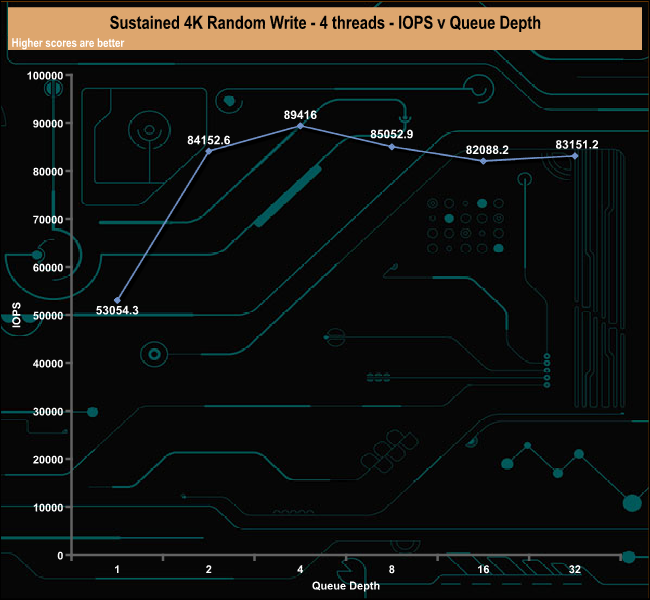
Random write performance for the drive is quoted at up to 54,000 IOPS for QD1 (1 thread) and up to 480,000 IOPS for QD32 (16 threads). In our tests with 4-threads, we got a figure of 53,054 IOPS at QD1, peaking at 89,416 at QD4.
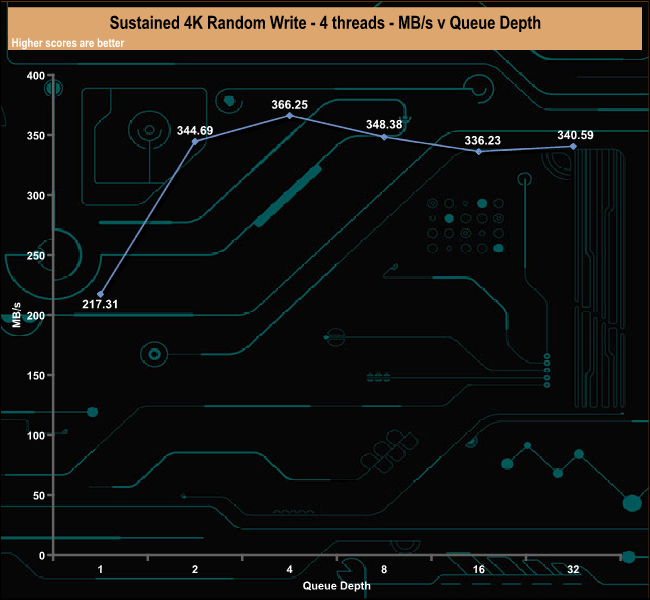
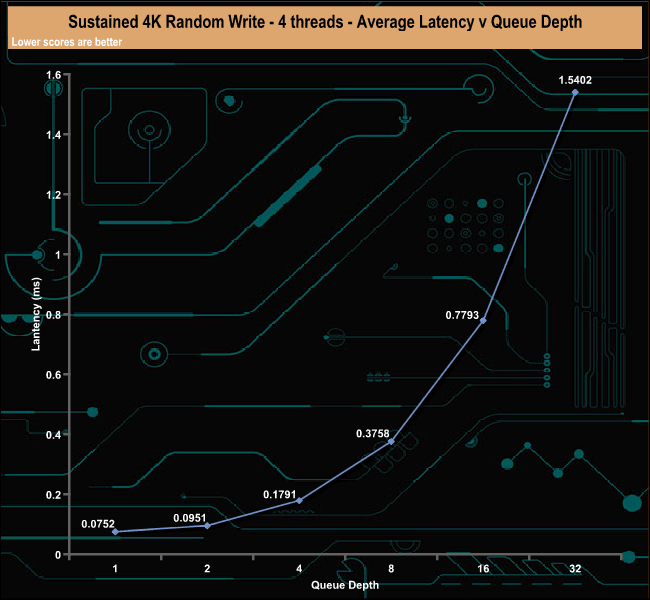
4K Sustained Random Write v QD comparison.
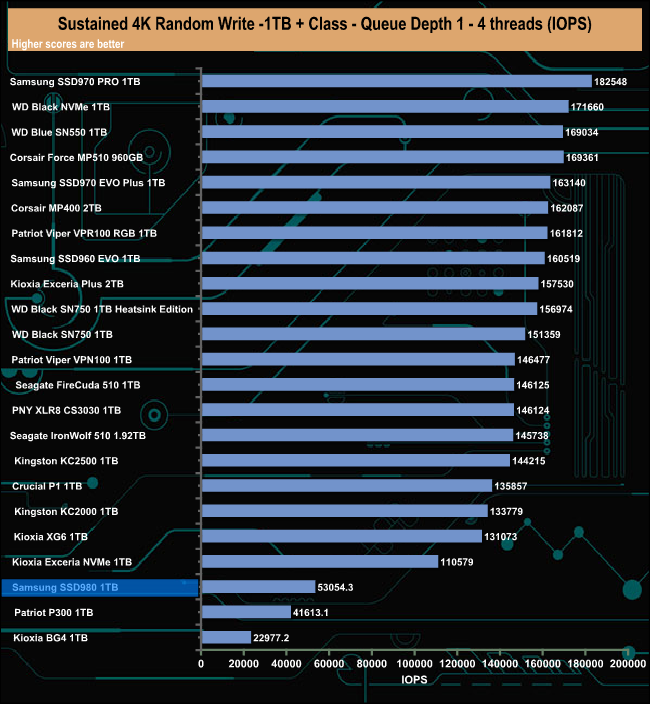
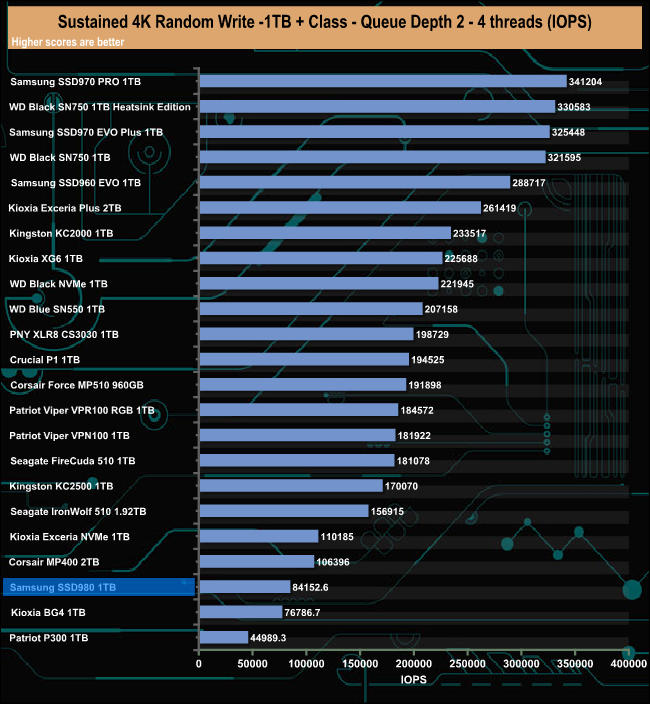
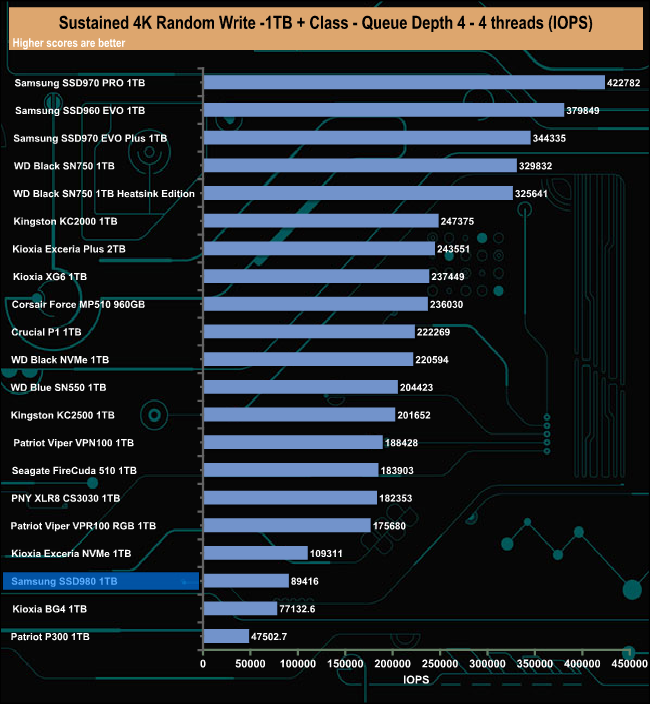
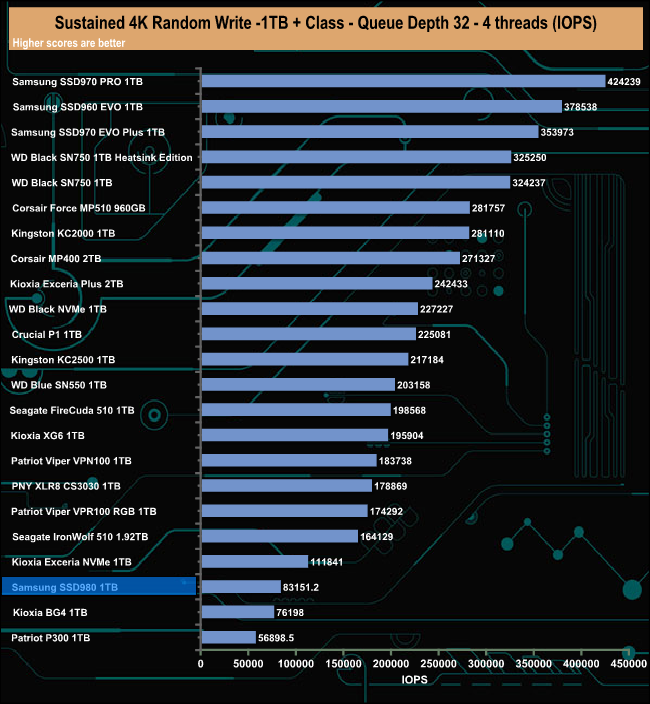
When the SSD 980 is pushed, the lack of a dedicated DRAM chip becomes apparent as the drive is in the bottom three throughout the random write tests. Even so after QD1 it is very consistent in performance.
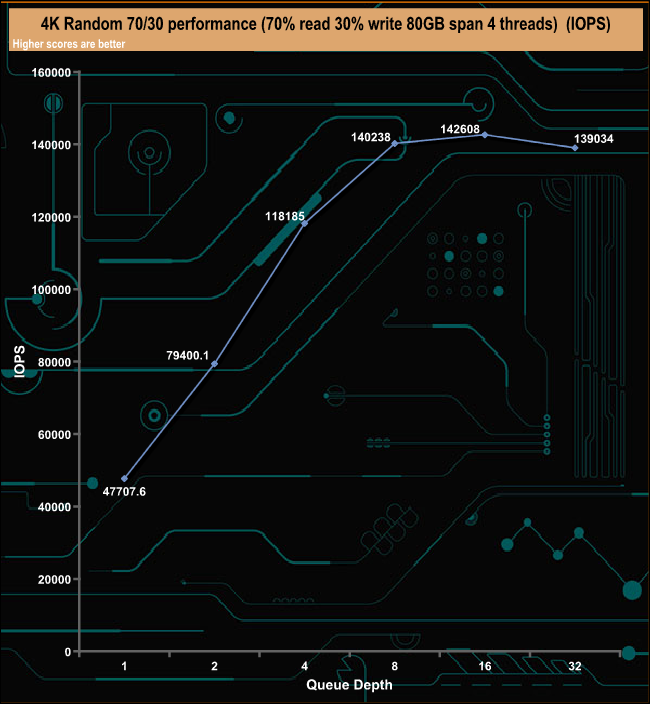
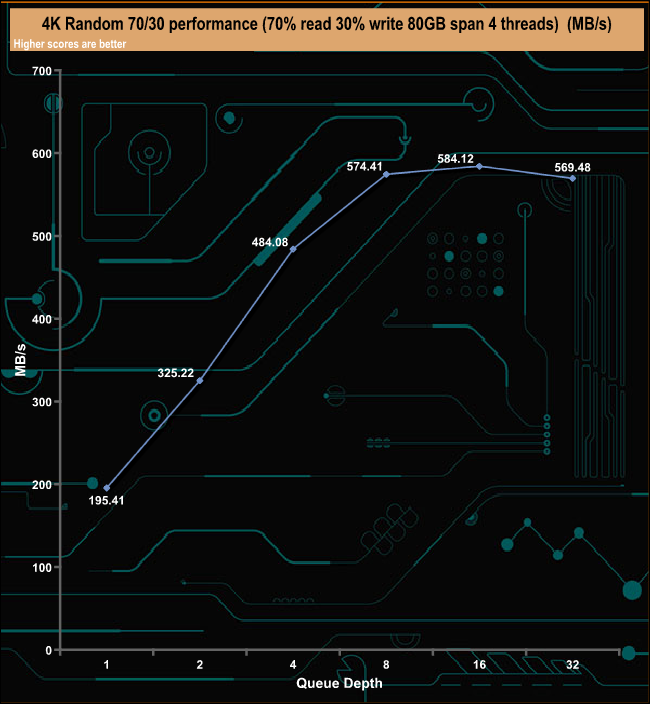
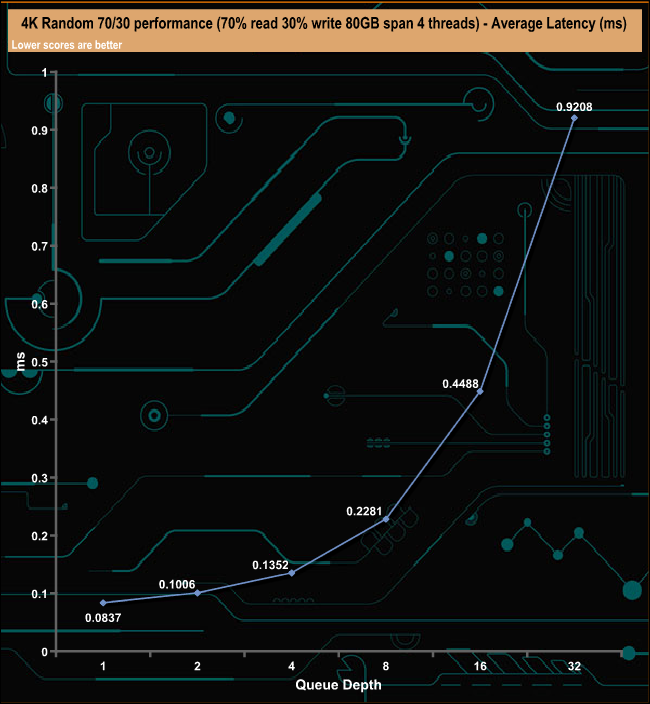
The SSD 980 handles the 70/30 read/write test pretty well but the performance does drop off slightly between QD's 16 (142,608 IOPS) and 32 (139,034 IOPS).
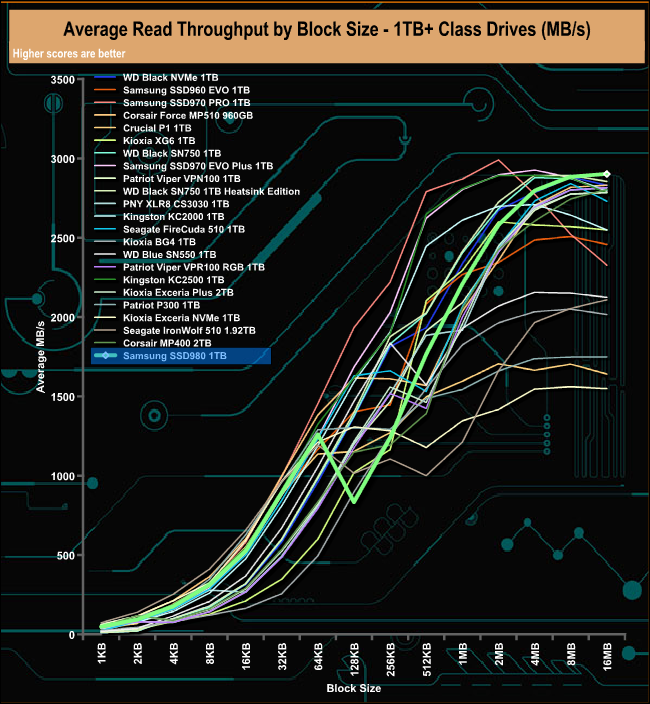
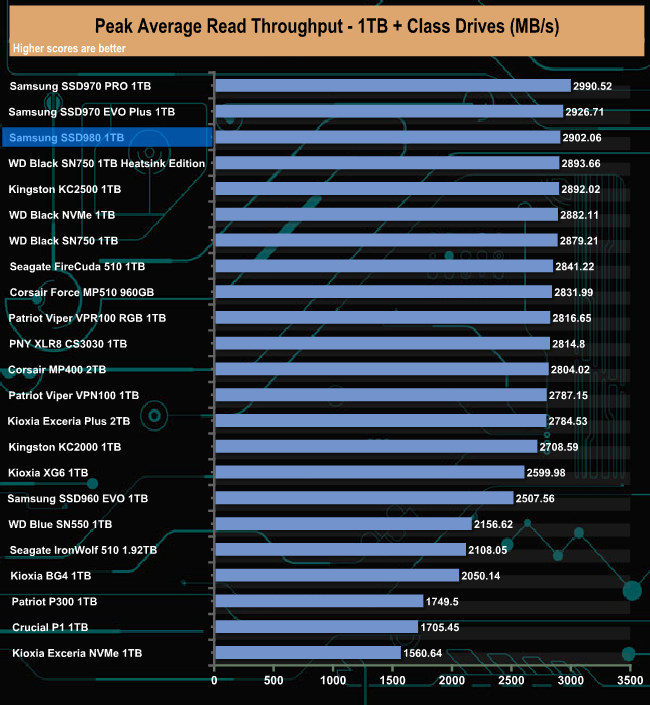
In our read throughput testing, the drive peaks at the end of the test at 2,902.06MB/s, short of the official 3,500MB/s. Even so that peak figure is good enough for third place on our results chart.
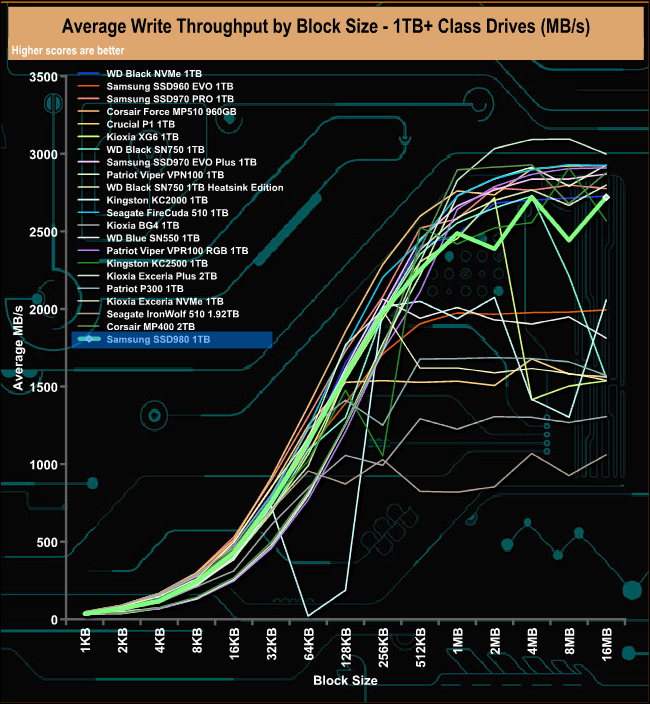
In our write throughput test the drive peaks at 2,722.70MB/s (4MB block) after which the performance drops to 2,442.56MB/s (8MB block) before recovering to finish the test run at 2,720.17MB/s.
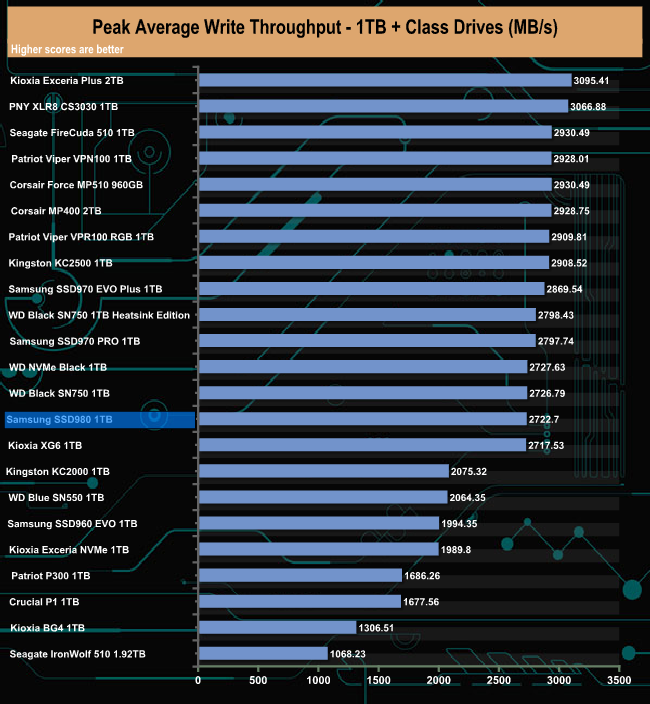
The drive's peak write figure of 2,722.70MB/s sees the drive in the bottom half of our results chart.
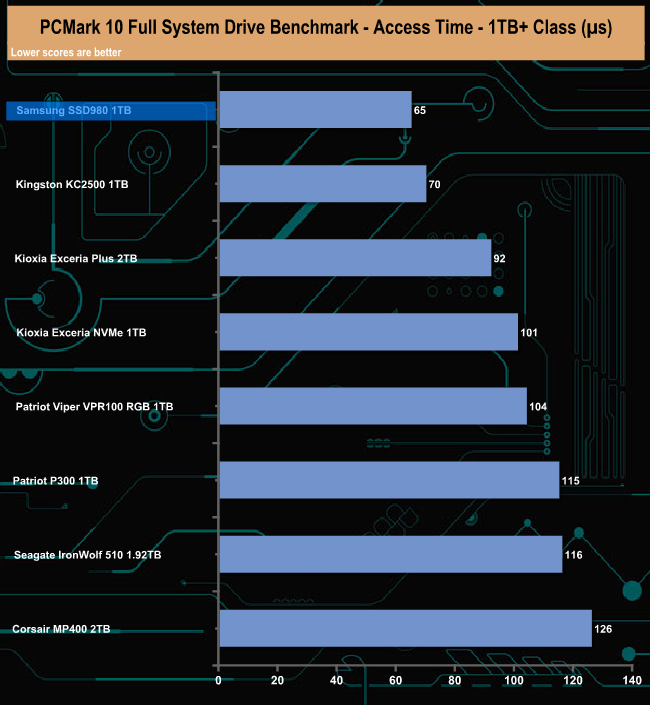
The PCMark 10 Full System Drive Benchmark uses a wide-ranging set of real-world traces from popular applications and common tasks to fully test the performance of the fastest modern drives. The benchmark is designed to measure the performance of fast system drives using the SATA bus at the low end and devices connected via PCI Express at the high end.
The goal of the benchmark is to show meaningful real-world performance differences between fast storage technologies such as SATA, NVMe, and Intel’s Optane. The Full System Drive Benchmark uses 23 traces, running 3 passes with each trace. It typically takes an hour to run.
Traces used:
Booting Windows 10.
Adobe Acrobat – starting the application until usable.
Adobe Illustrator – starting the application until usable Adobe Premiere Pro – starting the application until usable.
Adobe Photoshop – starting the application until usable.
Battlefield V – starting the game until the main menu.
Call of Duty Black Ops 4 – starting the game until the main menu.
Overwatch – starting the game until the main menu.
Using Adobe After Effects.
Using Microsoft Excel.
Using Adobe Illustrator.
Using Adobe InDesign.
Using Microsoft PowerPoint.
Using Adobe Photoshop (heavy use).
Using Adobe Photoshop (light use).
cp1 Copying 4 ISO image files, 20 GB in total, from a secondary drive to the target drive (write test).
cp2 Making a copy of the ISO files (read-write test).
cp3 Copying the ISO to a secondary drive (read test).
cps1Copying 339 JPEG files, 2.37 GB in total, to the target drive (write test).
cps2 Making a copy of the JPEG files (read-write test).
cps3 Copying the JPEG files to another drive (read test).
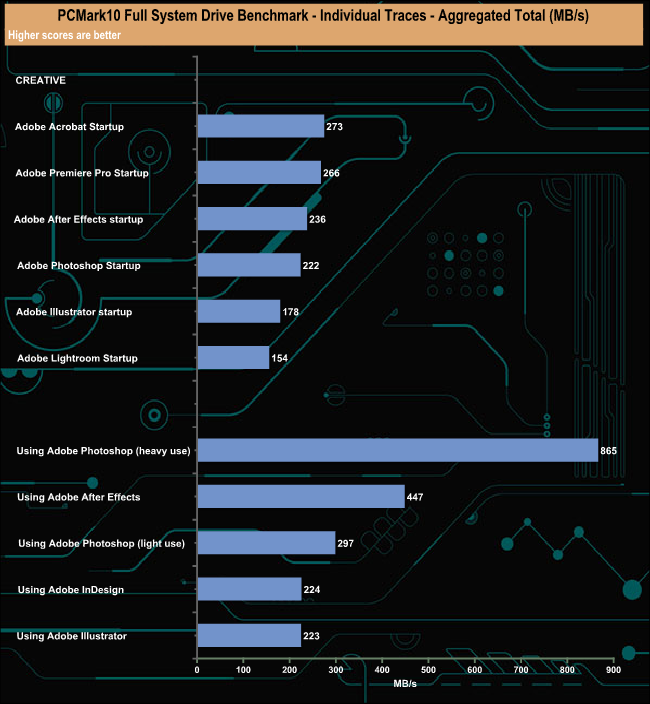
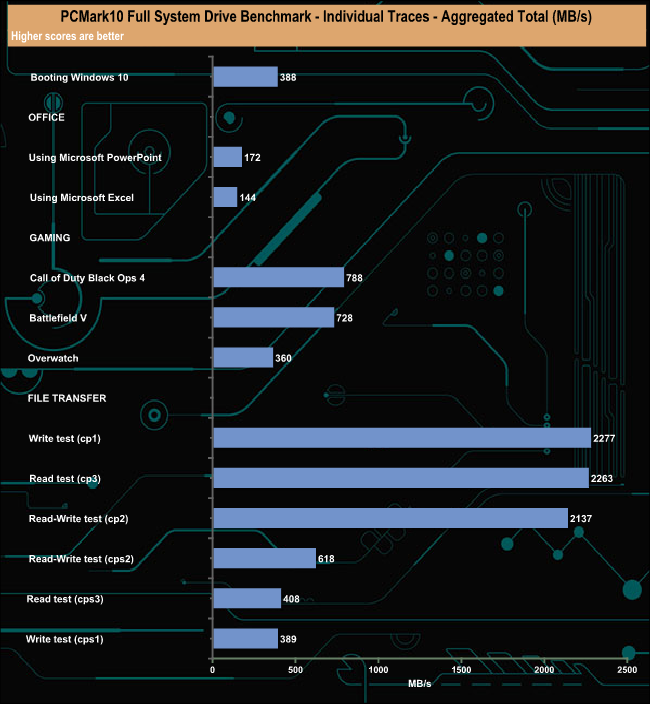
The drive handles PCMark 10's Full System Drive benchmark well. The standout figure for the creative set of tests is the 865MB/s for the Adobe Photoshop (heavy use) test trace while the 788MB/s for the Call of Duty Black Ops 4 trace and the results for the cps1 write test and cps3 read test are also good results.
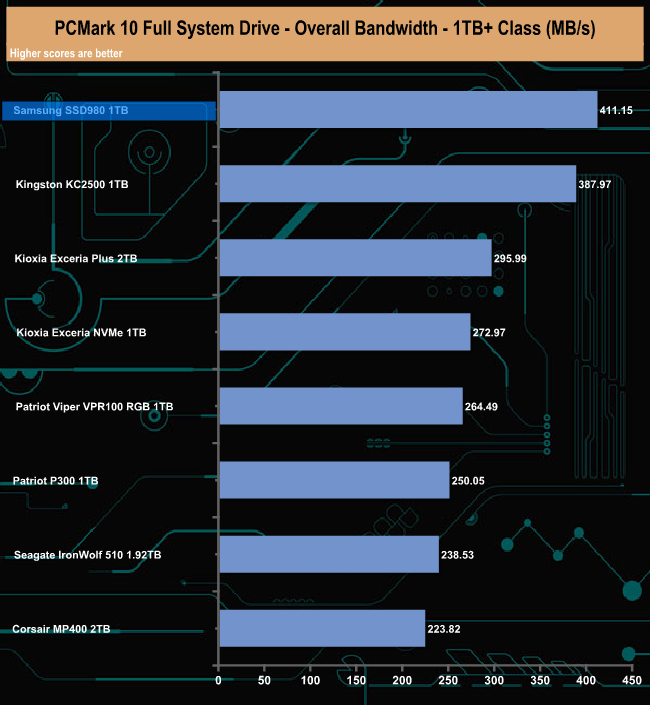
The SSD 980 is the fastest of the consumer PCIe Gen 3 drives we have tested with the PCMark10 Full System Drive benchmark to date.
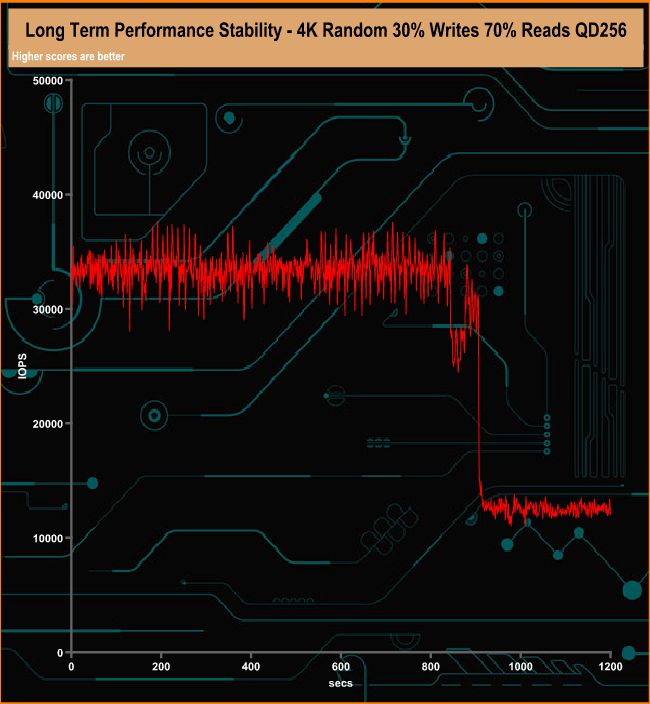
For the long term performance stability test, we set the drive up to run a 20-minute 4K random test with a 30% write, 70% read split, at a Queue Depth of 256 over the entire disk. The 1TB Samsung SSD 980 averaged 28,123.63 IOPS for the test with a performance stability of 76% which is very good for this class of drive.
To test the real-life performance of a drive we use a mix of folder/file types and by using the FastCopy utility (which gives a time as well as MB/s result) we record the performance of drive reading from & writing to a 256GB Samsung SSD850 PRO.
We use the following folder/file types:
- 100GB data file.
- 60GB iso image.
- 60GB Steam folder – 29,521 files.
- 50GB File folder – 28,523 files.
- 21GB 8K Movie demos.
- 12GB Movie folder – 24 files (mix of Blu-ray and 4K files).
- 11GB 4K Raw Movie Clips (8 MP4V files).
- 10GB Photo folder – 621 files (mix of png, raw and jpeg images).
- 10GB Audio folder – 1,483 files (mix of mp3 and .flac files).
- 5GB (1.5bn pixel) photo.
- Blu-ray movie.
![]()
![]()
The Samsung SSD 980 dealt with our real-life file transfers without any problems, showing good consistency of performance for reads when dealing with the larger file sizes, although as usual it's the small files in the Audio, Steam and File folders that cause the drive to slow down.
To get a measure of how much faster PCIe NVMe drives are than standard SATA SSD's we use the same files but transfer to and from a 512GB Toshiba OCZ RD400.
![]()
![]()
Switching over to the NVMe drive to transfer data to and from the SSD 980 saw transfer speeds for the large file transfers rocket and times taken drop dramatically. Seven of the transfers topped well over 2GB/s when writing to the drive.
It seems to have taken an eternity but Samsung has finally launched the successor to the venerable SSD 970 EVO in the shape of the SSD 980.
The new drive is the company's first DRAMless design. Instead of using a DRAM chip, the drive relies on Host Memory Buffer (HMB) technology. HMB uses the Direct Memory Access (DMA) feature of the PCIe interface to allow the drive to access part of the system memory (up to 64MB) to use for the mapping table.
The SSD 980 is also supported by Samsung's Intelligent TurboWrite 2.0 technology to aid write performance. The default TurboWrite region of the 1TB drive is 160GB, over three times bigger than the region in the 970 EVO.
The SSD 980 is a PCIe Gen 3 drive unlike its sibling the SSD 980 PRO which is a full blown PCIe Gen 4 model. At launch, the SSD 980 range comes in just three capacities, 250GB, 500GB and the flagship 1TB drive, which is a little disappointing as we might have expected the range to top out at 2TB these days. The drive uses the latest Samsung 1** layer 3-bit V-NAND (TLC NAND) in combination with an in-house Pablo controller, the same controller found in the T7 external drive.
Samsung quote Sequential performance figures for the 1TB drive as up to 3,500MB/s reads and 3,000 for writes. Using the ATTO benchmark we couldn't quite hit these official maximums, the best we saw was 3,230MB/s for reads and 2,790MB/s for writes. However, we did match the maximum read figure with the CrystalDiskMark benchmark with a best figure of 3,572MB/s. As with the ATTO benchmark, we couldn't quite match the official write figure, the fastest we saw was 2,907MB/s from the CrystalDiskMark 7 Peak Performance test.
Two sets of figures are officially quoted for random performance; QD1 with 1 thread and QD32 with 16 threads. The QD1 read figure is up to 17,000 IOPS while the QD32 performance is stated as up to 500,000 IOPS for reads. Our 4-threaded read tests produced figures of 50,660 IOPS at QD1 and 250,960 IOPS at QD32. We did a quick test at QD32 with 16 threads and got the best result of 422,133 IOPS (1,729MB/s).
Random write performance for the drive is quoted at up to 54,000 IOPS for QD1 and up to 480,000 IOPS for QD32. In our tests with 4-threads, we got a figure of 53,054 IOPS at QD1, peaking at 89,416 at QD4. As with random reads we did a quick test at QD32 with 16 threads to see if we could match the official 480,000 IOPS. The best we saw was 458,059.1 IOPS (1,876.21MB/s) still shy of the official maximum.
We don't yet have a buy link but he 1TB SSD 980 is priced at £119.49.
Pros
- Sequential performance.
- Endurance.
- 5-year warranty.
Cons
- Current line-up tops out at 1TB.
- Tested 4K performance couldn’t match the official maximum figures in some tests.
KitGuru says: It has taken a while but at last Samsung has brought out a drive to take the place of the highly successful and popular SSD 970 EVO. Only time will tell if it matches its predecessor's popularity and it is entering into a fiercely competitive market segment.