

Late last year we took a look at the 1TB version of Solidigm's entry-level Gen 4 SSD, the P41 Plus. Now it's the turn of the 2TB flagship drive, coming in at £115 here in the UK. Can it do enough to stand out in a fiercely competitive market?

The 2TB P41 Plus is the flagship model of a three-drive family along with 512GB and 1TB options. The P41 Plus uses a combination of a Silicon Motion SM2269XT controller (4-channel PCIe Gen 4 x4) and Solidigm 144-layer 3D QLC NAND. It's a DRAMless design using Host Memory Buffer technology instead.
Officially the 2TB drive is rated as up to 4,125MB/s and 3,325MB/s for Sequential read/write performance respectively. The entry-level 512GB model is rated at up to 3,500MB/s for reads & 1,625MB/s for writes. The 1TB drive has the same 4,125MB/s read figure as the 2TB drive with a write speed of up to 2,950MB/s.
The official 4K random performance figures for the 2TB drive are up to 390.000 IOPS and up to 540,000 IOPS for reads and writes respectively. The 1TB drive has figures of up to 225,000 IOPS for reads and up to 520,000 IOPS for writes. The 512GB drive makes do with 115,000 IOPS reads and 390,000 IOPS writes.
Solidigm quotes power consumption figures for the drive of active 80mW and active 80mW idle. The endurance of the 2TB drive is rated at 800TBW and Solidigm back it with a 5-year warranty.
Physical Specifications:
- Usable Capacities: 2TB.
- NAND Components: Solidigm 144-layer 3D QLC.
- NAND Controller: Silicon Motion SM2269XT.
- Cache: None/HMB (Host Memory Buffer).
- Interface: PCIe 4.0 x4, NVMe 1.4.
- Form Factor: M.2-2280.
- Dimensions: 80 x 20 x 2.2mm.
- Drive Weight: 6g.
Firmware Version: 001C.
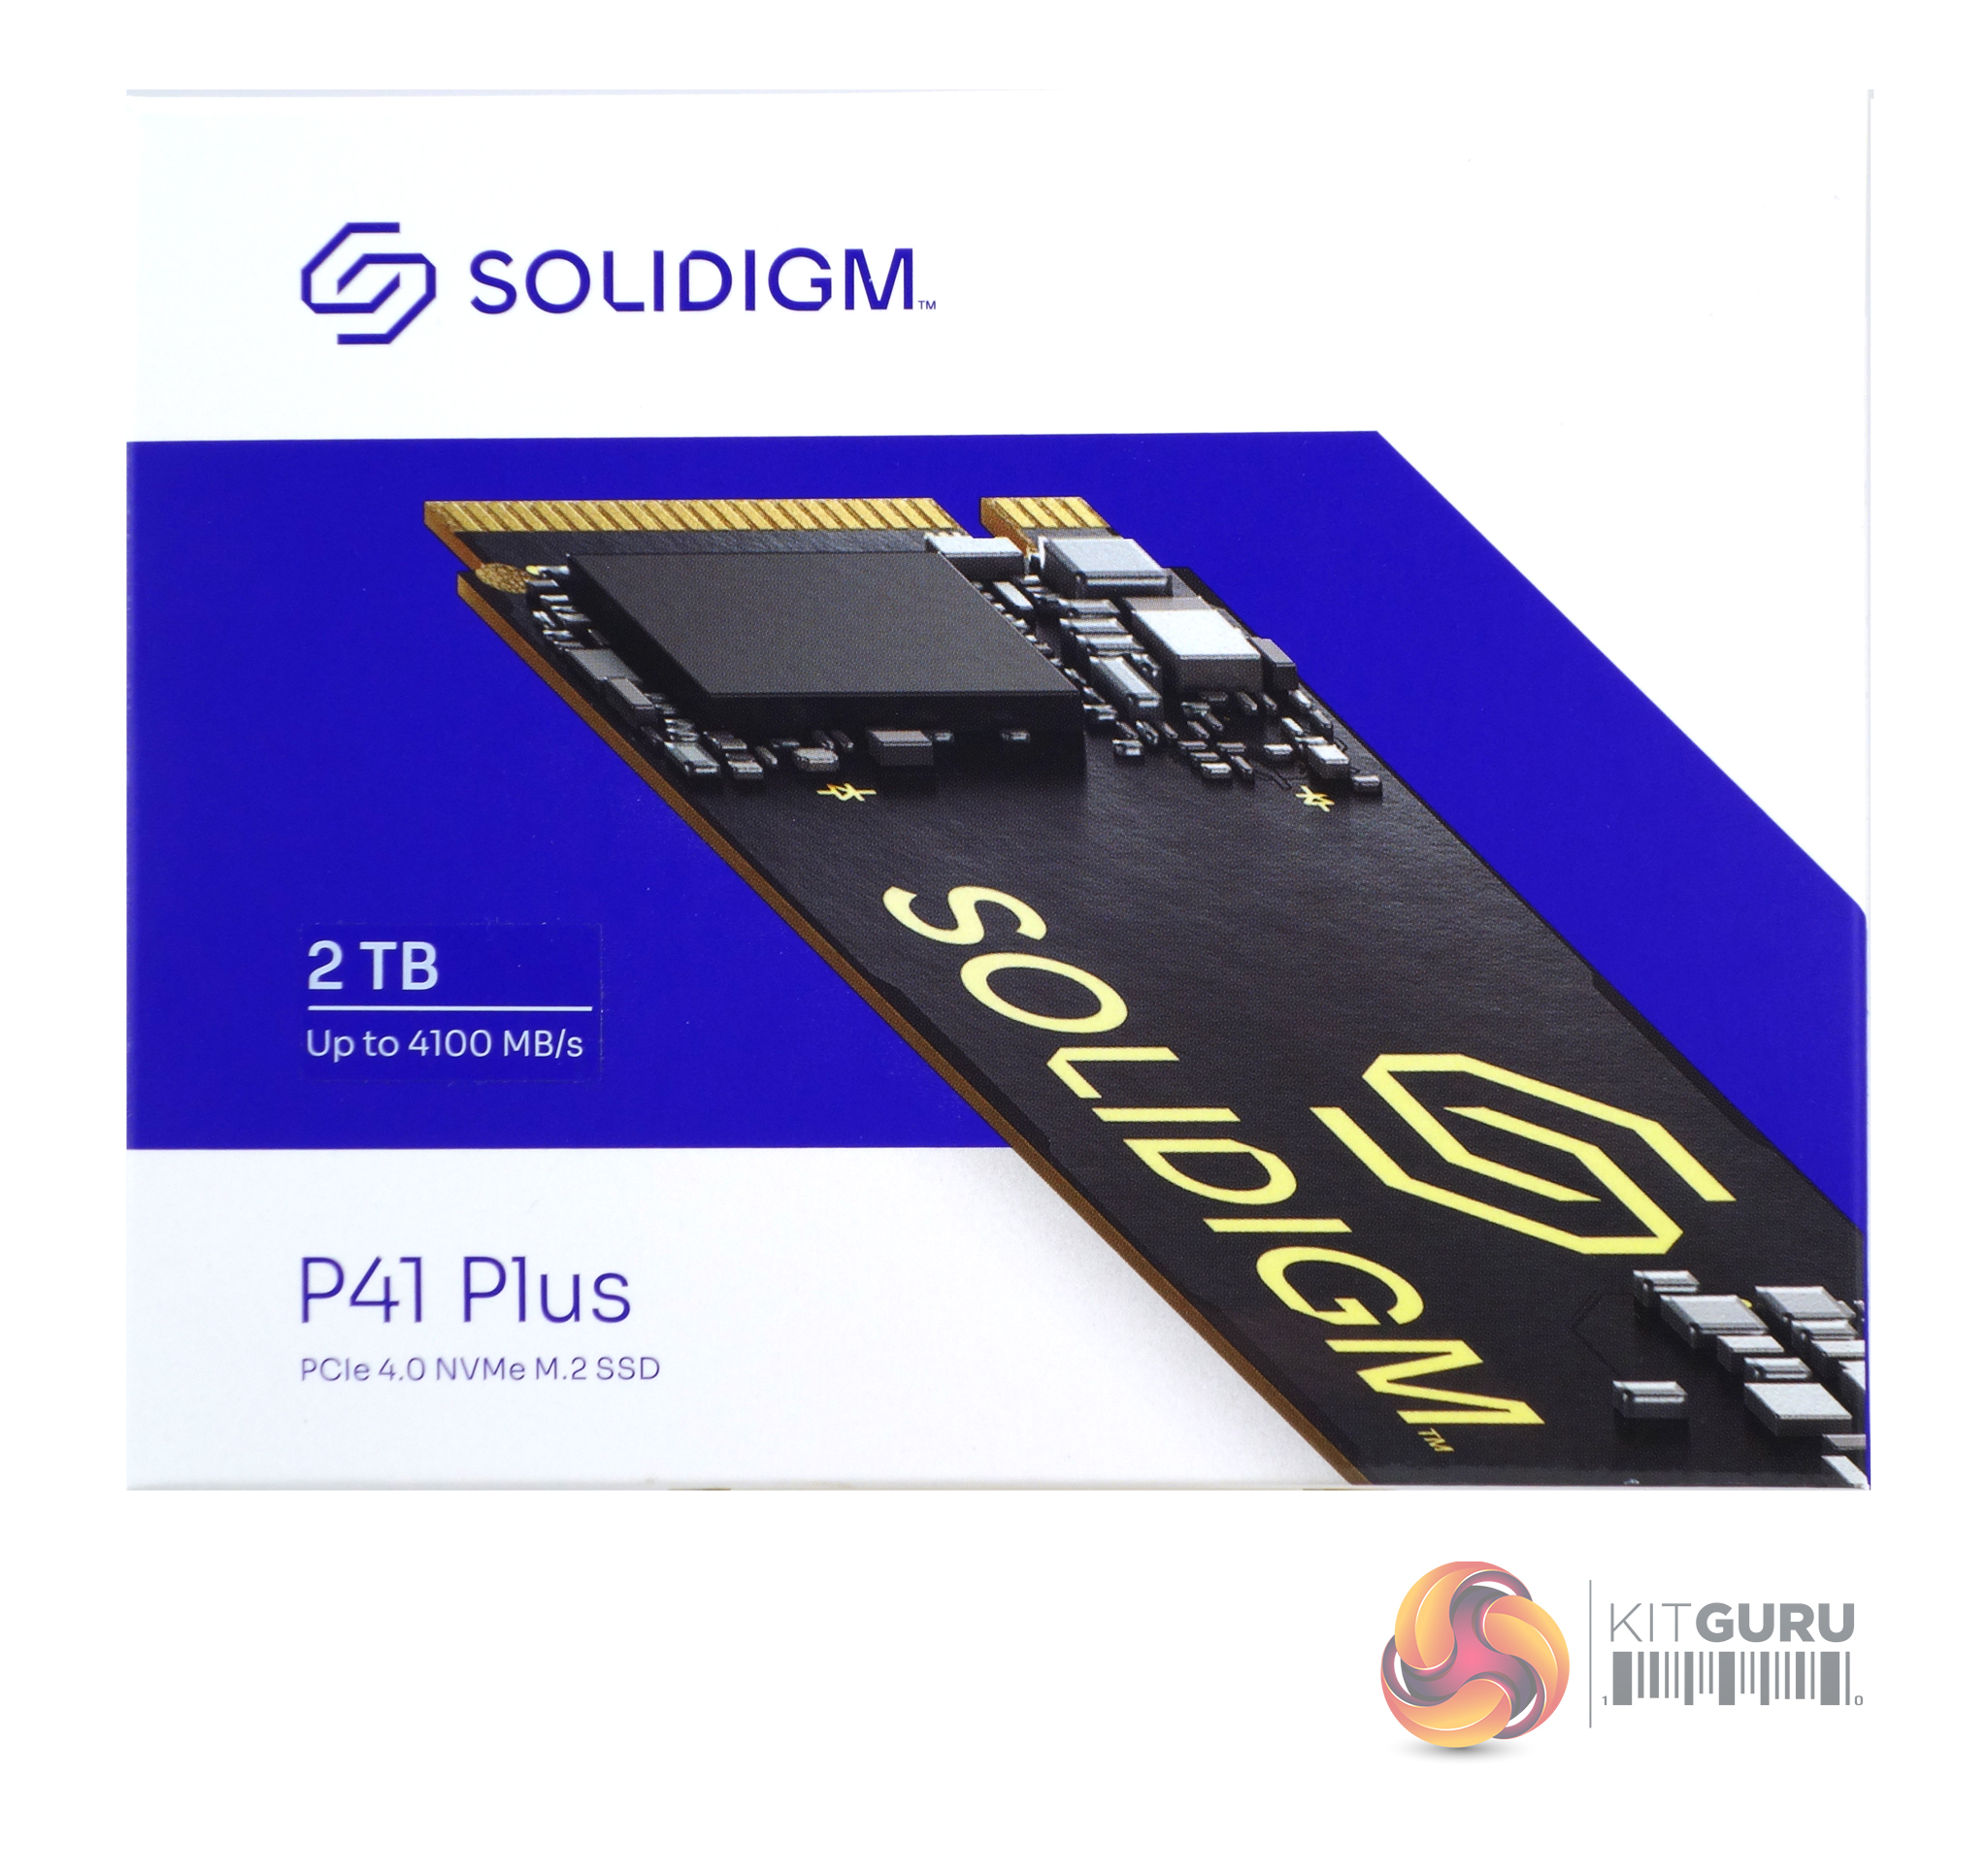
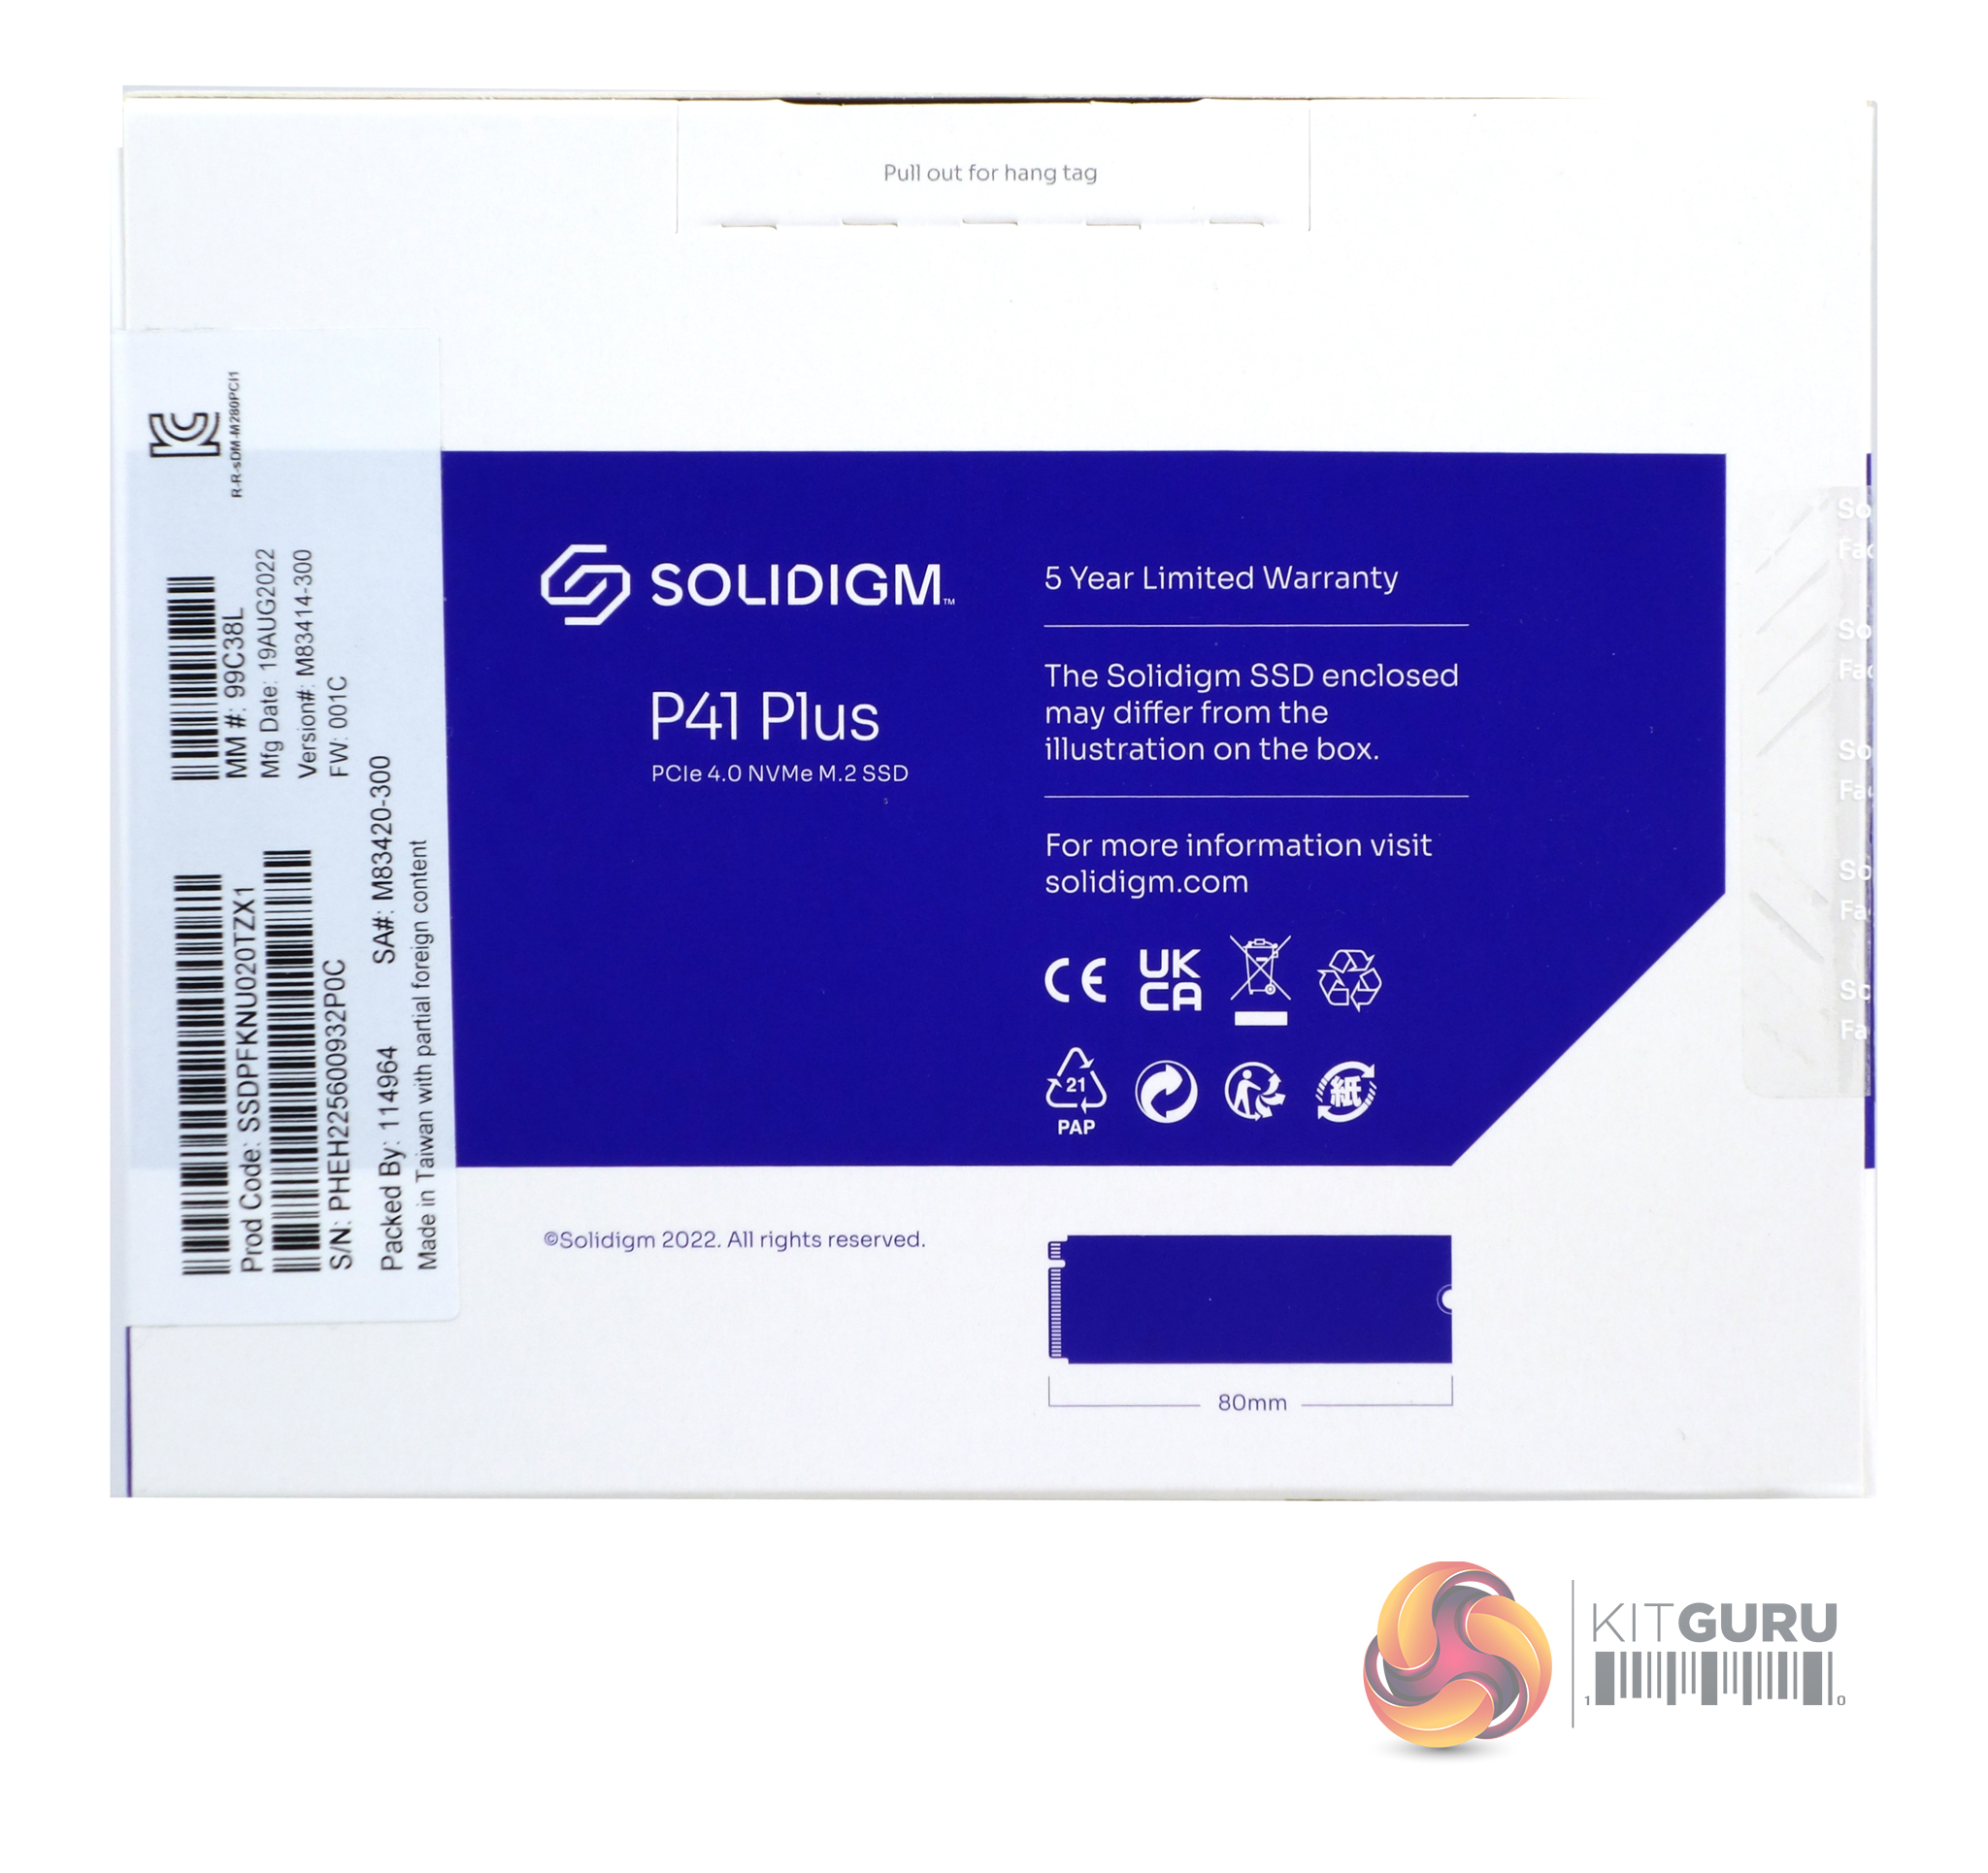
The Solidigm P41 Plus comes in a small but sturdy box with a close-up image of the drive on the front. To the left of the image is a sticker carrying the drive's size and its Sequential read speed rating (up to 4,100MB/s). On both the front and back of the box is a description of the format and architecture of the drive. Also on the back of the box is a statement that the drive has a 5-year warranty. Towards the bottom edge of the box, there is a small diagram showing the drive's length.

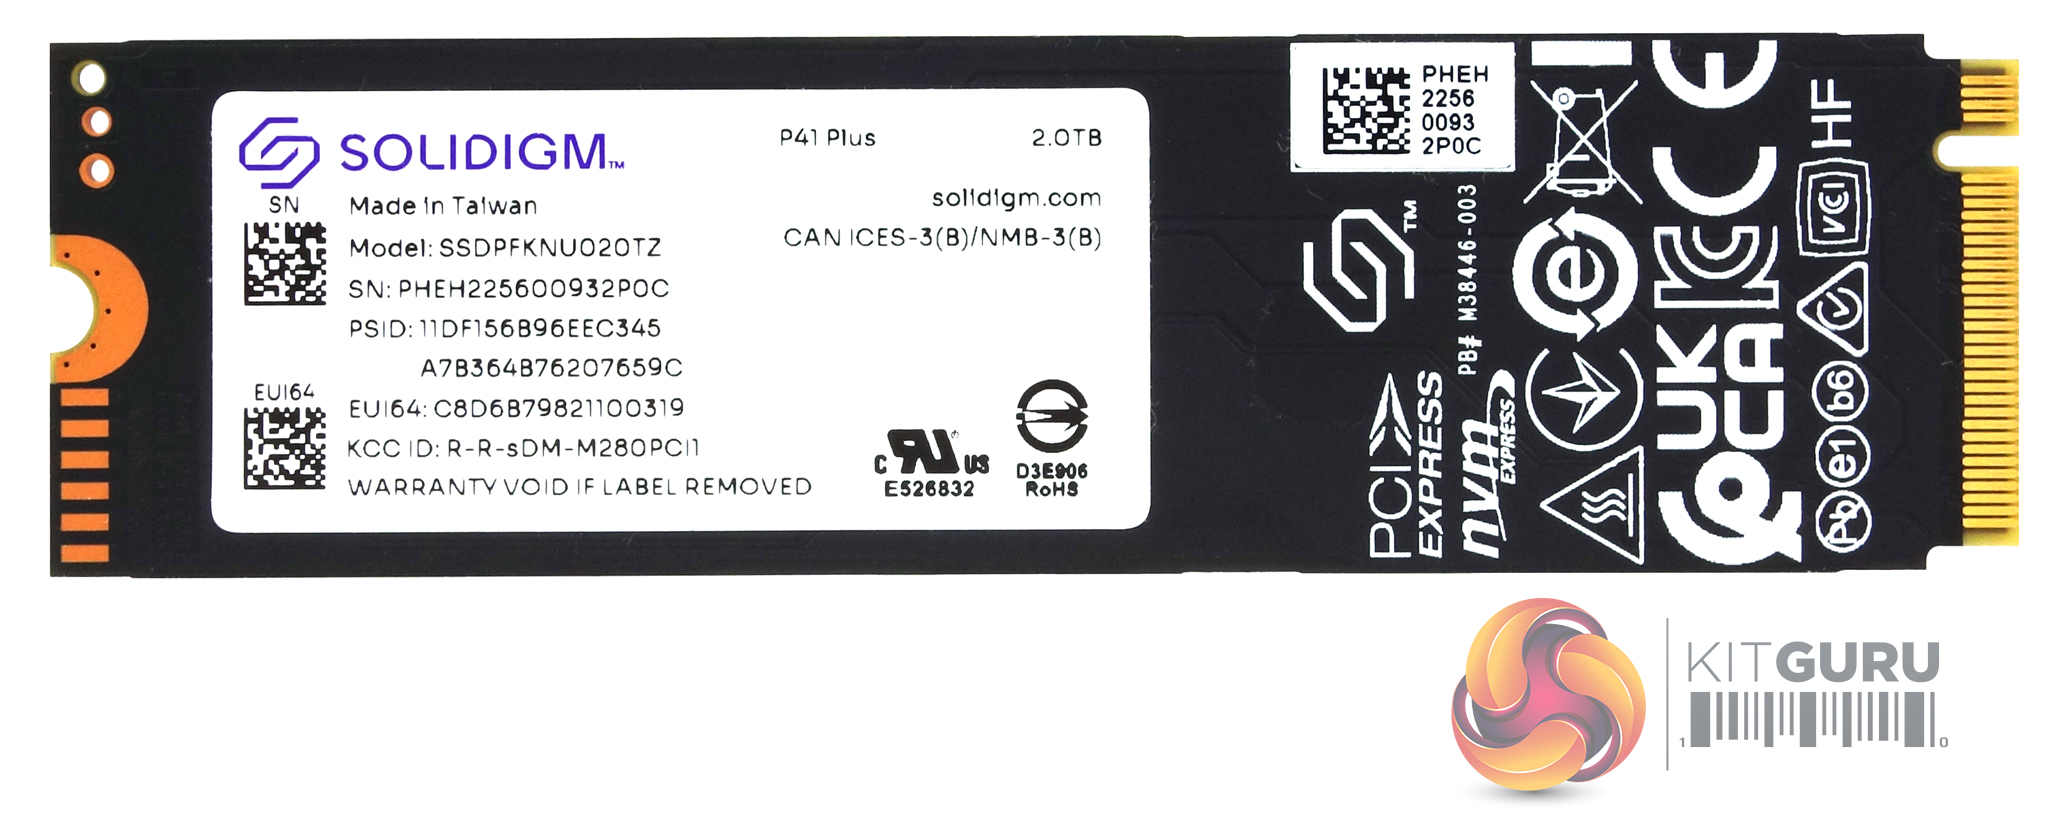
Solidigm's 2TB P41 Plus is built on a single-sided M.2 2280 format.
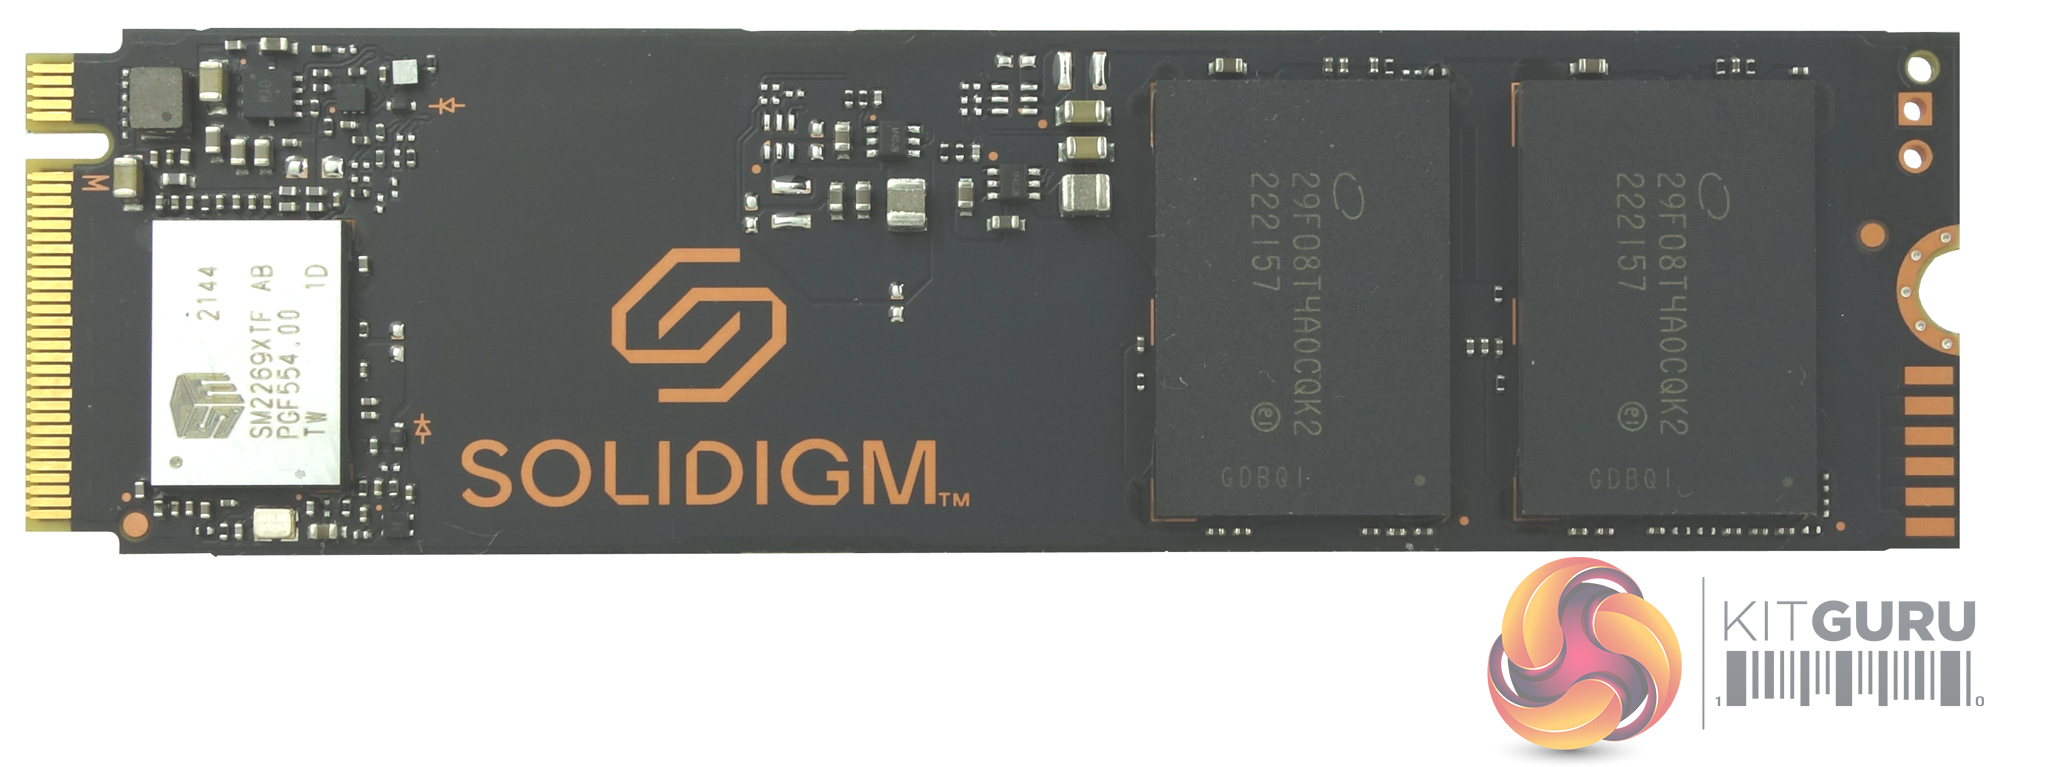
Under the product label on the front of the drive sits a 4-channel Silicon Motion SM2269XT controller which looks after a pair of 1TB packages of Solidigm 144-layer 3D QLC NAND. As the P41 Plus is a DRAM-less drive these are the only major components on the PCB. The SM2269XT is a compact (7.7 x 11mm package) DRAM-less design built on a 12nm process using a dual-core ARM R8 processor with 4 NAND channels running at 1,600 MT/s per channel. It supports 3D TLC and QLC NAND. The controller supports AES128/256 encryption and is TCG OPAL 2.0 compliant and uses the 7th generation of Silicon Motion's NANDXtend ECC technology.
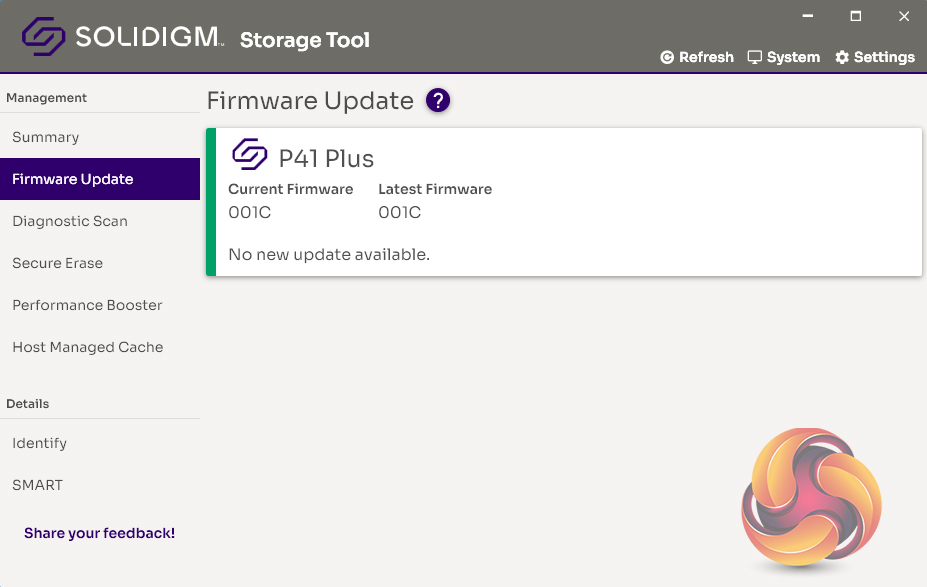
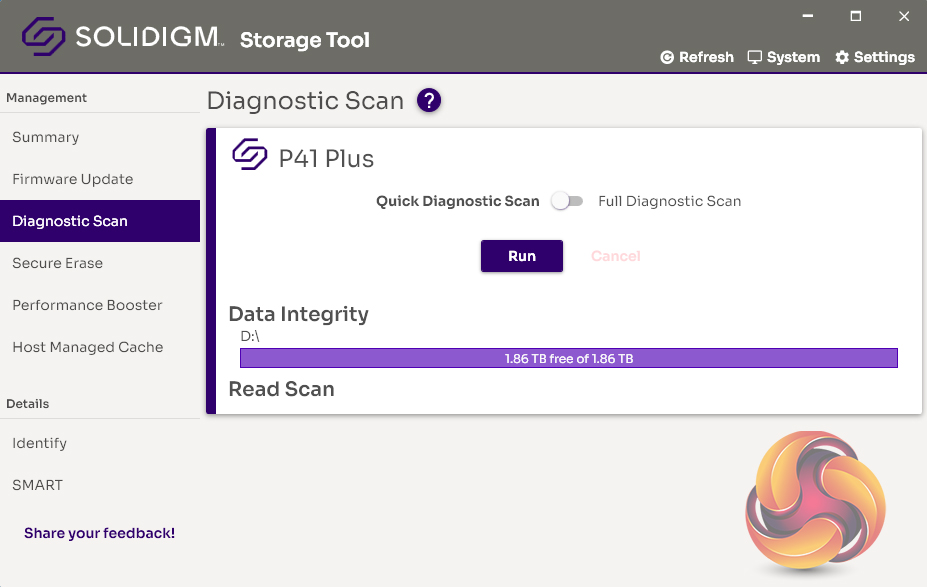
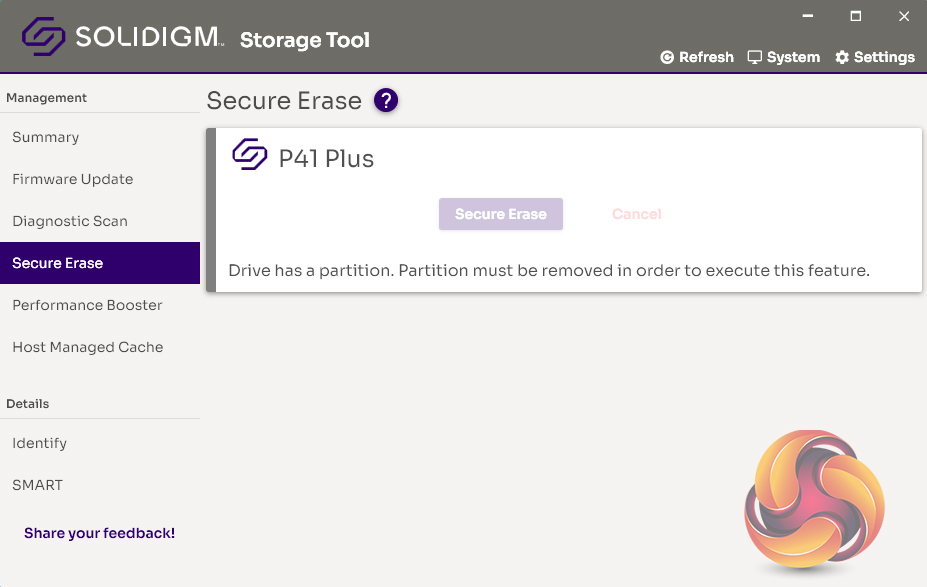
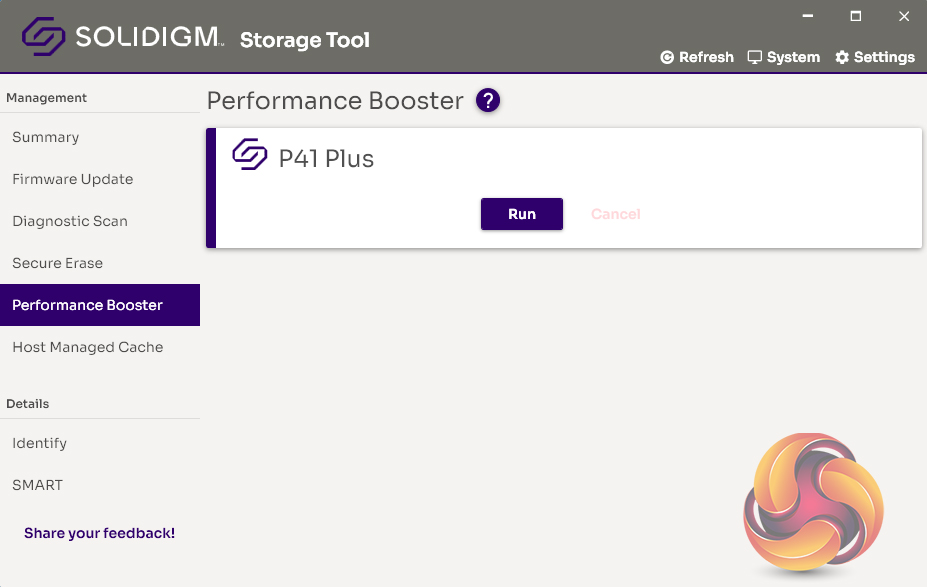
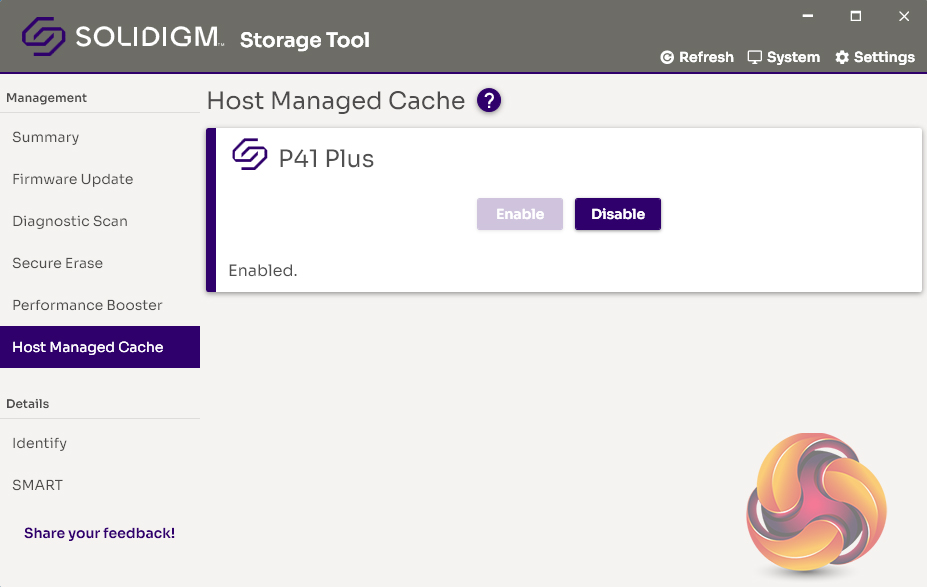
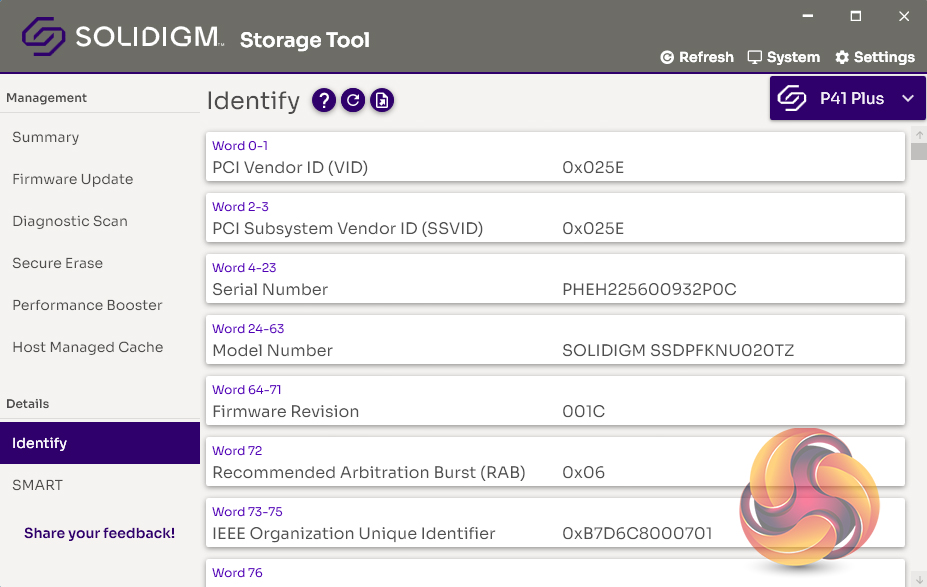
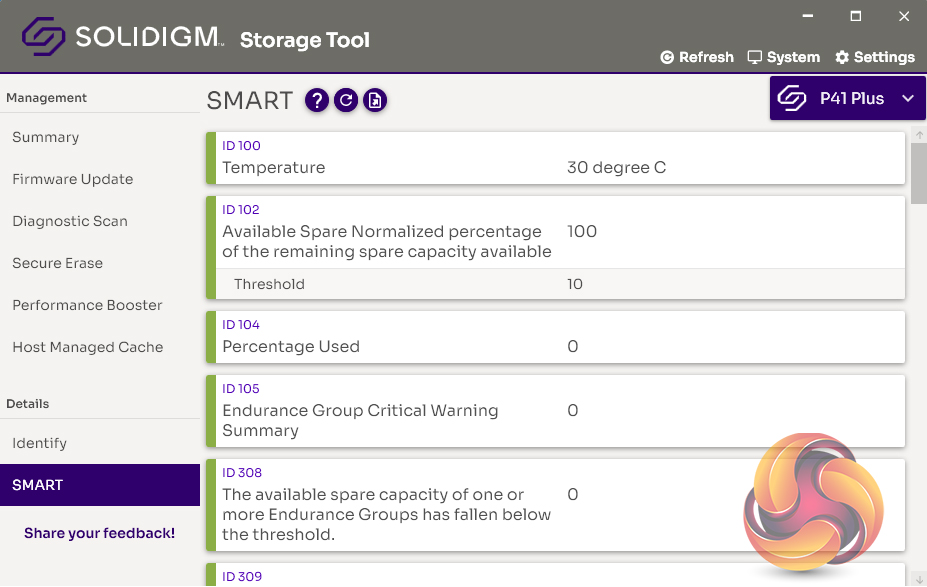
Solidigm's software utility goes by the name of the Solidigm Storage Tool. It doesn't have the flashy GUI of some of its competitors, but most of what you need to keep a drive in shape is there including; drive information, drive health, diagnostic scans, firmware updates and secure erase. It has two sections Management and Details.
Management
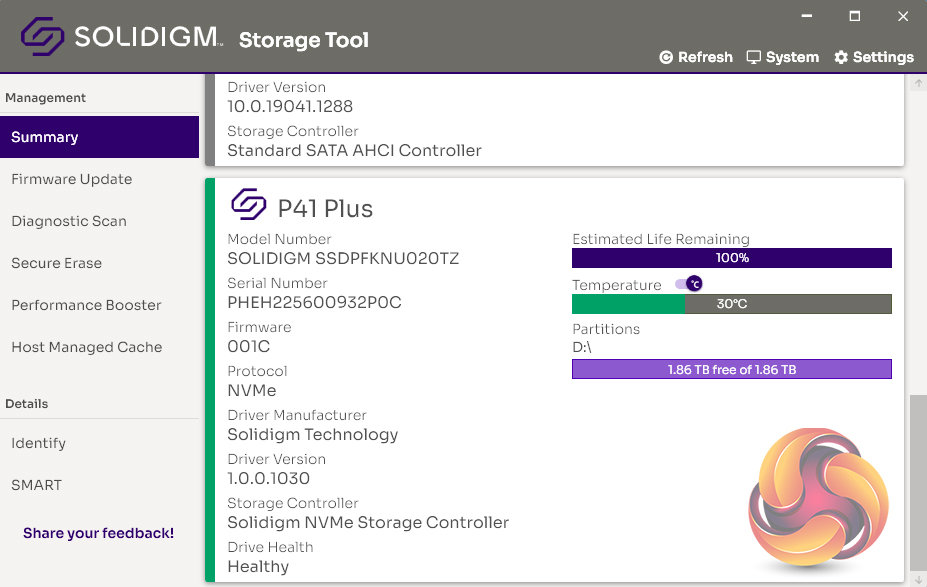
Details
For testing, the drives are all wiped and reset to factory settings by HDDerase V4. We try to use free or easily available programs and some real world testing so you can compare our findings against your own system.
This is a good way to measure potential upgrade benefits.
Main system:
AMD Ryzen 5 3600X, 16GB DDR4-2400, Sapphire R9 390 Nitro and an MSI MPG X570 Gaming Edge Wifi motherboard
Other drives: 2TB+ class
Corsair MP600 GS 2TB
Corsair MP600 PRO 2TB
Corsair MP600 PRO XT 2TB
Gigabyte AORUS 7000e 2TB
HP FX900 Pro 2TB
Kingston Fury Renegade Heatsink 2TB
Kingston KC3000 2TB
Kioxia Exceria Pro 2TB
Lexar Professional NM800PRO Heatsink 2TB
MSI Spatium M480 2TB
Patriot Viper VP4300 2TB
Sabrent Rocket 4 Plus 2TB
Sabrent Rocket 4 Plus 4TB
Samsung SSD990 PRO 2TB
Seagate FireCuda 530 2TB
WD Black SN850X Heatsink 2TB
Software:
Atto Disk Benchmark 4.
CrystalMark 8.0.0.
AS SSD 2.0.
IOMeter.
UL Solutions PC Mark 10.
UL Solutions 3DMark Storage Benchmark.
Final Fantasy XIV Endwalker Official Benchmark.
All our results were achieved by running each test five times with every configuration this ensures that any glitches are removed from the results. Trim is confirmed as running by typing fsutil behavior query disabledeletenotify into the command line. A response of disabledeletenotify =0 confirms TRIM is active.
CrystalDiskMark is a useful benchmark to measure the theoretical performance levels of hard drives and SSDs. We are using v8.0.
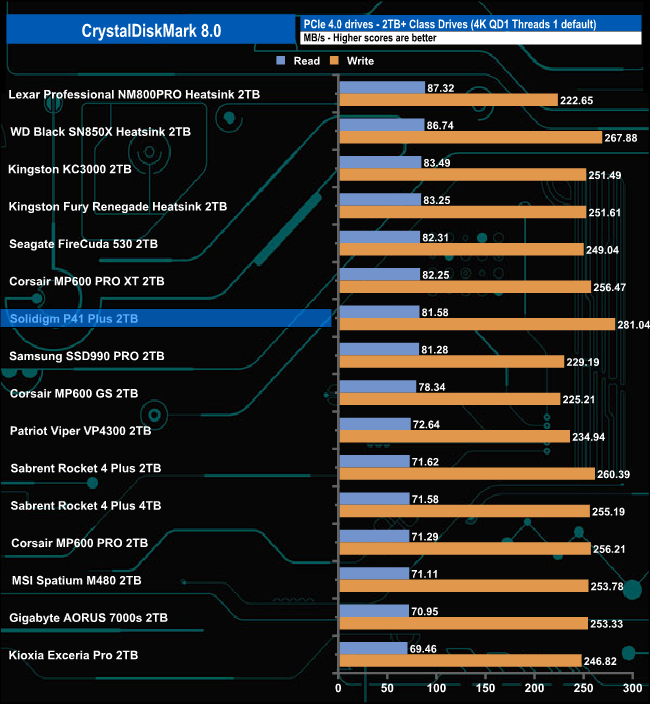
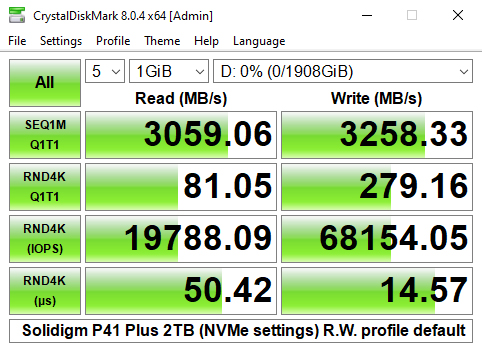
With a read score of 81.58MB/s for CrystalDiskMark 8's 4K QD1 test, Solidigm's P41 Plus sits inside the top 10 in our results chart. However, its write score of 281.04MB/s is the fastest we've seen to date for a consumer 2TB NVMe drive.
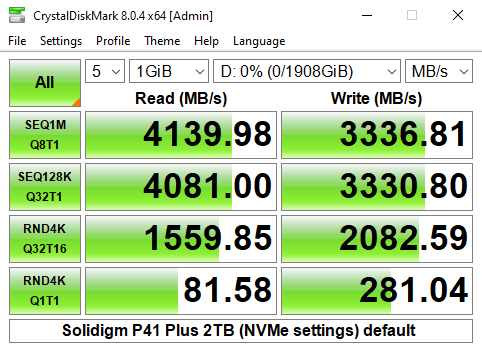
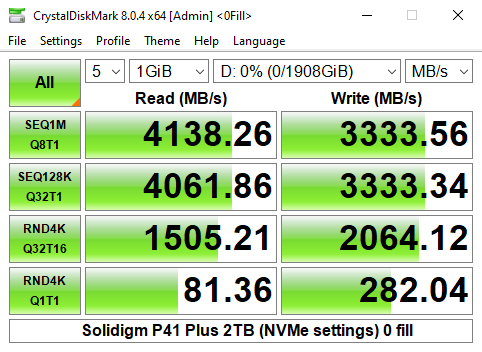
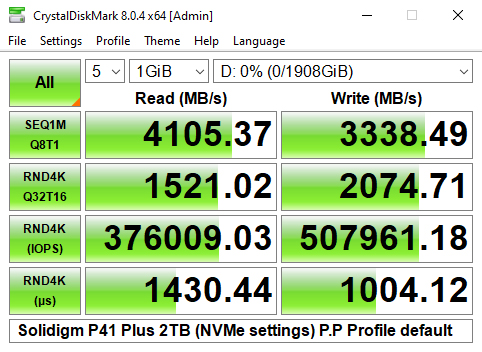
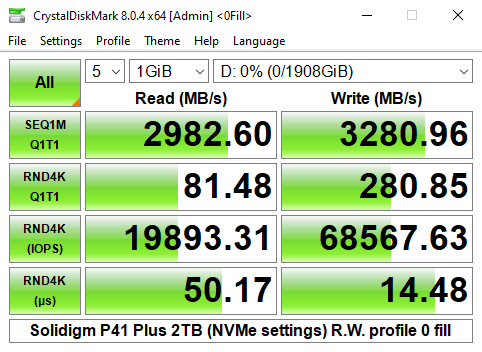
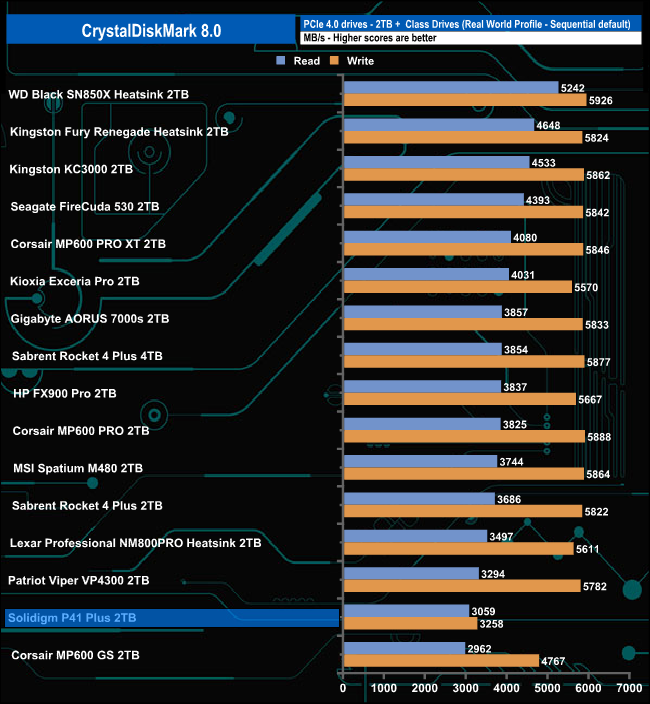
As you can see from the benchmark result screens we could confirm the official read/write figures of 4,125MB/s and 3,325MB/s respectively with a read result of 4,139MB/s with writes at 3,336MB/s.
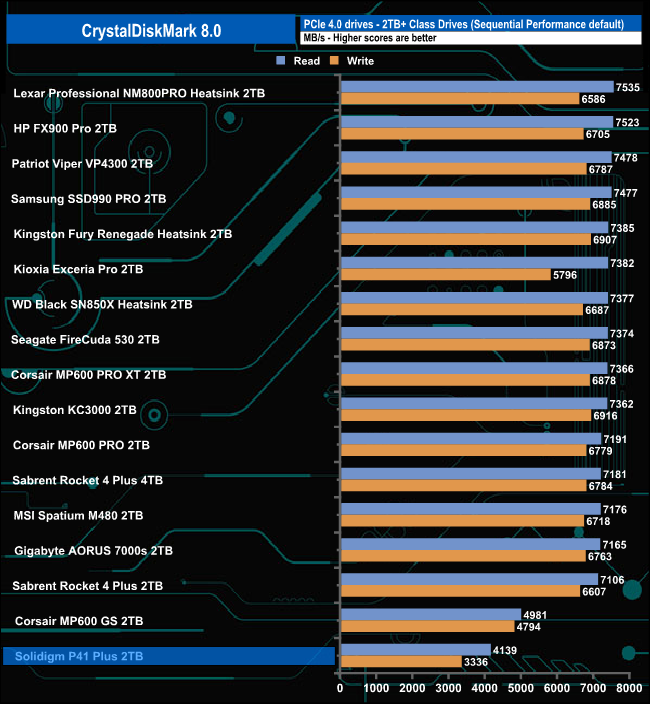
The P41 Plus 2TB drive sits in last place on our results chart as a result of its test results.
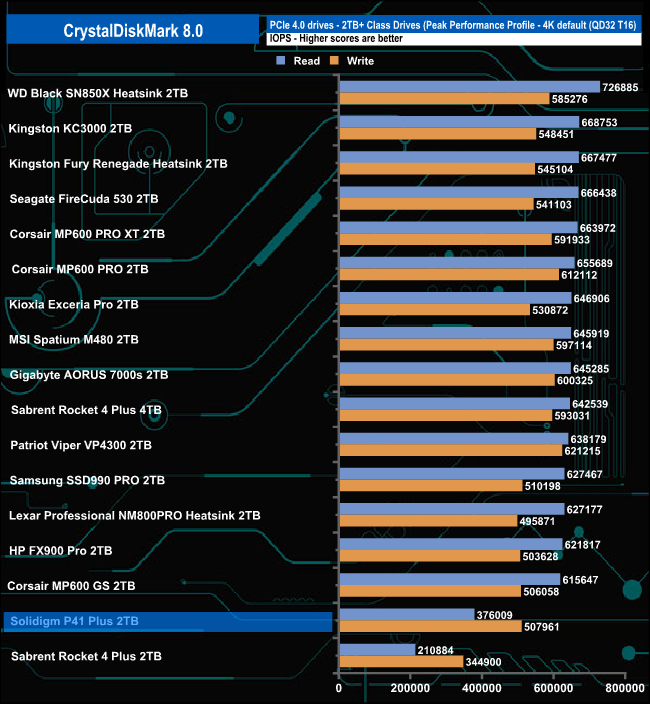
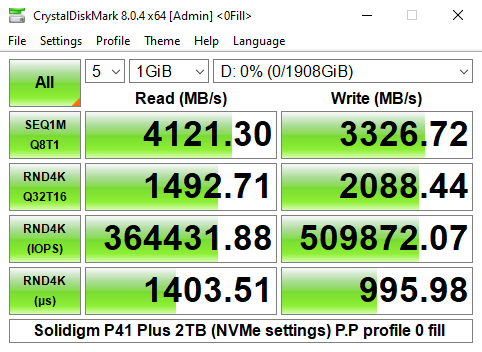
Using the Peak Performance profile of the CrystalDiskMark benchmark we came up short when testing the 4K read/write performance. The official random read / write ratings for the 2TB drive are up to 390.000 IOPS and up to 540,000 IOPS respectively. The best we saw from the drive when tested with the default settings was 376,009 IOPS for reads and 507,961 IOPS for writes.
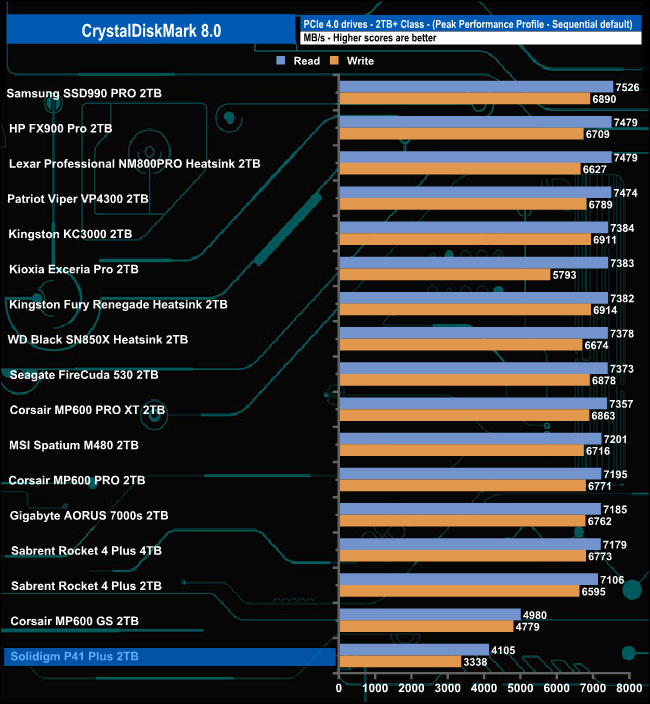
Using the Real World profile the drive produced Sequential read/write figures of 3.059MB/s and 3,258MB/s respectively, short of the official maximum for reads (4,125MB/s) but on the mark when it came to writes (3,325MB/s).
The ATTO Disk Benchmark performance measurement tool is compatible with Microsoft Windows. Measure your storage systems performance with various transfer sizes and test lengths for reads and writes. Several options are available to customize your performance measurement including queue depth, overlapped I/O and even a comparison mode with the option to run continuously. Use ATTO Disk Benchmark to test any manufacturer's RAID controllers, storage controllers, host adapters, hard drives and SSD drives and notice that ATTO products will consistently provide the highest level of performance to your storage.
We are using version 4.1 for our NVMe disk tests.
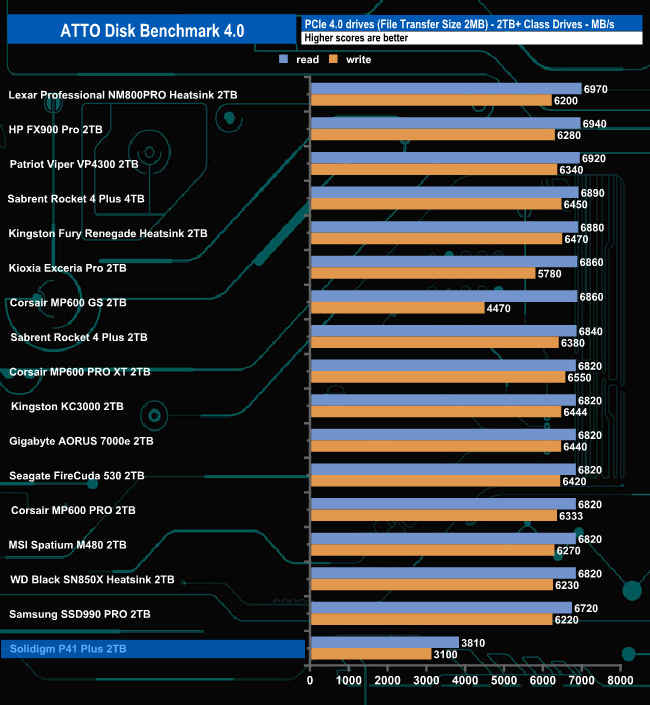
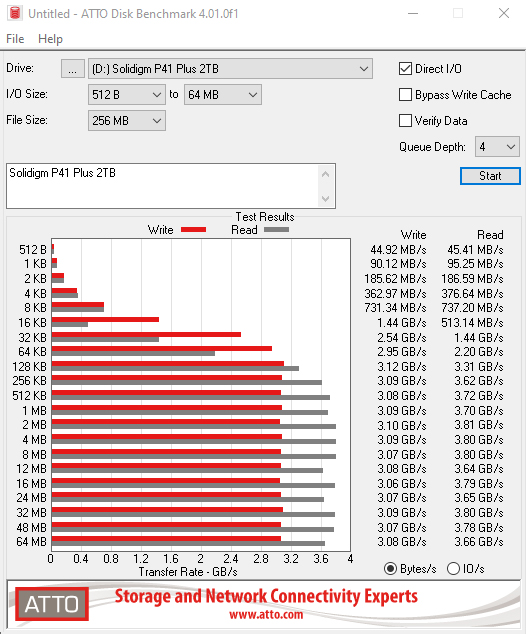
Officially the 2TB P41 Plus is rated as up to 4,125MB/s and 3,325MB/s for Sequential reads and writes respectively. Using the ATTO benchmark, we couldn't match the official figures for either, with a read result of 3,810MB/s and writes at 3,100MB/s.
AS SSD is a great free tool designed just for benching Solid State Drives. It performs an array of sequential read-and-write tests, as well as random read-and-write tests with sequential access times over a portion of the drive. It uses
incompressible data samples which many drives struggle with, so results can be viewed as the worst-case scenarios.
AS SSD includes a sub suite of benchmarks with various file pattern algorithms but this is difficult in trying to judge accurate performance figures.
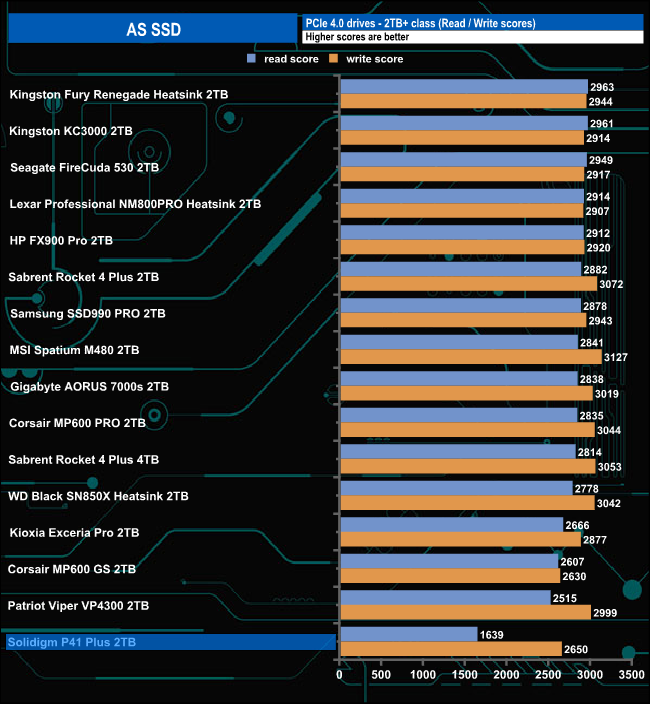
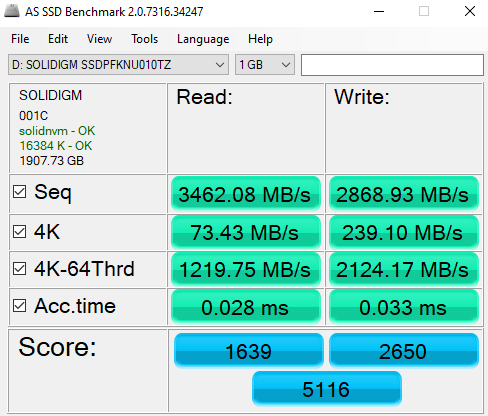
The Solidigm P41 Plus AS-SSD read score of 1639 sees the drive at the foot of the results table, however, its write score is much, much stronger at 2650.
We used CrystalDiskMark 8‘s custom settings to test the Sequential read and write performance of the drive through a range of queue depths. The setup for the tests is listed below.
128KB Sequential Read / Write.
Transfer Request Size: 128KB, Thread(s): 1, Outstanding I/O: 1-32.
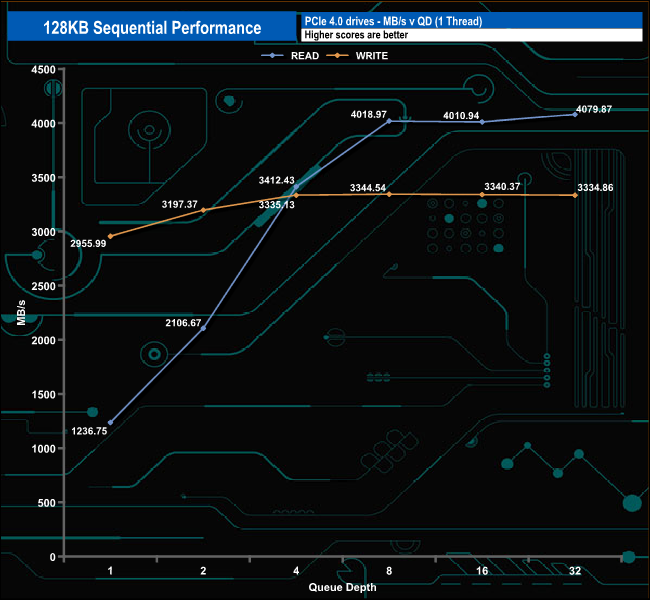
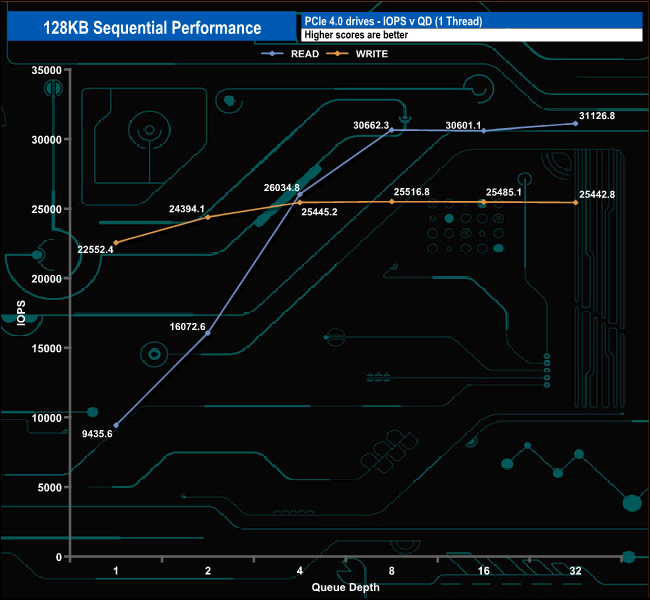
At 4,079MB/s, the Sequential read result is a little shy of the official 4,125MB/s but the best write result of 3,344MB/s (QD8) is a tiny bit better than the official 3,325MB/s. The rate of read performance increase slows down by QD8 but rises up a little at QD32. By comparison, the write performance starts to level off at QD4 and stays pretty consistent until the end of the test run at QD32.
128KB Sequential Read v QD compared.
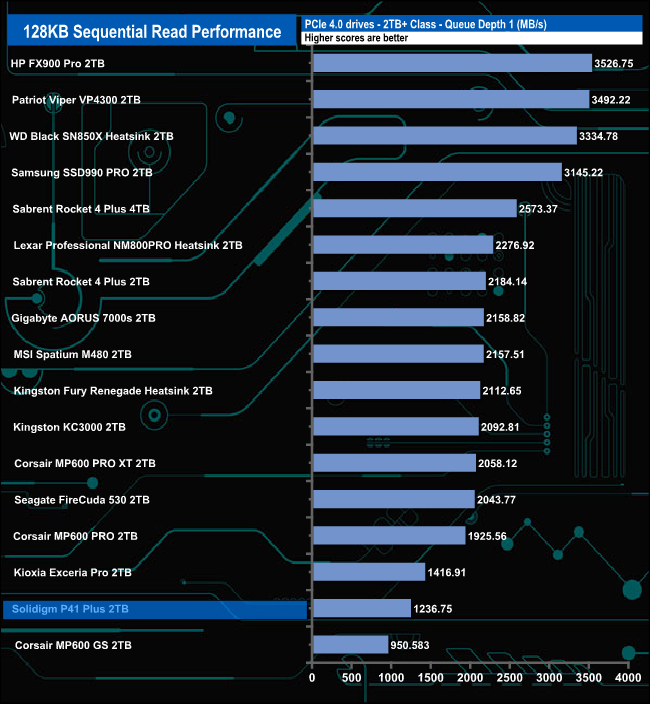
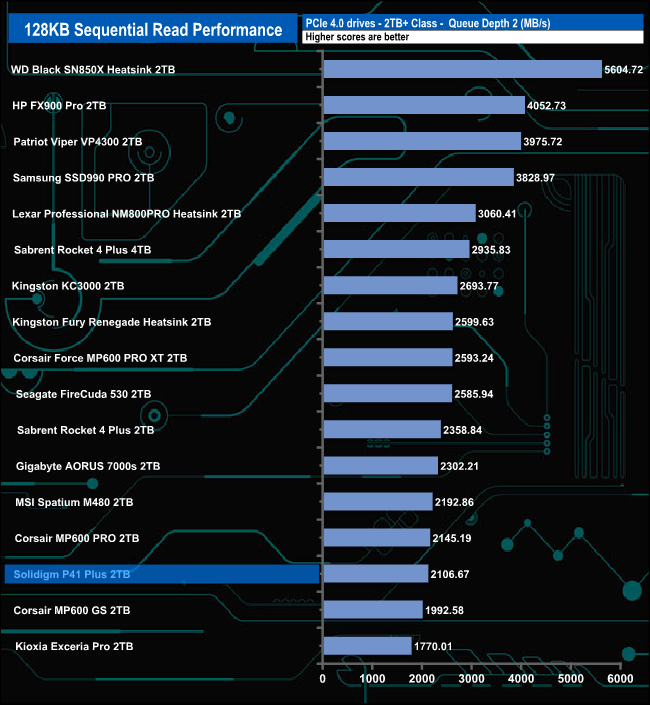
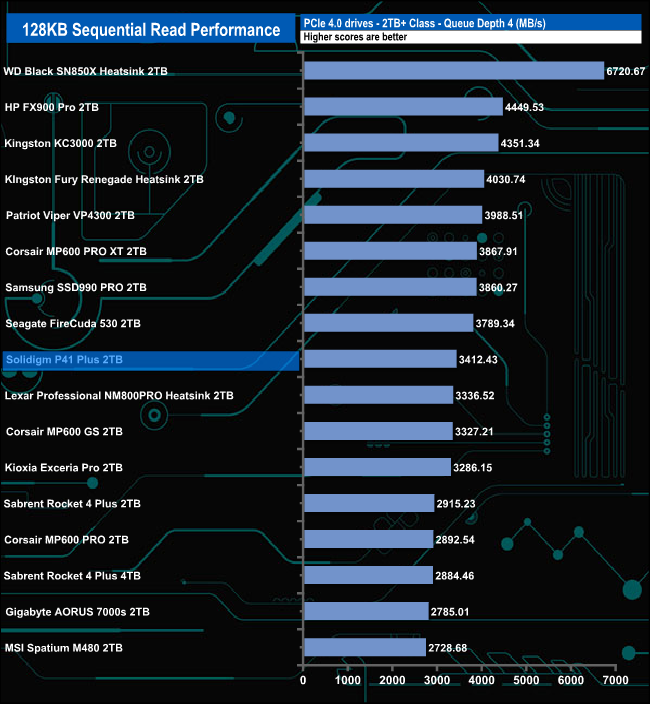
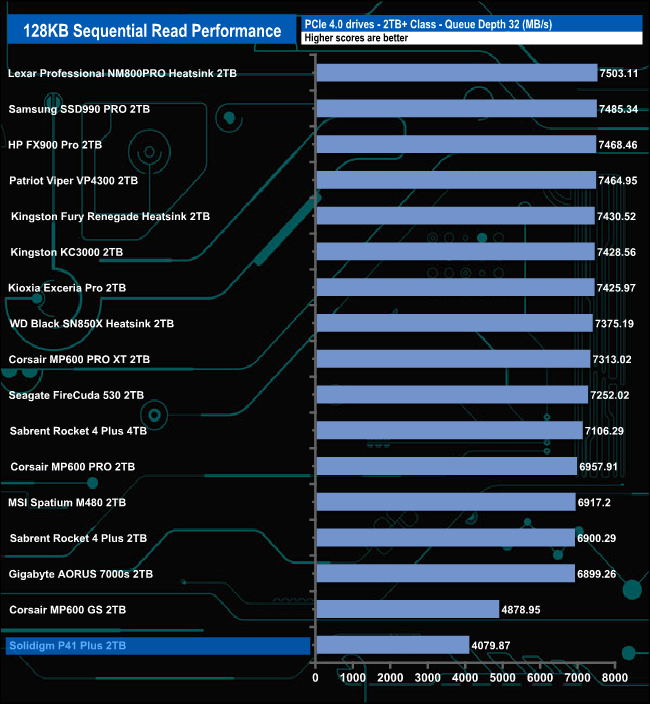
The 2TB P41 Plus seems to perform best at QD4 where it sits mid-table. At all other tested queue depths it's either bottom of the table or very close to it.
128KB Sequential Write v QD compared.
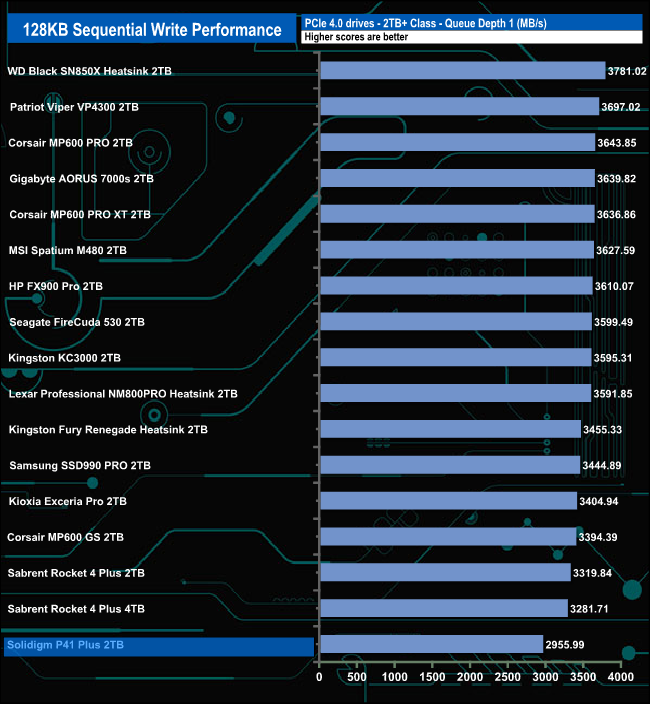

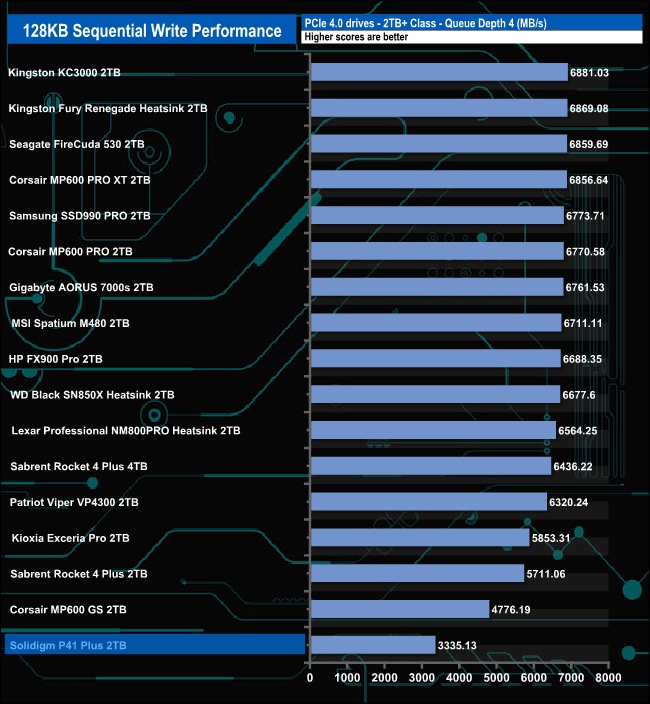
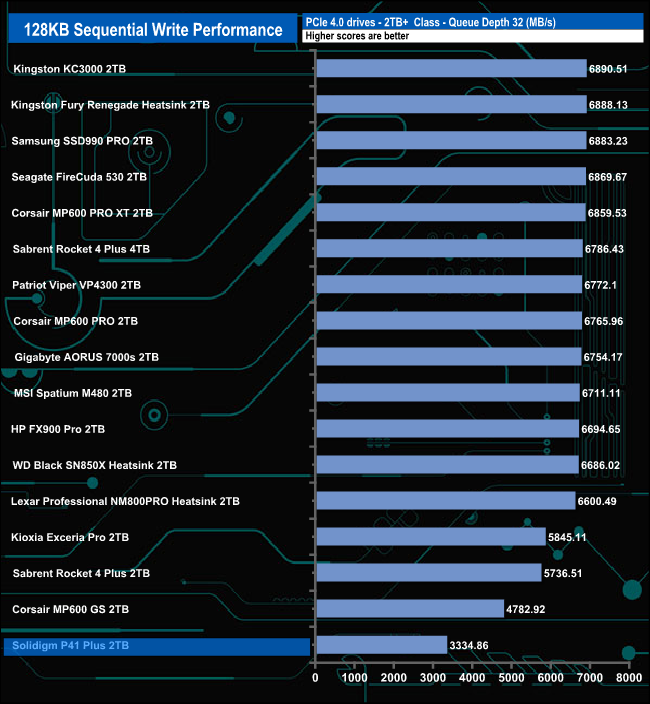
The 2TB P41 Plus sits very firmly in the bottom part of our results charts throughout the tested queue depths.
We used CrystalDiskMark 8‘s custom settings to test the drive's 4K random read performance through a range of queue depths. The setup for the tests is listed below.
Transfer Request Size: 4KB, Outstanding I/O: 1-32.
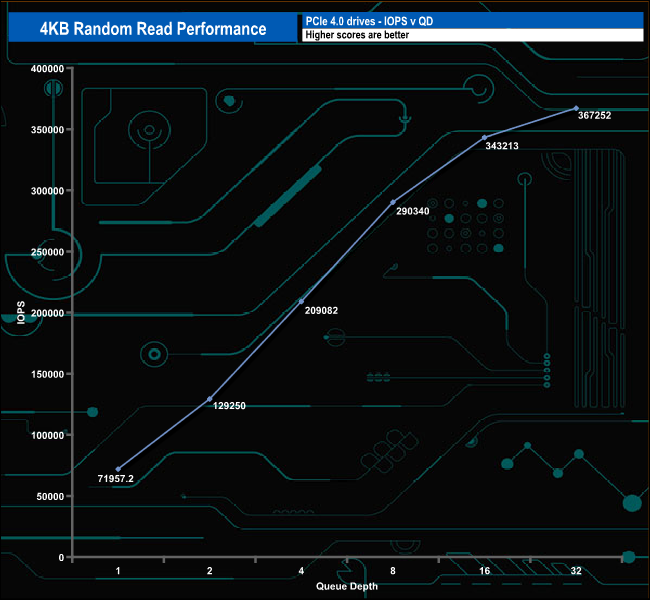
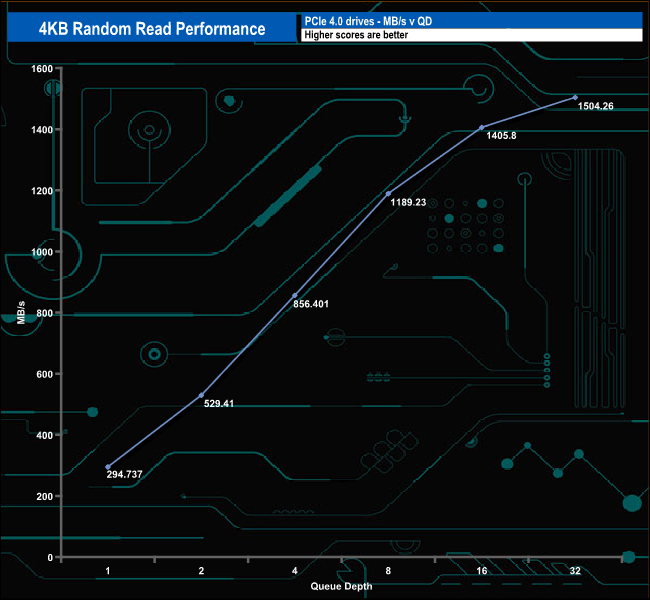
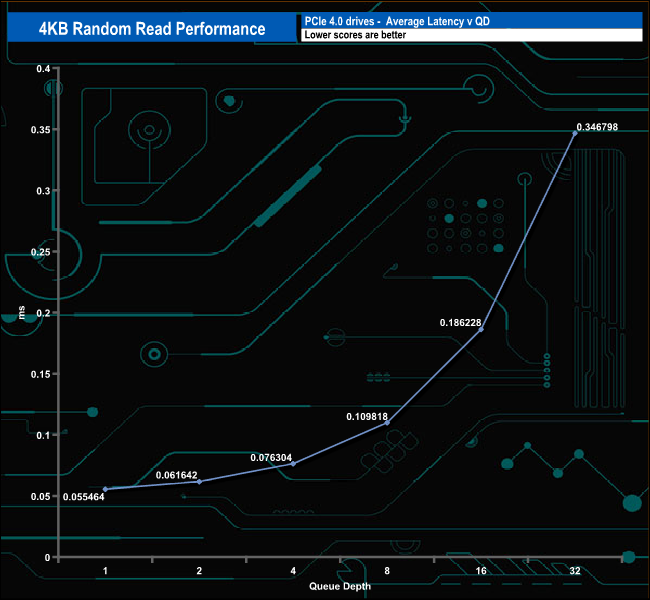
In our 4K random read tests, we couldn't quite reach the maximum official rating of 390.000 IOPS with a test result of 367,752 IOPS (1,504.26MB/s) at QD32.
4K Random Read v QD Performance
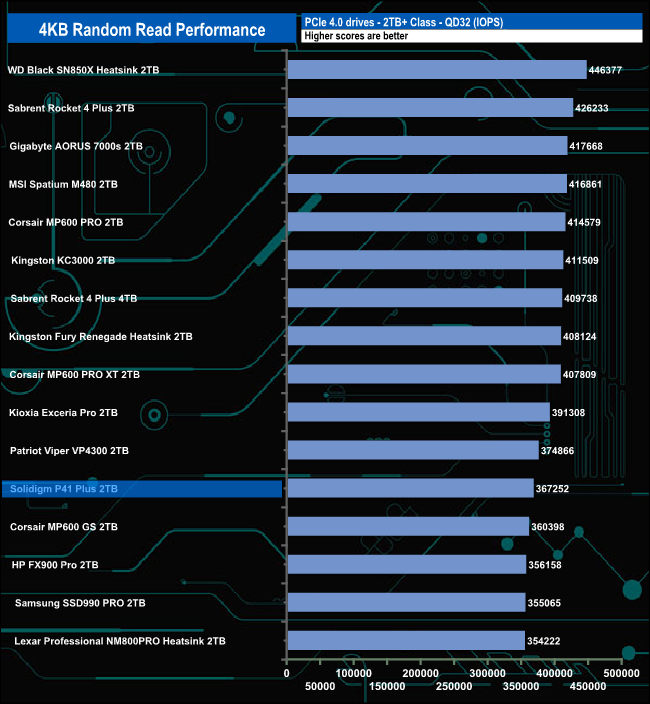
At QD1 the P41 Plus sits in the top 10 of the results chart but as the tested queue depth deepens the drive drops down the chart until at QD32 it sits in the bottom section of the results chart.
We used CrystalDiskMark 8‘s custom settings to test the drive's 4K random write performance through a range of queue depths. The setup for the tests is listed below.
Transfer Request Size: 4KB, Outstanding I/O: 1-32.
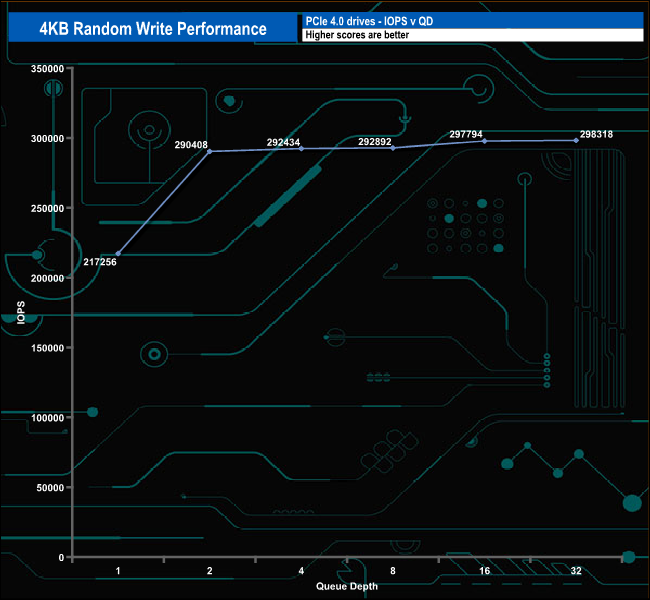
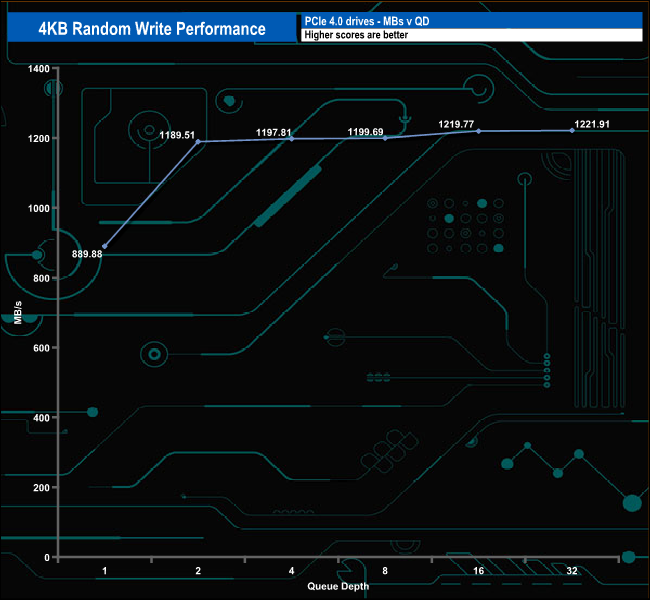
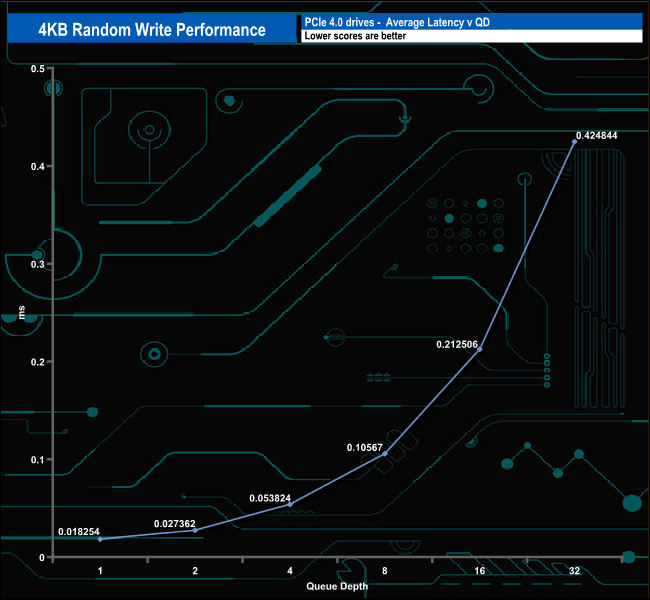
The best random write figure we saw in our 4-threaded random write test was 298,318 IOPS (1,221.91MB/s) at QD32 which is way off the official maximum figure of 540,000 IOPS.
4K Random Write v QD Performance
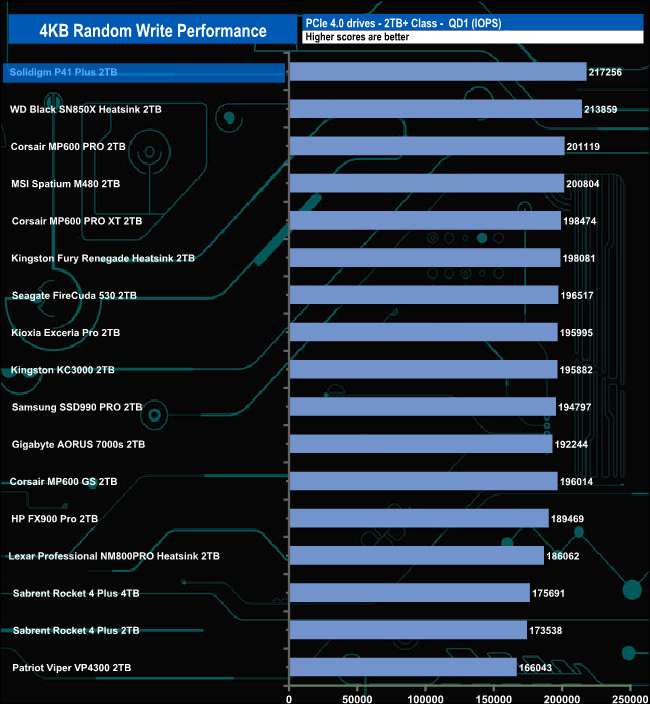
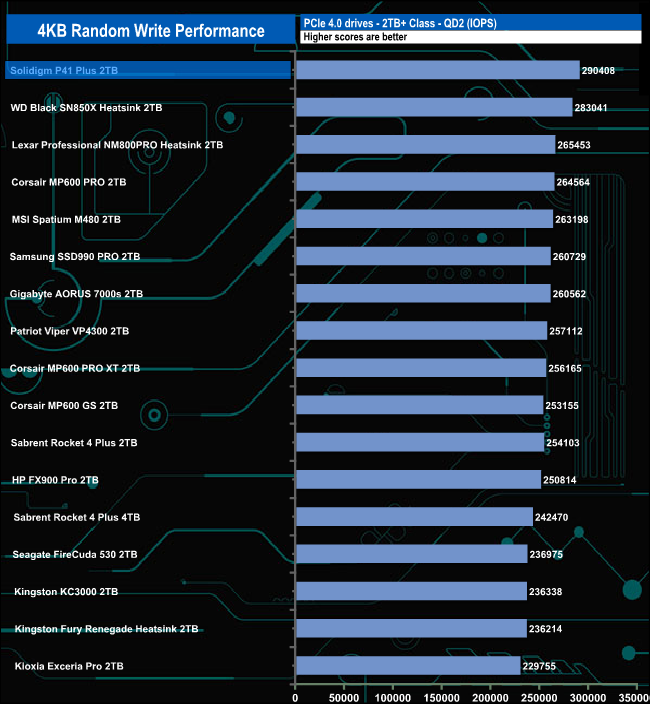
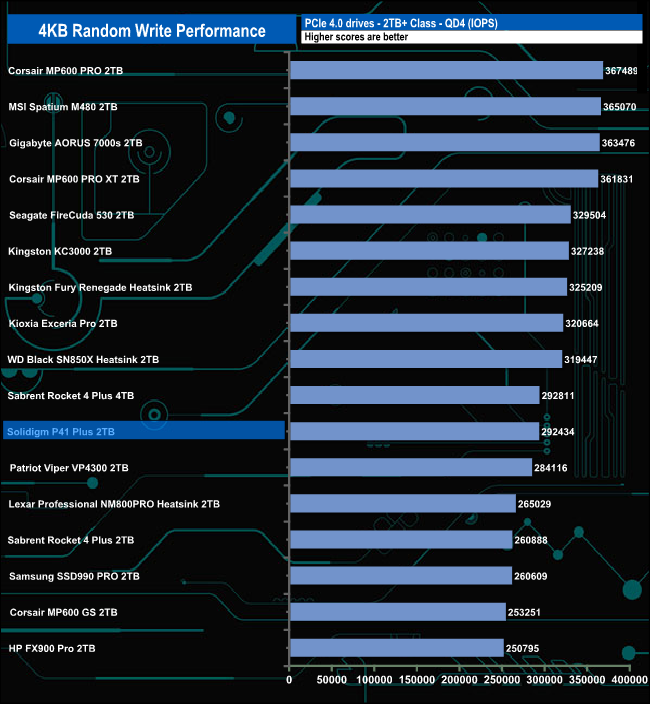
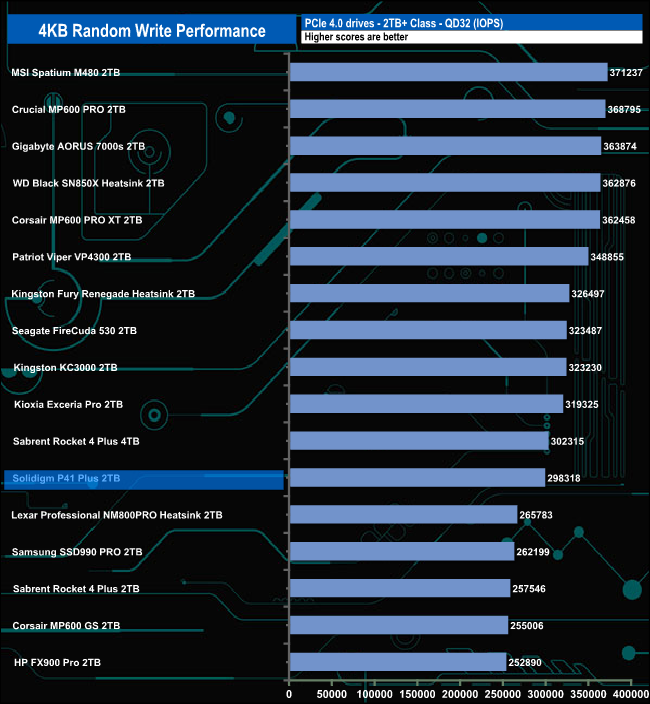
While we couldn't get close to the maximum quoted figure for 4K random writes with our testing, at QD's 1 and 2, the 2TB P41 Plus is the fastest 2TB consumer drive we've seen to date, but as the queue depth deepens past QD2, the drive slips down the result charts.
We used CrystalDiskMark 8’s custom settings to test the drive's 4K 70/30 mixed read/write performance through a range of queue depths using a single thread and four threads.
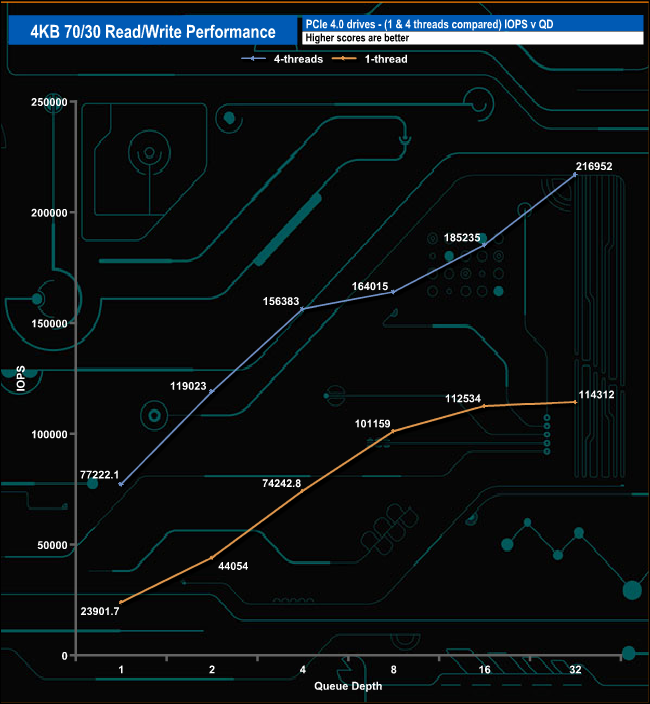
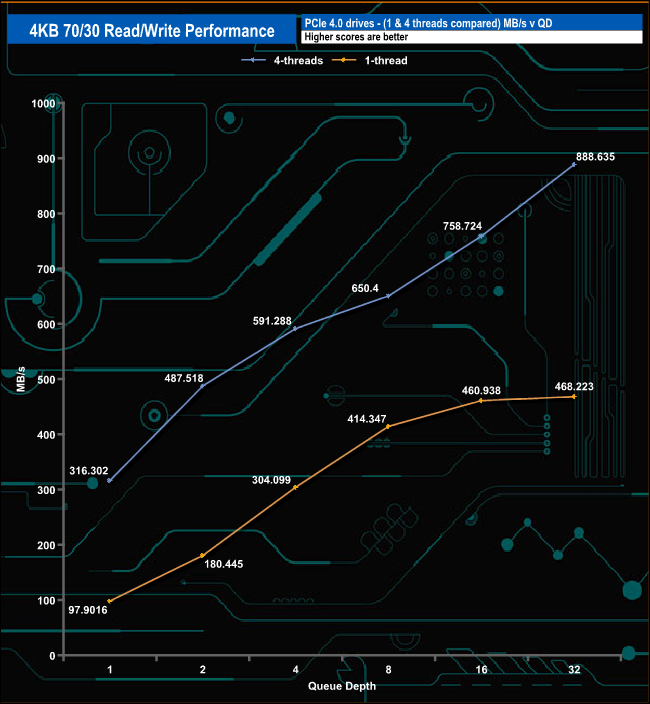
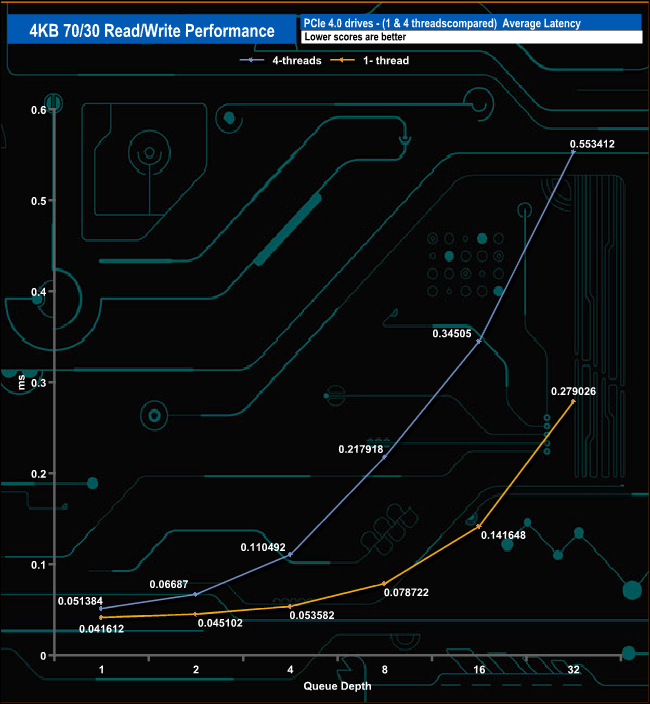
Using a single thread, the P41 Plus's performance climbs in a fairly smooth curve from 23,901 IOPS (97MB/s) at QD1 up to 114,312 IOPS (468MB/s) at QD32. Using four threads the performance seems to ever so slightly slow down from QD4 through to QD8 before recovering to finish the test run at QD32 at 216,952 IOPS (888MB/s).
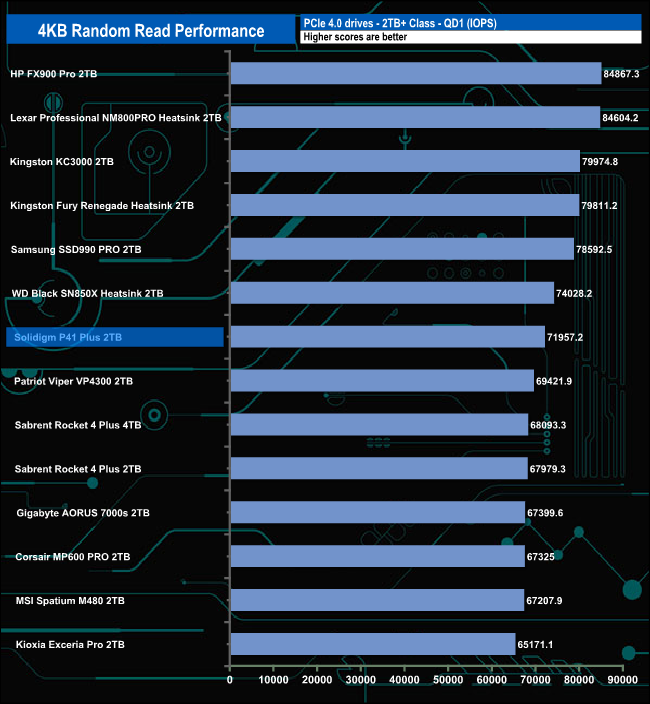
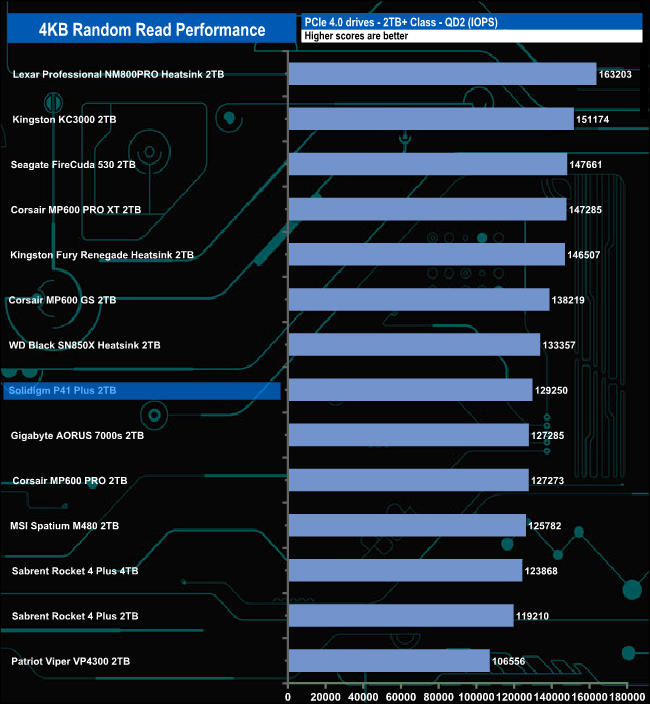
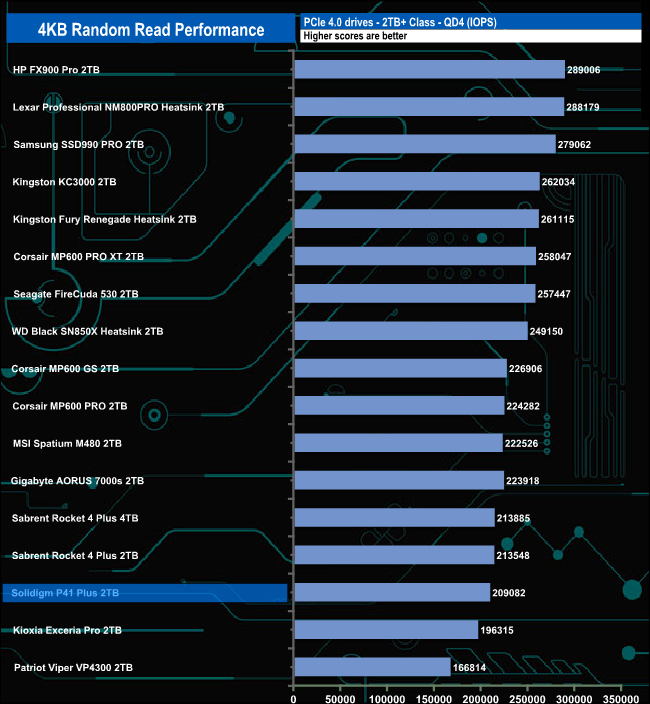
We used CrystalDiskMark 8 to test the random performance of the drive at lower queue depths (QD1 – QD8 where most of the everyday workloads occur) using 1 to 4 threads.
Random Read
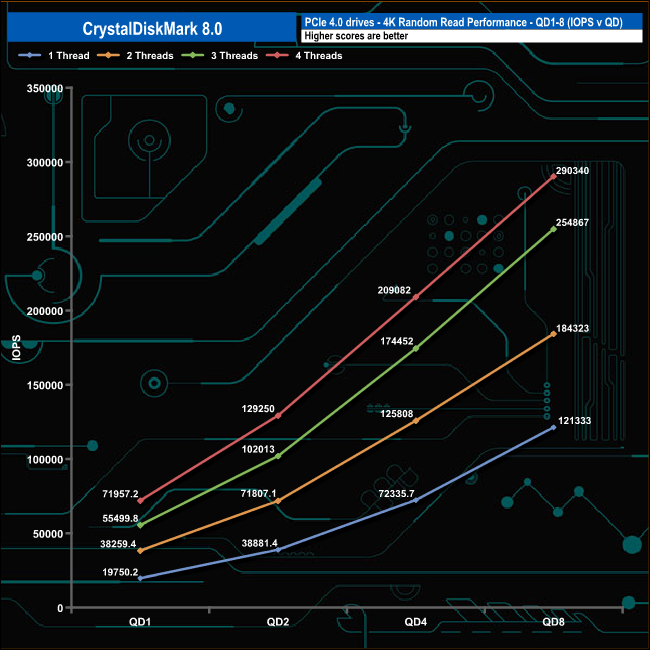
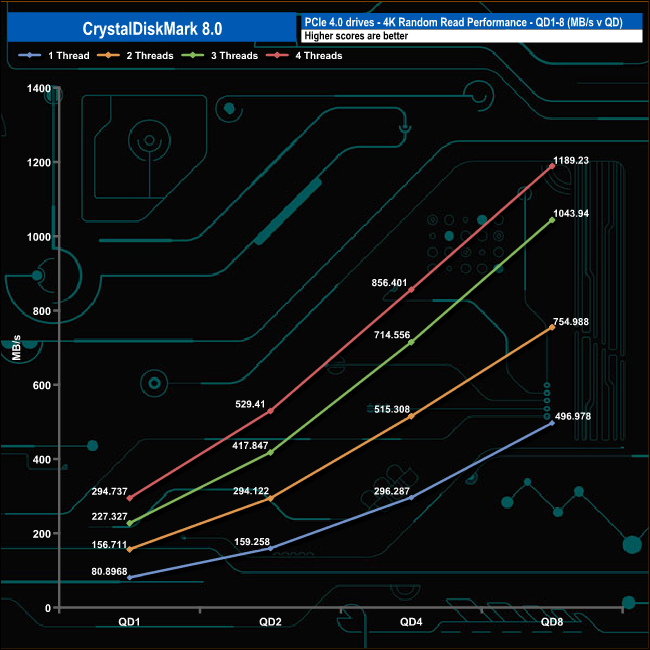
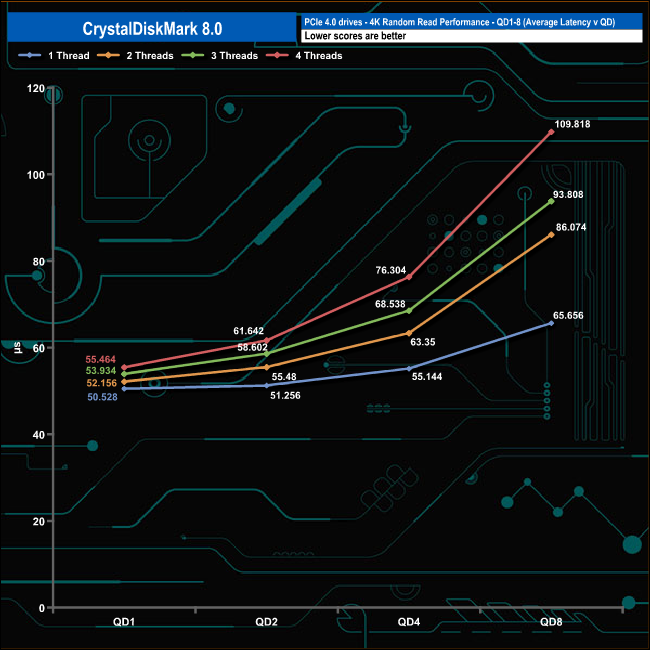
In our lower queue depth, 4K random read tests there are no unexpected shocks as the performance smoothly increases as the queue depth deepens for each tested thread. At QD1 the performance ranged from a low point of 19,720 IOPS (80.89MB/s) for a single thread up to 71,957 IOPS (294MB/s) for four threads. At QD8 a single thread produced 121.333 IOPS (496MB/s), two threads 184,323 IOPS (754MB/s), three threads 254,487 IOPs (1,043MB/s) and finally with four threads, 290,340 IOPS (1,189MB/s).
Random Write
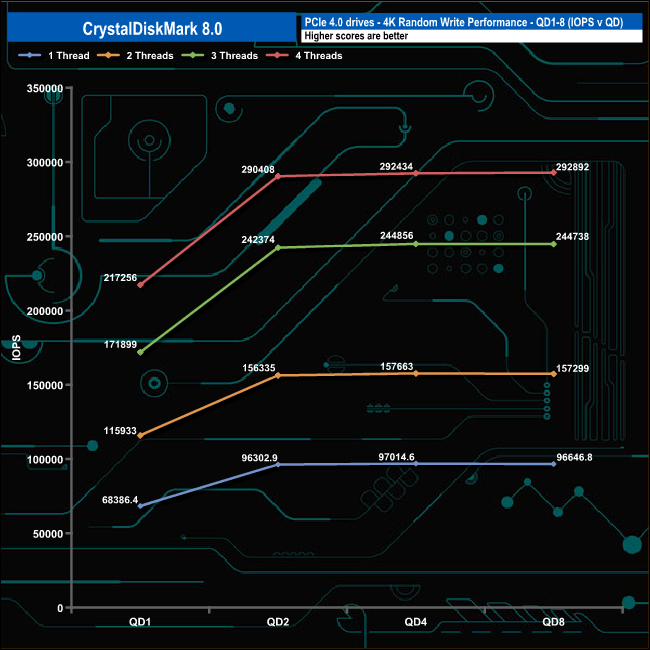
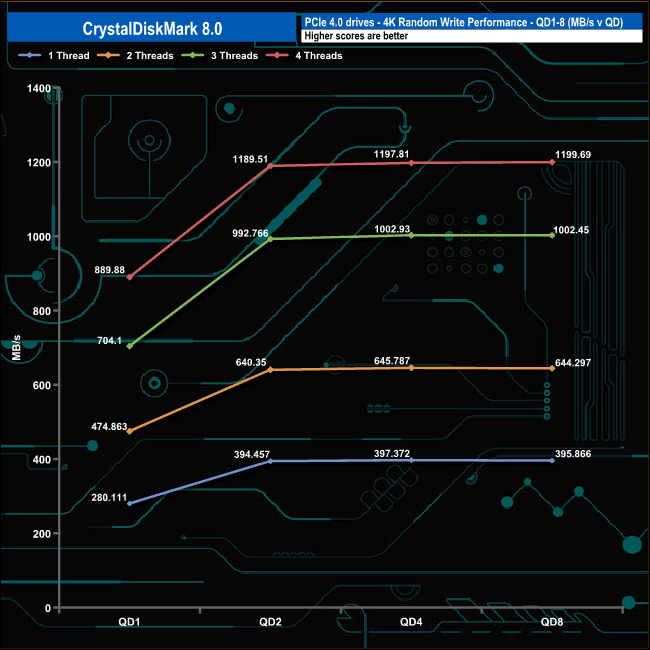
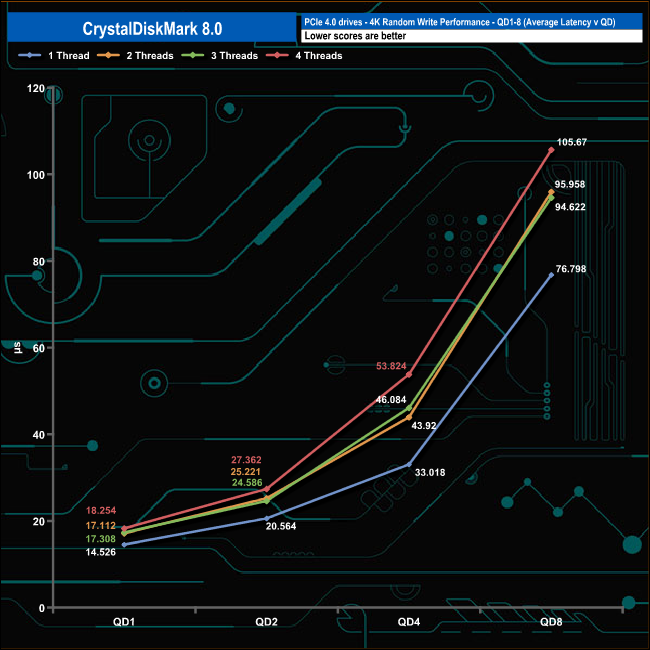
In the 4K write performance tests the performance rose quickly from QD1 to QD2 but then levelled off for the remainder of the test run for all the tested threads.
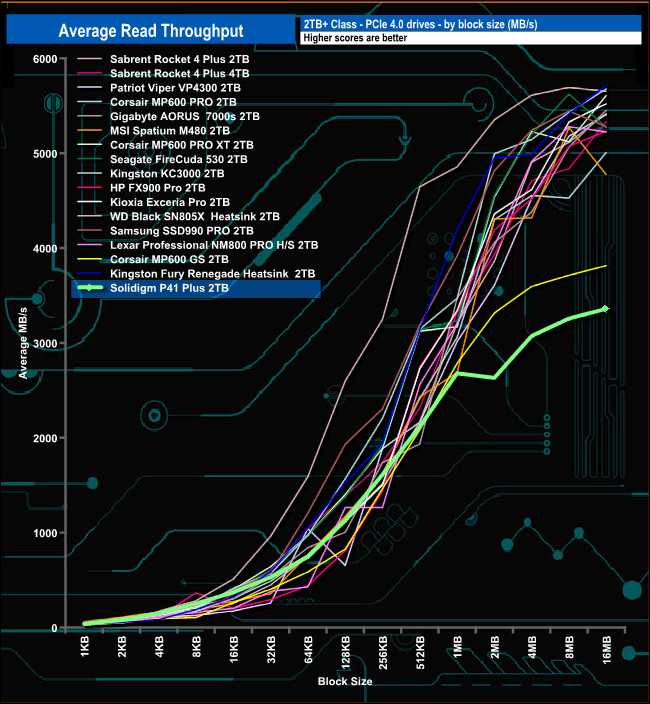
In our read-throughput tests, the 2TB P41 Plus peaked at the 16MB block mark at 3,358MB/s, a good deal short of the maximum official figure of 4,125MB/s.
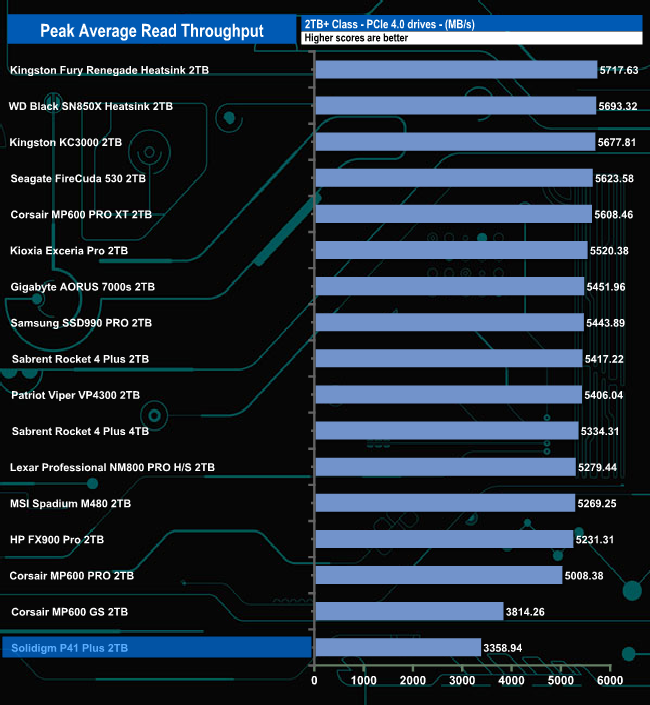
That peak read result of 3,358MB/s puts the drive in last place on our results chart.
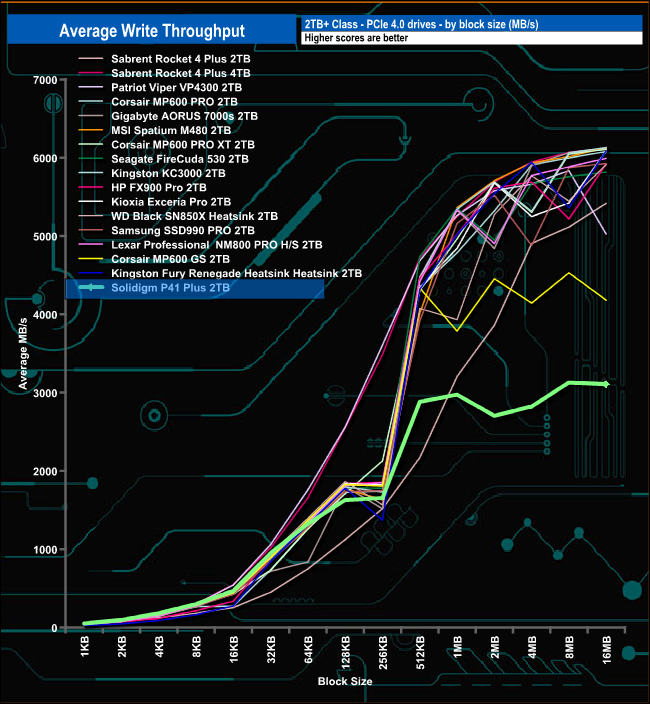
During the write throughput test, the drive peaked at 3,192MB/s (8MB block) before finishing the test run down slightly at 3,107MB/s, both figures just shy of the official maximum of 3,325MB/s.
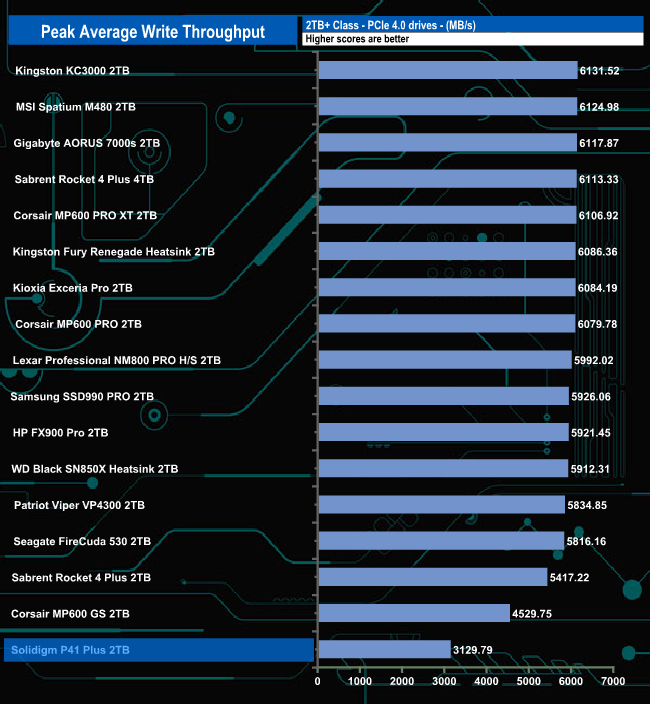
As with the peak read throughput result, the peak write test result of 3,192MB/s sees the drive in last place in the results chart.
The PCMark 10 Full System Drive Benchmark uses a wide-ranging set of real-world traces from popular applications and common tasks to fully test the performance of the fastest modern drives. The benchmark is designed to measure the performance of fast system drives using the SATA bus at the low end and devices connected via PCI Express at the high end.
The goal of the benchmark is to show meaningful real-world performance differences between fast storage technologies such as SATA, NVMe, and Intel’s Optane. The Full System Drive Benchmark uses 23 traces, running 3 passes with each trace. It typically takes an hour to run.
Traces used:
Booting Windows 10.
Adobe Acrobat – starting the application until usable.
Adobe Illustrator – starting the application until usable Adobe Premiere Pro – starting the application until usable.
Adobe Photoshop – starting the application until usable.
Battlefield V – starting the game until the main menu.
Call of Duty Black Ops 4 – starting the game until the main menu.
Overwatch – starting the game until the main menu.
Using Adobe After Effects.
Using Microsoft Excel.
Using Adobe Illustrator.
Using Adobe InDesign.
Using Microsoft PowerPoint.
Using Adobe Photoshop (heavy use).
Using Adobe Photoshop (light use).
cp1 Copying 4 ISO image files, 20 GB in total, from a secondary drive to the target drive (write test).
cp2 Making a copy of the ISO files (read-write test).
cp3 Copying the ISO to a secondary drive (read test).
cps1Copying 339 JPEG files, 2.37 GB in total, to the target drive (write test).
cps2 Making a copy of the JPEG files (read-write test).
cps3 Copying the JPEG files to another drive (read test).
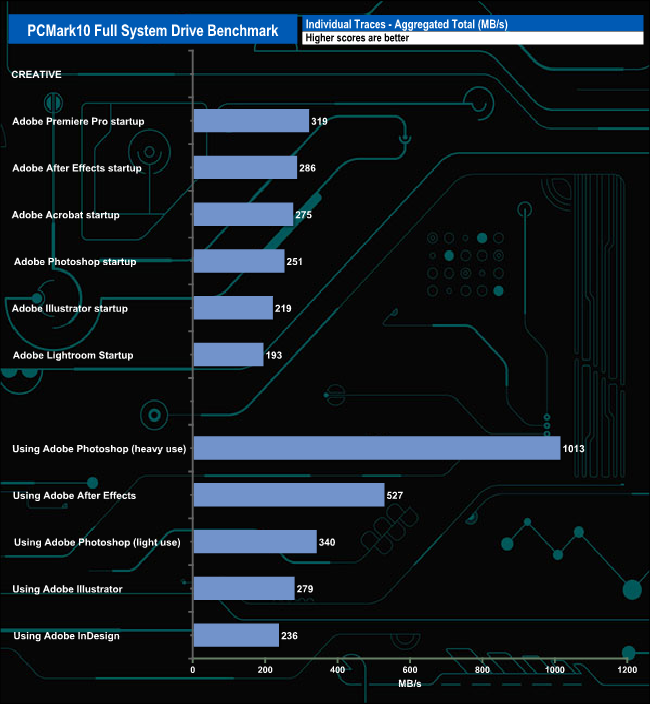
The fastest individual trace result came from the Adobe Photoshop heavy usage trace at 1,013MB/s. The drive averaged 257.16MB/s for the six Adobe start-up test traces and 479MB/s for the five usage traces including the Photoshop heavy usage one.
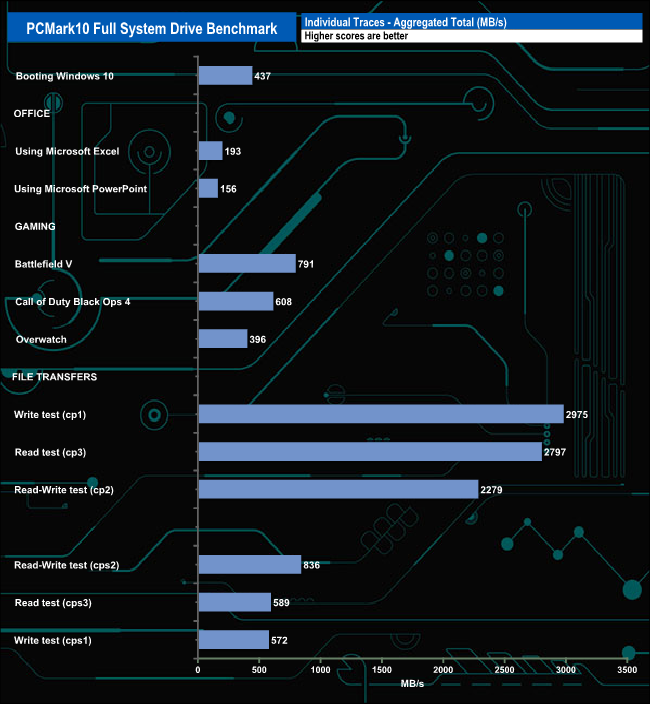
When it came to the file transfers, the fastest was the cp1 Write test at 2,975MB/s.
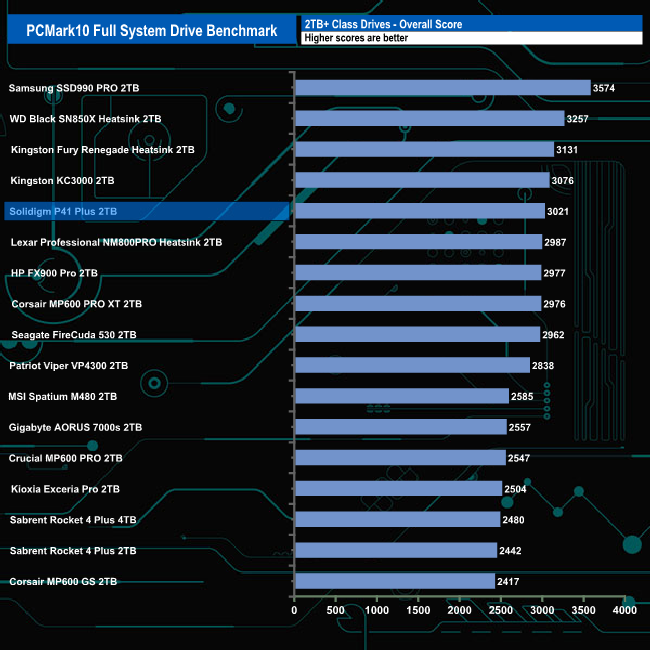
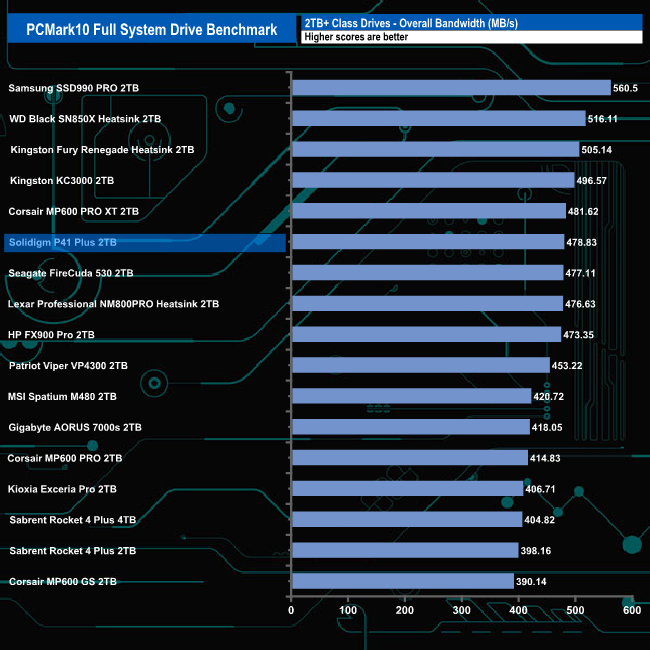
The overall bandwidth figure of 478.83 MB/s sees the drive sitting in the Top 10 drives seen to date.
The 3DMark Storage Benchmark uses traces recorded from popular games and gaming-related activities to measure real-world gaming performance.
Traces used –
Battlefield V
Loading Battlefield™ V from launch to the main menu.
Call of Duty Black Ops 4
Loading Call of Duty®: Black Ops 4 from launch to the main menu.
Overwatch
Loading Overwatch® from launch to the main menu.
Game Move
Copying the Steam folder for Counter-Strike®: Global Offensive from an external SSD to the system drive.
Game Recording
Recording a 1080p gameplay video at 60 FPS with OBS (Open Broadcaster Software) while playing Overwatch®.
Installing Game
Installing The Outer Worlds® from the Epic Games Launcher.
Game Saving
Saving progress in The Outer Worlds game.
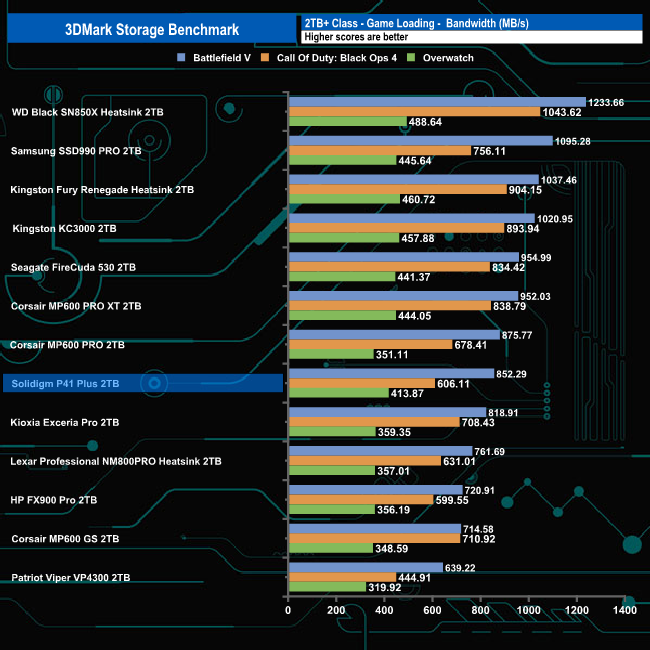
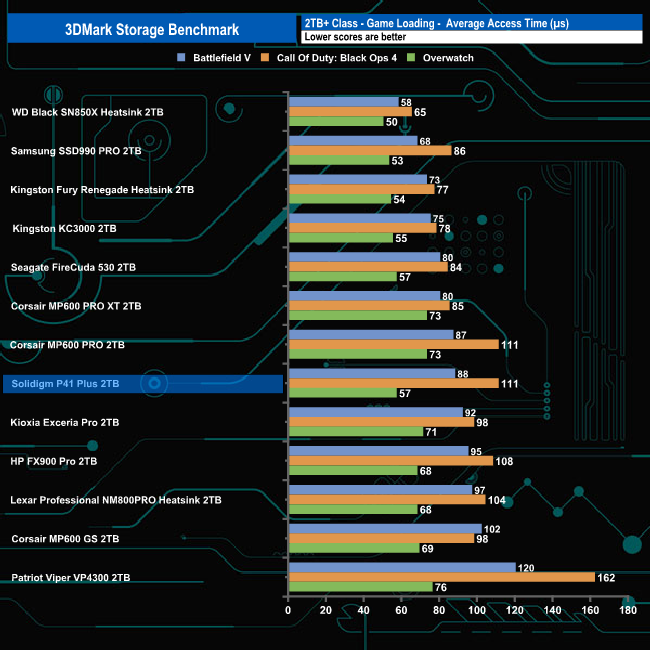
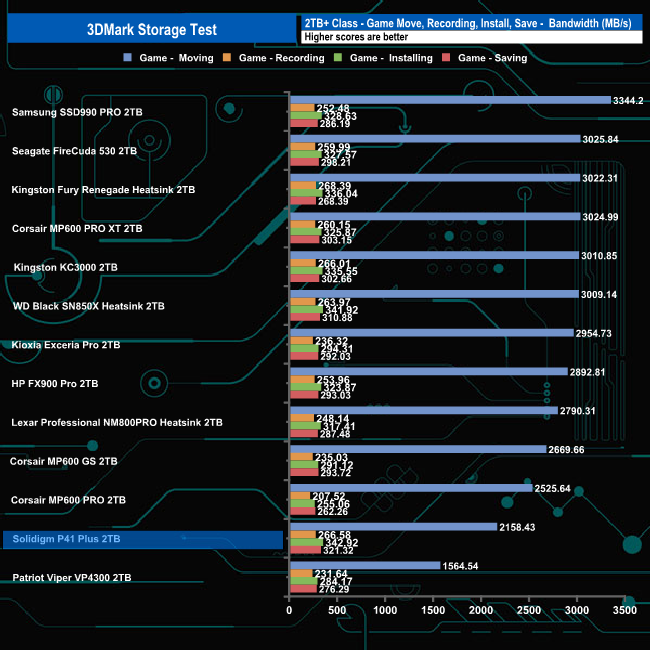
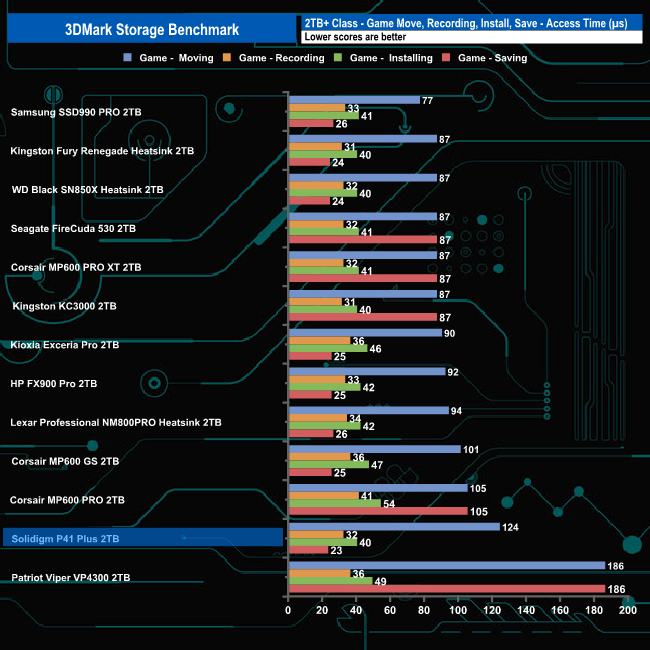
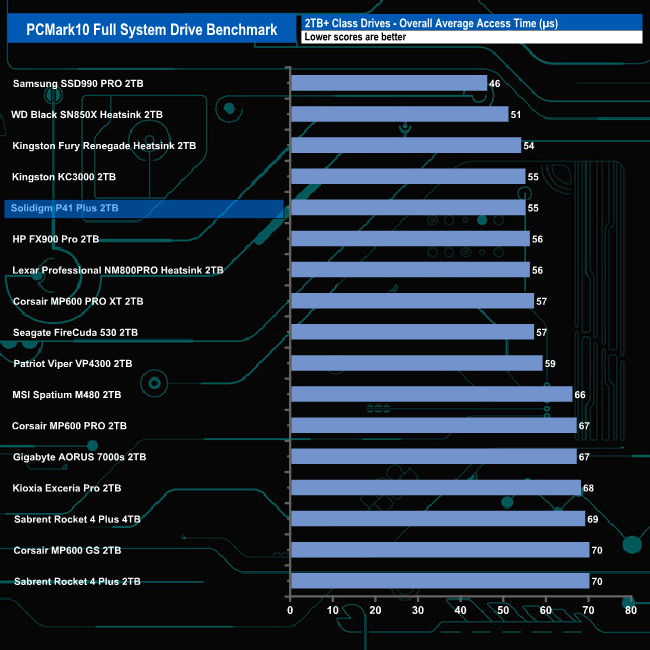
In 3DMark’s Storage Test, the 2TB P41 Plus had an average bandwidth figure of 623MB/s for the three-game load tests (Battlefield V, Call of Duty: Black Ops 4 and Overwatch) with an average access time of 85µs for the same three games.
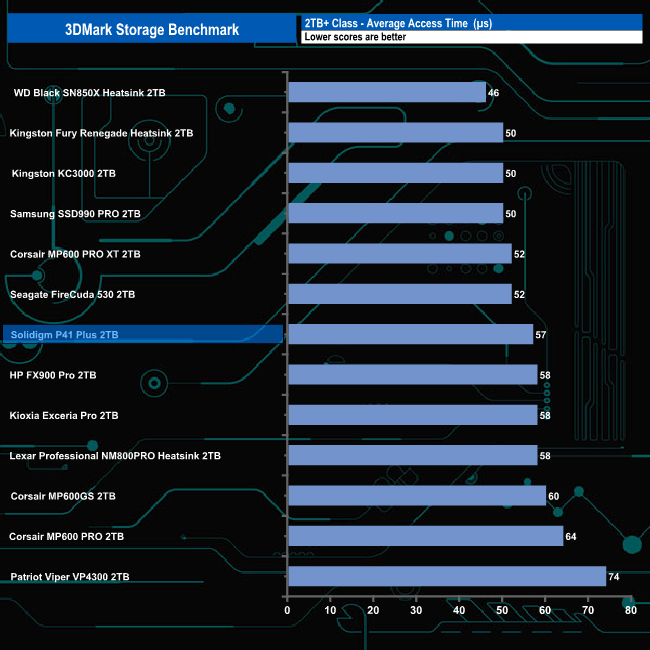
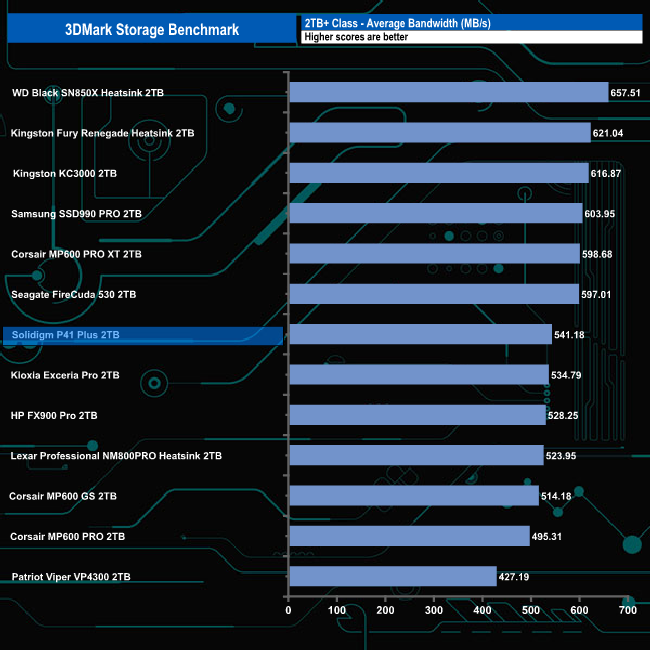
The overall average bandwidth figure of 541MB/s for the complete test run puts the drive in the middle of the results chart.
The Final Fantasy XIV Endwalker Official Benchmark uses actual maps and playable characters to assign a score to your PC and rate its performance including scene loading times.
The benchmark gives an overall load time as well as loading times by scene.
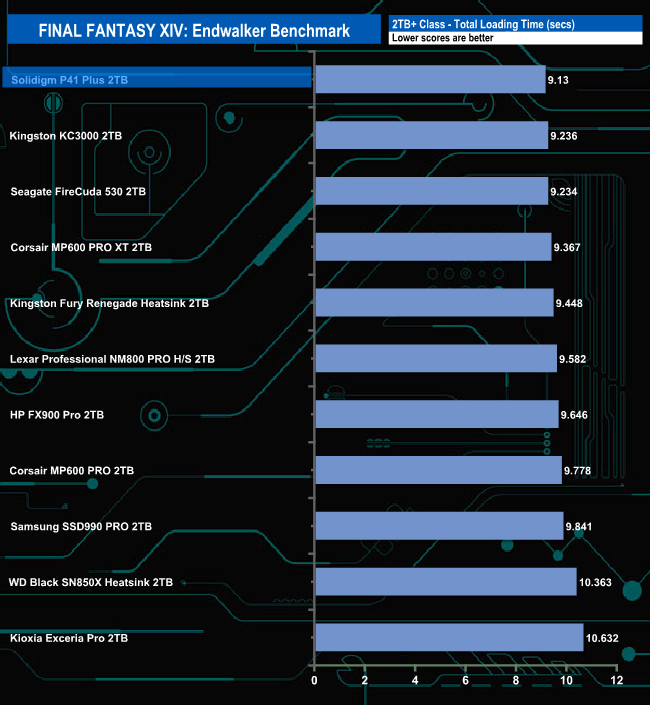
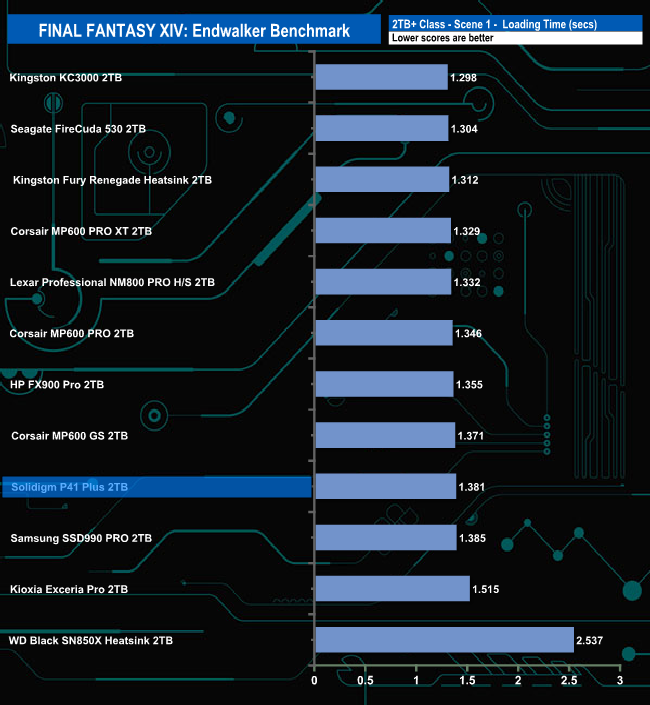
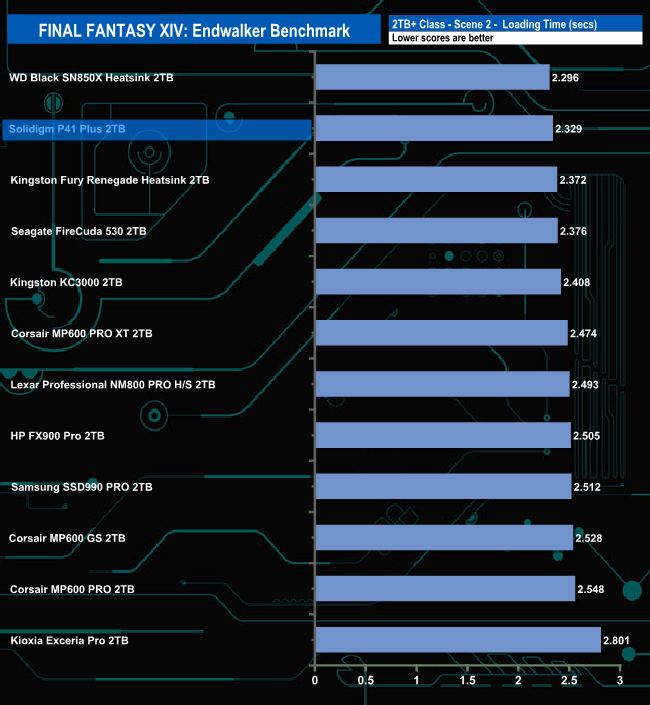
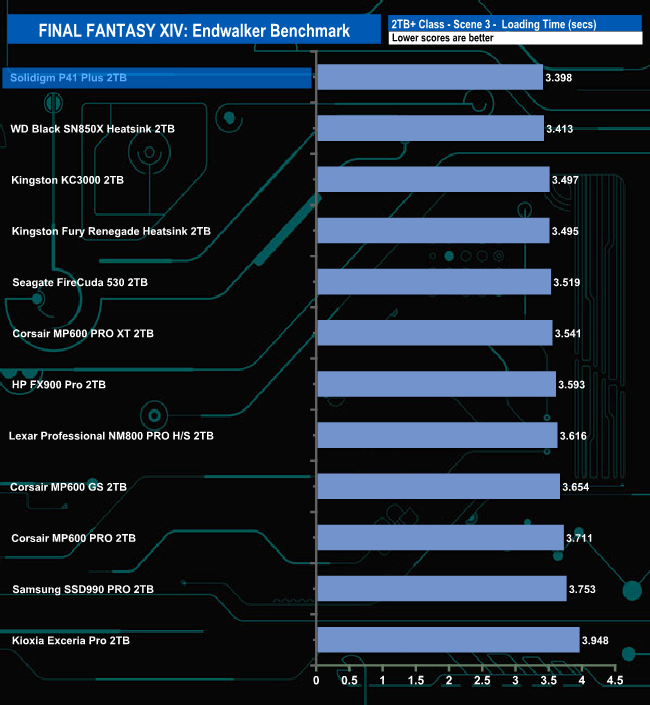
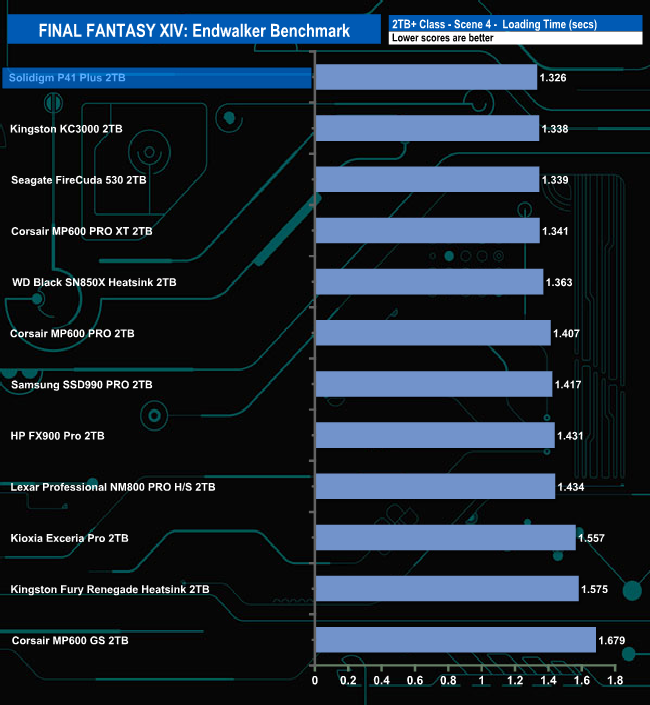
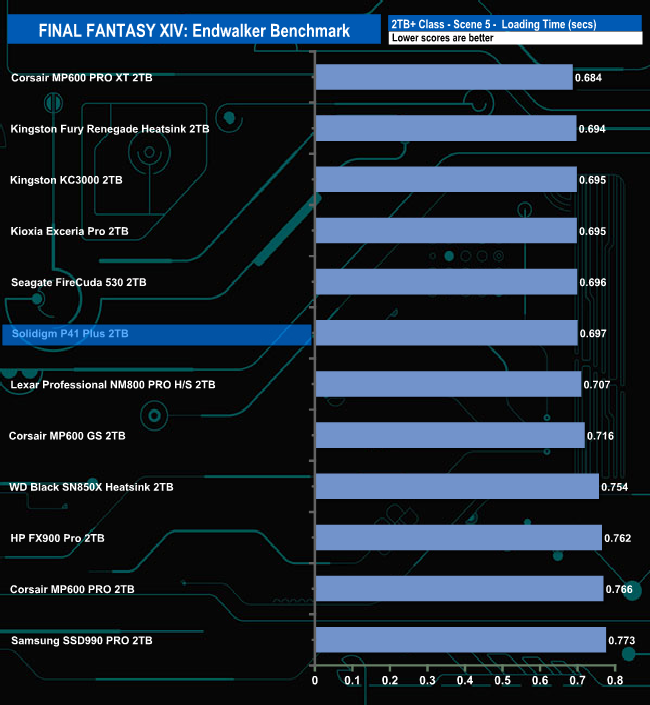
Solidigm's 2TB P41 Plus does very in the Final Fantasy XIV Endwalker Official Benchmark topping the chart with the fastest total load time we've seen to date. It also tops two of the other individual scene load timing charts as well.
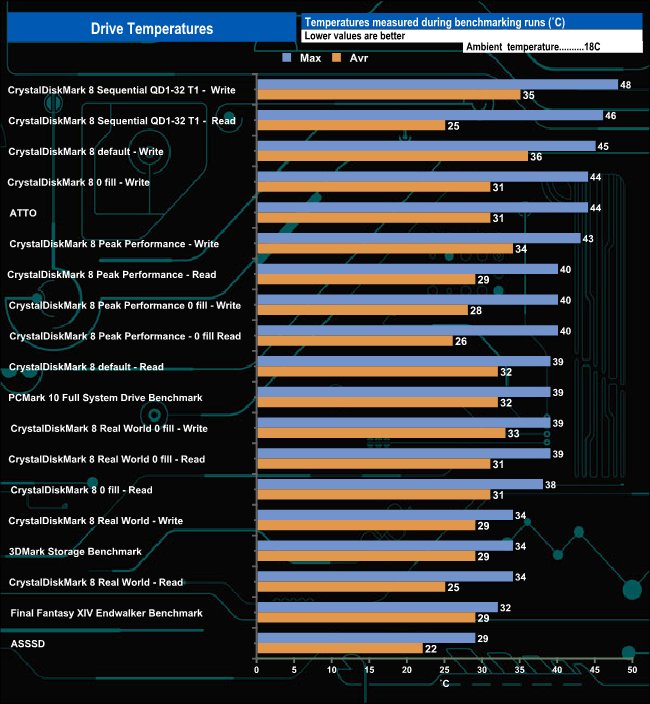
We took note of the drive’s temperature during some of our benchmarking runs. The 2TB Solidigm P41 Plus doesn't come with any form of a physical heat sink and Solidigm claim it has been optimised for thermal efficiency and reduced throttling which seems to be confirmed by our test results. The hottest the drive got was when being pushed extremely hard during repeated runs of the CrystalDiskMark 8 Sequential write tests where the drive got to 48° C, 22° C below the stated maximum of 70° C but there didn't appear to be any throttling issues. For the bulk of our testing, the temperature averaged around 35° C, well below that 70° C maximum operating temperature.
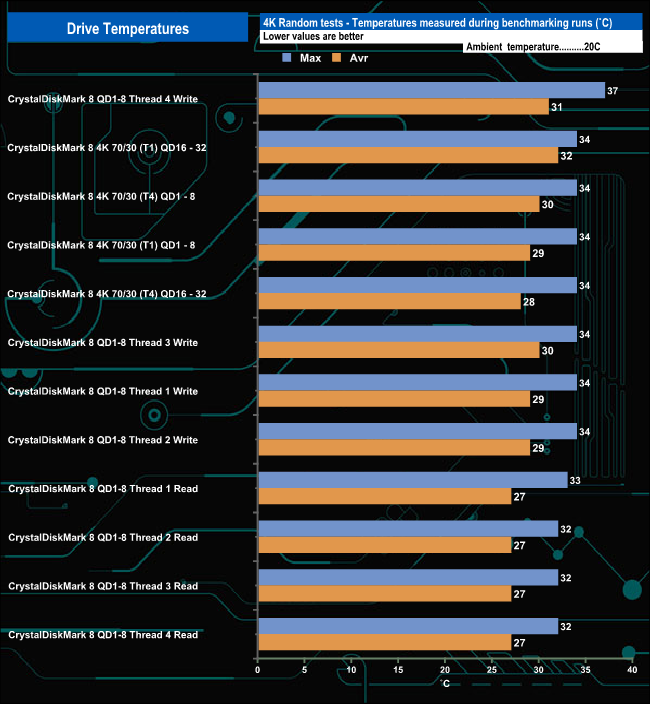
During the dedicated 4K random testing, the drive averaged 33.6° C. The hottest the drive got under this series of tests was the 37° C seen during the QD1-8 write test using 4-threads.
To test the real-life performance of a drive we use a mix of folder/file types and by using the FastCopy utility (which gives a time as well as MB/s result) we record the performance of the drive reading from & writing to a 256GB Samsung SSD850 PRO.
We use the following file/folder types:
- 100GB data file.
- 60GB iso image.
- 60GB Steam folder – 29,521 files.
- 50GB File folder – 28,523 files.
- 21GB 8K Movie demos.
- 12GB Movie folder – 24 files (mix of Blu-ray and 4K files).
- 11GB 4K Raw Movie Clips (8 MP4V files).
- 10GB Photo folder – 621 files (mix of png, raw and jpeg images).
- 10GB Audio folder – 1,483 files (mix of mp3 and .flac files).
- 5GB (1.5bn pixel) photo.
- Blu-ray movie.
![]()
![]()
The Solidigm P41 Plus handled our real-life file transfer tests without any problems. It averaged 519MB/s for writes when dealing with the larger file size transfers and 458MB/s when reading the data back. It's not quite as efficient when dealing with smaller file sizes, averaging 293MB/s for writes and 388MB/s for reads.
To get a measure of how much faster PCIe NVMe drives are than standard SATA SSD we use the same files but transfer to and from a 2TB Kioxia Exceria Plus drive.
![]()
![]()
Writing to and reading from an NVMe drive saw transfer speeds rocket and overall transfer times dropped dramatically as you might expect. Nine of the transfers topped over 2GB/s when writing to the drive with the 5GB image transfer being the fastest at 3,059MB/s. The same nine transfers produced read speeds of over 2GB/s, the fastest being the 2,811MB/s when dealing with the 8K Movie scenes folder.
The P41 Plus is the first Solidigm-branded SSD product line to be launched, we looked at the 1TB drive late last year, and this time we take a look at the 2TB flagship drive.
The P41 Plus uses a combination of a Silicon Motion controller and QLC NAND and is a DRAM-less design (it uses Host Memory Buffer technology). The controller in question is Silicon Motion's SM2269XT, their mainstream PCIe Gen4 controller. A 4-channel controller built on a 12nm process using a 7mm x 11mm package, it uses a dual-core ARM R8 CPU supporting four 1,600MT/s NAND channels and can be used with either TLC or QLC NAND. The NAND that the P41 Plus uses is Solidigm's own 144-layer 3D QLC NAND.
The 2TB P41 Plus is rated officially as up to 4,125MB/s and 3,325MB/s for Sequential reads and writes respectively. Using the ATTO benchmark, the best test result figures we saw from the drive; 3,810MB/s reads and 3,100MB/s for writes are shy of the official maximum. Switching over to the CrystalDiskMark benchmark we could confirm the official figures with default test results of 4,139MB/s for reads and 3,336MB/s for writes.
When it comes to 4K random performance the 2TB P41 Plus is officially rated as up to 390.000 IOPS for reads and 540,000 IOPS for writes. With our 4-threaded testing producing best test results of 367,252 IOPS for reads and 298,318 IOPS, we fell short of those official maximums. We got closer to both using the Peak Performance profile in CrystalDiskMark 8 with a best-read figure of 376, 009 IOPS (default test) and 509,872 IOPS for writes (0 fill test).
We found the 2TB Solidigm P41 Plus on Ebuyer for £112.98 (inc VAT) HERE.
Discuss on our Facebook page HERE.
Pros
- Solid sequential performance.
- Solidigm Storage Tool.
- Competitively priced.
Cons
- DRAM-less design.
- Not the fastest Gen4 drive we've seen.
KitGuru says: As we said with the 1TB P41 Plus, Solidigm's 2TB version of the drive performs reasonably well for the market segment it is aimed at. Solidigm has given it every chance by giving it a competitive price tag.