

WD's first NVMe drive to carry the Black label – the Black PCIe – was something of a disappointment in terms of performance, to say the least. While it was true to say that it was, up till now, the fastest ever Black drive, it was no match for many of its direct competitors. Now we have the 2nd generation NVMe Black drive – the WD Black NVMe, and it's a whole different animal.
The original Black PCIe drive used a combination of a Marvell controller and SanDisk 15nm TLC Planer NAND. The new drive has upped the ante with the debut of WD's own NVMe controller combined with SanDisk's 64-layer BiCS 3D TLC NAND.
The new Black NVMe drive comes in three capacities; 250GB (WDS250G2X0C), 500GB (WDS500G2X0C) and the flagship 1TB (WDS100T2X0C) drive that WD kindly supplied for review. The previous drive just came in two sizes – 256GB and 512GB.
The official figures for the new drives are mightily impressive. Sequential reads for the entry 250GB model are up to 3,000MB/s, while the 500GB and 1TB drive share the same up to 3,400MB/s figure. Sequential writes climb with capacity; 250GB up to 1,600MB/s, 500GB up to 2,500MB/s and the 1TB model up to 2,800MB/s.
Random read/write figures for the range are up to 220,000 IOPS and 170,000 IOPs respectively for the 250GB drive, the 500GB drive is rated as up to 330,000 IOPS for reads and 410,000 IOPS for writes while the 1TB drive is rated as up to 500,000 IOPS for reads and up to 400,000 IOPS for writes.
Endurance TBW figures for the range is 200 for the 200GB drive, 300 for the 500GB and 600 for the 1TB model. WD backs the drive with a 5 year warranty.
Specifications:
- Usable Capacities: 1TB
- NAND Components: SanDisk BiCS 3D TLC NAND
- NAND Controller: WD
- Cache: 1024MB
- Interface: PCIe Gen3.0 x4 NVMe
- Form Factor: M.2 2280
- Dimensions: 80 x 22 x 2.38mm
- Drive Weight: 7.5g
Firmware Version: 101020WD

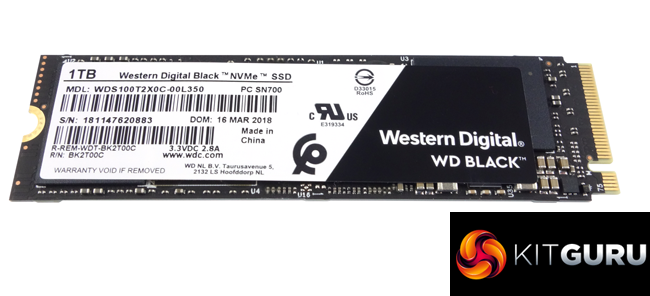
The WD Black NVMe comes in a smallish box with a clear image of the drive on the front. WD is obviously keen to let you know that this is a fast drive, too, as the 3400MB/s read figure is displayed in the bottom left corner of the box. Next to this are three boxes displaying the capacity of the drive, the fact it uses 3D NAND and that it comes with a 5 year warranty.
The rear of the box has a small clear plastic panel through which part of the drive is visible, sitting in its protective plastic enclosure. The only other thing in the box is a Technical Support and Warranty Guide.
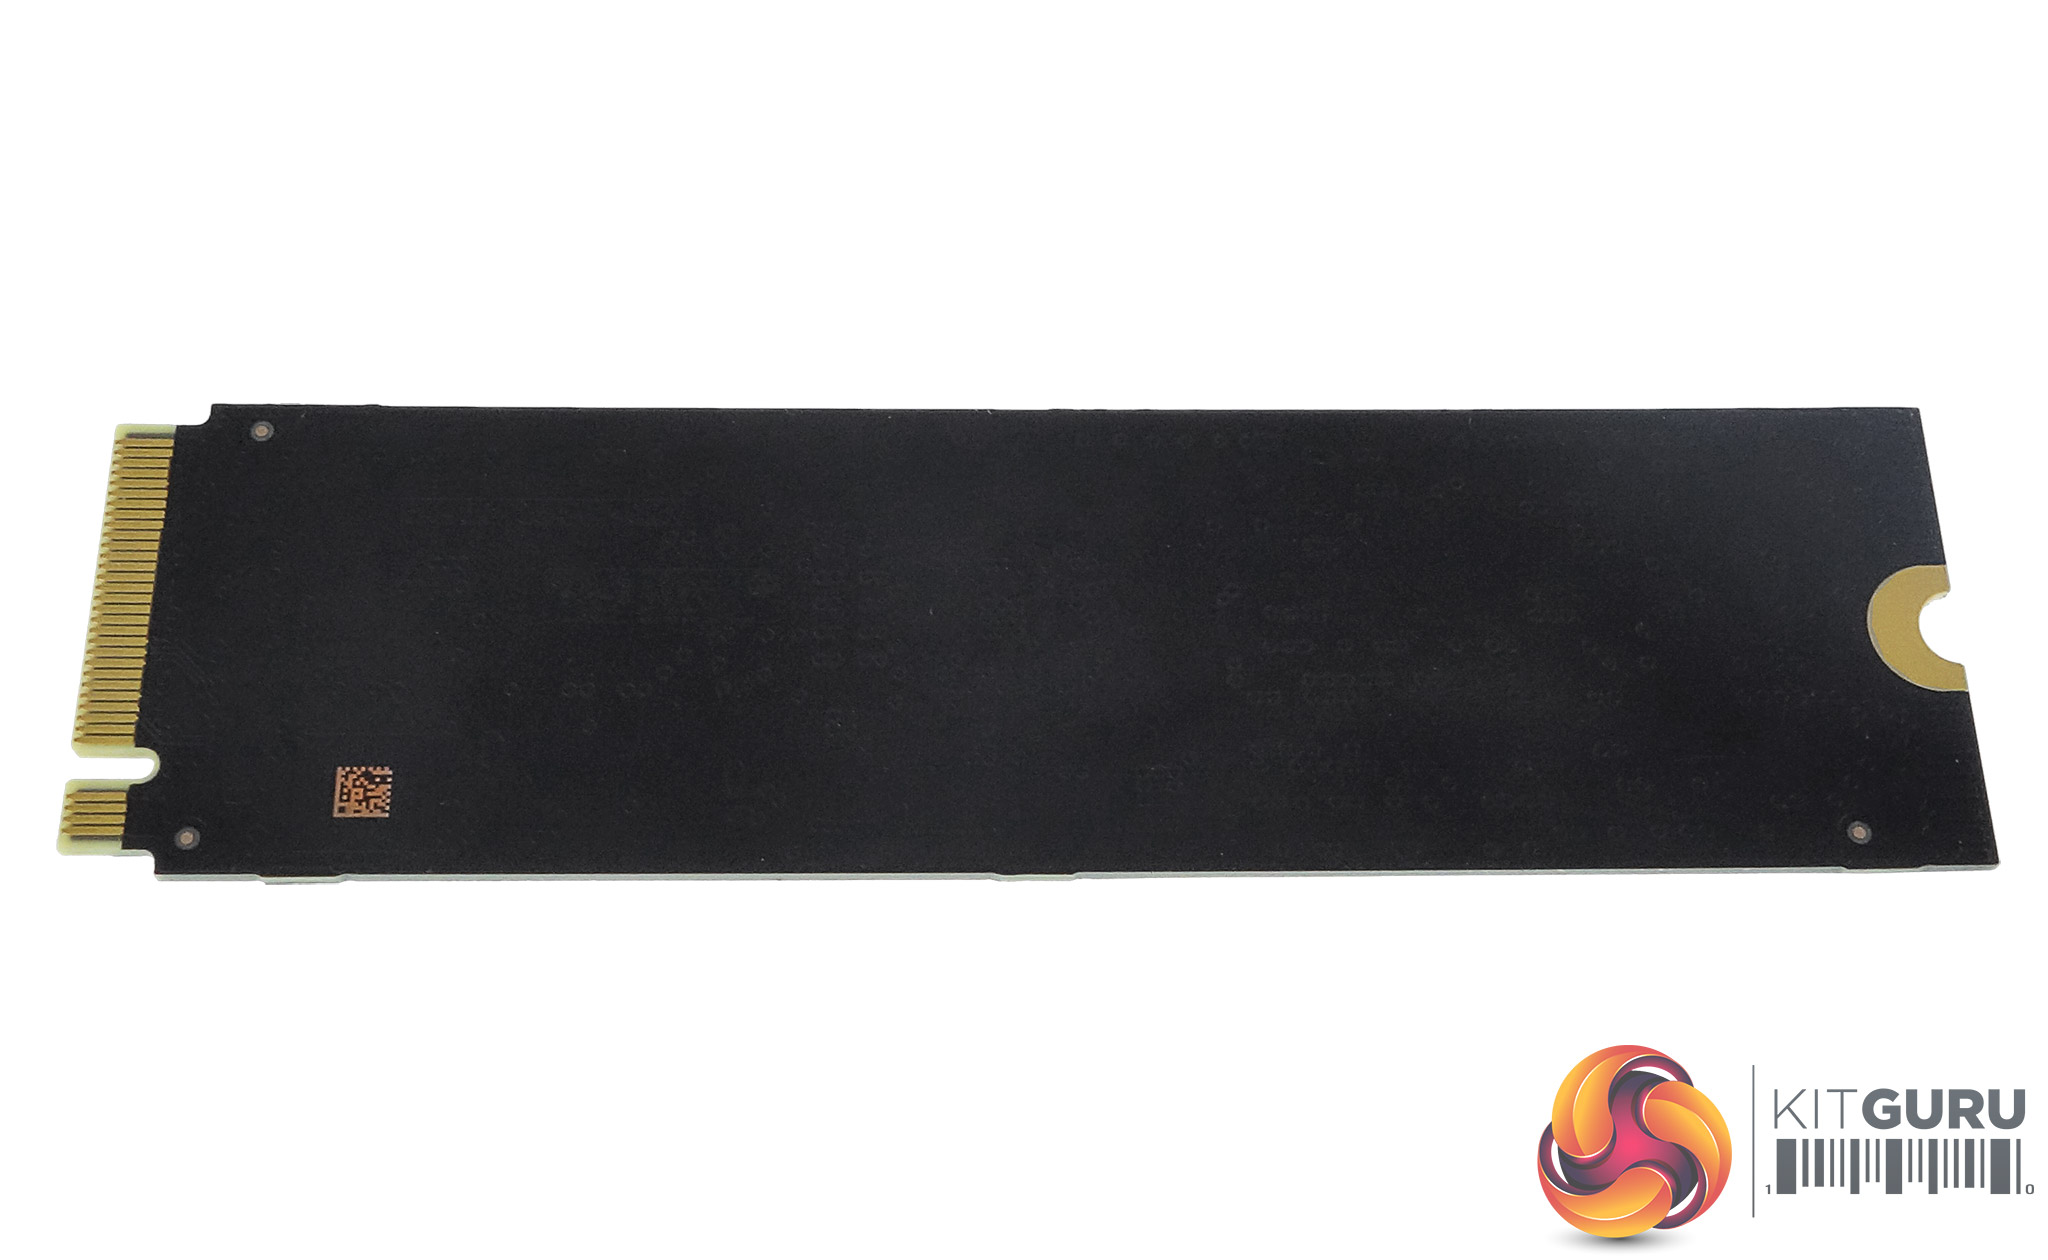
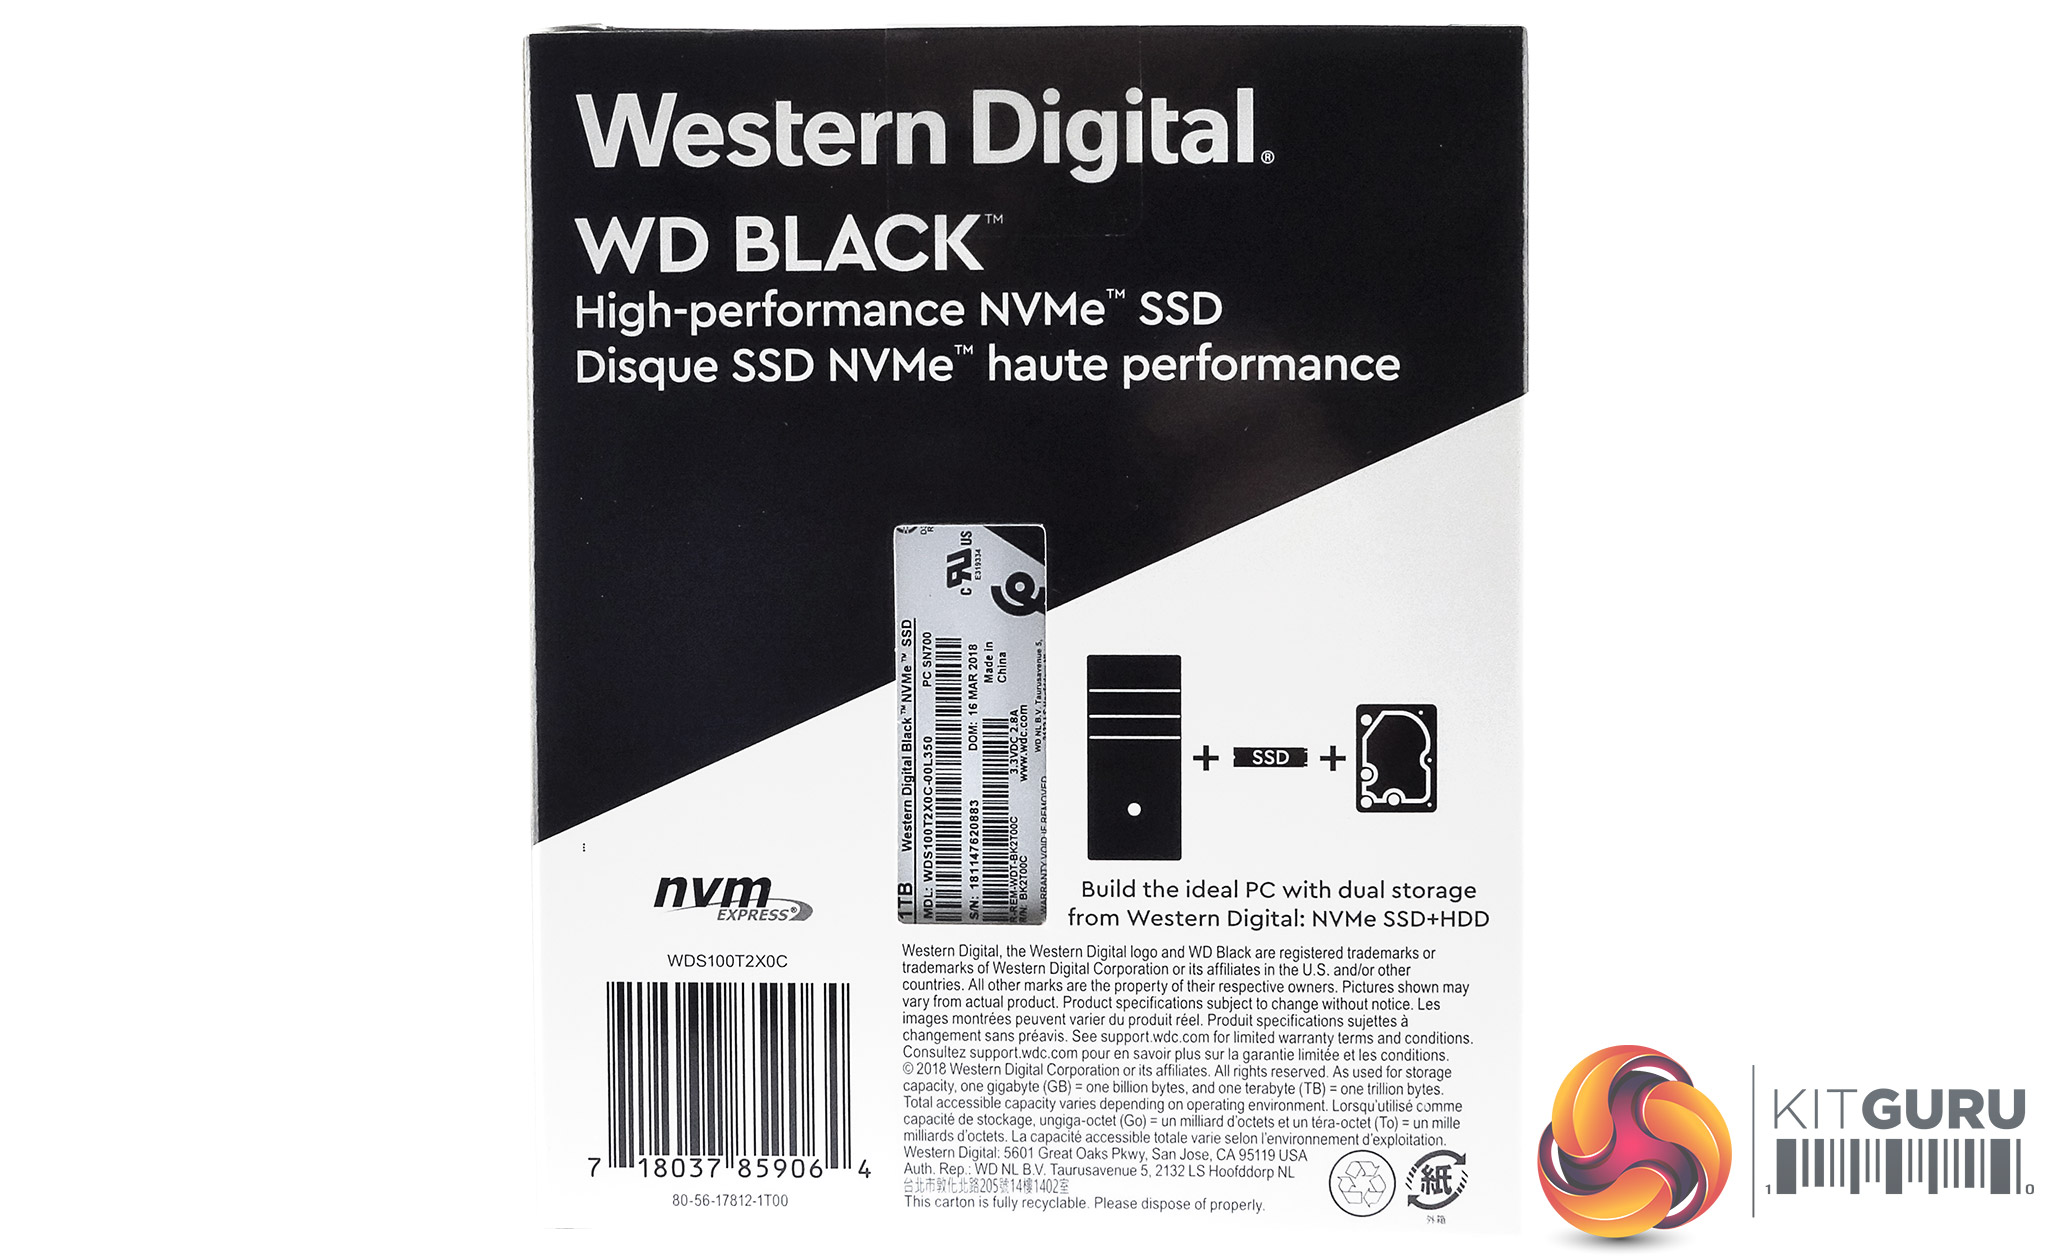
WD's Black NVMe is a single sided PCB design, so the rear of the drive is empty, with all the components covered by the product label on the top side.
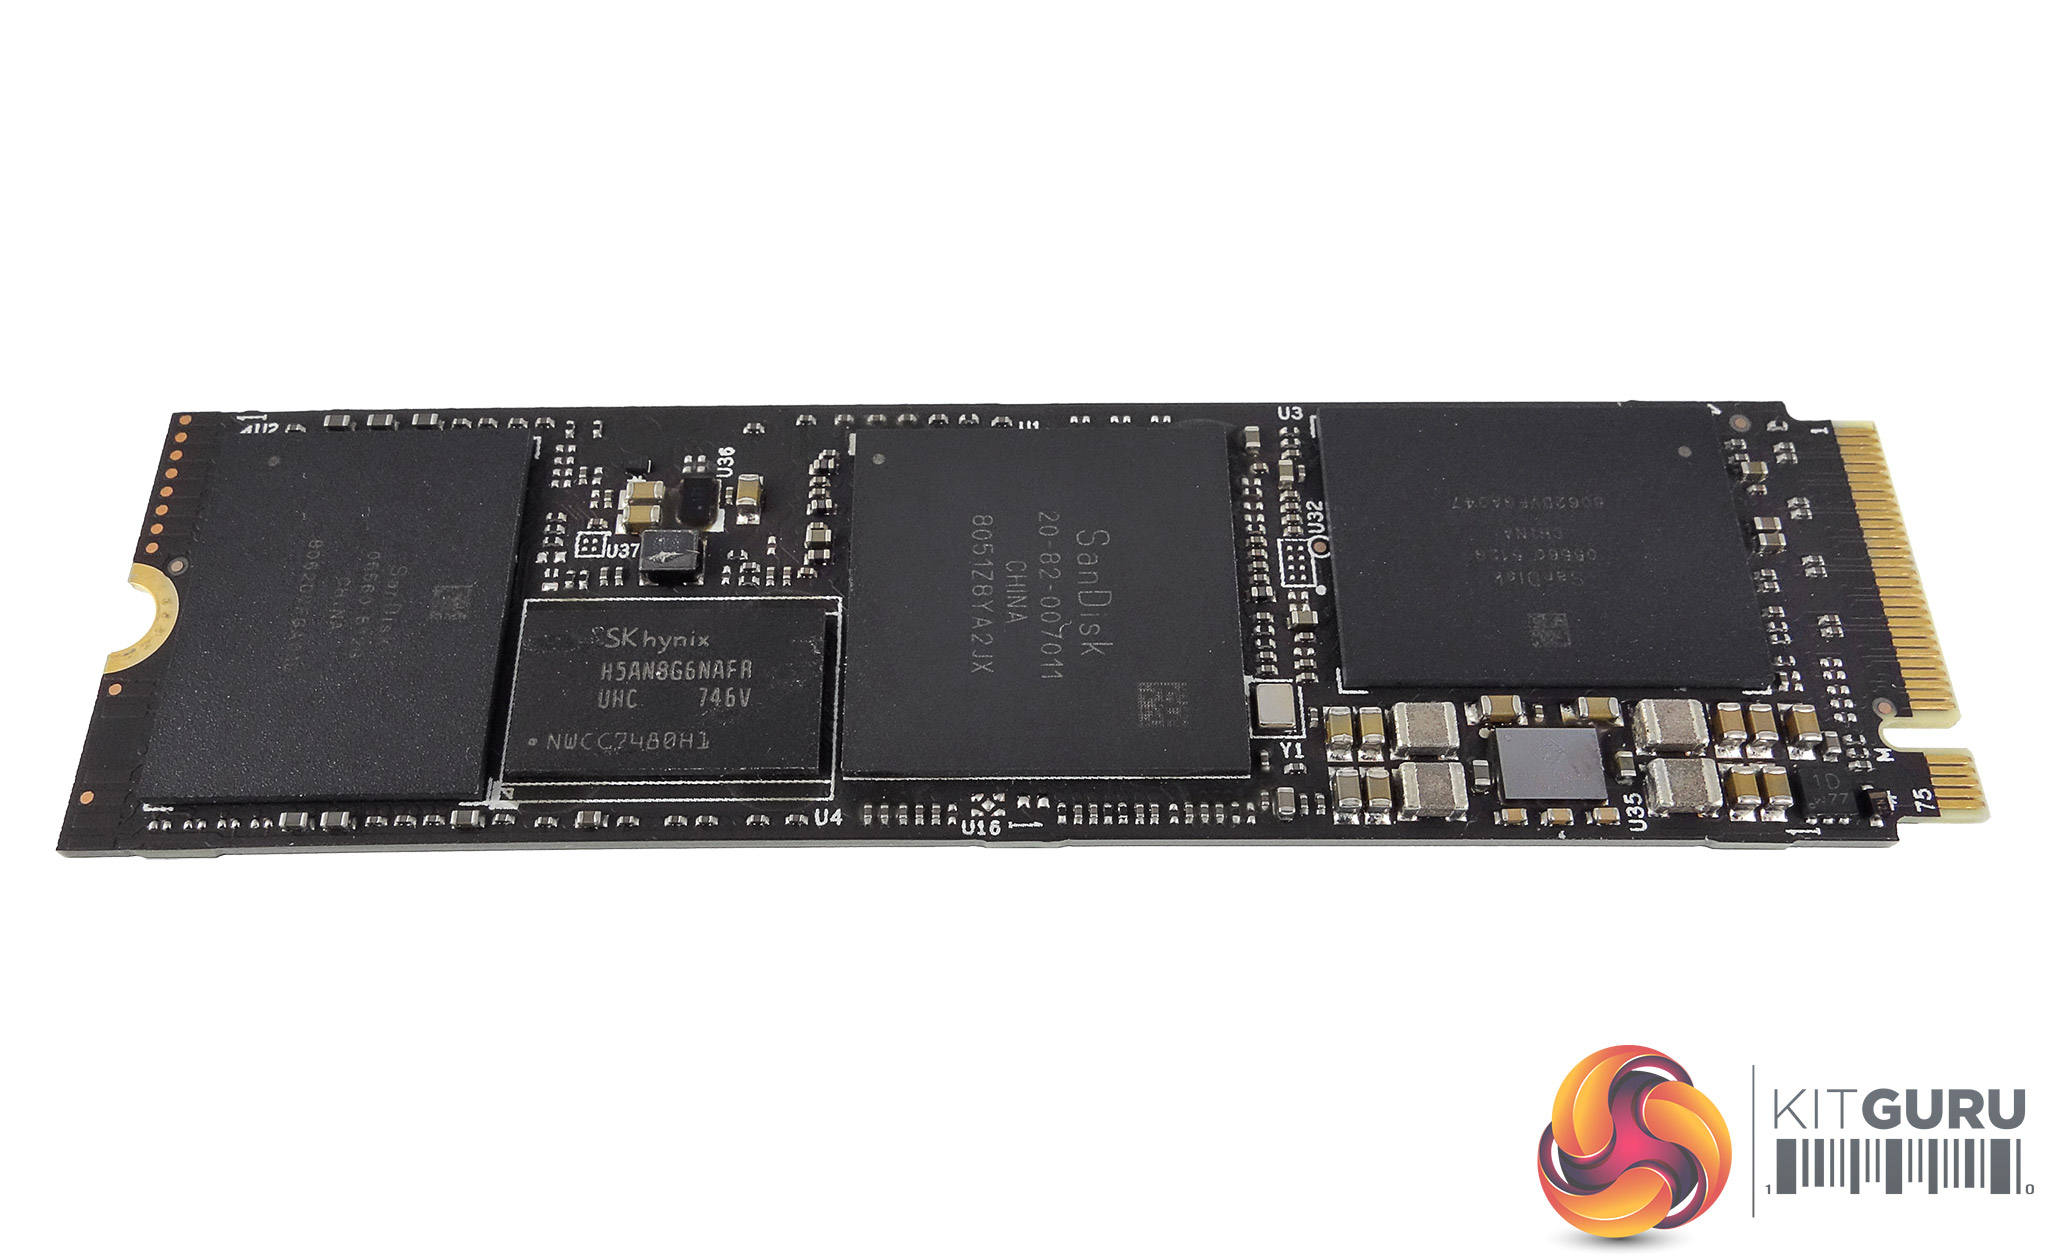
The layout of the components is different from any other M.2 drive we've seen in the fact that WD have positioned the controller (labelled SanDisk 20-880007011) in the middle of the drive between the two NAND packages.
This 1TB drive uses two 512GB BiCS 3 64-layer TLC packages (labelled SanDisk 05560 512G). Sitting between one of these packages and the controller is a single SK hynix H5AN8G6NAFA 1024MB DDR4-2666 cache IC.
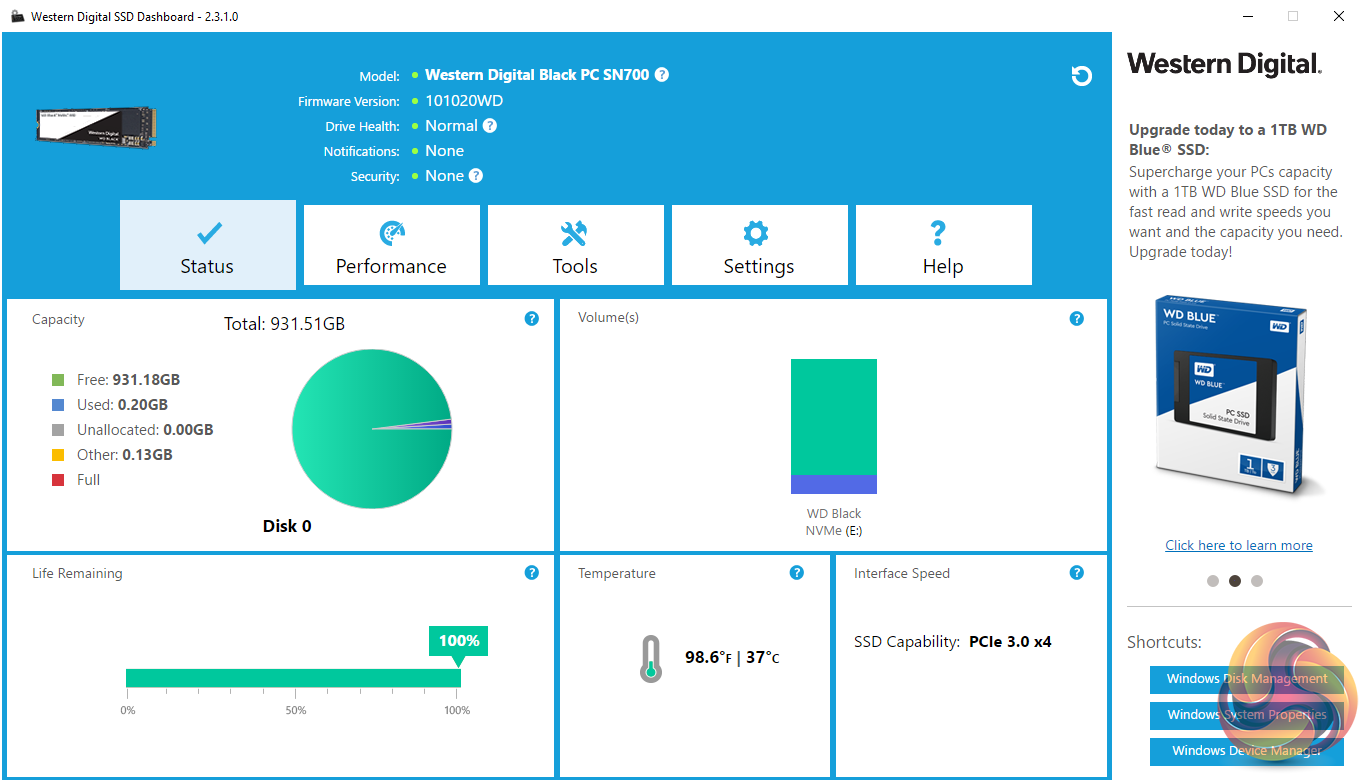
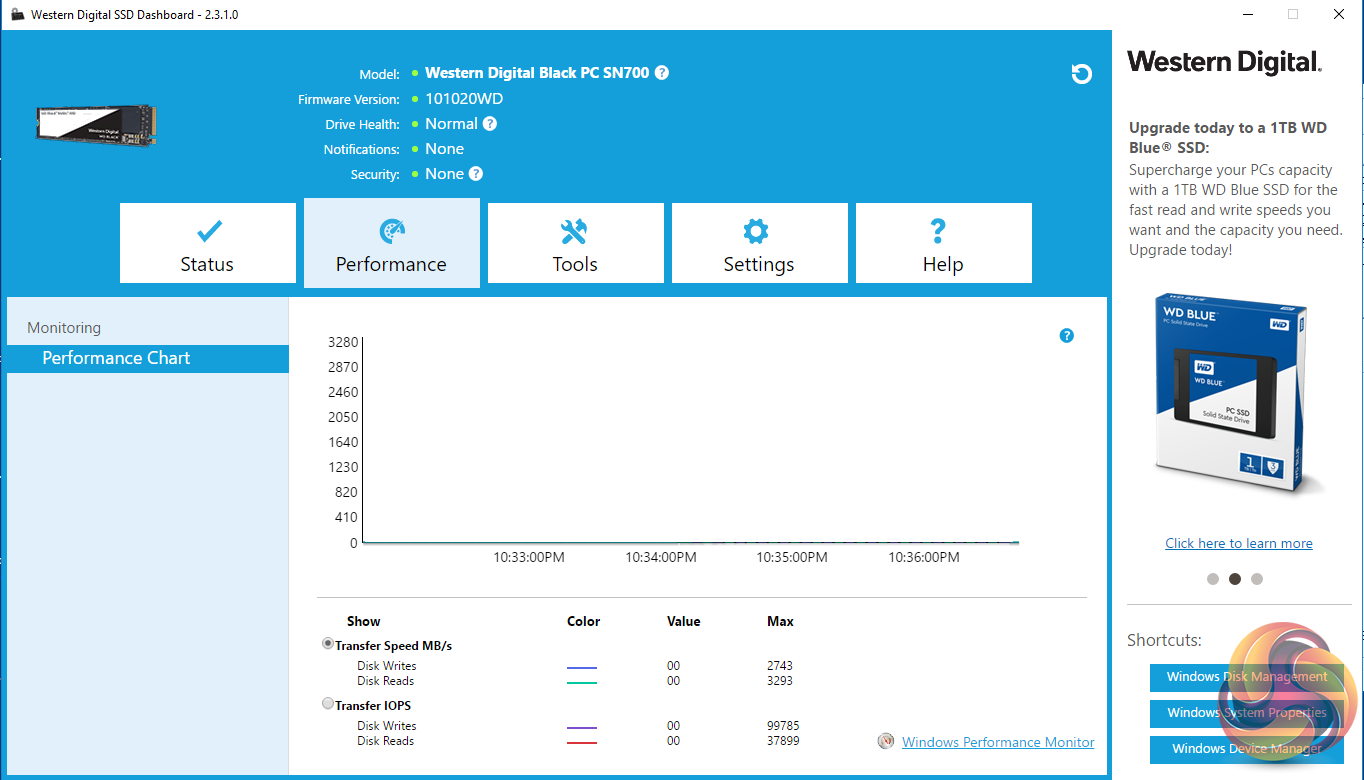
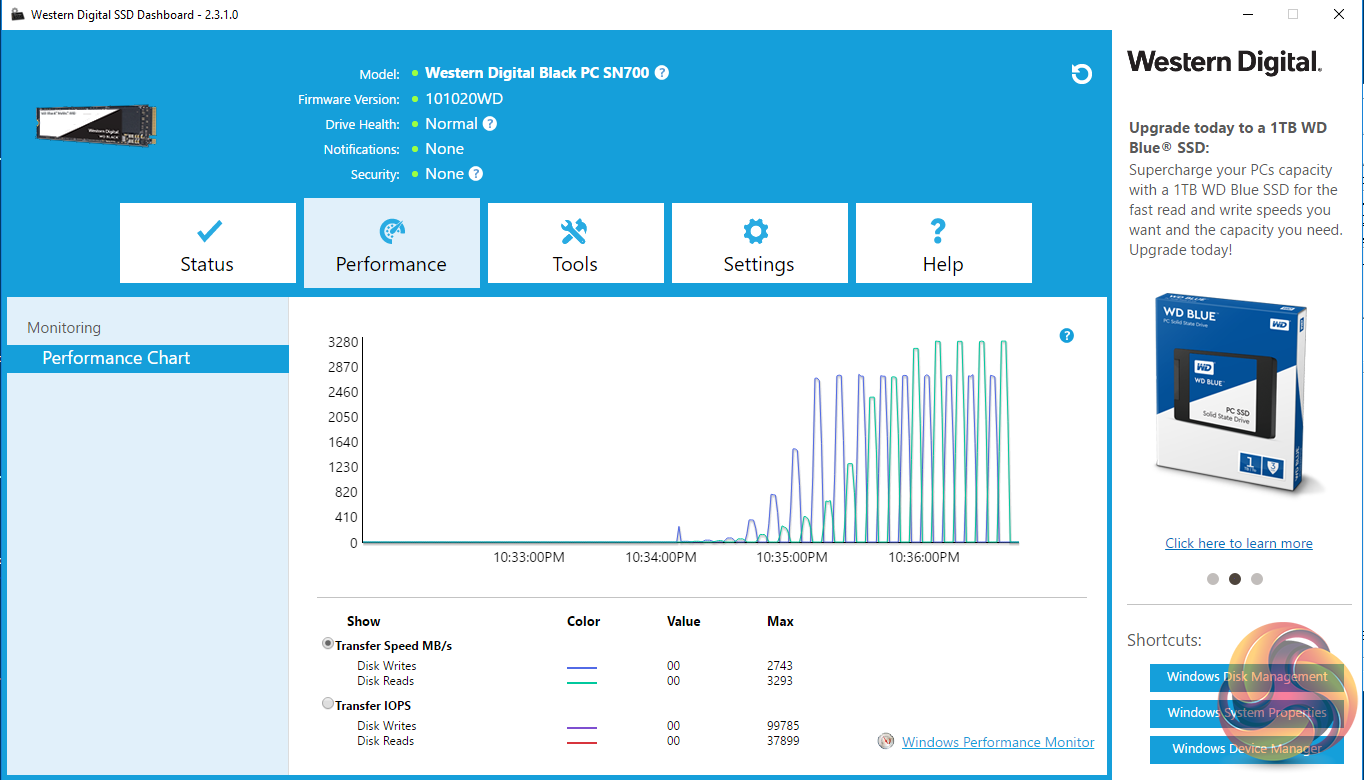
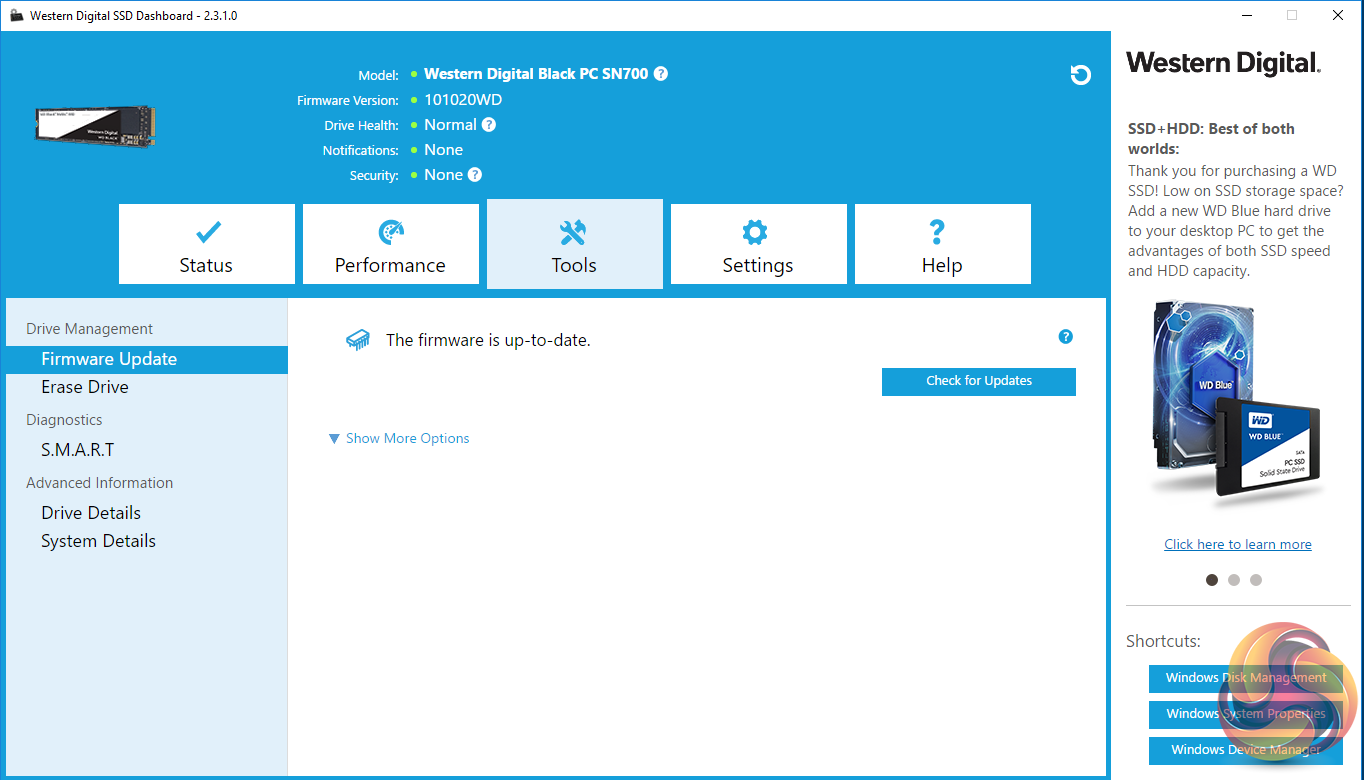
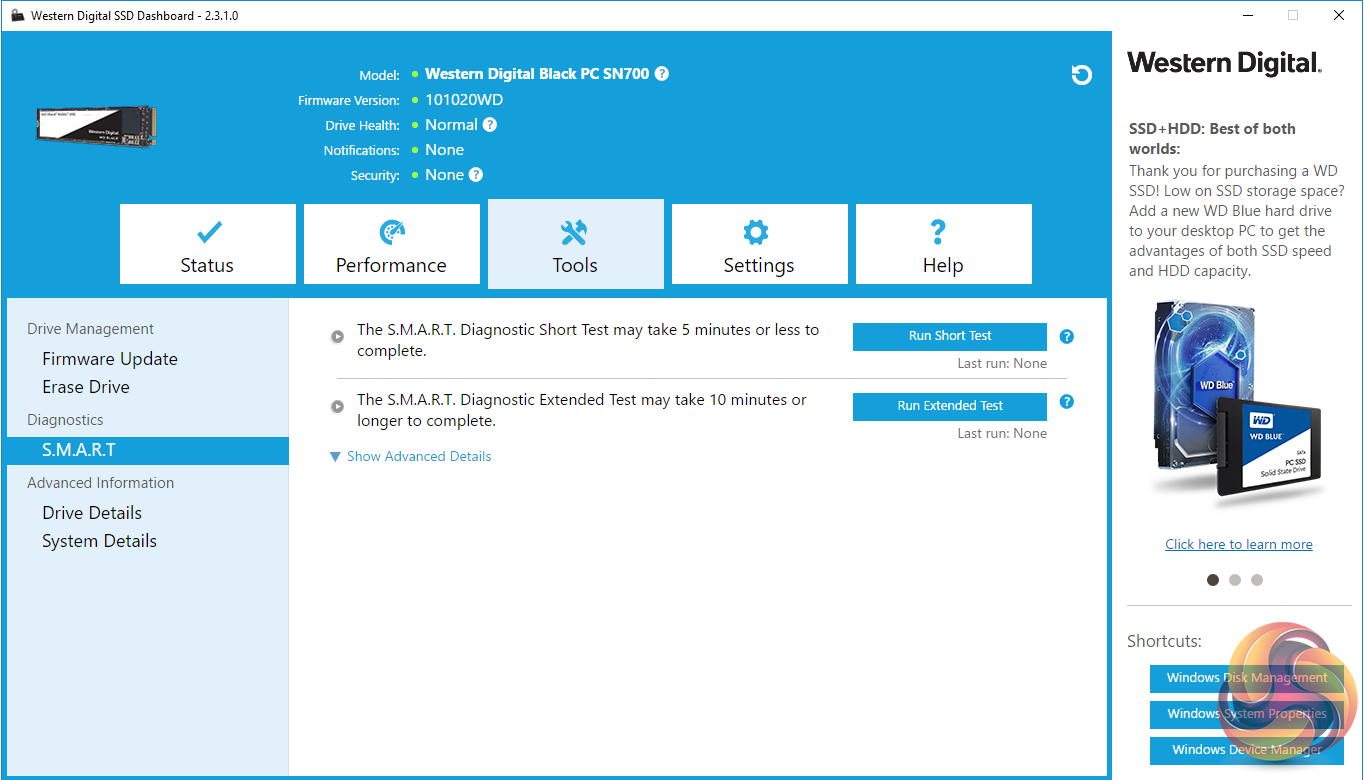
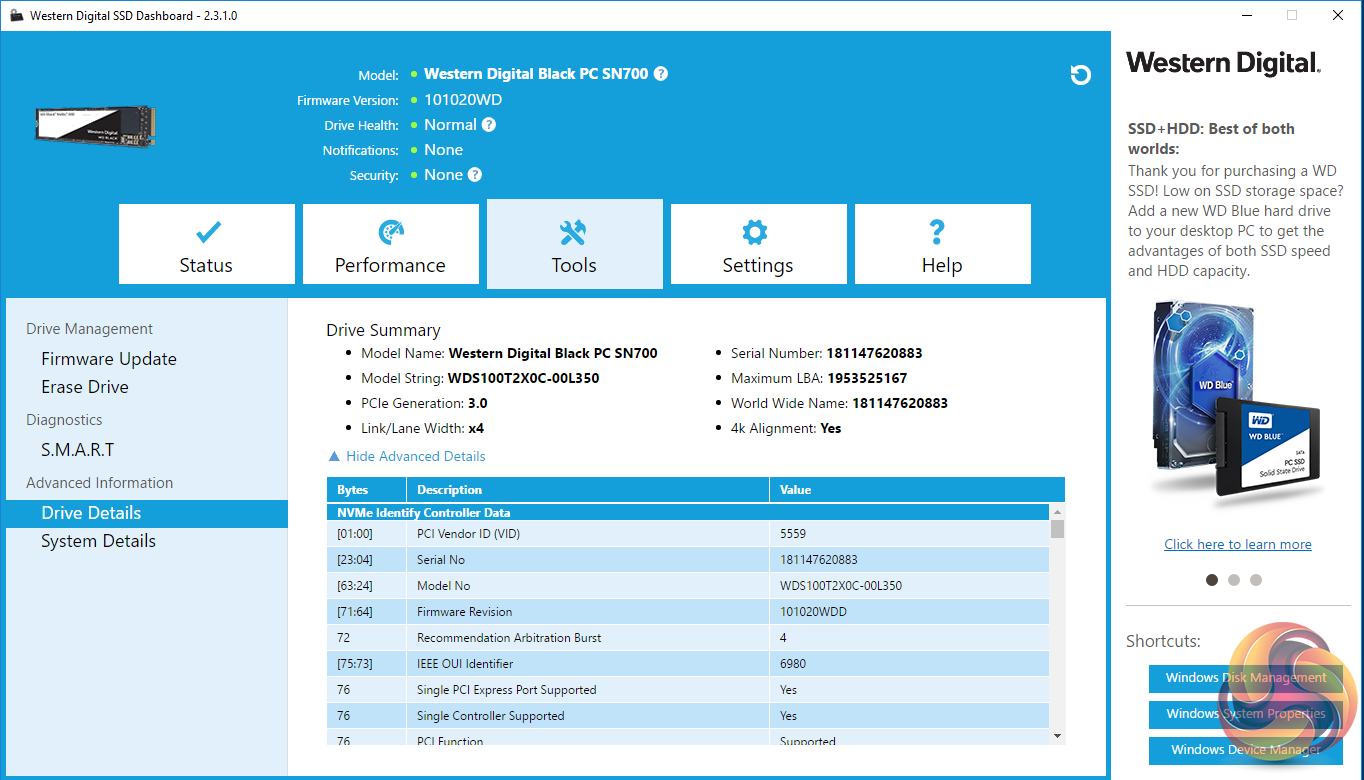
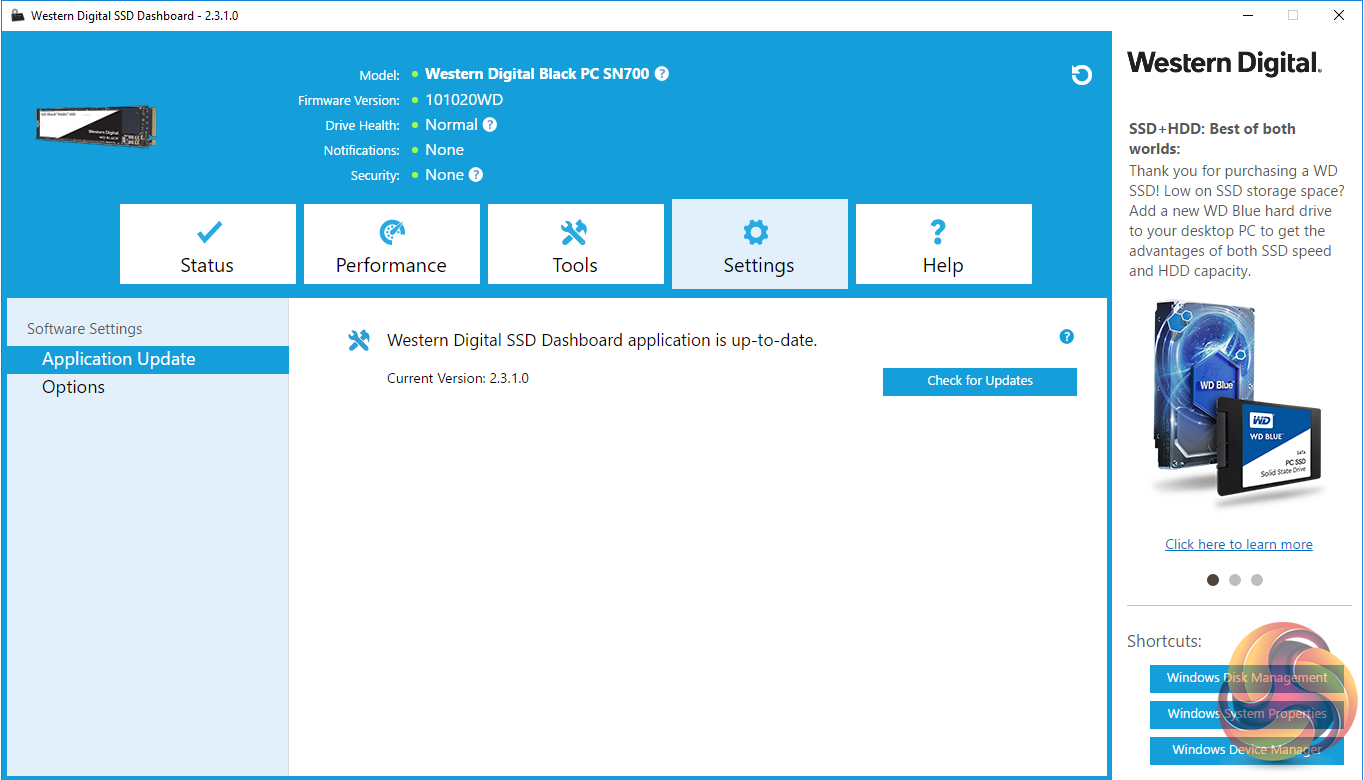
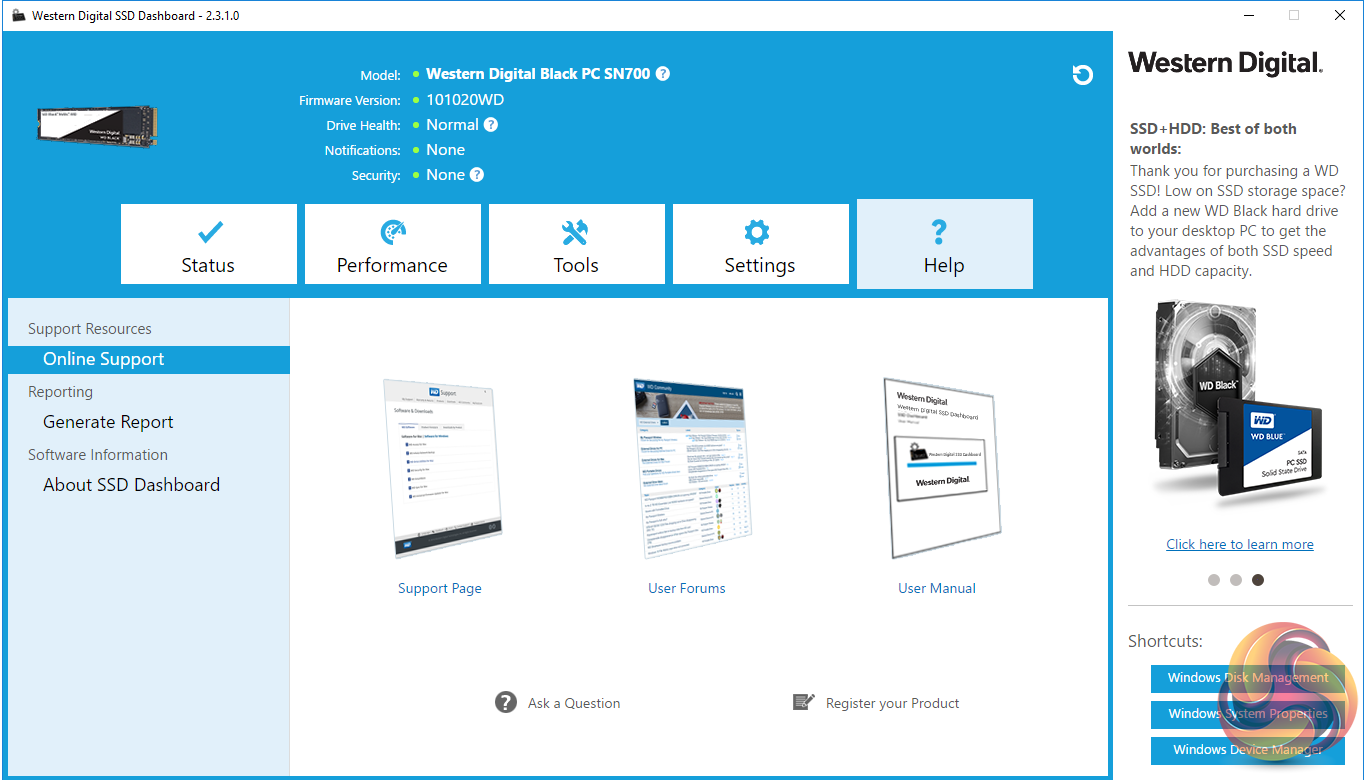
WD's SSD management software goes by the name of SSD Dashboard. With it you can monitor drive status, performance, secure erase (currently only by making a bootable USB device), update firmware and monitor temperatures. There's no cloning tool integrated into the utility but you can download Acronis True Image WD Edition from the WD website.
For testing, the drives are all wiped and reset to factory settings by HDDerase V4. We try to use free or easily available programs and some real world testing so you can compare our findings against your own system. This is a good way to measure potential upgrade benefits.
We are in the process of updating our testing procedures for NVMe SSD’s adding new tests, refining others and using the latest versions of CrystalDiskMark, ATTO and AS SSD benchmarks. For a time we will show both old and new screenshots of these benchmarks as we transition from the older tests to the newer ones. We will try and re-test as many of the previously reviewed NVMe drives as we can so as to build up new versions of our comparative performance graphs.
The test setup for the new tests are listed below. Each is run five times.
128KB Sequential Read / Write.
Transfer Request Size: 128KB Span: 8GB Thread(s): 1 Outstanding I/O: 1-32 Test Run: 20 minutes per test
4K Sustained Random Read / Write.
Transfer Request Size: 4KB Span: 80GB Thread(s): 4 Outstanding I/O: 1-32 Test Run: 20 minutes per test
4K Random 70/30 mix Read/Write.
Transfer Request Size: 4KB Span: 80GB Reads: 70% Writes: 30% Thread(s): 4 Outstanding I/O: 2 – 32 Test Run: 20 minutes
Main system:
Intel Core i7-7700K with 16GB of DDR4-3200 RAM, Sapphire R9 390 Nitro and an Asus Prime Z270-A motherboard.
Other drives:
Corsair Force MP500 480GB
Corsair Neutron NX500 800GB
Intel Optane Memory 32GB
Intel SSD760p 512GB
Kingston HyperX Predator 480GB
Kingston A1000 480GB
Kingston KC1000 960GB
OCZ RevoDrive 350 480GB
OCZ RevoDrive 3 x2 480GB
Patriot Hellfire 240GB
Plextor M9Pe(Y) 512GB
Plextor M8PeG 512GB
Plextor M6e Black Edition PCIe 256GB
PNY CS2030 240GB
Samsung SSD960 PRO 2TB
Samsung SSD960 EVO 1TB
Samsung SSD950 PRO 256GB
Samsung SM951 256GB
Samsung XP941 512GB
Toshiba OCZ RD400 512GB
Western Digital Black PCIe 512GB
Software:
Atto Disk Benchmark.
CrystalMark 3.0.3.
AS SSD.
IOMeter.
Futuremark PC Mark 8
All our results were achieved by running each test five times with every configuration. This ensures that any anomalies are removed from the results. TRIM is confirmed as running by typing ‘fsutil behavior query disabledeletenotify' into the command line. A response of ‘disabledeletenotify =0' confirms TRIM is active.
CrystalDiskMark is a useful benchmark to measure theoretical performance levels of hard drives and SSDs. We are using V3.0.3., but will be switching to v6.0 shortly so we have added the two CrystalDiskMark 6 result screenshots.
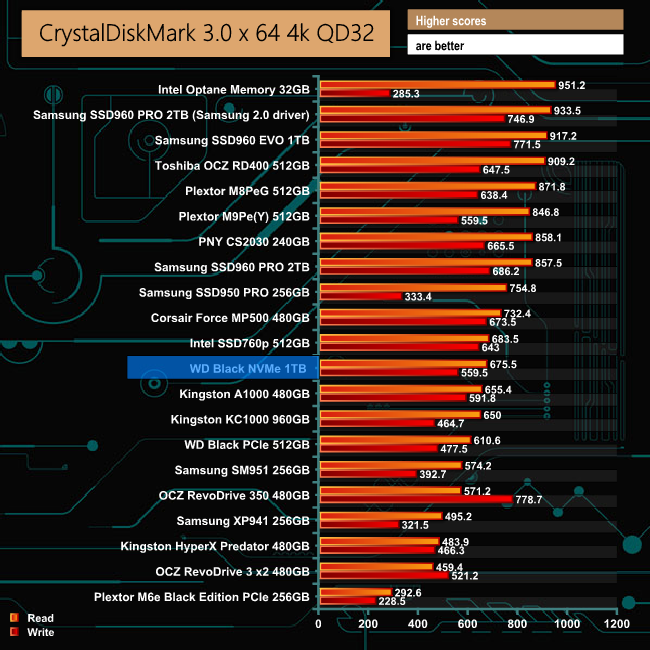
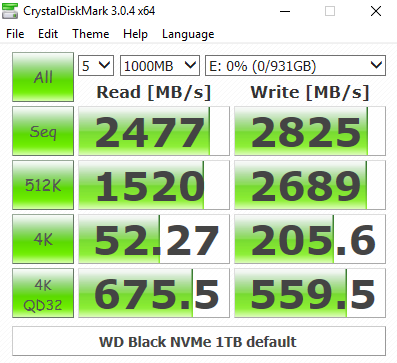
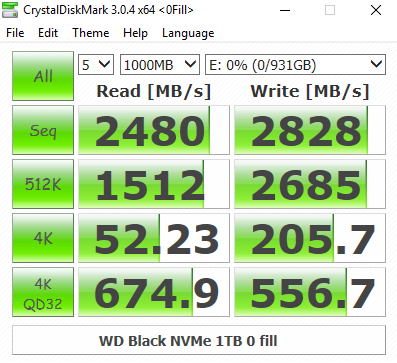
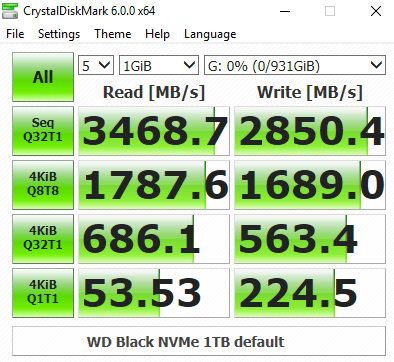
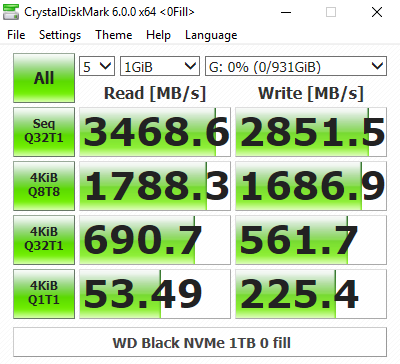
In CrystalDiskMark's 4K QD32 test the WD NVMe Black isn't quite as fast as Intel's latest SSD760p drive. At a QD of 1, though, the 4K Write performance is pretty good at 205.6MB/s. Comparing the default benchmark screen with the 0 fill test, it seems the new WD controller isn't concerned about the type of data it's being asked to handle.
The ATTO Disk Benchmark performance measurement tool is compatible with Microsoft Windows. Measure your storage systems performance with various transfer sizes and test lengths for reads and writes. Several options are available to customise your performance measurement including queue depth, overlapped I/O and even a comparison mode with the option to run continuously.
Use ATTO Disk Benchmark to test any manufacturers RAID controllers, storage controllers, host adapters, hard drives and SSD drives and notice that ATTO products will consistently provide the highest level of performance to your storage.
Once again we are upgrading which ATTO version we are using for NVMe drives, so we have also included the result screenshot from the new version.
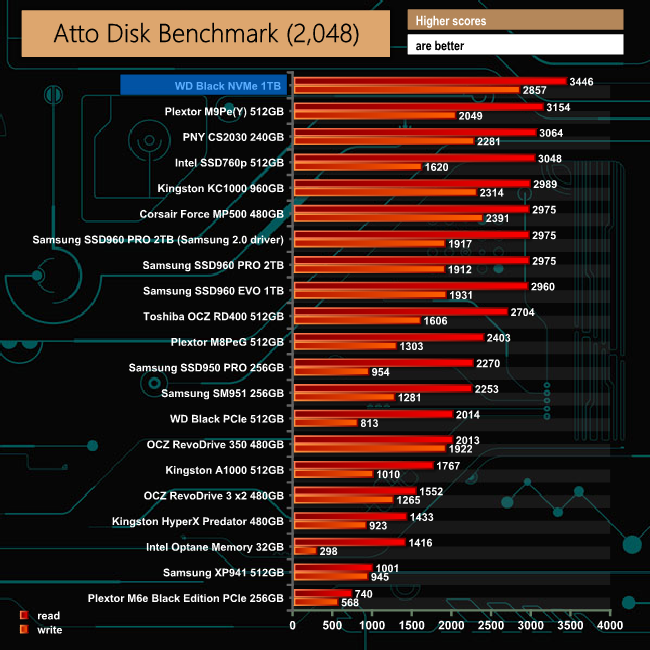
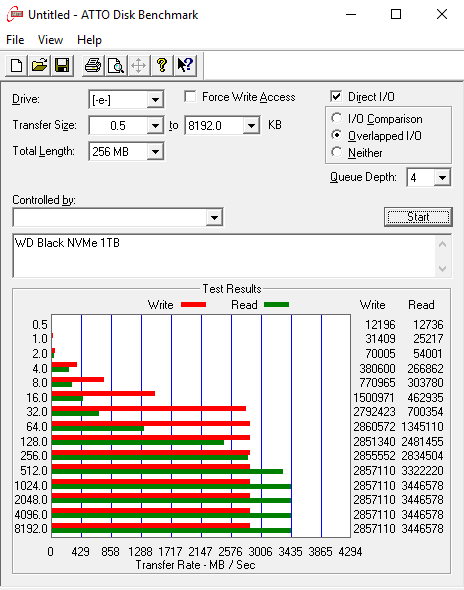
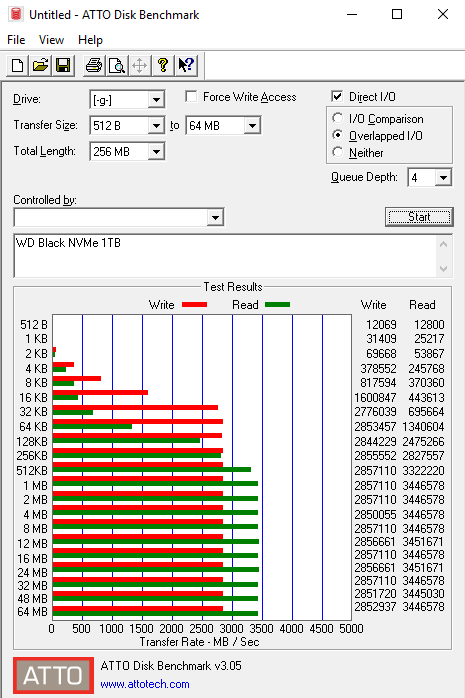
WD's official sequential figures for the 1TB drive are up to 3,400MB/s for reads and up to 2,800MB/s for writes. Using the ATTO benchmark we were able to confirm these speeds as the drive produced a read score of 3,446MB/s with writes coming in at 2,857MB/s. Both of these numbers make the WD Black NVMe 1TB the fastest consumer drive we have tested to date.
AS SSD is a great free tool designed just for benching Solid State Drives. It performs an array of sequential read and write tests, as well as random read and write tests with sequential access times over a portion of the drive. AS SSD includes a sub suite of benchmarks with various file pattern algorithms but this is difficult in trying to judge accurate performance figures.
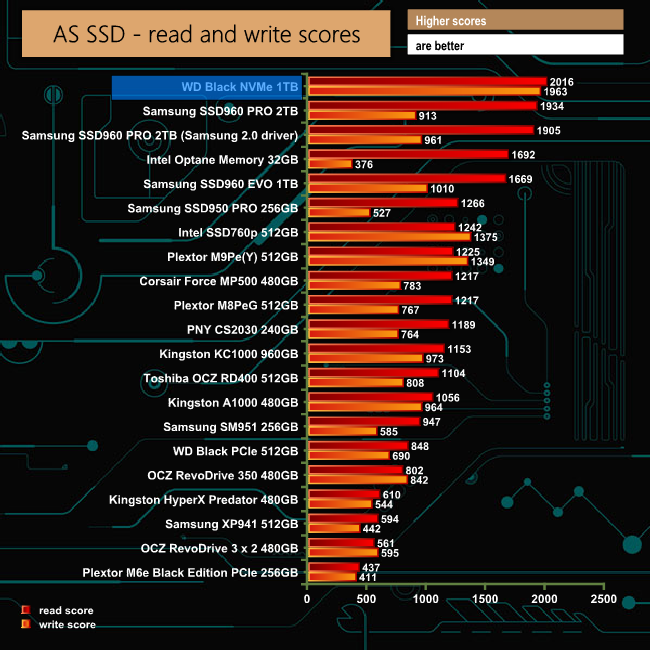
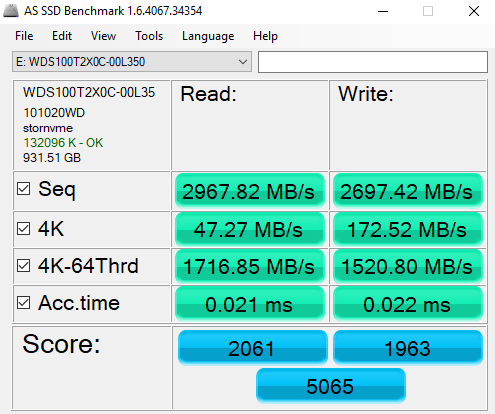
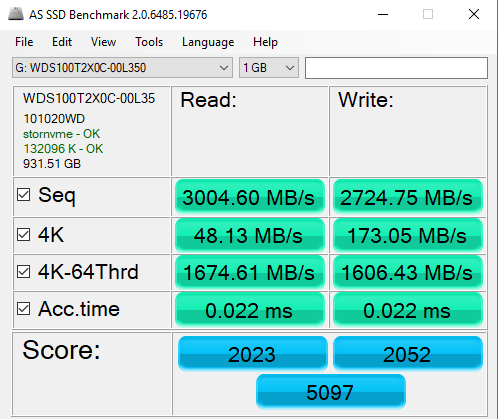
As with the ATTO benchmark, the drive's performance in the AS SSD benchmark is very impressive. The read score of 2016 and the 1963 for writes are again the fastest we have seen for a consumer drive to date.
IOMeter is another open source synthetic benchmarking tool which is able to simulate the various loads placed on hard drive and solid state drive technology.
We test with both random read and write 4k tests. There are many ways to measure the IOPS performance of a Solid State Drive, so our results will sometimes differ from manufacturer’s quoted ratings. We do test all drives in exactly the same way, so the results are directly comparable.
We are in the process of upgrading our IOMeter tests to include the following tests. Each is run five times.
128KB Sequential Read / Write.
Transfer Request Size: 128KB Span: 8GB Thread(s): 1 Outstanding I/O: 1-32 Test Run: 20 minutes per test
4K Sustained Random Read / Write.
Transfer Request Size: 4KB Span: 80GB Thread(s): 4 Outstanding I/O: 1-32 Test Run: 20 minutes per test
4K Random 70/30 mix Read/Write.
Transfer Request Size: 4KB Span: 80GB Reads: 70% Writes: 30% Thread(s): 4 Outstanding I/O: 2 – 32 Test Run: 20 minutes
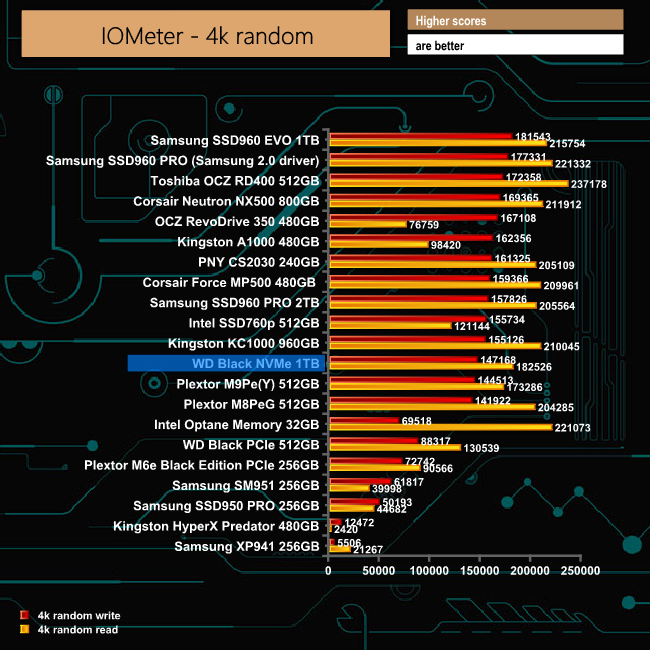
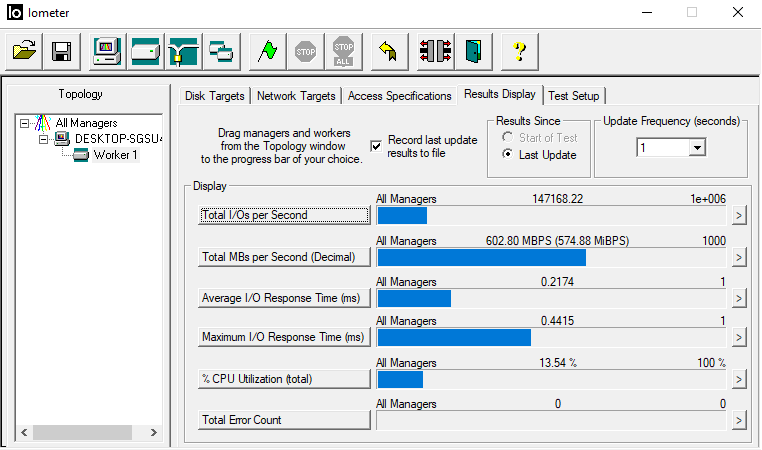
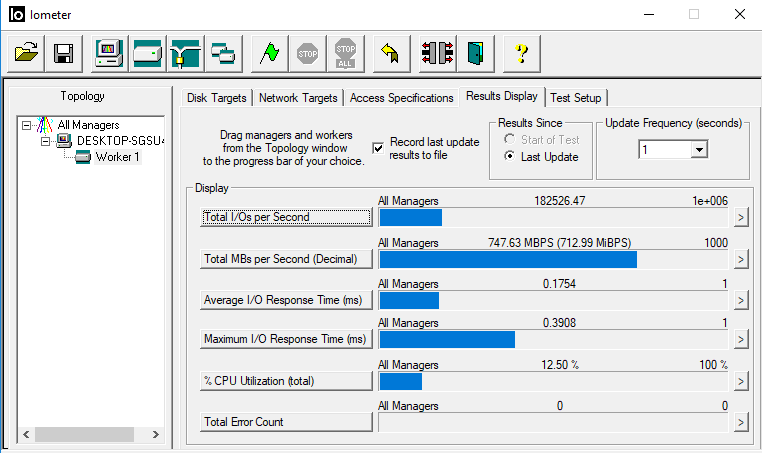
The WD Black NVMe 1TB drive didn't get anywhere near the official figures in our original IOMeter 4K random tests, but once we ran our extended set of tests, the performance of the drive improved greatly.
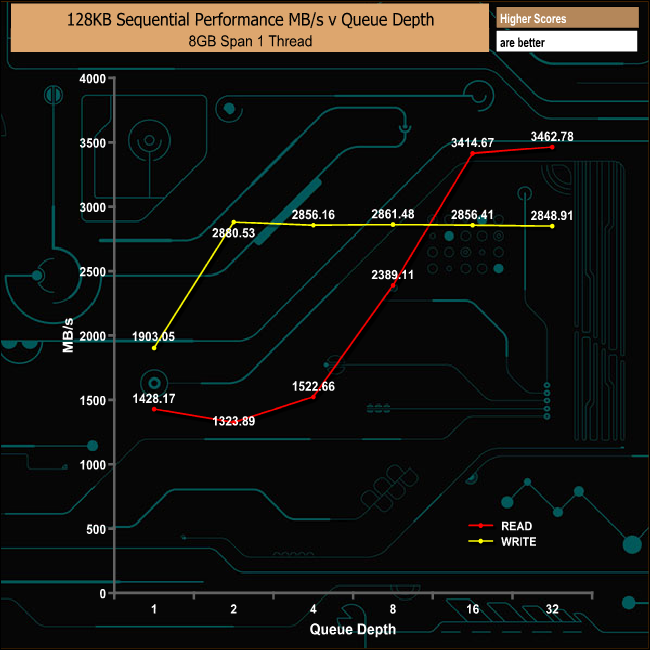

Testing the drive's sequential performance at varying queue depths saw the read performance increase with queue depth until it just surpassed the official maximum figure of 3,400MB/s at 3,462MB/s at a queue depth of 32. Writes, on the other hand, more or less peaked after the initial jump in performance between queue depths 1 & 2, with the peak coming at QD2 and a speed of 2,880MB/s.
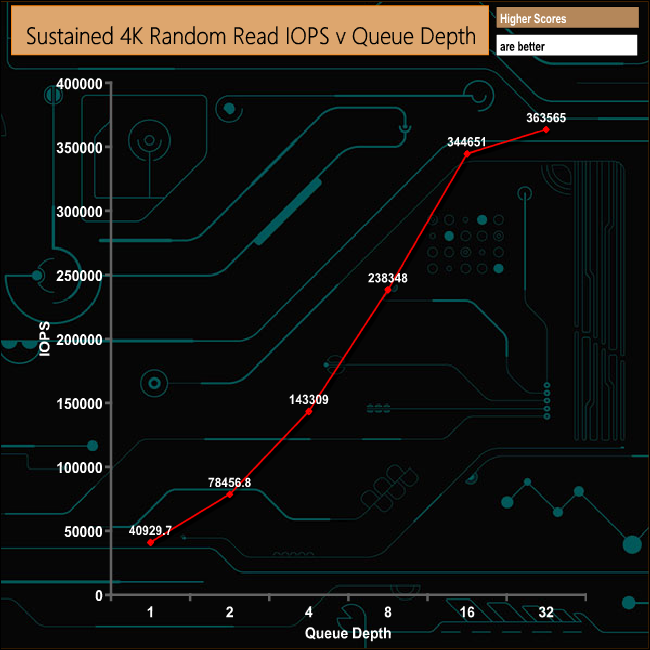
The official random read figure for the 1TB drive is up to 500,000 IOPS. Despite the fact that during our testing the drive couldn't match the official maximum speed, the tested figure of 363,565 IOPS makes the WD Black NVMe a very quick consumer drive regardless.
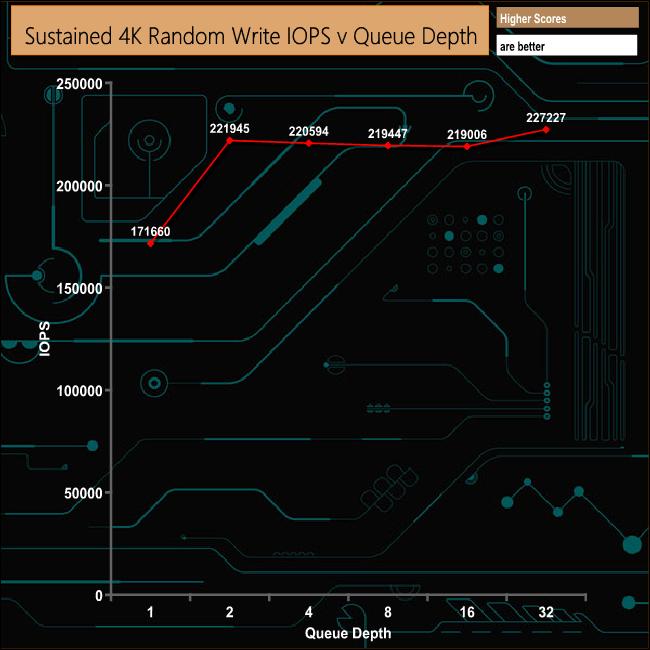
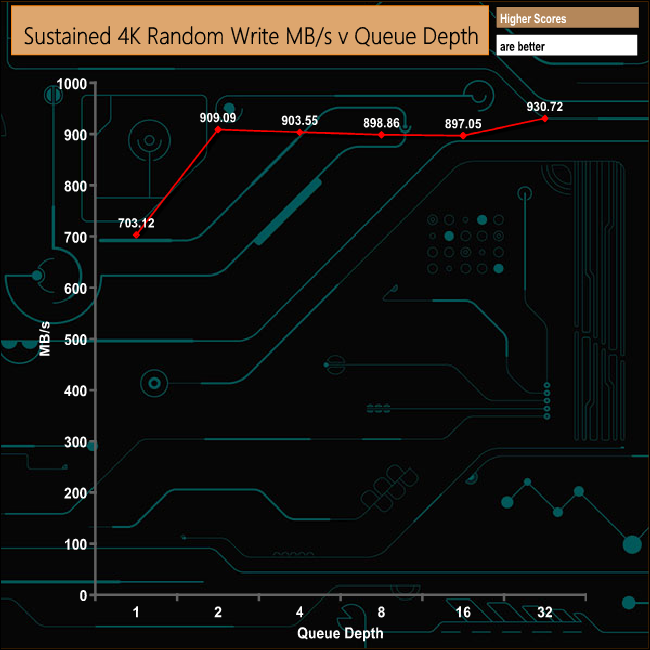
As with the 4K random read result, our 4K random write figure of 227,227 IOPS fell well short of the quoted official maximum of up to 400,000 IOPS. But even so, the test result figure is still very good for a consumer drive.
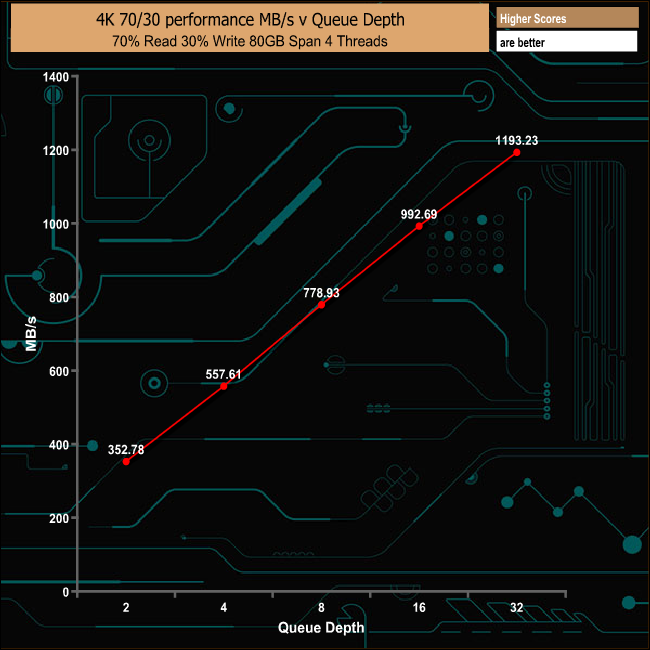
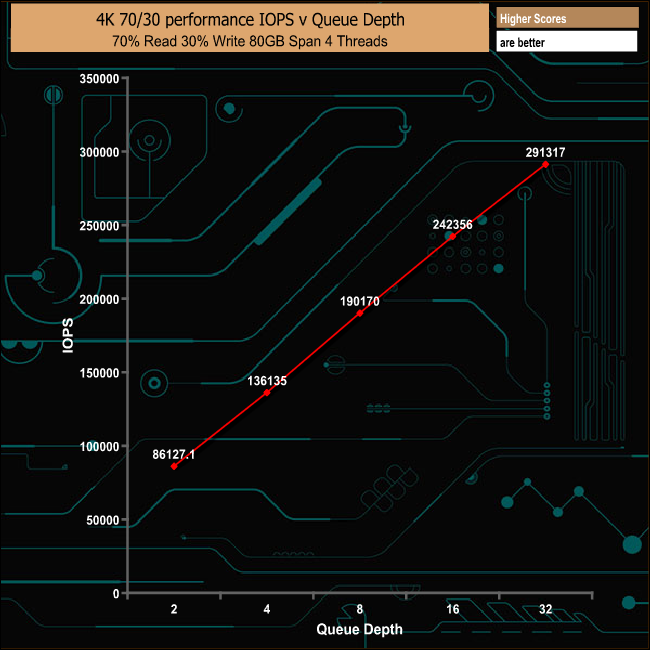
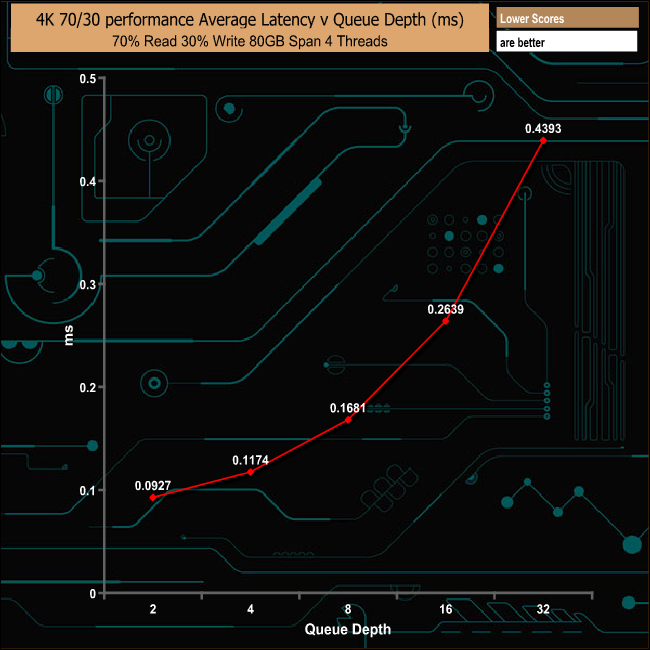
The WD Black NVMe handled the mixed 70/30 test very well indeed with a peak performance of 1193.23MB/s at a QD of 32.
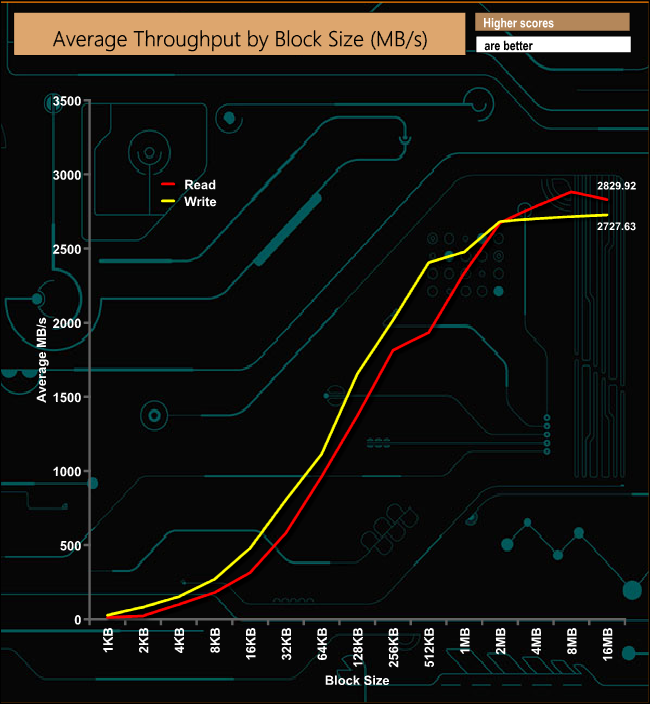
The WD Black NVMe produced very strong figures for both read and writes in out throughput test, without any serious drops in performance on the way to peaks of 2,829.92MB/s for reads and 2,727.63MB/s for writes.
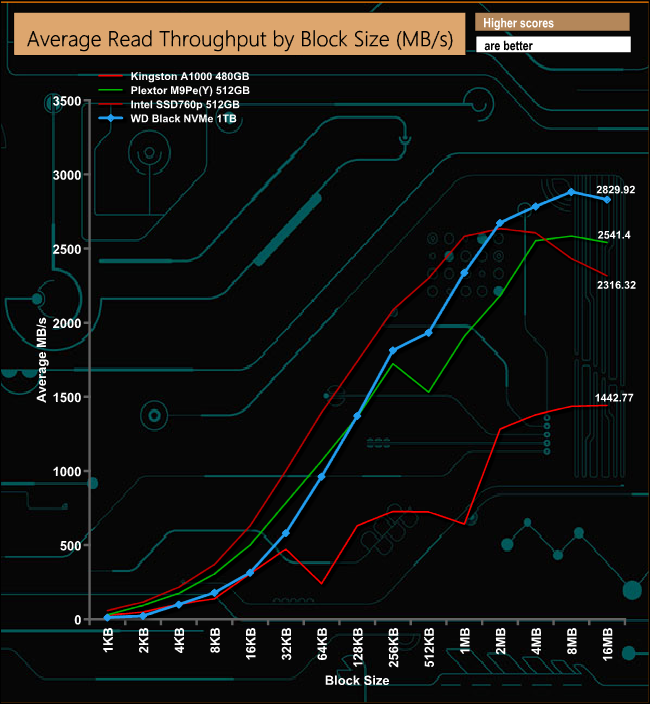
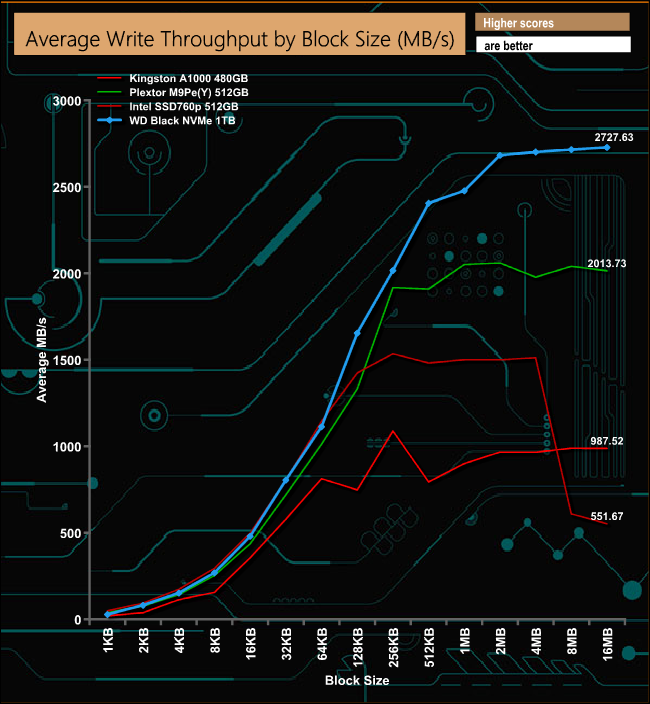
The WD Black NVMe showed the fastest average read and write throughput speeds when compared to three other recently tested drives, but bear in mind the Intel 760p and Kingston A1000 drives are entry level NVMe drives whereas the Black NVMe is very much a performance drive.
Futuremark’s PCMark 8 is a very good all round system benchmark but it’s Storage Consistency Test takes it to whole new level when testing SSD drives. It runs through four phases; Preconditioning, Degradation, Steady State, Recovery and finally Clean Up. During the Degradation, Steady State and Recovery phases it runs performance tests using the 10 software programs that form the backbone of PCMark 8; Adobe After Effects, Illustrator, InDesign, Photoshop Heavy and Photoshop Light, Microsoft Excel, PowerPoint, Word, Battlefield 3 and World of Warcraft. With some 18 phases of testing, this test can take many hours to run.
Preconditioning
The drive is written sequentially through up to the reported capacity with random data, write size of 256 × 512 = 131,072 bytes. This is done twice.
Degradation
Run writes of random size between 8 × 512 and 2048 × 512 bytes on random offsets for 10 minutes. It then runs a performance test. These two actions are then repeated 8 times and on each pass the duration of random writes is increased by 5 minutes.
Steady State
Run writes of random size between 8 × 512 and 2048 × 512 bytes on random offsets for final duration achieved in degradation phase. A performance test is then run. These actions are then re-run five times.
Recovery
The drive is idled for 5 minutes. Then a performance test is run. These actions are then repeated five times.
Clean Up
The drive is written through sequentially up to the reported capacity with zero data, write size of 256 × 512 = 131,072 bytes.
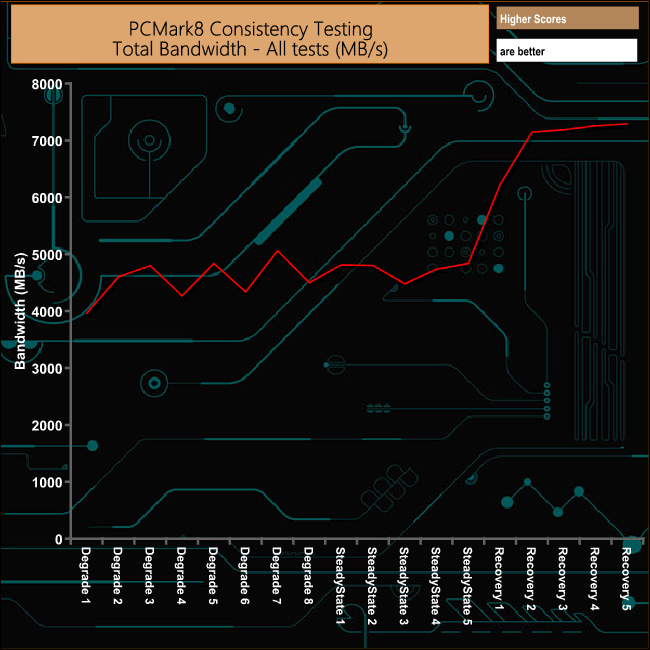

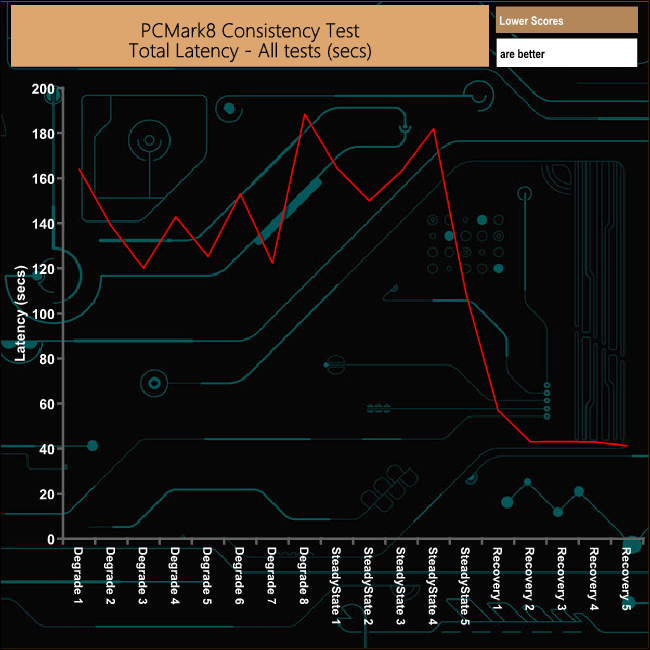
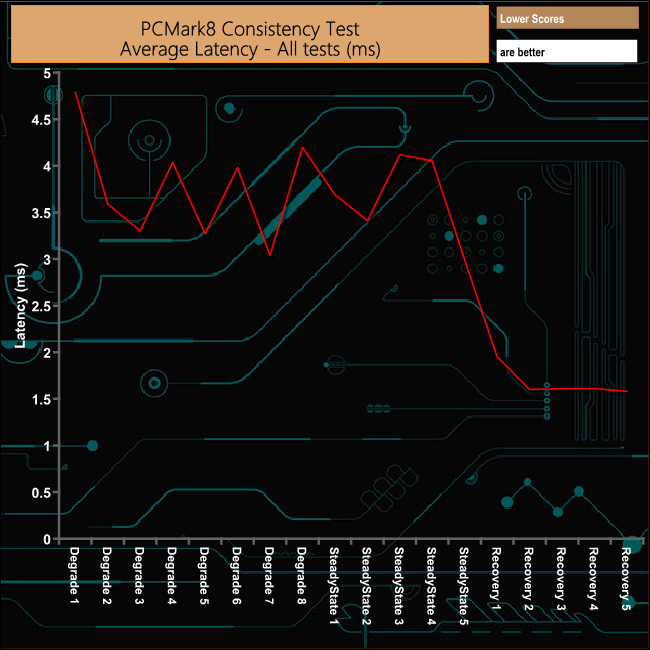
Overall, the 1TB WD Black NVMe did very well in the PCMark 8 Consistency test. There were small dips in performance across the Degradation runs 4, 6 and 8 and again in the third SteadyState run but the drive recovered from the test very well indeed.
PCMark 8’s Consistency test provides a huge amount of performance data, so here we’ve looked a little closer at how the 1TB WD Black NVMe performs in each of the benchmark's test suites.
Adobe Creative Cloud
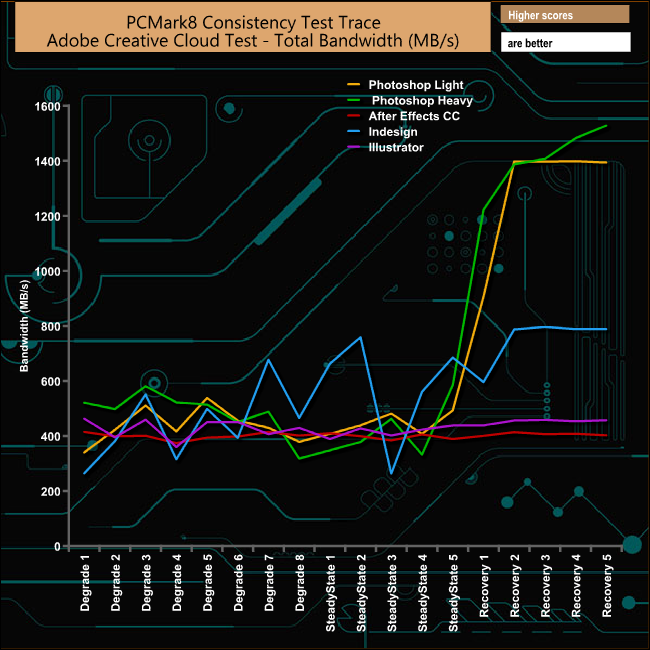
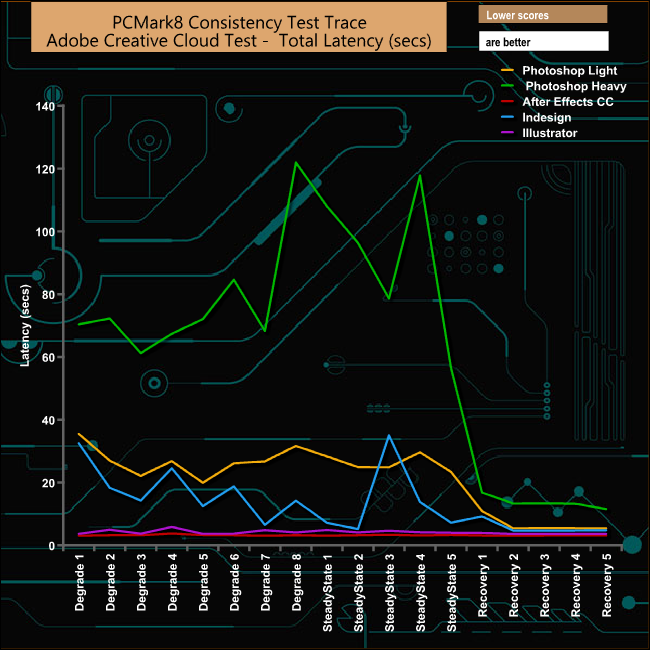
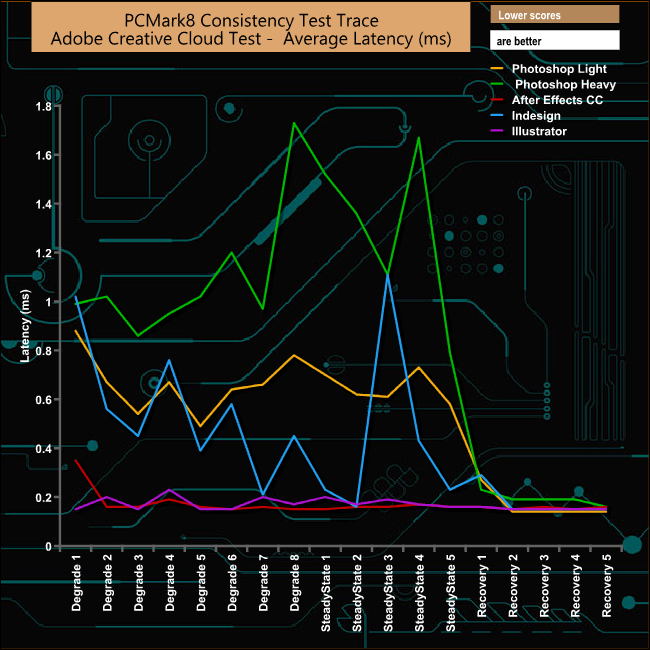
In the Adobe CC suite of tests, the drive did take some hits in performance during the Degradation and Steady State phases but it recovered very well, particularly in the two demanding Photoshop test traces.
Microsoft Office
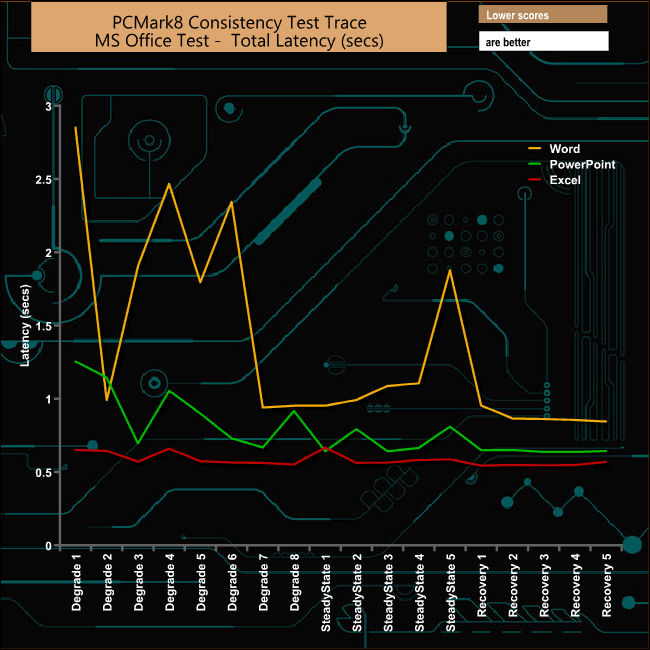
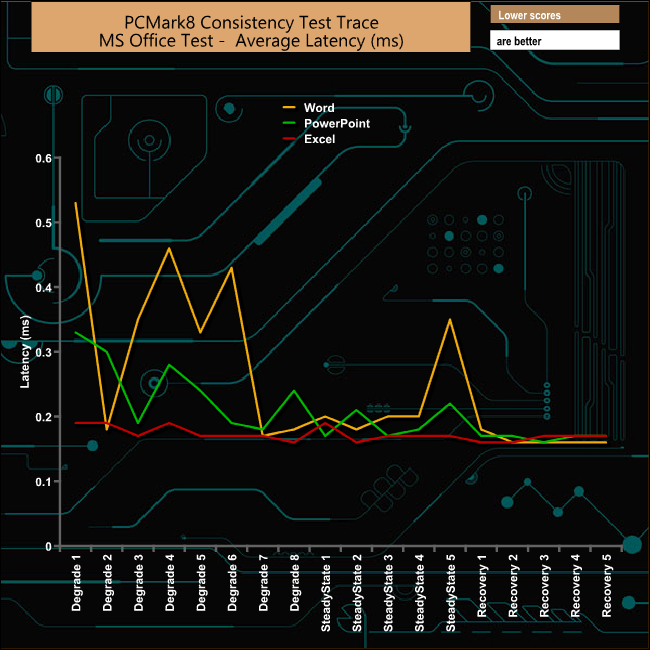
Both the MS Office and PowerPoint tests display significant drops in performance throughout the test phases, but more importantly the performance for both traces during the Recovery runs is first rate.
Casual Gaming
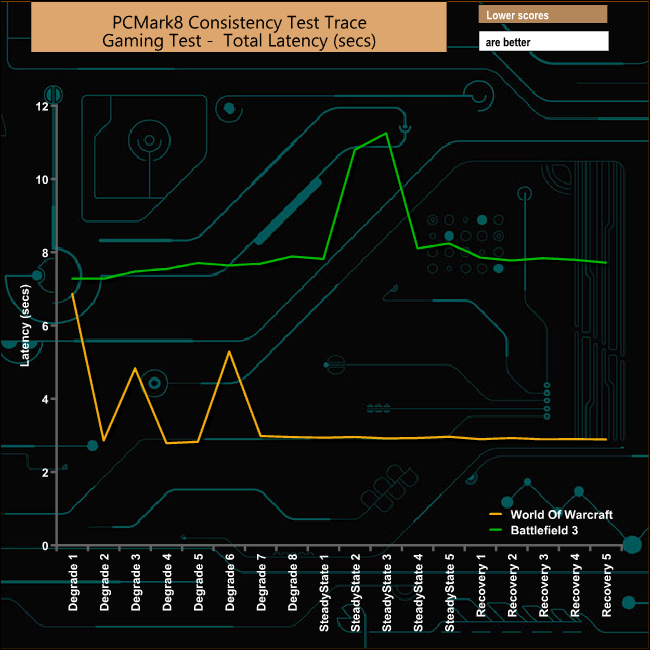
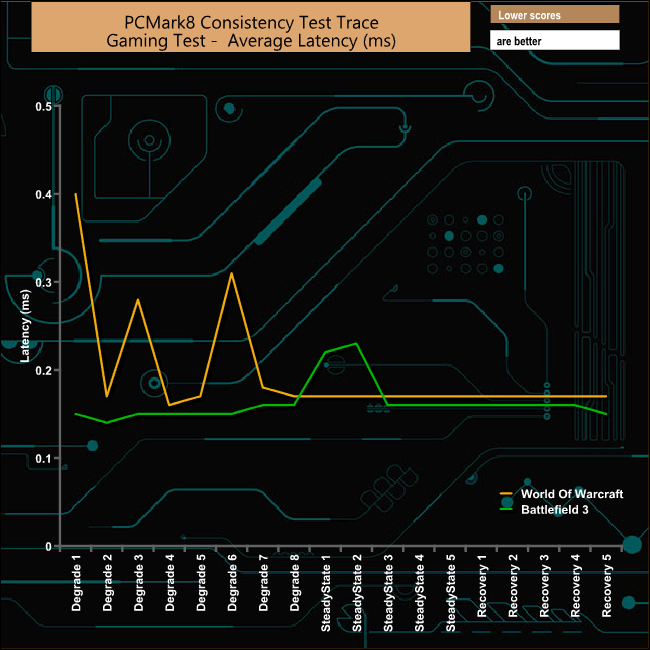
The drive was hit hard during the Degradation phases of the World Of Warcraft test, but after that the performance steadied throughout the Steady State and Recovery phases. The drive also suffered with the second and third Steady State phases during the Battlefield 3 test but recovered well from the ordeal.
Just like the Consistency test, PCMark 8’s standard Storage test also saves a large amount of performance data. The default test runs through the test suite of 10 applications three times. Here we show the total bandwidth performance for each of the individual test suites for the third and final benchmark run.

The drive's performance in PCMark 8's Standard benchmark is impressive, particularly when it comes to how it handled the two demanding Adobe Photoshop tests, with over 1,000MB/s bandwidth results for both, 1,525MB/s for the Photoshop Heavy test and 1,311MB/s for the Photoshop Light test.
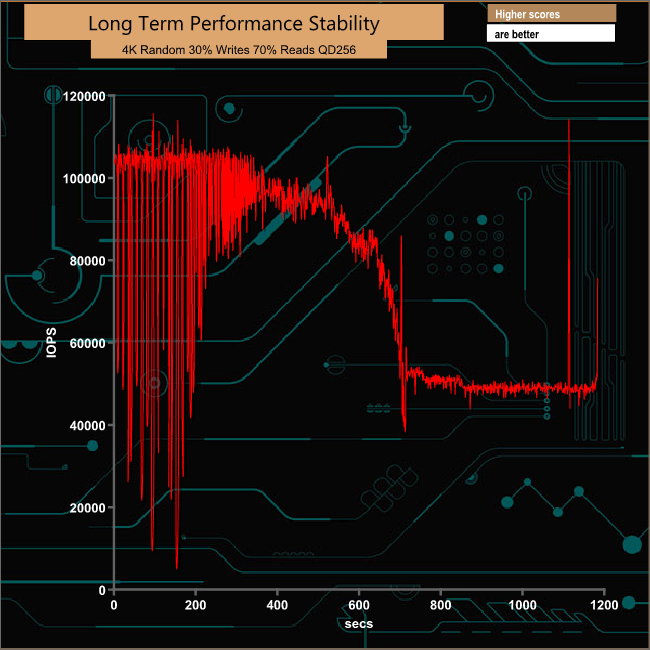
For the long term performance stability test, we set the drive up to run a 20-minute 4K random test with a 30% write/70% read split, at a queue depth of 256 over the entire disk. The 1TB WD Black NVMe averaged 75,539 IOPS for the test with a performance stability of 72%.
To test real life performance of a drive we use a mix of folder/file types and by using the FastCopy utility (which gives a time as well as MB/s result) we record the performance of drive reading from & writing to a 256GB Samsung 850 PRO.
We use the following files/folders:
100GB data file.
60GB ISO image.
60GB Steam folder – 29,521 files.
50GB File folder – 28,523 files.
12GB Movie folder – 24 files (mix of Blu-ray and 4K files).
10GB Photo folder – 621 files (mix of .png, raw and .jpeg images).
10GB Audio folder – 1,483 files (mix of mp3 and .flac files).
5GB (1.5bn pixel) photo.
![]()
Although the drive had no problems with our suite of real life file transfer tests, it much prefers dealing with large files than small bity files as can be seen with the results for the 60GB Steam, 50GB File and 10GB Audio folders when compared against any of the other tests.
![]()
To get a better idea of what this drive can deliver in terms of real life transfer speeds, we took our SATA SSD drive out of the equation and instead tested the drive writing and reading files to and from another NVMe drive, in this case a 512GB Toshiba/OCZ RD400. This gave us some spectacular results. particularly when it came to handling the large files in the 12GB Movie folder and the 5GB image.
WD's Black label has always been reserved for high performance disks and it has to be said that the original Black PCIe drive was disappointing. There were many that thought it should have actually been released as a Blue label product.
Now WD has delivered a drive in the shape of the WD Black NVMe that not only casts aside the disappointment of the original drive, but has got the company a seat on the top table of high performance drives. It is certainly worthy of carrying the Black moniker.
The Black NVMe sees the introduction of WD's own in-house controller which now gives the company a vertically integrated SSD platform and allows them to join that very select group of SSD manufacturers that have all the major components of a drive under their own control. Having everything in-house allows for better quality control over individual components and, more importantly in a particularly cut-throat market, a firm hand on pricing.
WD's new controller is built on a 28nm process using a tri-core architecture. It uses the latest WD nCache 3.0 intelligent tiered caching technology to boost performance, and unlike its competitors' use of caching technology which uses flexible sizing of the SLC cache, WD's nCache 3.0 uses a SLC cache that is fixed in size which saves the hassle of converting blocks from SLC usage to TLC and vice versa.
The controller also features advanced layered LDPC (Low-Density Parity Check) error correction technology, although it doesn't support Full Disk Encryption or both Microsoft's eDrive and TCG Opal encryption technologies.
Regardless, WD is back with a bang with its WD Black NVMe, and although the pricing for the 1TB drive may seem high, it is pretty competitive when compared to most of the drives in this market segment. In terms of sequential read/write performance, it is the fastest consumer drive we've tested to date.
![]()
We found the 1TB WD Black NVMe drive available from Overclockers UK for £219.99 (inc VAT) HERE (updated April 2019)
Pros
- Performance.
- WD controller.
- Five year warranty.
Cons
- The 4K performance was a little disappointing in some of the tests.
KitGuru says: It's taken a while but finally we've got an NVMe M.2 drive worthy of carrying WD's Black label for high-performance drives… and then some.