

We leave the system to idle on the Windows 10 desktop for 10 minutes before taking a power draw reading (and averaging the result, if necessary due to Ryzen's sensor drift). For CPU load results, we read the power draw while producing approximately 5 minutes worth of runs of the Cinebench R20 multi-threaded test. We also run 10 minutes of AIDA64 stress test.
Both Cinebench and AIDA64 are used as some CPUs – most notably Intel's Core processors when operating under default turbo conditions – will heavily reduce their clock speed with the AIDA64 workload, thus giving an unrepresentative reading.
The power consumption of our entire test system (at the wall) is shown in the chart. The same test parameters were used for temperature readings.
Power Consumption
Power draw readings are accurate to around +/-5W under heavy load due to instantaneous fluctuations in the value. We use a Titanium-rated Seasonic 1000W Prime PSU (with 8-pin plus 4-pin or 8-pin plus 8-pin power connectors where possible).
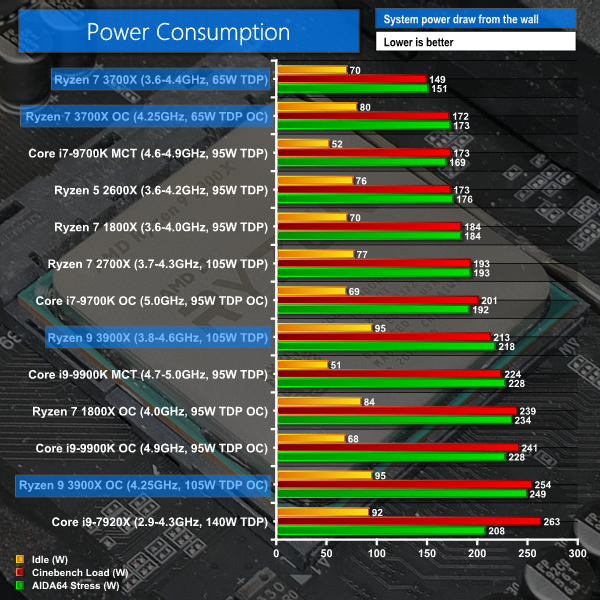
Power consumption is an area where AMD performs particularly well with Ryzen 3000. Focusing first on the 12-core Ryzen 9 3900X, maximum CPU-load system draw from the wall was just under 220W compared to just under 230W for the Core i9-9900K. Looking at the Cinebench numbers, that same 10 Watt delta between the two CPUs holds consistent, despite the Ryzen part’s significant performance advantage.
As is the case for AMD’s smart Precision Boost 2 algorithm, these numbers will depend upon factors such as cooling potential, motherboard VRM quality, and individual CPU silicon. Nevertheless, AMD’s Zen 2 12-core part pulling less juice from the wall than Intel’s eight-core 9900K is impressive to see.
The Ryzen 7 3700X is the real power consumption king, maintaining system-wide power draw of around 150W at full CPU load. That’s a full 75W less than the 9900K which the 3700X manages to compete against in Cinebench R20.
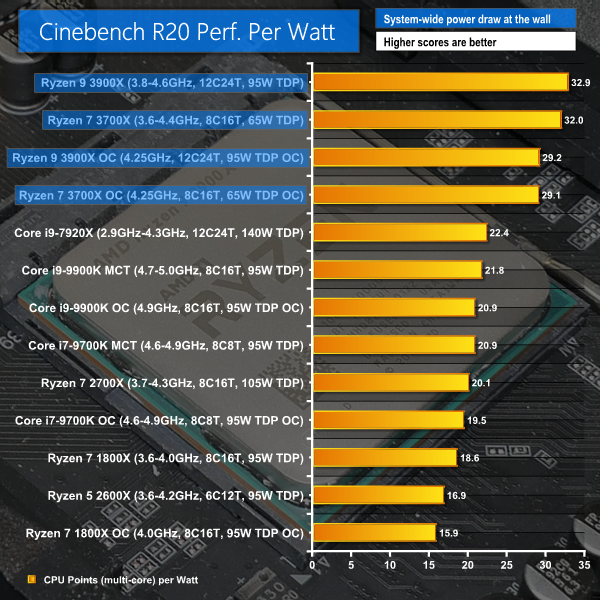
Cinebench performance per Watt numbers show that Ryzen 3000 chips are in a league of their own with values of 32.0 for the 3700X and 32.9 for the 3900X, compared to 20.9 for the 9700K and 21.8 for the 9900K. Blender shows the same performance per Watt trend.
Temperatures
Temperature recordings were taken using a 240mm Corsair H100X all-in-one liquid cooler with its two fans running at their 1700 RPM maximum. Ambient temperatures were around 25-27°C in the hot UK summer weather (and normalised to 25°C where there were slight fluctuations).
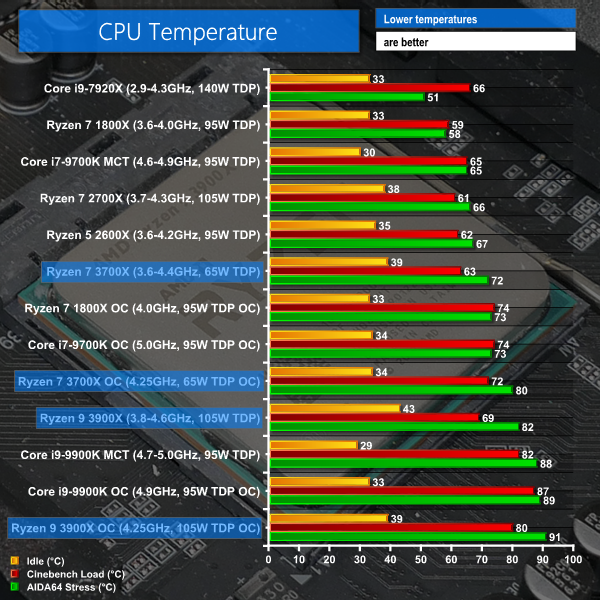
Using a 240mm AIO, the Ryzen 9 3900X certainly takes the cooling capacity available and throws its Precision Boost 2 algorithm at it. Sustained stress test load in AIDA64 pushed the CPU temperature to 82C, though Cinebench did tend to stay at a lower level. Throw overclocking into the mix and it is difficult to cool our tested 1.35-4V VCore unless your ambient levels are lower than the typical UK house in summer weather. This looks like a CPU that could benefit from a high performance 360mm AIO or full custom liquid cooling if you want to push past 1.4V.
The Ryzen 7 3700X also proved to be a hot runner, pushing past 70C in our AIDA stress test. The more manageable heat output of this chip means that strong air coolers such as the be quiet! Dark Rock Pro 4 can be used to cool it comfortably out of the box and also when overclocked with 1.35-1.40V.
Temperatures for Ryzen 3000 are high – there’s no denying that. AMD’s Precision Boost 2 algorithm pushes CPU performance when there’s headroom, so don’t necessarily expect to see lower temperatures with improved cooling configurations as the algorithm is likely to simply push frequency further.