

Here we present frame rate figures for each graphics card, averaged across all 12 games on test today. These figures can disguise significant variations in performance from game to game, but provide a useful overview of the sort of performance you can expect at each resolution tested.
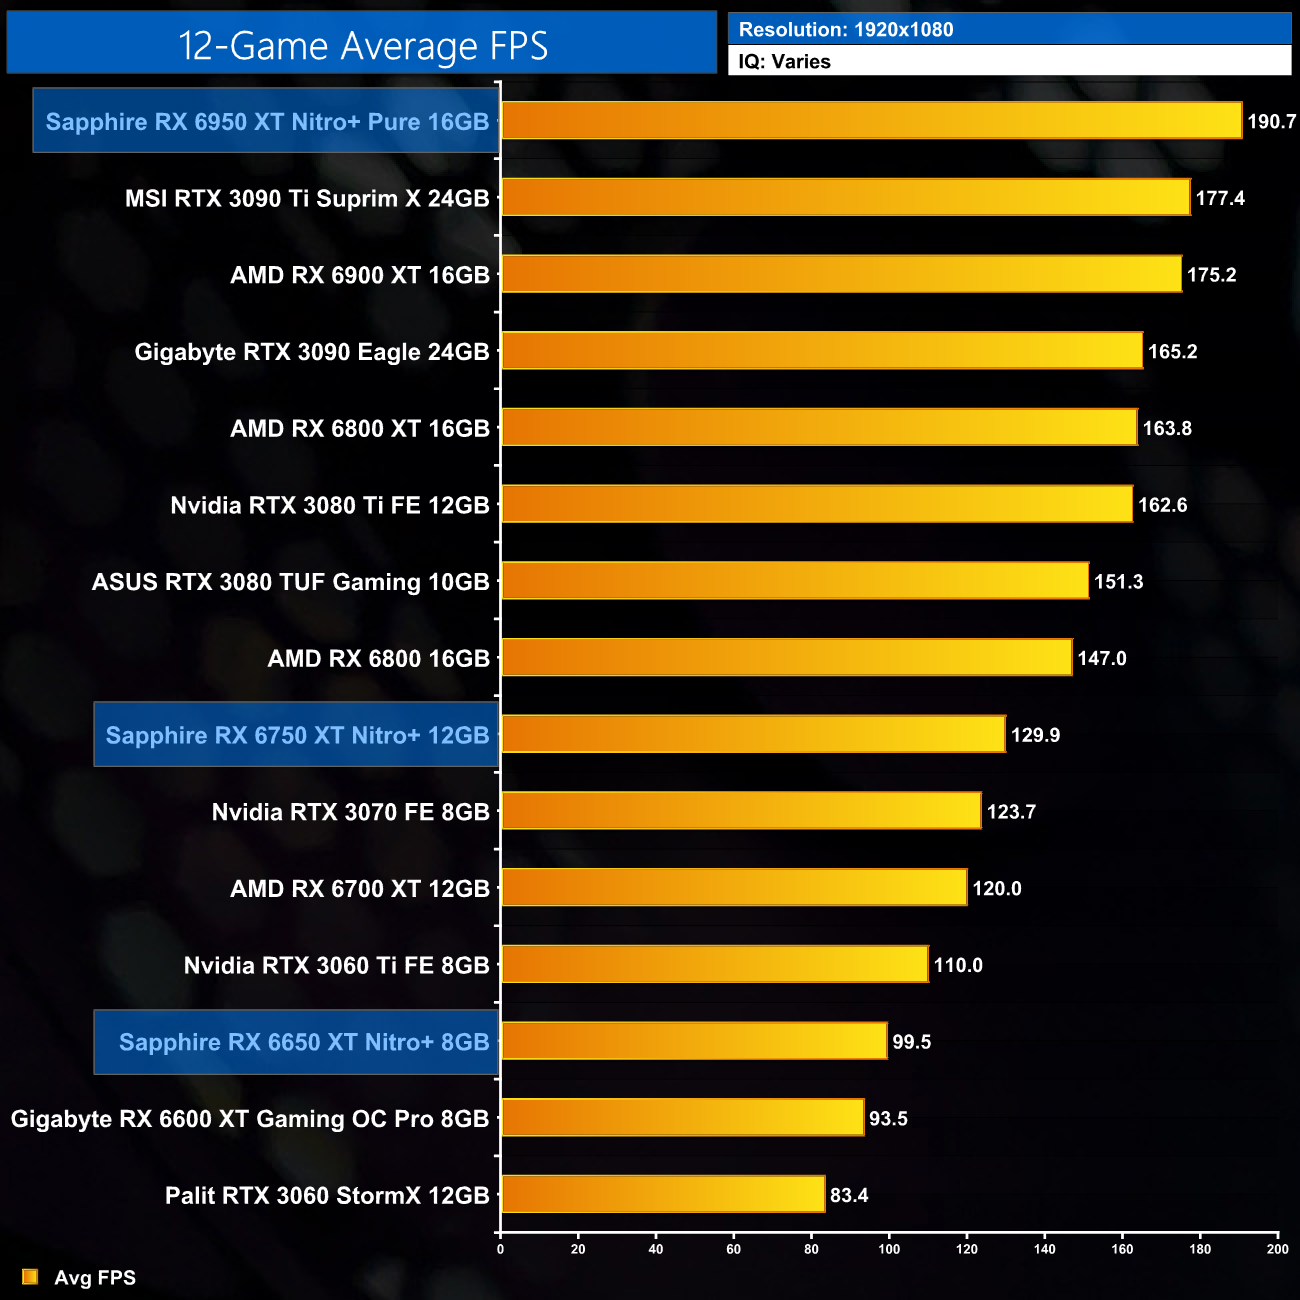
Averaged across our 12 games, at 1080p the Sapphire RX 6650 XT Nitro+ ran 6% faster than the RX 6600 XT, while the 6750 XT proved 8% faster than the RX 6700 XT. The big dog, the RX 6950 XT, ran 9% faster than the vanilla RX 6900 XT, which isn't too shabby.
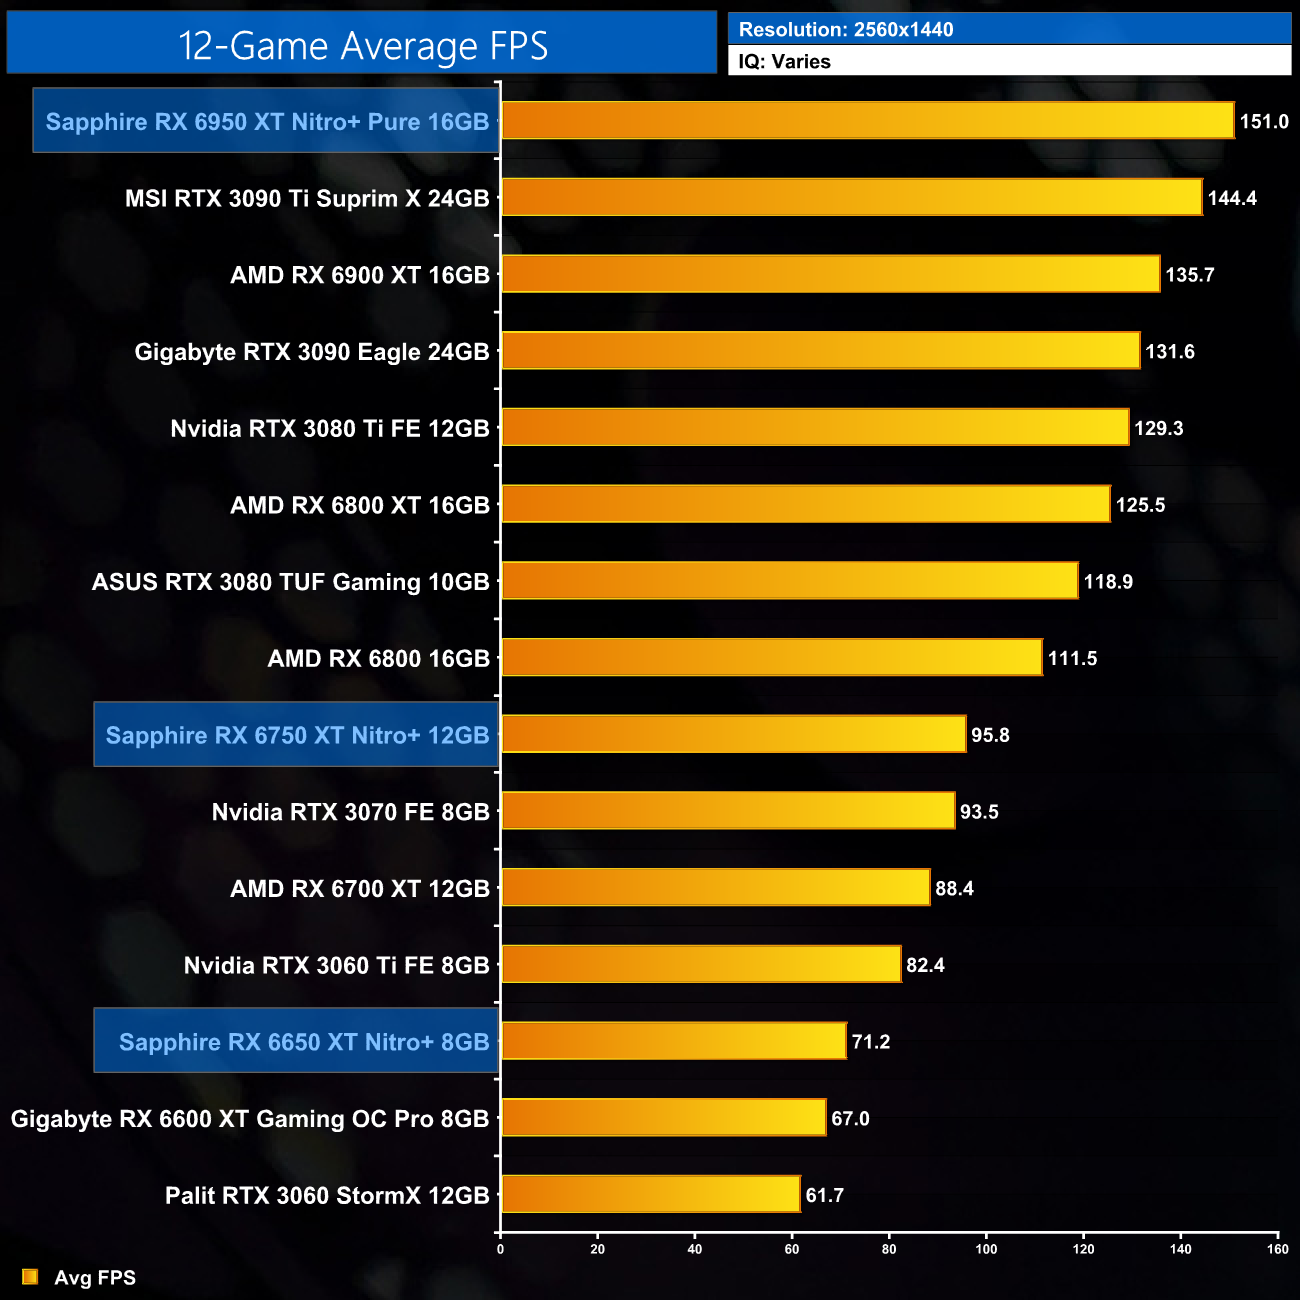
Up at 1440p, both the RX 6650 XT and RX 6750 XT scale exactly the same as they do at 1080p, so we're talking gains of 6% and 8%, respectively. The RX 6950 XT is more impressive, delivering an extra 11% when compared to the RX 6900 XT.
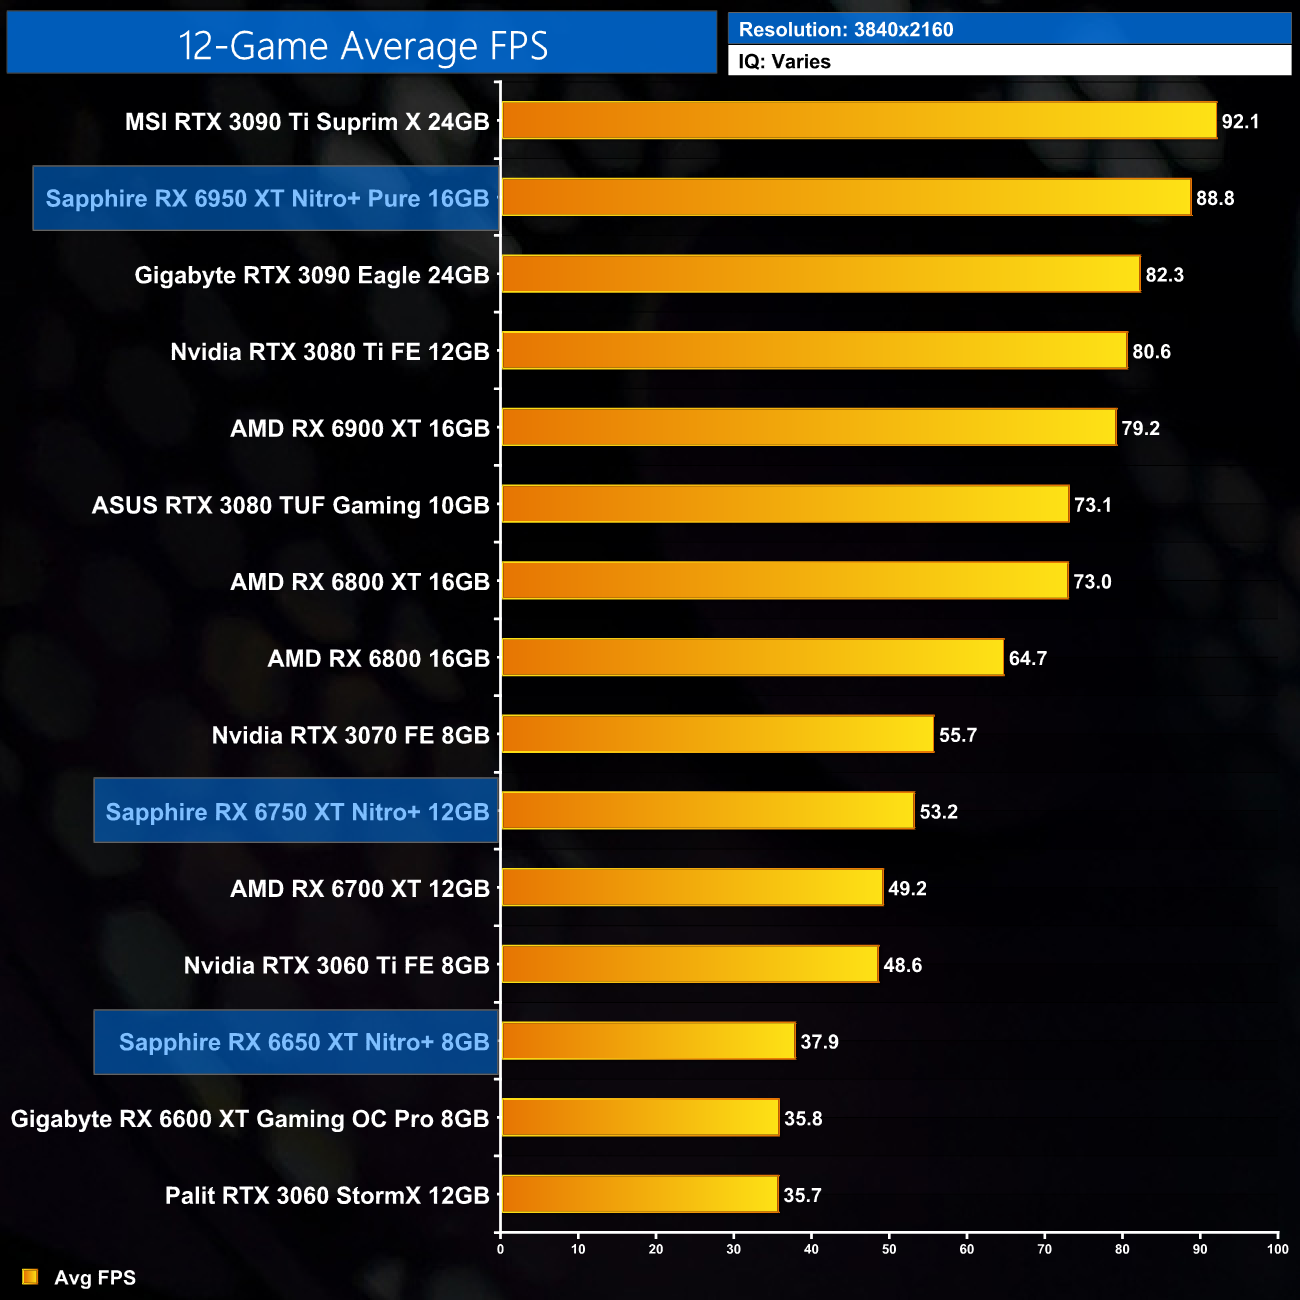
Then at 4K, once more the RX 6650 XT is 6% faster than the RX 6600 XT, while the RX 6750 XT is still 8% faster than the vanilla 6700 XT. At its very best, the RX 6950 XT delivers 12% more performance than AMD's previous flagship, the RX 6900 XT.
I have already mentioned this, but I do just want to stress that these results are very much a best case scenario for the RX 6X50 series, as we are testing Sapphire's heavily overclocked Nitro+ cards. The RX 6950 XT Nitro+ Pure, for instance, ships with an 11% factory overclock compared to the reference RX 6950 XT. As ever other card we have tested, bar the MSI RTX 3090 Ti, has been benchmarked at reference clock speed, this will slightly skew the data. If we were comparing reference models against reference models, I would expect smaller margins than what is shown here.