
Launching alongside AMD's flagship RX 7900 XTX, today we can present our review of the RX 7900 XT, the least expensive of the two 7900 series cards, though it still hits the market at £899.99. Offering a cut-down Navi 31 experience, AMD will hope that the 7900 XT can entice those who want a high-end gaming GPU, but perhaps don't want to go all out on an XTX. We're certainly not sure about the name scheme, but can the XT do enough to earn a recommendation?
Announced alongside the RX 7900 XTX at AMD's event in Las Vegas, the Radeon RX 7900 XT has gone under the radar somewhat. In that initial announcement, the company didn't show a single benchmark for the XT, focusing instead on the XTX, and it was only a couple of weeks later than we saw the first 7900 XT benchmarks.
Built on the same RDNA 3 architecture and Navi 31 silicon as the full-fat XTX model, the 7900 XT has simply been trimmed back somewhat, offering fewer cores and less memory in a lower-power package. But will it be enough to step out from the XTX's shadow? That's what we will find out today…
It's also worth noting that while this is a standalone review for the RX 7900 XT, we do also have a day one review for the RX 7900 XTX, and you can find that HERE.
If you want to read this review as a single page, click HERE.
| RX 7900 XTX | RX 7900 XT | RX 6950 XT | RX 6900 XT | RX 6800 XT | RX 6800 | |
| Architecture | RDNA 3 | RDNA 3 | RDNA 2 | RDNA 2 | RDNA 2 | RDNA 2 |
| Manufacturing Process | 5nm GCD + 6nm MCD | 5nm GCD + 6nm MCD | 7nm | 7nm | 7nm | 7nm |
| Transistor Count | 57.7 billion | 57.7 billion | 26.8 billion | 26.8 billion | 26.8 billion | 26.8 billion |
| Die Size | 300 mm² GCD 220 mm² MCD | 300 mm² GCD 220 mm² MCD | 519 mm² | 519 mm² | 519 mm² | 519 mm² |
| Ray Accelerators | 96 | 84 | 80 | 80 | 72 | 60 |
| Compute Units | 96 | 84 | 80 | 80 | 72 | 60 |
| Stream Processors | 6144 | 5376 | 5120 | 5120 | 4608 | 3840 |
| Game GPU Clock | Up to 2300MHz | Up to 2000 MHz | Up to 2100MHz | Up to 2015MHz | Up to 2015MHz | Up to 1815MHz |
| Boost GPU Clock | Up to 2500 MHz | Up to 2400 MHz | Up to 2310MHz | Up to 2250MHz | Up to 2250MHz | Up to 2105MHz |
| ROPs | 192 | 192 | 128 | 128 | 128 | 96 |
| AMD Infinity Cache | 96MB | 80MB | 128MB | 128MB | 128MB | 128MB |
| Memory | 24GB GDDR6 | 20GB GDDR6 | 16GB GDDR6 18Gbps | 16GB GDDR6 16Gbps | 16GB GDDR6 | 16GB GDDR6 |
| Memory Bandwidth | 960 GB/s | 800 GB/s | 576 GB/s | 512 GB/s | 512 GB/s | 512 GB/s |
| Memory Interface | 384-bit | 320-bit | 256-bit | 256-bit | 256-bit | 256-bit |
| Board Power | 355W | 315W | 335W | 300W | 300W | 250W |
First, let's take a quick look at the specs. We've already covered the key figures in our announcement article, but it's worth recapping the core details here.
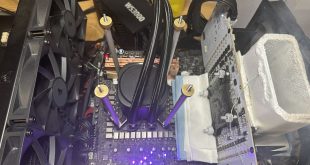
For starters, the RDNA 3 architecture has seen AMD transition to a chiplet-based design – a world first for a gaming GPU. We find a 300mm² Graphics Compute Die, based on TSMC's 5nm node, flanked by six 37mm² Memory Cache Dies (though one is disabled for the 7900 XT). In total, the Navi 31 GPU packs 57.7 billion transistors.
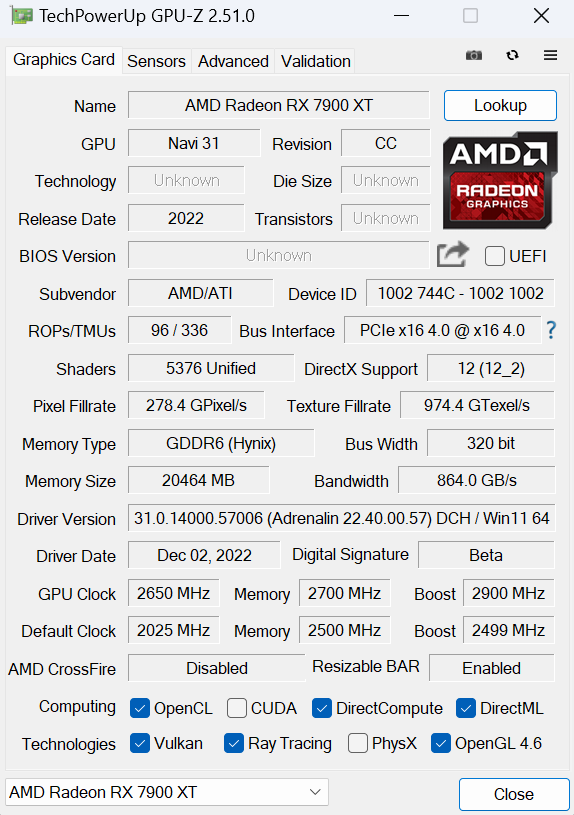
Internally, the GCD makeup hasn't been radically changed compared to what we saw with RDNA 2. While a full Navi 31 GPU packs in 96 Compute Units, the 7900 XT is cut down to 84 CUs, each of which houses 64 Steam Processors, for a total of 5376 shaders. There's also 84 Ray Accelerators – one per CU – and 192 ROPs.
As for clock speed, AMD has de-coupled the clocks, so the front-end and shaders can operate at different clock speeds in a bid to save power. With the RX 7900 XT, the shader clock features a rated game clock of up to 2000MHz, and a boost of up to 2400MHz.
Meanwhile, the memory configuration has taken a step forward. The RX 7900 XT packs 20GB of GDDR6 memory clocked at 20Gbps, operating over a 320-bit memory interface, for total memory bandwidth of 800 GB/s. 80MB of Infinity Cache is also present, which allows AMD to claim an ‘effective memory bandwidth' of up to 2900 GB/s.
Power draw for the RX 7900 XT is rated at 315W Total Board Power (TBP), but we are using our updated GPU power testing methodology in this review, so read on for our most detailed power and efficiency testing yet.

The AMD Radeon RX 7900 XT ships in a compact black box. A semi-obscured image of the graphics card is visible on the front, while AMD highlights the Adrenalin software on the back.
Inside, we find only two small pieces of documentation – a quick-start guide and an invitation to sign up to AMD's community forum.
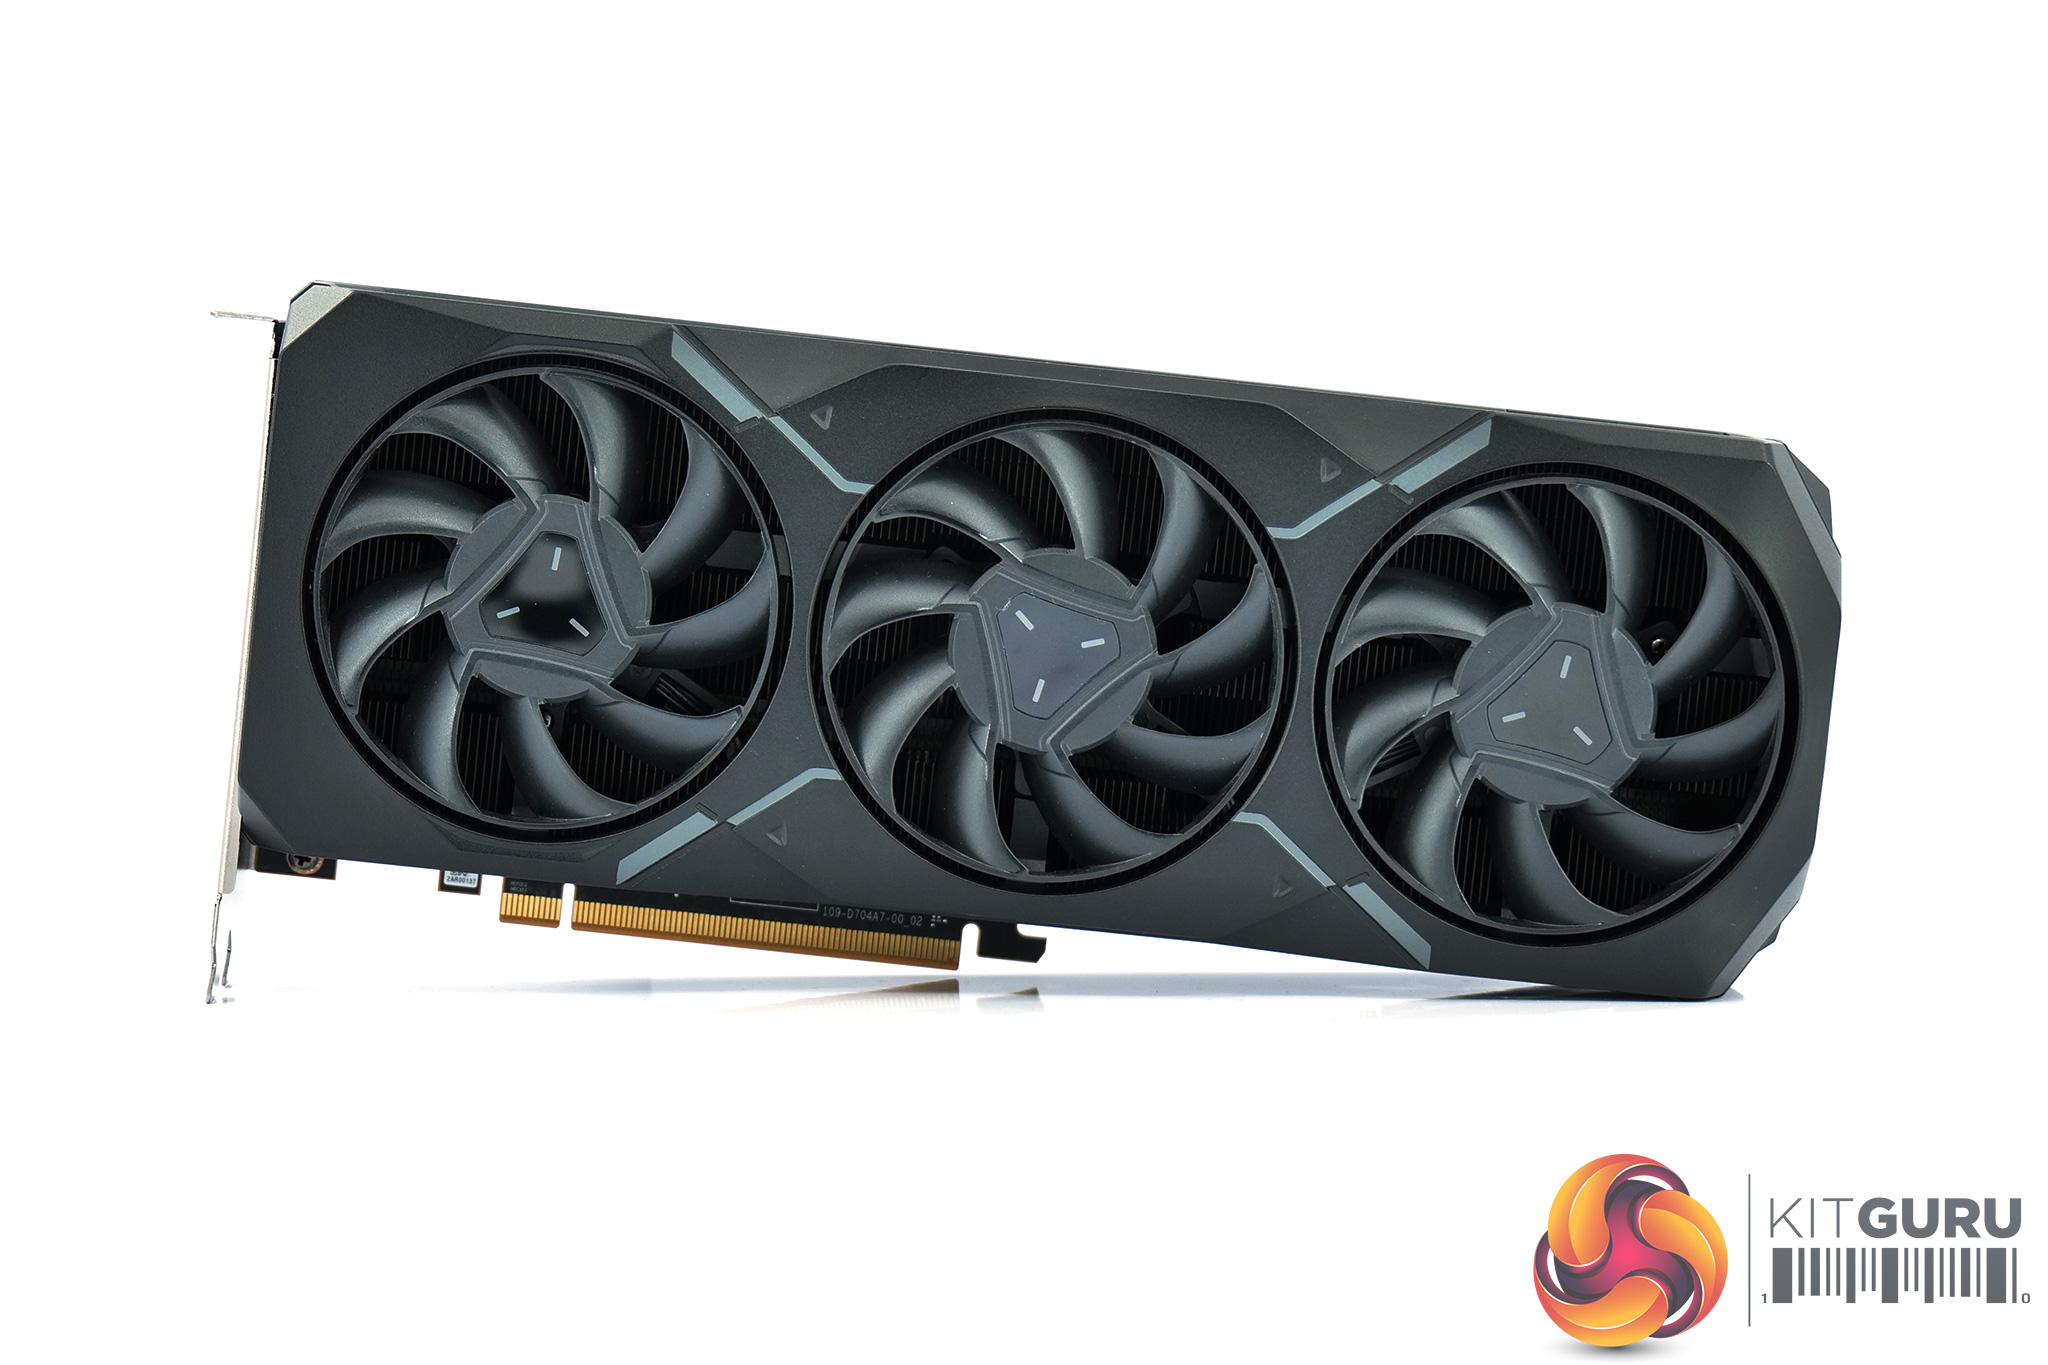
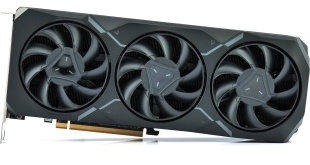
Taking a look at the graphics card itself, I think it is immediately clear that AMD has really stepped up its game with the 7000 series. Yes, the overall design is more of an evolution of the RX 6000 series, rather than a revolution, but the all-black aesthetic is very alluring in my opinion and is much cleaner-looking than the previous black and silver design.
The shroud is also incredibly well built, manufactured with an aluminium alloy, with three 80mm fans sitting within the shroud. Unlike the RX 7900 XTX, there are no RGB LEDs on the RX 7900 XT.
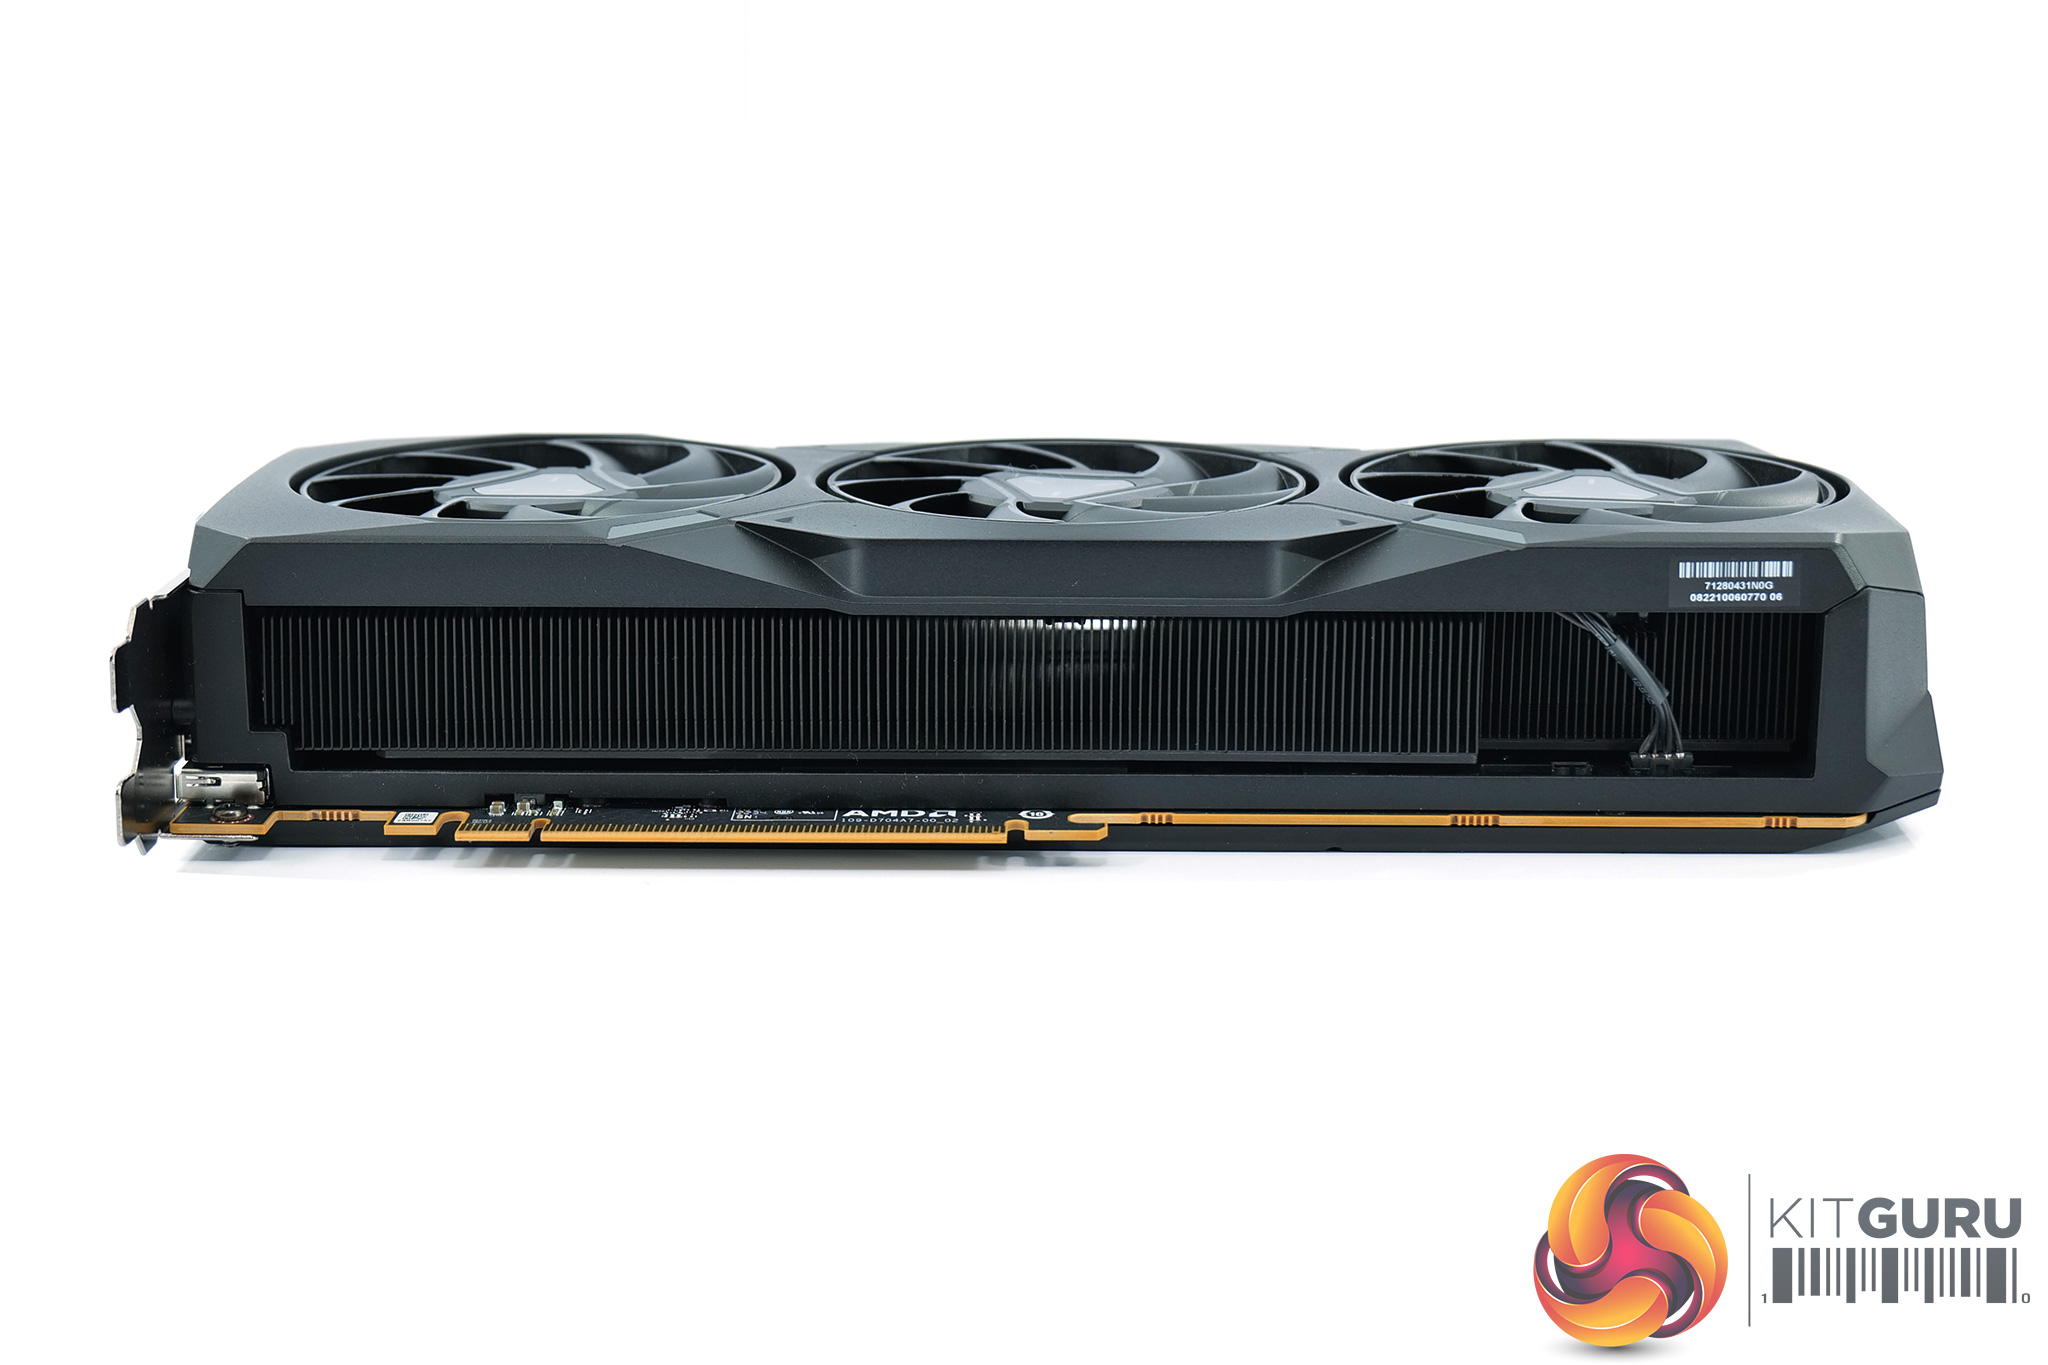
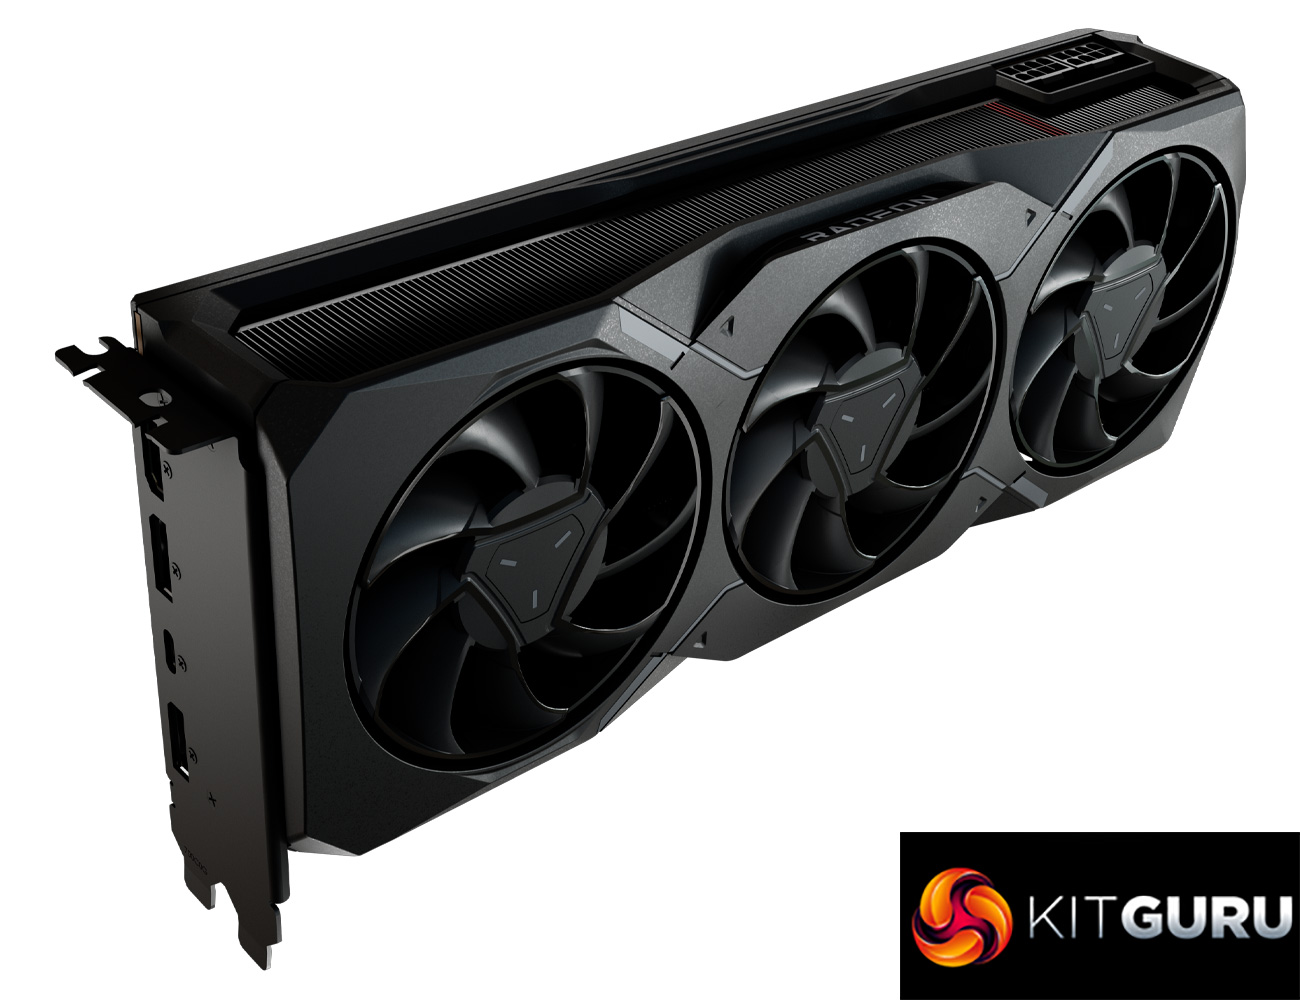
Meanwhile, much has been made of the size of AMD's reference cards, with the RX 7900 XT measuring 276mm long, 135mm tall, and 2.5 slots thick (approx. 50mm). That means it is slightly shorter than the RX 7900 XTX, while it's also smaller in every dimension when compared to the RTX 4080 Founders Edition, which itself
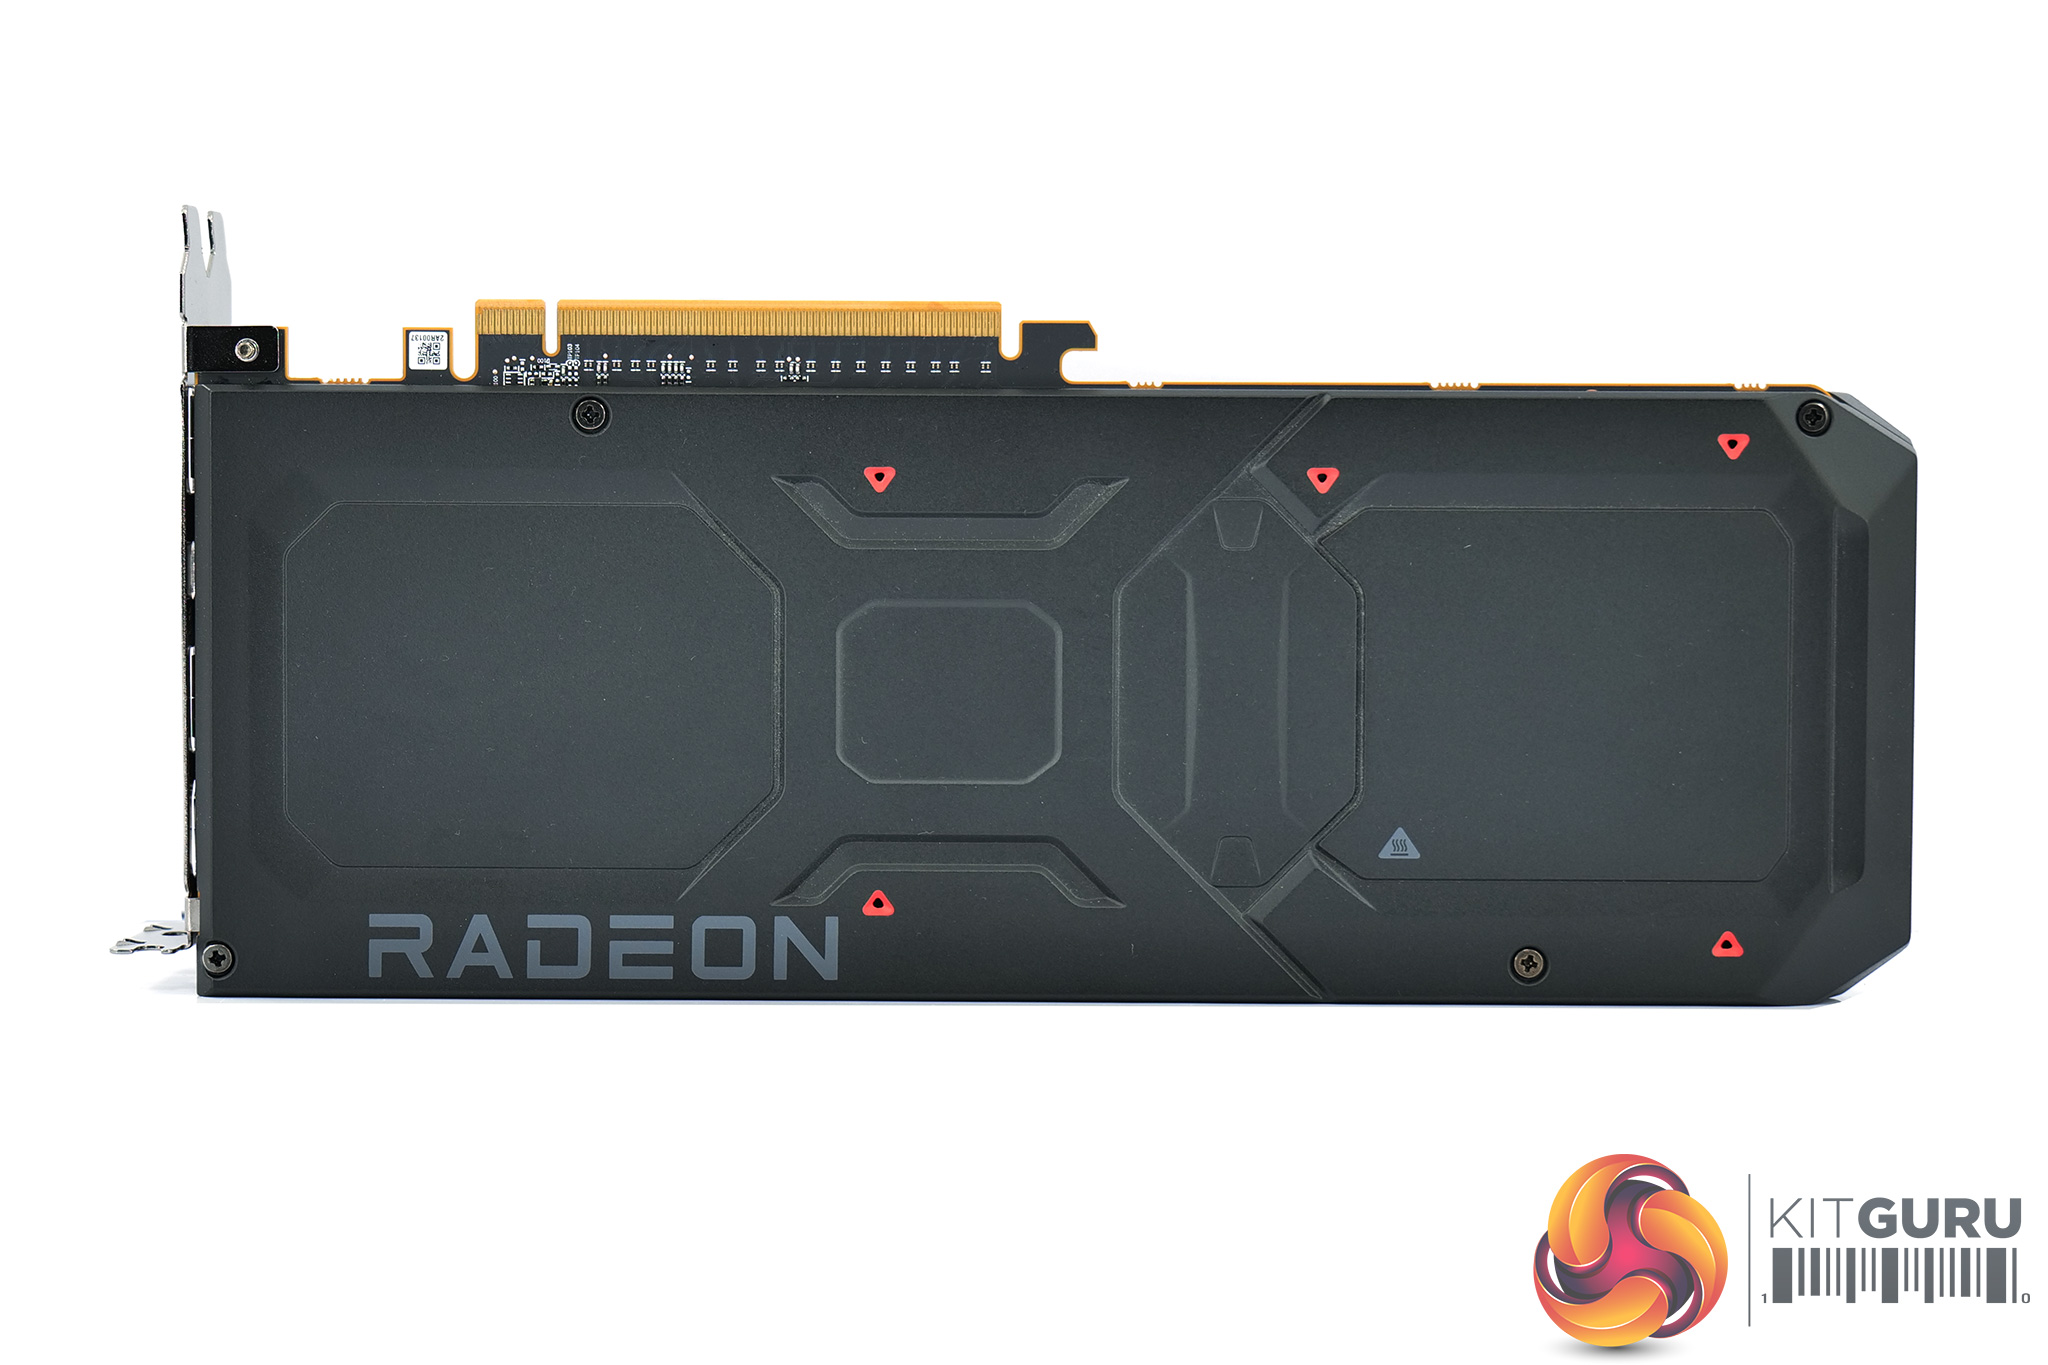
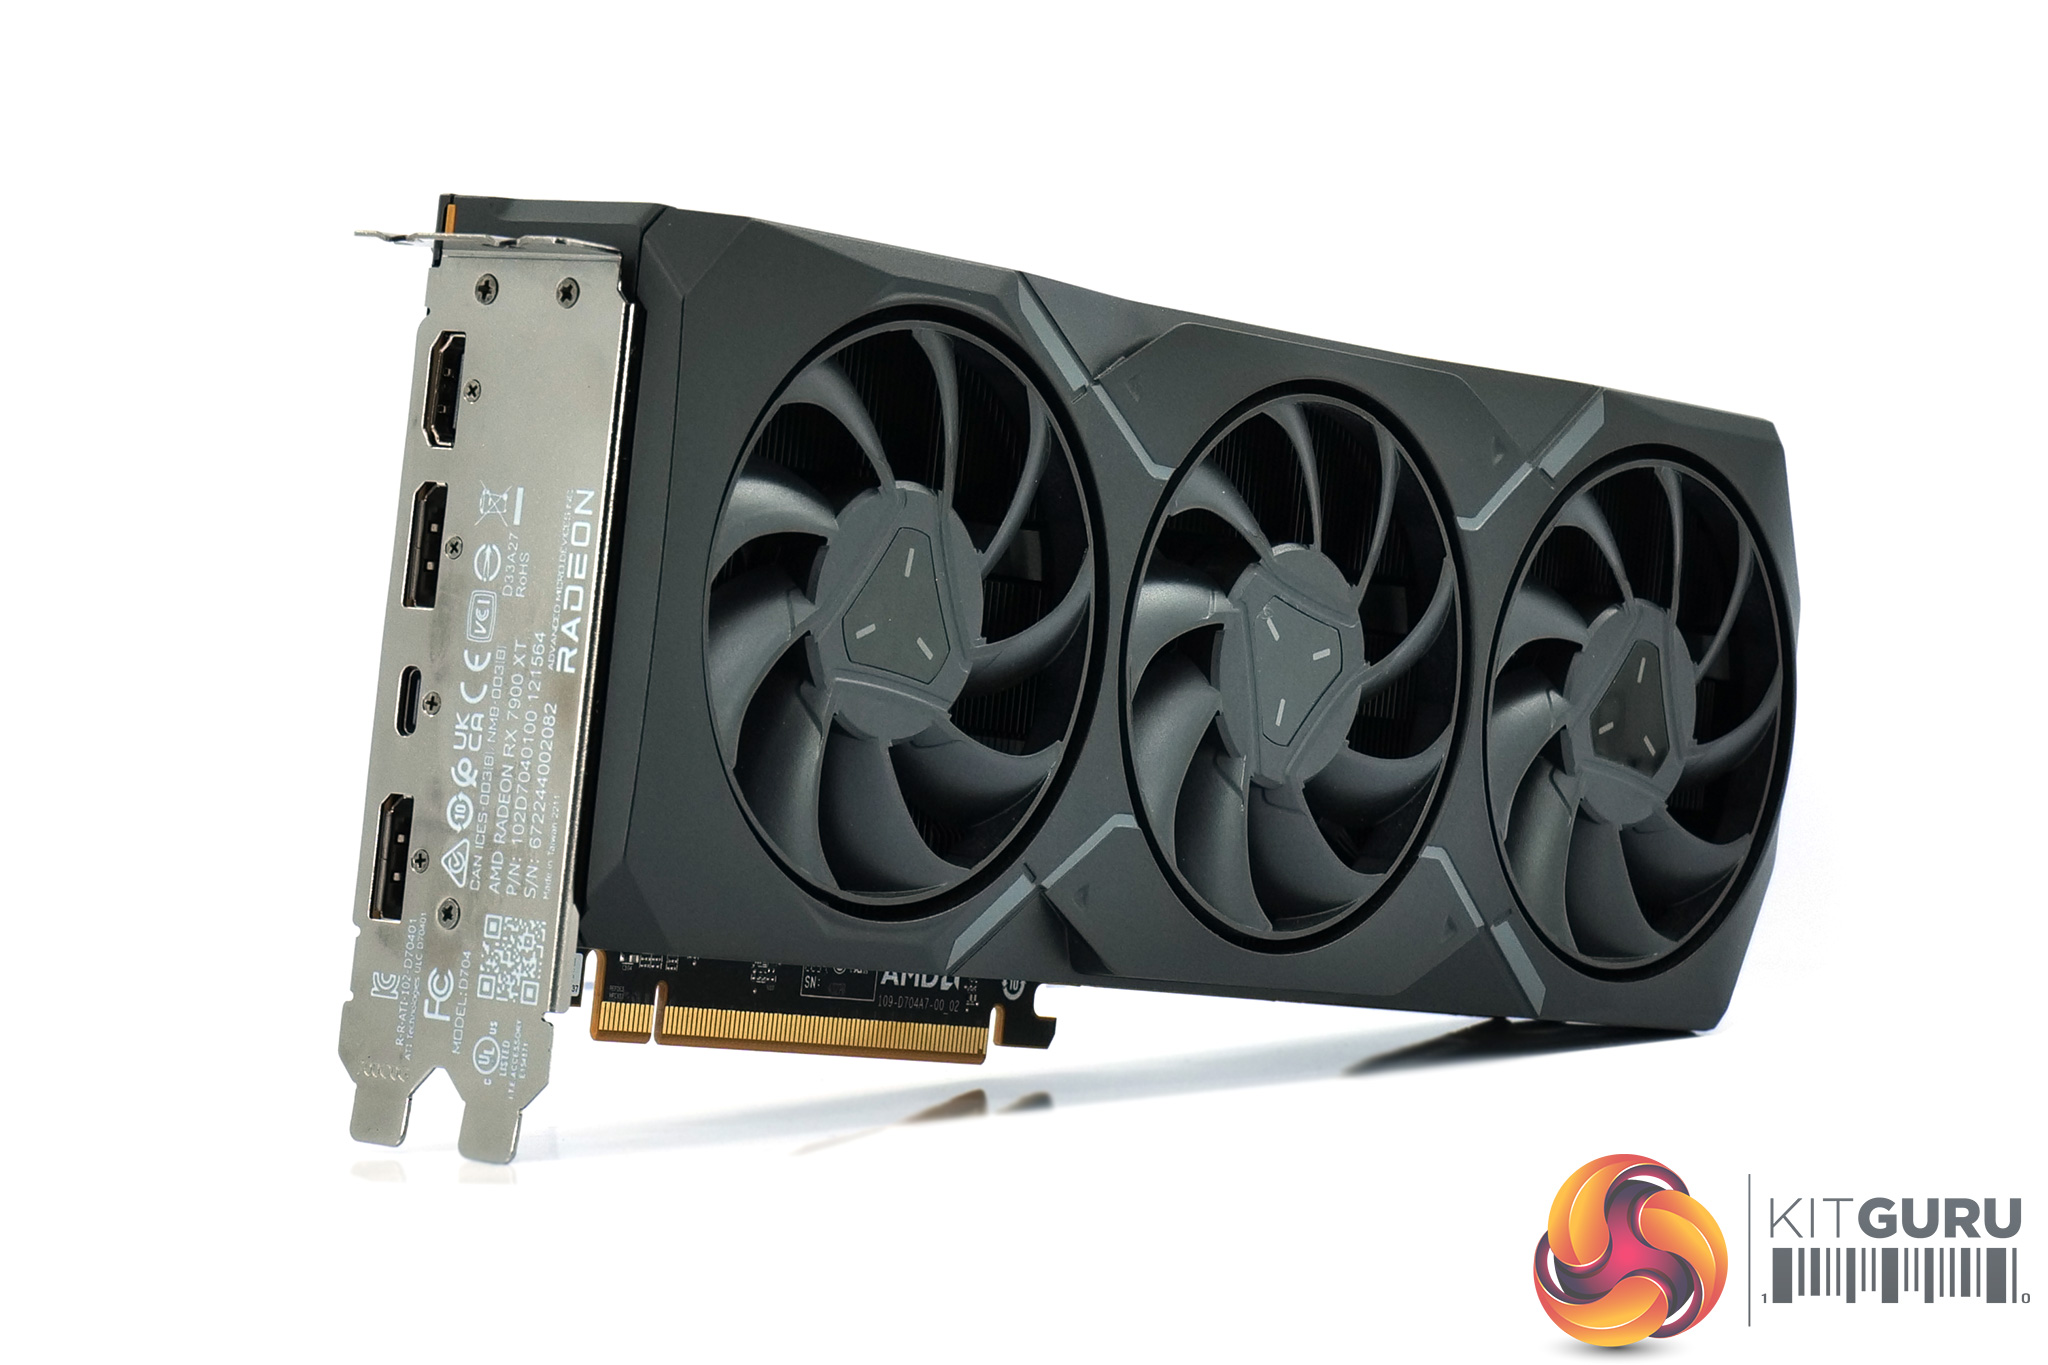
The front side of the card is left fairly bare, with the aluminium finstack occupying most of the space. A full-length metal backplate can be seen once the card is flipped over, with the Radeon branding printed in grey text towards the I/O bracket.
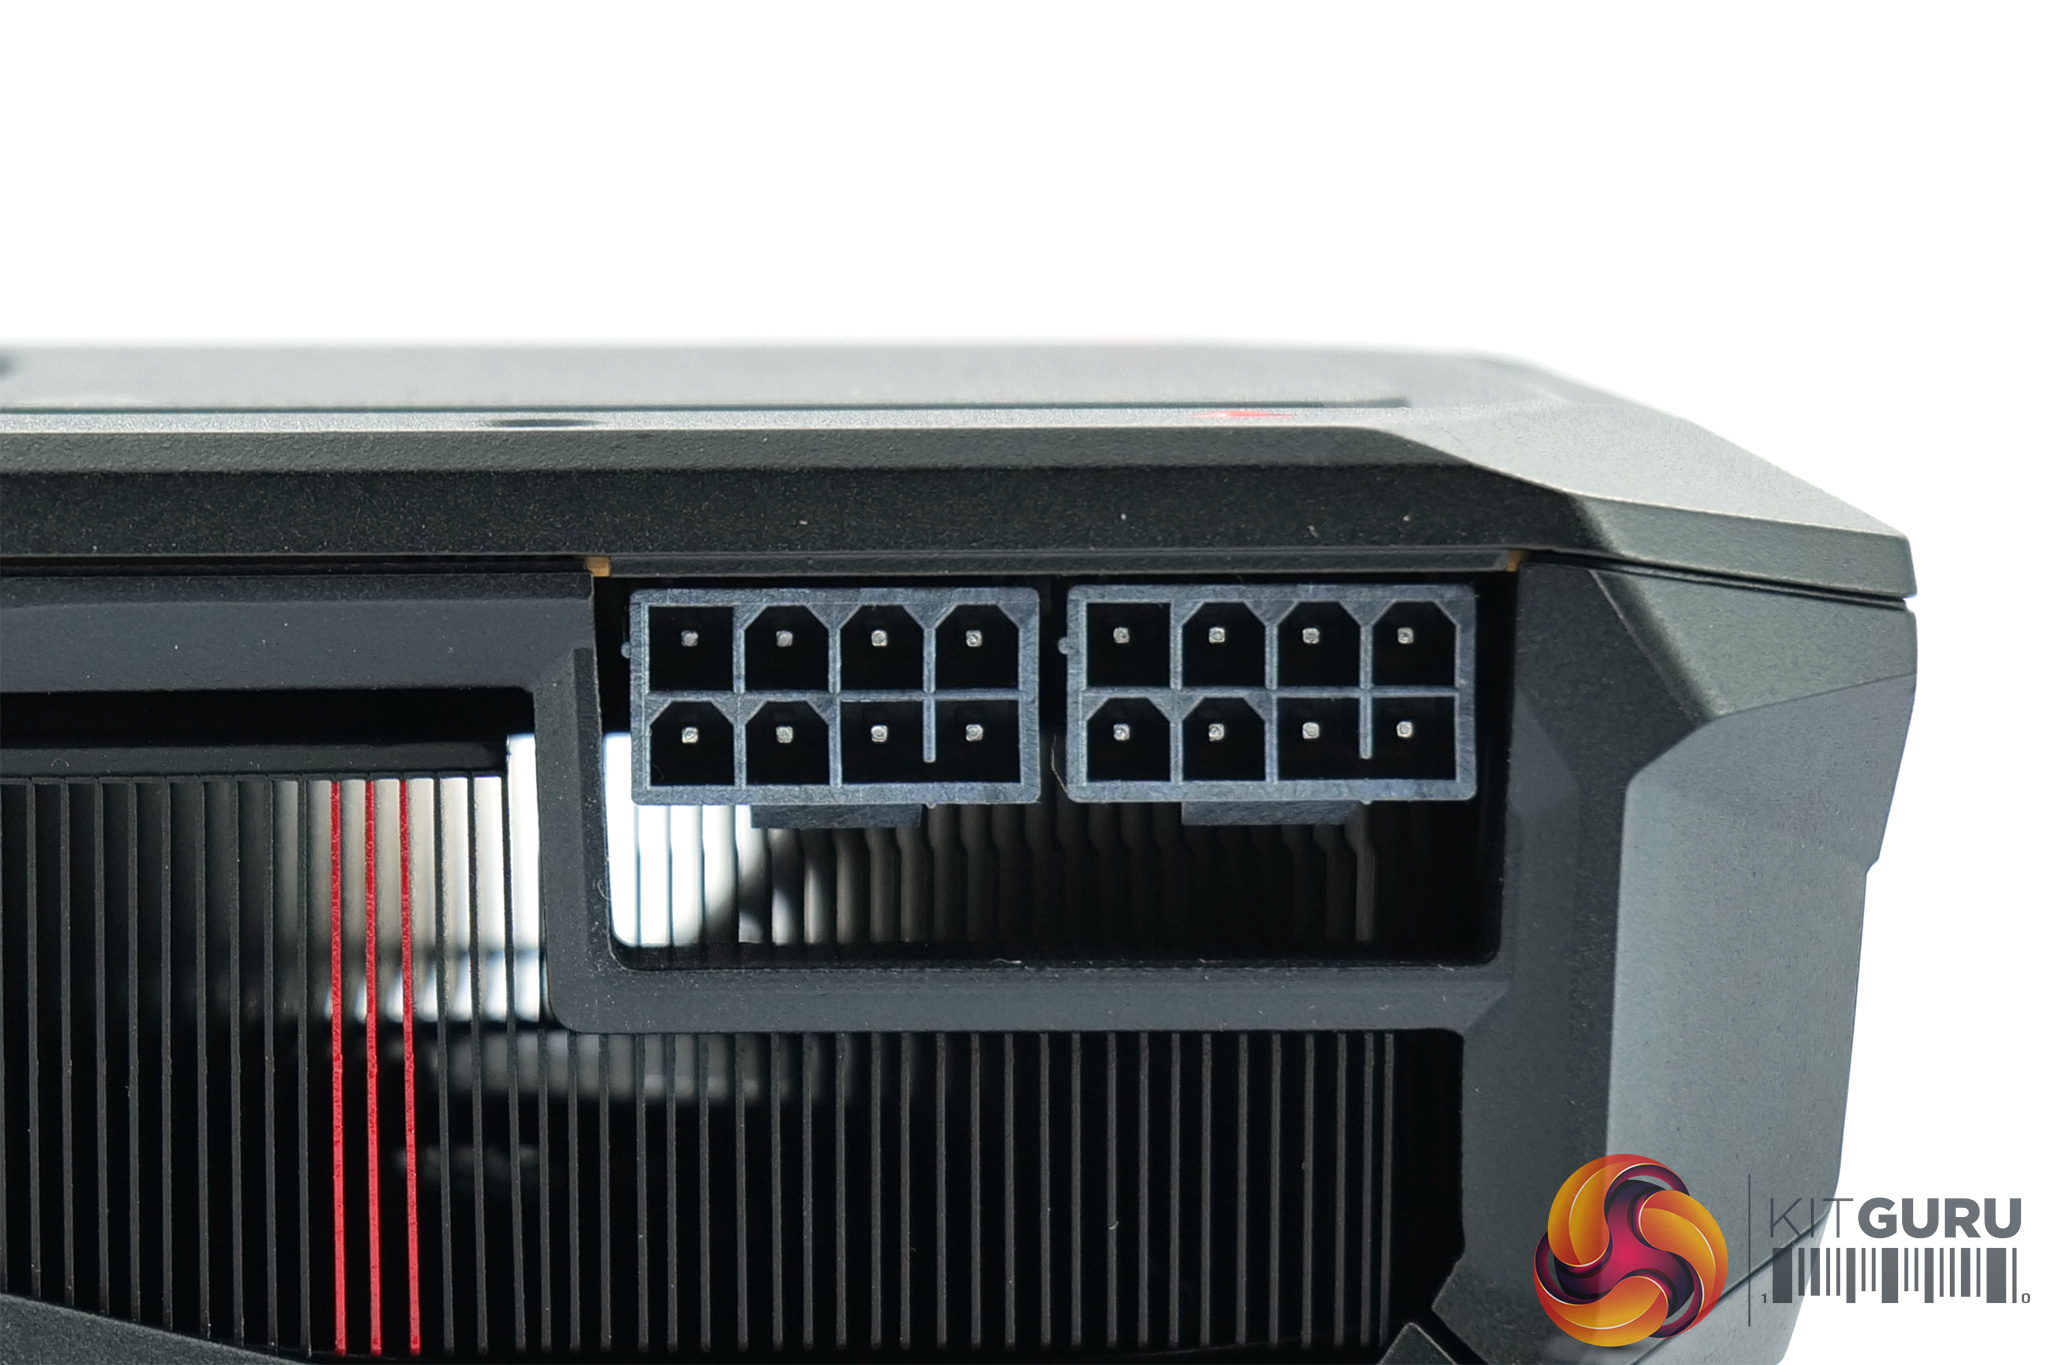
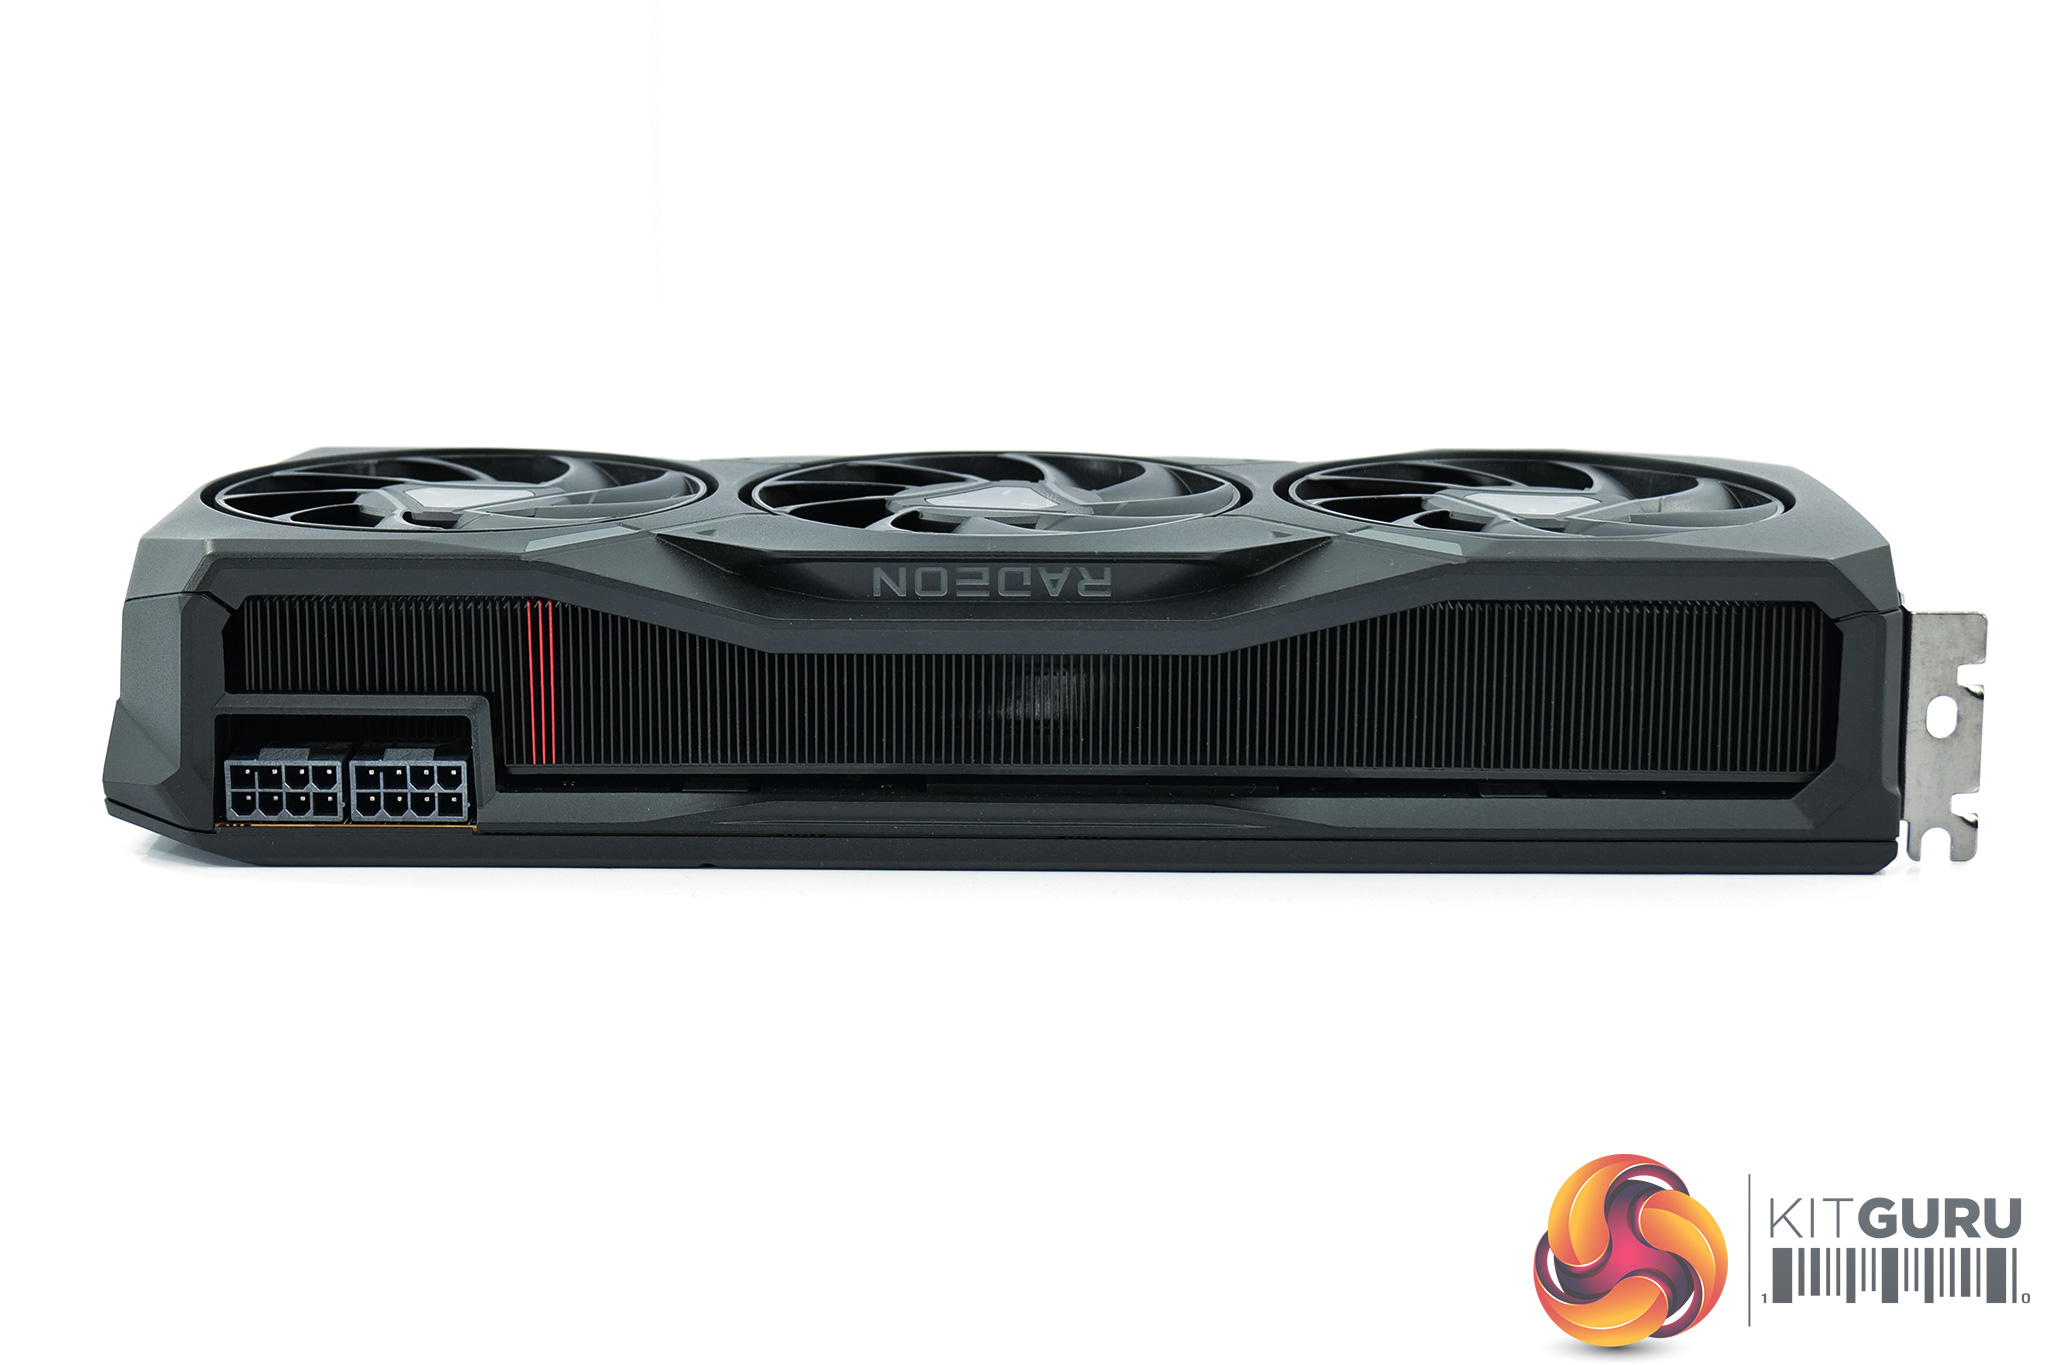
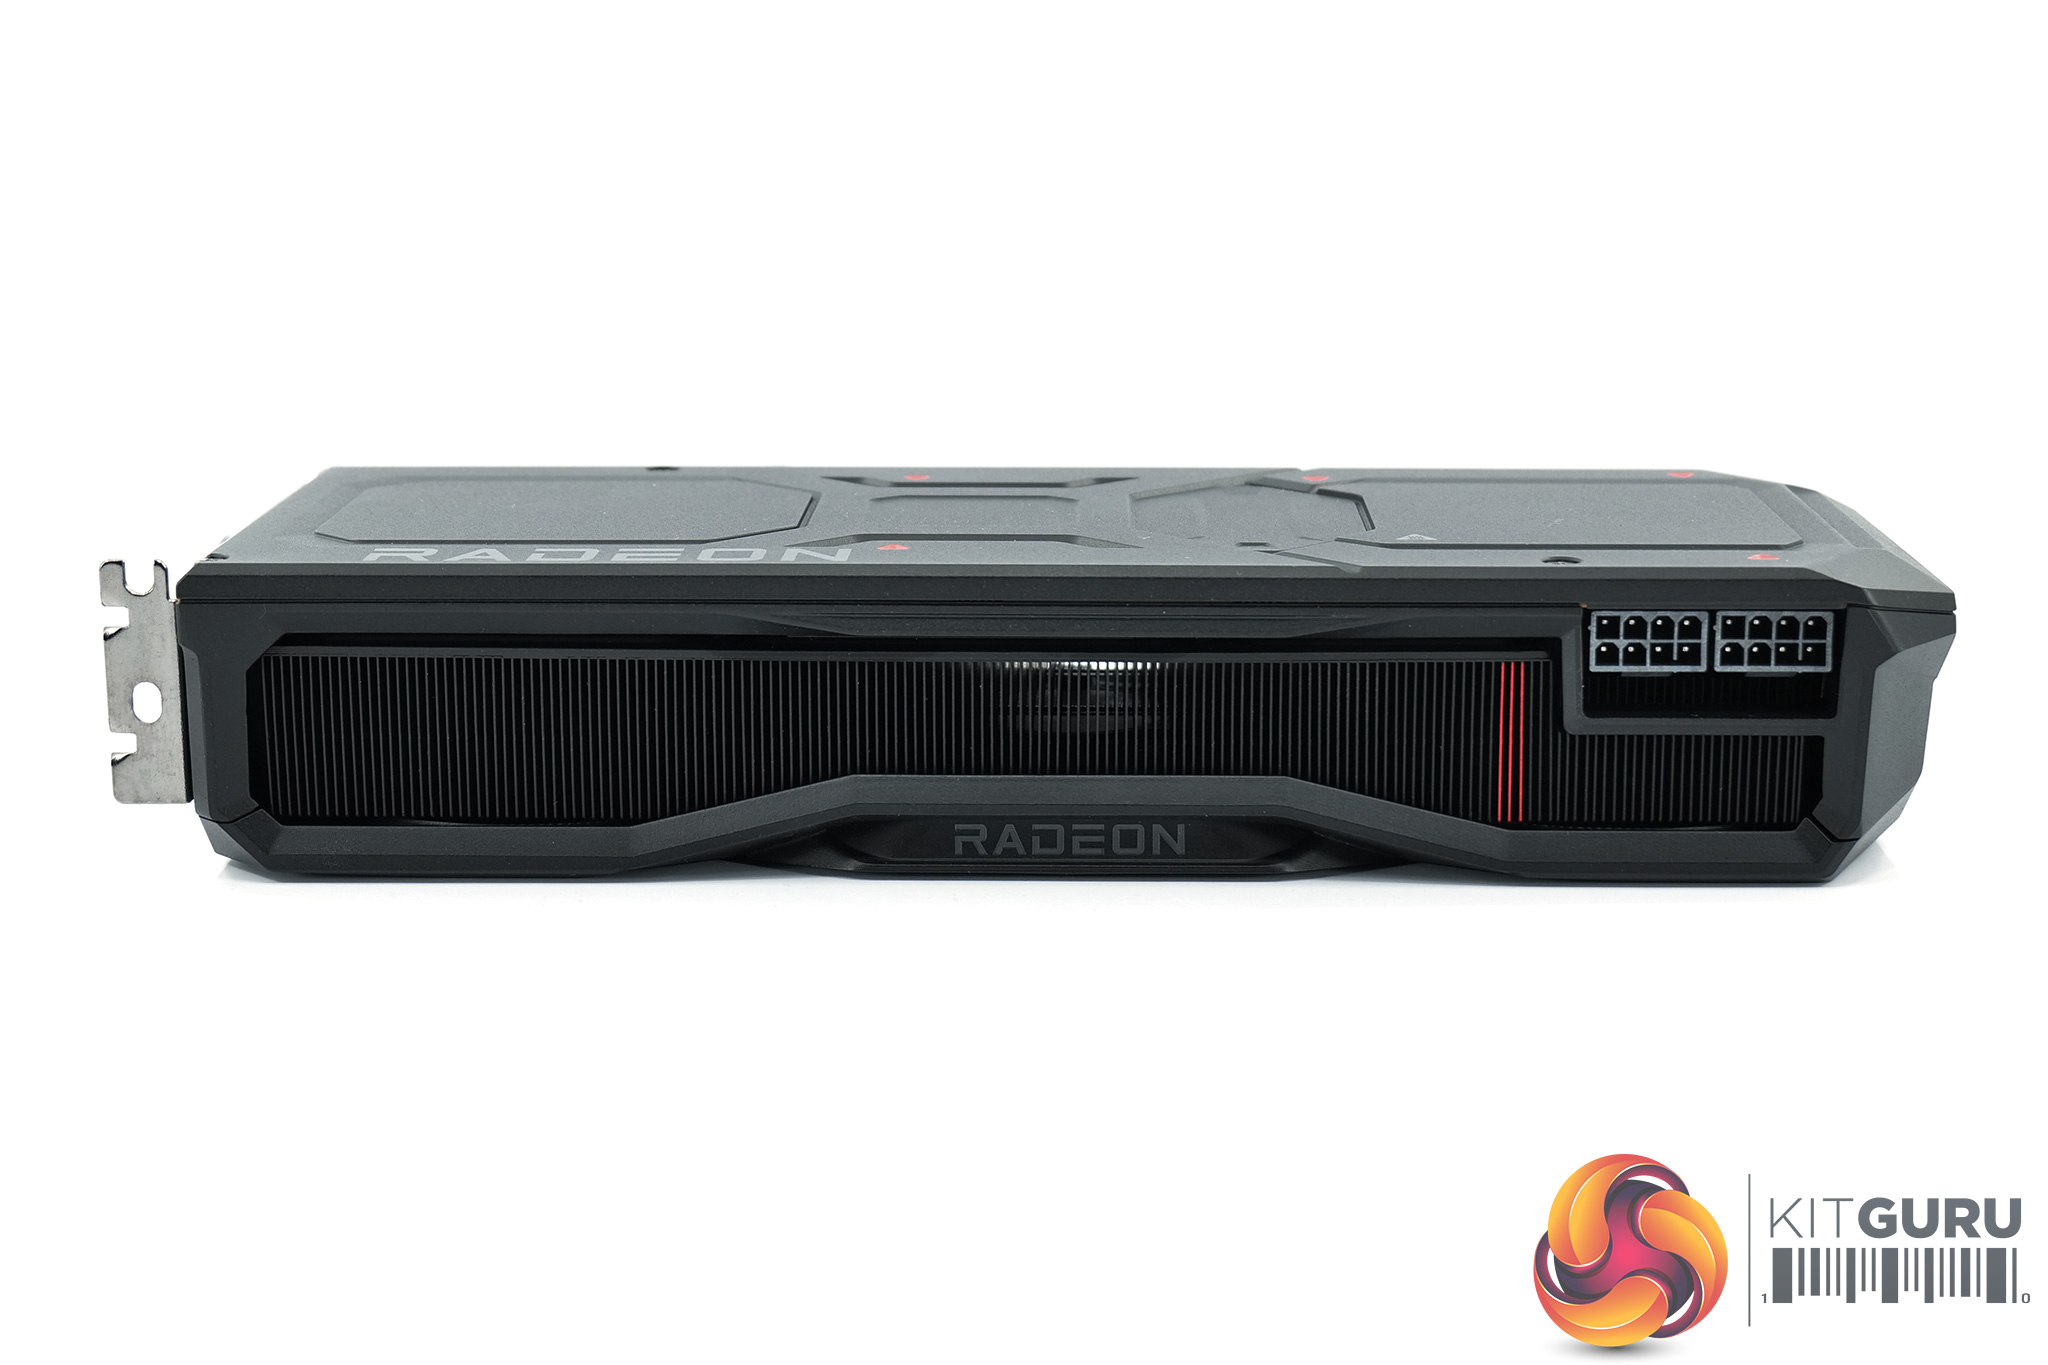
It's also noteworthy that AMD has opted for two 8-pin PCIe power connectors. Of course this was not a last-minute decision in response to the controversy around the 12VHPWR connector, but it does mean no new cables or adapters are required.
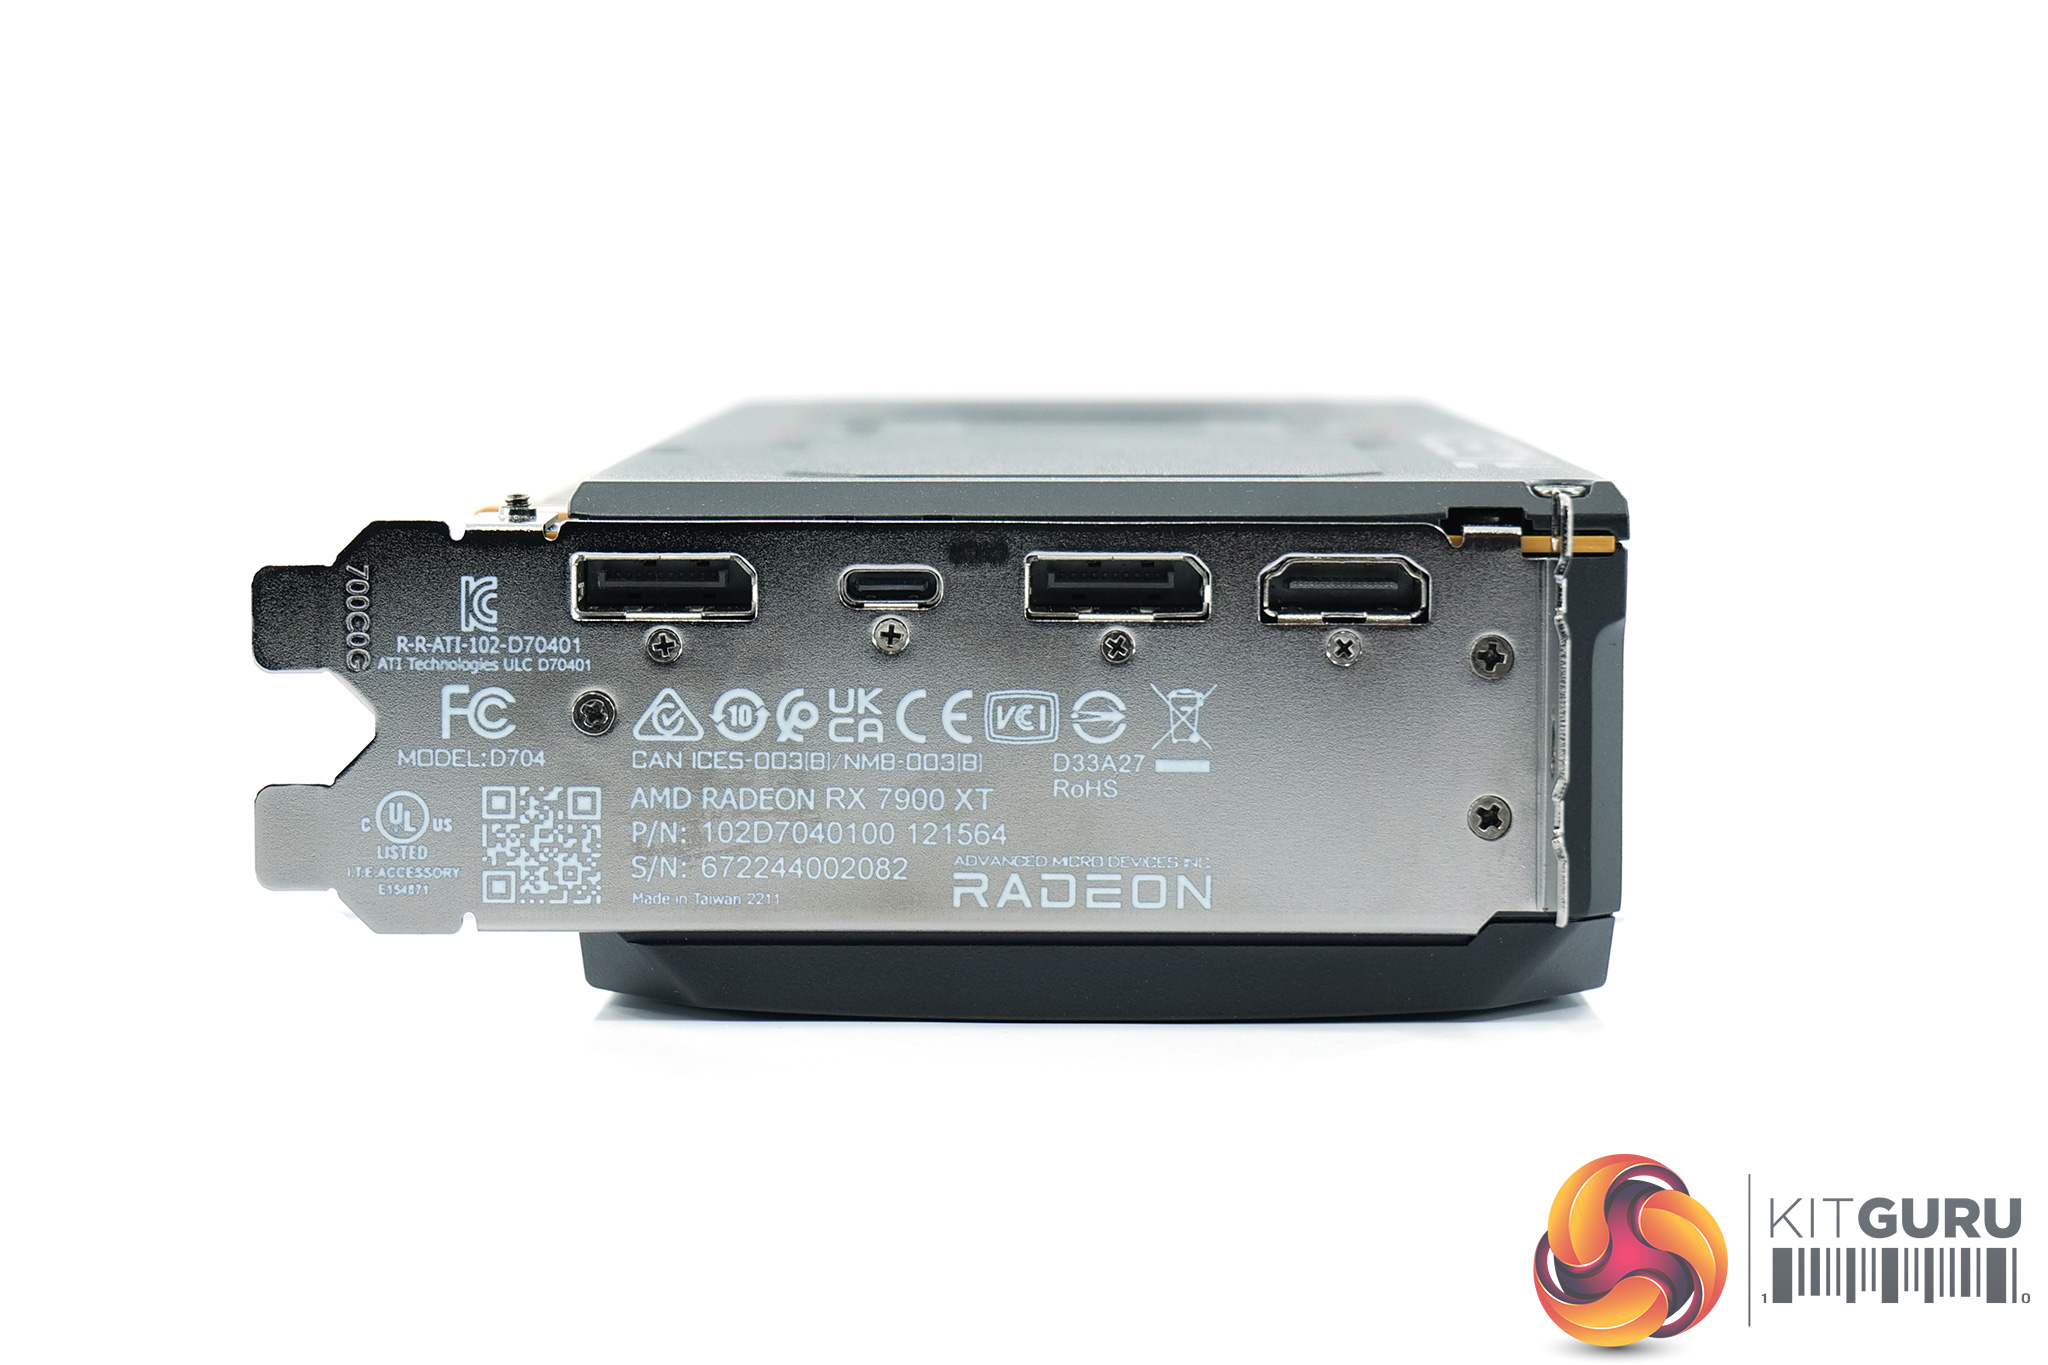
For display outputs, AMD has made the switch to DisplayPort 2.1, offering two full size connectors and DP 2.1 functionality over the USB-C port as well. We also find a single HDMI 2.1 output.
Driver Notes
- All AMD GPUs (except RX 7900 series) were benchmarked with the Adrenalin 22.10.3 driver.
- All Nvidia GPUs (except RTX 4080) were benchmarked with the 526.61 driver.
- RTX 4080 was benchmarked with the 526.72 driver supplied to press.
- RX 7900 XTX and RX 7900 XTX were benchmarked with the Adrenalin 22.40.00.57 driver supplied to press.
Test System:
We test using a custom built system powered by MSI, based on Intel’s Alder Lake platform. You can read more about this system HERE and check out MSI on the CCL webstore HERE.
| CPU |
Intel Core i9-12900K
|
| Motherboard |
MSI MEG Z690 Unify
|
| Memory |
32GB (2x16GB) ADATA XPG Lancer DDR5 6000MHz
CL 40-40-40
|
| Graphics Card |
Varies
|
| SSD |
2TB MSI Spatium M480
|
| Chassis | MSI MPG Velox 100P Airflow |
| CPU Cooler |
MSI MEG CoreLiquid S360
|
| Power Supply |
Corsair 1200W HX Series Modular 80 Plus Platinum
|
| Operating System |
Windows 11 Pro 21H2
|
| Monitor |
MSI Optix MPG321UR-QD
|
| Resizable BAR |
Enabled for all supported GPUs
|
Comparison Graphics Cards List
- Sapphire RX 6950 XT Nitro+ 16GB
- AMD RX 6900 XT 16GB
- AMD RX 6800 XT 16GB
- AMD RX 6800 16GB
- Nvidia RTX 4090 FE 24GB
- Nvidia RTX 4080 FE 16GB
- Gigabyte RTX 3090 Ti Gaming 24GB
- Gigabyte RTX 3090 Eagle 24GB
- Gigabyte RTX 3080 Eagle 10GB
- Nvidia RTX 3070 Ti FE 8GB
All cards were tested at reference specifications.
Software and Games List
- 3DMark Fire Strike & Fire Strike Ultra (DX11 Synthetic)
- 3DMark Time Spy (DX12 Synthetic)
- 3DMark DirectX Raytracing feature test (DXR Synthetic)
- Assassin's Creed Valhalla (DX12)
- Cyberpunk 2077 (DX12)
- Days Gone (DX11)
- Dying Light 2 (DX12)
- Far Cry 6 (DX12)
- Forza Horizon 5 (DX12)
- God of War (DX11)
- Horizon Zero Dawn (DX12)
- Marvel's Spider-Man Remastered (DX12)
- Metro Exodus Enhanced Edition (DXR)
- Red Dead Redemption 2 (DX12)
- Resident Evil Village (DX12)
- Total War: Warhammer III (DX11)
We run each benchmark/game three times, and present mean averages in our graphs. We use FrameView to measure average frame rates as well as 1% low values across our three runs.
Fire Strike is a showcase DirectX 11 benchmark for modern gaming PCs. Its ambitious real-time graphics are rendered with detail and complexity far beyond other DirectX 11 benchmarks and games. Fire Strike includes two graphics tests, a physics test and a combined test that stresses the CPU and GPU. (UL).
3DMark Time Spy is a DirectX 12 benchmark test for Windows 10 gaming PCs. Time Spy is one of the first DirectX 12 apps to be built the right way from the ground up to fully realize the performance gains that the new API offers. With its pure DirectX 12 engine, which supports new API features like asynchronous compute, explicit multi-adapter, and multi-threading, Time Spy is the ideal test for benchmarking the latest graphics cards. (UL).
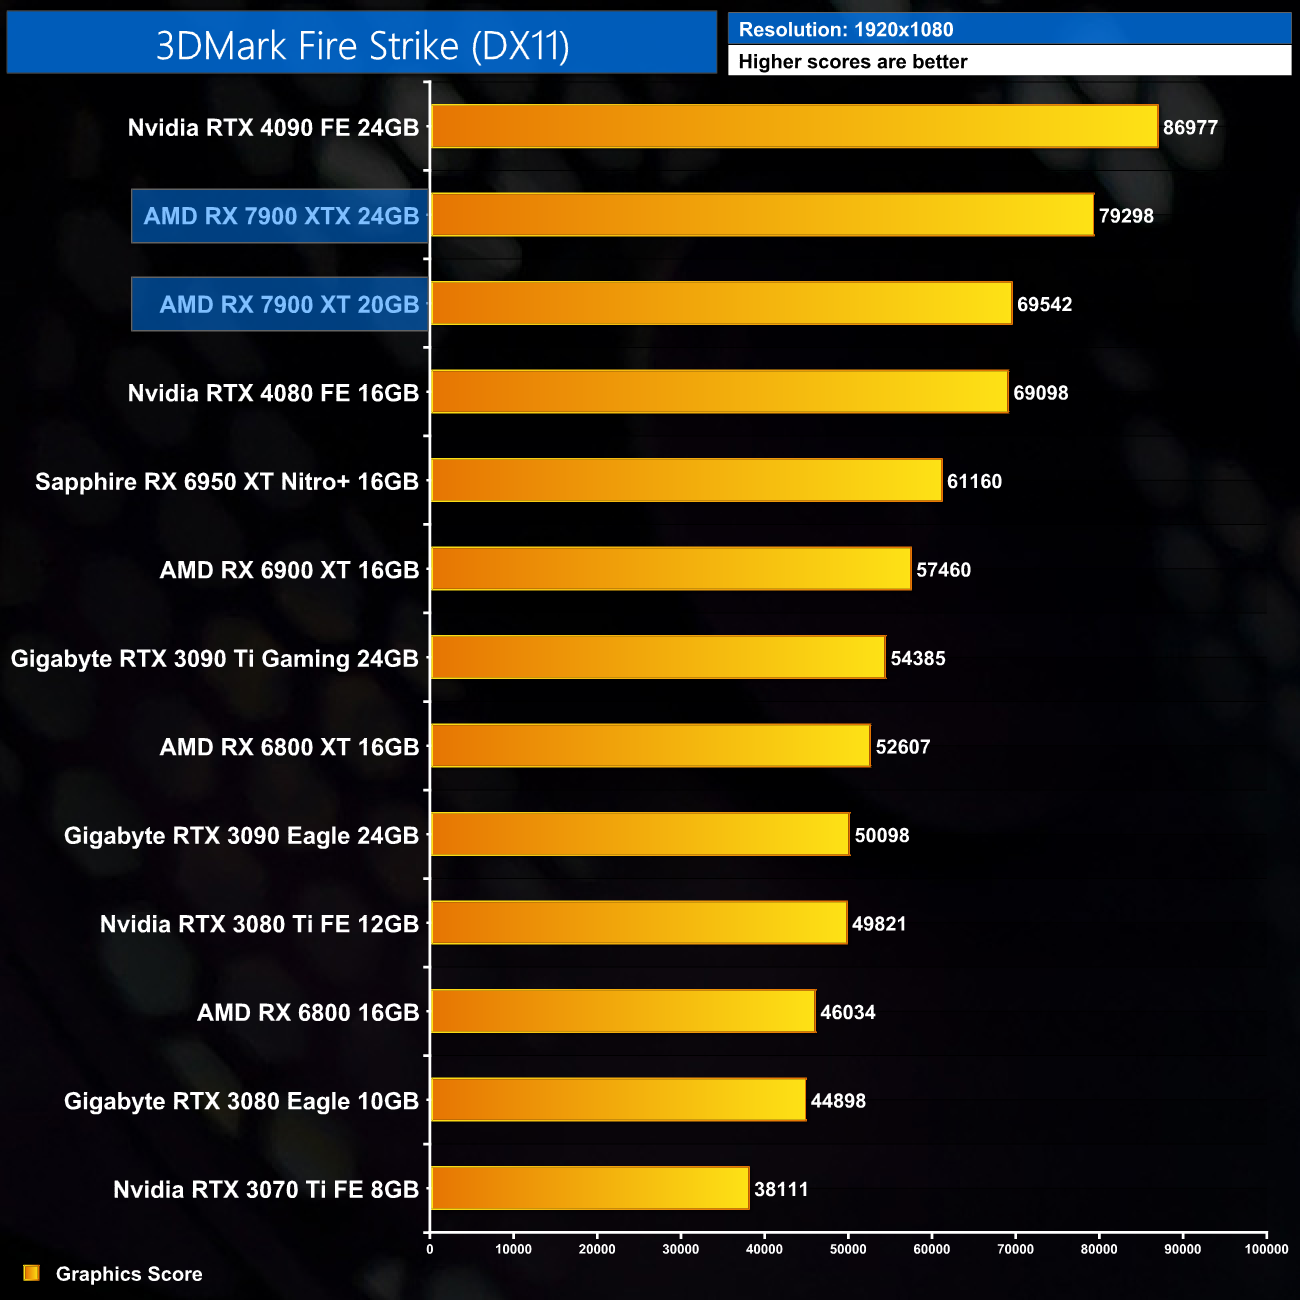
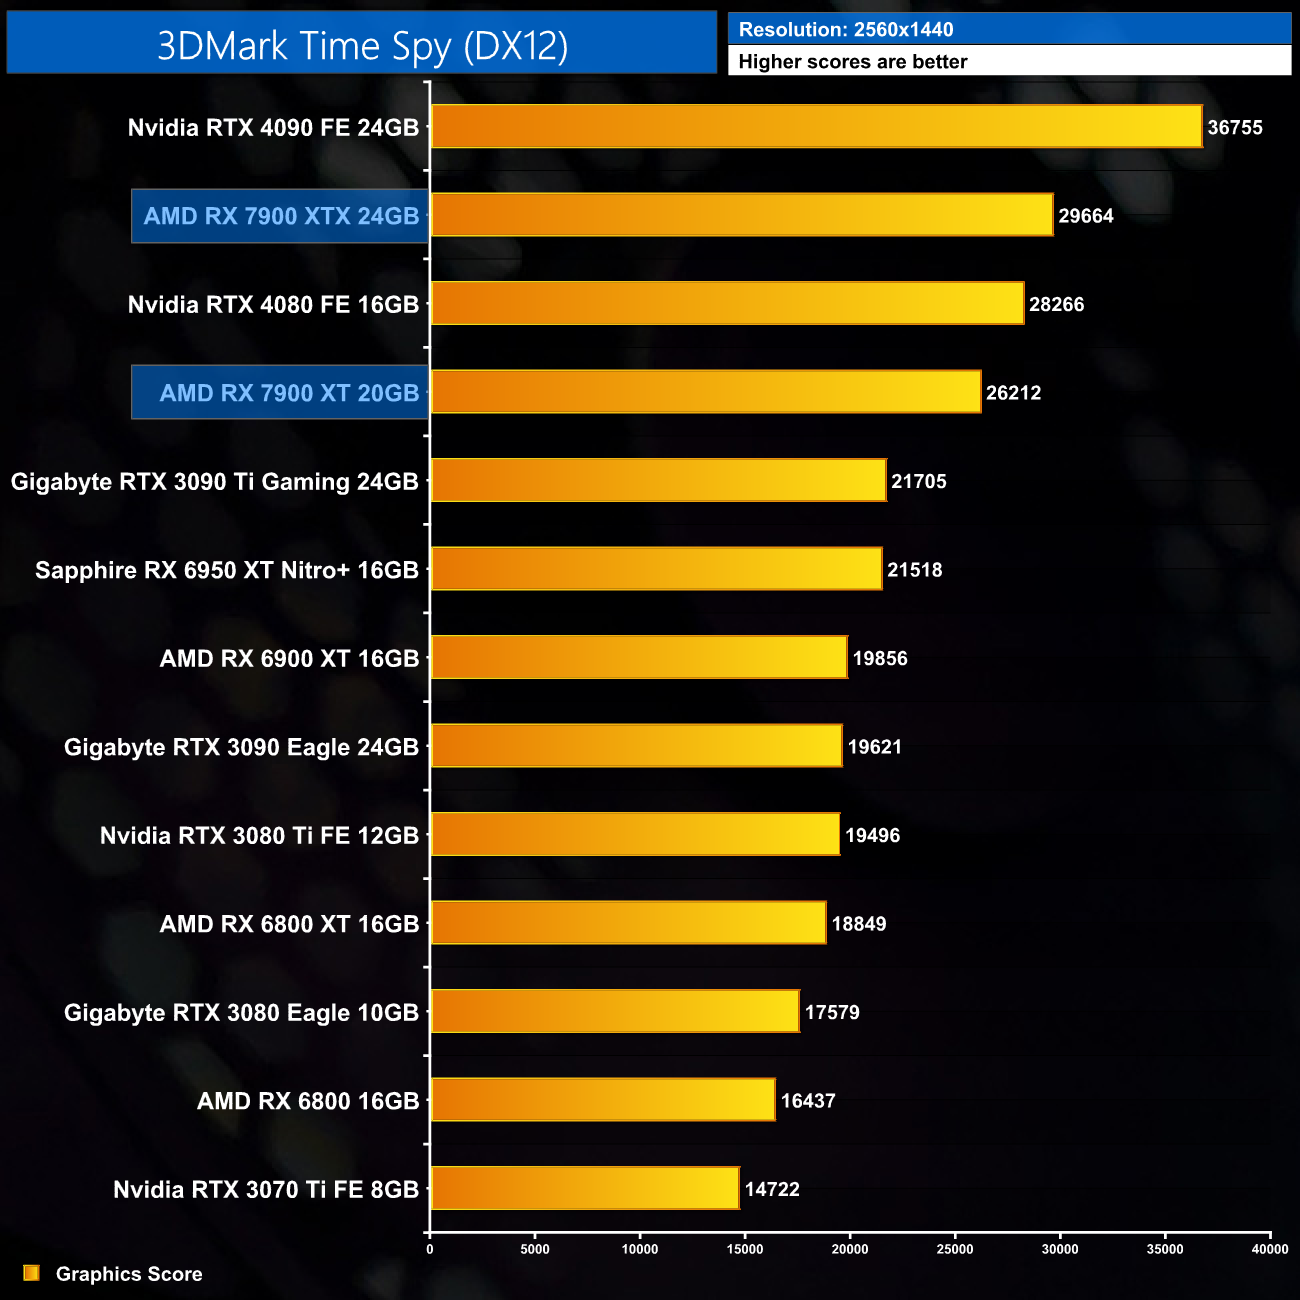
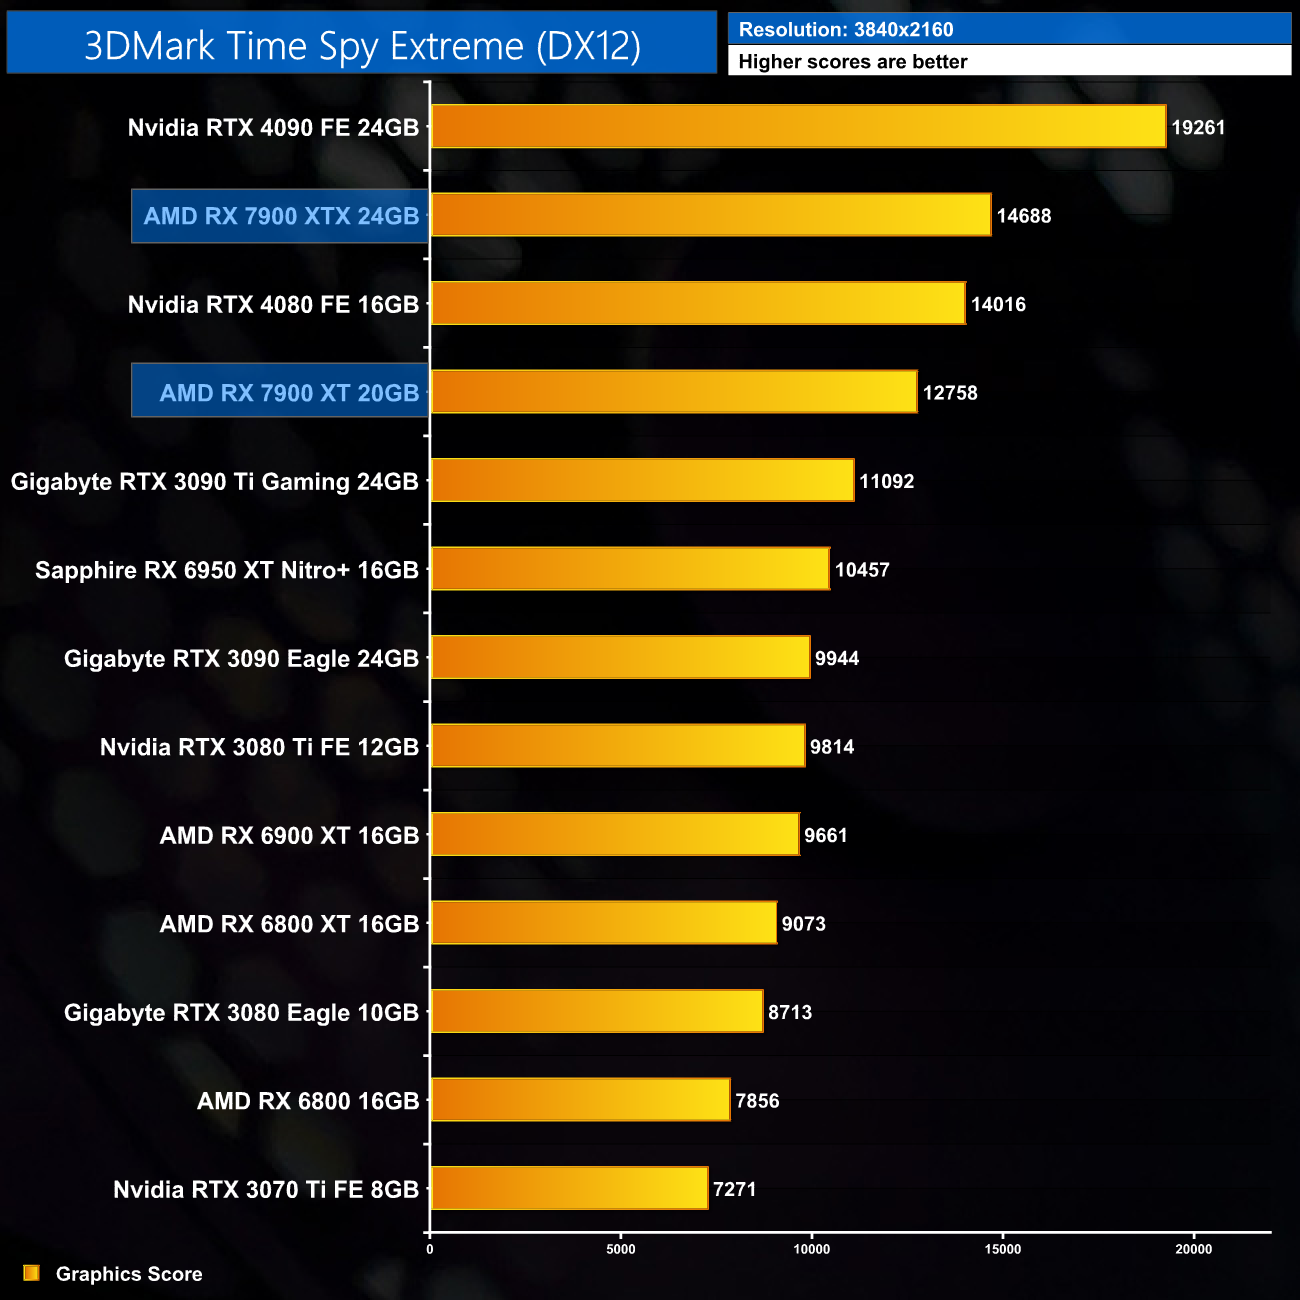
Initial impressions are positive for the RX 7900 XT. It's level with the RTX 4080 in 3DMark Fire Strike, and still outscores the RTX 3090 Ti handsomely in Time Spy.
Real-time ray tracing is incredibly demanding. The latest graphics cards have dedicated hardware that’s optimized for ray-tracing. The 3DMark DirectX Raytracing feature test measures the performance of this dedicated hardware. Instead of using traditional rendering techniques, the whole scene is ray-traced and drawn in one pass. The result of the test depends entirely on ray-tracing performance. (UL).
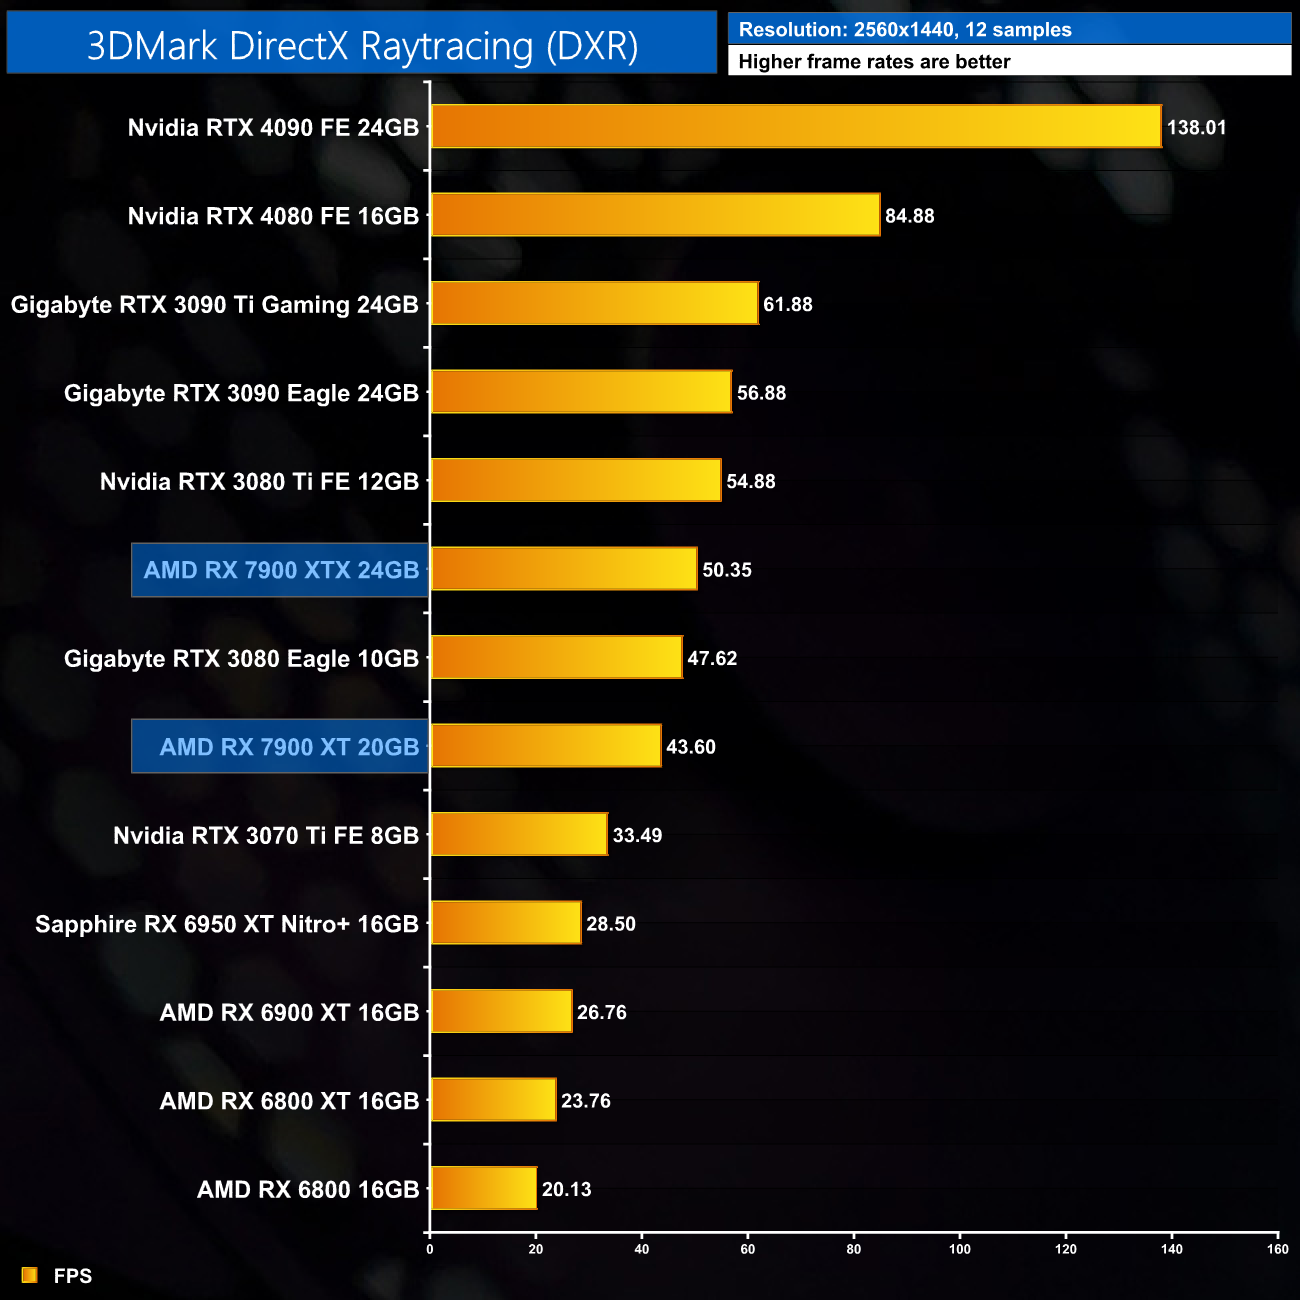
The 3DMark DXR feature test is more worrying however, with the 7900 XT slower than even the RTX 3080 10GB. The RTX 4080 is almost twice as quick in the same test.
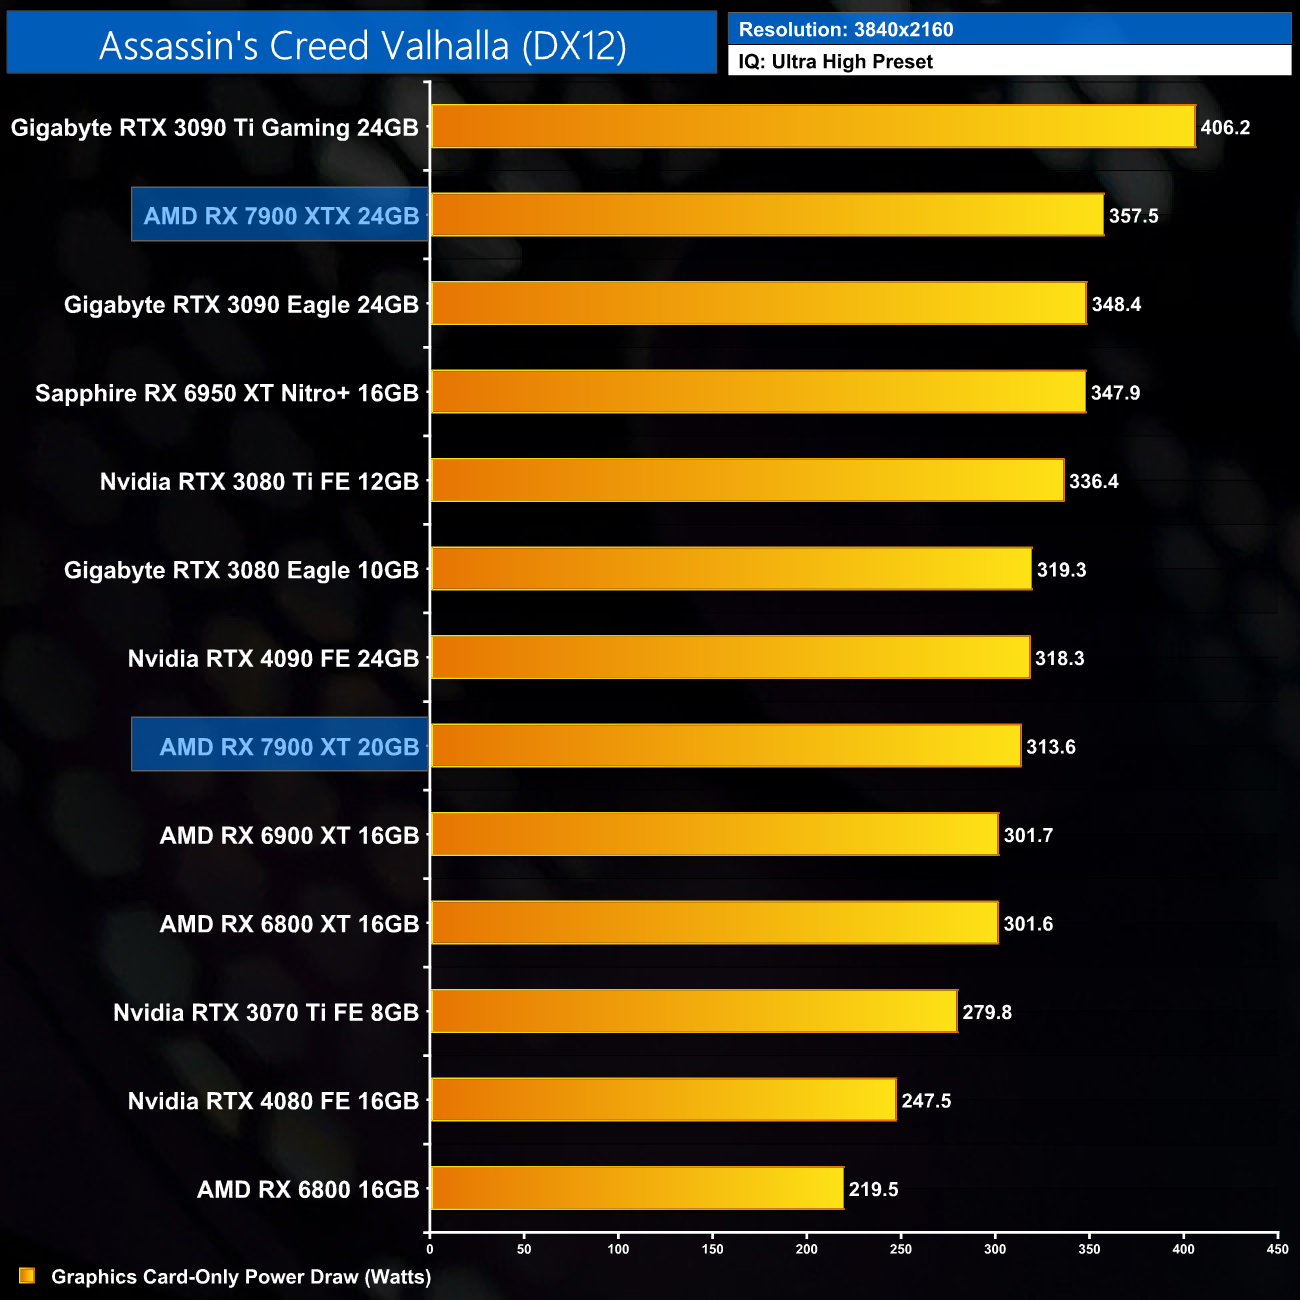
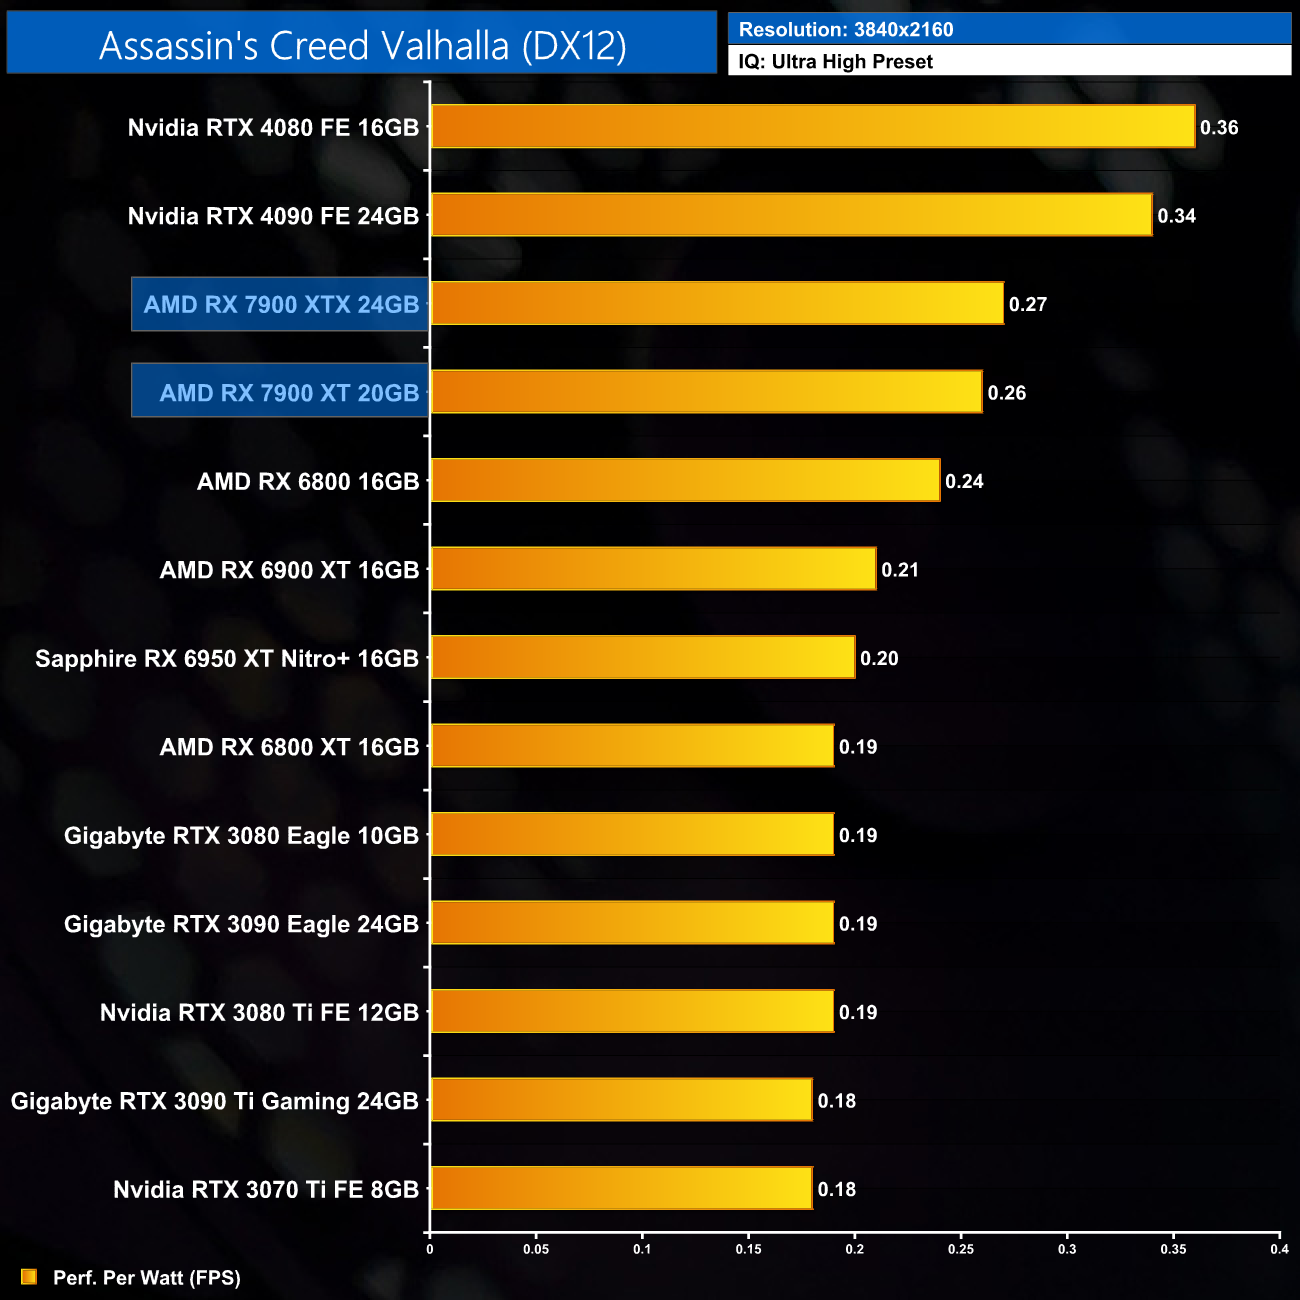
Assassin's Creed Valhalla is an action role-playing video game developed by Ubisoft Montreal and published by Ubisoft. It is the twelfth major instalment and the twenty-second release in the Assassin's Creed series, and a successor to the 2018's Assassin's Creed Odyssey. The game was released on November 10, 2020, for Microsoft Windows, PlayStation 4, Xbox One, Xbox Series X and Series S, and Stadia, while the PlayStation 5 version was released on November 12. (Wikipedia).
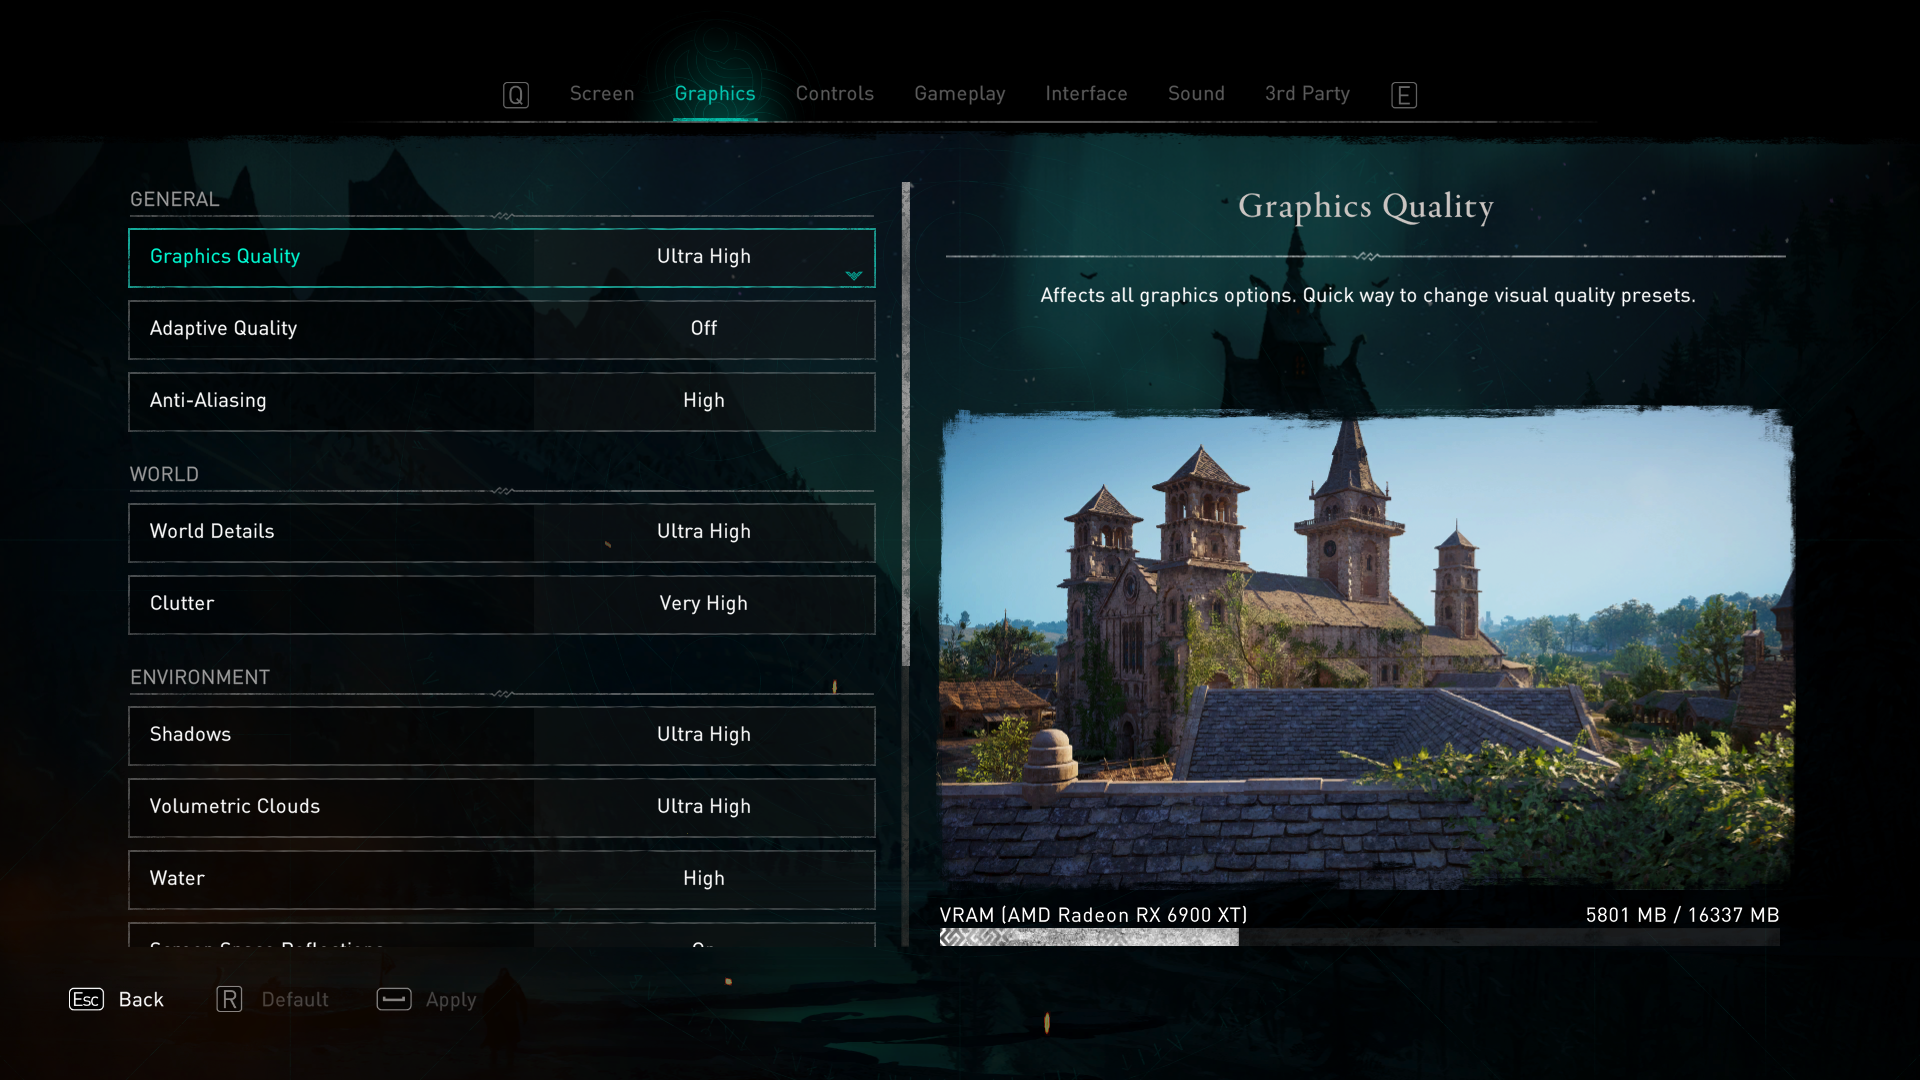
Engine: AnvilNext 2.0. We test using the Ultra High preset, DX12 API.
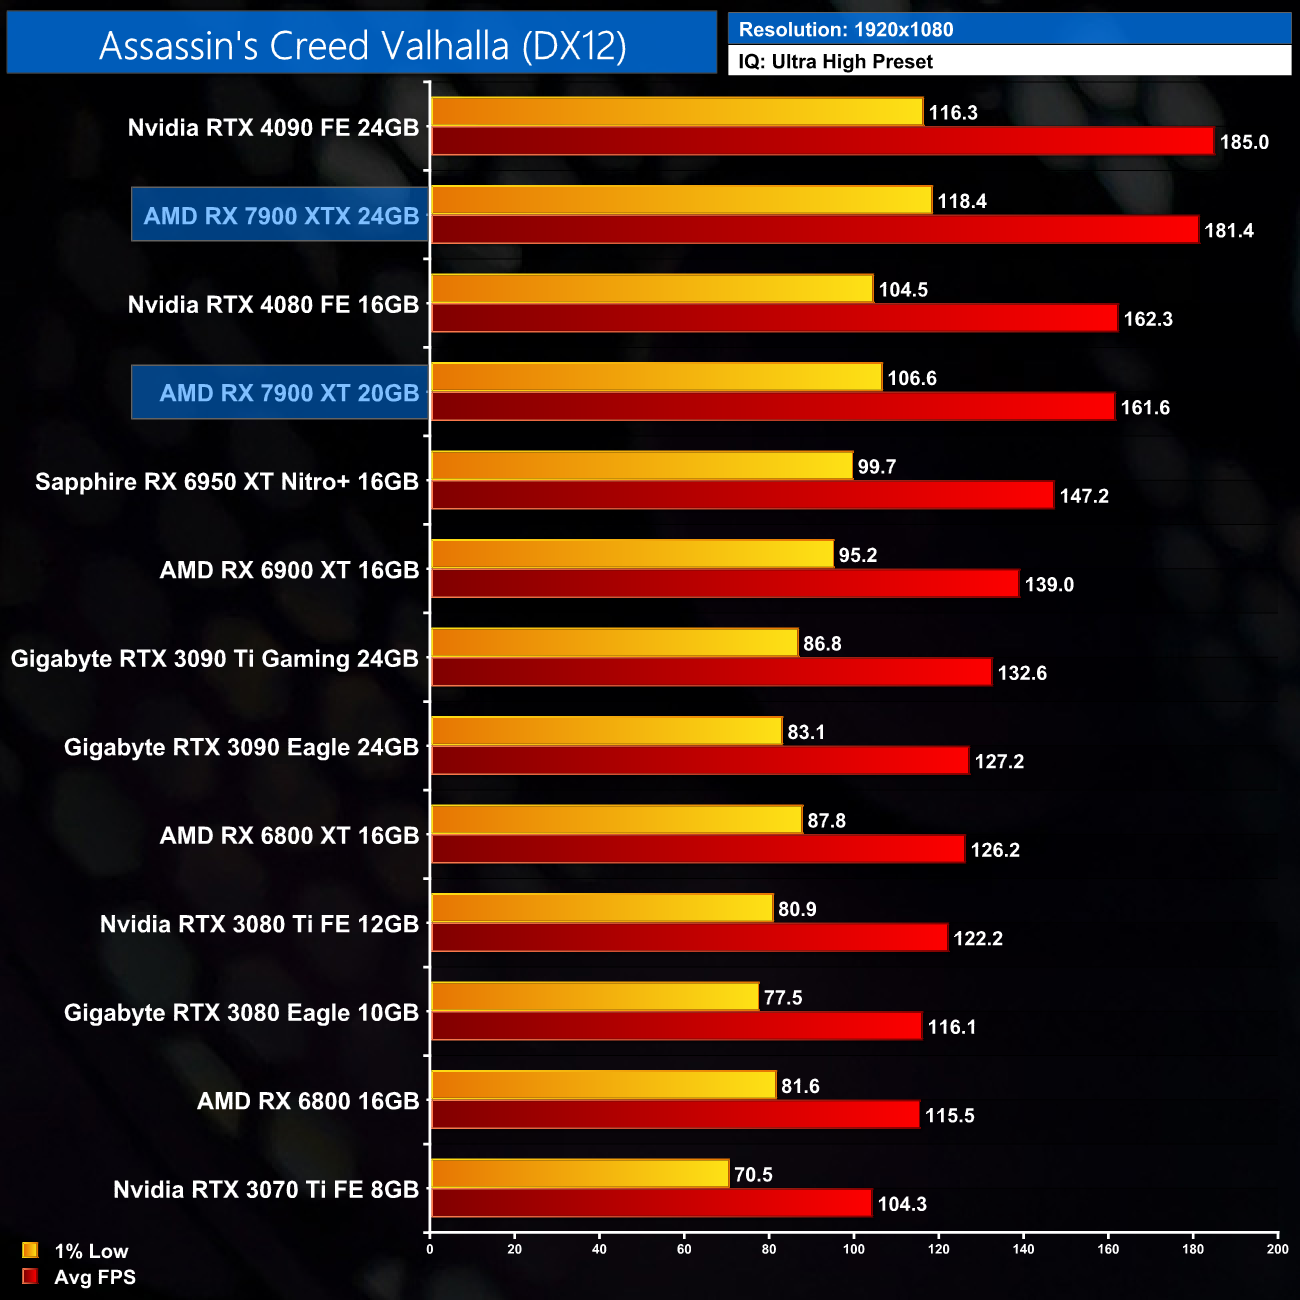
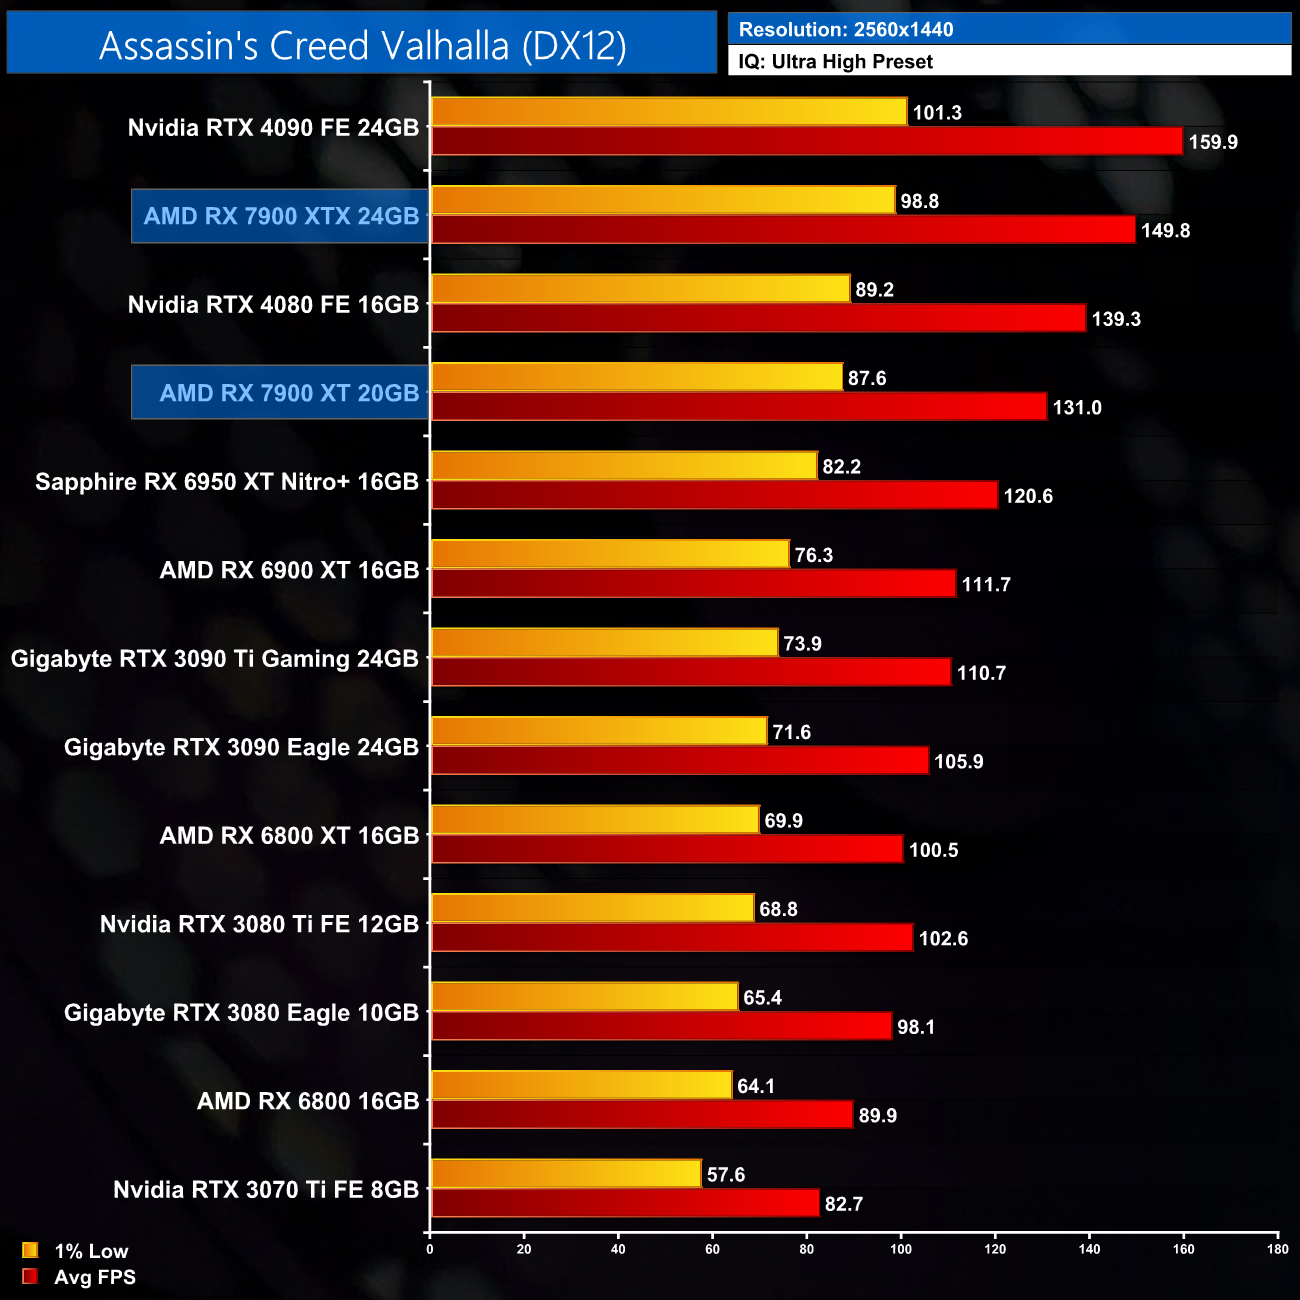
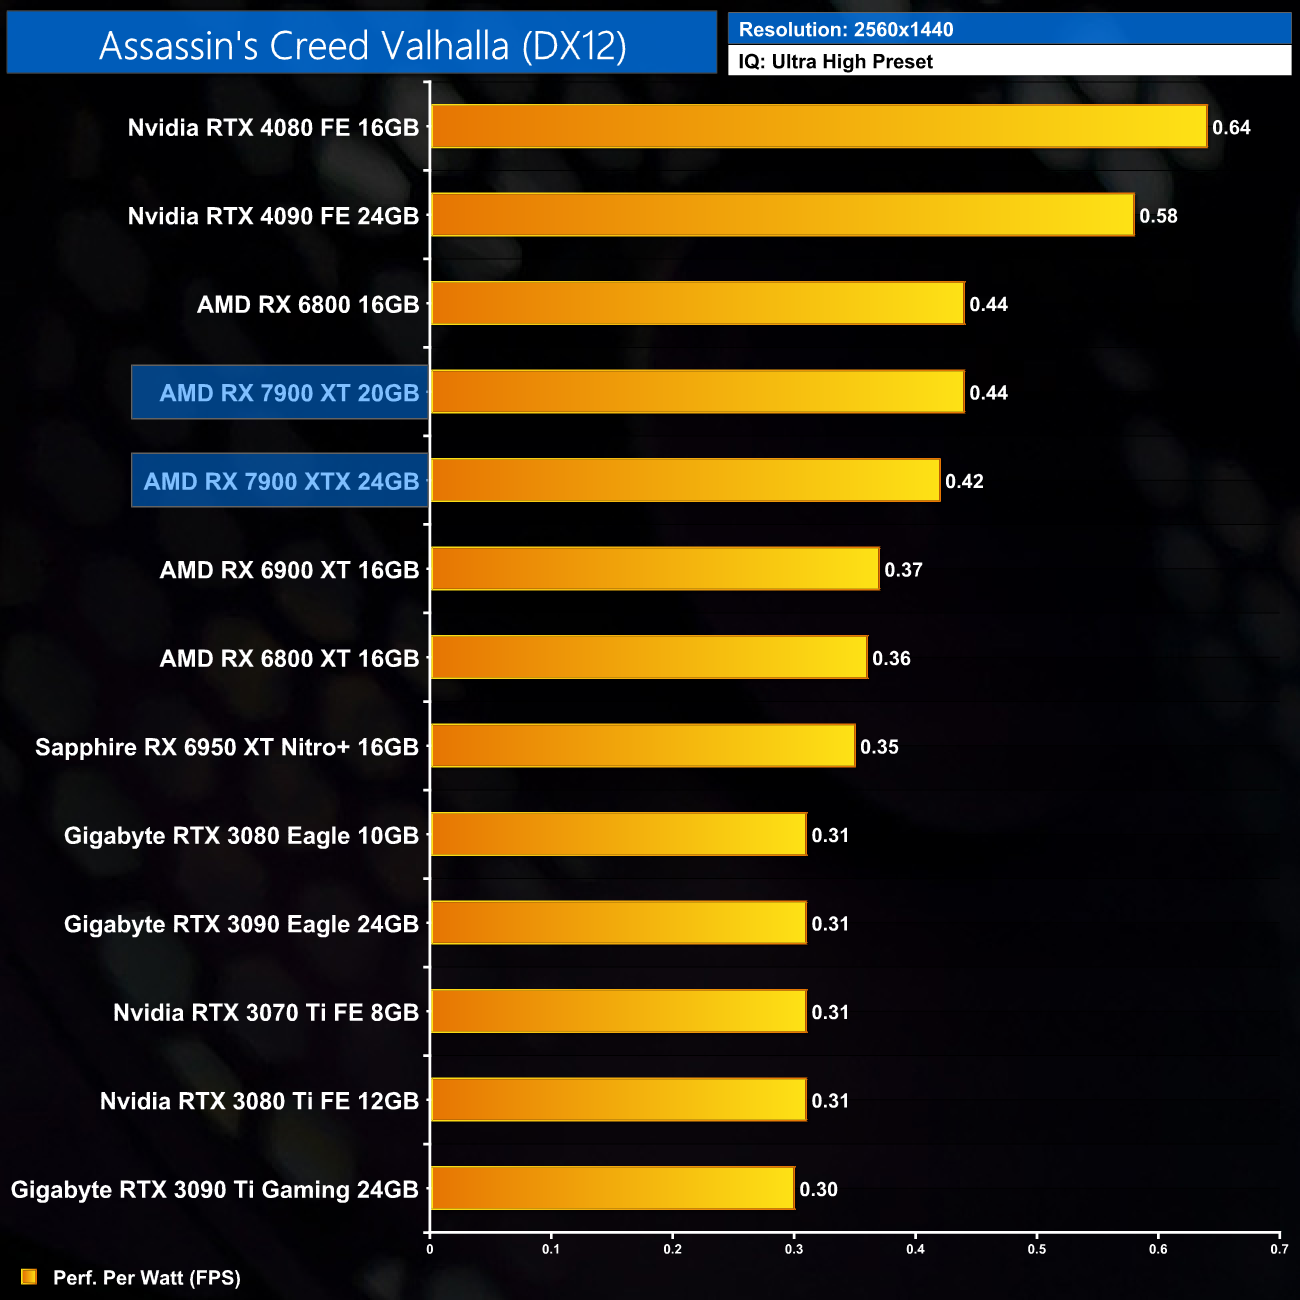
Starting the game benchmarks as we always do, with Assassin's Creed Valhalla, the RX 7900 XT is good for just over 131FPS at 1440p, putting it just a few frames behind the RTX 4080 – though do remember that this game historically favours AMD hardware.
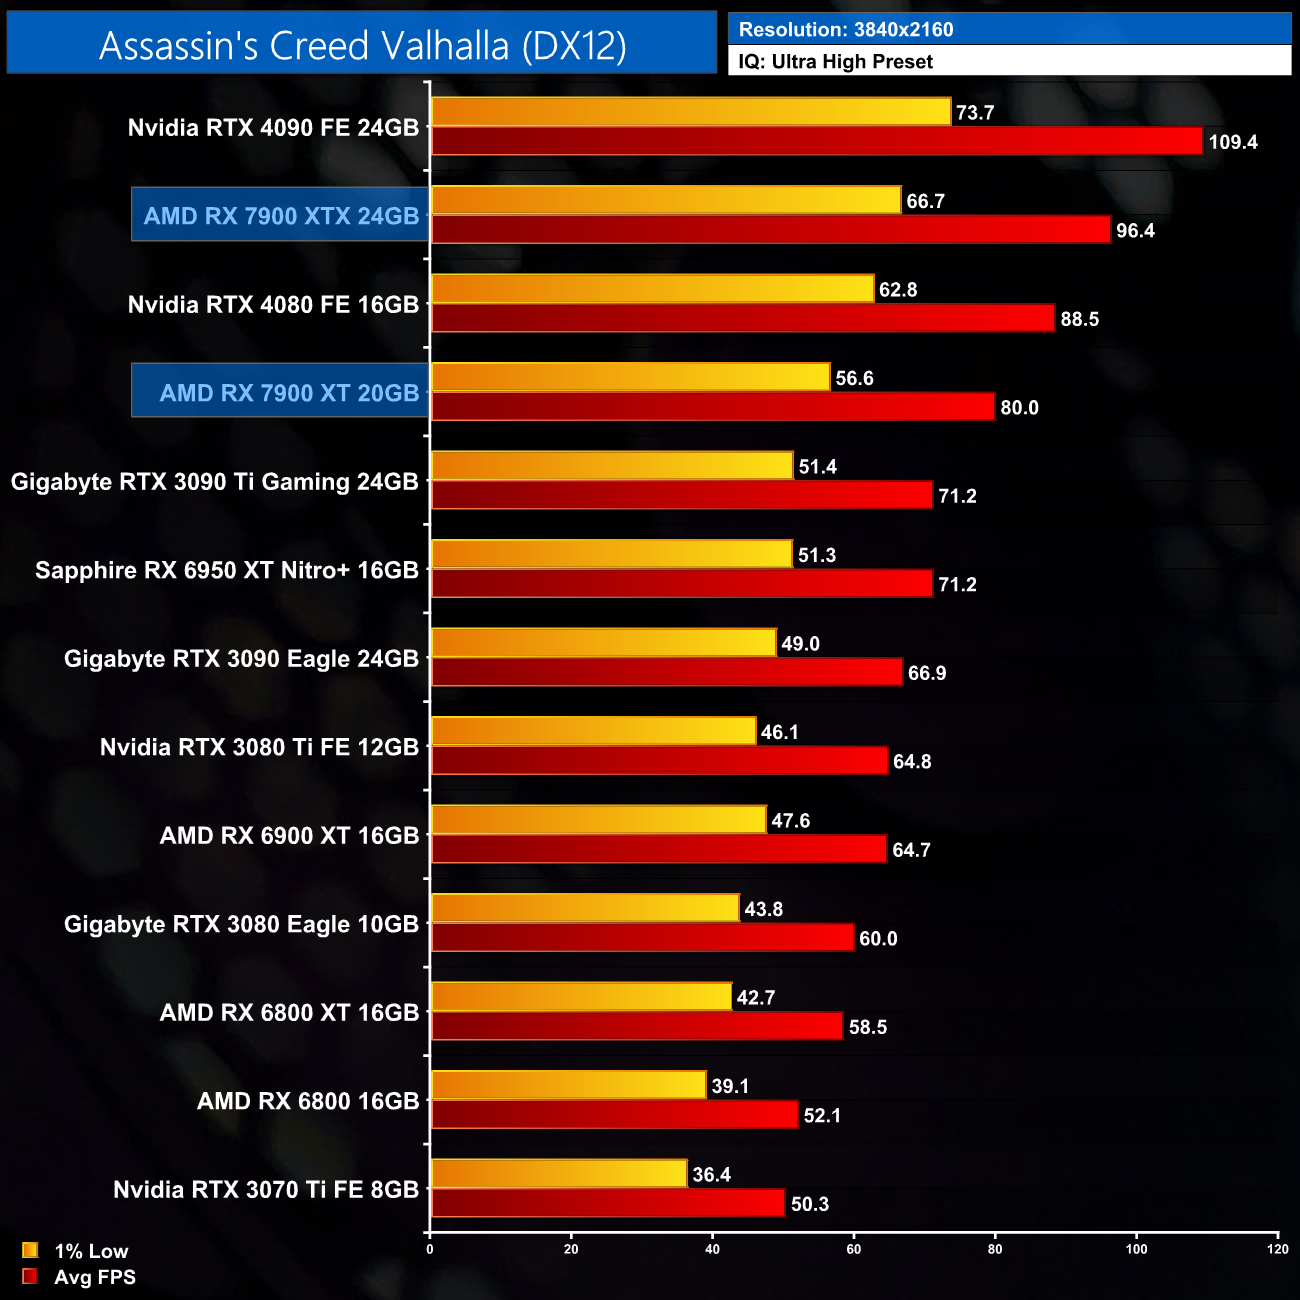
At 4K, the XT averages 80FPS, making it 12% faster than the RTX 3090 Ti and RX 6950 XT, while it's 10% slower than the RTX 4080.
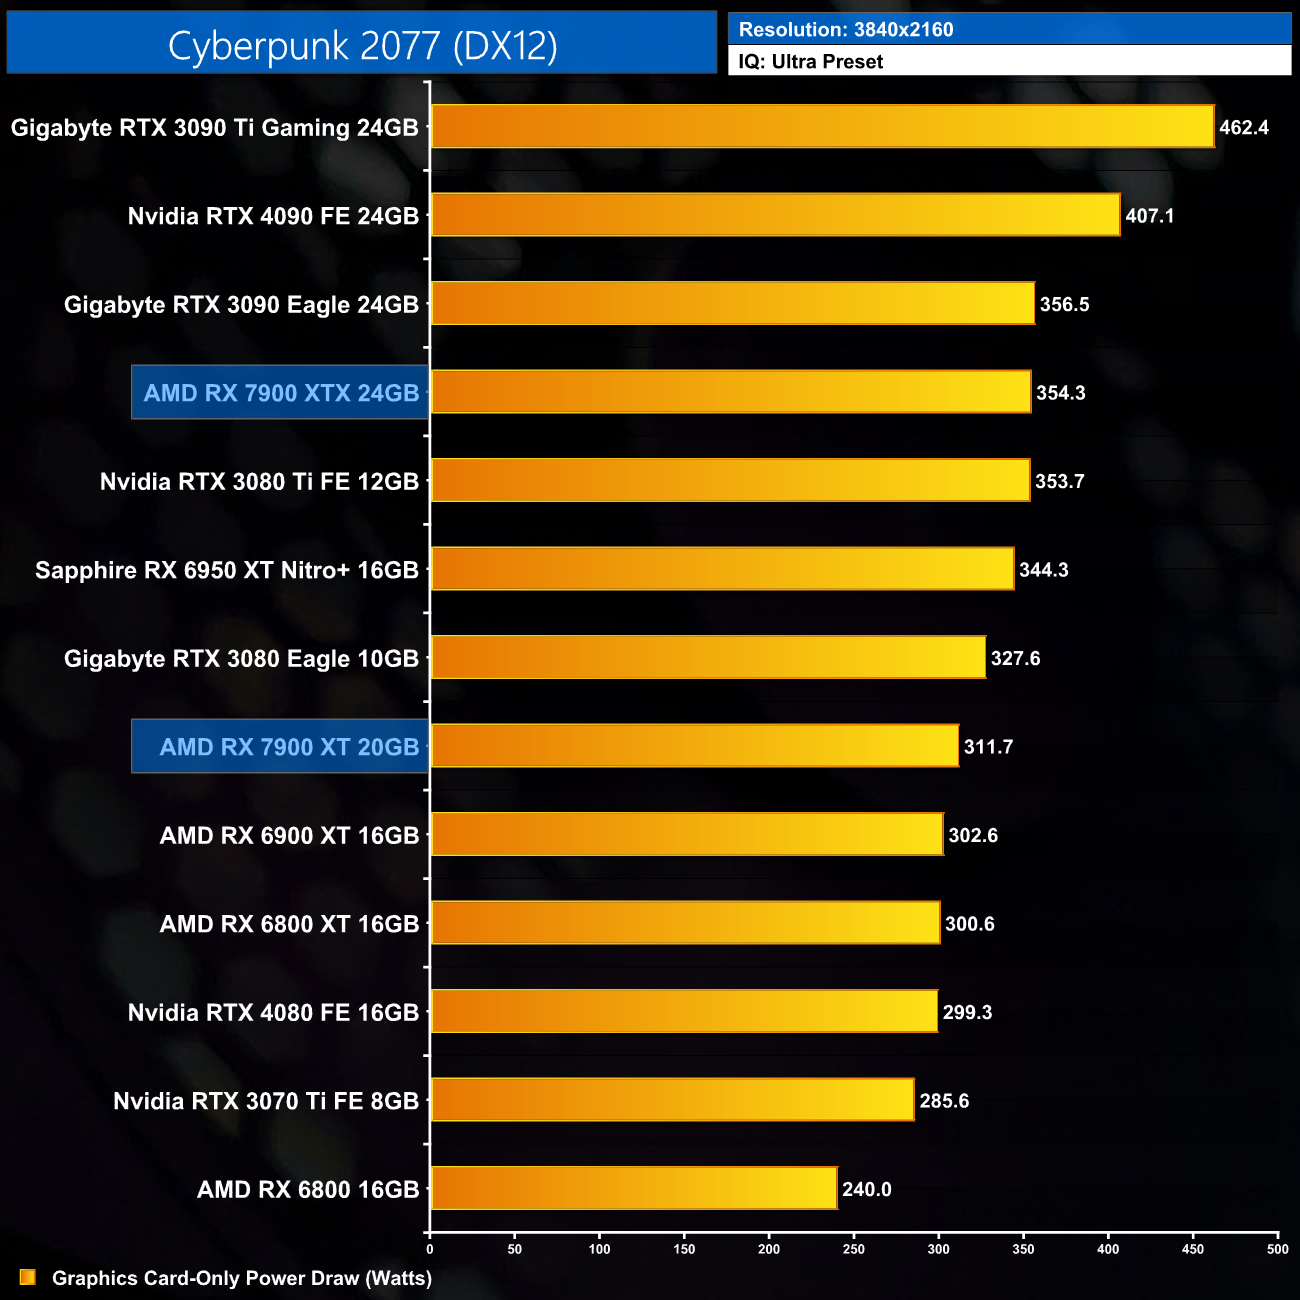
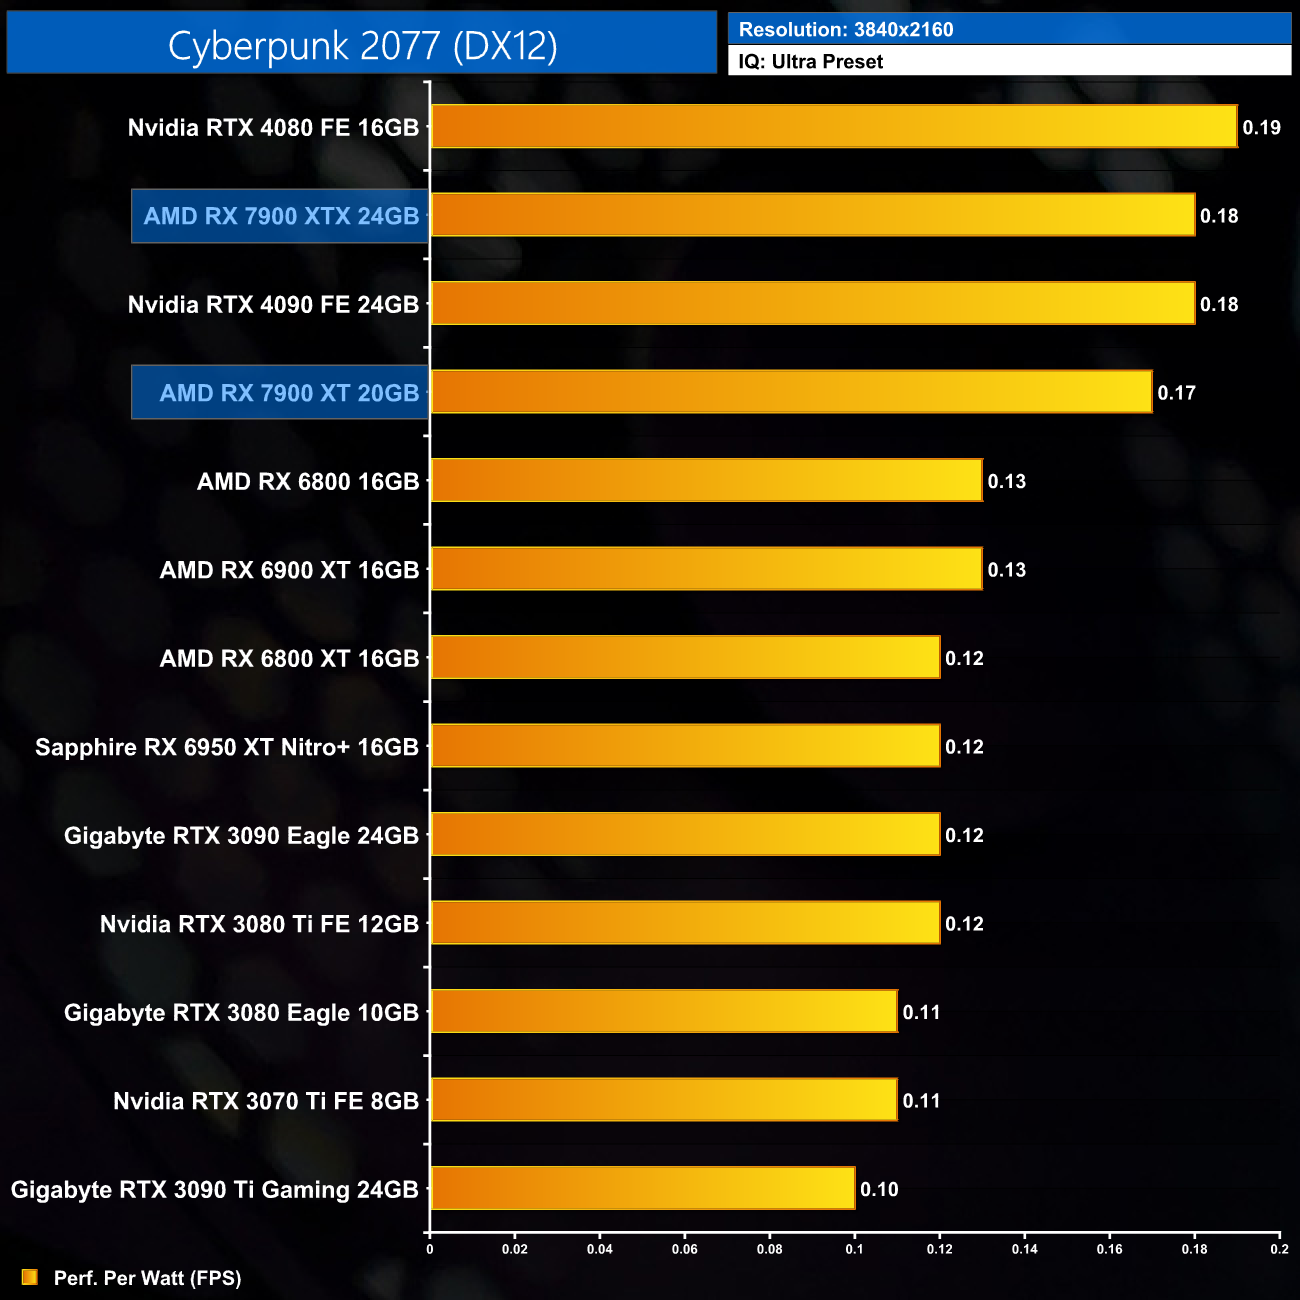
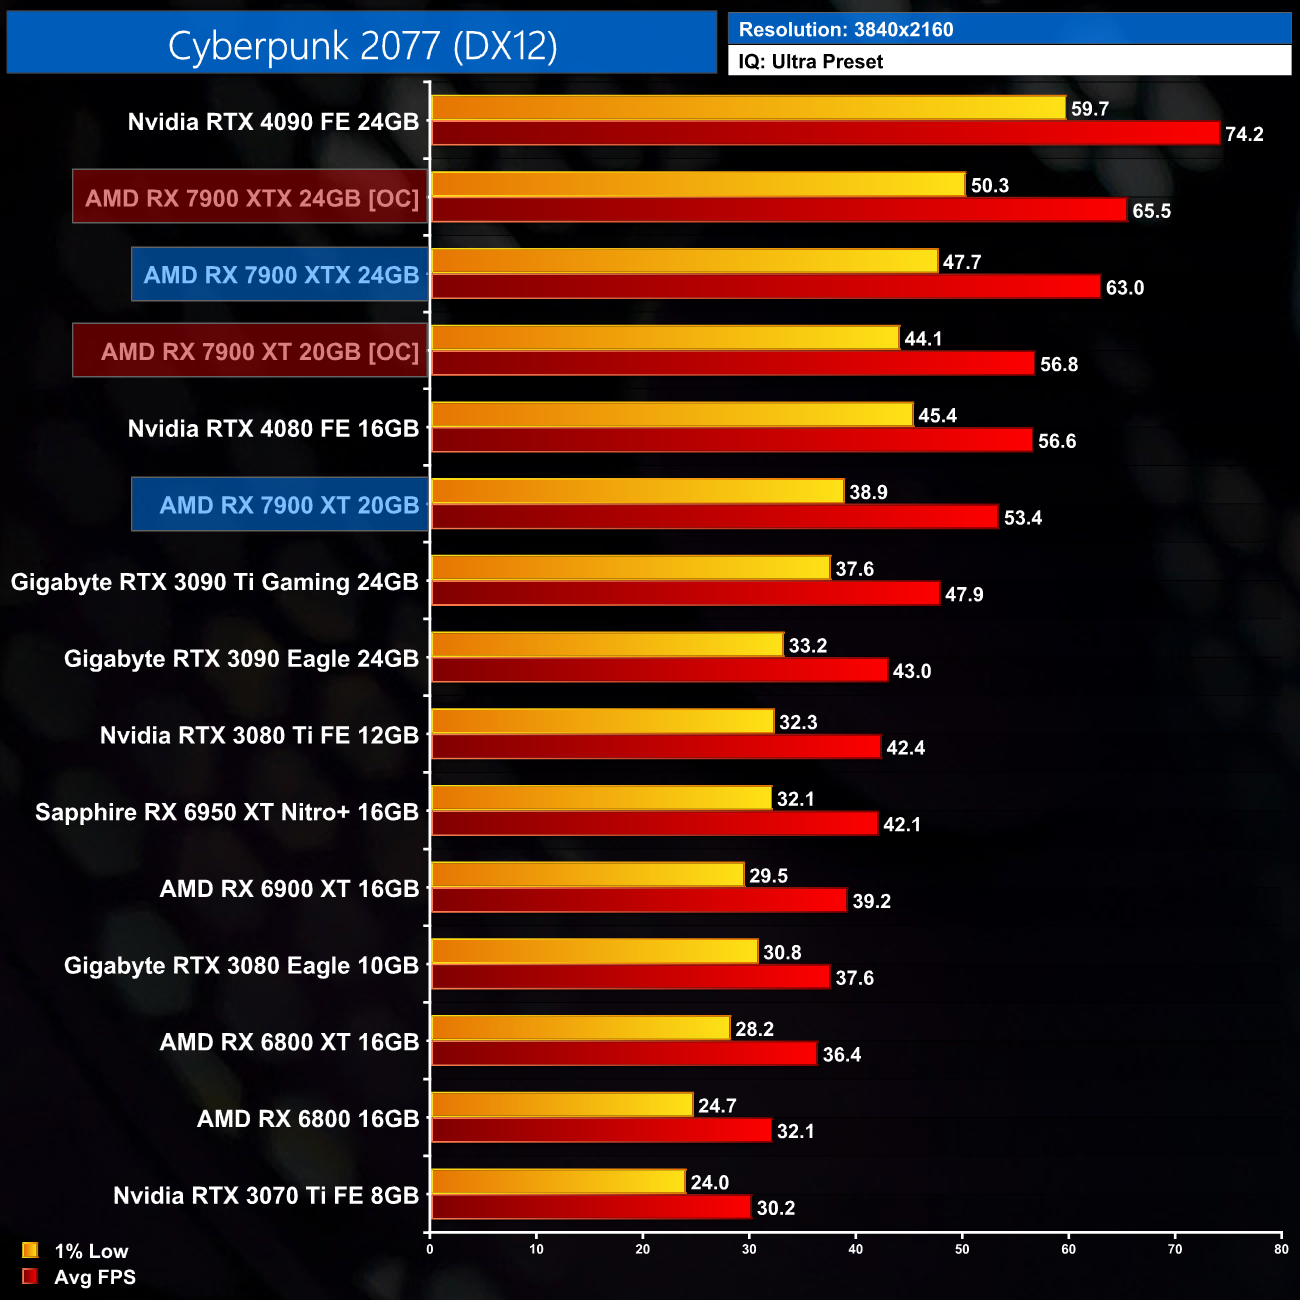
Cyberpunk 2077 is a 2020 action role-playing video game developed and published by CD Projekt. The story takes place in Night City, an open world set in the Cyberpunk universe. Players assume the first-person perspective of a customisable mercenary known as V, who can acquire skills in hacking and machinery with options for melee and ranged combat. Cyberpunk 2077 was released for Microsoft Windows, PlayStation 4, Stadia, and Xbox One on 10 December 2020. (Wikipedia).
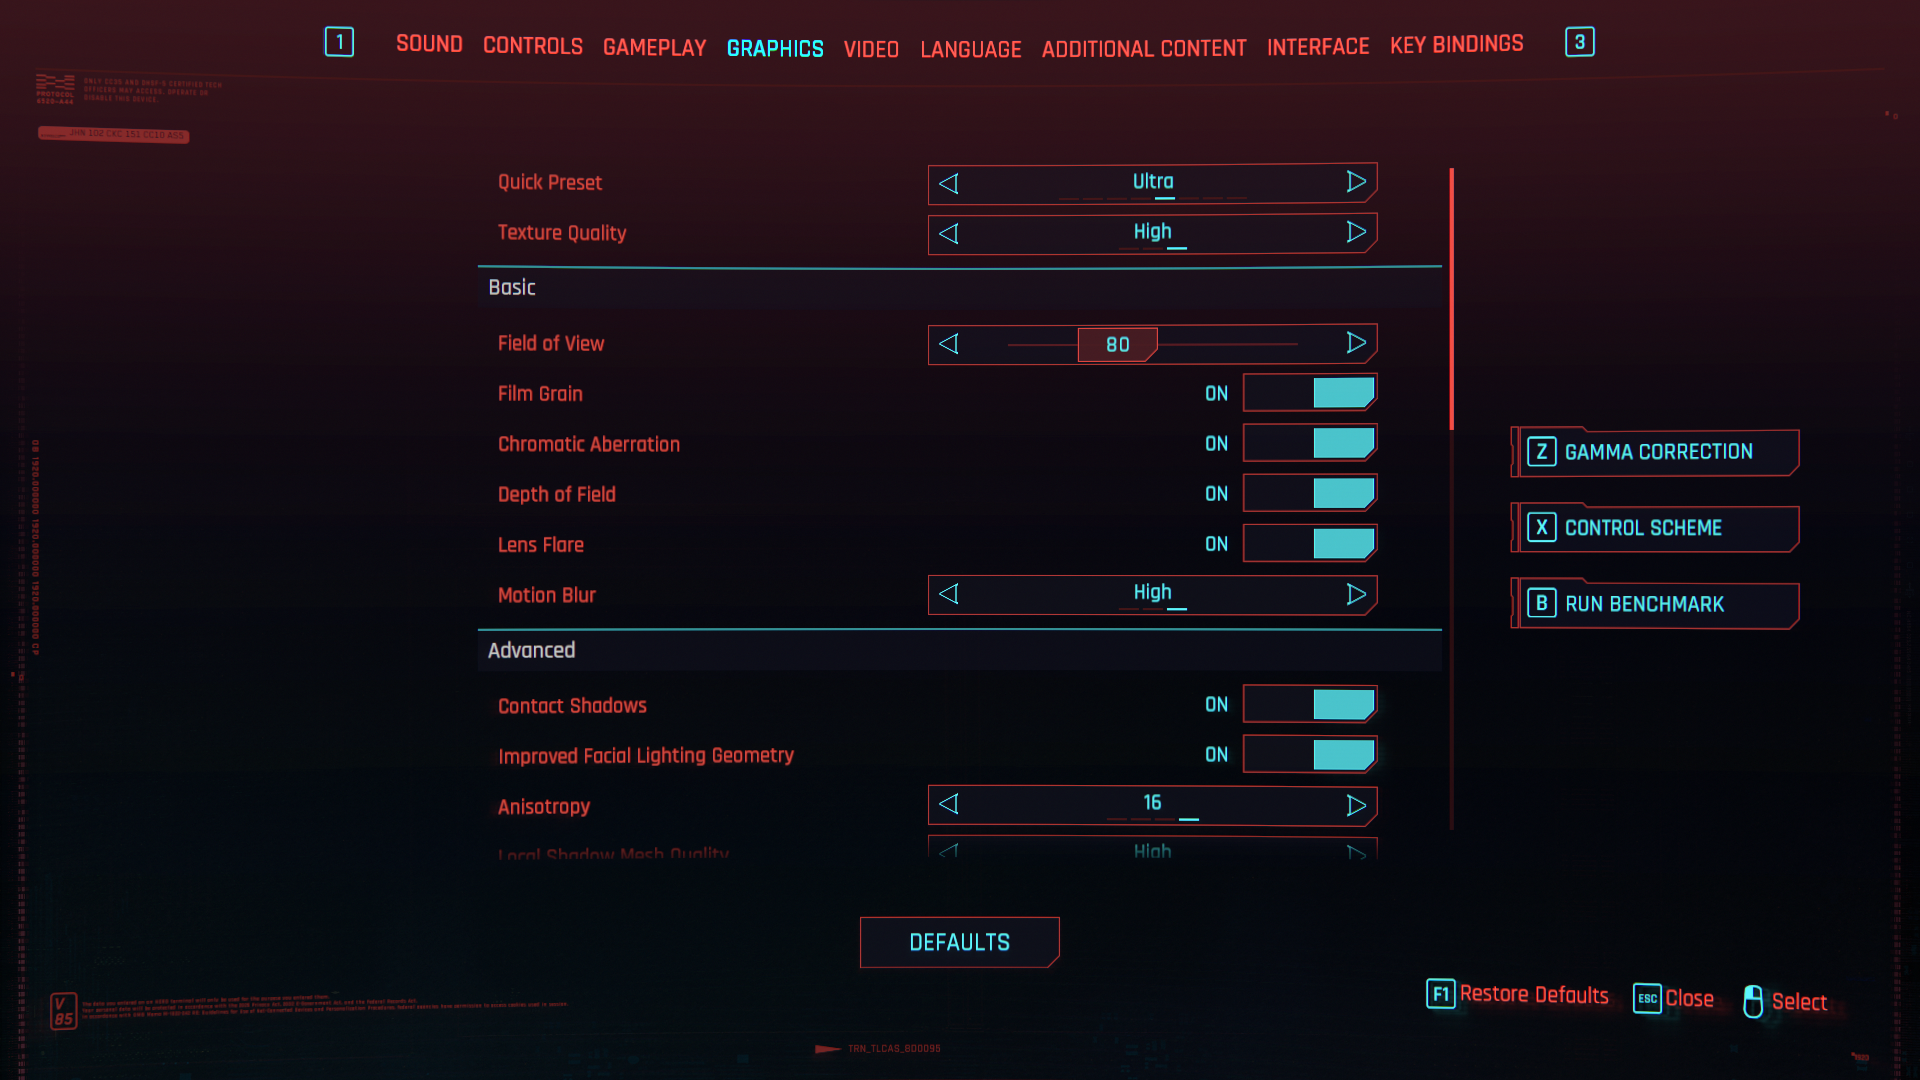
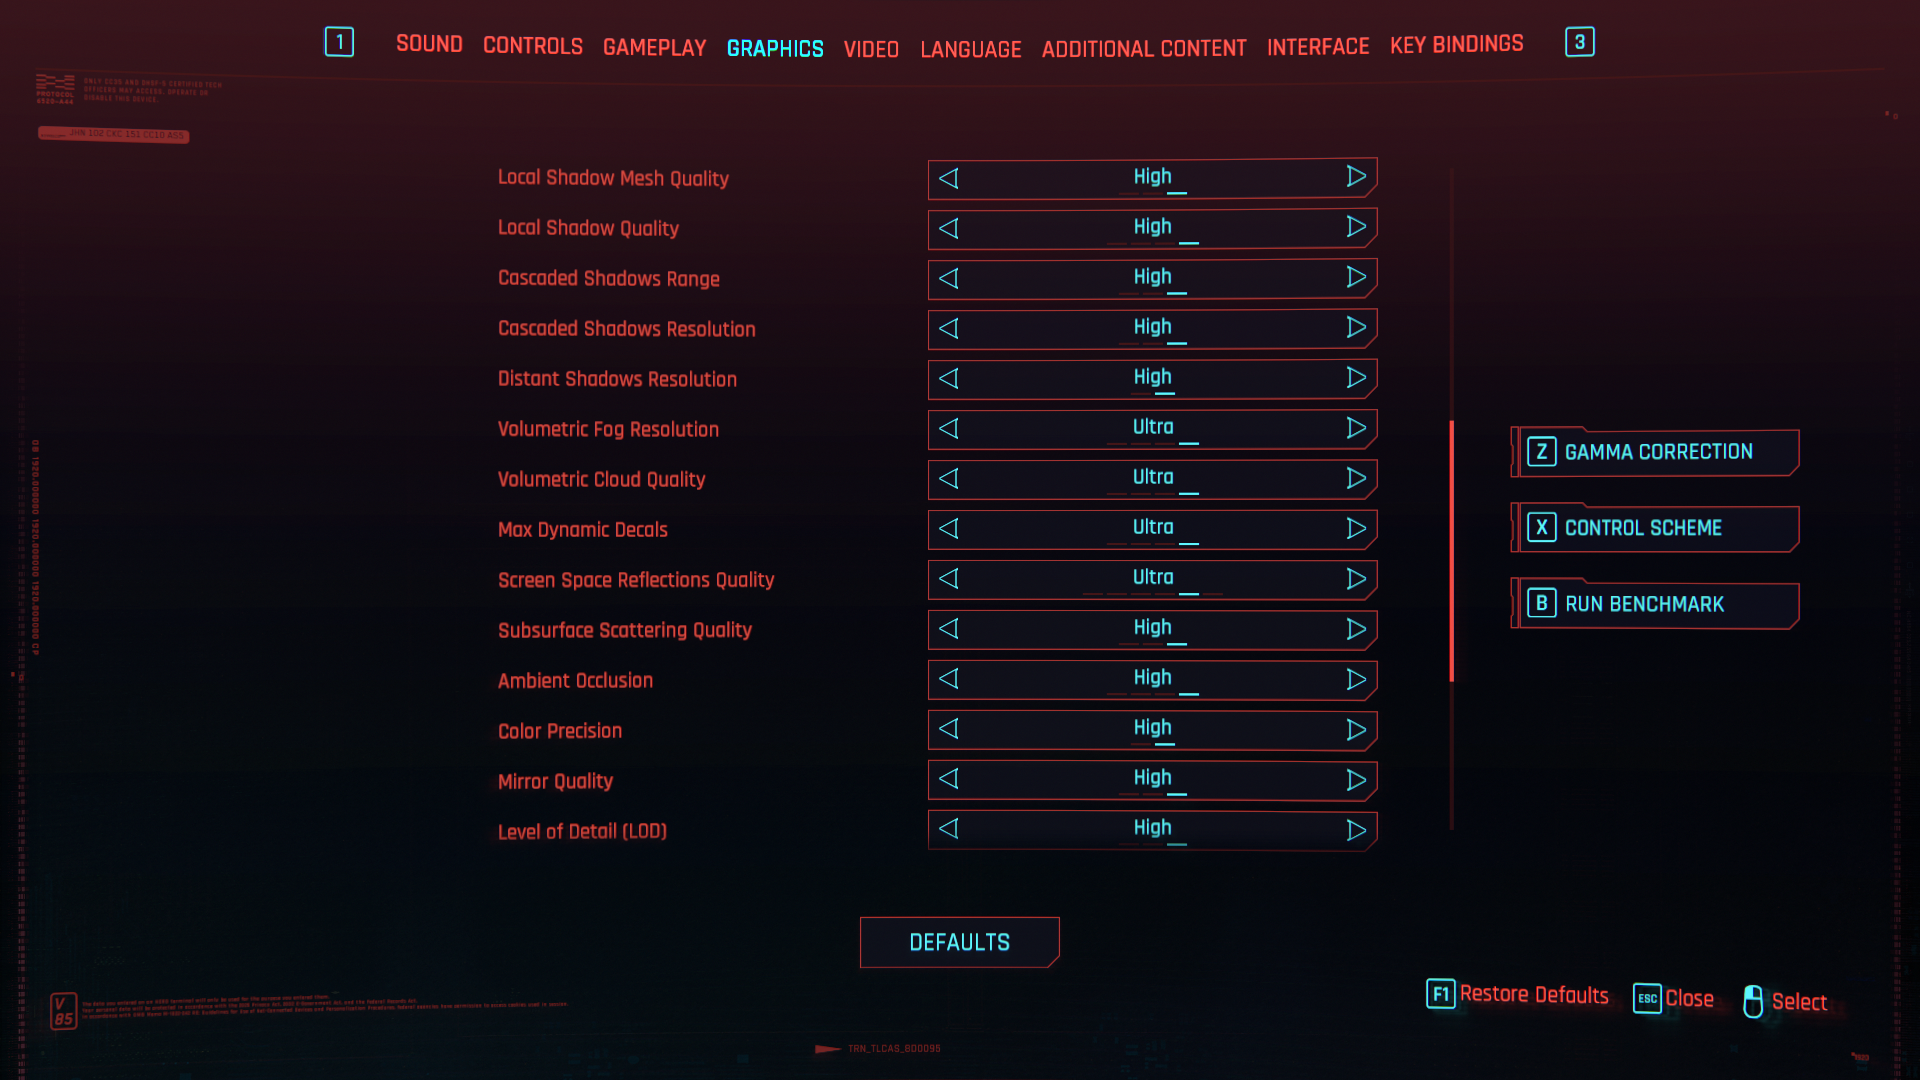
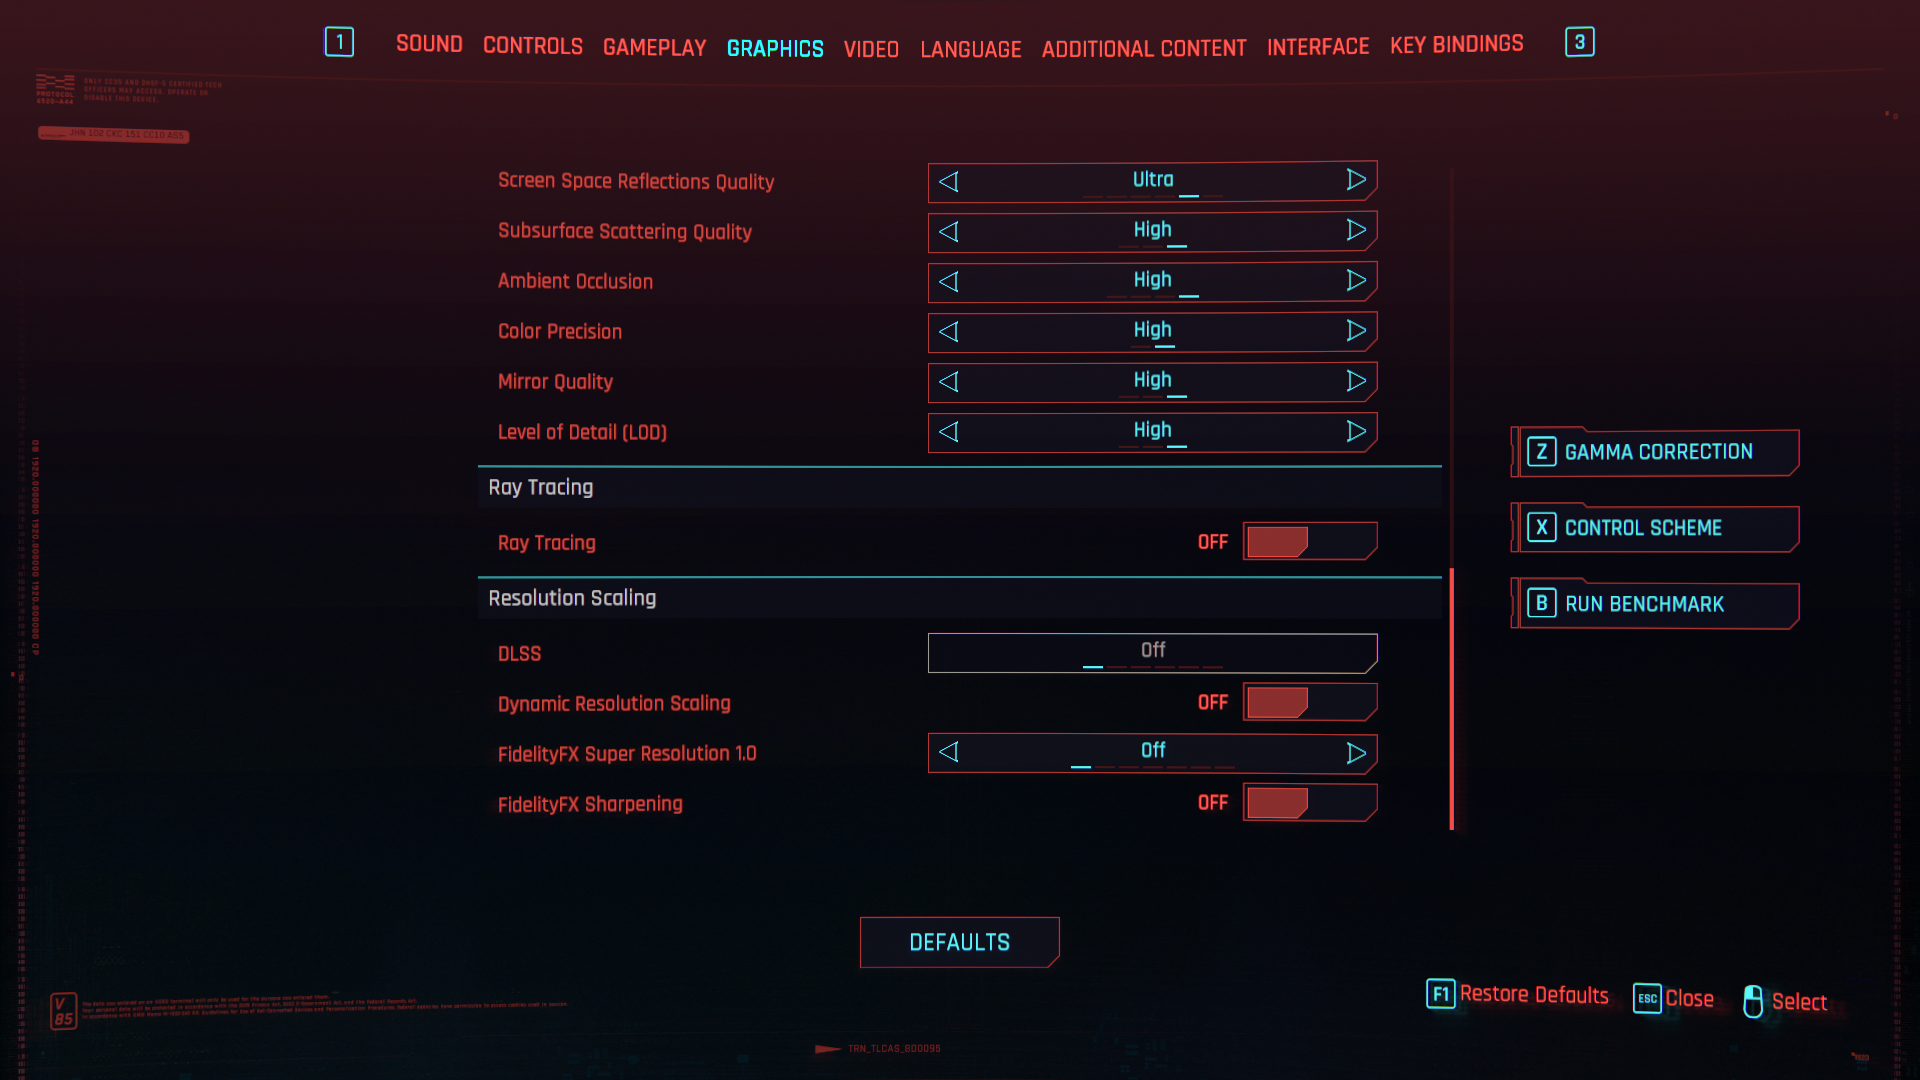
Engine: REDengine 4. We test using the Ultra preset, DX12 API.
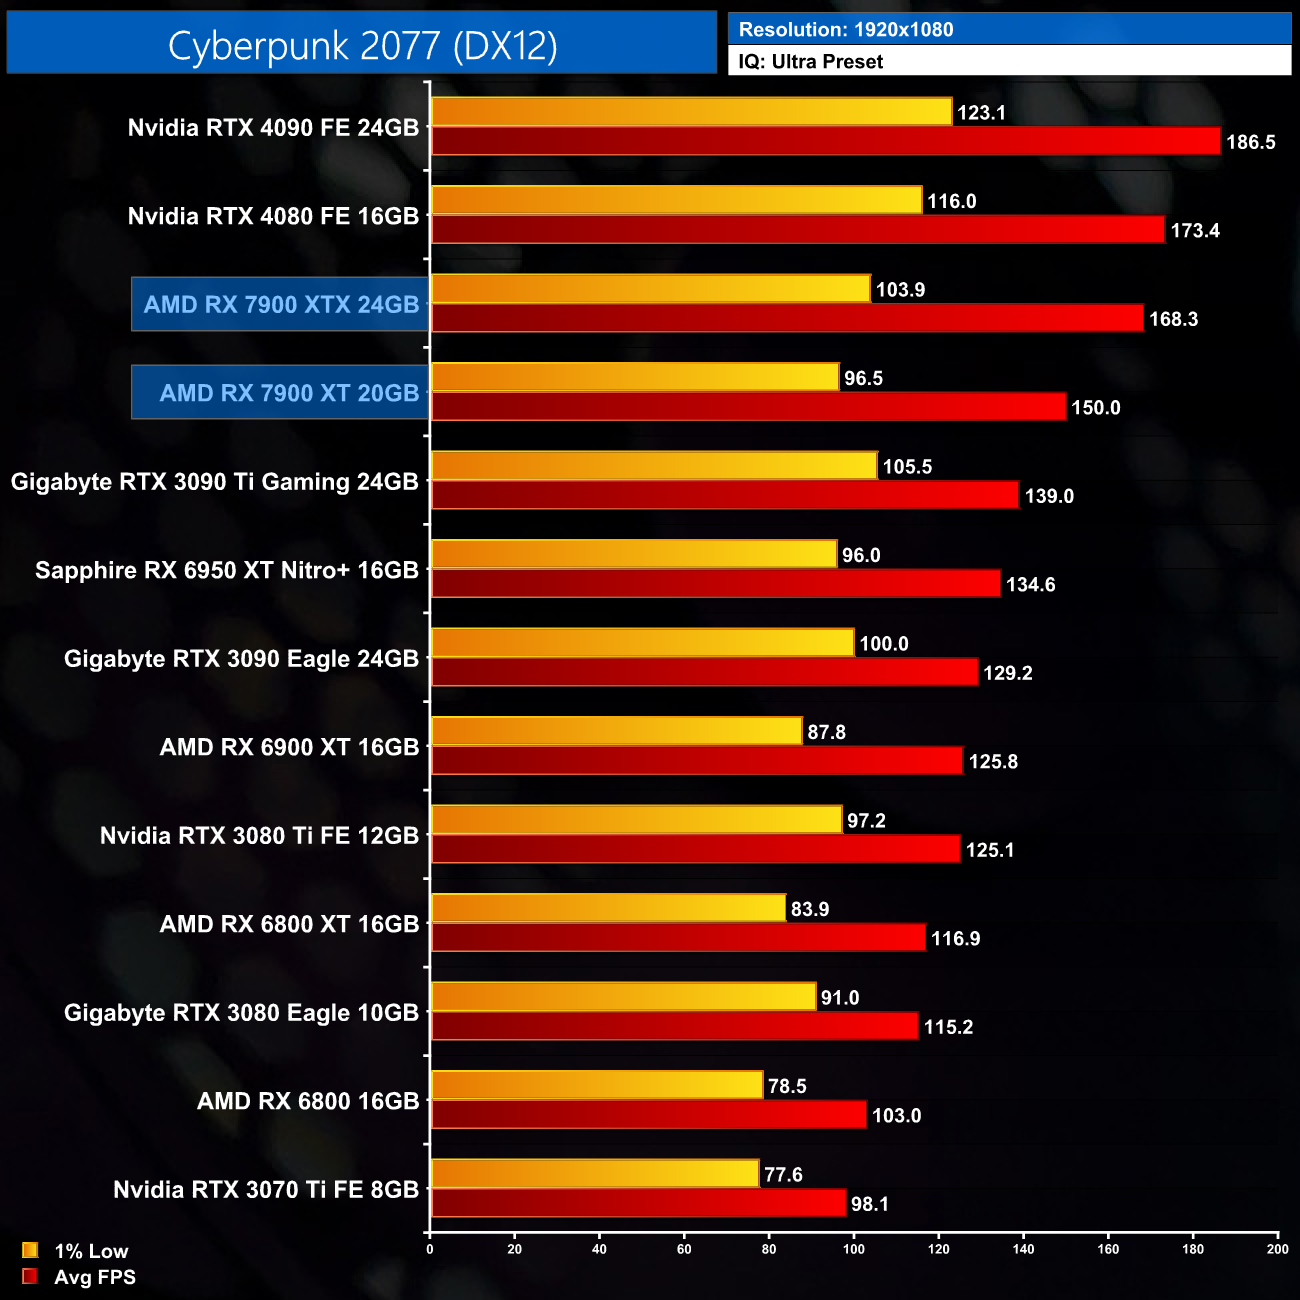
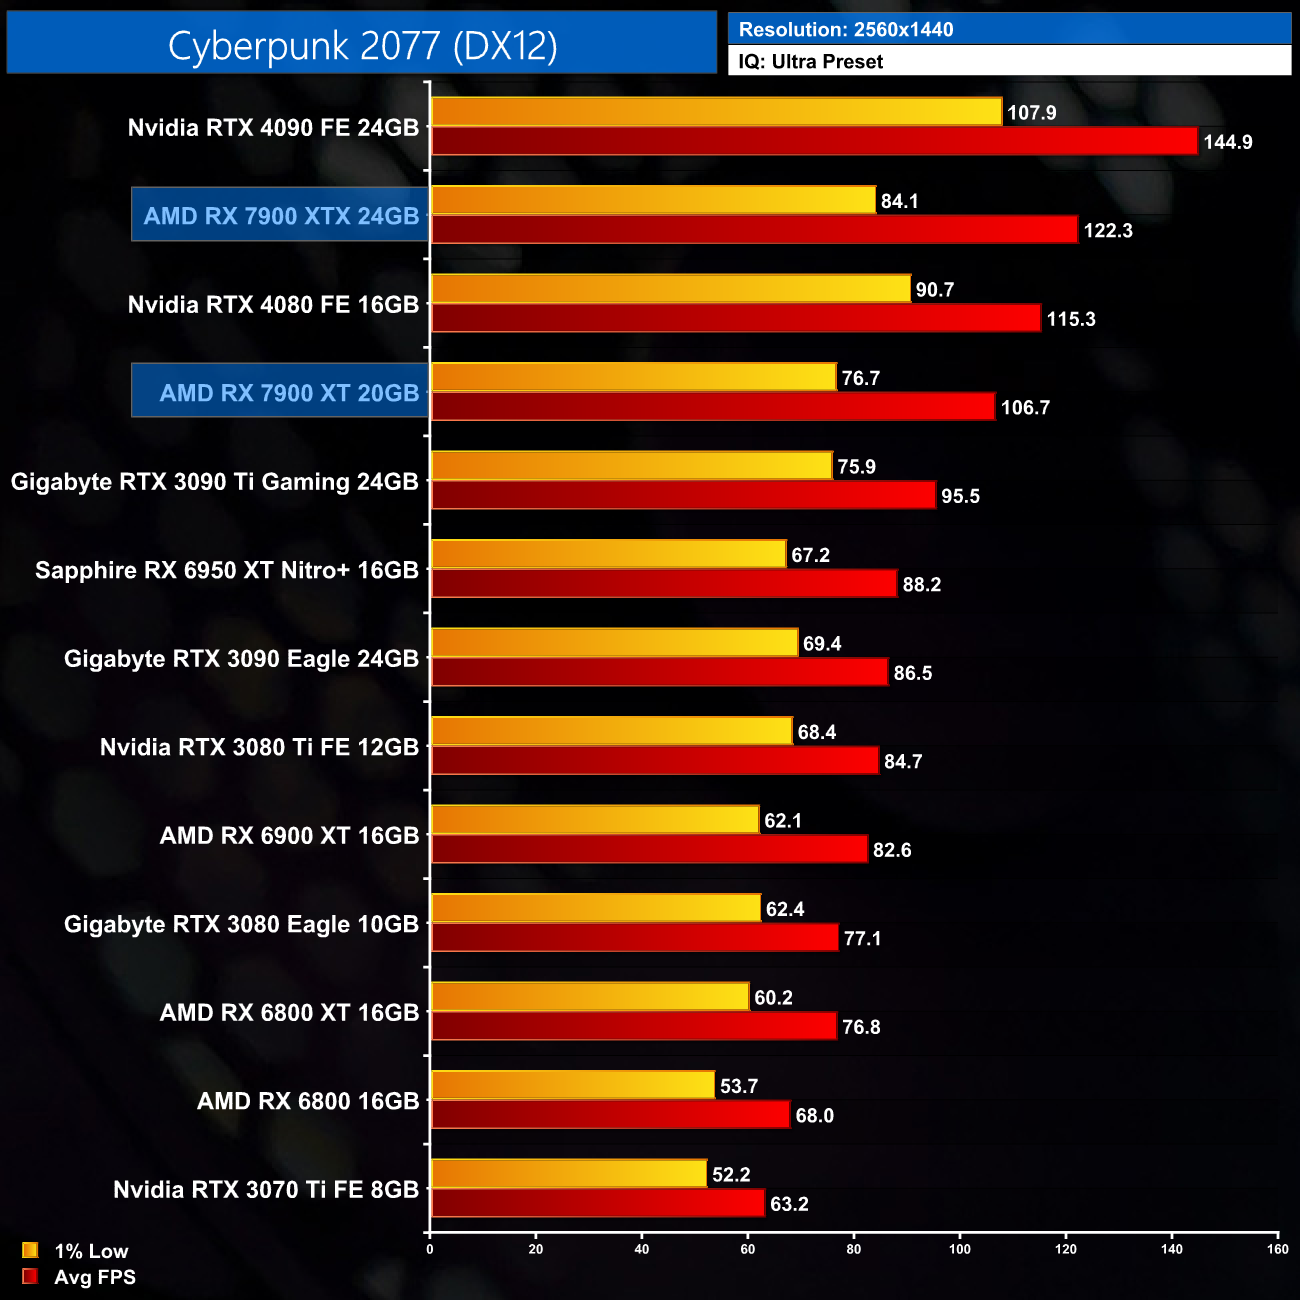

Meanwhile in Cyberpunk 2077, the RX 7900 XT delivers over 100FPS at 1440p, making it 12% faster on average than the RTX 3090 Ti, but with similar 1% low performance.
Up at 4K, it can't quite deliver a 60FPS experience, but it's doing pretty well coming in just 6% shy of the RTX 4080, while it's 36% faster than the last-gen RX 6900 XT.
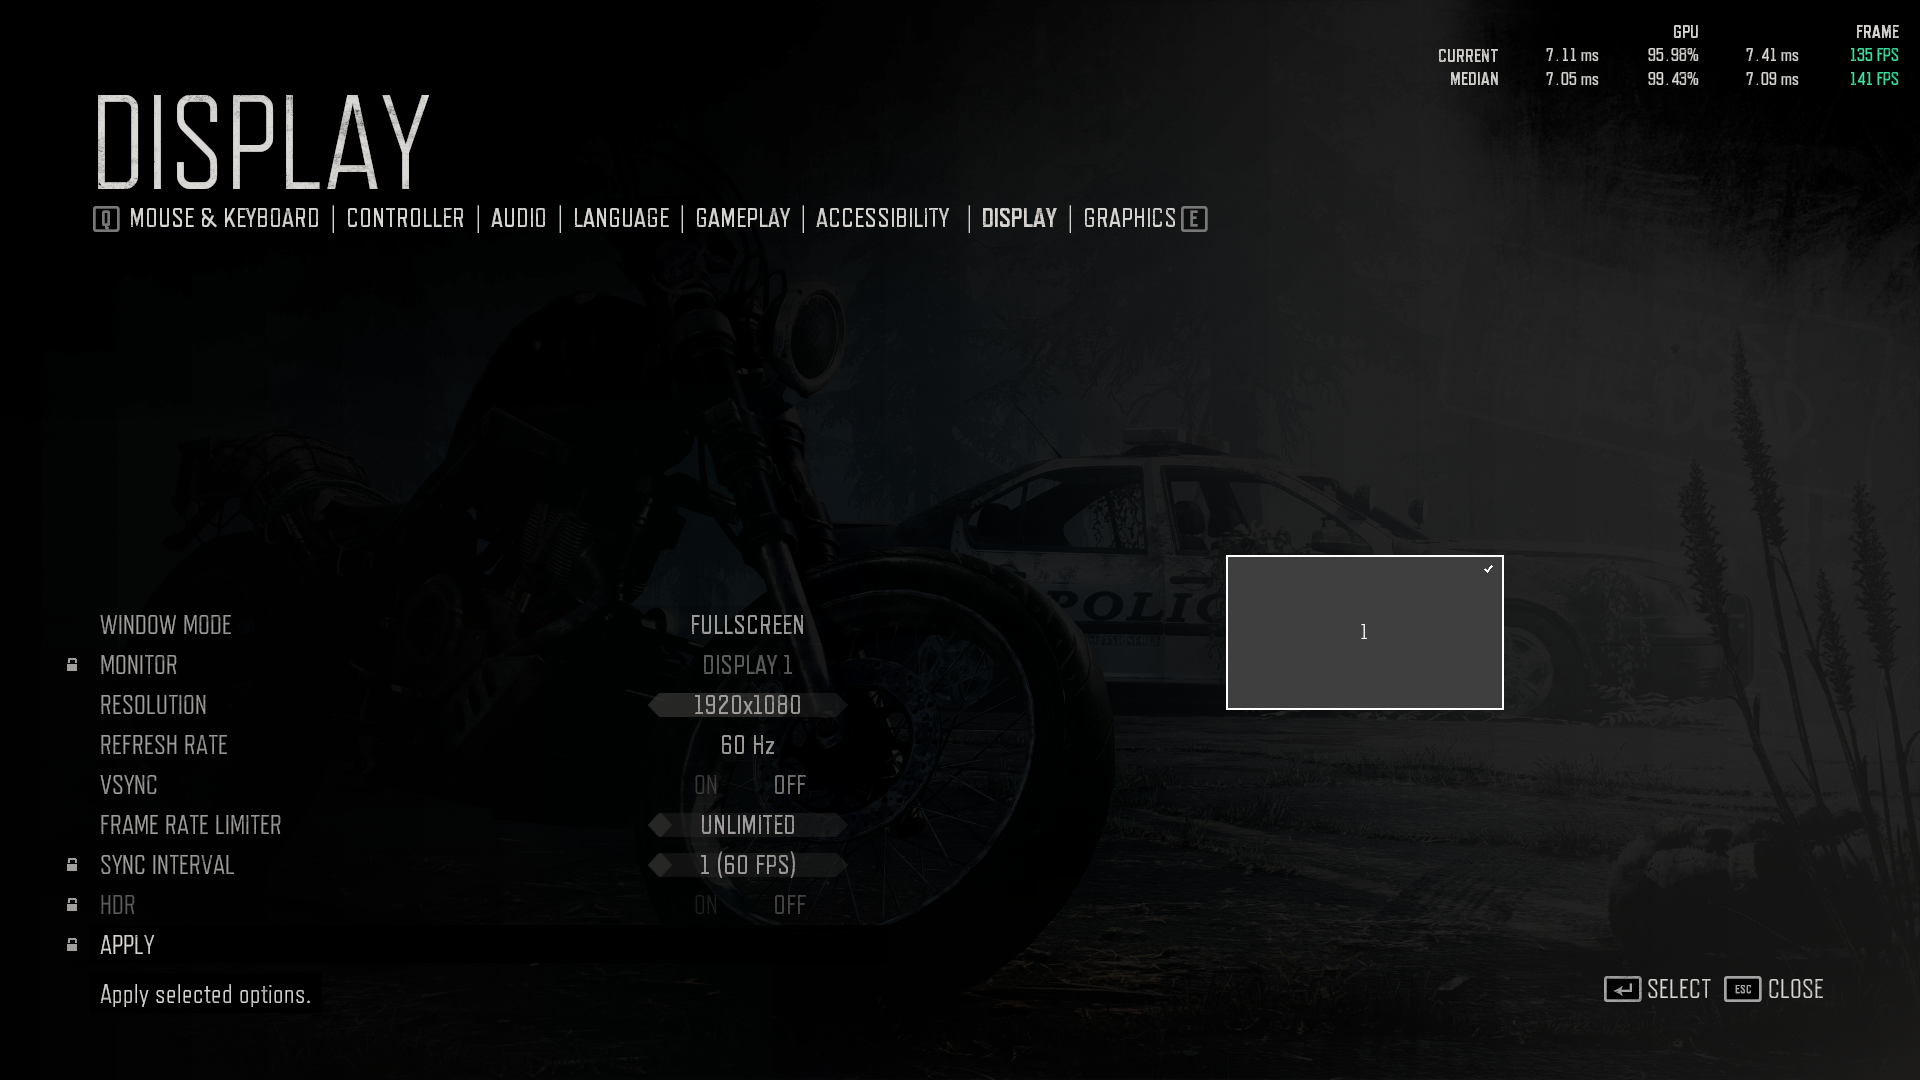
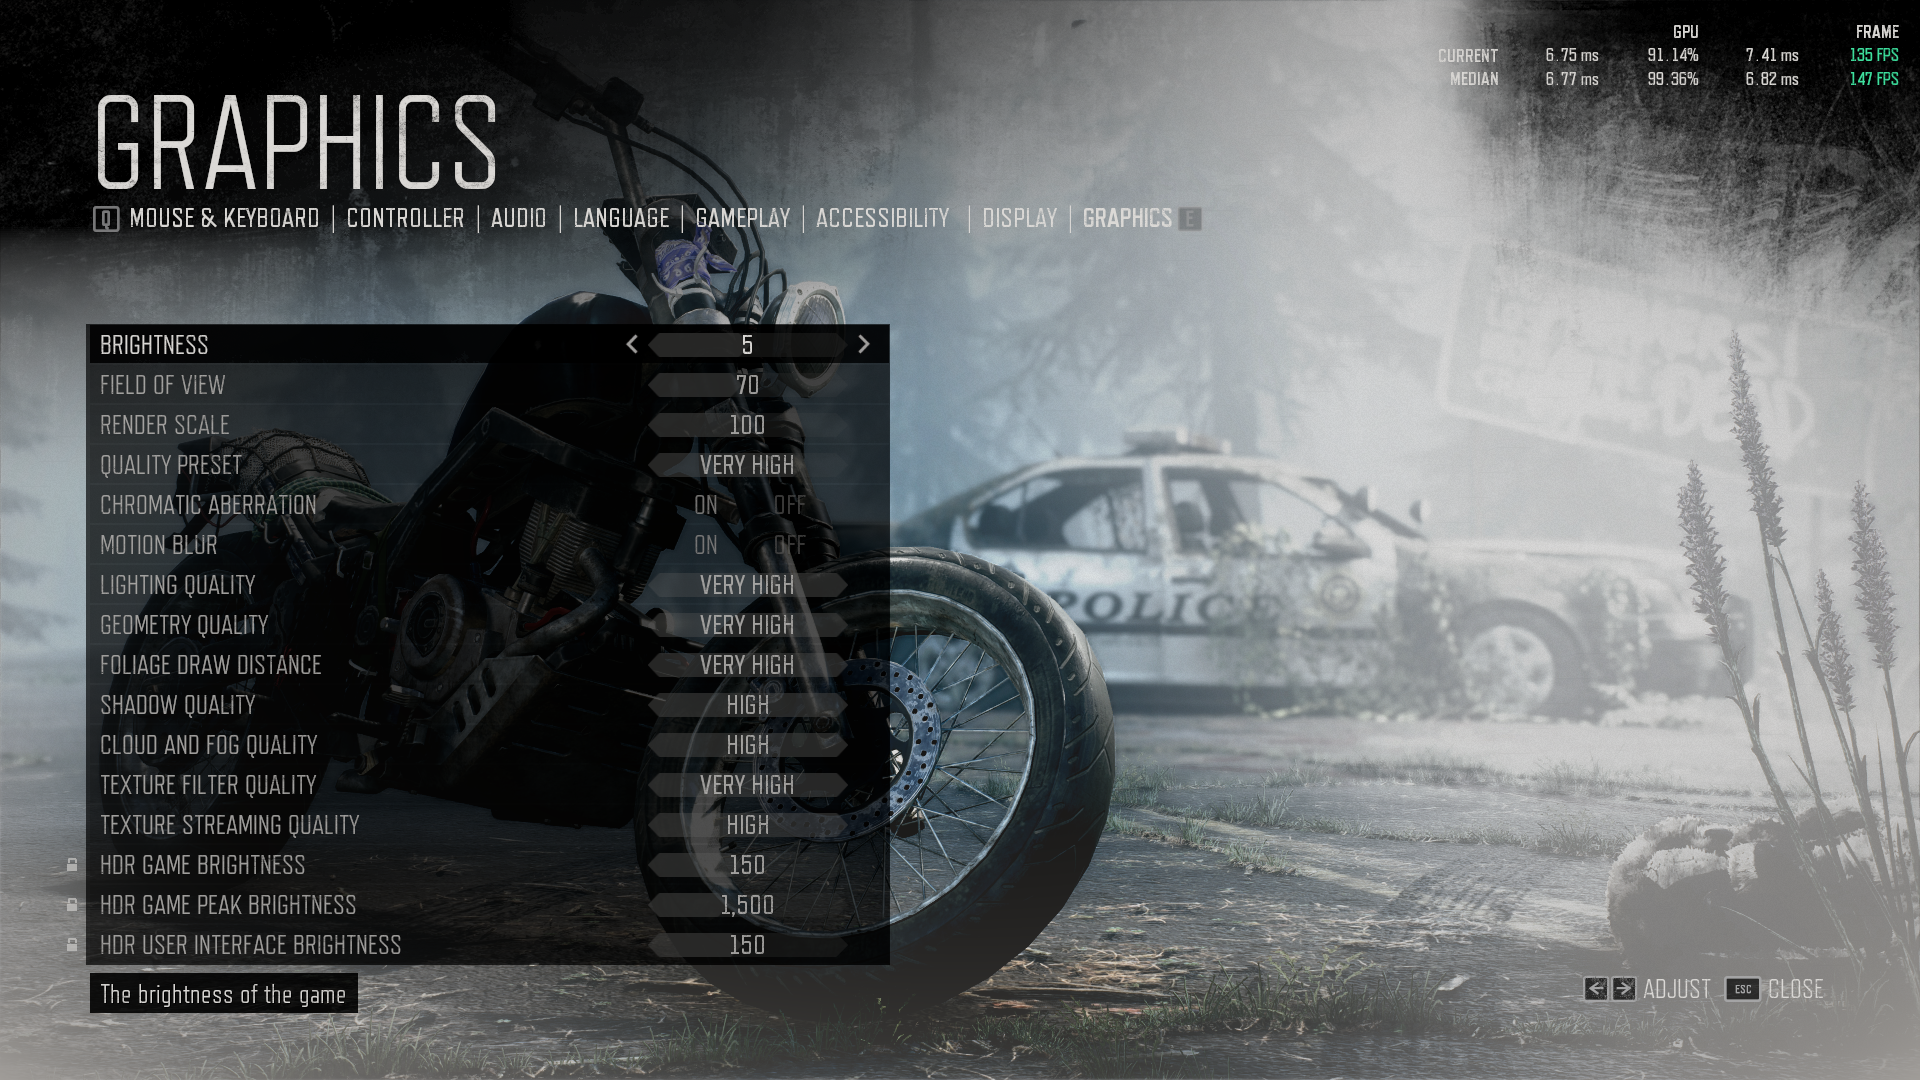
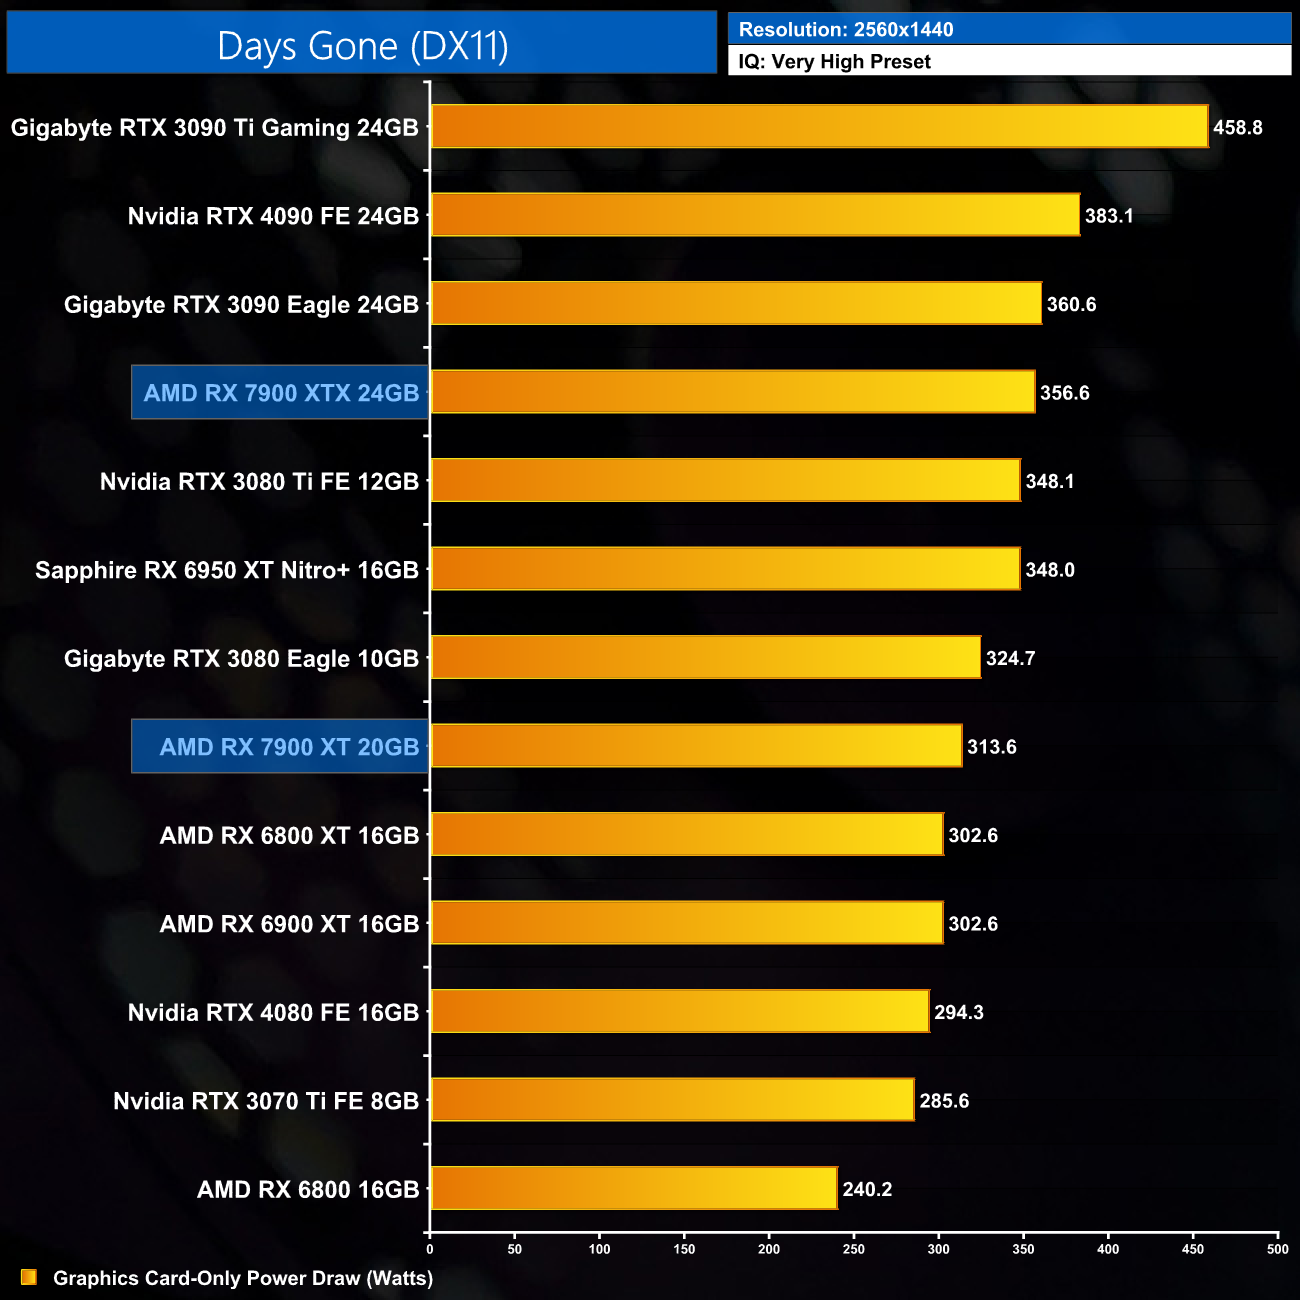
Days Gone is a 2019 action-adventure survival horror video game developed by Bend Studio and published by Sony Interactive Entertainment for the PlayStation 4 and Microsoft Windows. As part of Sony's efforts to bring more of its first-party content to Microsoft Windows following Horizon Zero Dawn, Days Gone released on Windows on May 18, 2021. (Wikipedia).
Engine: Unreal Engine 4. We test using the Very High preset, DX11 API.
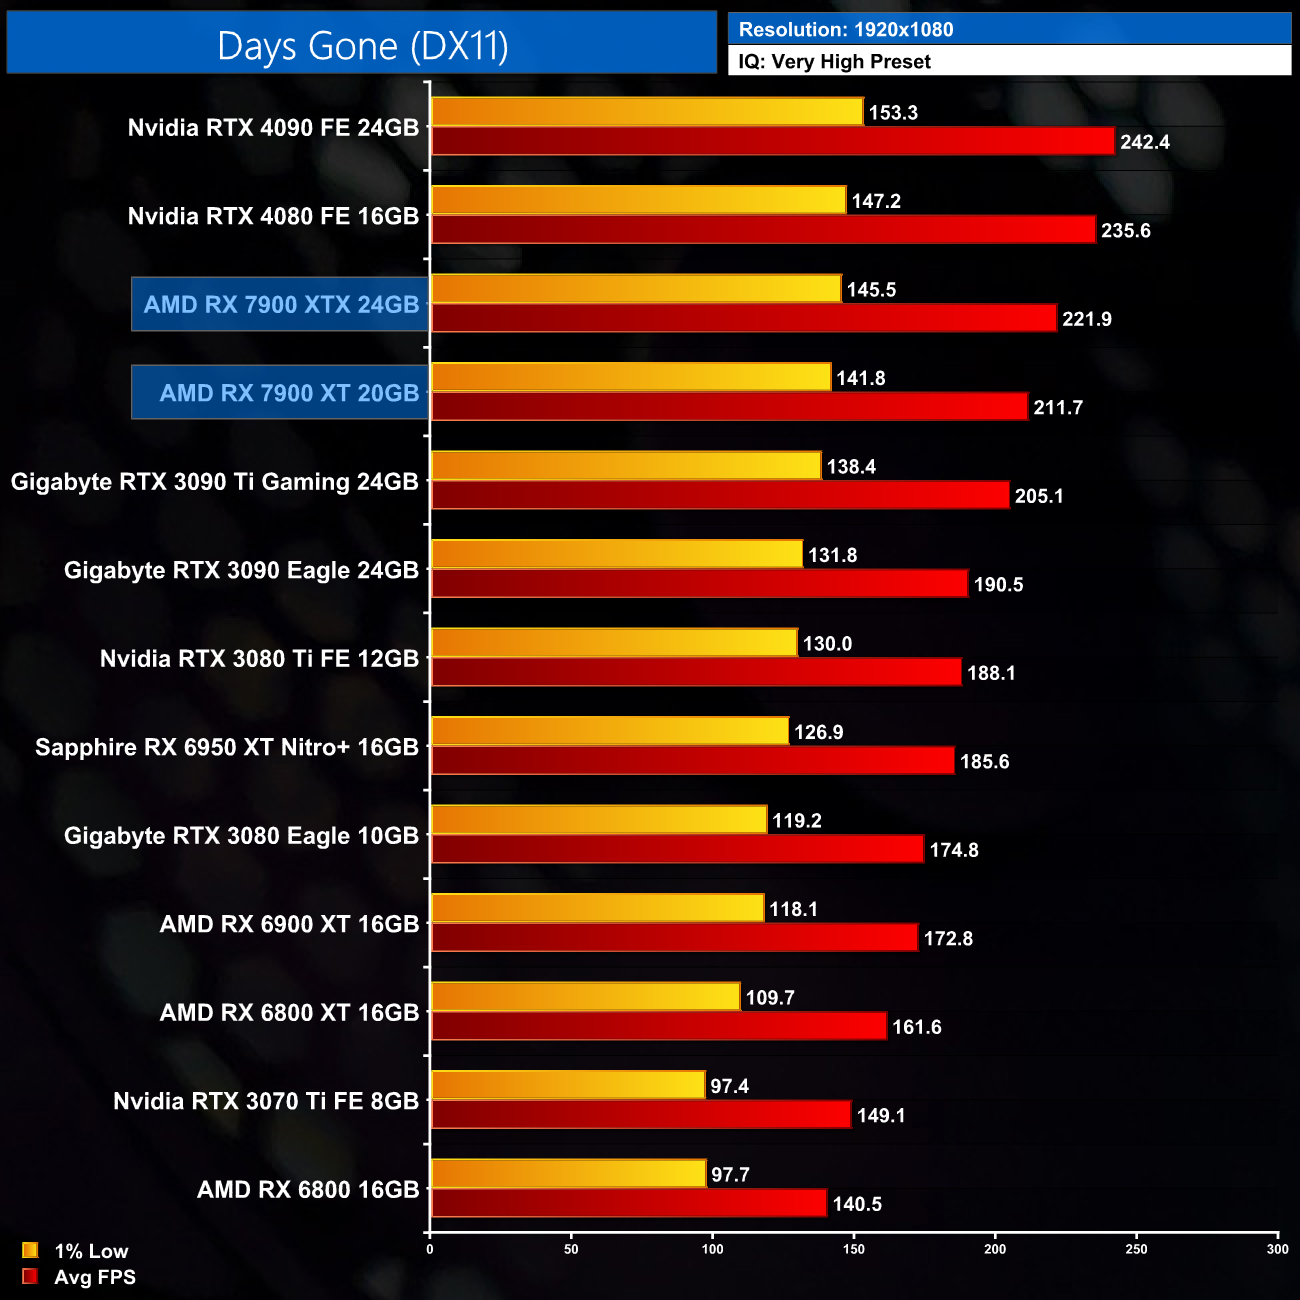
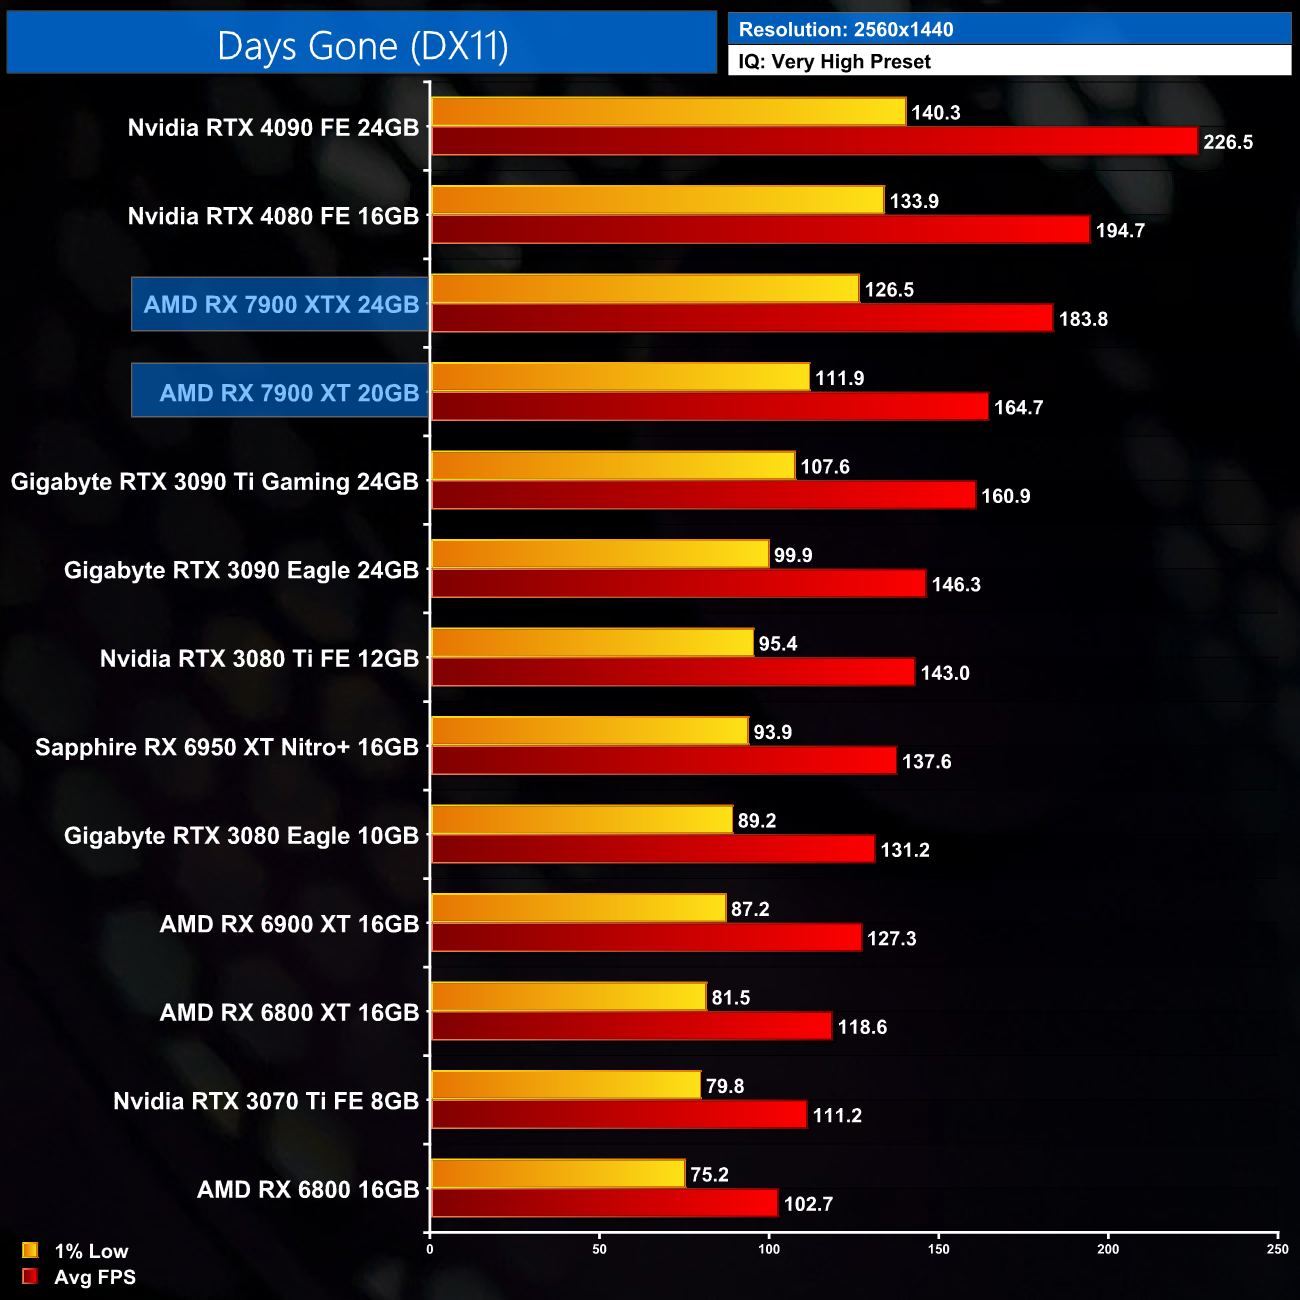
Days Gone isn't quite so impressive for the RX 7900 XT, though at 1440p it's still able to hit 165FPS on average, putting it level with the RTX 3090 Ti.
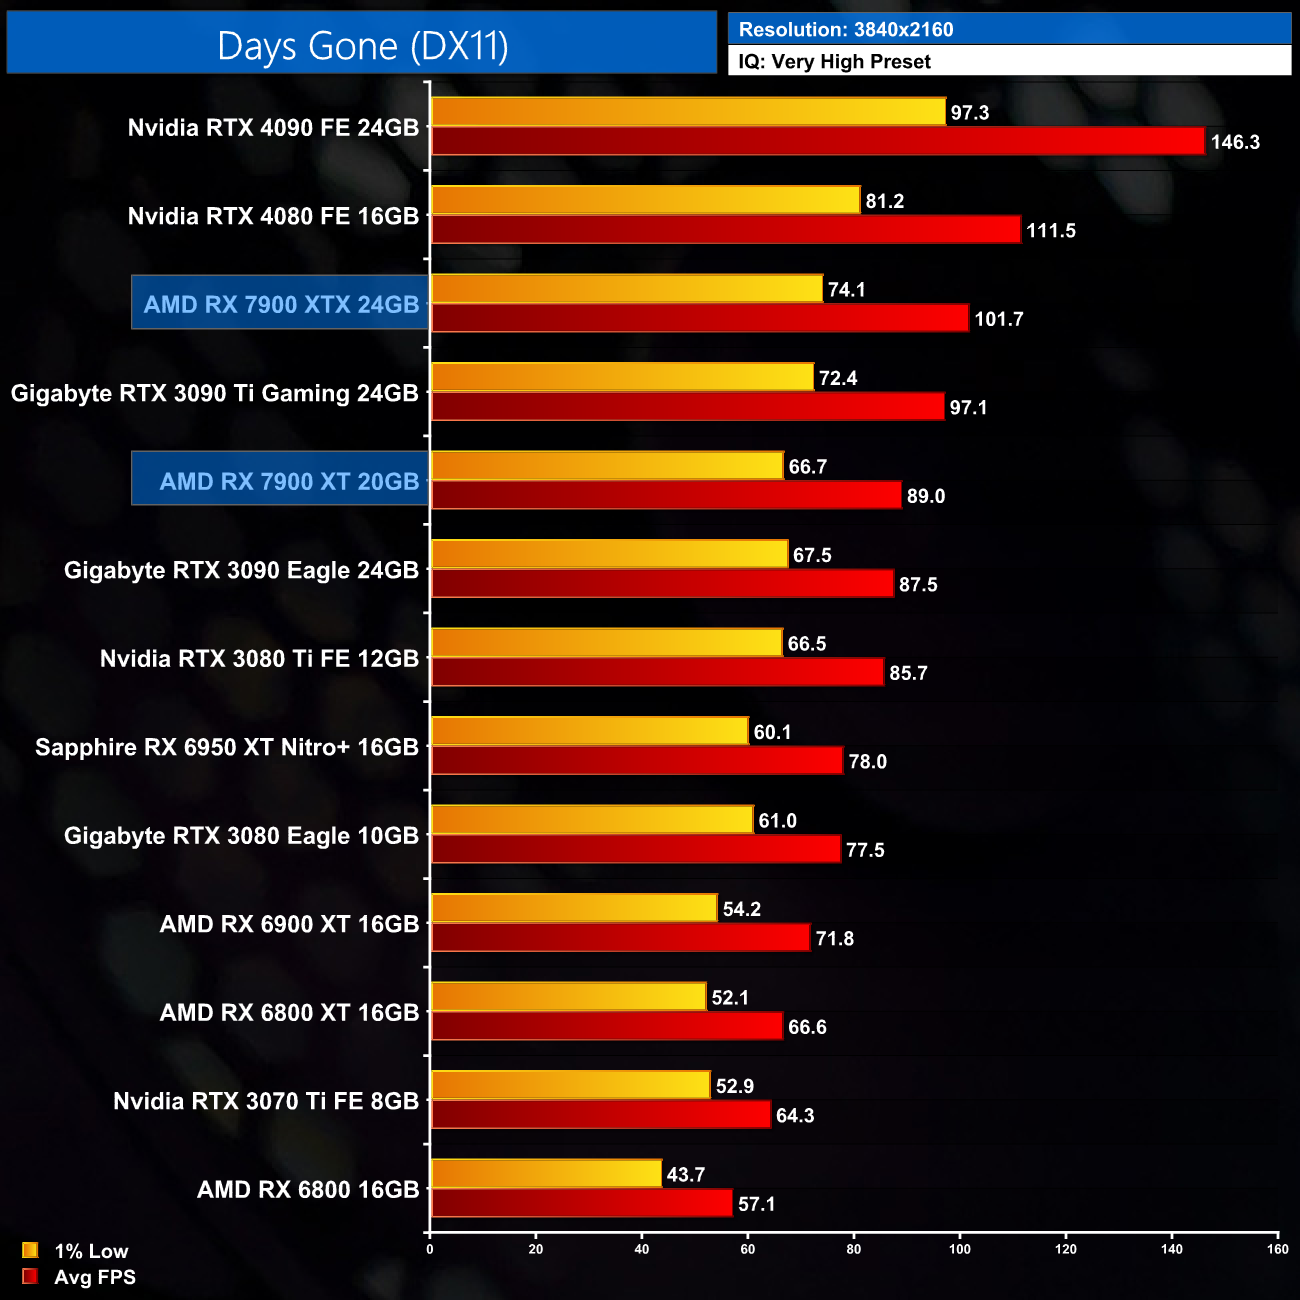
At 4K it does fall behind, coming in 8% slower than the 3090 Ti, while it's 20% behind the RTX 4080. Compared to the 6900 XT, we're looking at a 24% gen-on-gen uplift.
Dying Light 2: Stay Human is a 2022 action role-playing game developed and published by Techland. The sequel to Dying Light (2015), the game was released on February 4, 2022 for Microsoft Windows, PlayStation 4, PlayStation 5, Xbox One, and Xbox Series X/S. (Wikipedia).
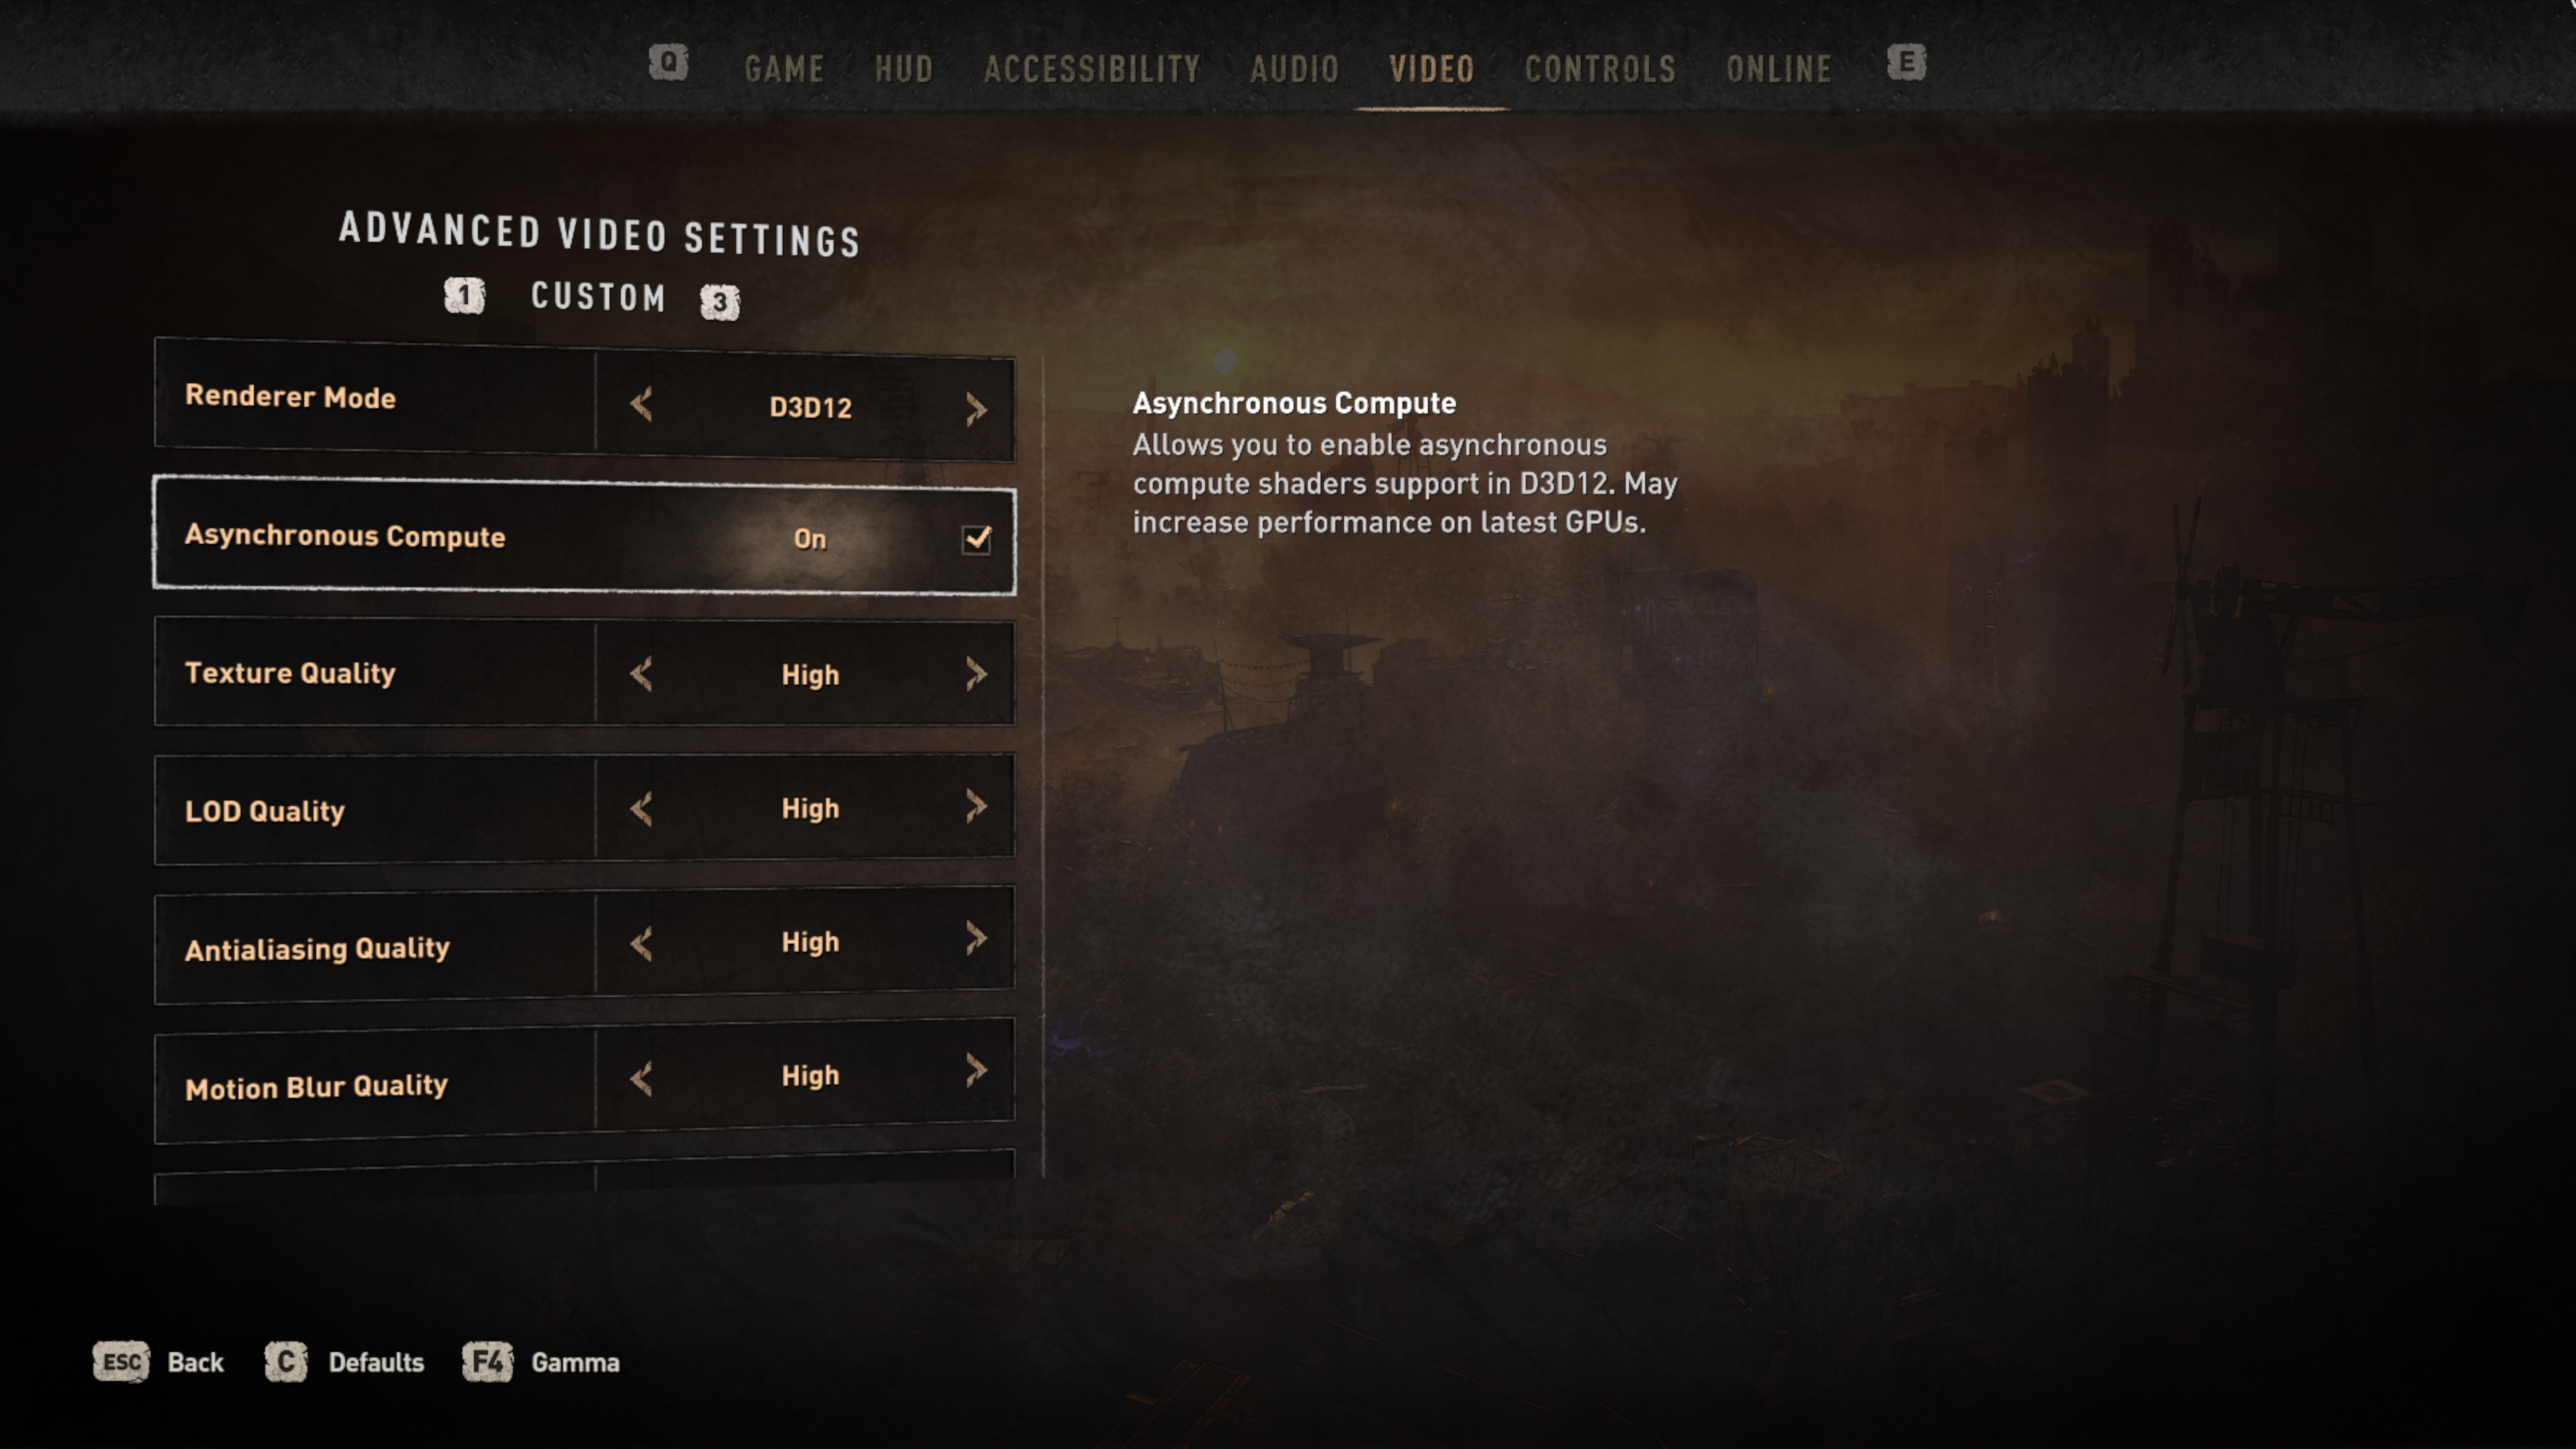
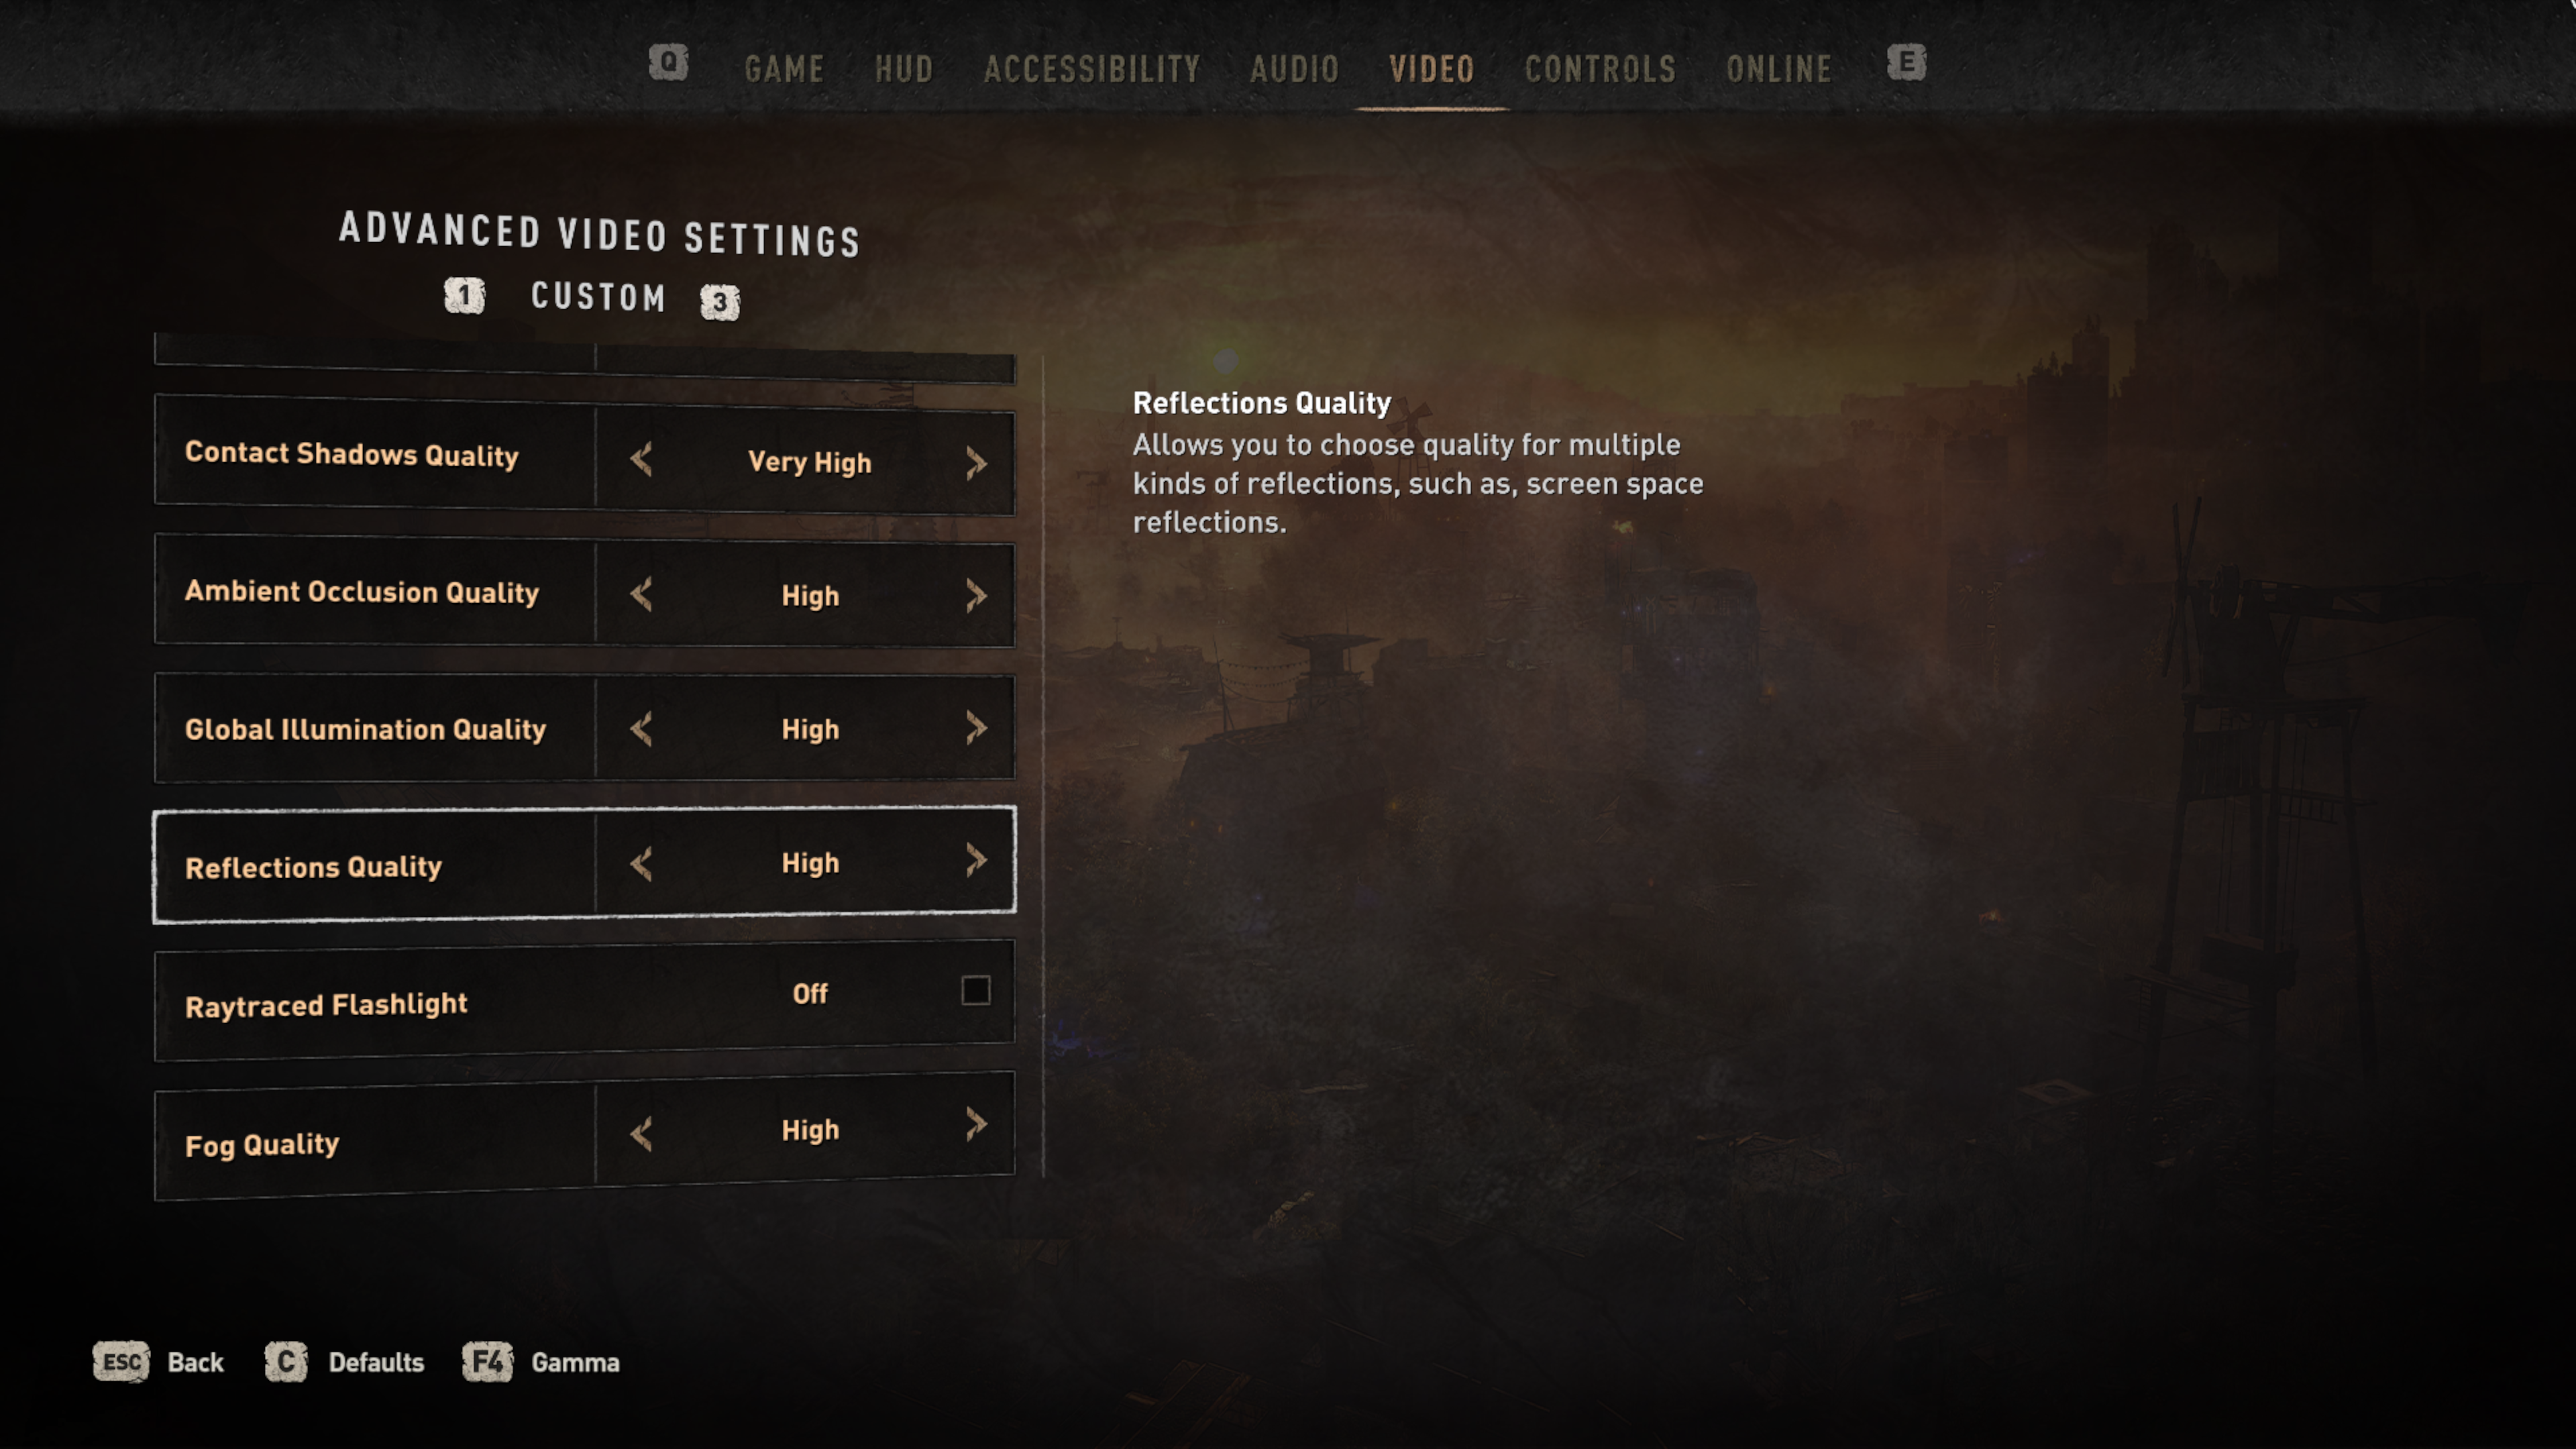
Engine: C-Engine. We test using the High preset, DX12 API.

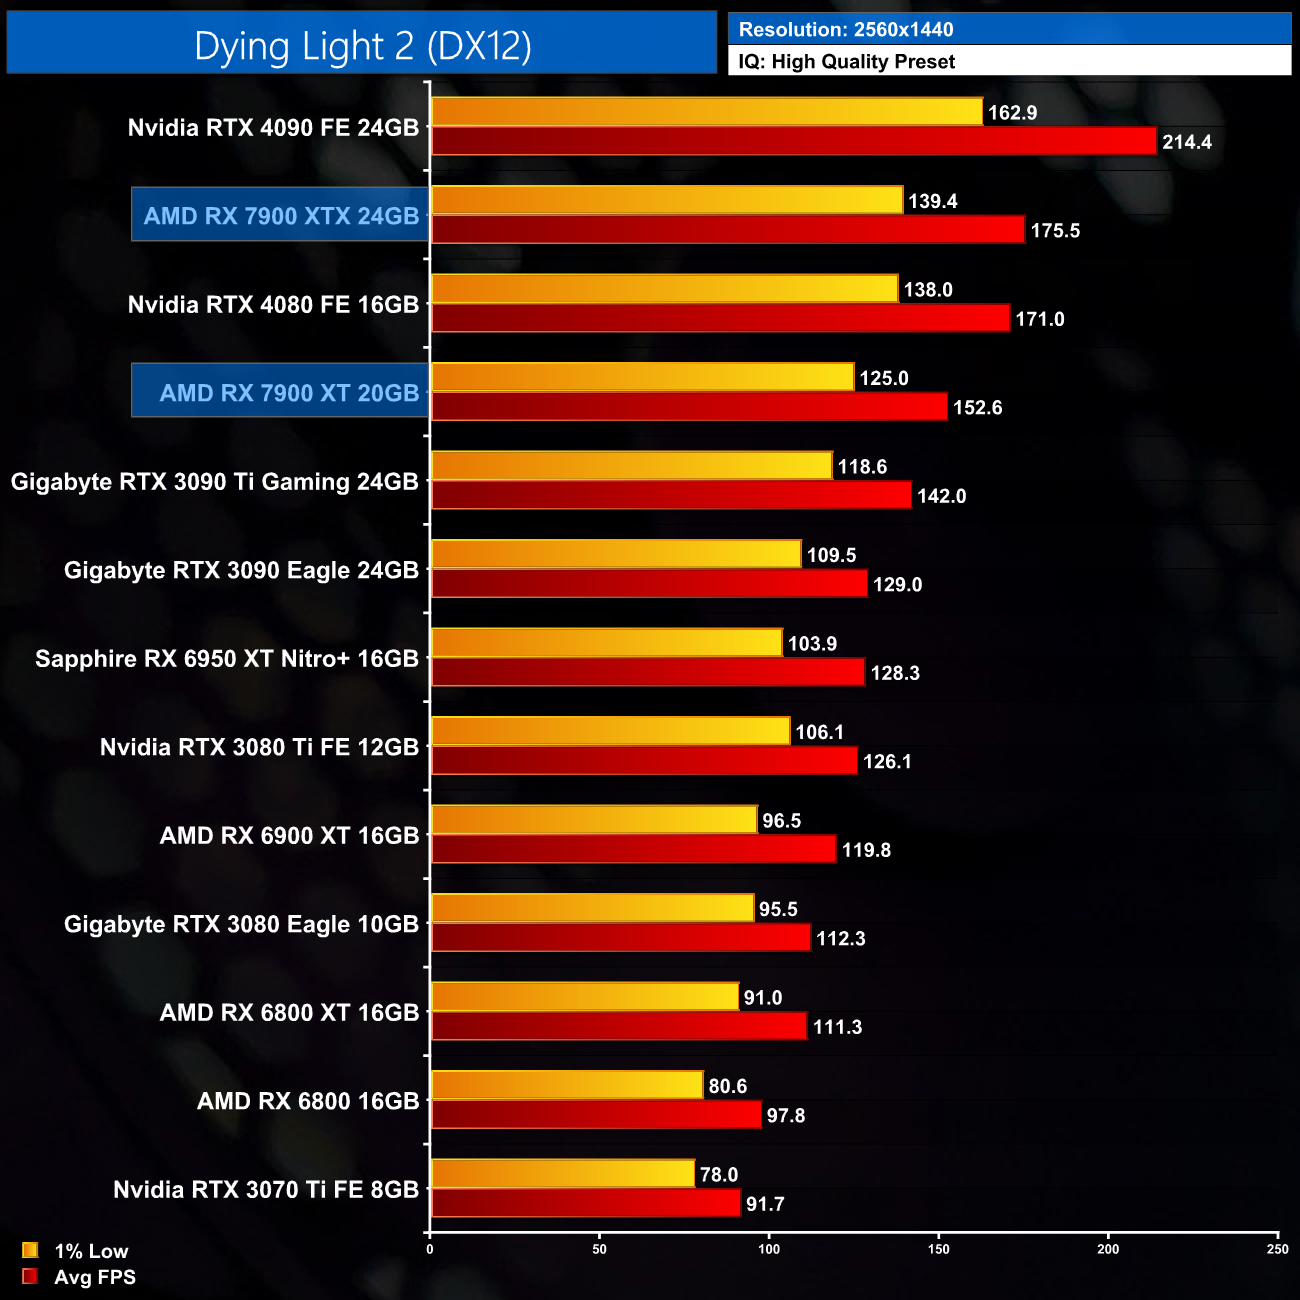
Dying Light 2 is a bit more positive for the 7900 XT, where it is 8% faster than the RTX 3090 Ti at 1440p, delivering over 150FPS on average.
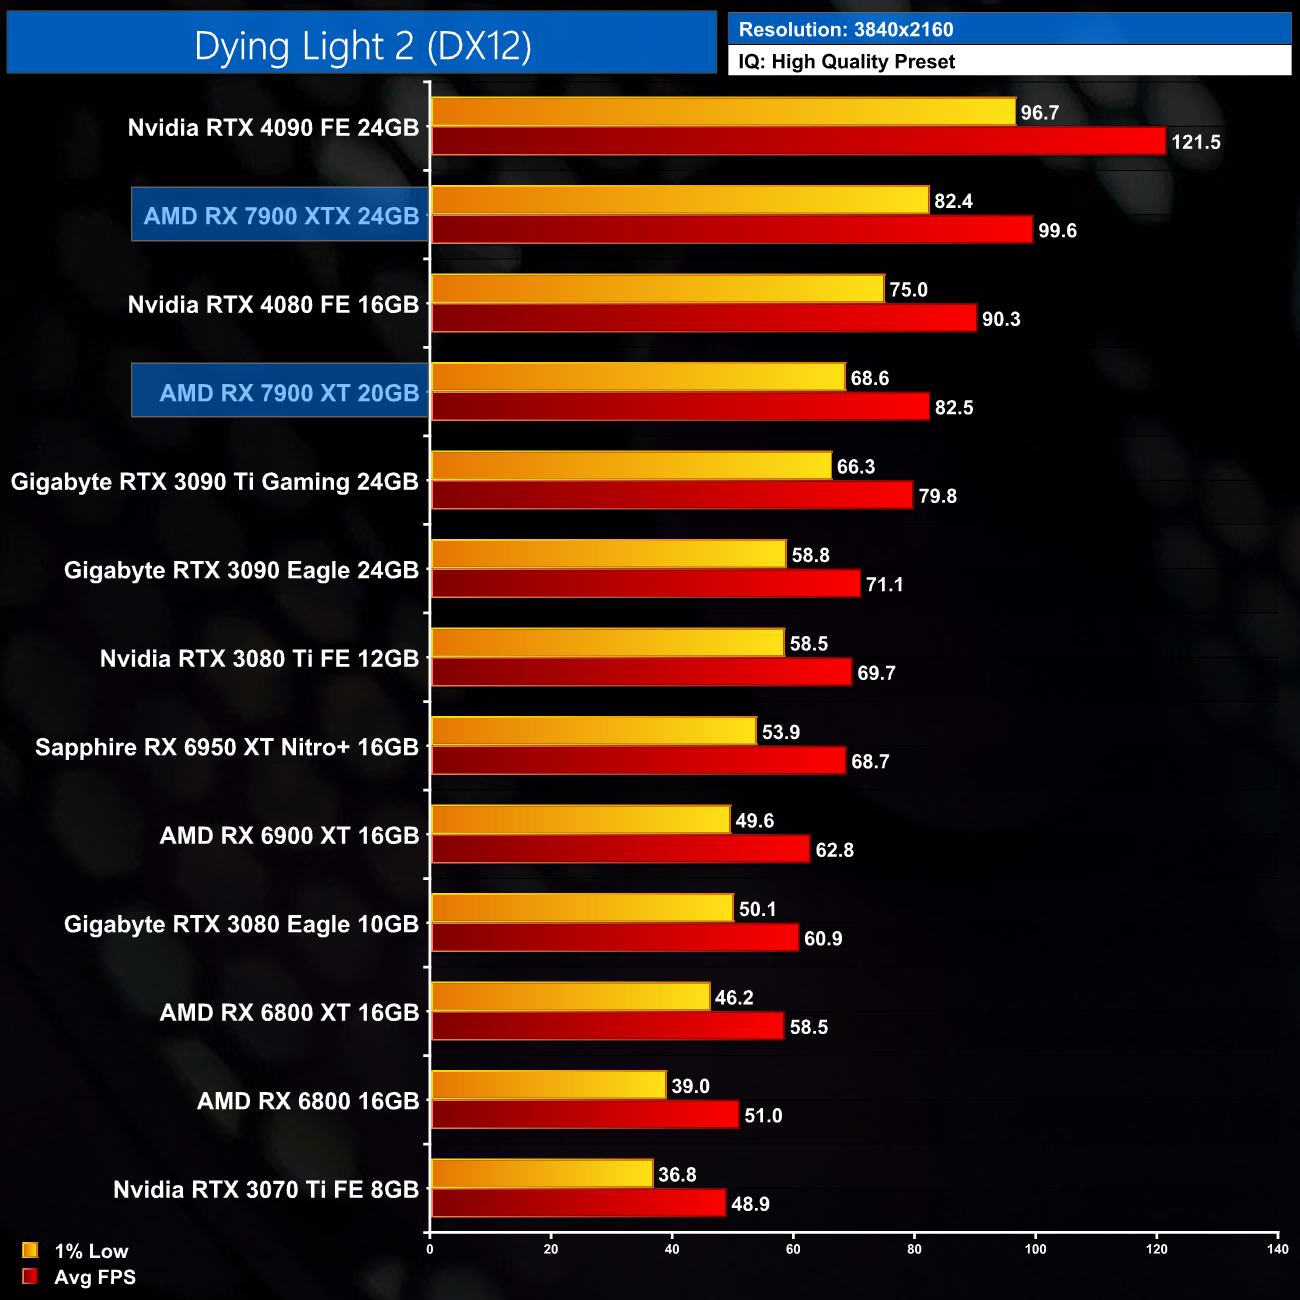
At 4K it does fall off slightly versus the 3090 Ti, as it's now just 3% faster, though it's also just 9% behind the RTX 4080 which is not bad at all.
Far Cry 6 is a 2021 action-adventure first-person shooter game developed by Ubisoft Toronto and published by Ubisoft. It is the sixth main installment in the Far Cry series and the successor to 2018's Far Cry 5. The game was released on October 7, 2021, for Microsoft Windows, PlayStation 4, PlayStation 5, Xbox One, Xbox Series X/S, Stadia, and Amazon Luna. (Wikipedia).
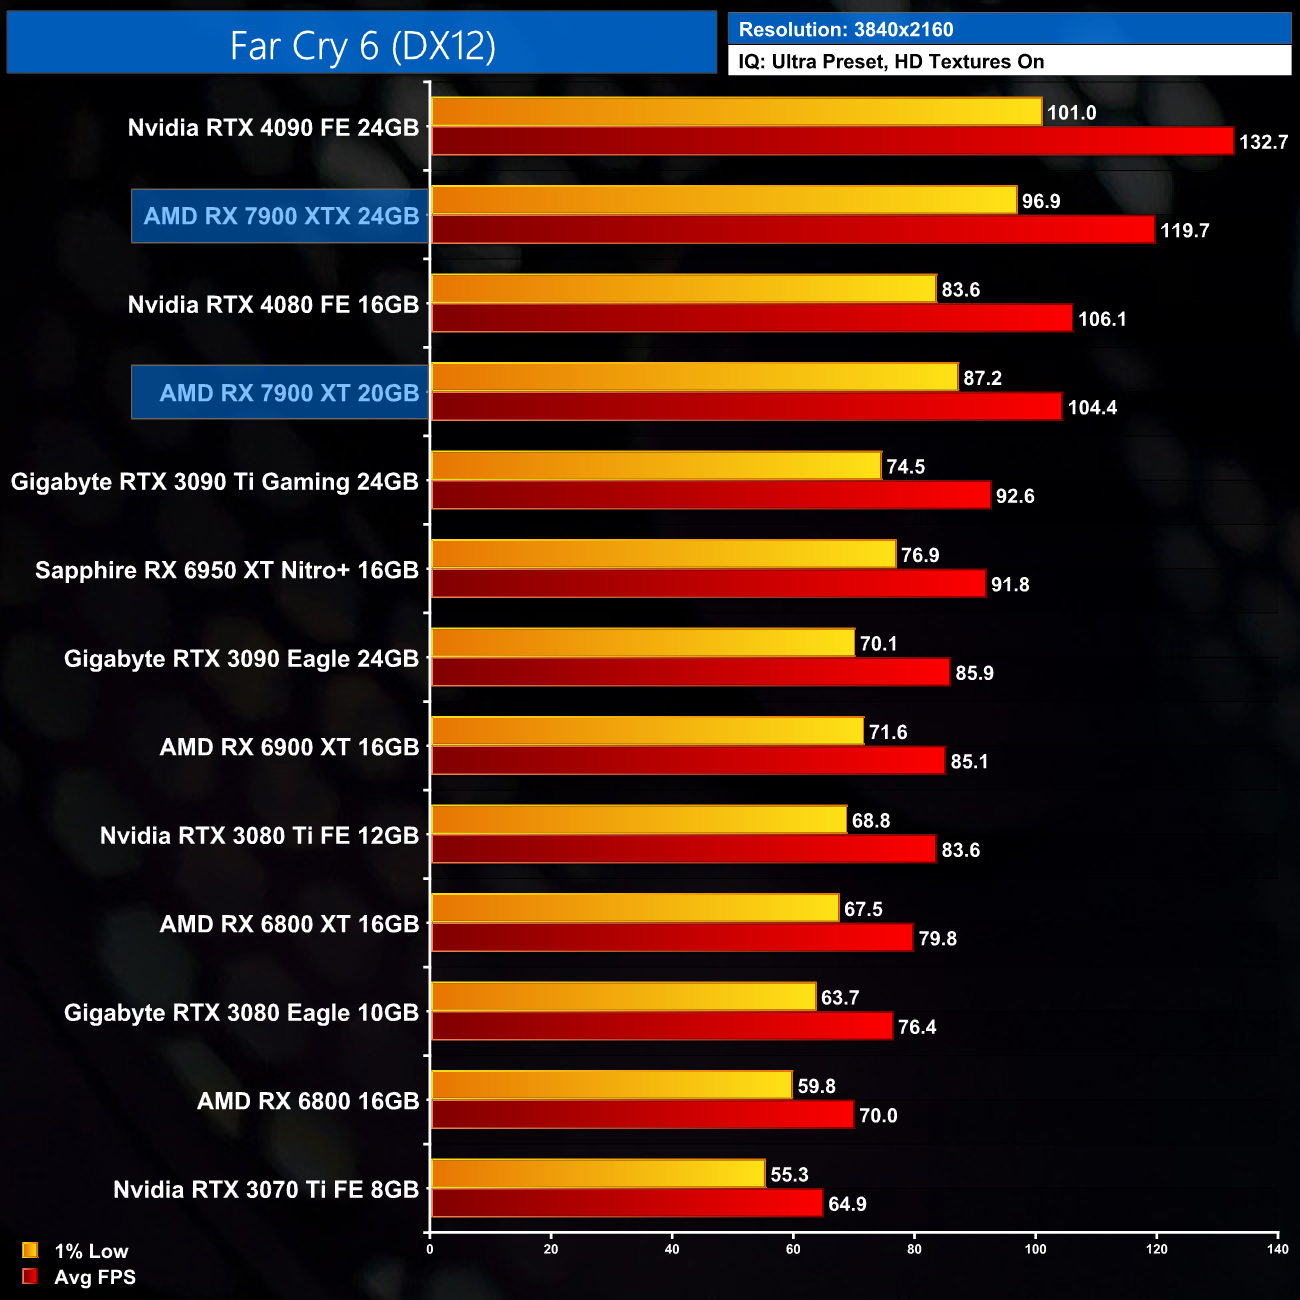
Engine: Dunia Engine. We test using the Ultra preset, HD Textures enabled, DX12 API.
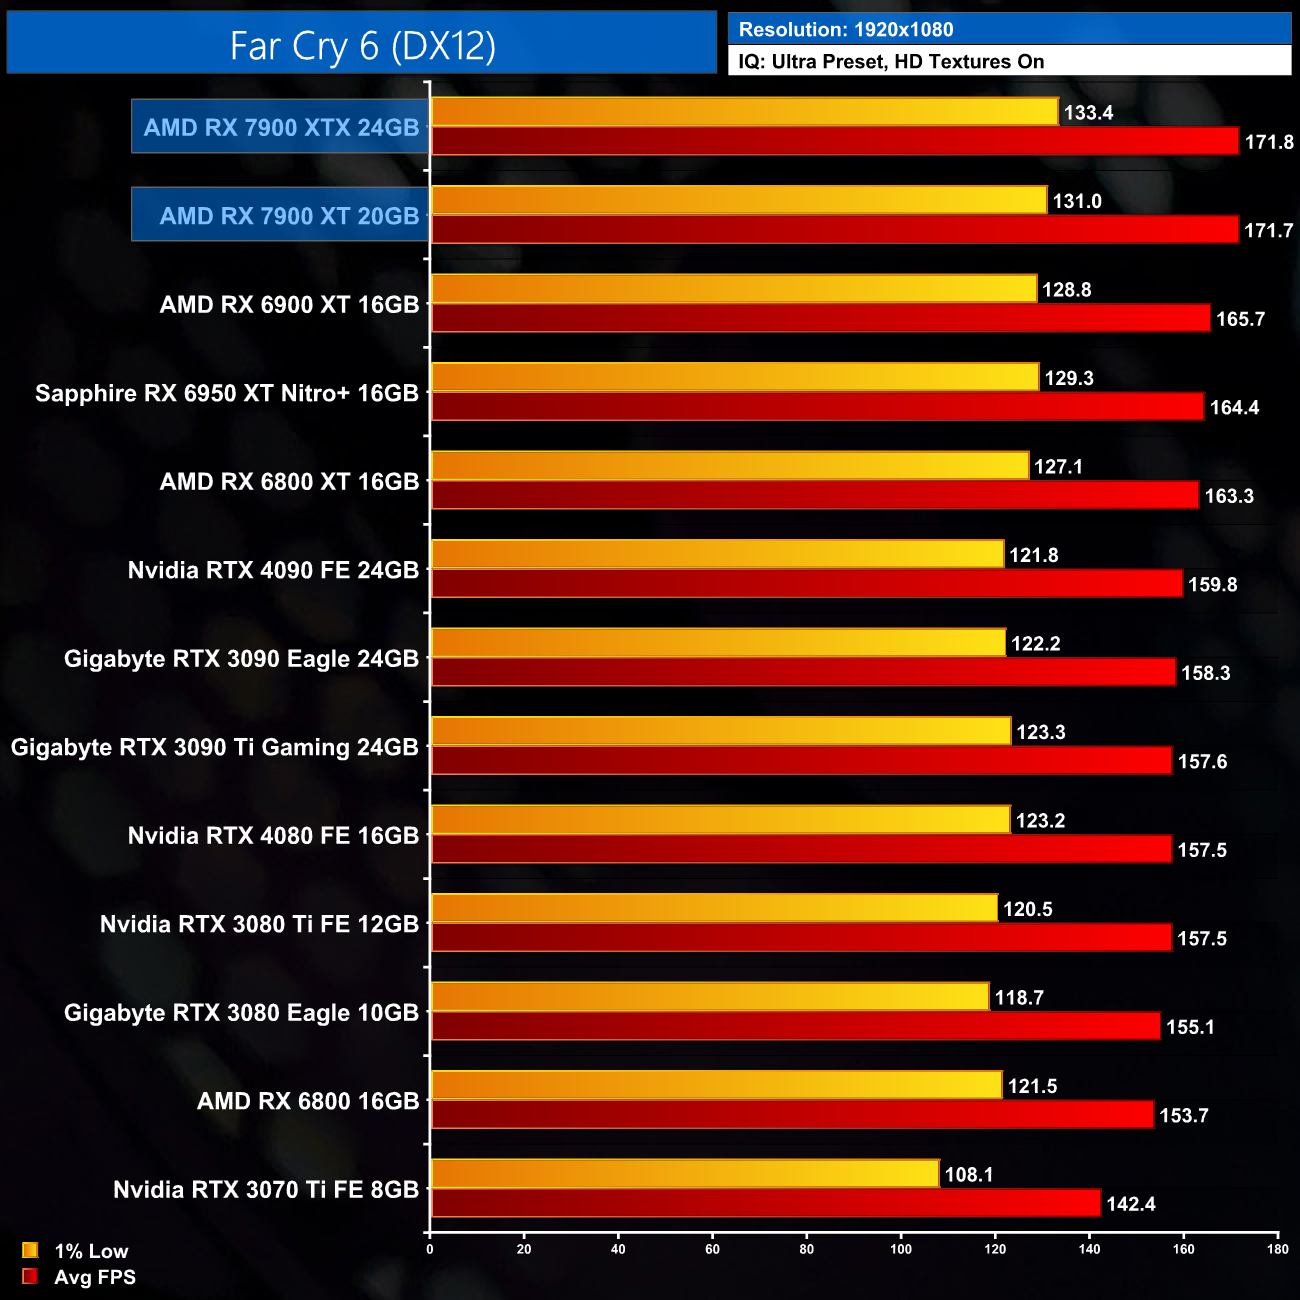
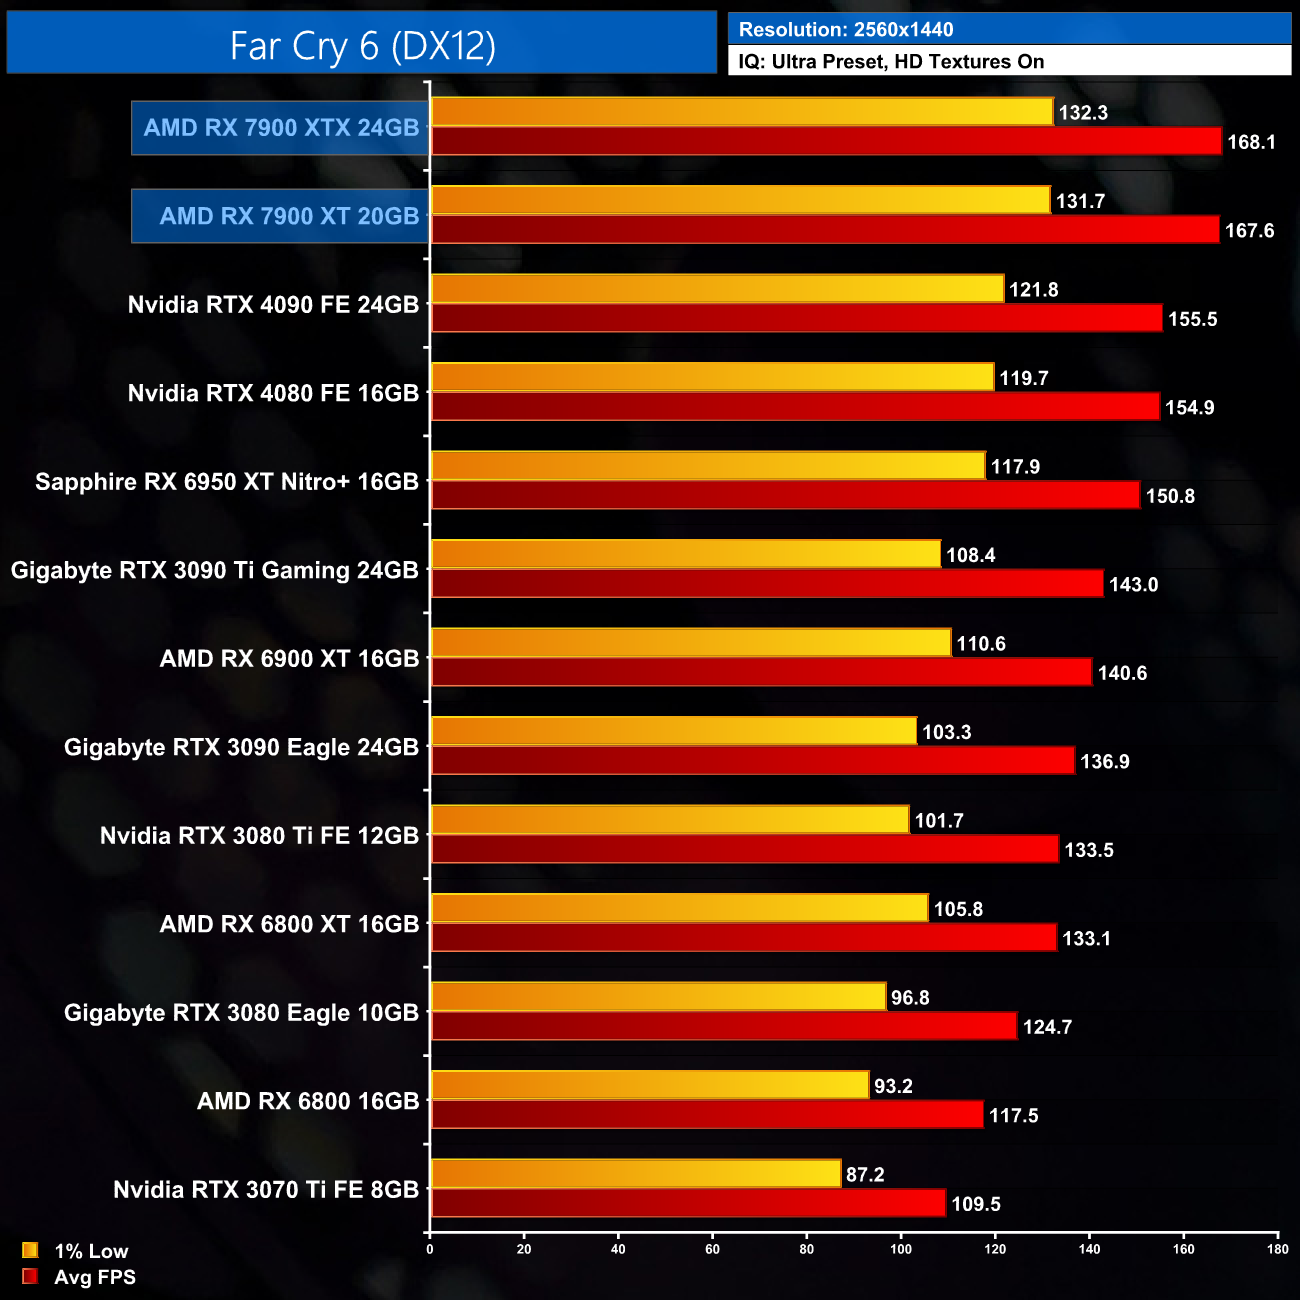
Far Cry 6 is unfortunately CPU bound, even at 1440p, with the 7900 XTX and 7900 XT offering identical performance.
At 4K we do become GPU limited, and the 7900 XT impresses here, offering frame rates that are a match for the more expensive RTX 4080, while it's 13% faster than the 3090 Ti.
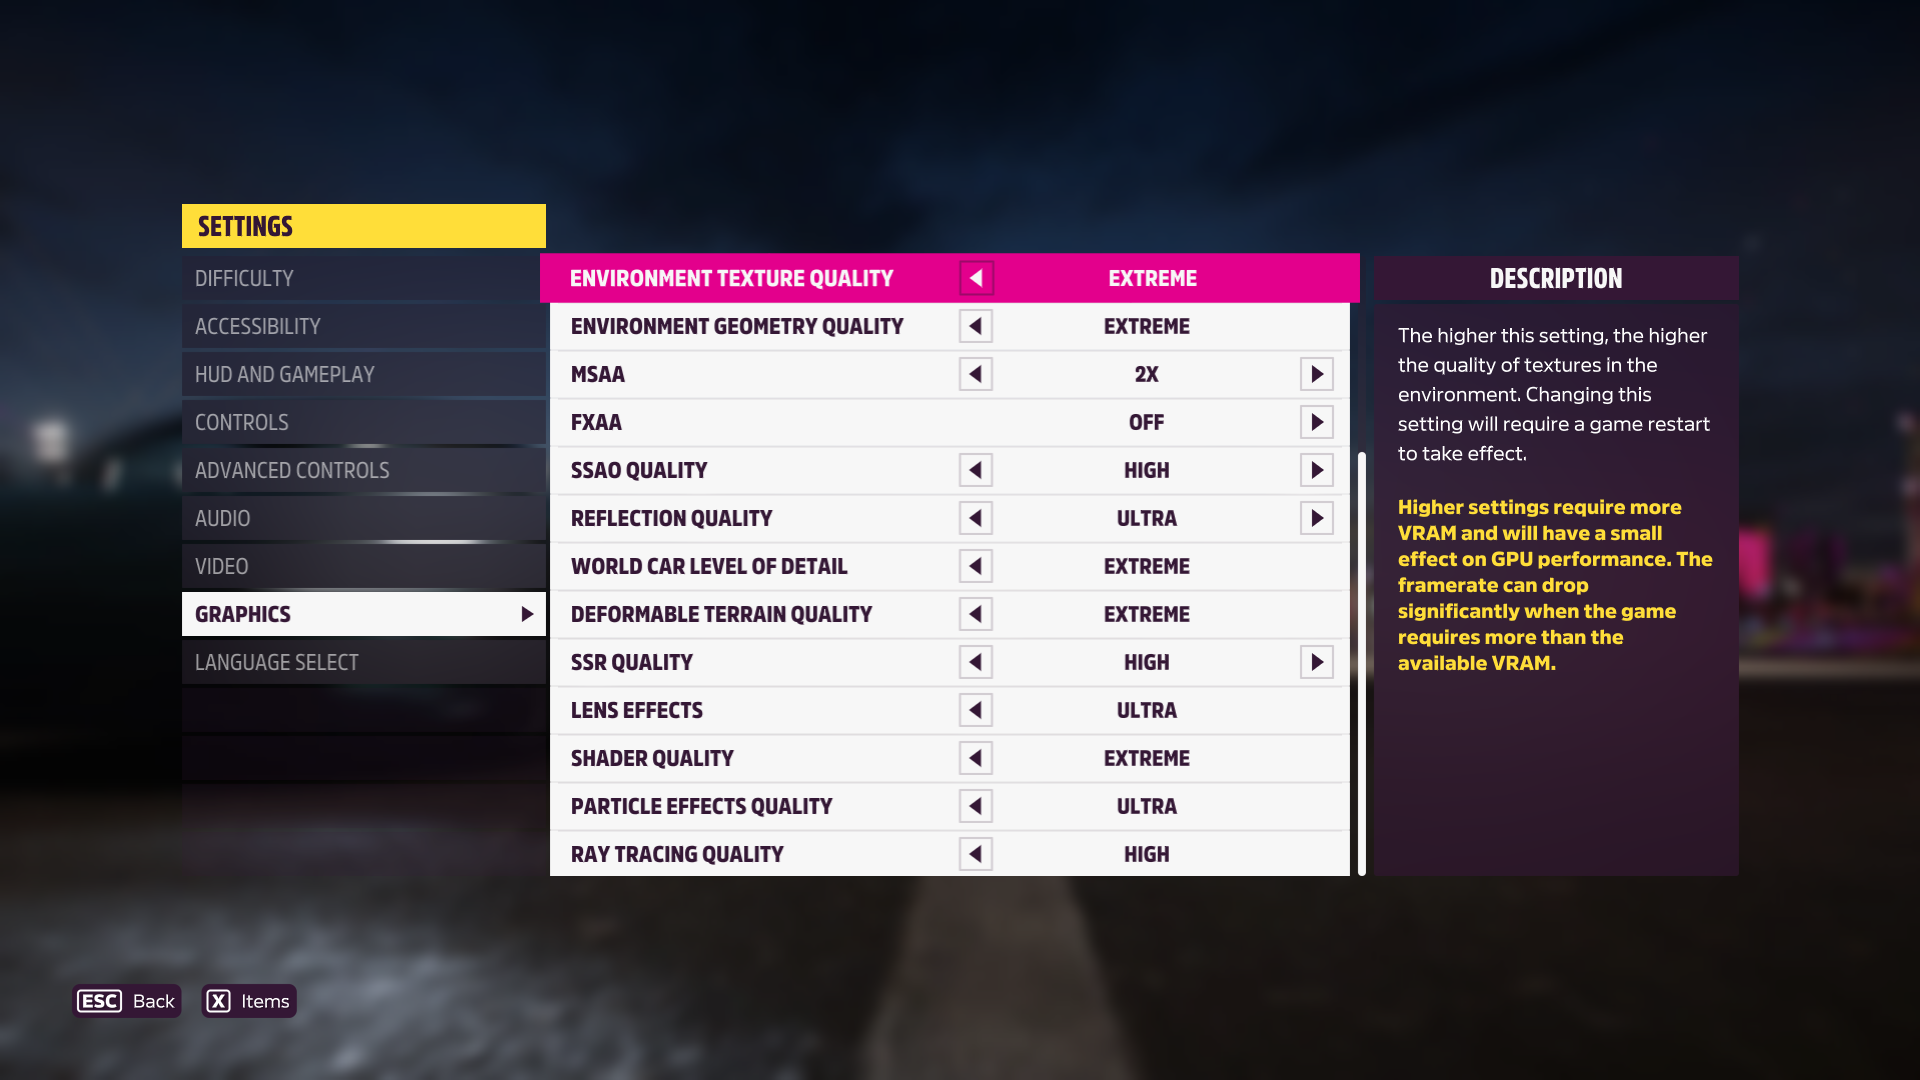
Forza Horizon 5 is a 2021 racing video game developed by Playground Games and published by Xbox Game Studios. The twelfth main instalment of the Forza series, the game is set in a fictionalised representation of Mexico. It was released on 9 November 2021 for Microsoft Windows, Xbox One, and Xbox Series X/S. (Wikipedia).
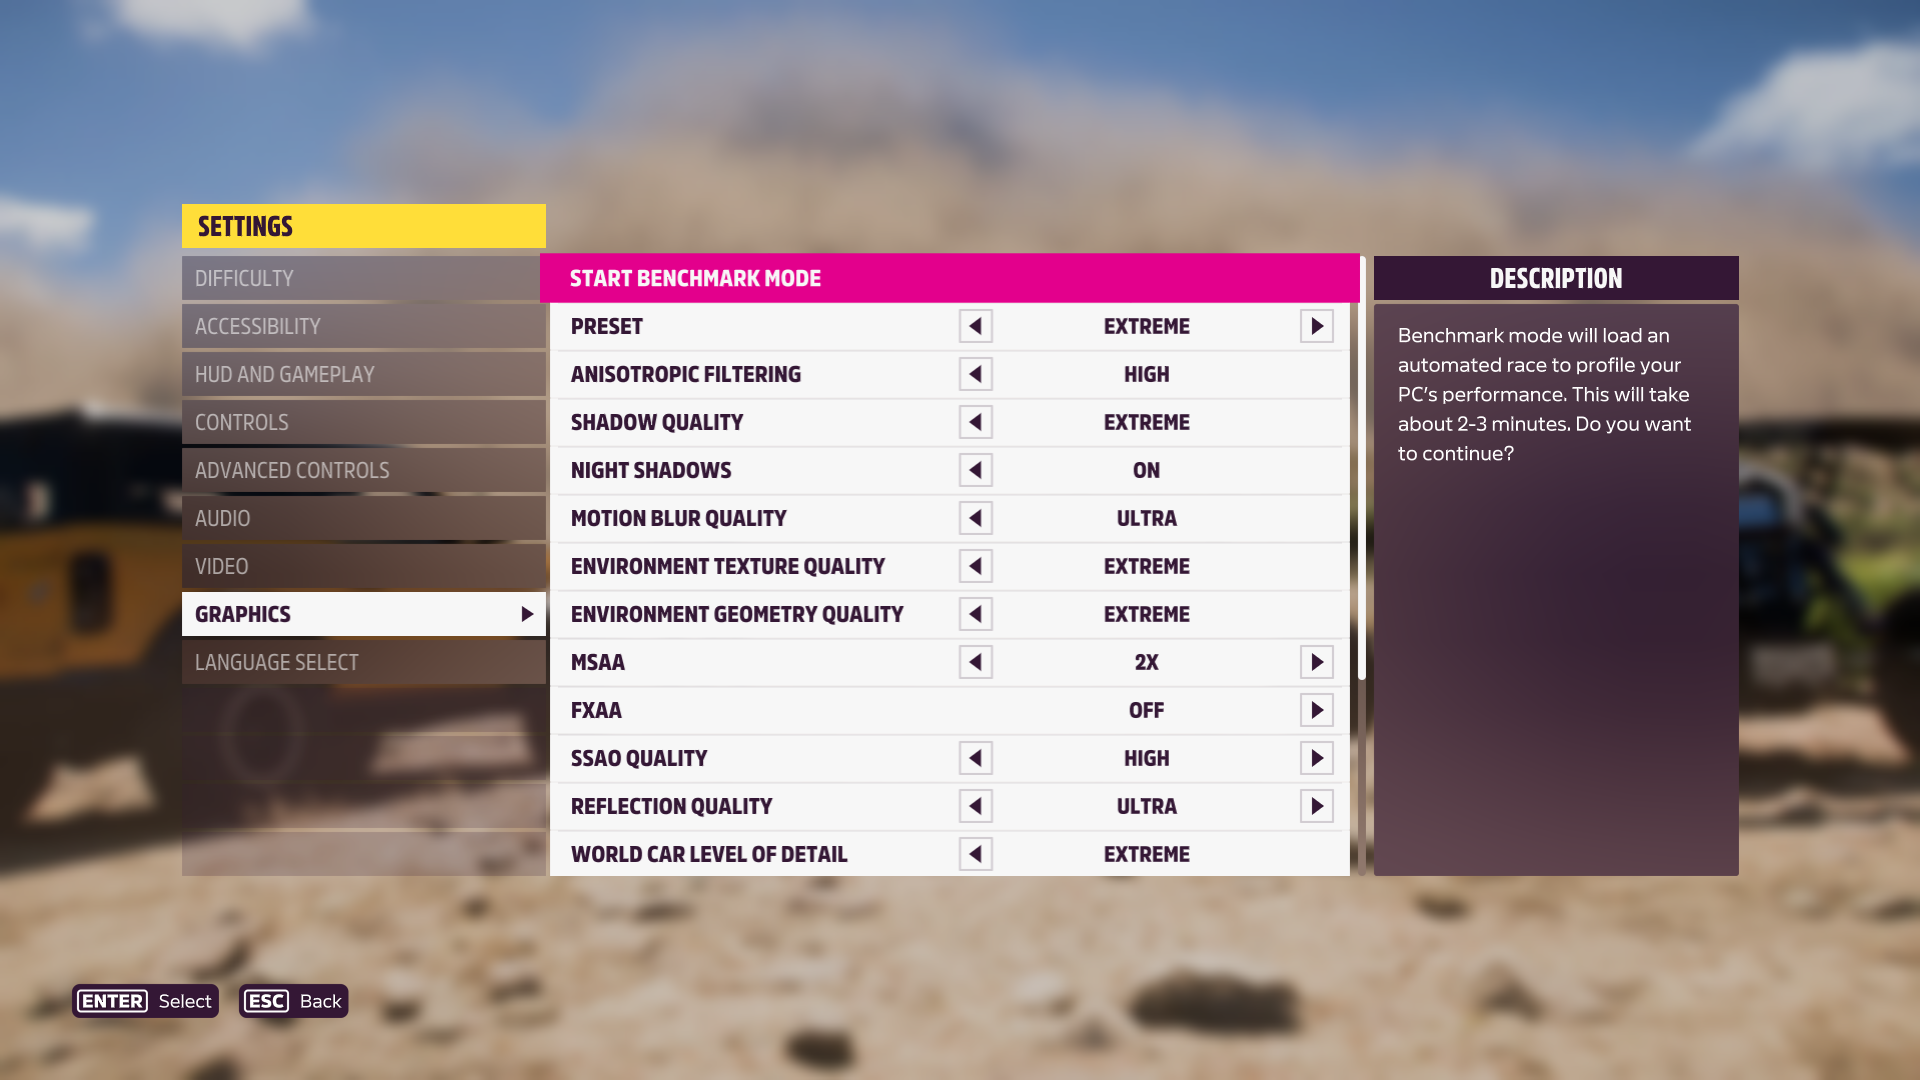
Engine: ForzaTech. We test using the Extreme preset, DX12 API.
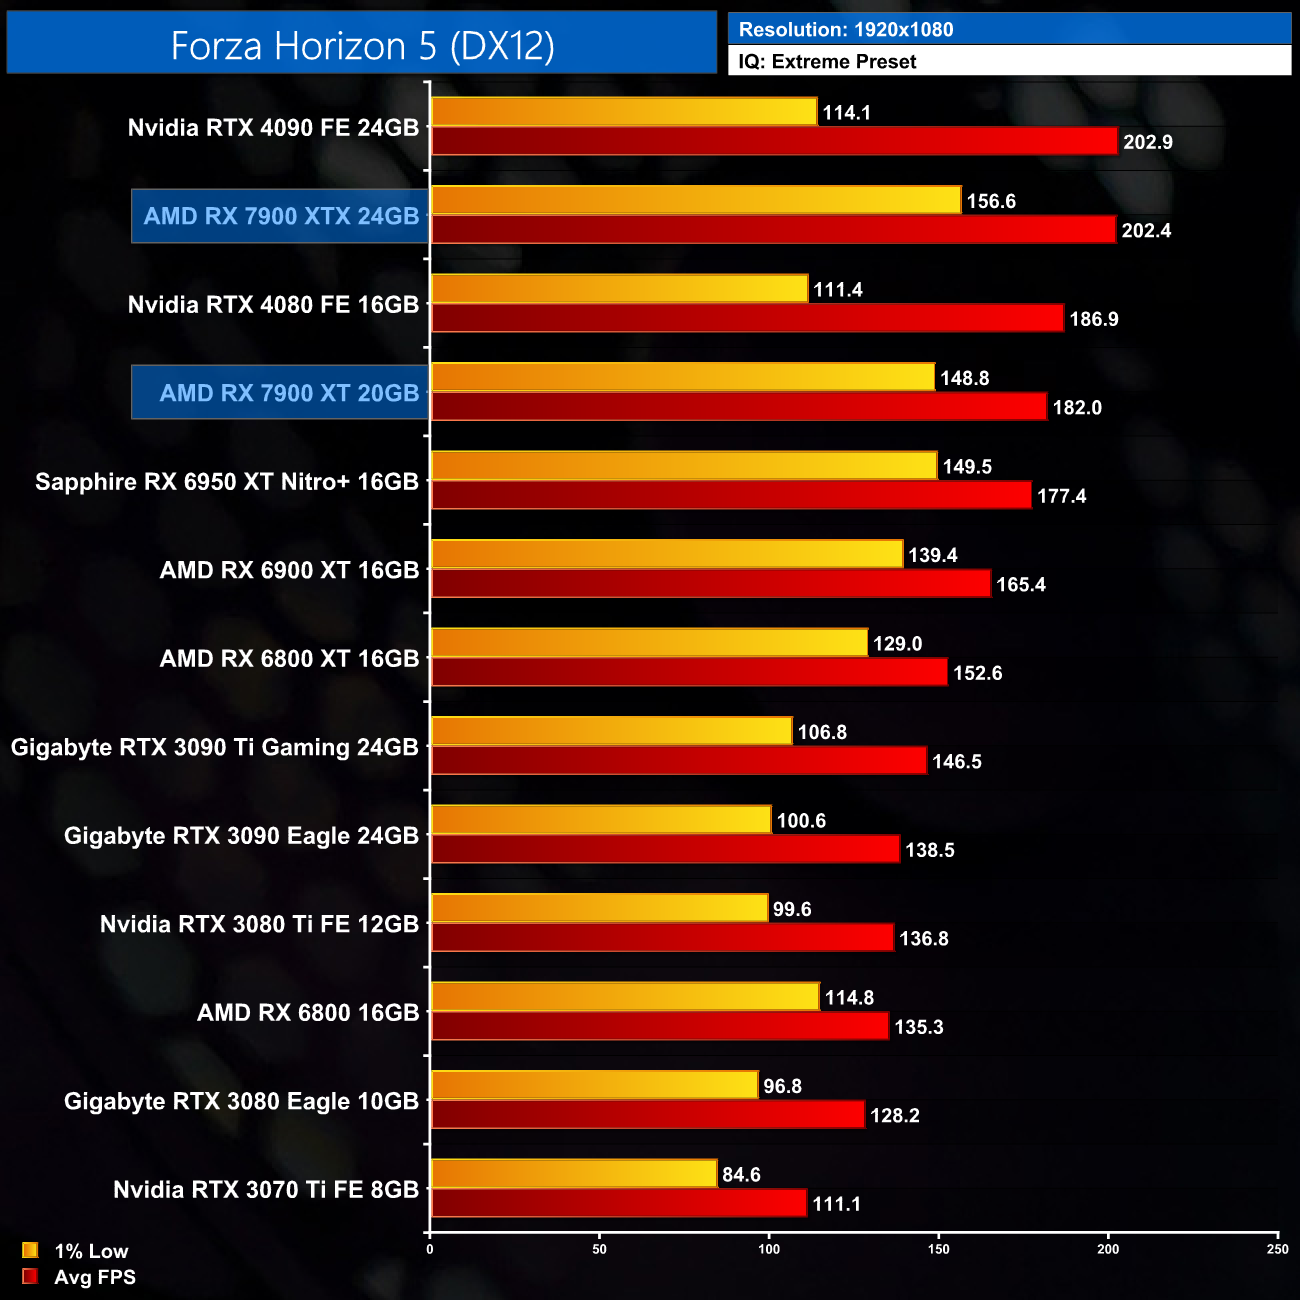
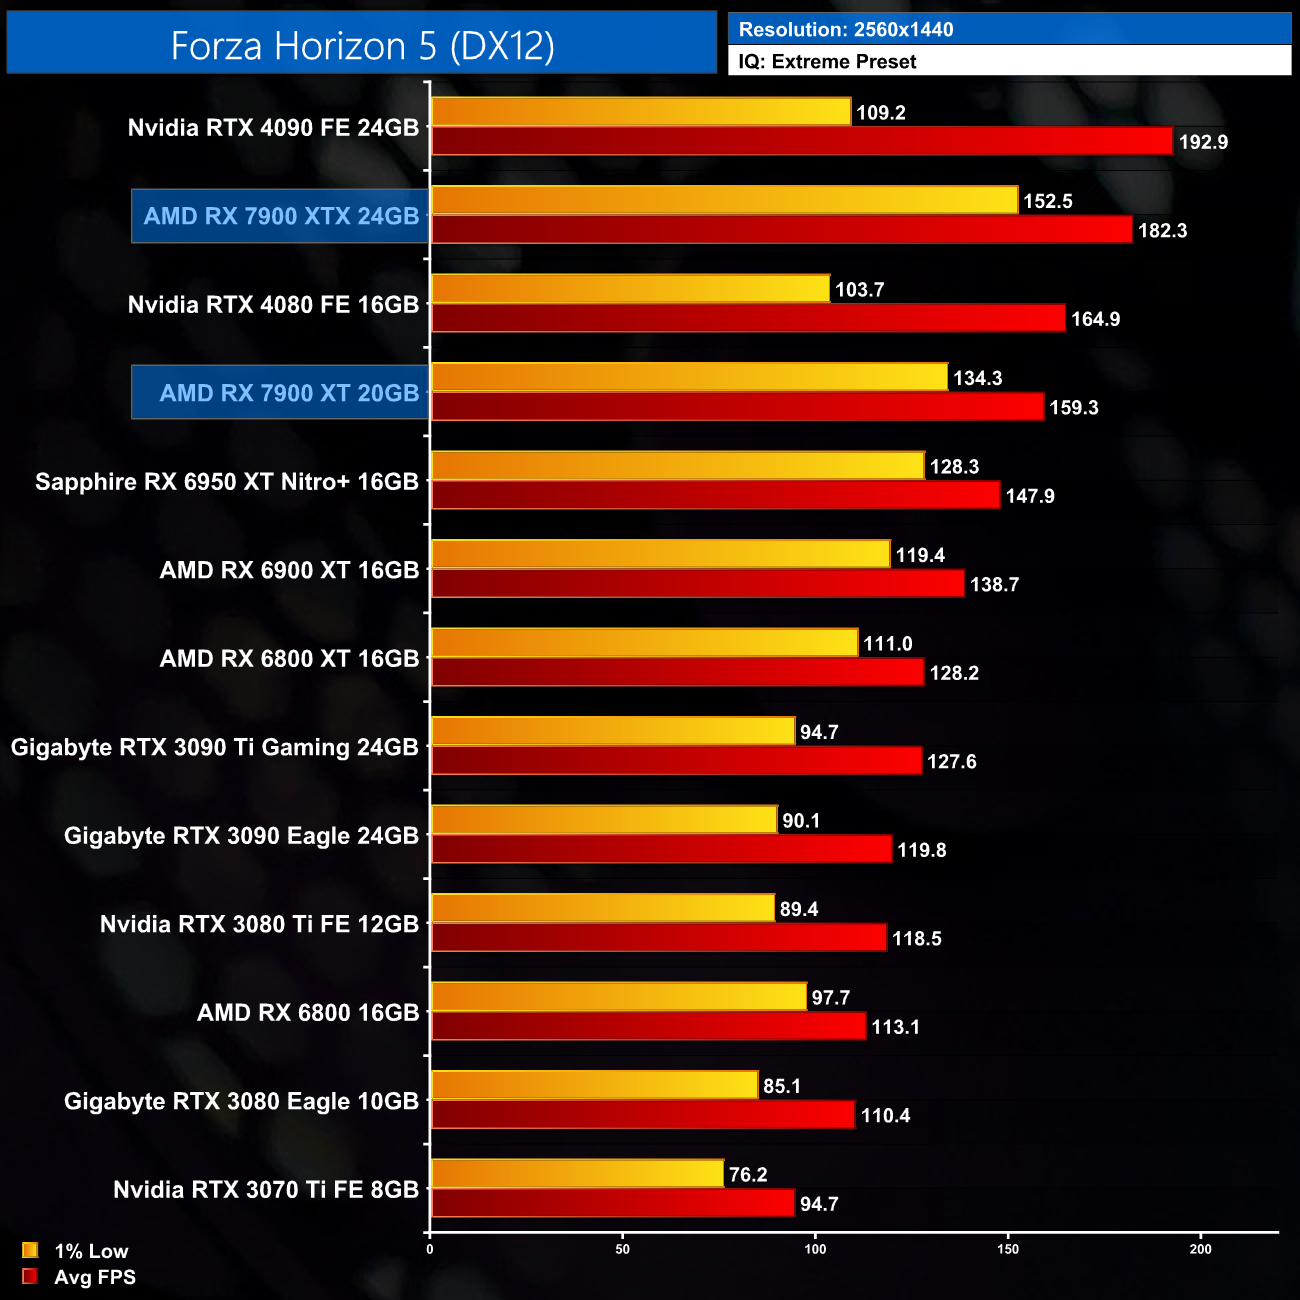
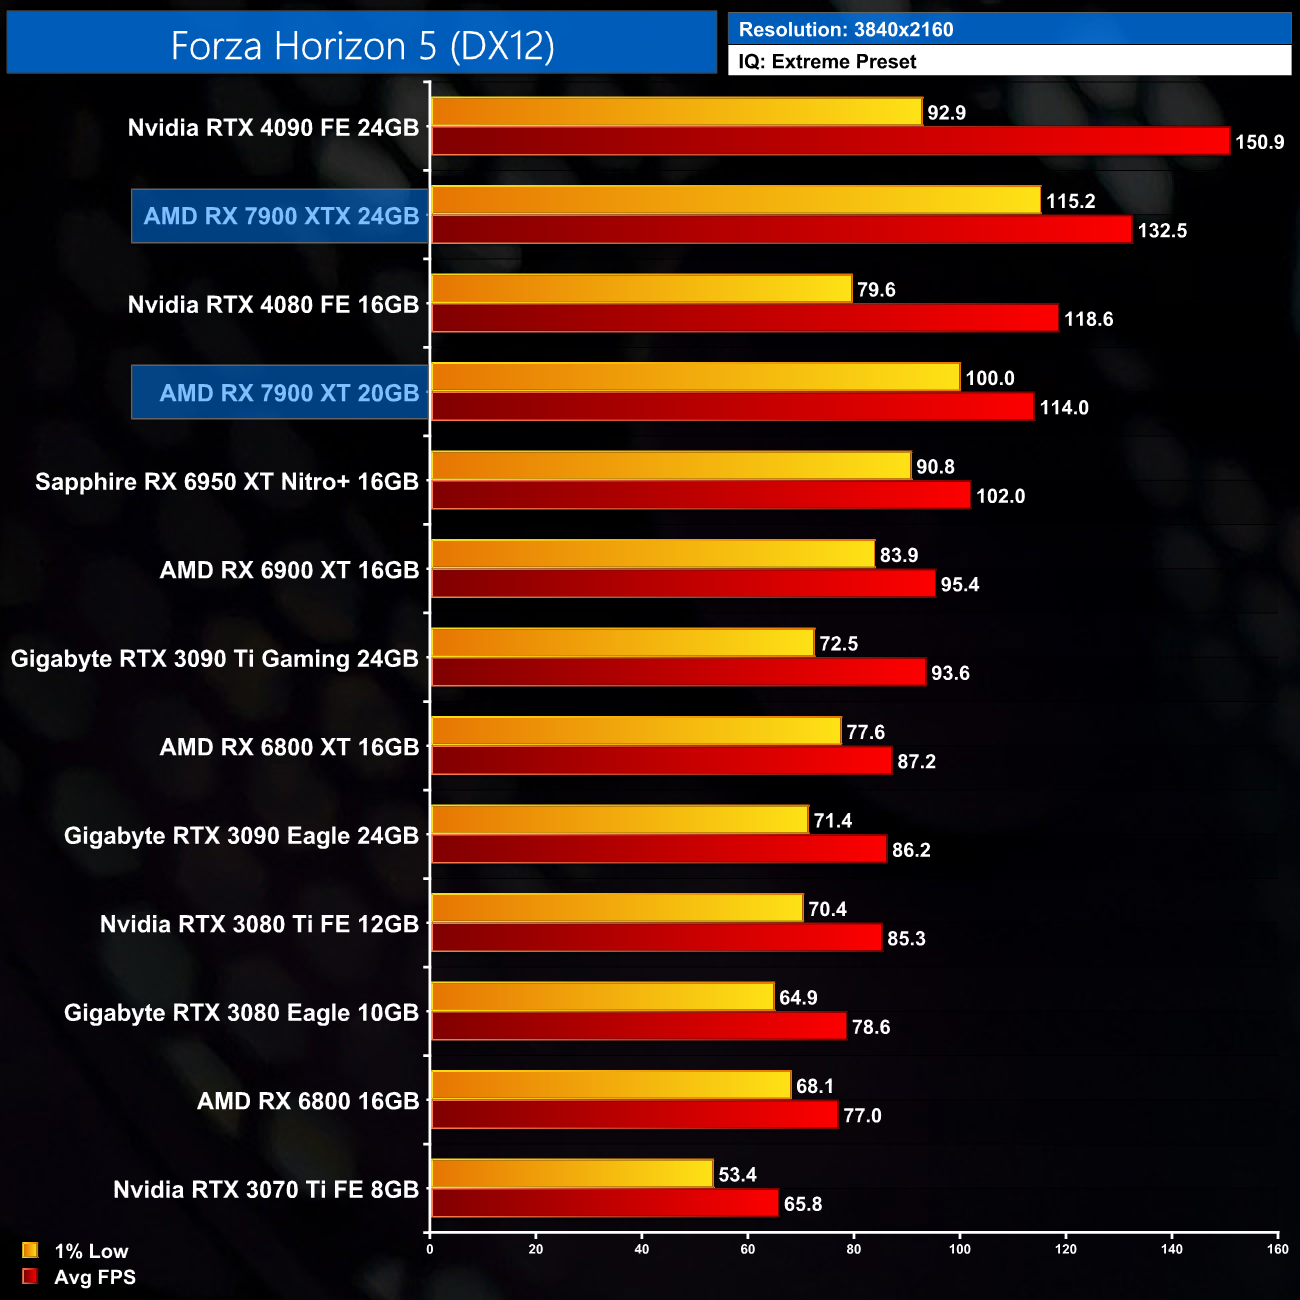
Forza Horizon 5 is currently exhibiting an issue with Nvidia GPUs and their 1% lows- something we are told the company is actively investigating, so we'd hope for a fix soon. That said, at 1440p the 7900 XT delivers 159FPS on average, putting it roughly level with the RTX 4080, while at 4K it's only marginally behind once again. However, the gains versus the 6900 XT aren't huge – with just a 20% increase gen-on-gen at 4K.
God of War is an action-adventure game developed by Santa Monica Studio and published by Sony Interactive Entertainment (SIE). It was released worldwide on April 20, 2018, for the PlayStation 4 with a Microsoft Windows version released on January 14, 2022. (Wikipedia).
Engine: Sony Santa Monica Proprietary. We test using the Ultra preset, DX11 API.
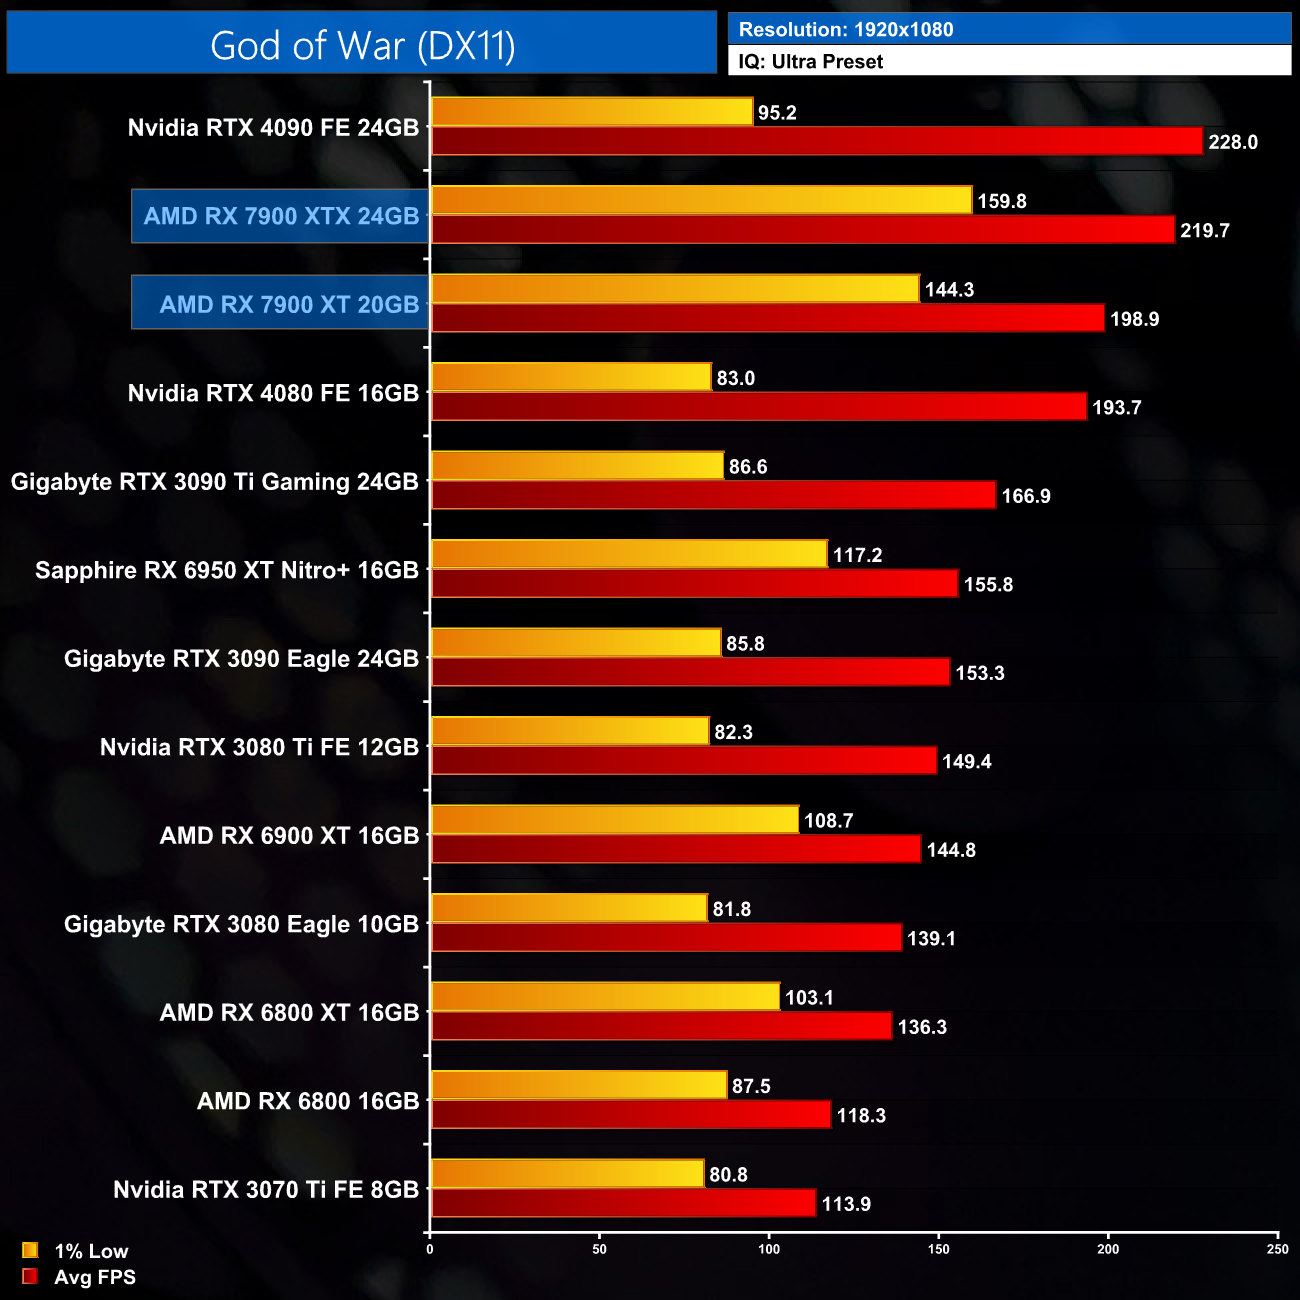
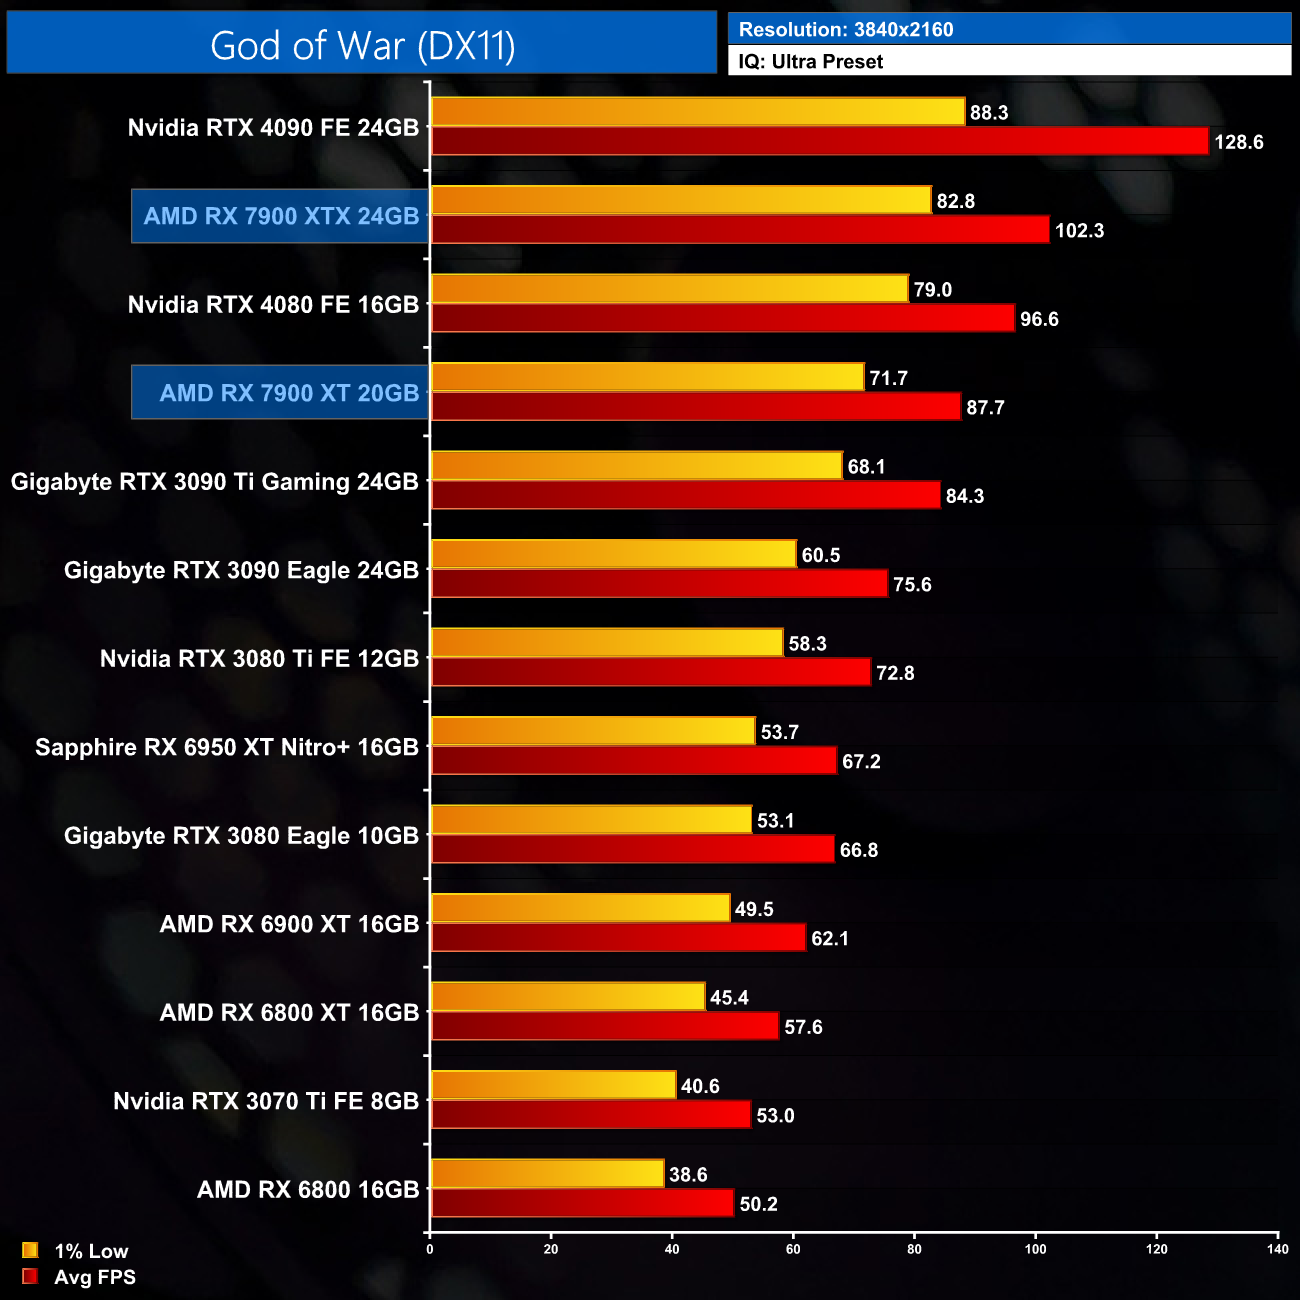
Next is God of War, where the 7900 XT delivers over 150FPS at 1440p – it's basically a match for the RTX 4080, but with substantially better 1% lows.
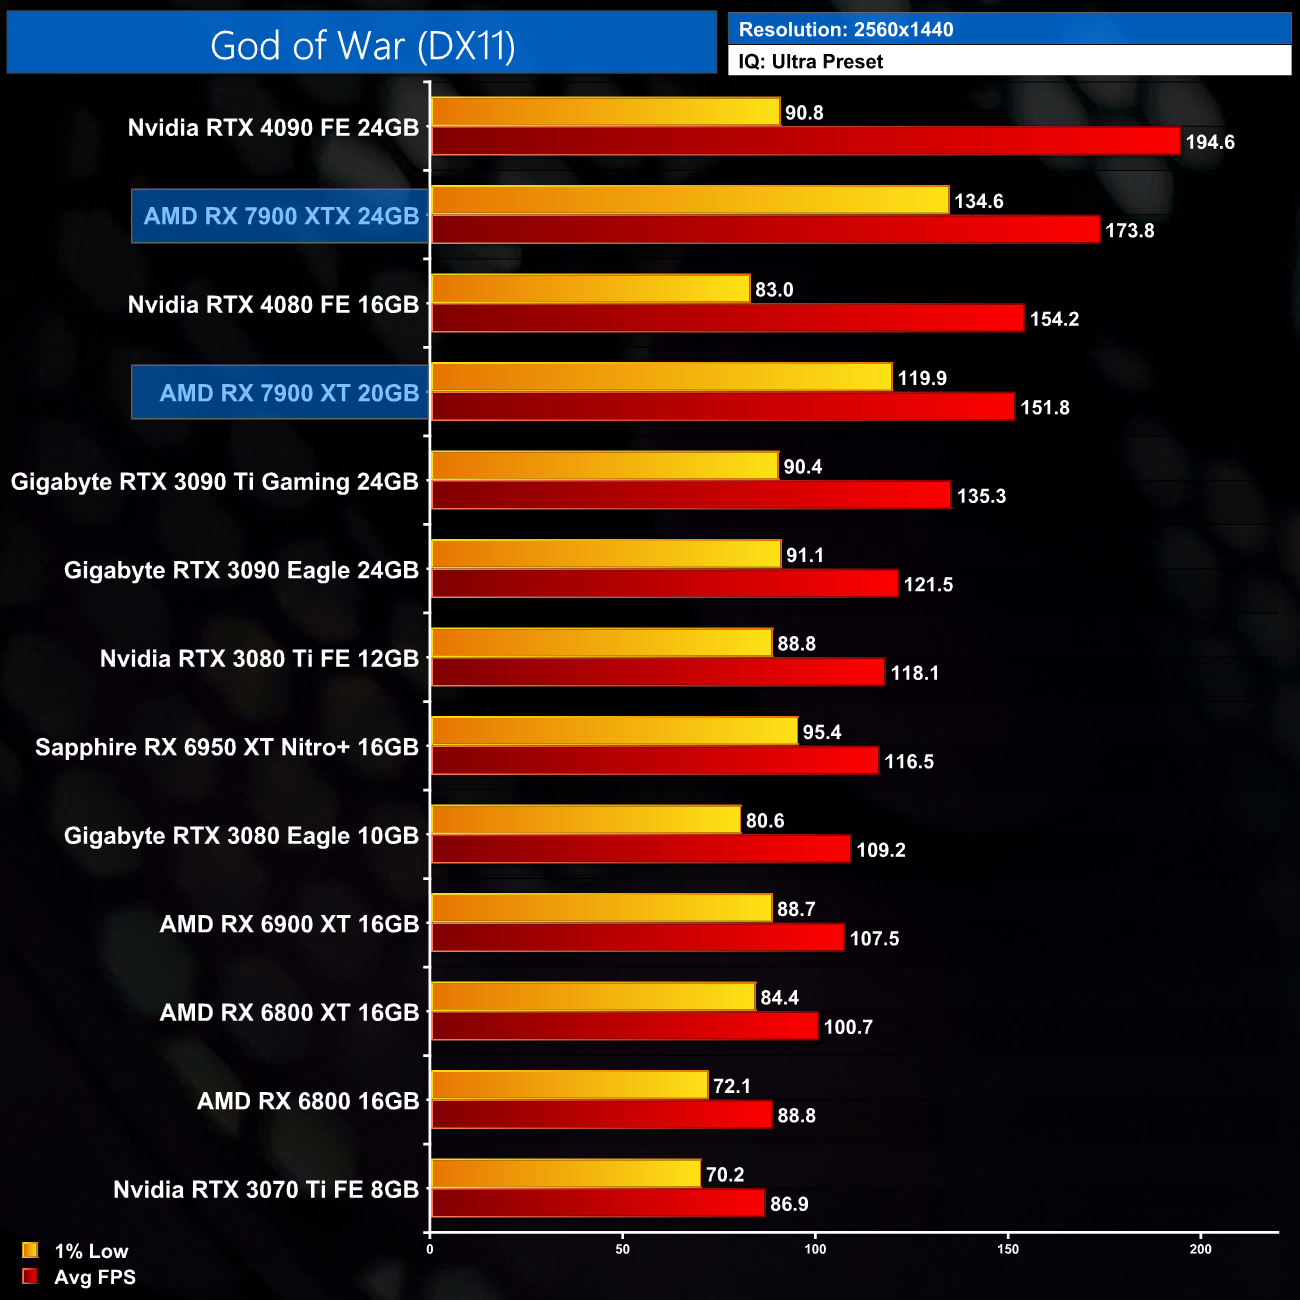
The 40-series pulls away at 4K however, and now the 7900 XT is just 4% faster than the 3090 Ti, when it was 12% faster at 1440p.
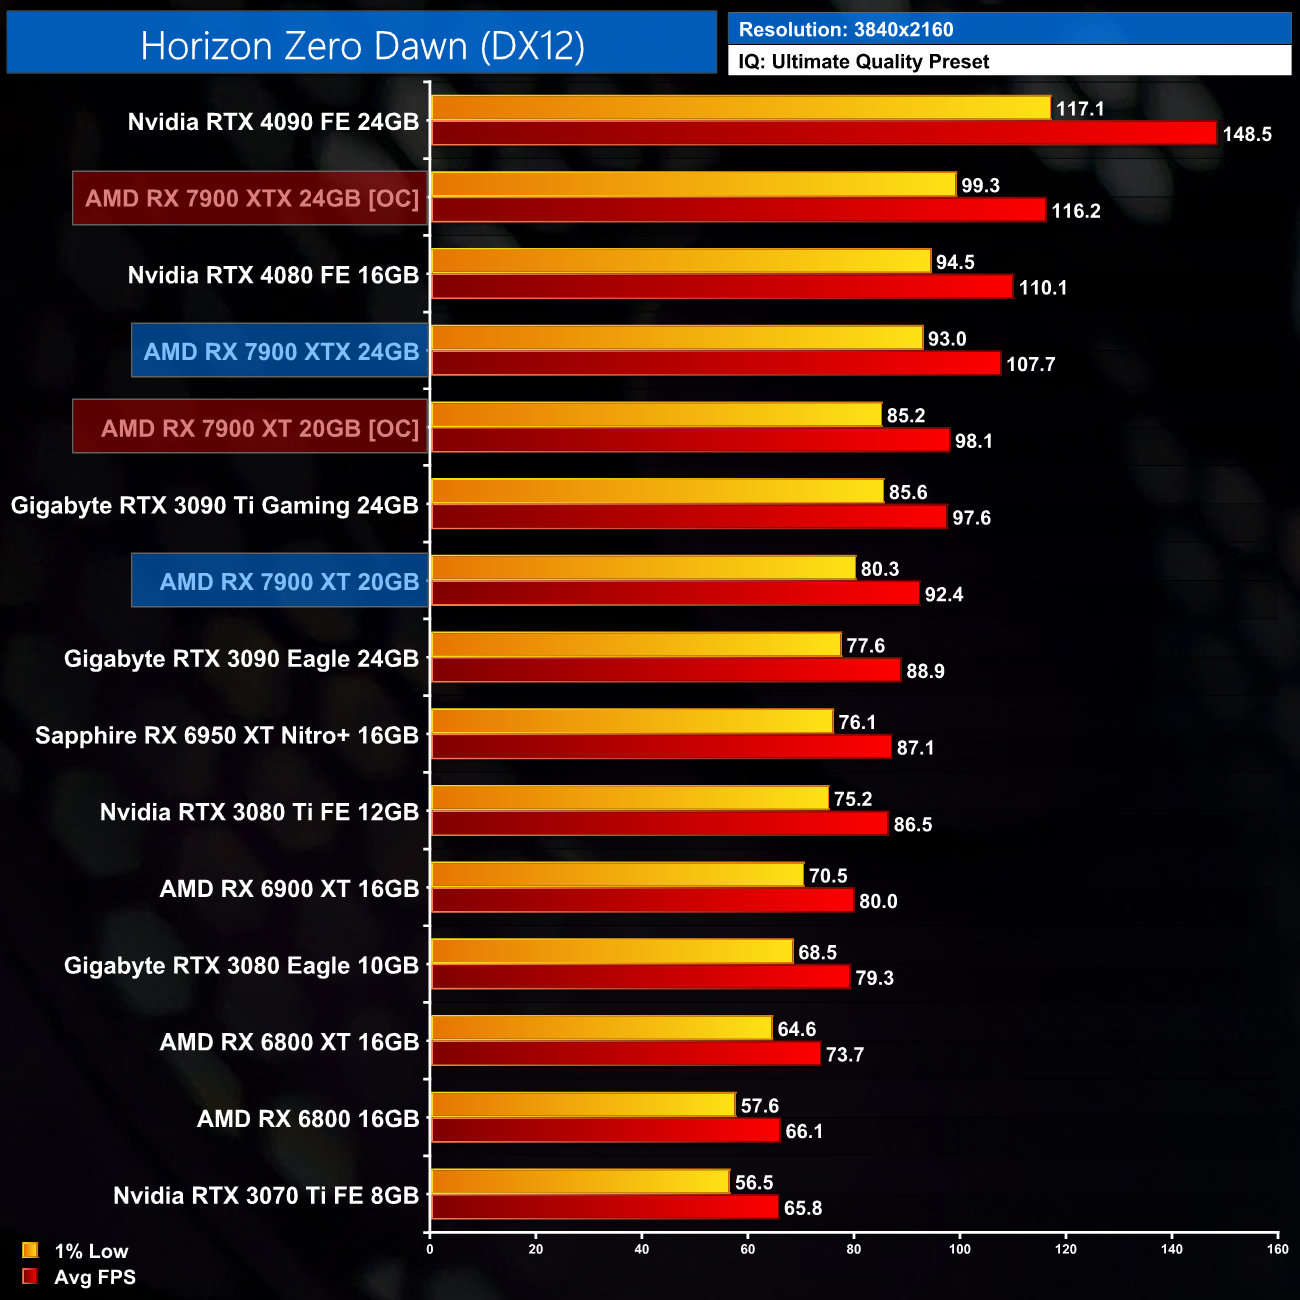
Horizon Zero Dawn is an action role-playing game developed by Guerrilla Games and published by Sony Interactive Entertainment. The plot follows Aloy, a hunter in a world overrun by machines, who sets out to uncover her past. It was released for the PlayStation 4 in 2017 and Microsoft Windows in 2020. (Wikipedia).
Engine: Decima. We test using the Ultimate Quality preset, DX12 API.
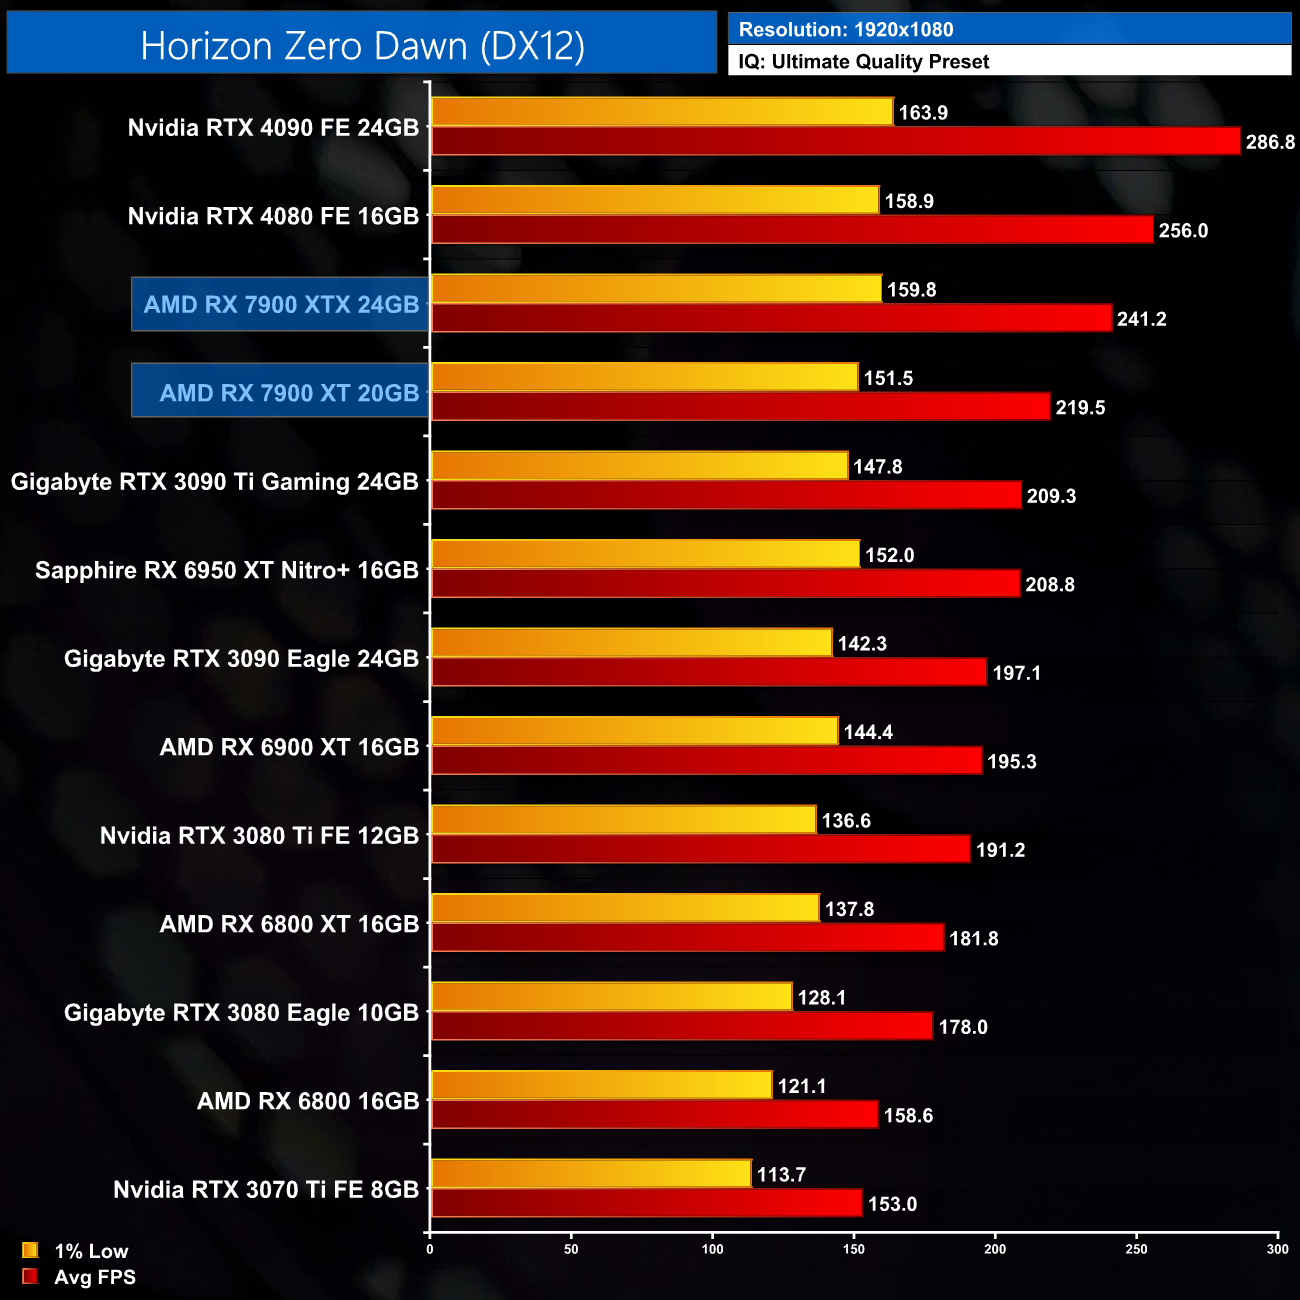
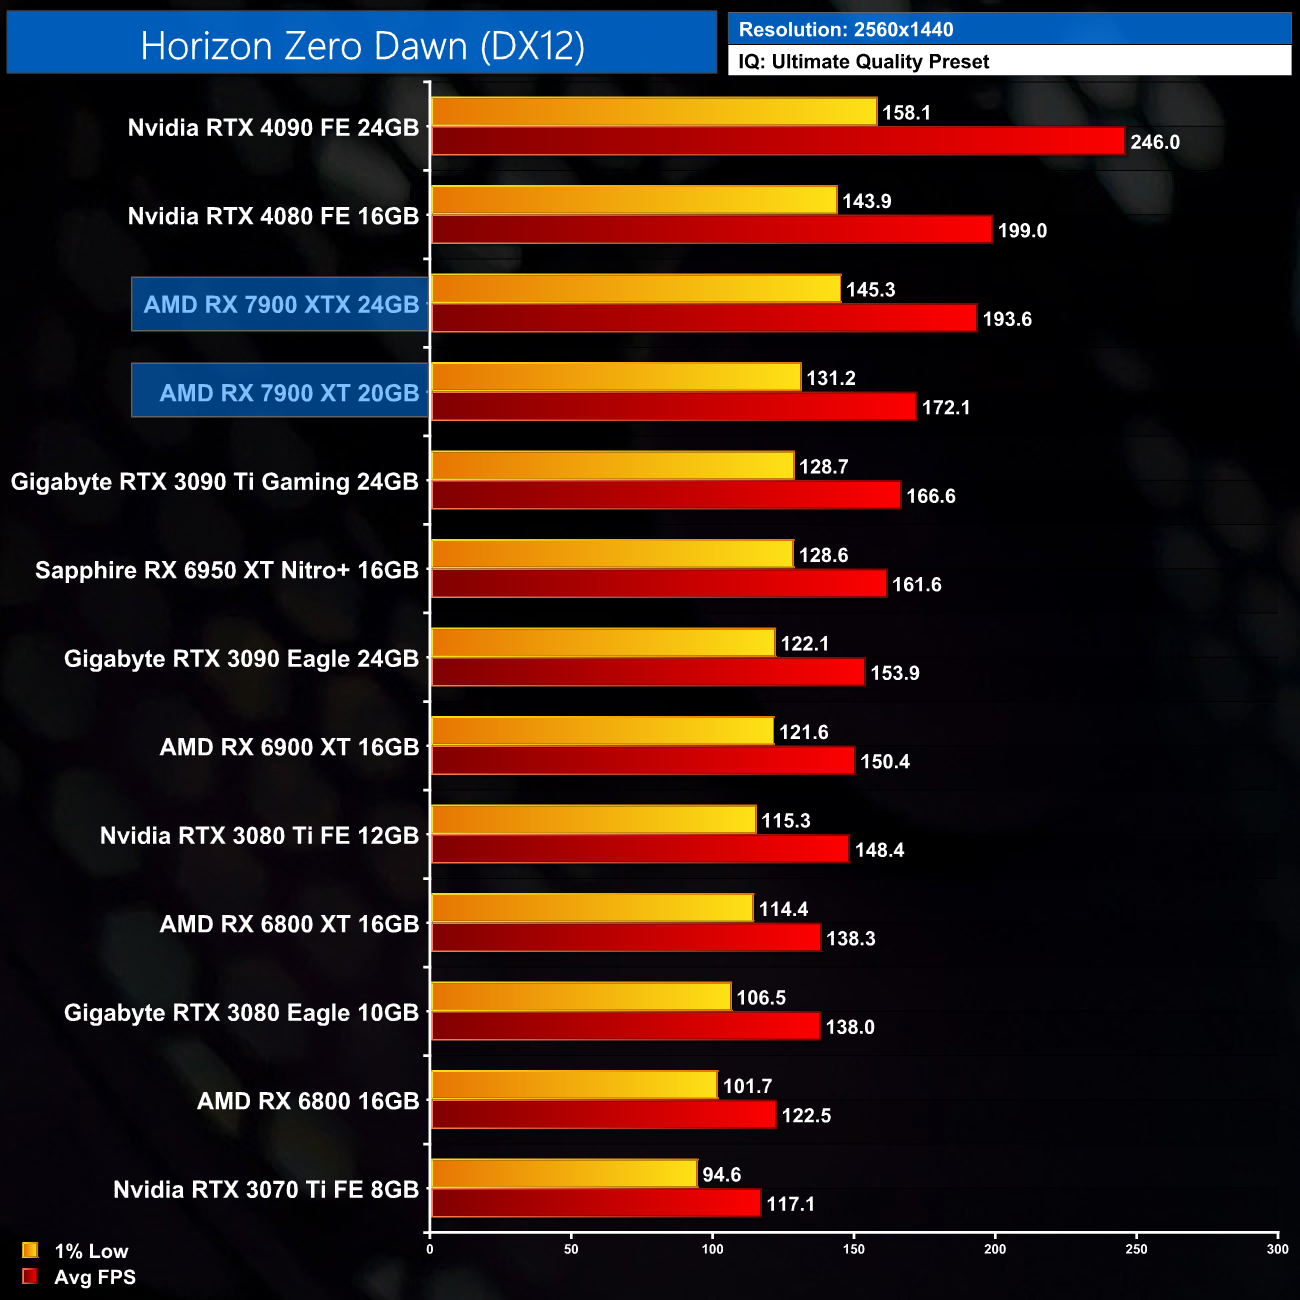
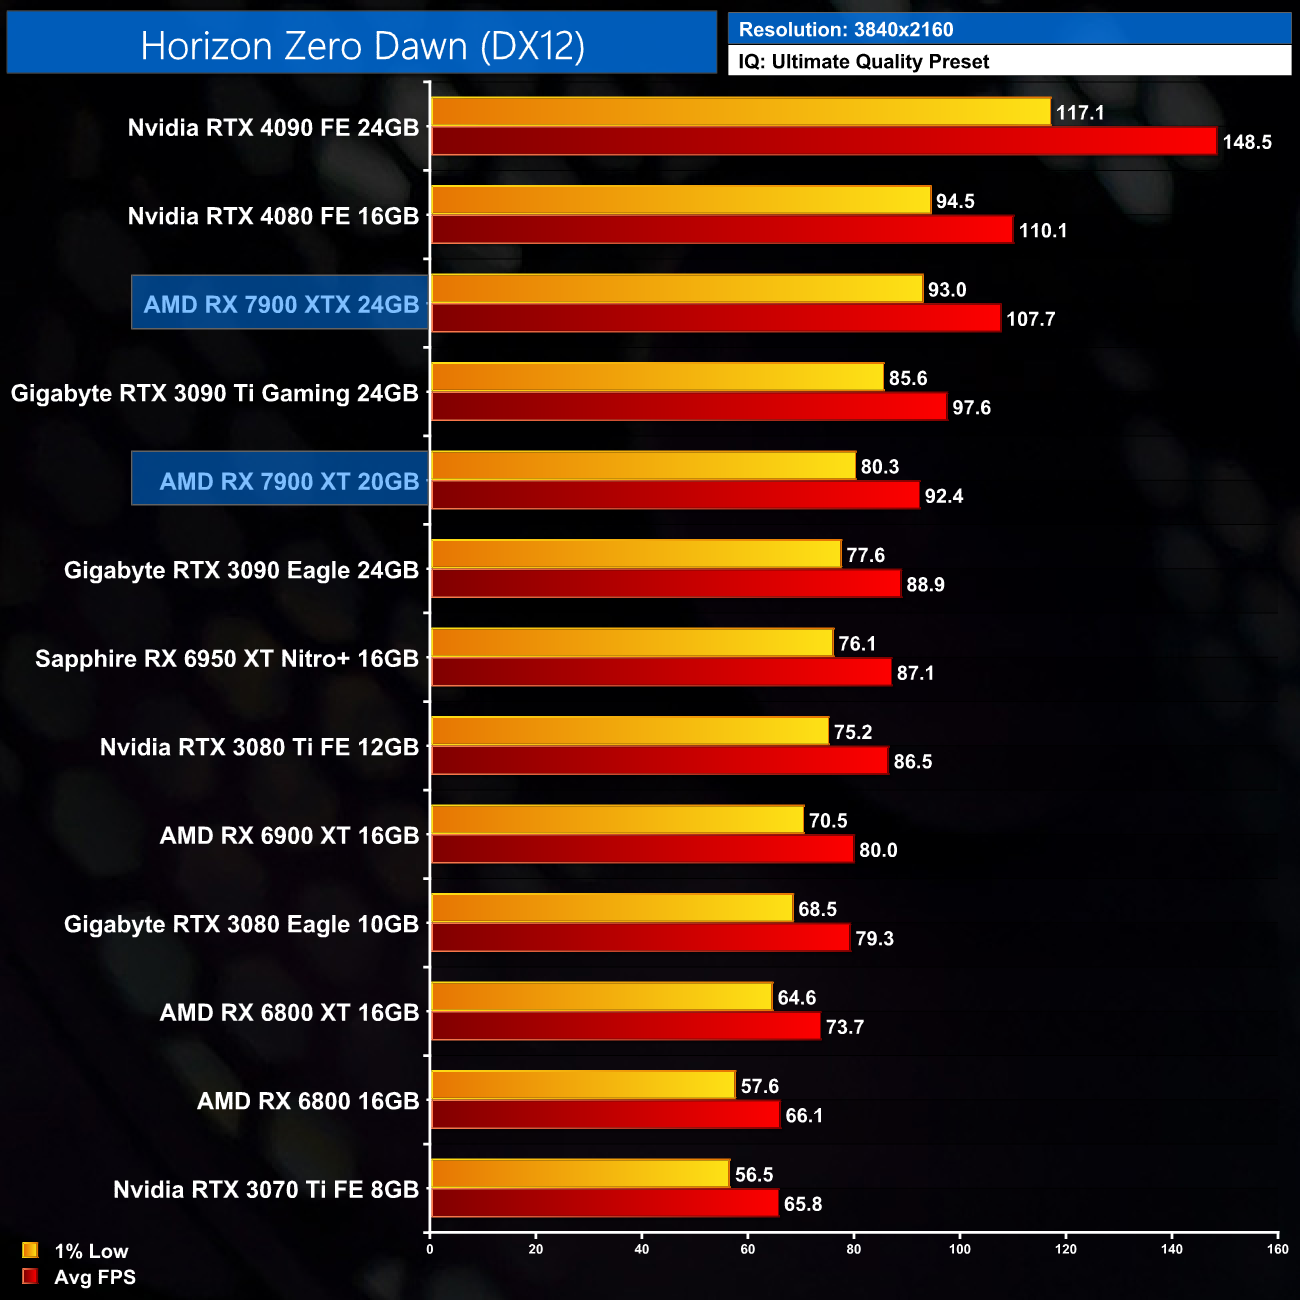
Horizon Zero Dawn is a relatively poor performer for the RDNA 3 GPUs, which is slightly surprising considering how well RDNA 2 scales in this title. At 1440p, the 7900 XT is well behind the RTX 4080, by a margin of 14%, and it's 3% faster than the 3090 Ti.
Up at 4K, the 7900 XT even falls behind the RTX 3090 Ti, and it's now just 4% faster than the vanilla 3090, with a 15% uplift versus the 6900 XT.
Marvel's Spider-Man Remastered is a 2018 action-adventure game developed by Insomniac Games and published by Sony Interactive Entertainment. A remastered version of Marvel's Spider-Man, featuring all previously released downloadable content, was released for the PlayStation 5 in November 2020 and for Microsoft Windows in August 2022. (Wikipedia).
Engine: Insomniac Games Proprietary. We test using the Very High preset, DX12 API.
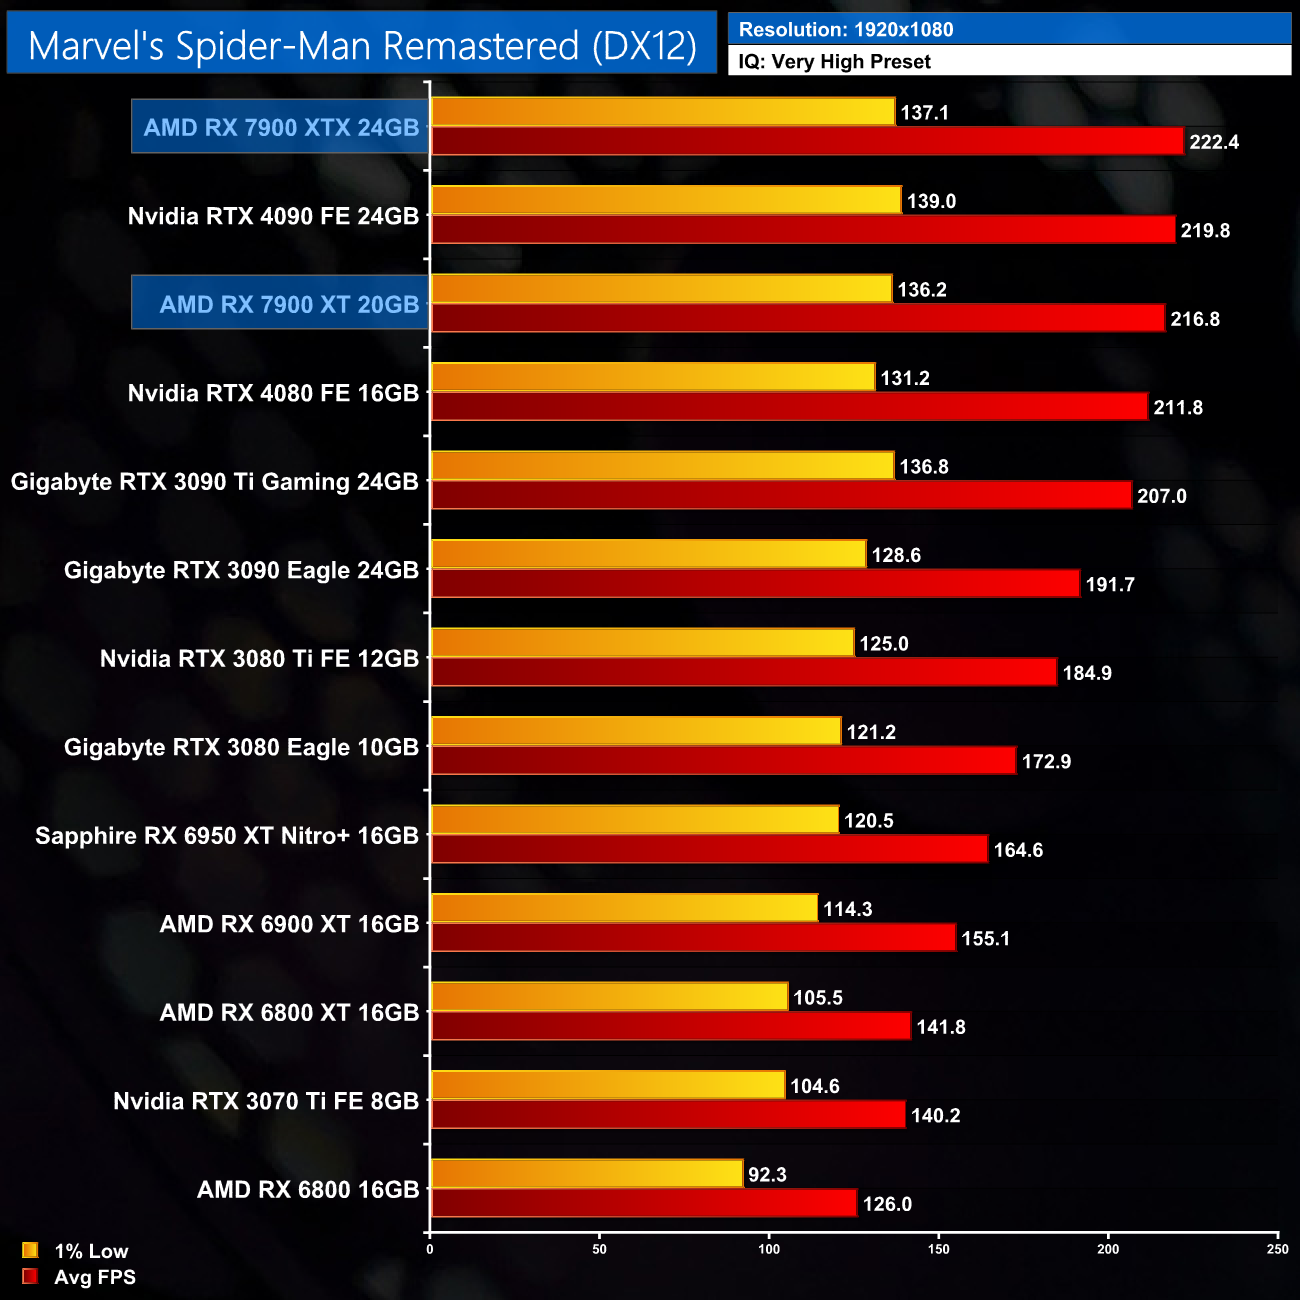
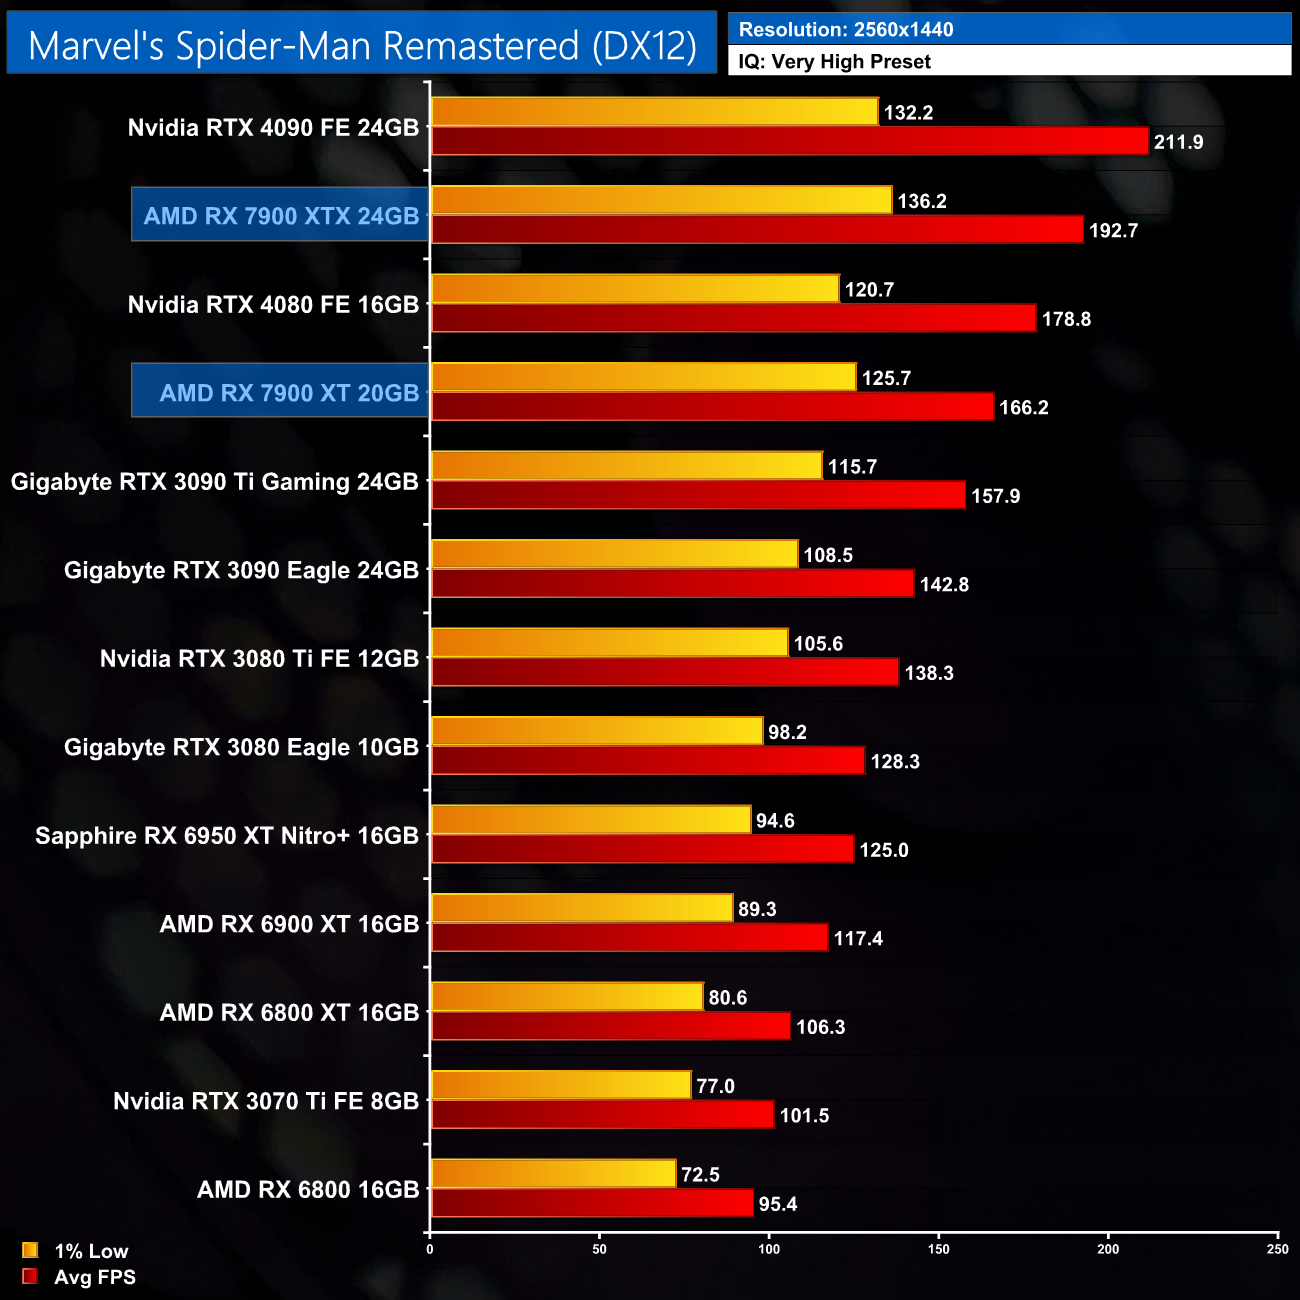
As for Spider-Man Remastered, at 1440p the 7900 XT sits right between the 3090 Ti and the 4080, offering 166FPS on average. It's also 42% faster than the 6900 XT here.
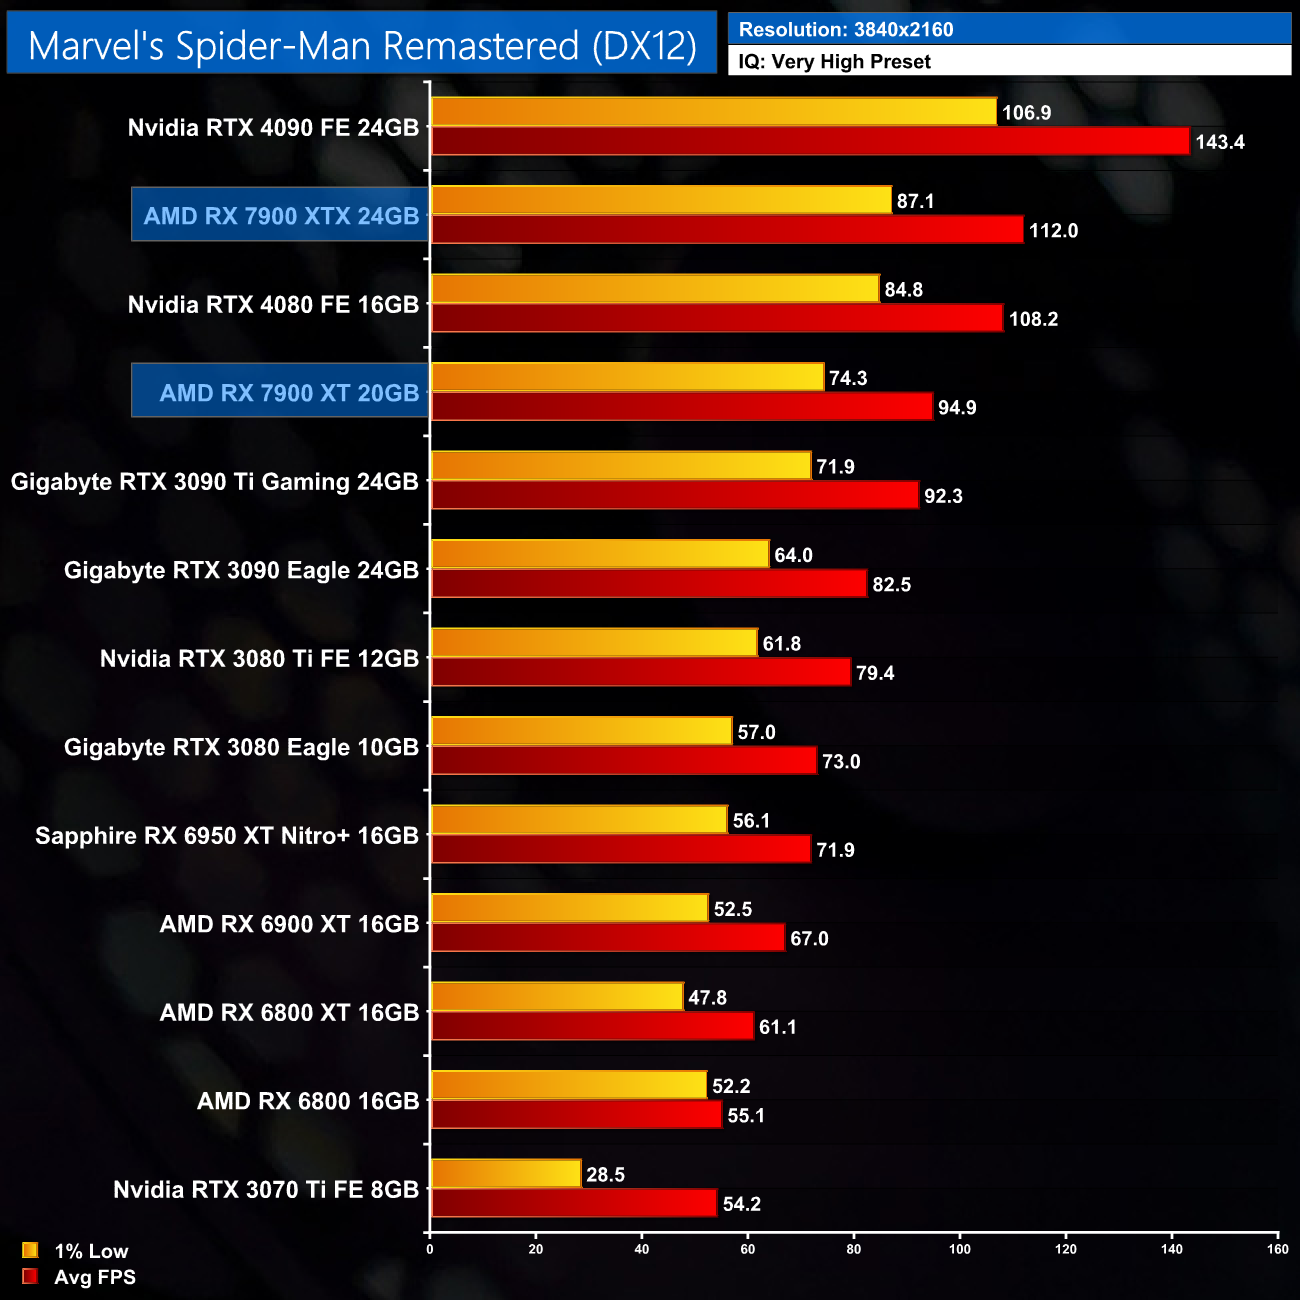
Increasing the resolution to 4K sees the 3090 Ti catch up, and the two GPUs are now more-or-less level, with the 7900 XT 12% slower than the 4080.
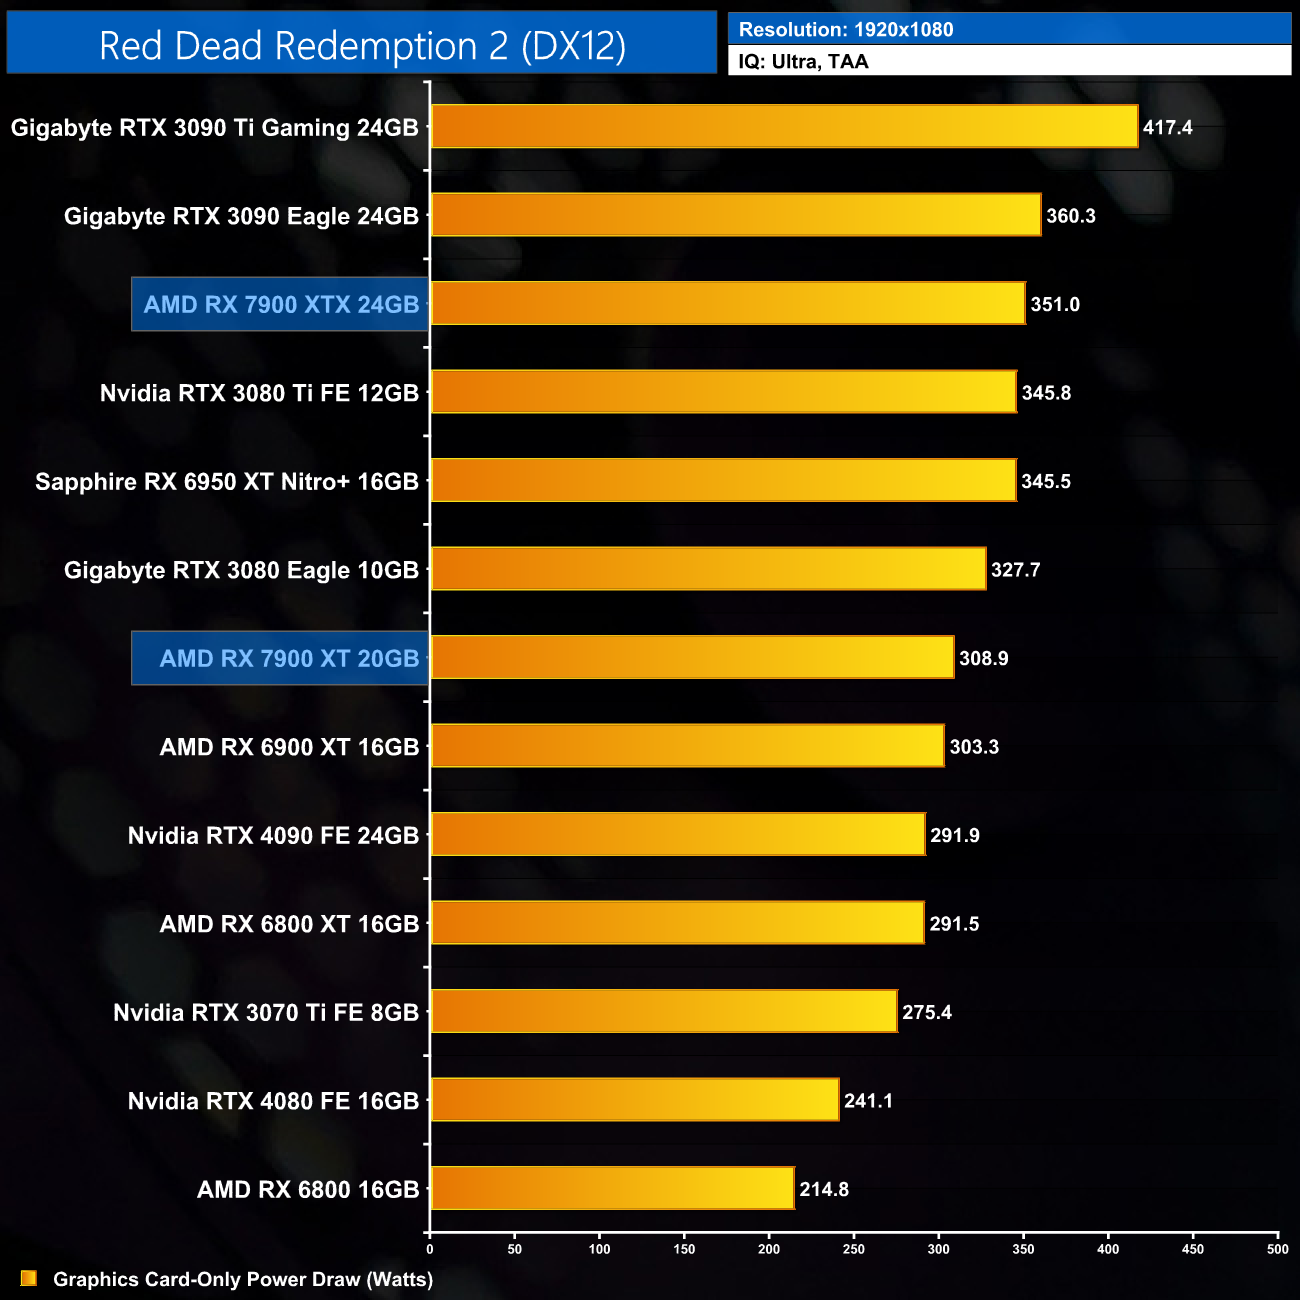
Red Dead Redemption 2 is a 2018 action-adventure game developed and published by Rockstar Games. The game is the third entry in the Red Dead series and is a prequel to the 2010 game Red Dead Redemption. Red Dead Redemption 2 was released for the PlayStation 4 and Xbox One in October 2018, and for Microsoft Windows and Stadia in November 2019. (Wikipedia).
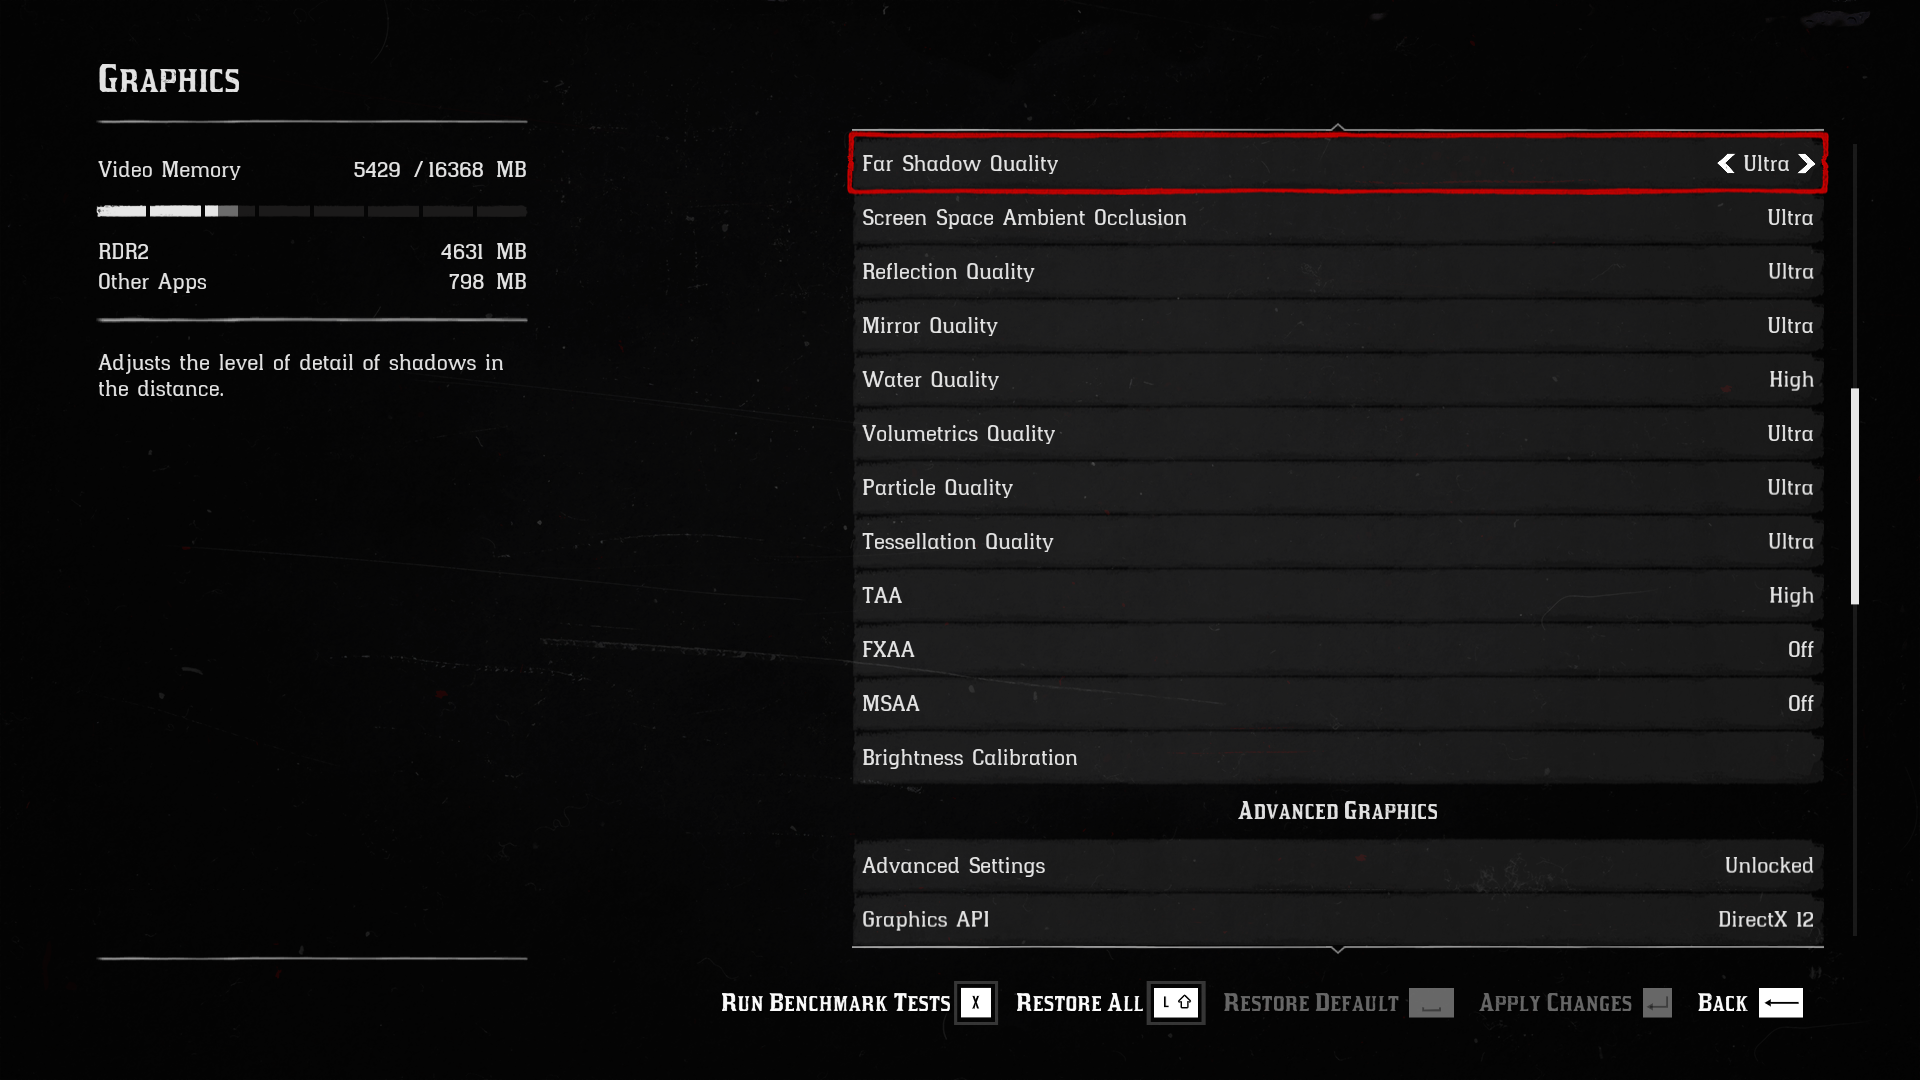
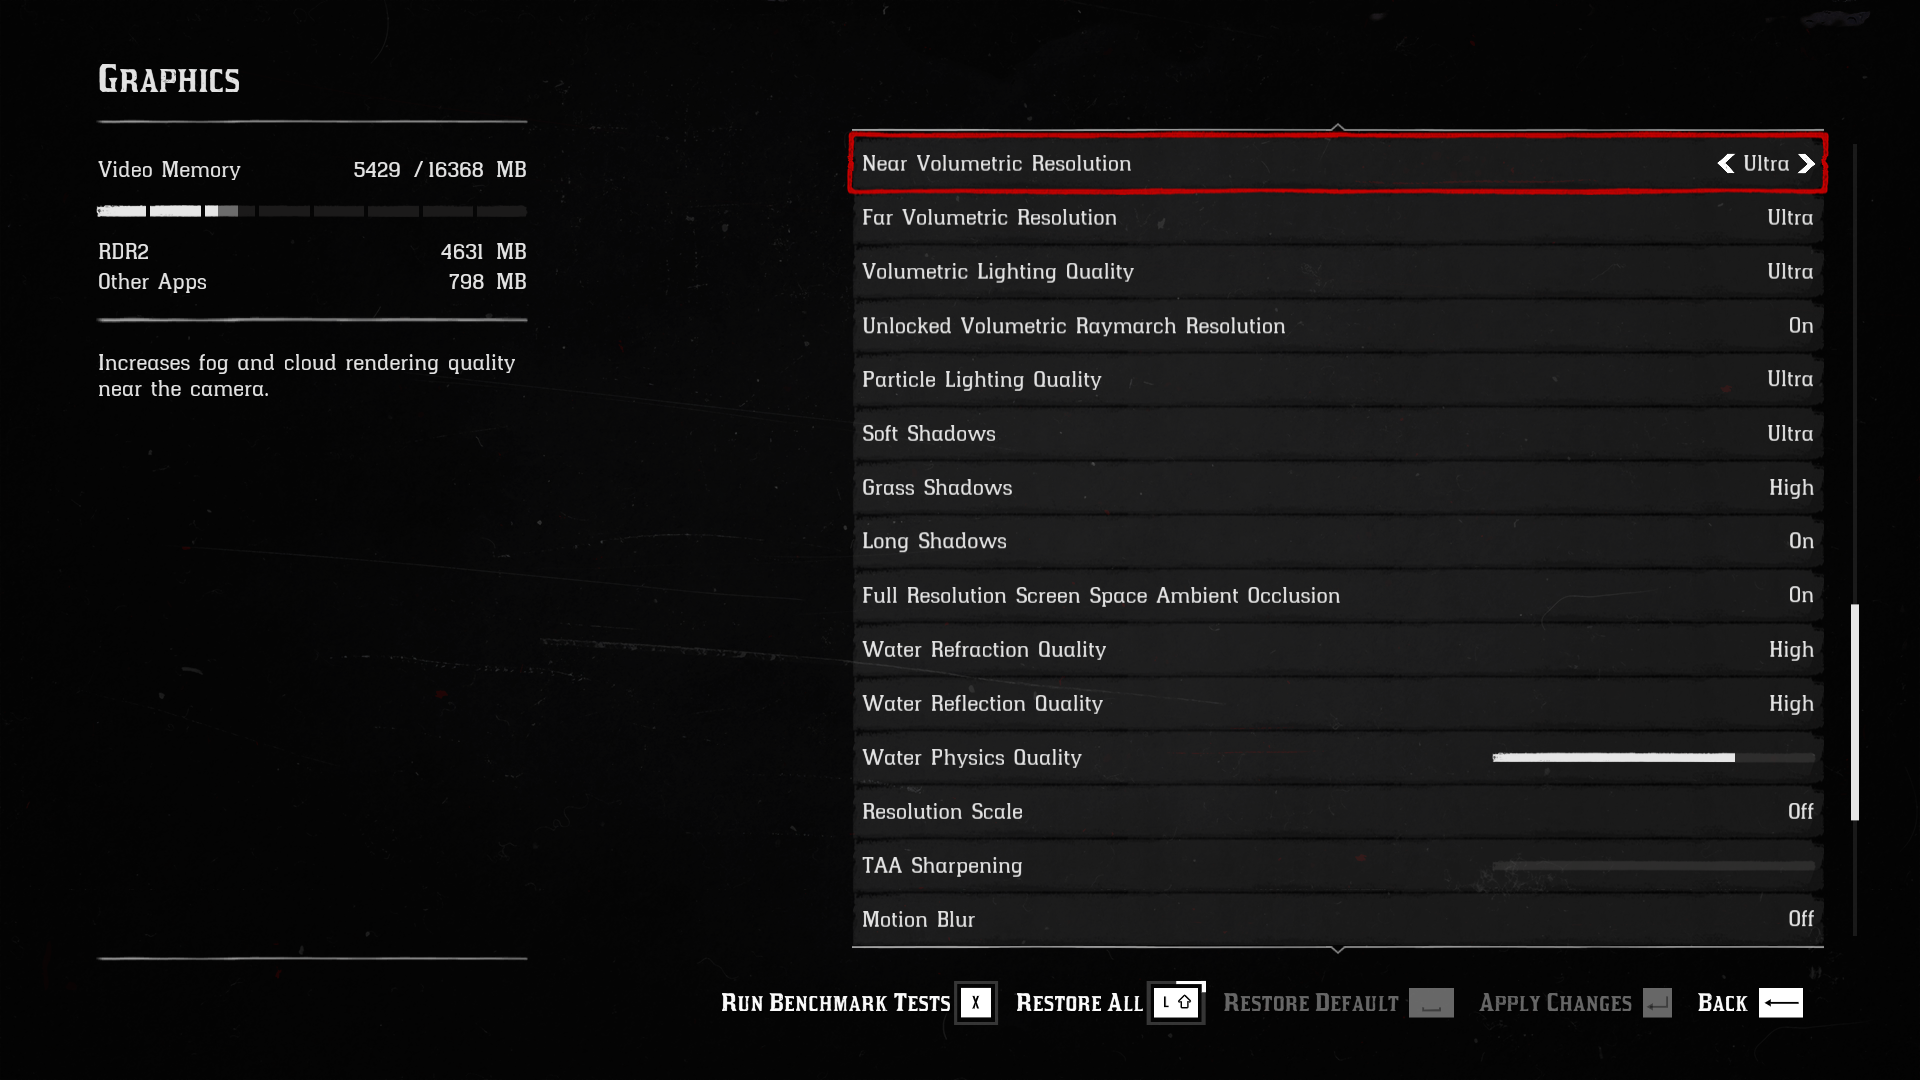
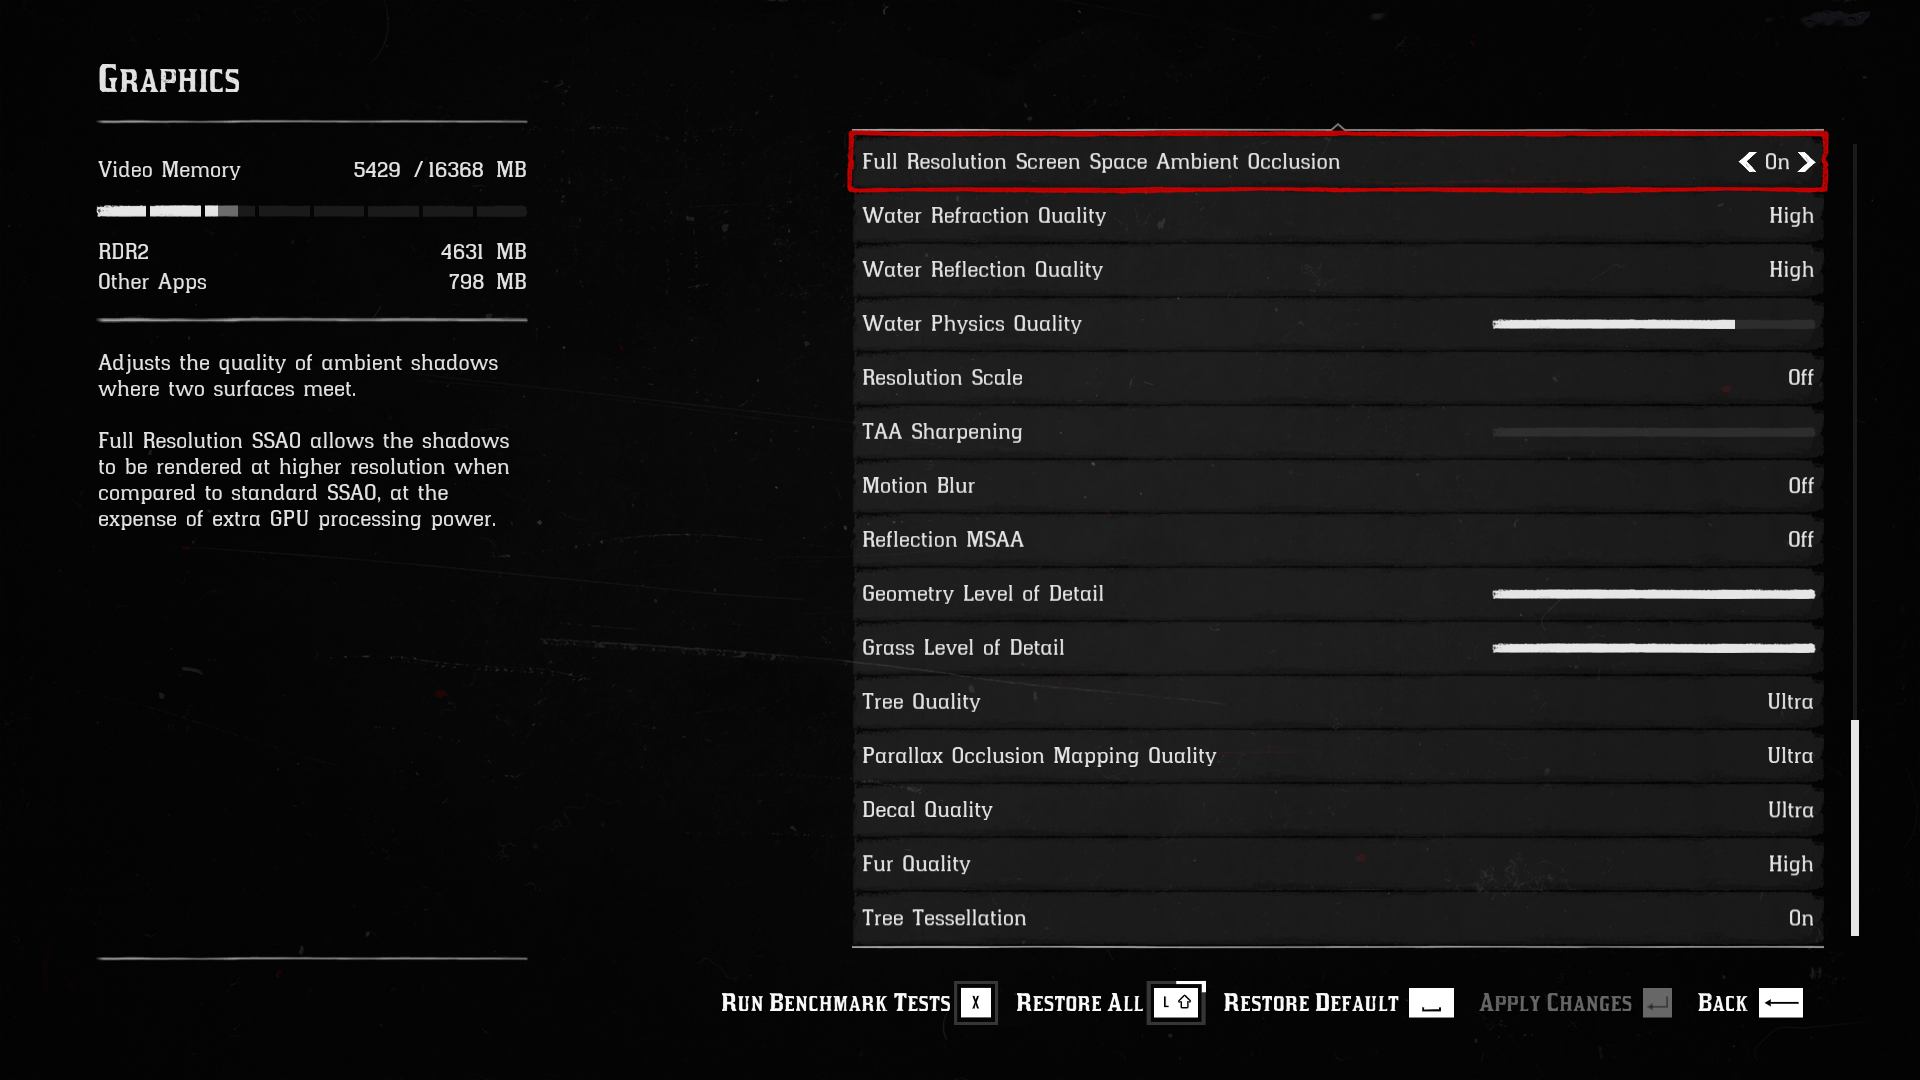
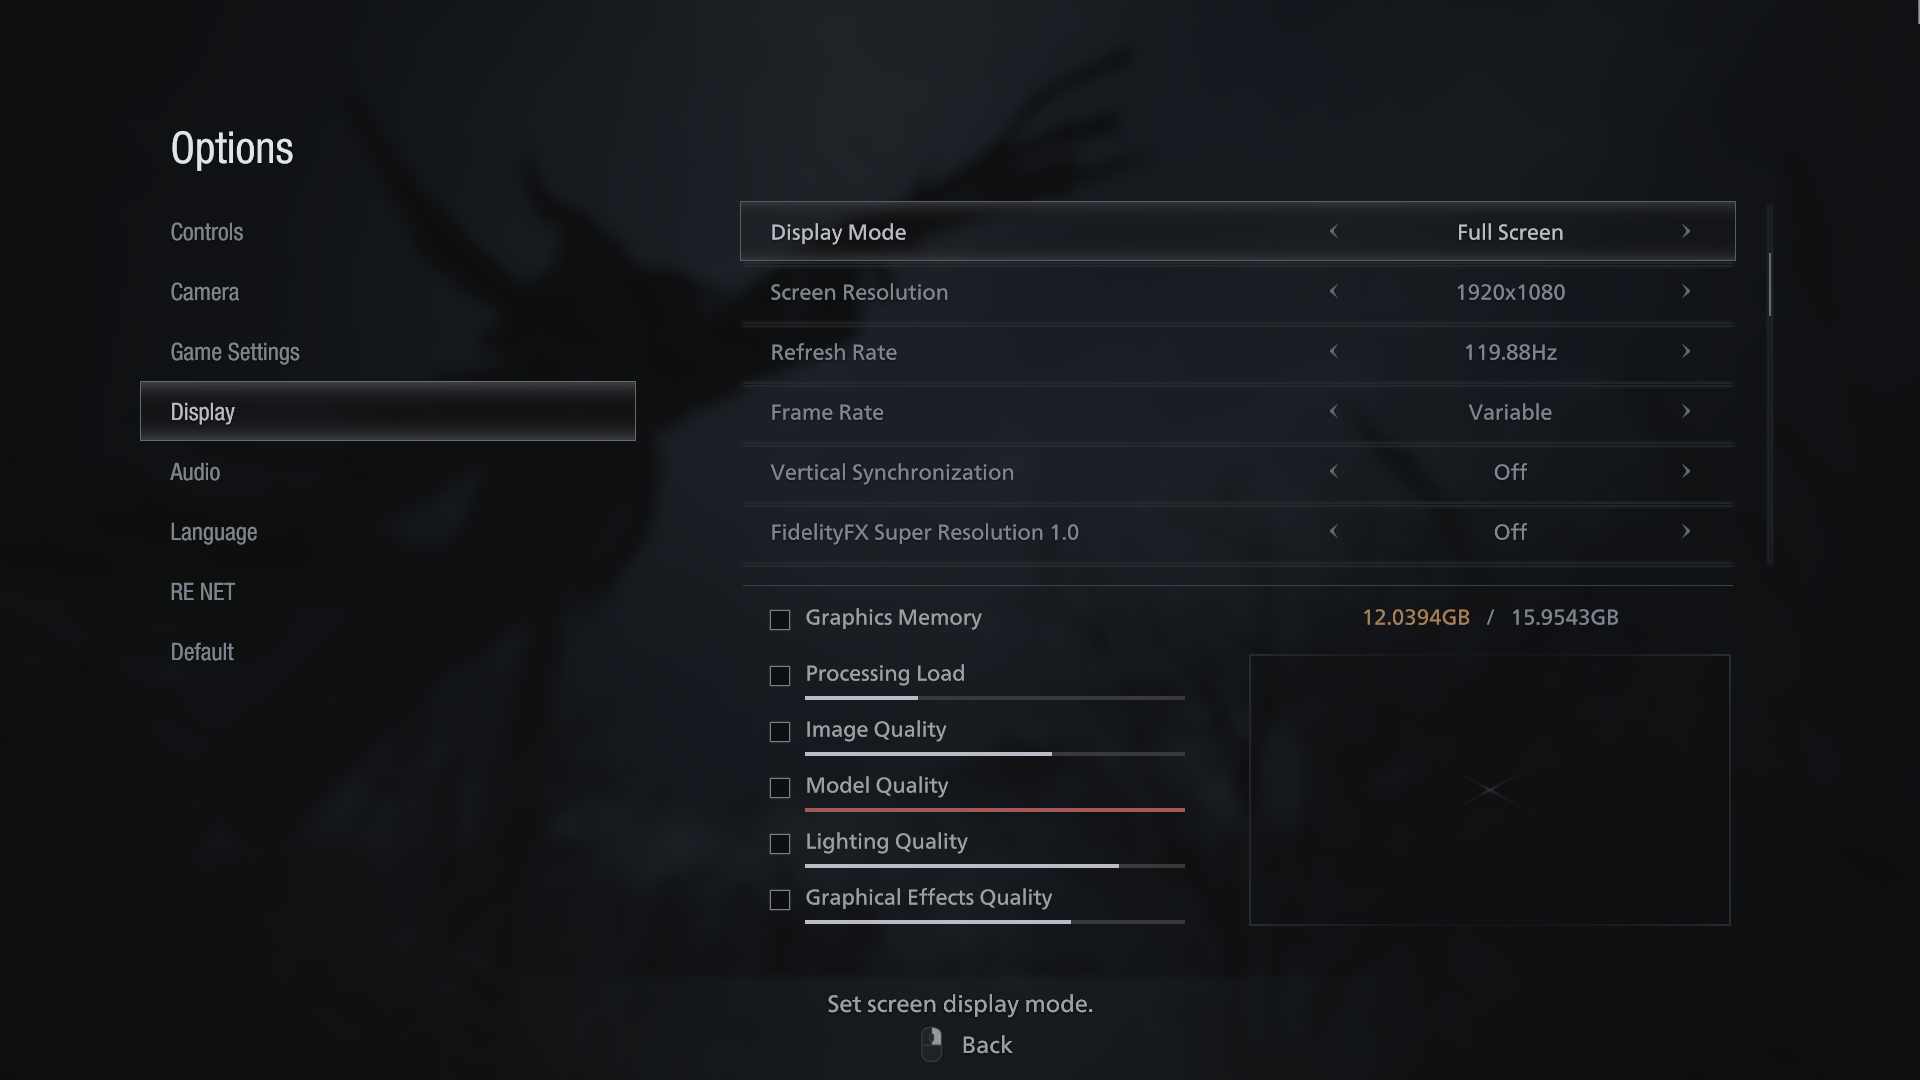
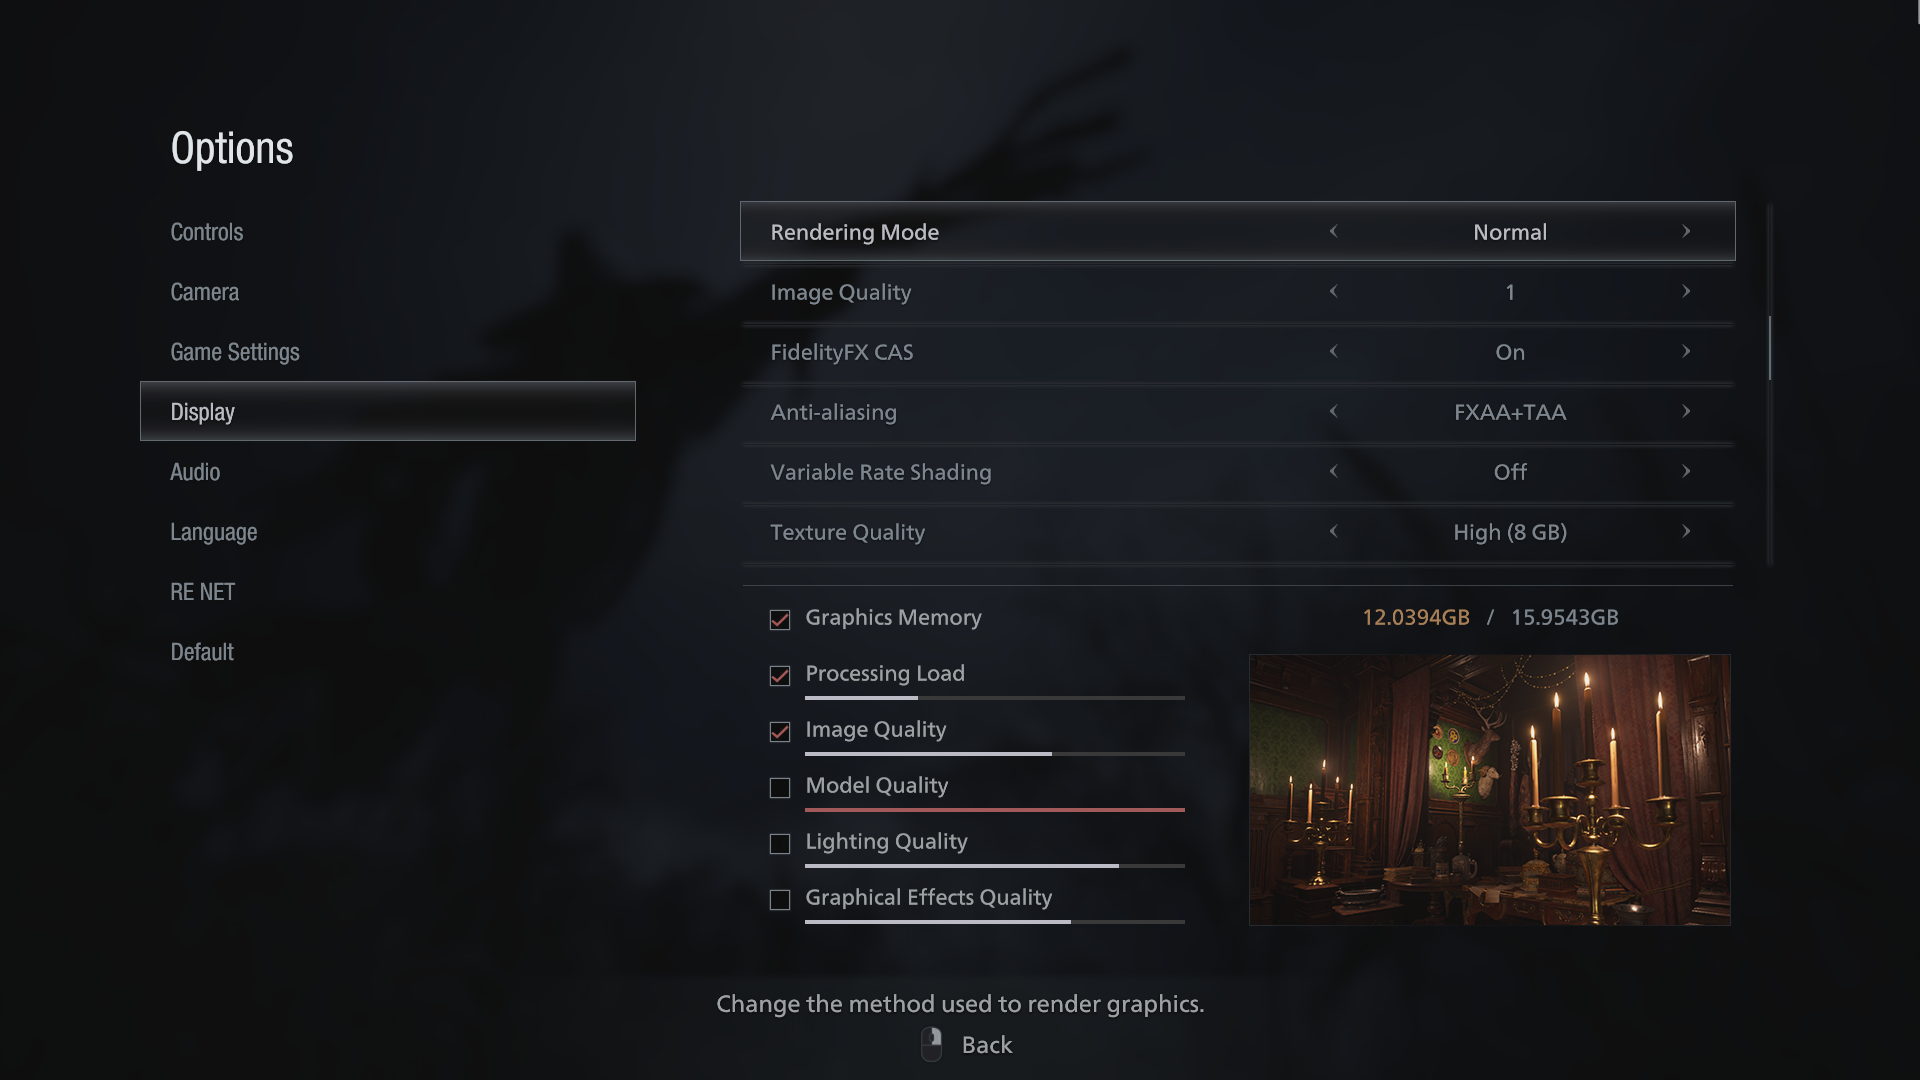
Engine: Rockstar Advance Game Engine (RAGE). We test by manually selecting Ultra settings (or High where Ultra is not available), TAA, DX12 API.
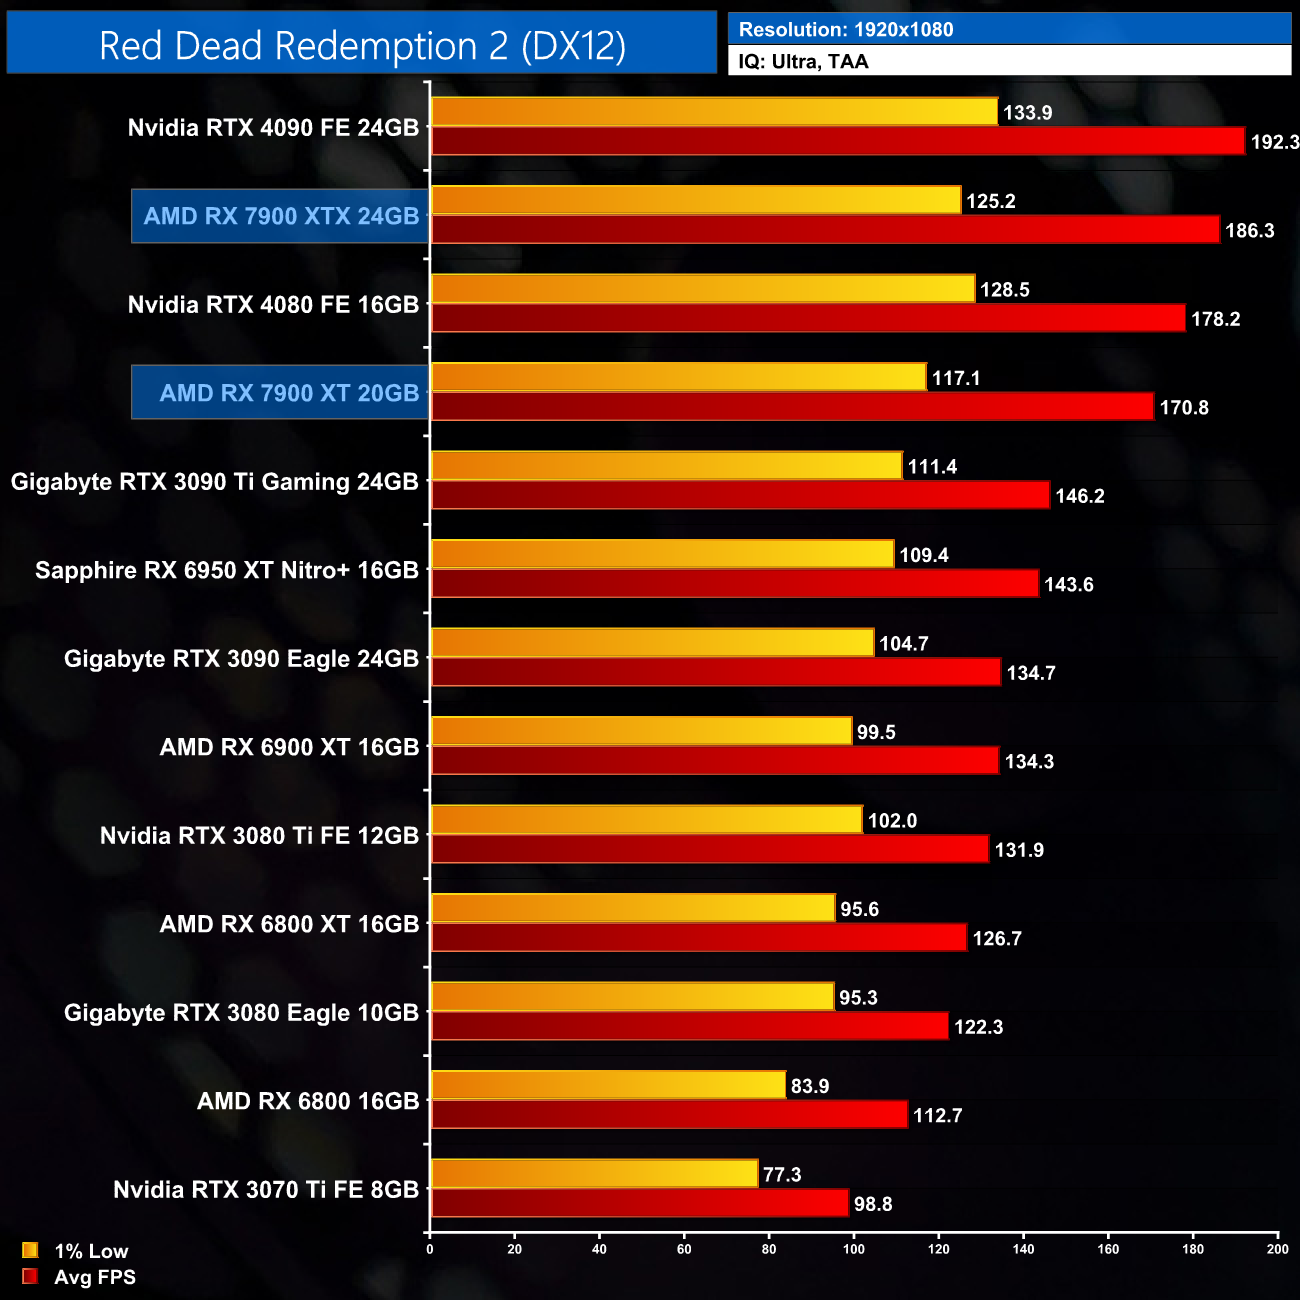
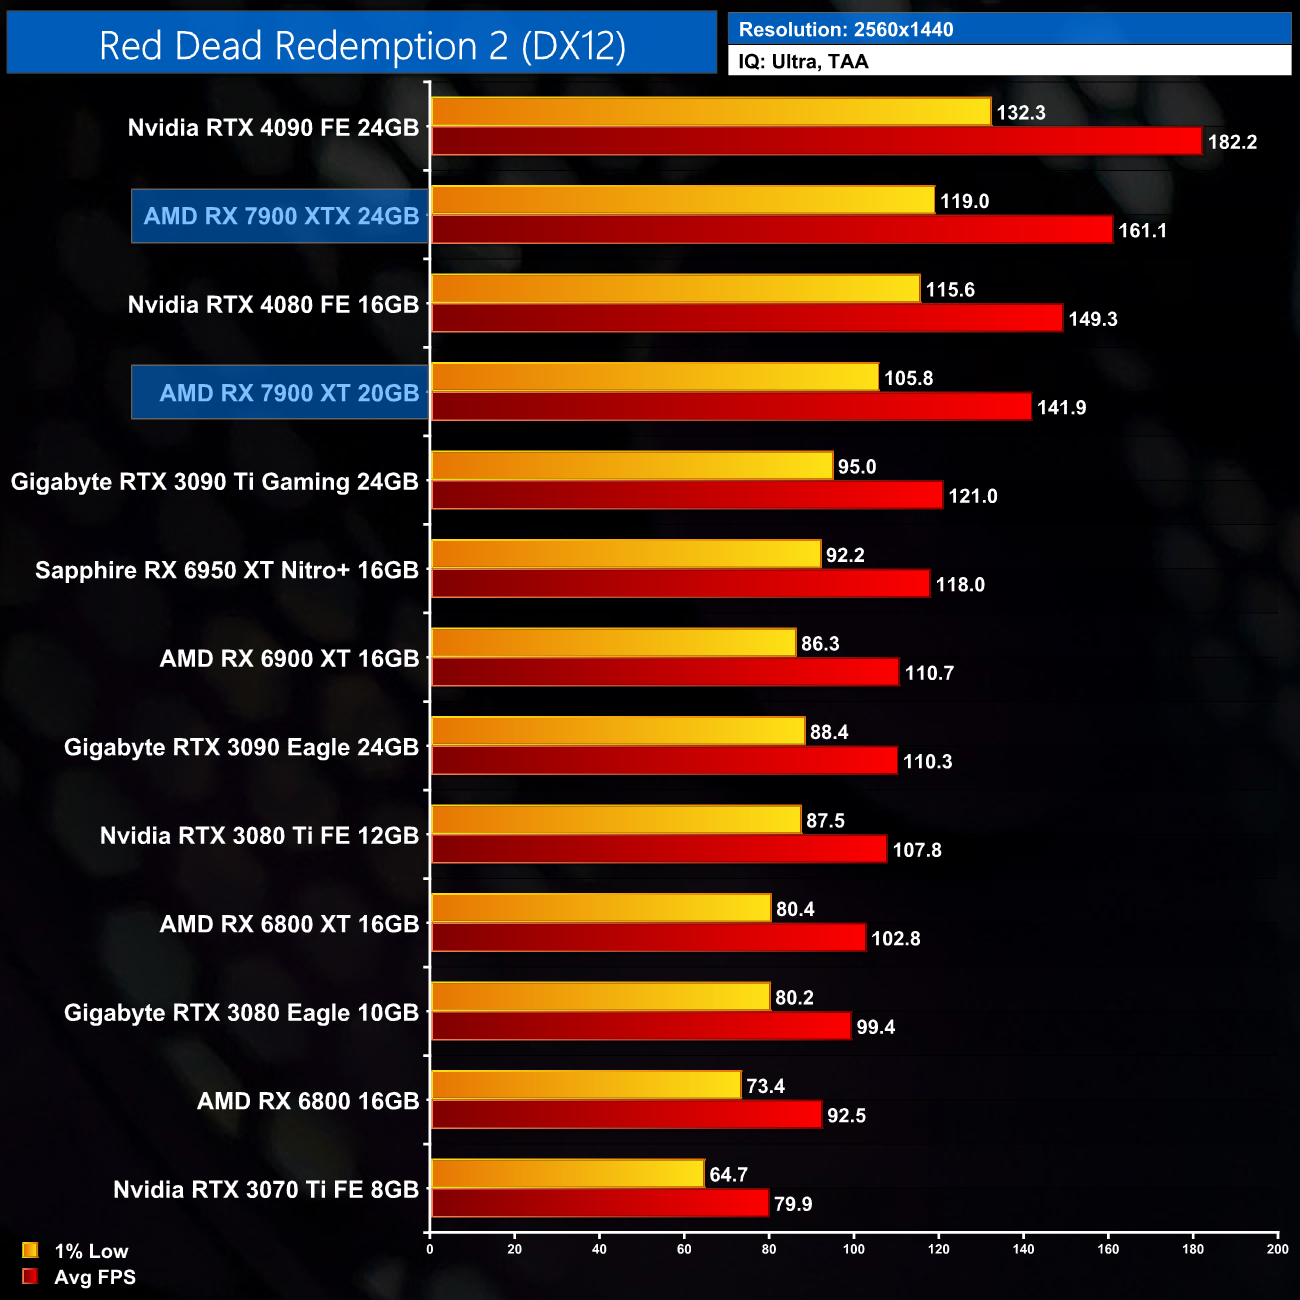
Next we have Red Dead Redemption 2, where the RDNA 3 GPUs do very well indeed – at 1440p, the RX 7900 XT is only 5% slower than the RTX 4080, while it's 17% faster than the 3090 Ti.
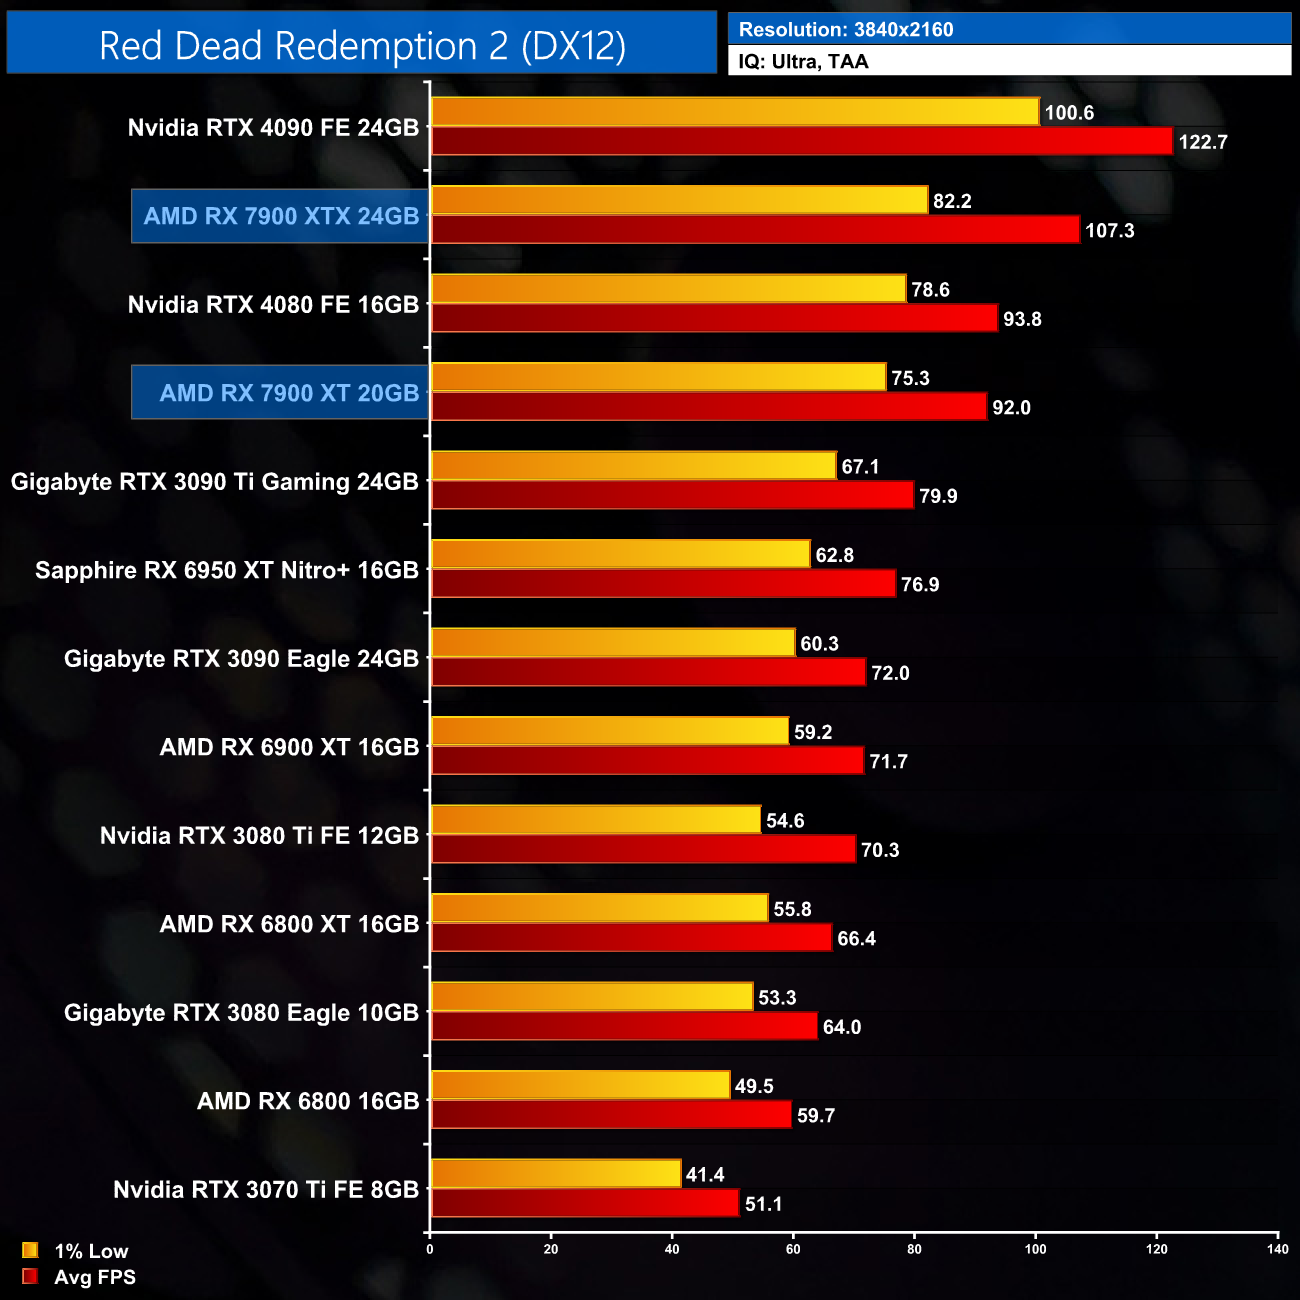
As for 4K performance, the 7900 XT is now a match for the RTX 4080, with both cards averaging just over 90FPS, and that's a great result for the AMD GPU considering its price-point.
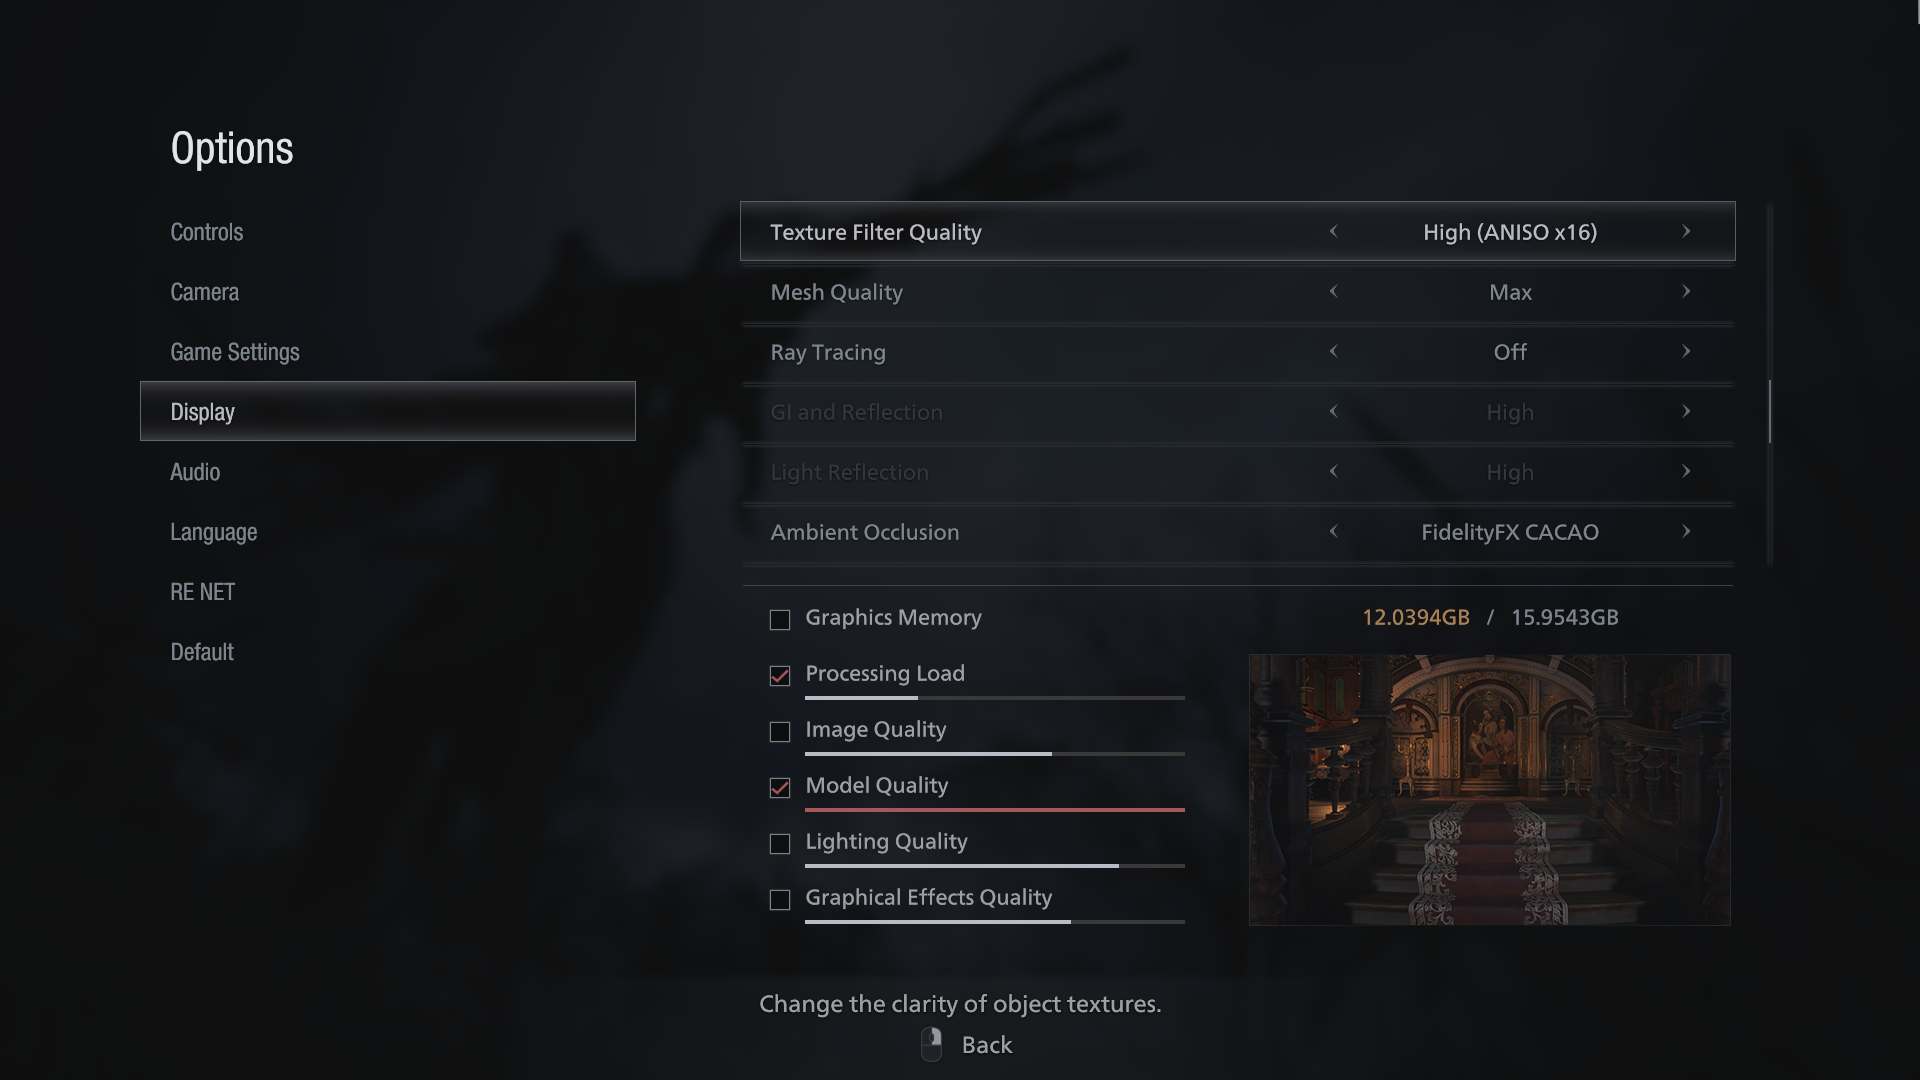
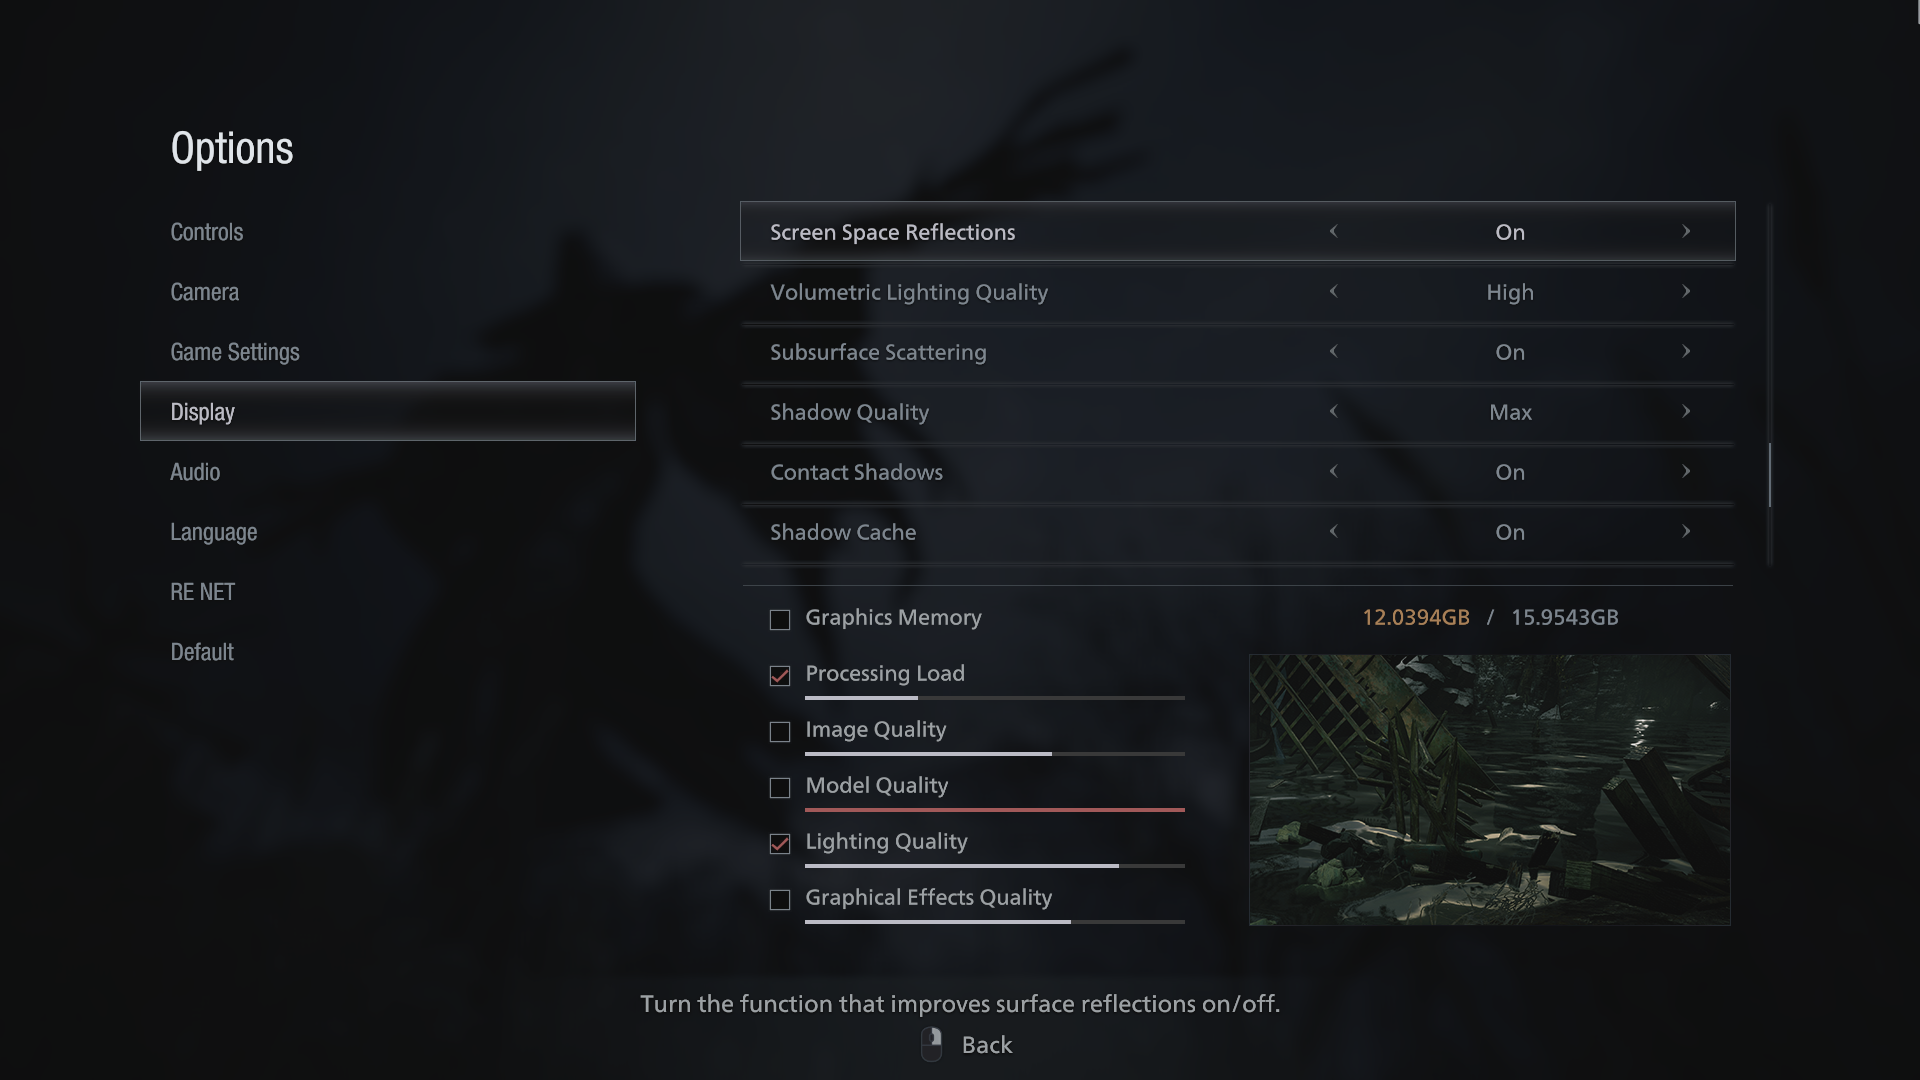
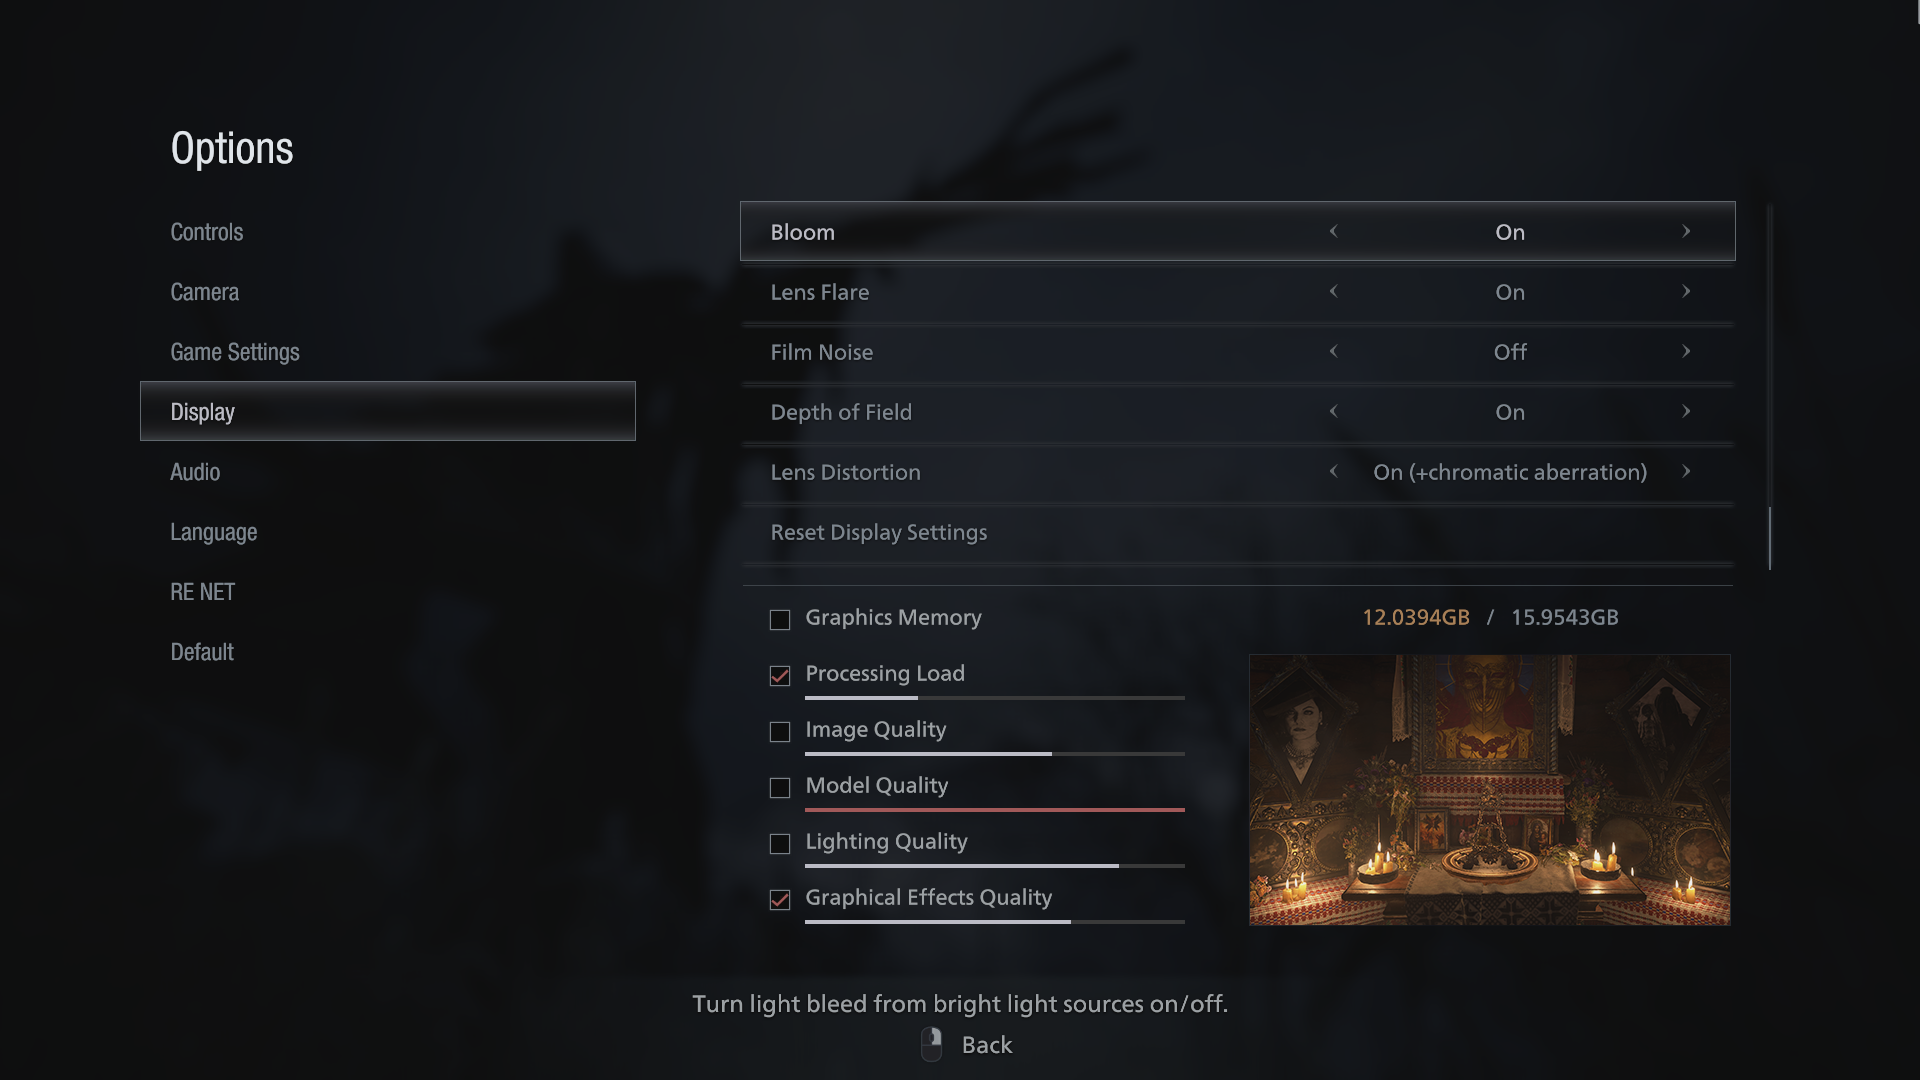
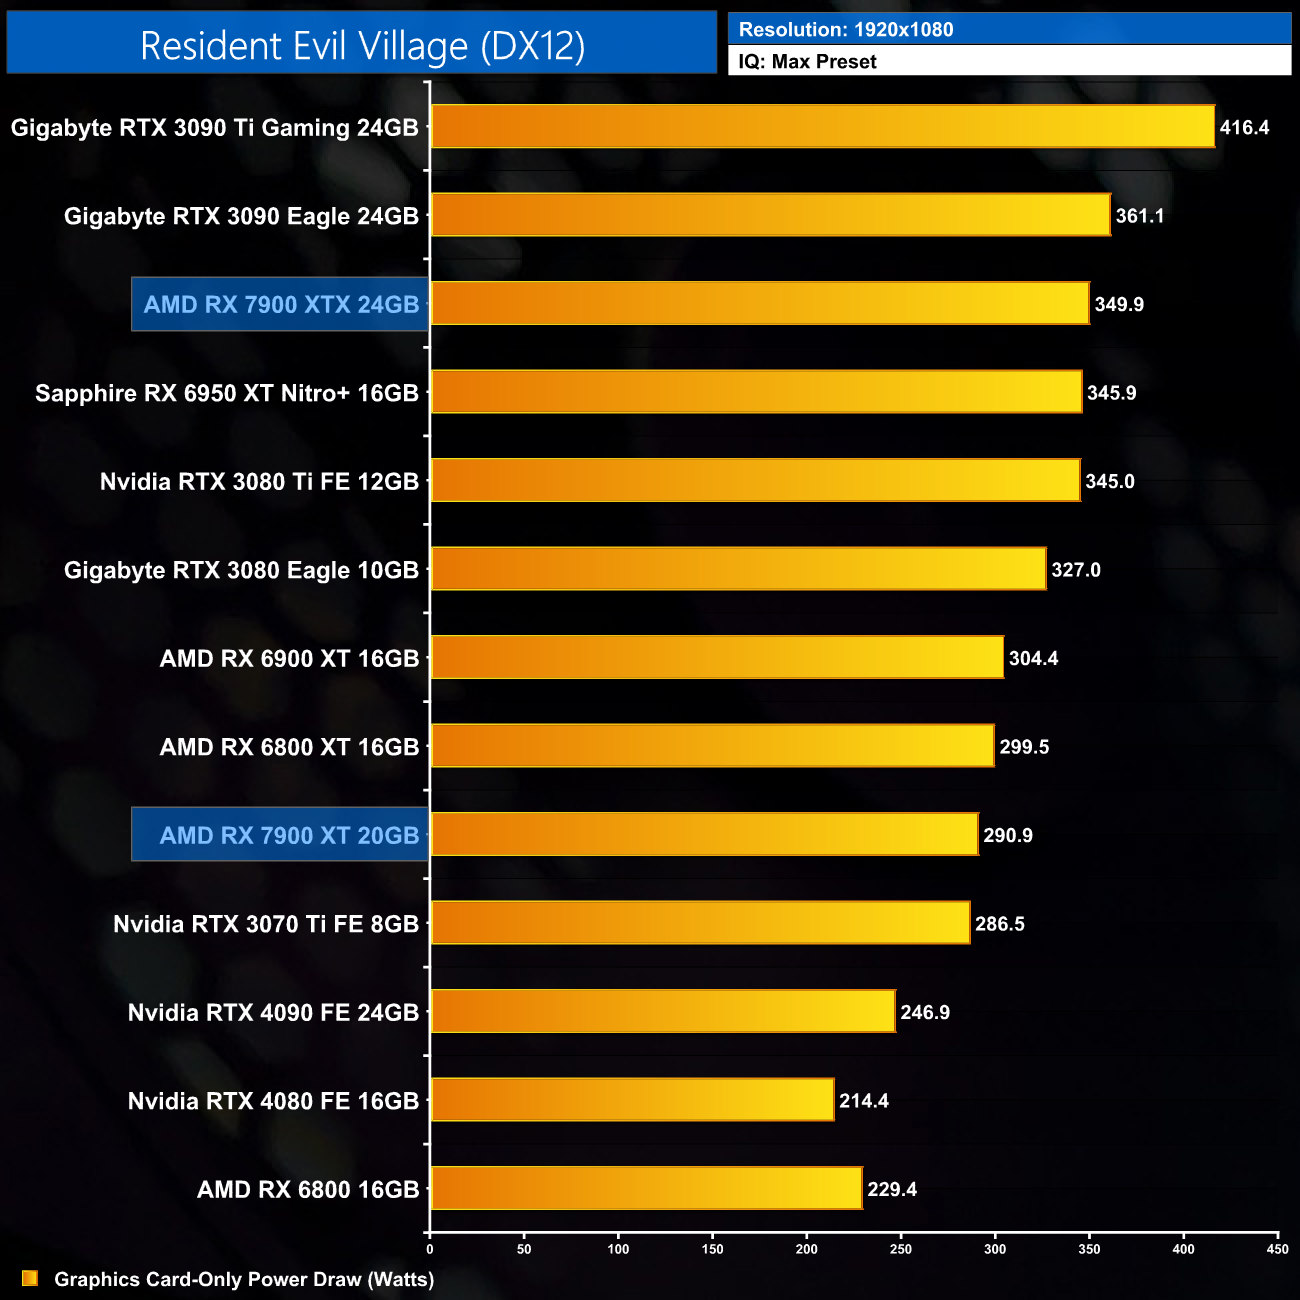
Resident Evil Village is a survival horror game developed and published by Capcom. The sequel to Resident Evil 7: Biohazard (2017), players control Ethan Winters, who is searching for his kidnapped daughter; after a fateful encounter with Chris Redfield, he finds himself in a village filled with mutant creatures. The game was announced at the PlayStation 5 reveal event in June 2020 and was released on May 7, 2021, for Windows, PlayStation 4, PlayStation 5, Xbox One, Xbox Series X/S and Stadia. (Wikipedia).
Engine: RE Engine. We test using the Max preset, with V-Sync disabled, DX12 API.
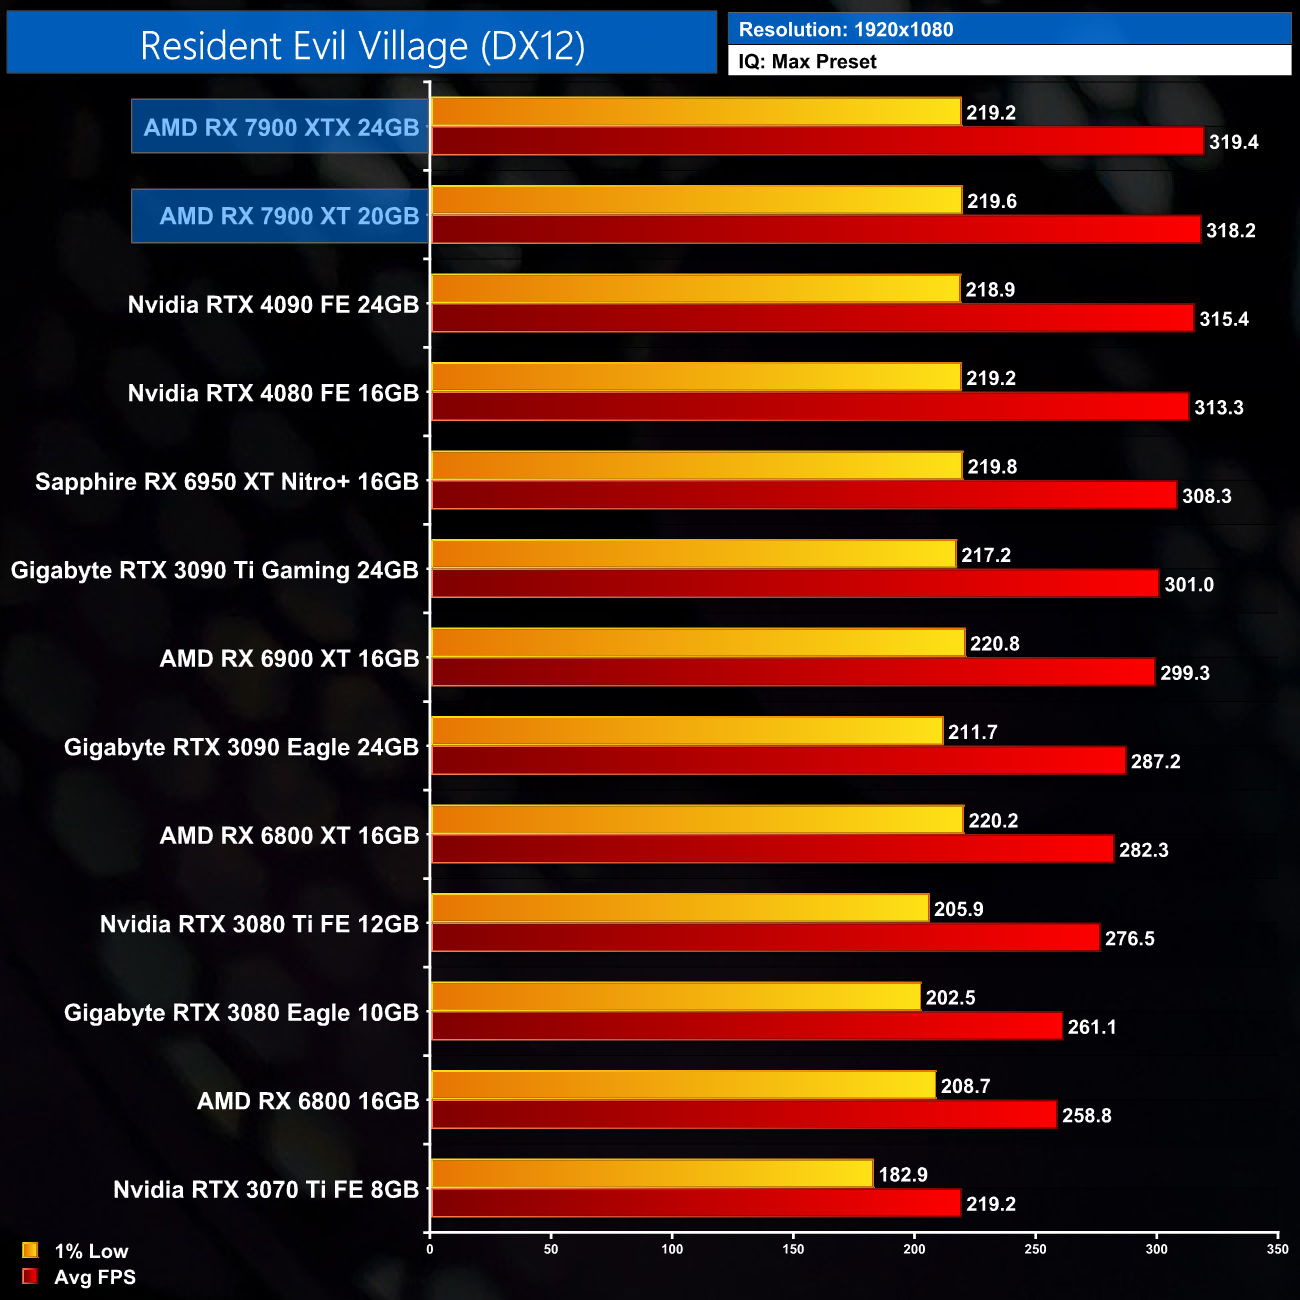
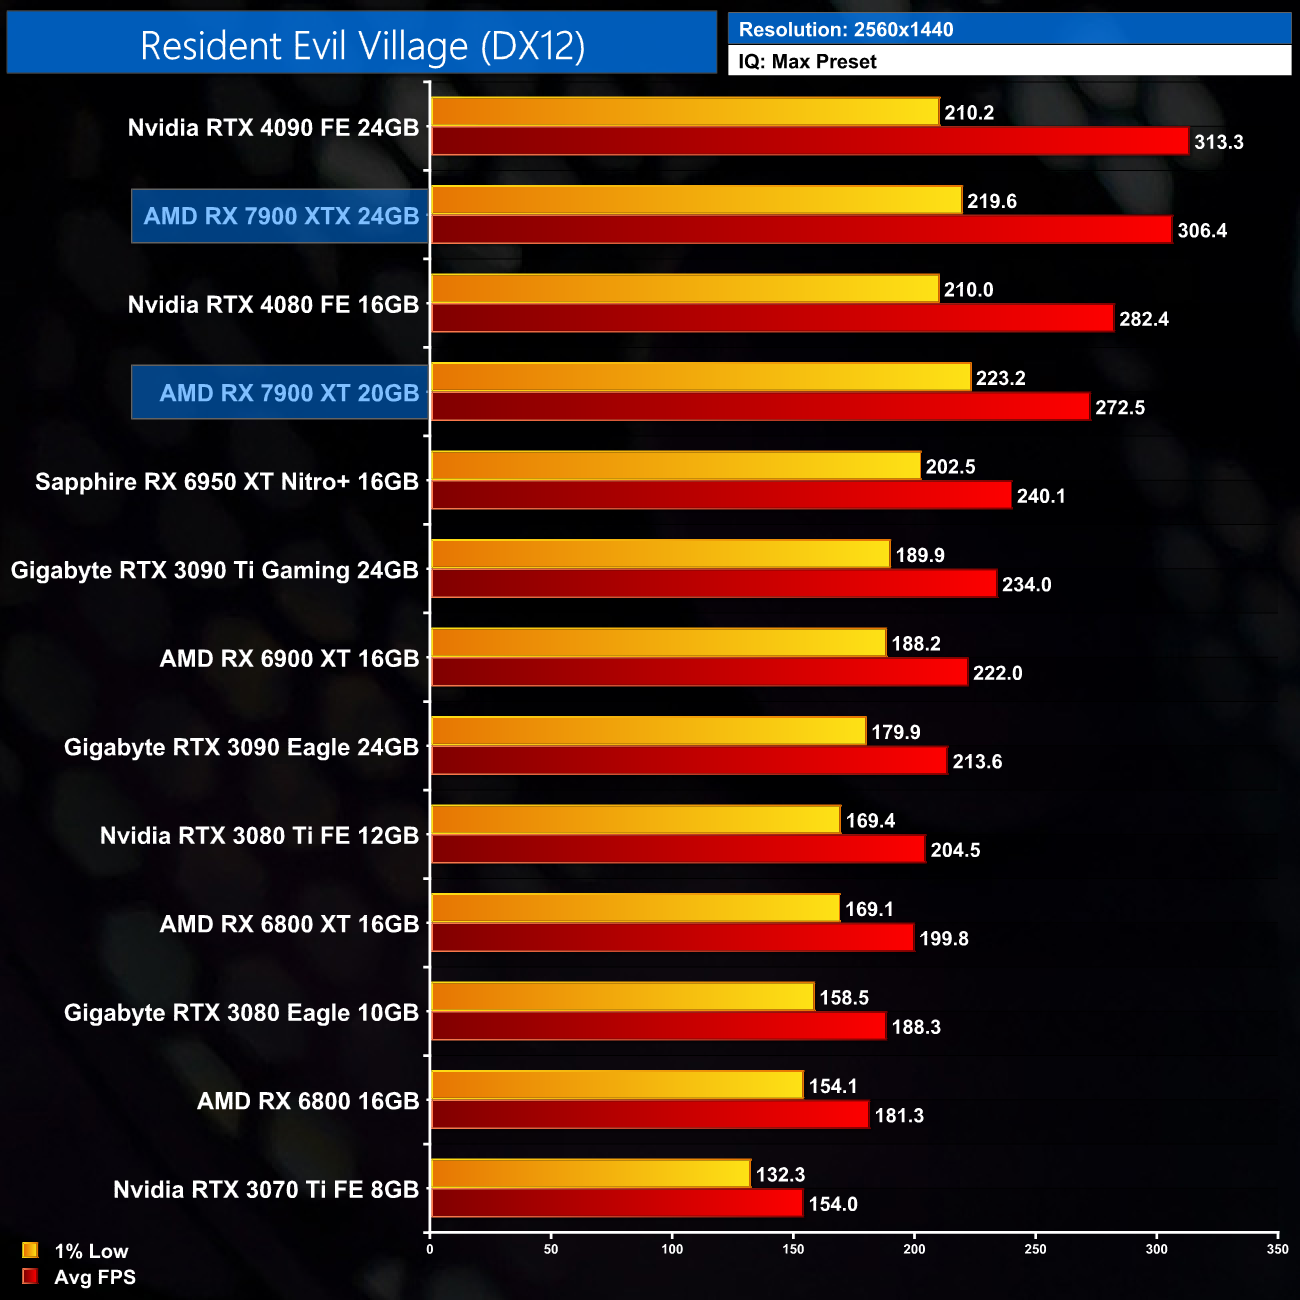
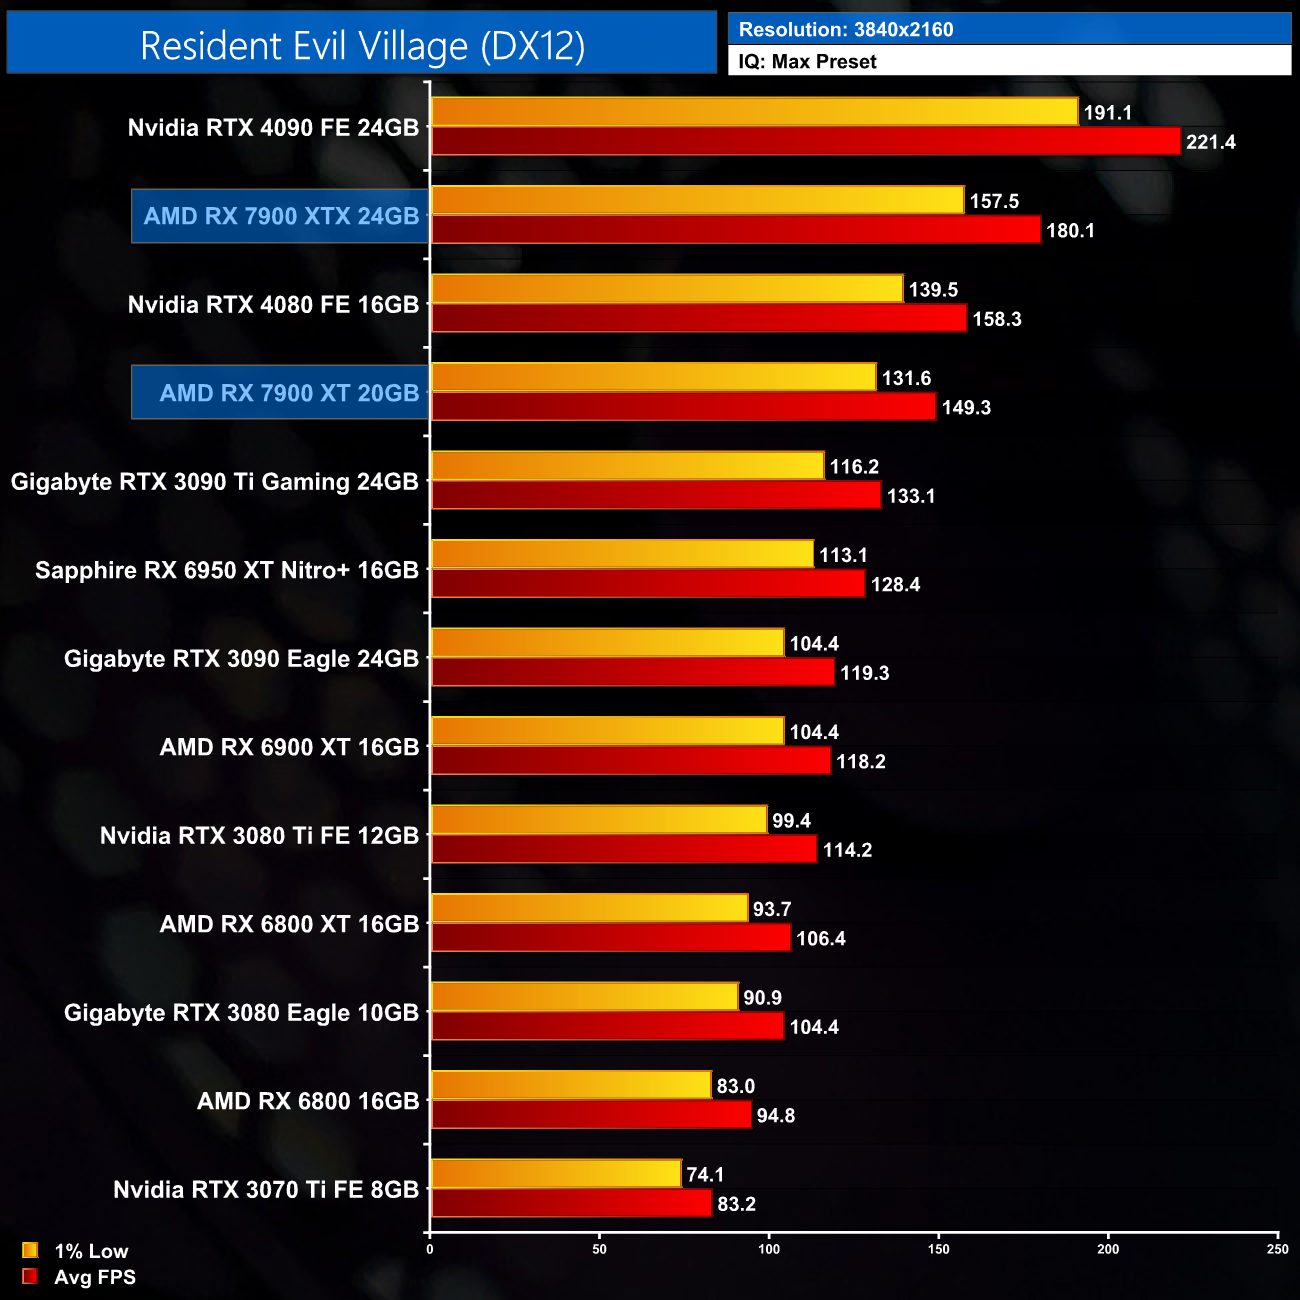
Resident Evil Village is another strong performer for the RX 7900 XT, as it's within 4% of the RTX 4080 at 1440p, making it 17% faster than the 3090 Ti.
Stepping up to 4K sees the RTX 4080 pull away slightly, as the 7900 XT is now 6% slower, but that's still a good result, and it's hard to argue with almost 150FPS at the UHD resolution.
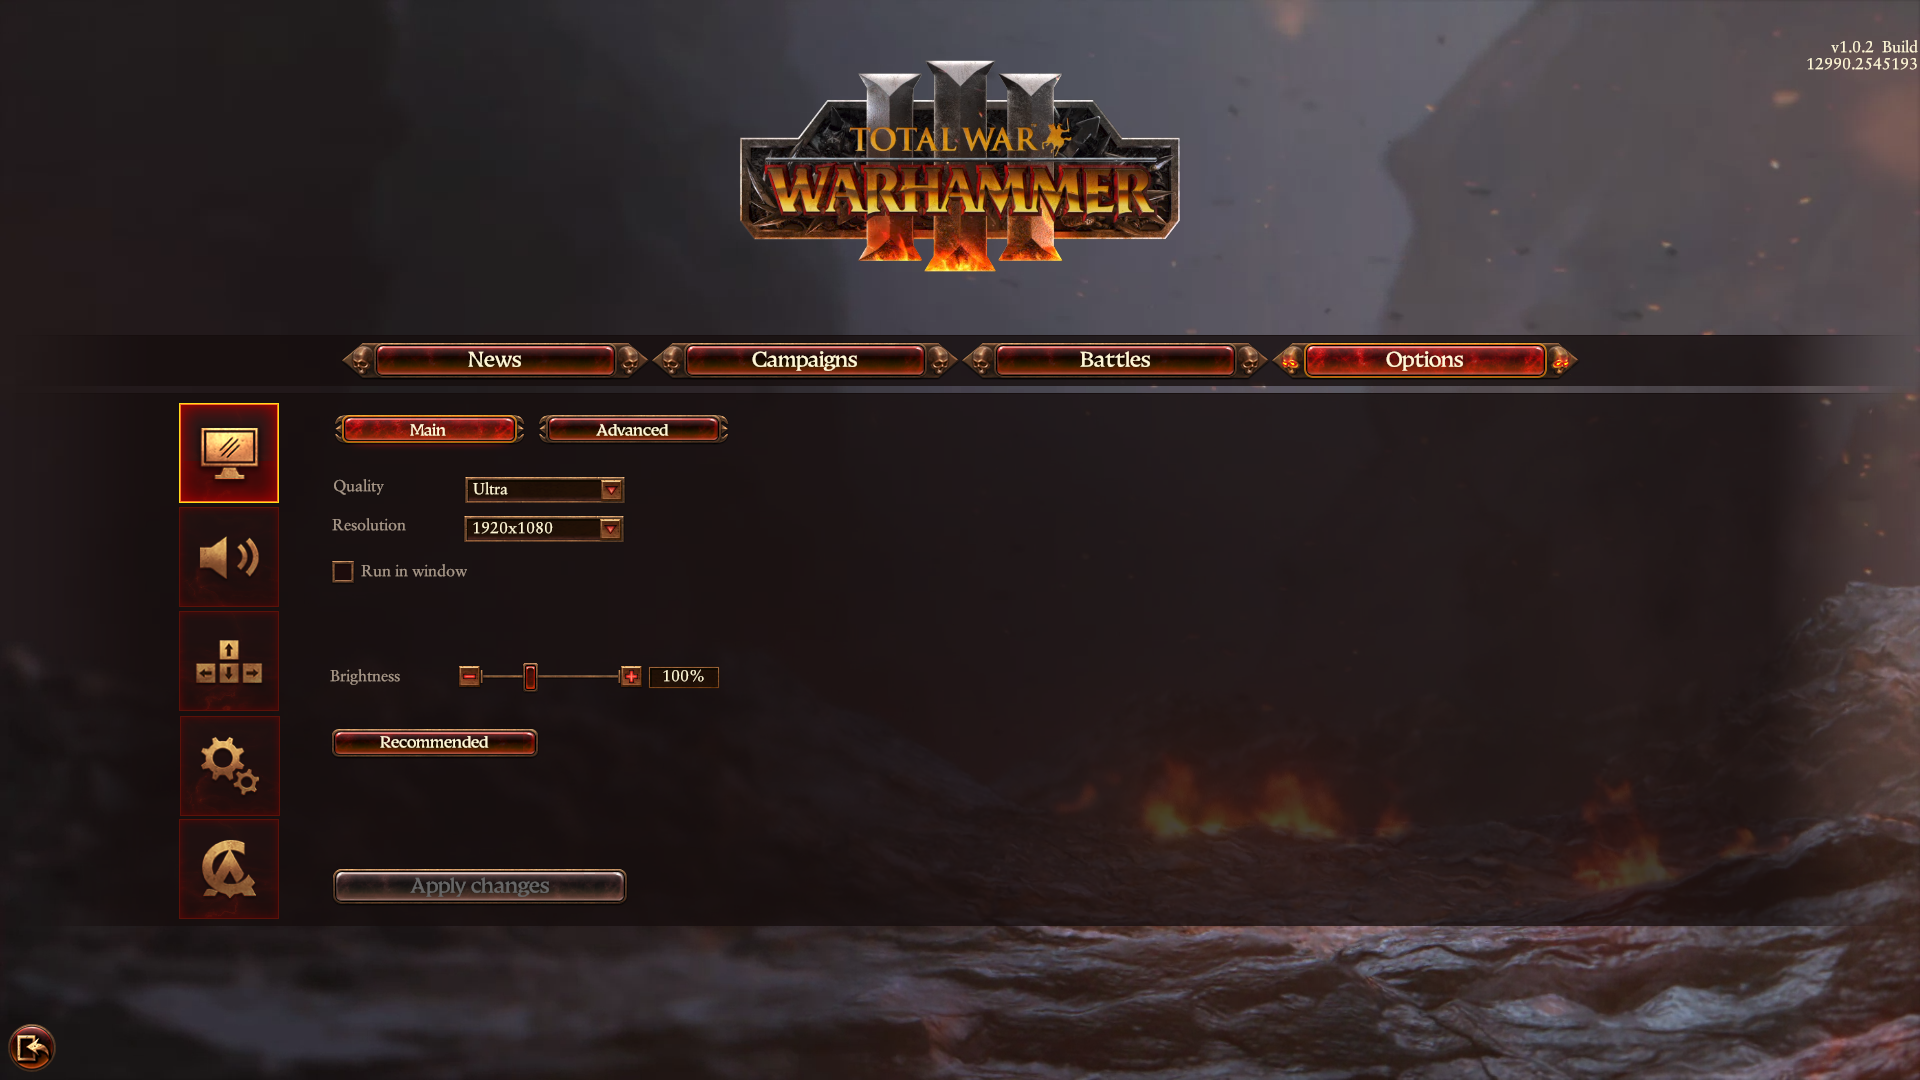
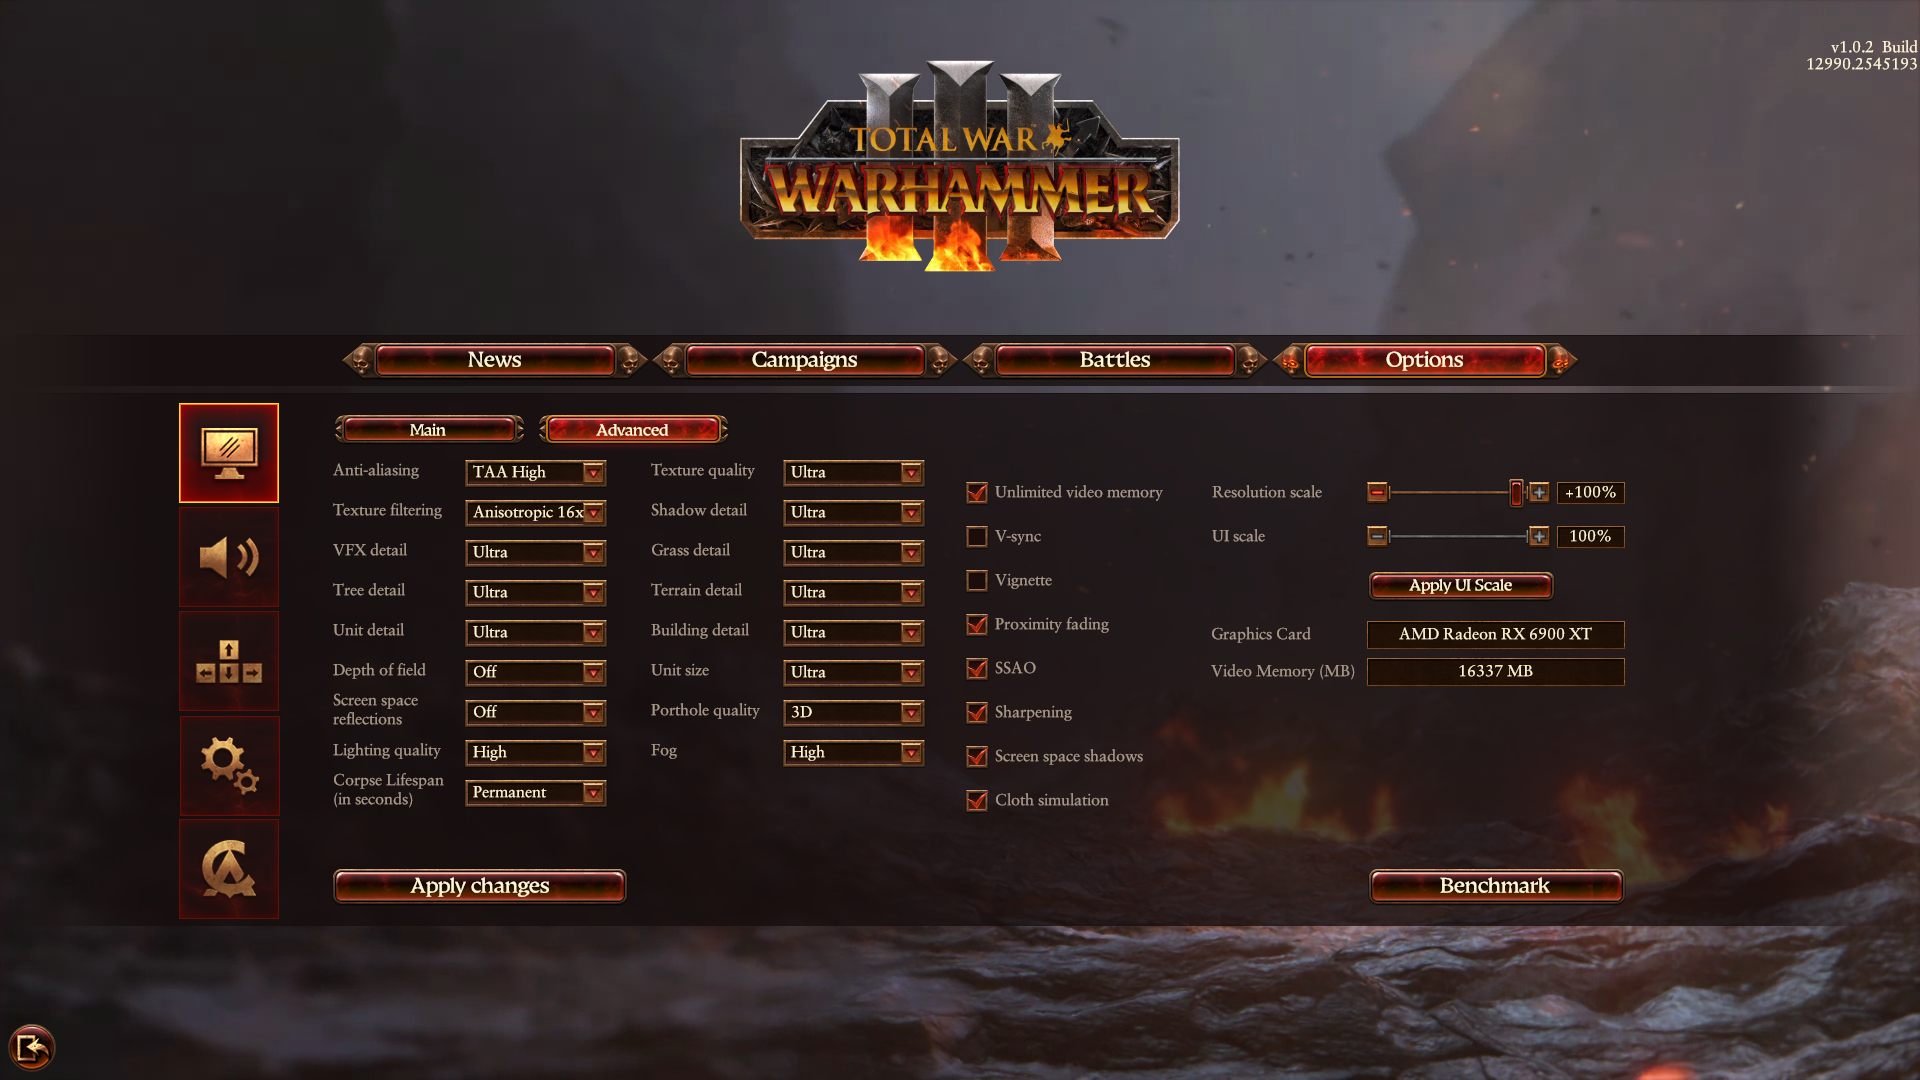
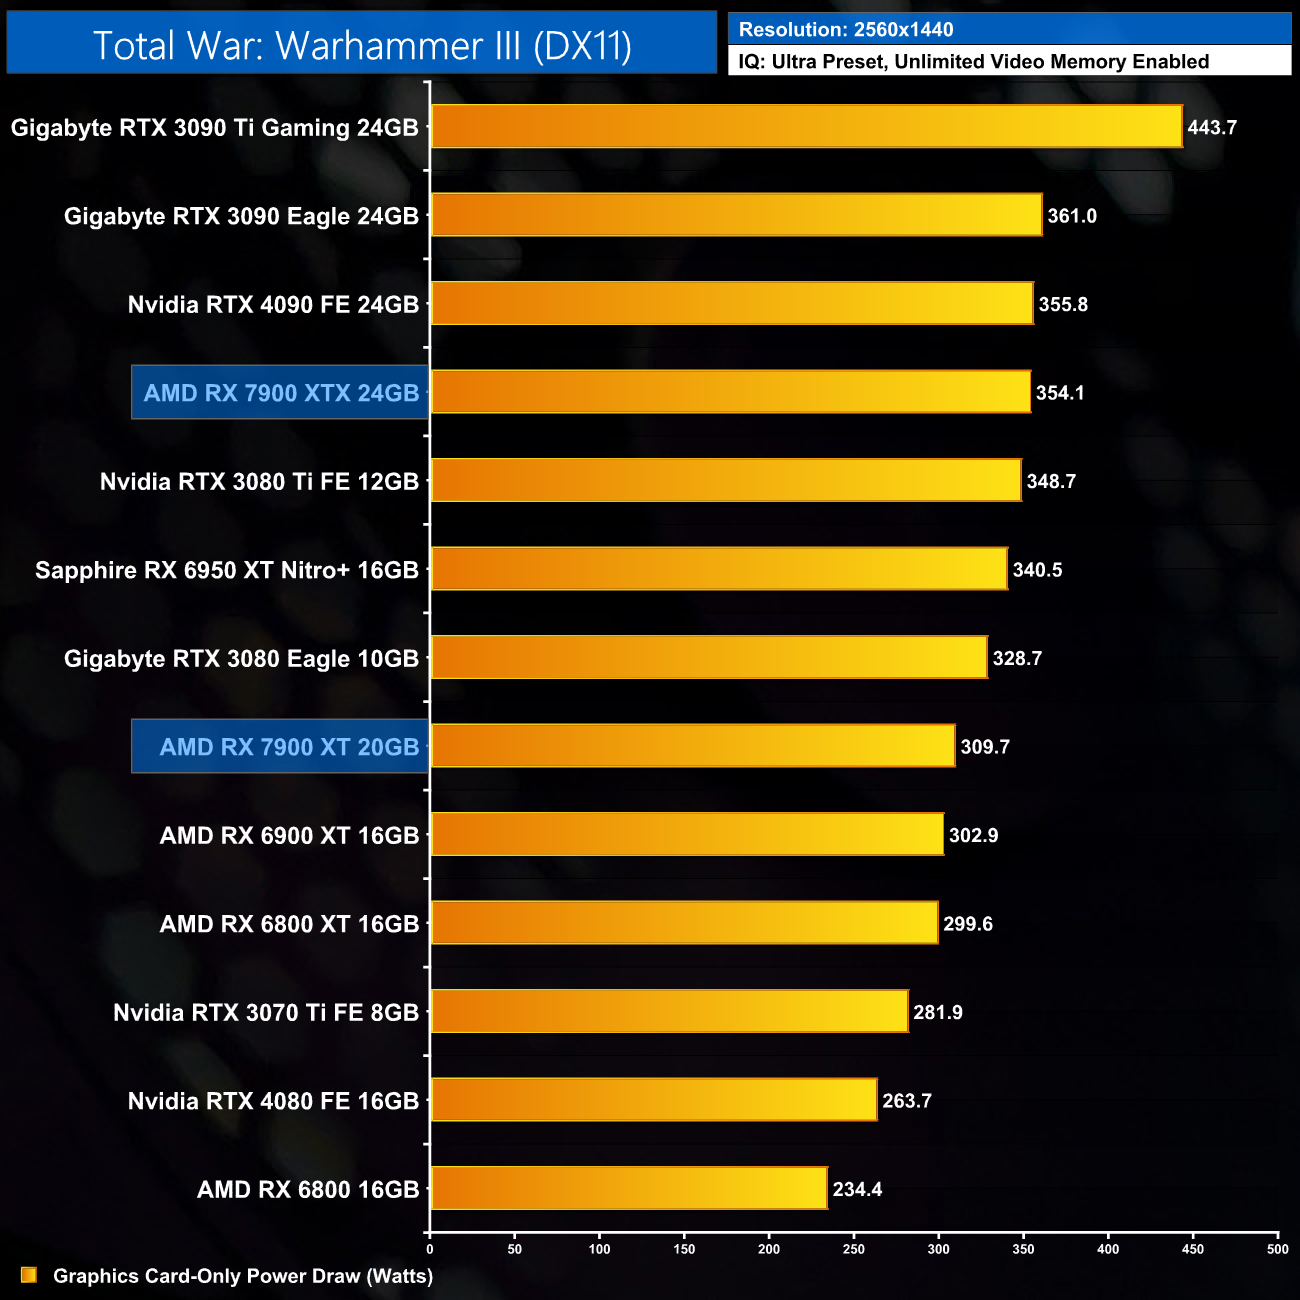
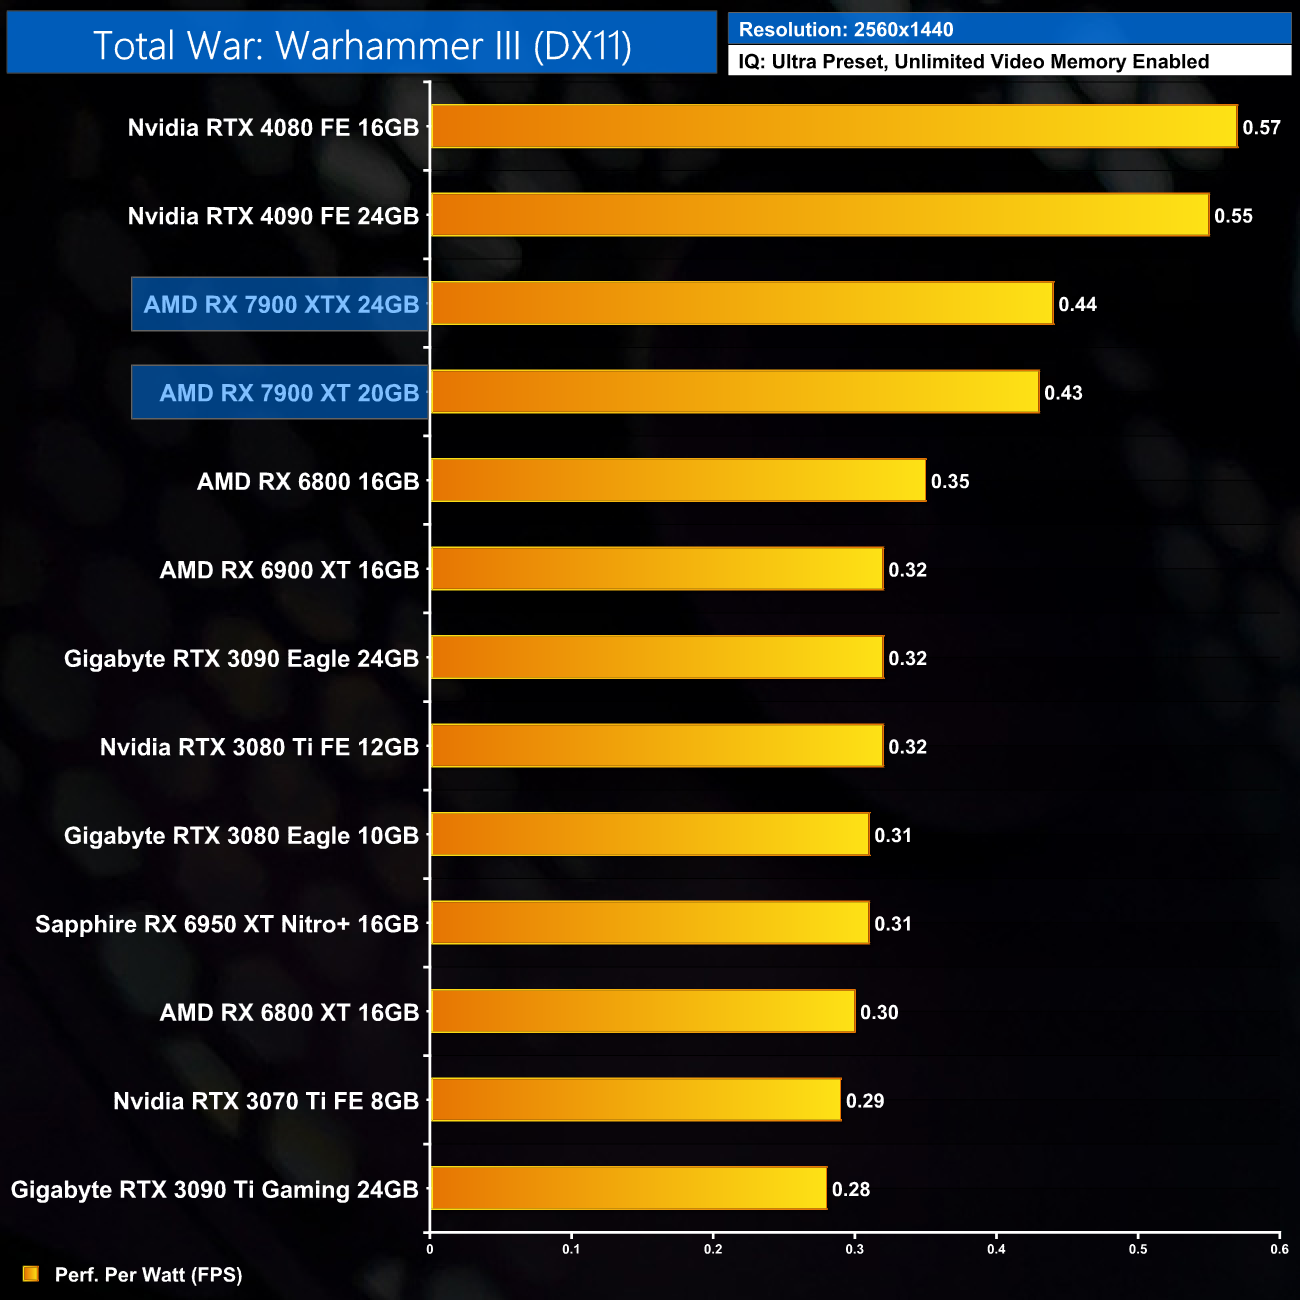
Total War: Warhammer III is a turn-based strategy and real-time tactics video game developed by Creative Assembly and published by Sega. It is part of the Total War series, and the third to be set in Games Workshop's Warhammer Fantasy fictional universe (following 2016's Total War: Warhammer and 2017's Total War: Warhammer II). The game was announced on February 3, 2021 and was released on February 17, 2022.(Wikipedia).
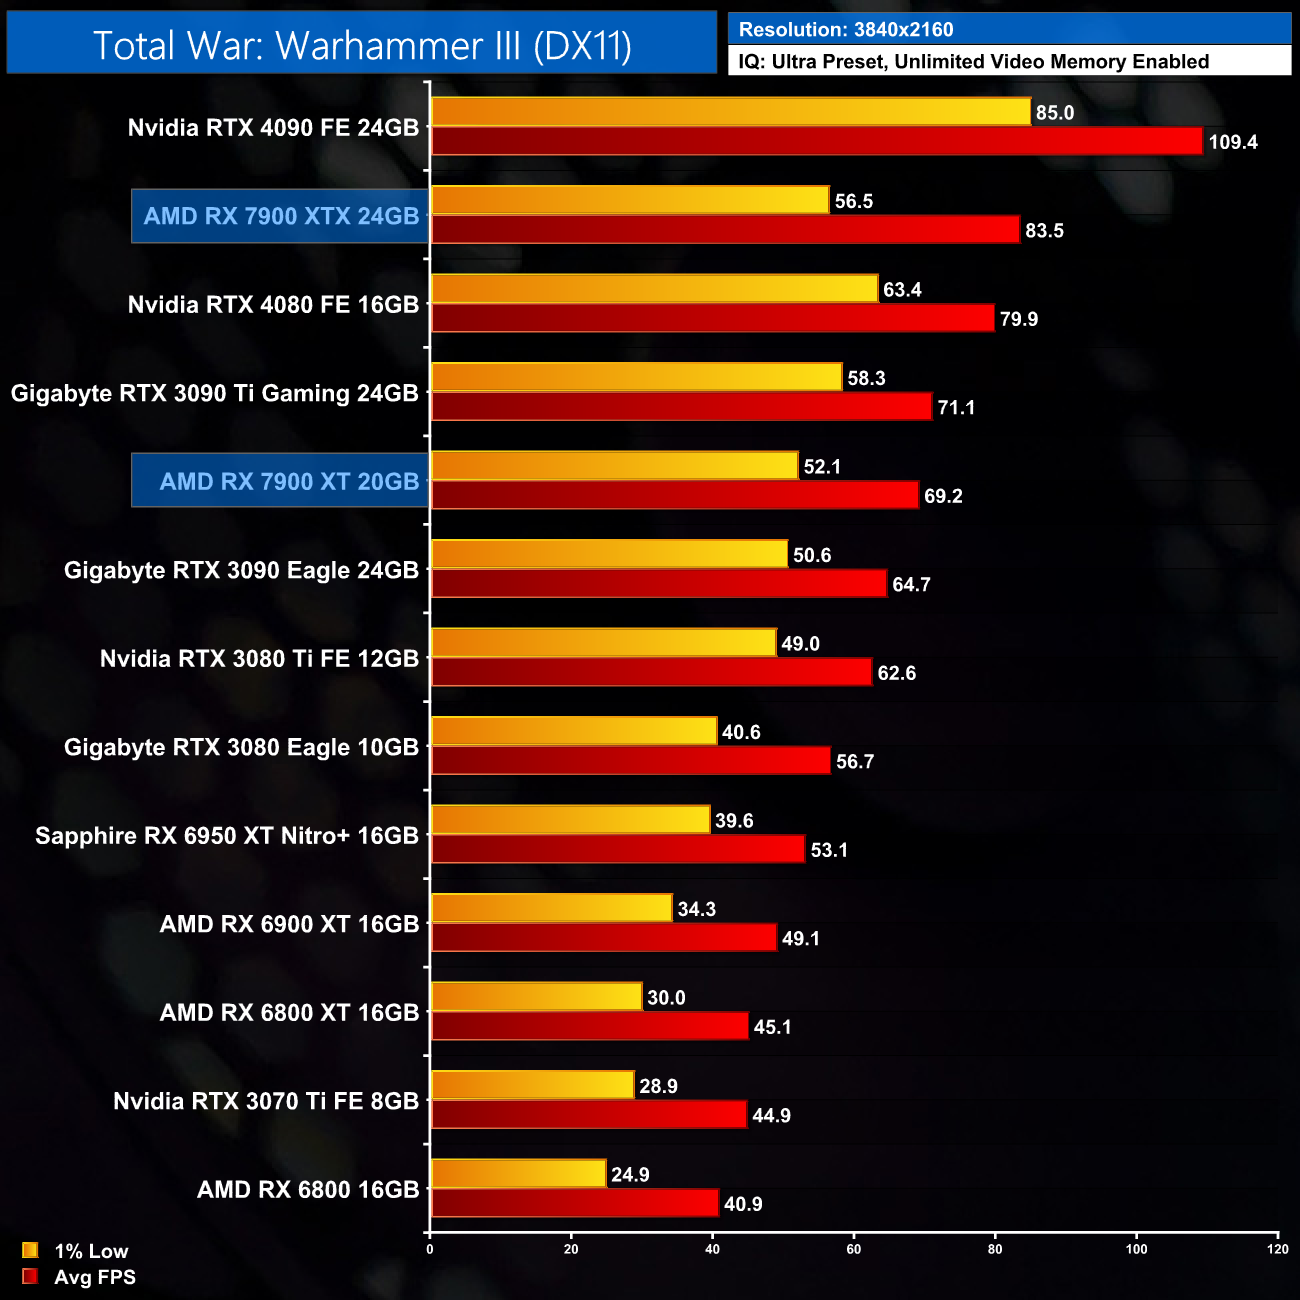
Engine: TW Engine 3 (Warscape). We test using the Ultra preset, with unlimited video memory enabled, DX11 API.

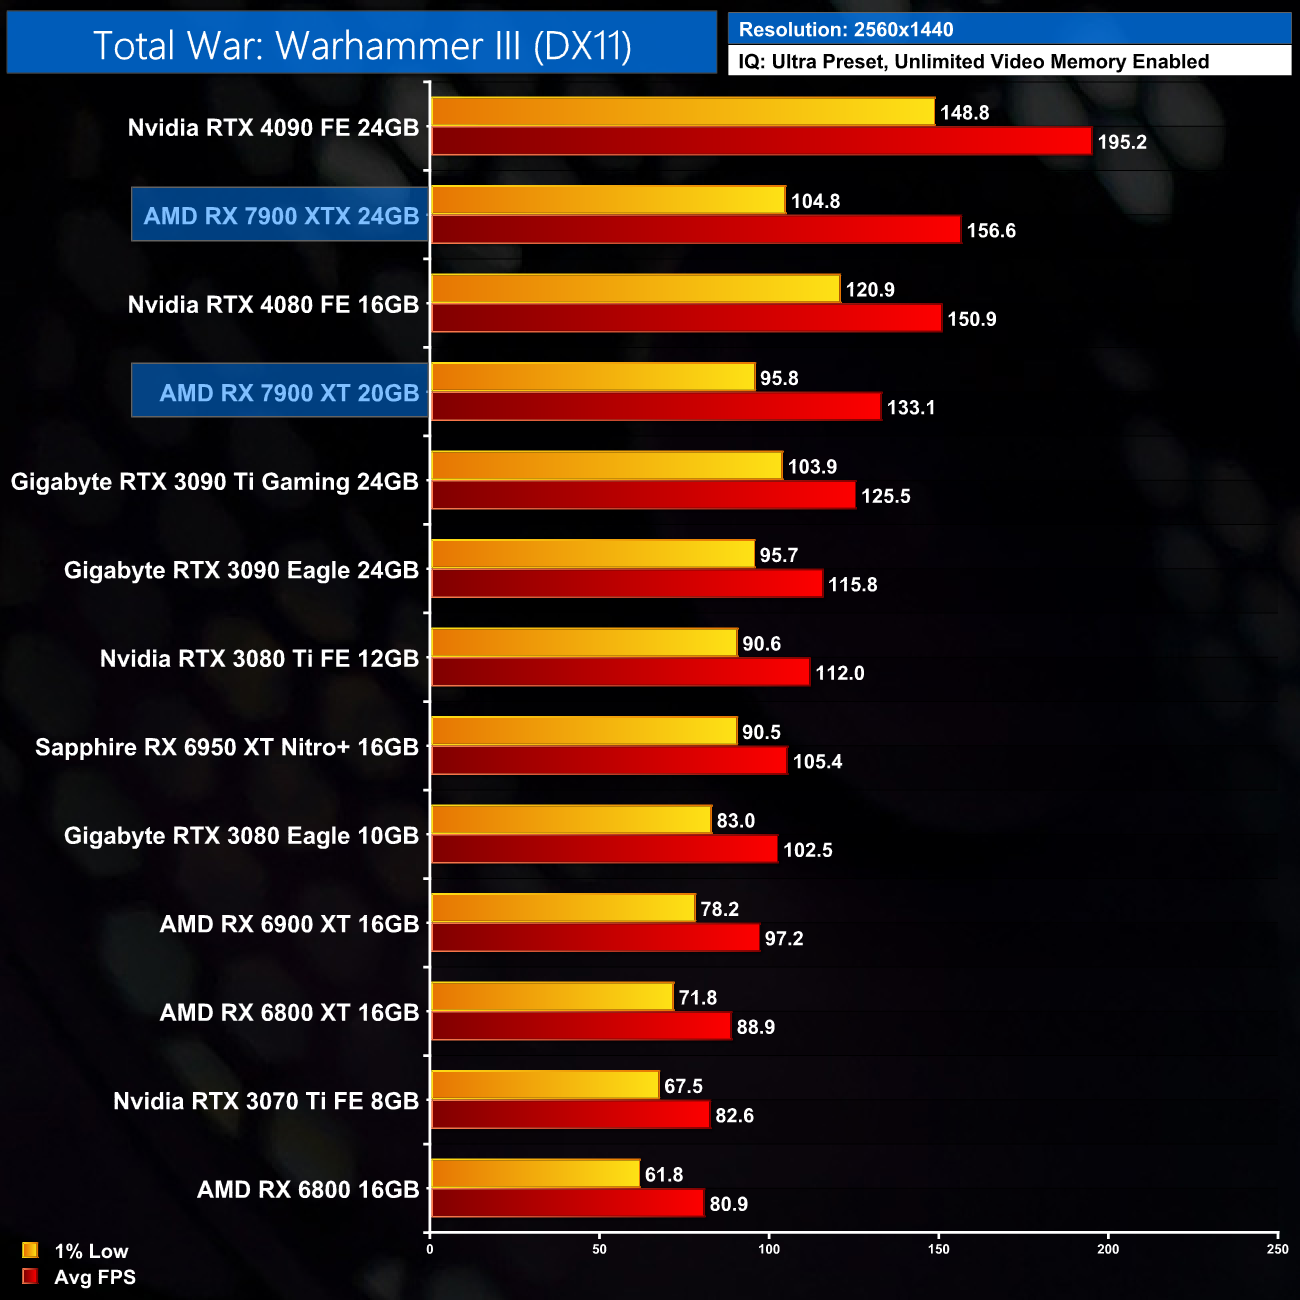
Lastly, we finish with Total War: Warhammer III. At 1440p the 7900 XT delivers a solid 37% uplift compared to the RX 6900 XT, though the 1% lows do lag behind the likes of the RTX 3090 Ti.
As for 4K, the 7900 XT does fall just behind the RTX 3090 Ti, but only by 3%, and it's still 31% faster than the 6900 XT.
Here we present frame rate figures for each graphics card, averaged across all 12 games on test today. These figures can disguise significant variations in performance from game to game, but provide a useful overview of the sort of performance you can expect at each resolution tested.
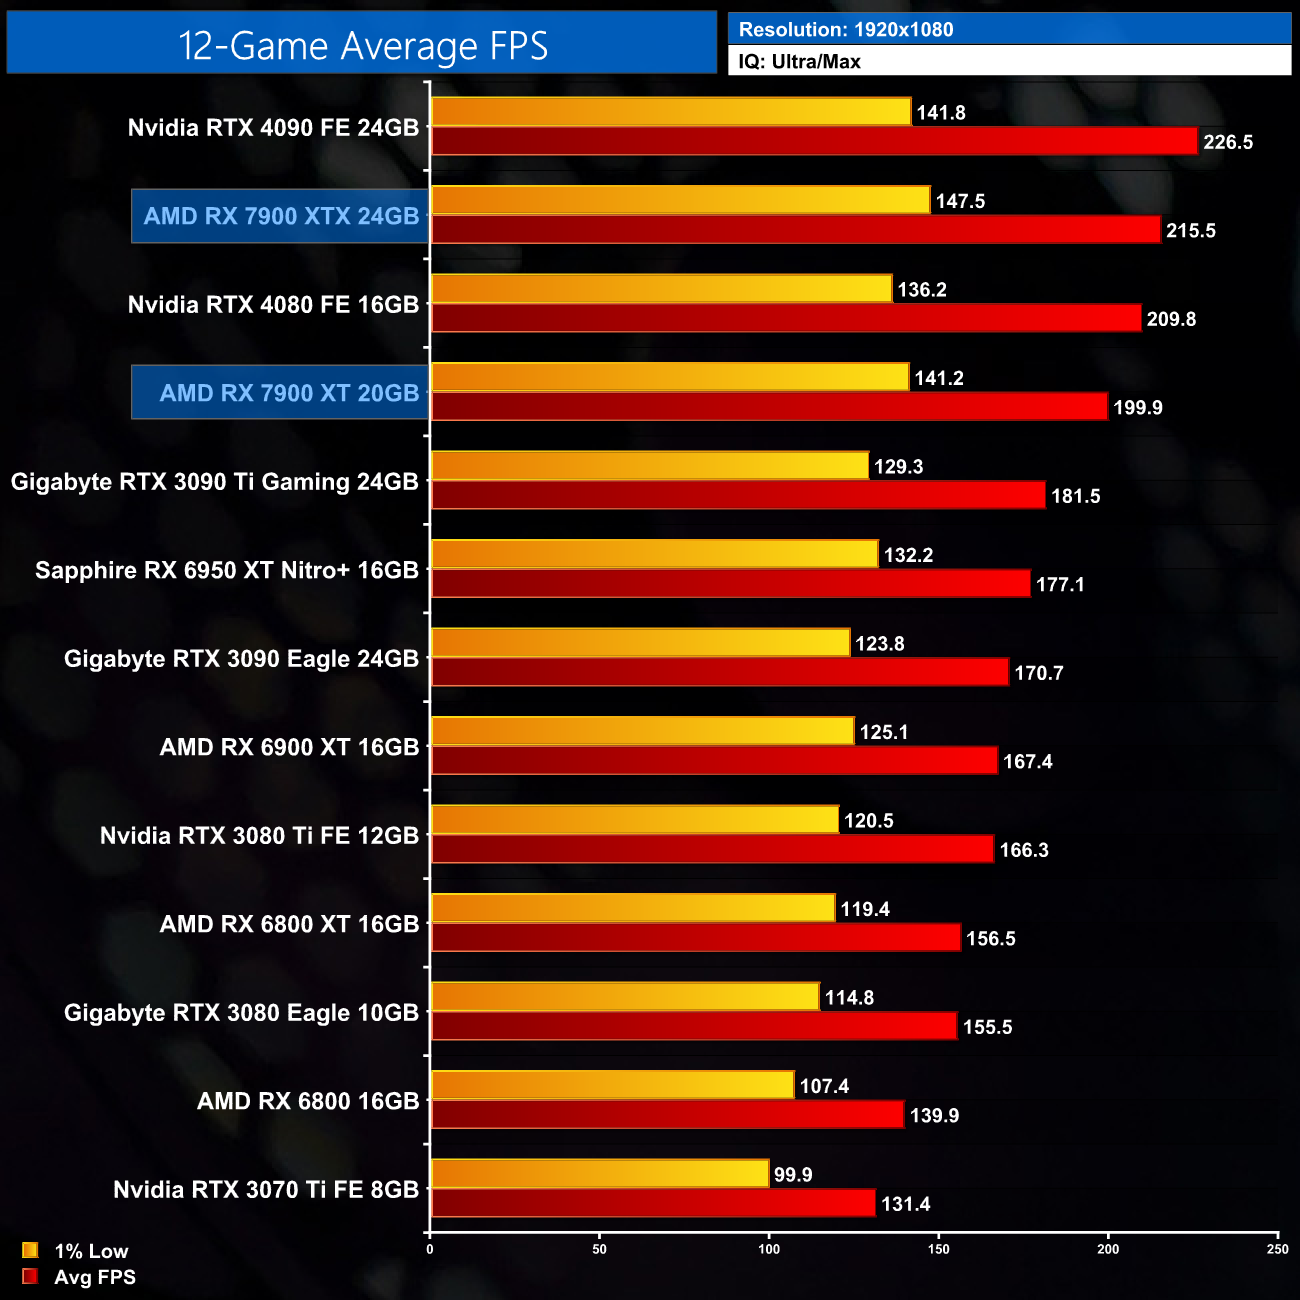
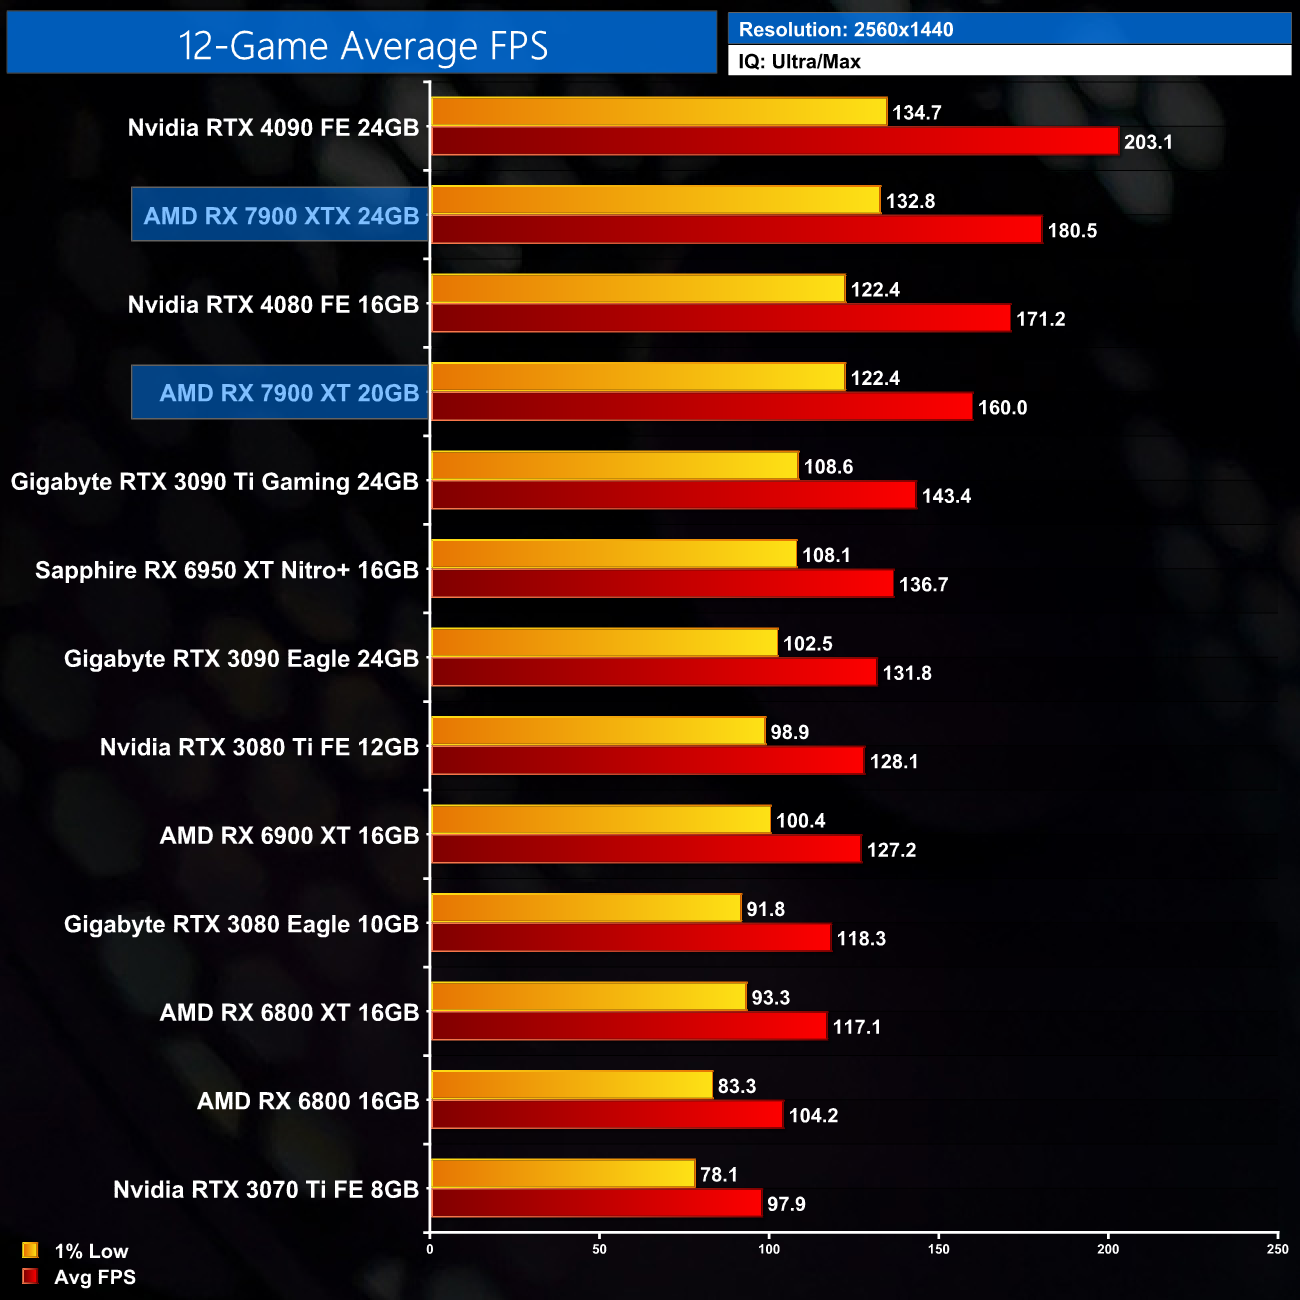
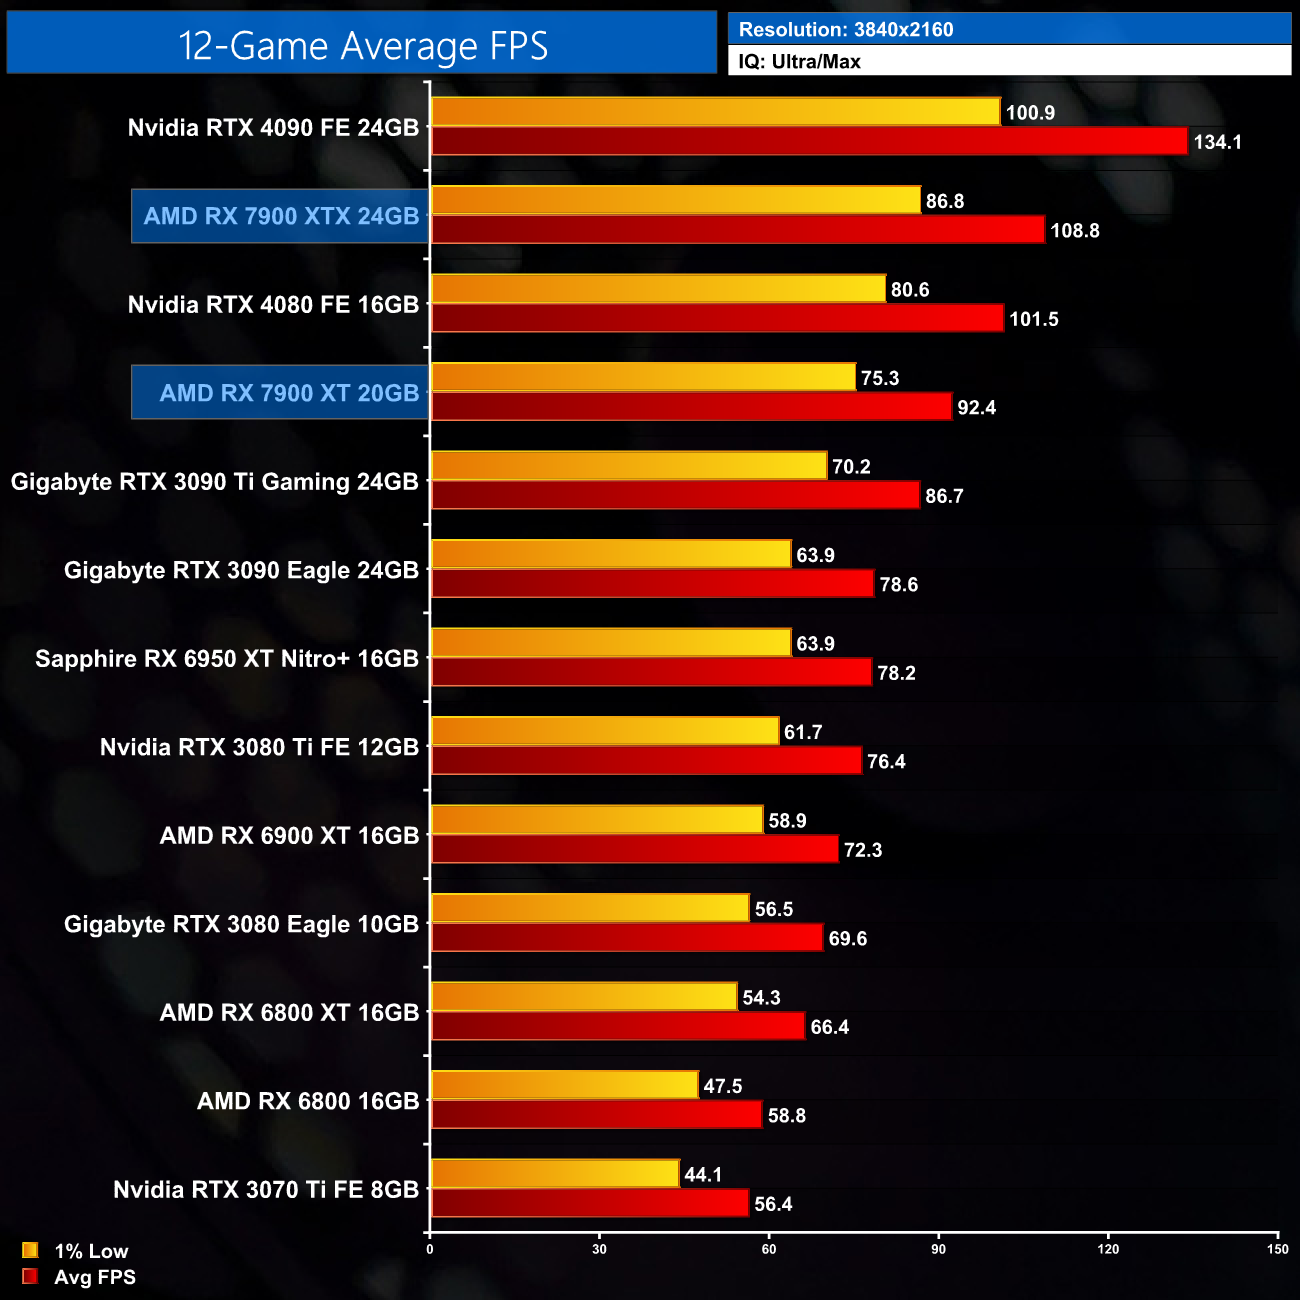
After finishing the per-game results, we can take a look at our 12-game average figures. At 1440p, the RX 7900 XT delivered exactly 160FPS on average, making it 11% slower than its XTX sibling. It's 7% slower than the RTX 4080, 12% faster than the RTX 3090 Ti and 26% faster than the RX 6900 XT.
At 4K, it does fall further behind the XTX, as the XT proves to be 15% slower on average. It's also now 9% behind the RTX 4080, while proving 7% faster than the 3090 Ti and 28% faster than its predecessor, the 6900 XT.
The MSRPs
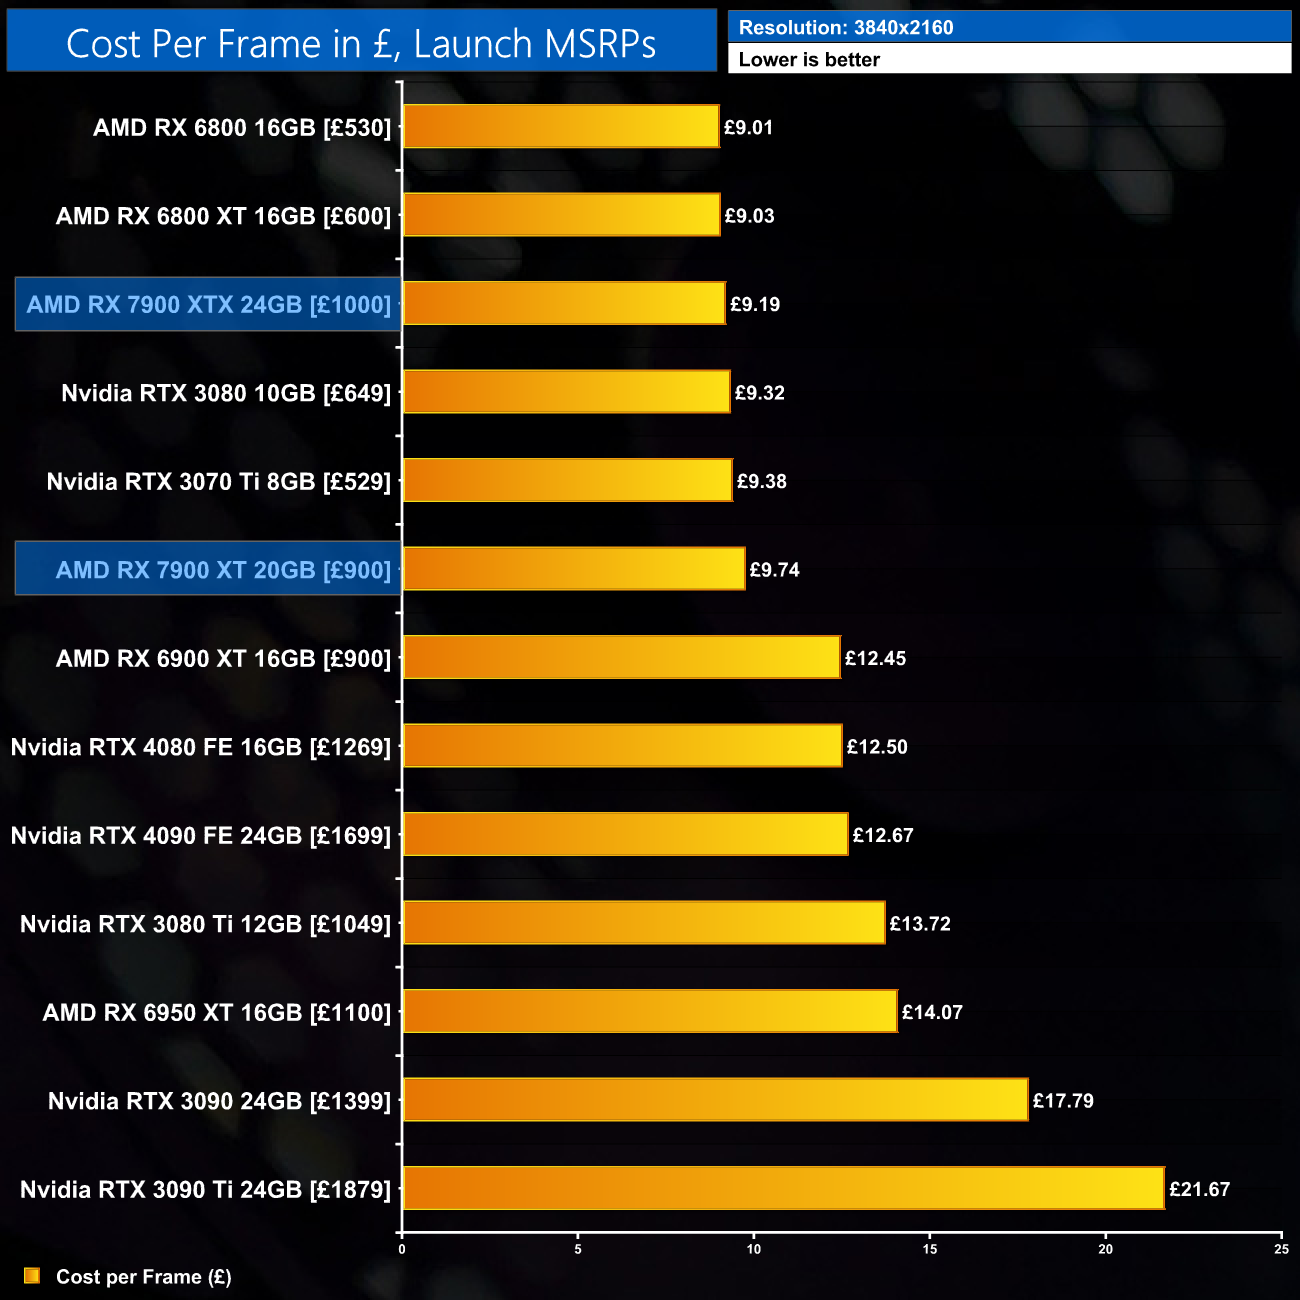
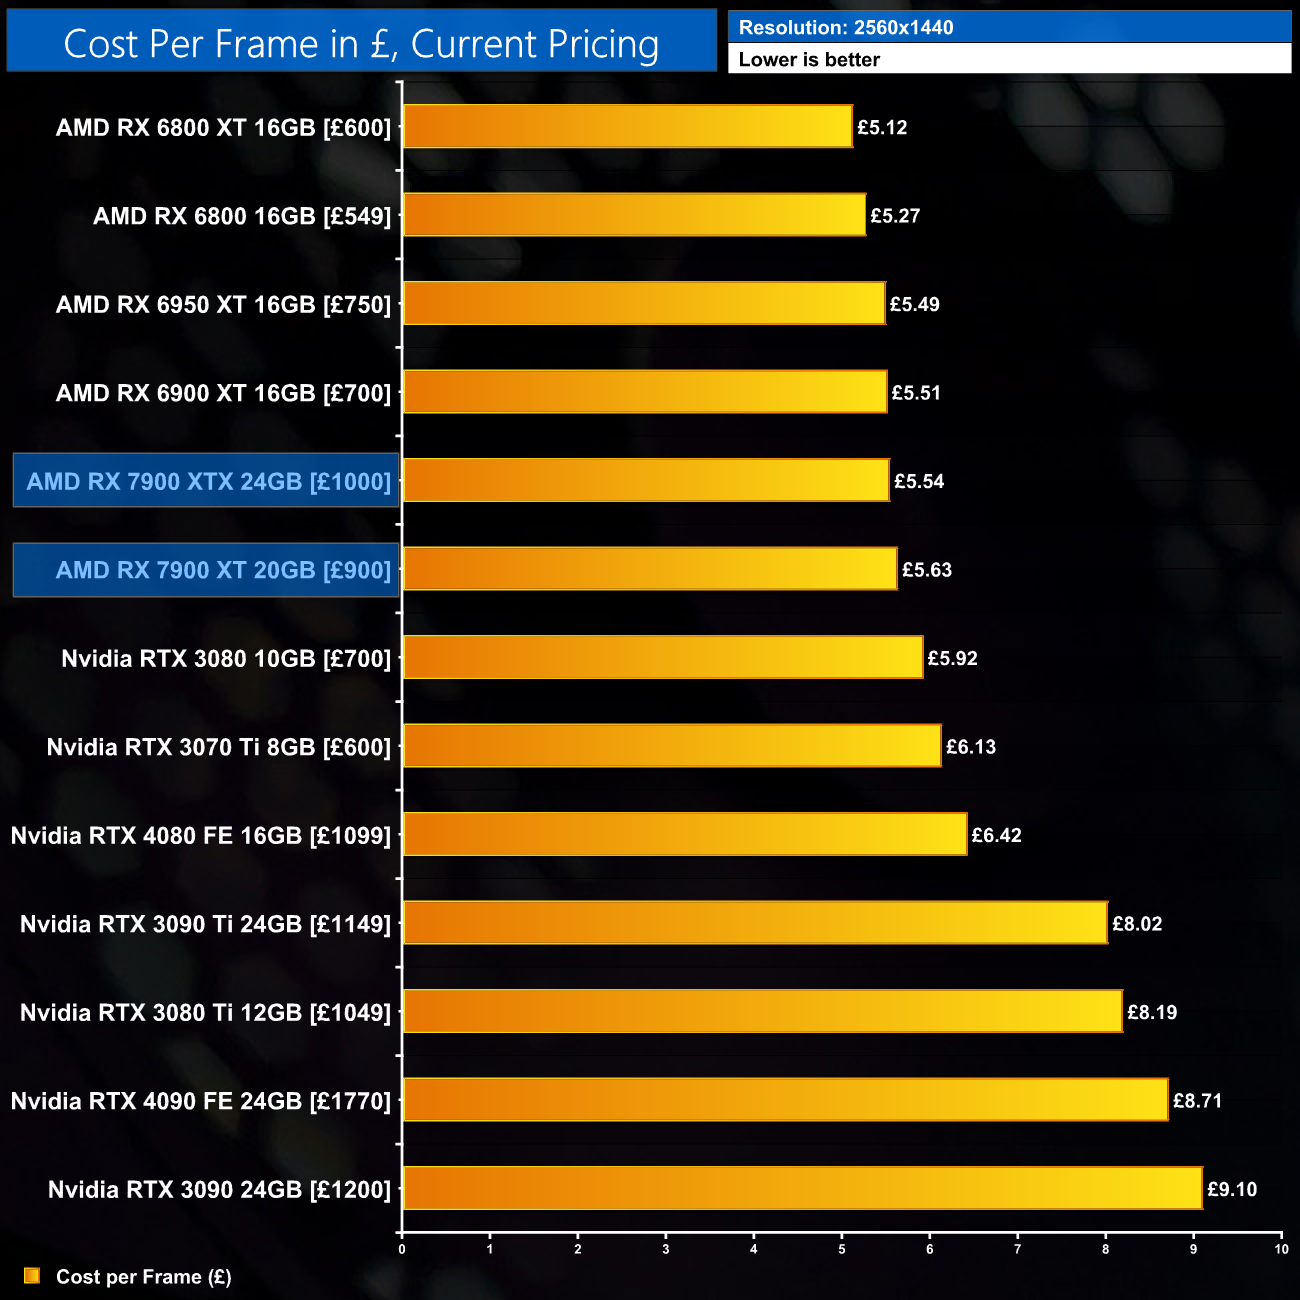
Using the average frame rate data presented earlier in the review, here we look at the cost per frame using the UK MSRP launch prices for each GPU.
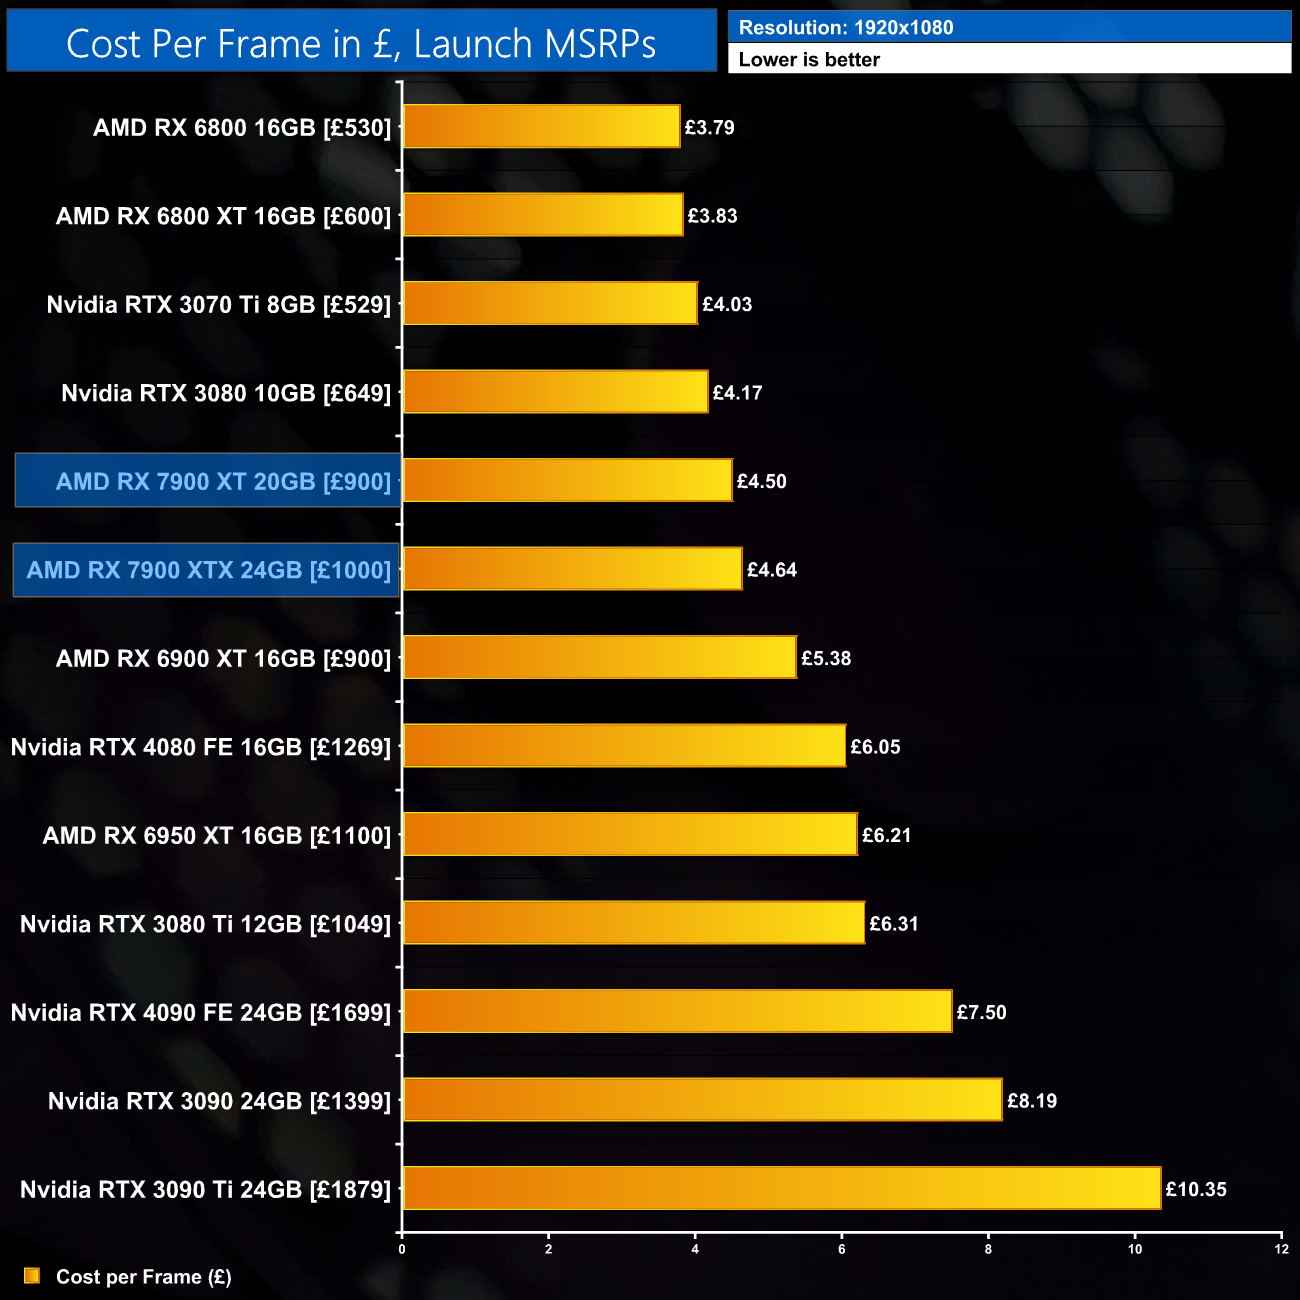
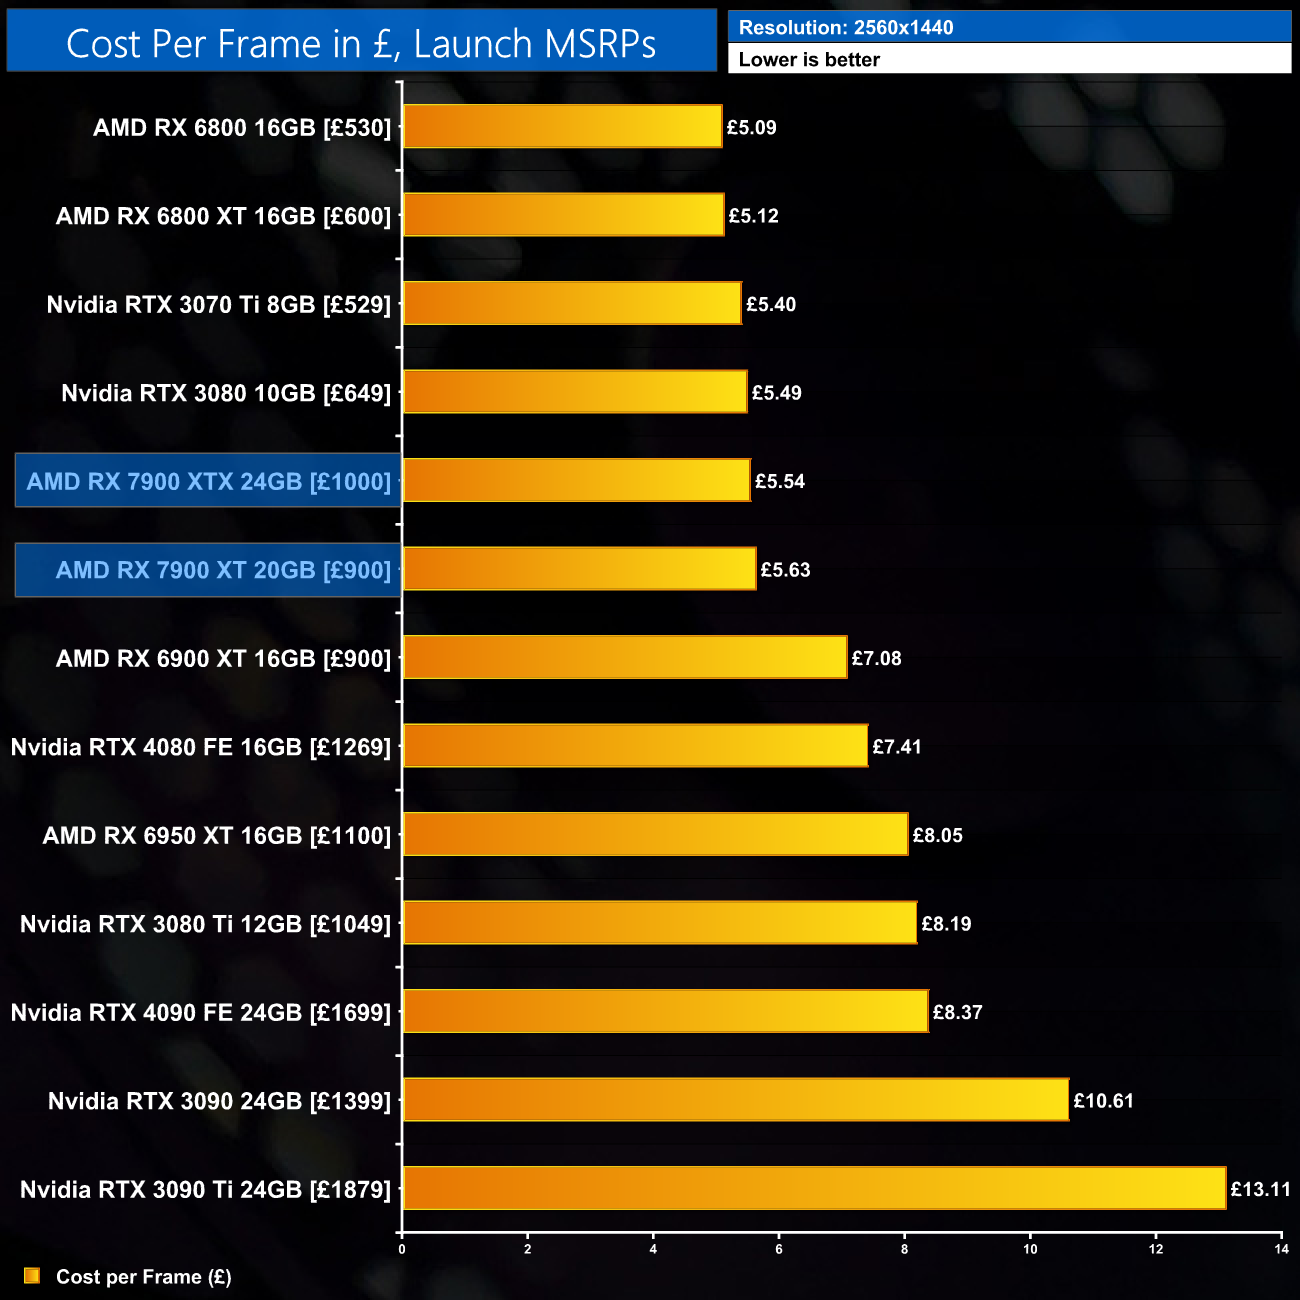
In terms of cost per frame, at 1440p the 7900 XT comes in at £5.63. This is actually worse value than the more expensive XTX model, not something we typically see and it's certainly not what you want to see from a cheaper component. The 7900 XT is still an improvement on the 6900 XT, offering a 22% reduction in cost per frame. It's around the same level as the last-gen RTX 3080 10GB.
At 4K, the gap between the XT and the XTX widens, and not in the way you'd want – the XT is 6% more expensive per frame. It's still 22% better value than the 6900 XT using MSRP pricing.
Current retail pricing


Based on current pricing however, things are less appealing 7900 XT. At 1440p for instance, its overall value is a match for the RX 6900 XT and 6950 XT, both of which can now be found well below MSRP.
Likewise at 4K, this is very much a continuation of last-gen value – it's more continuation, rather than progression.
Here we test Cyberpunk 2077, using the Ray Tracing: Ultra preset. DLSS/FSR are disabled.
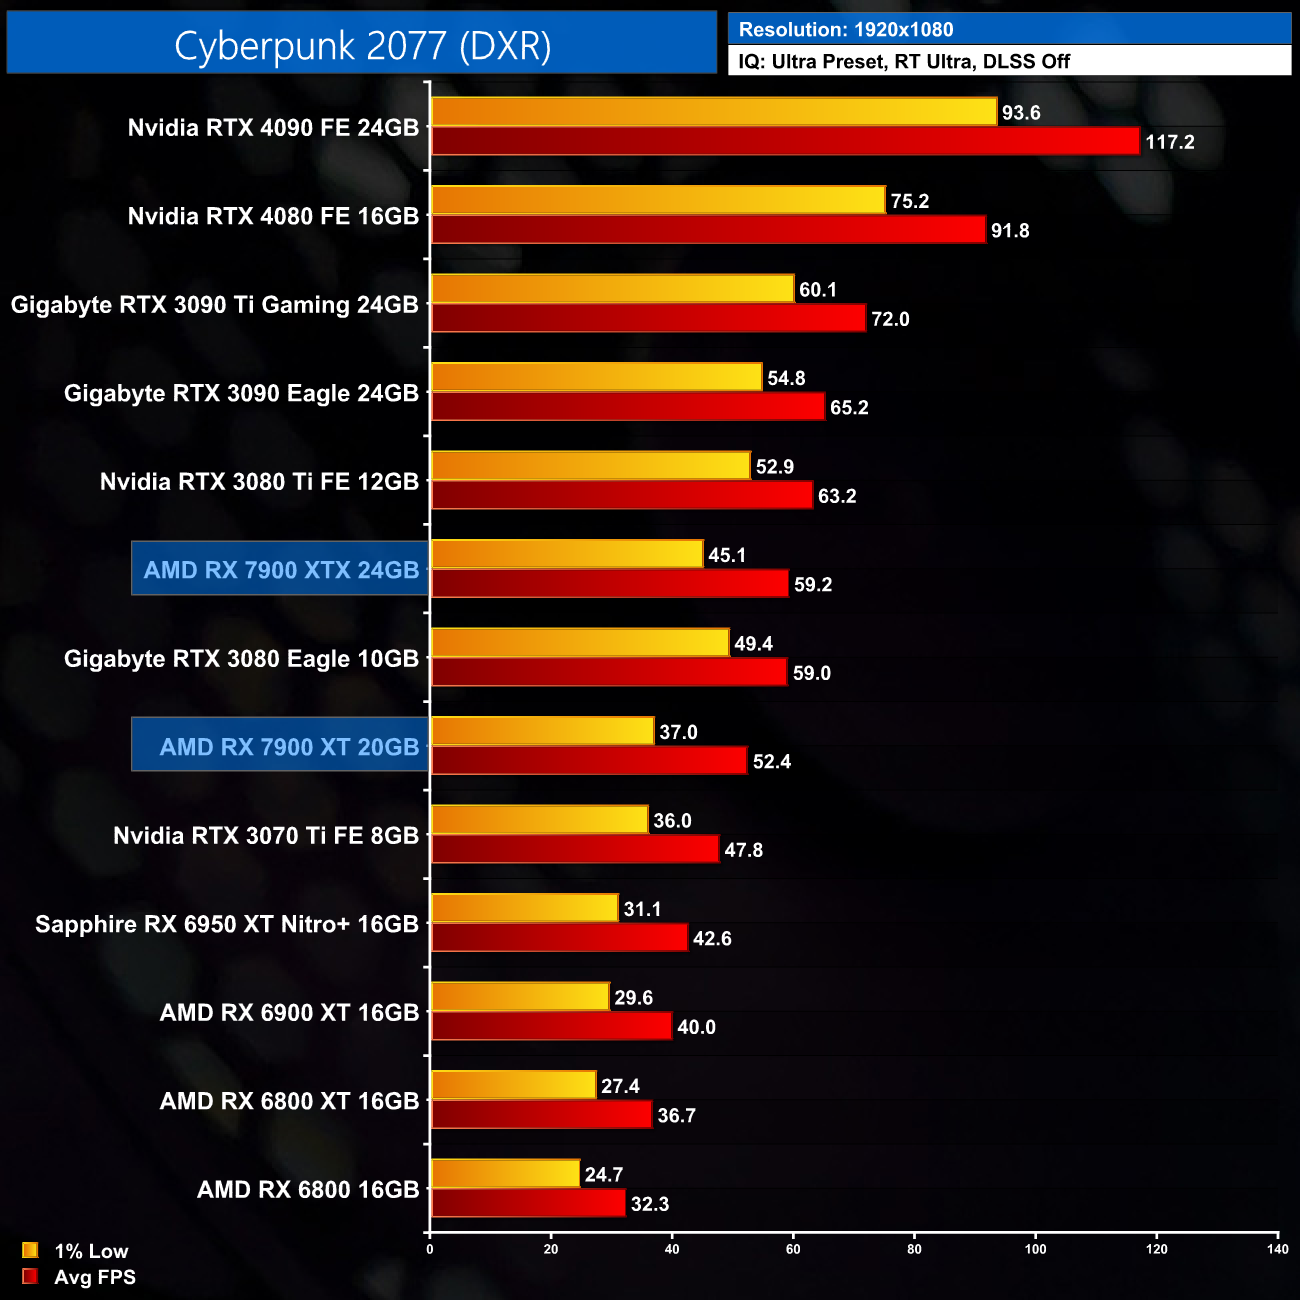
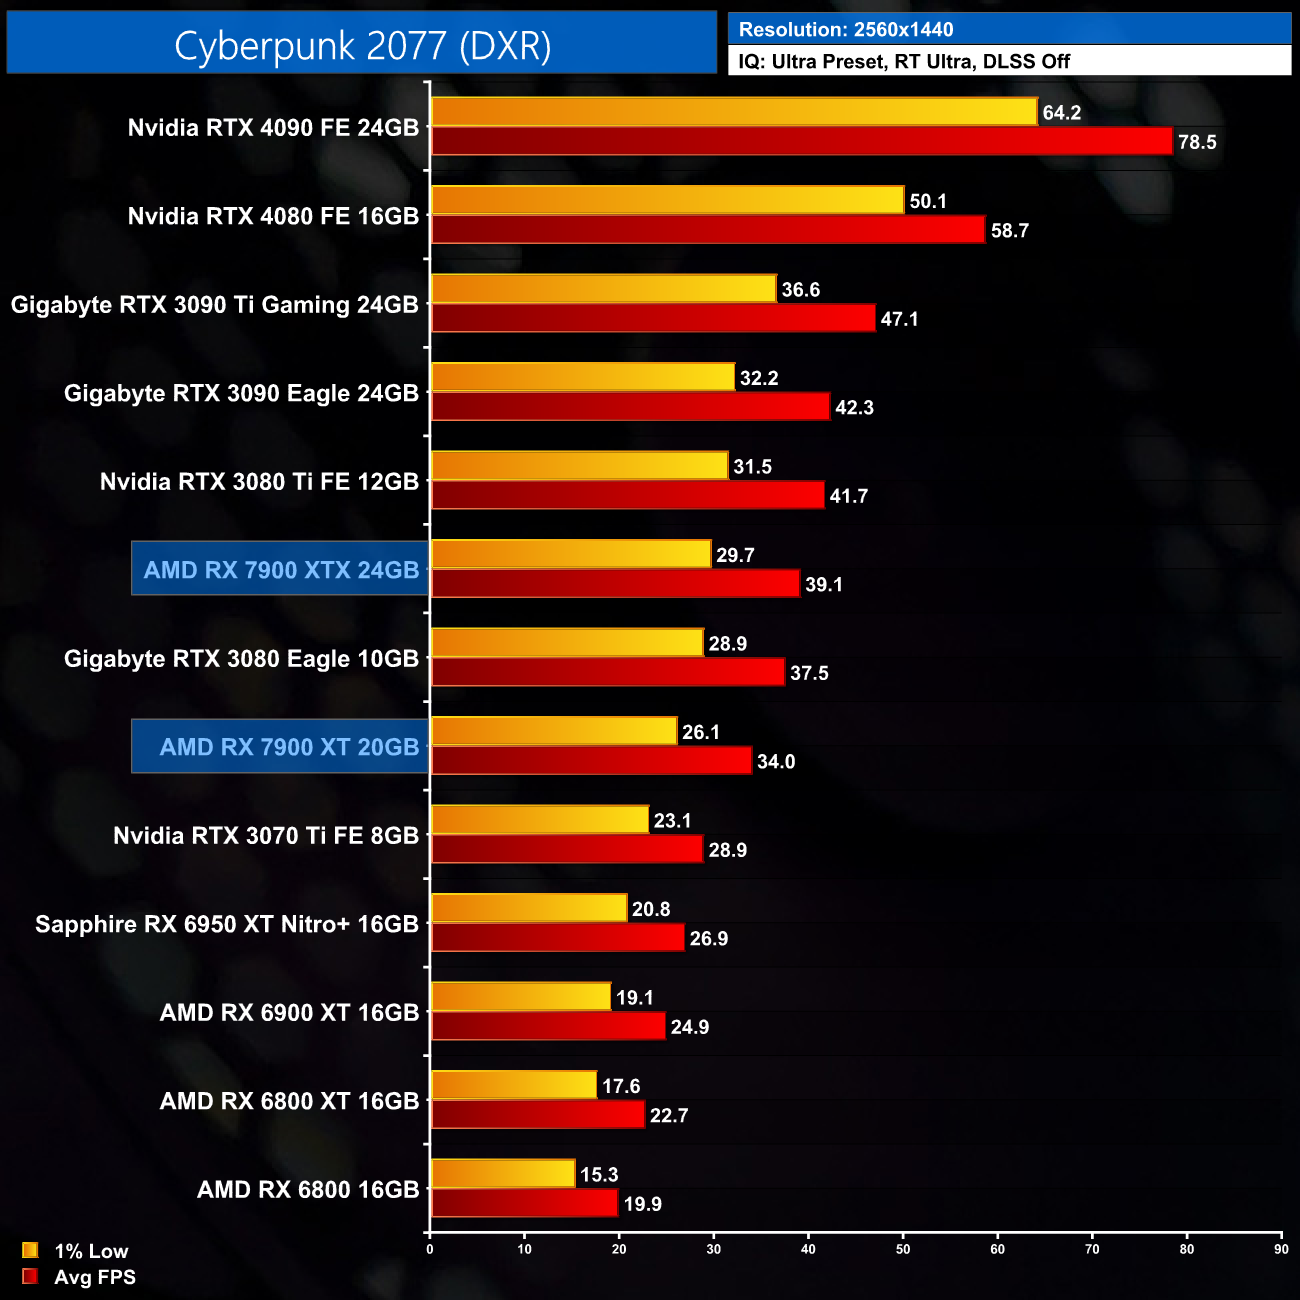

Moving onto look at ray tracing performance, Cyberpunk 2077 is a tough ask for any DXR-capable GPU, and at 1440p the RX 7900 XT can't maintain a frame rate above 30FPS, with the 1% lows hitting 26FPS. It's slightly worse than an RTX 3080 10GB here.
Of course that means 4K is a no-go, though only an RTX 4090 can hold above 30FPS at this resolution.
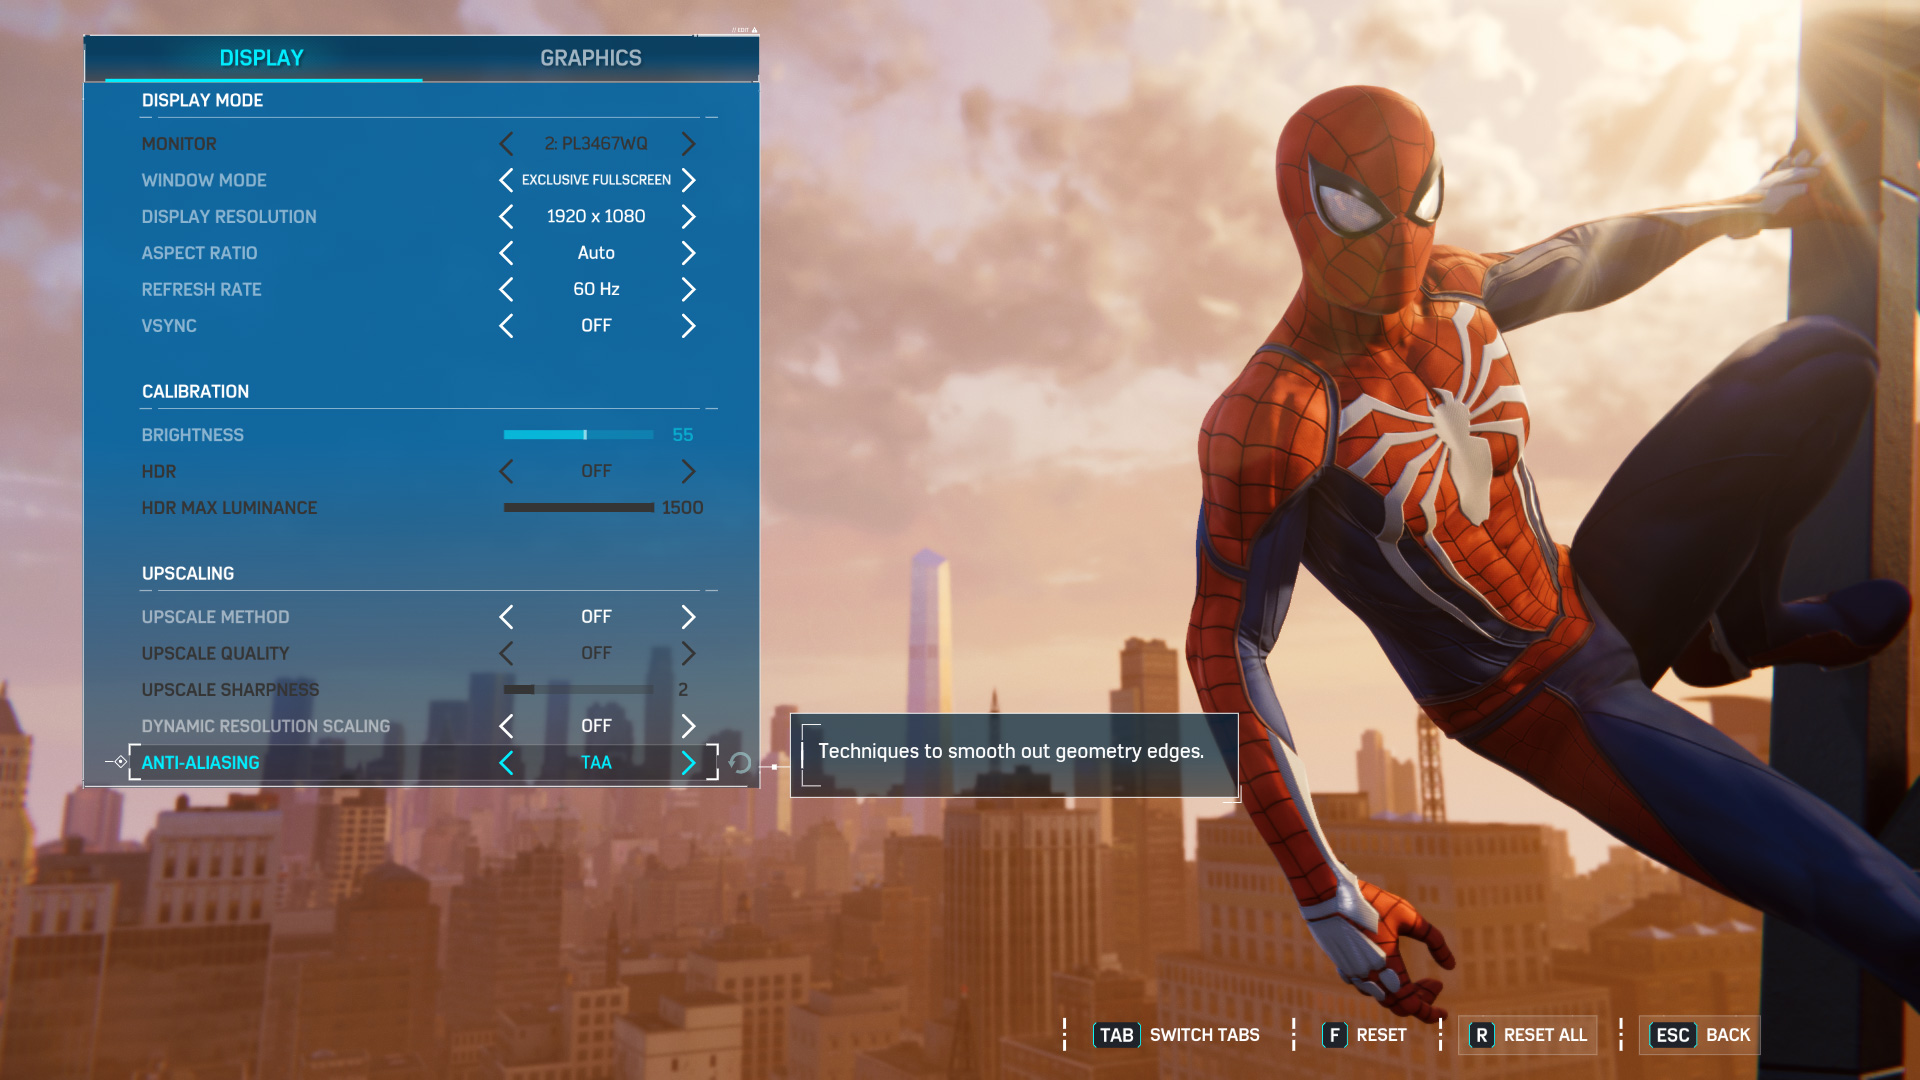
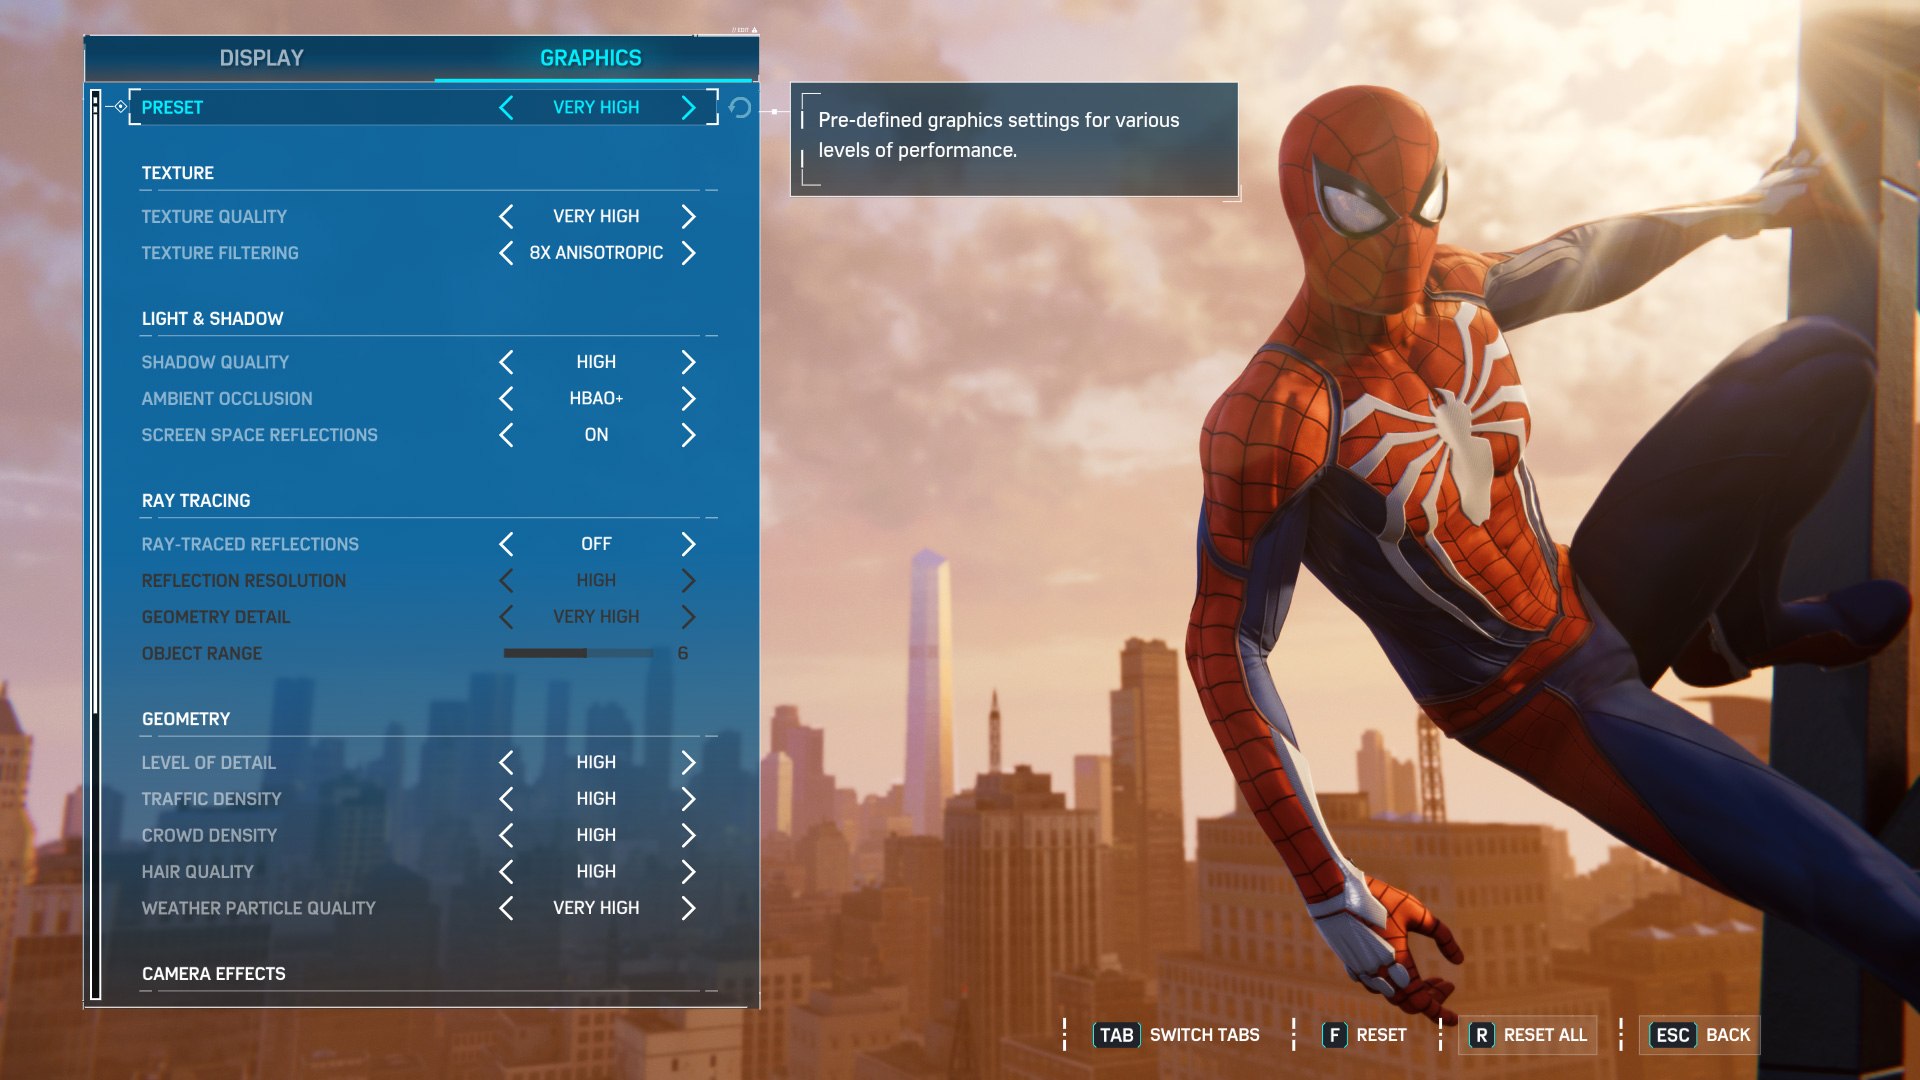
Here we test Marvel's Spider-Man Remastered, with the in-game ray tracing effects set to Very High, Object Range set to 6. DLSS/FSR are disabled.
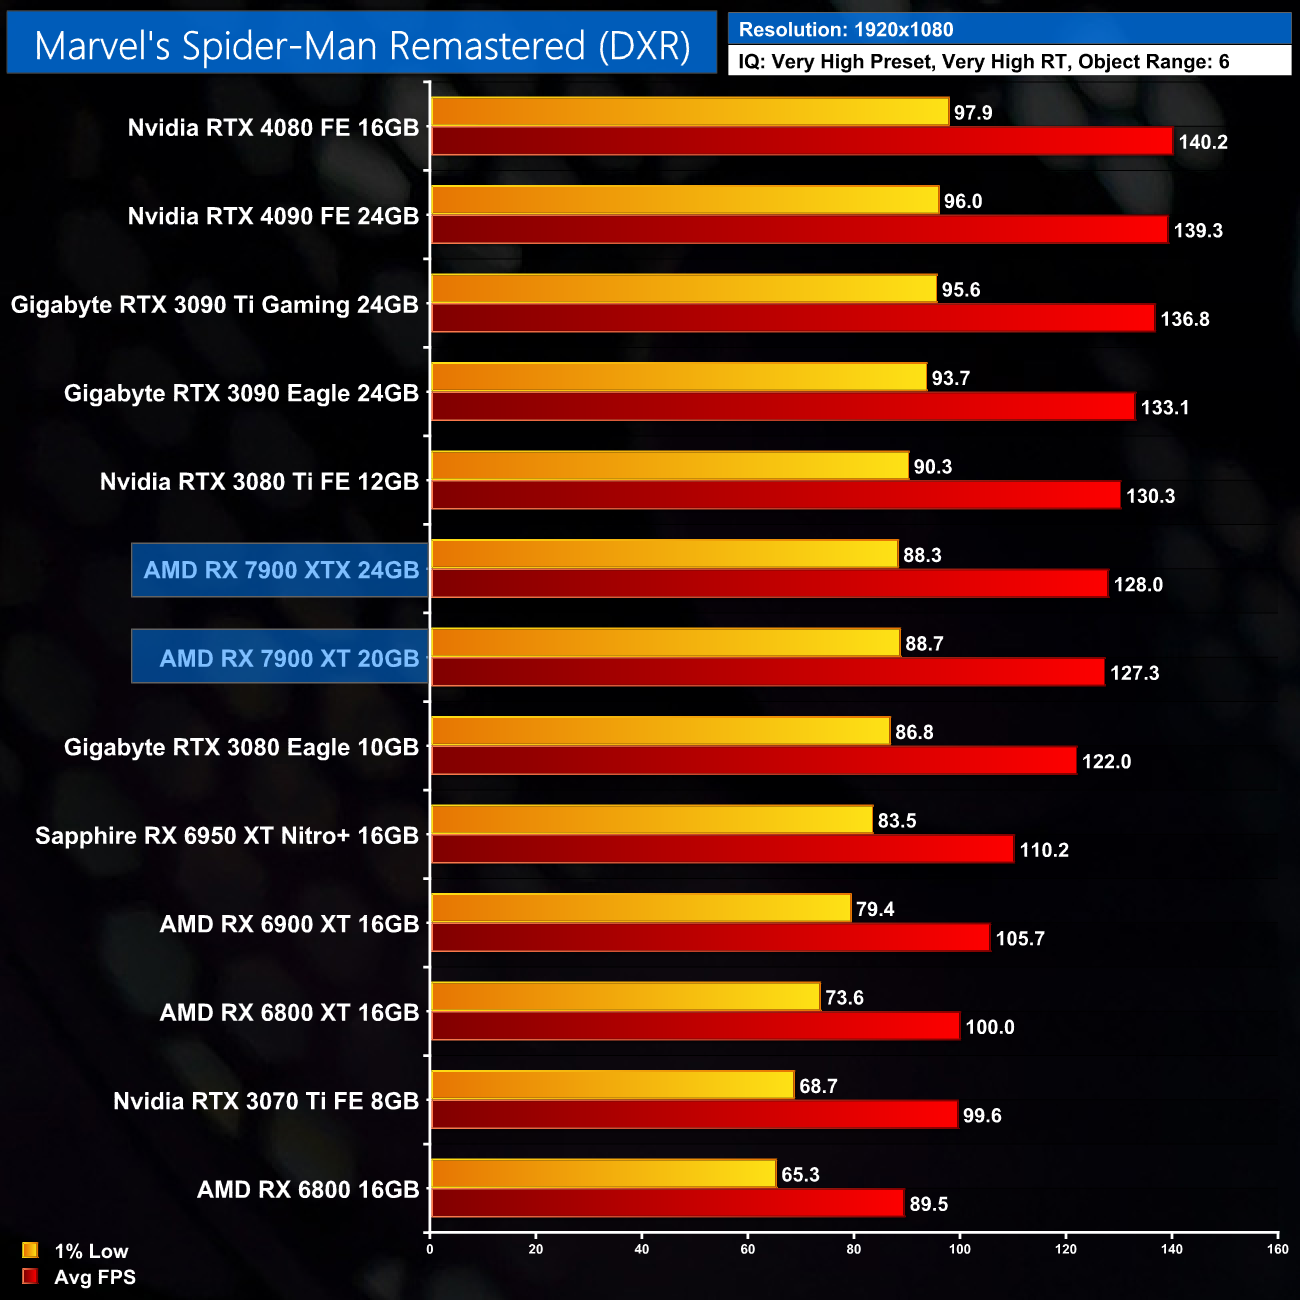
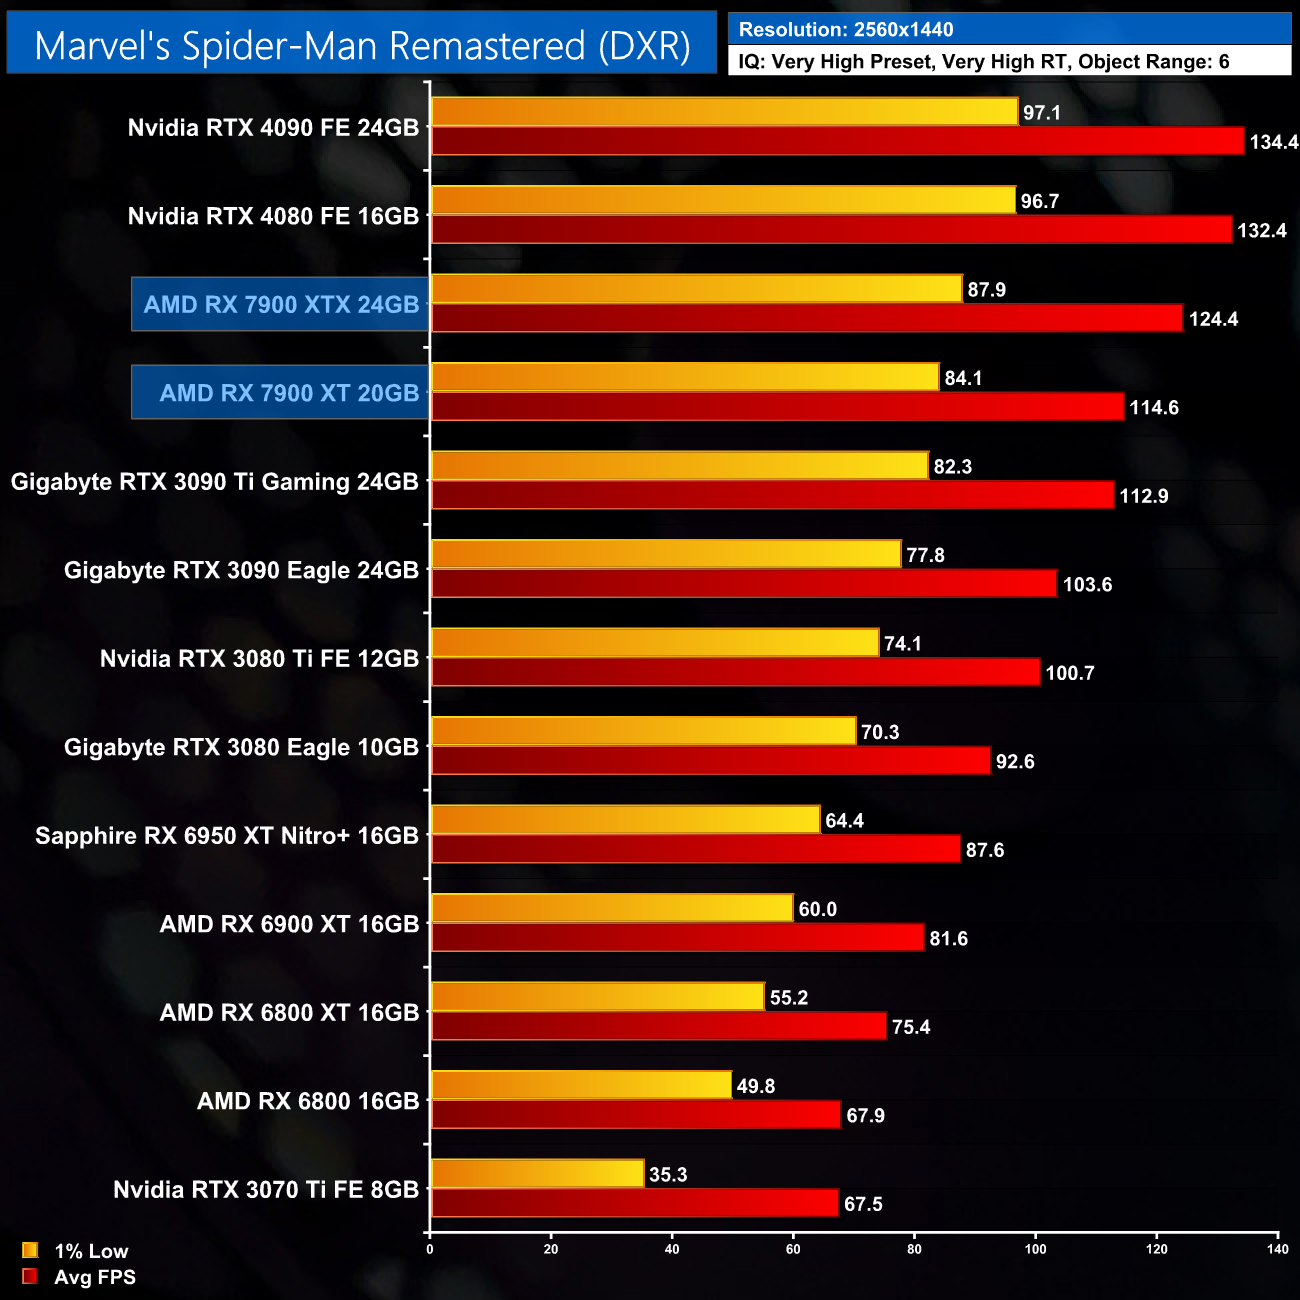
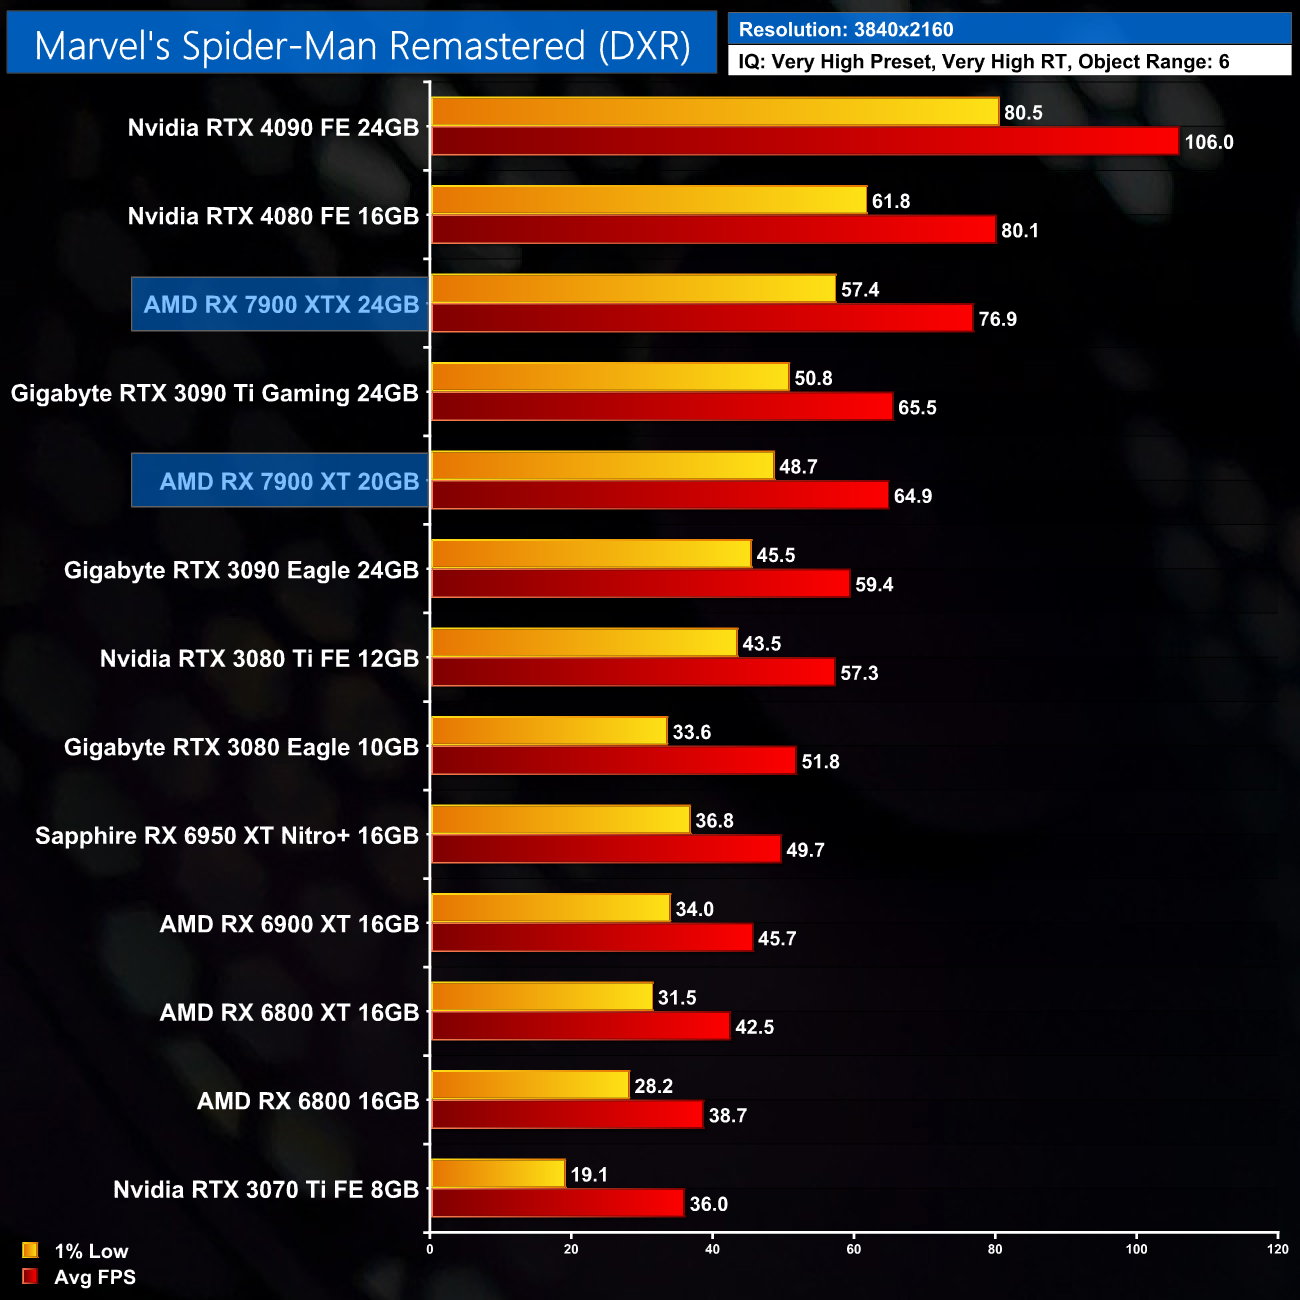
Marvel's Spider-Man Remastered is a better showing for RDNA 3, however, perhaps as a result of this game's RDNA 2 console roots. With ray tracing enabled, the 7900 XT averages 114 FPS, putting it about level with the RTX 3090 Ti.
That trend stays the same at 4K, with the 7900 XT now averaging 65FPS. It's 42% faster than the RX 6900 XT.
Here we test Metro Exodus Enhanced Edition, with the in-game ray tracing effects set to Ultra. DLSS/FSR are disabled.
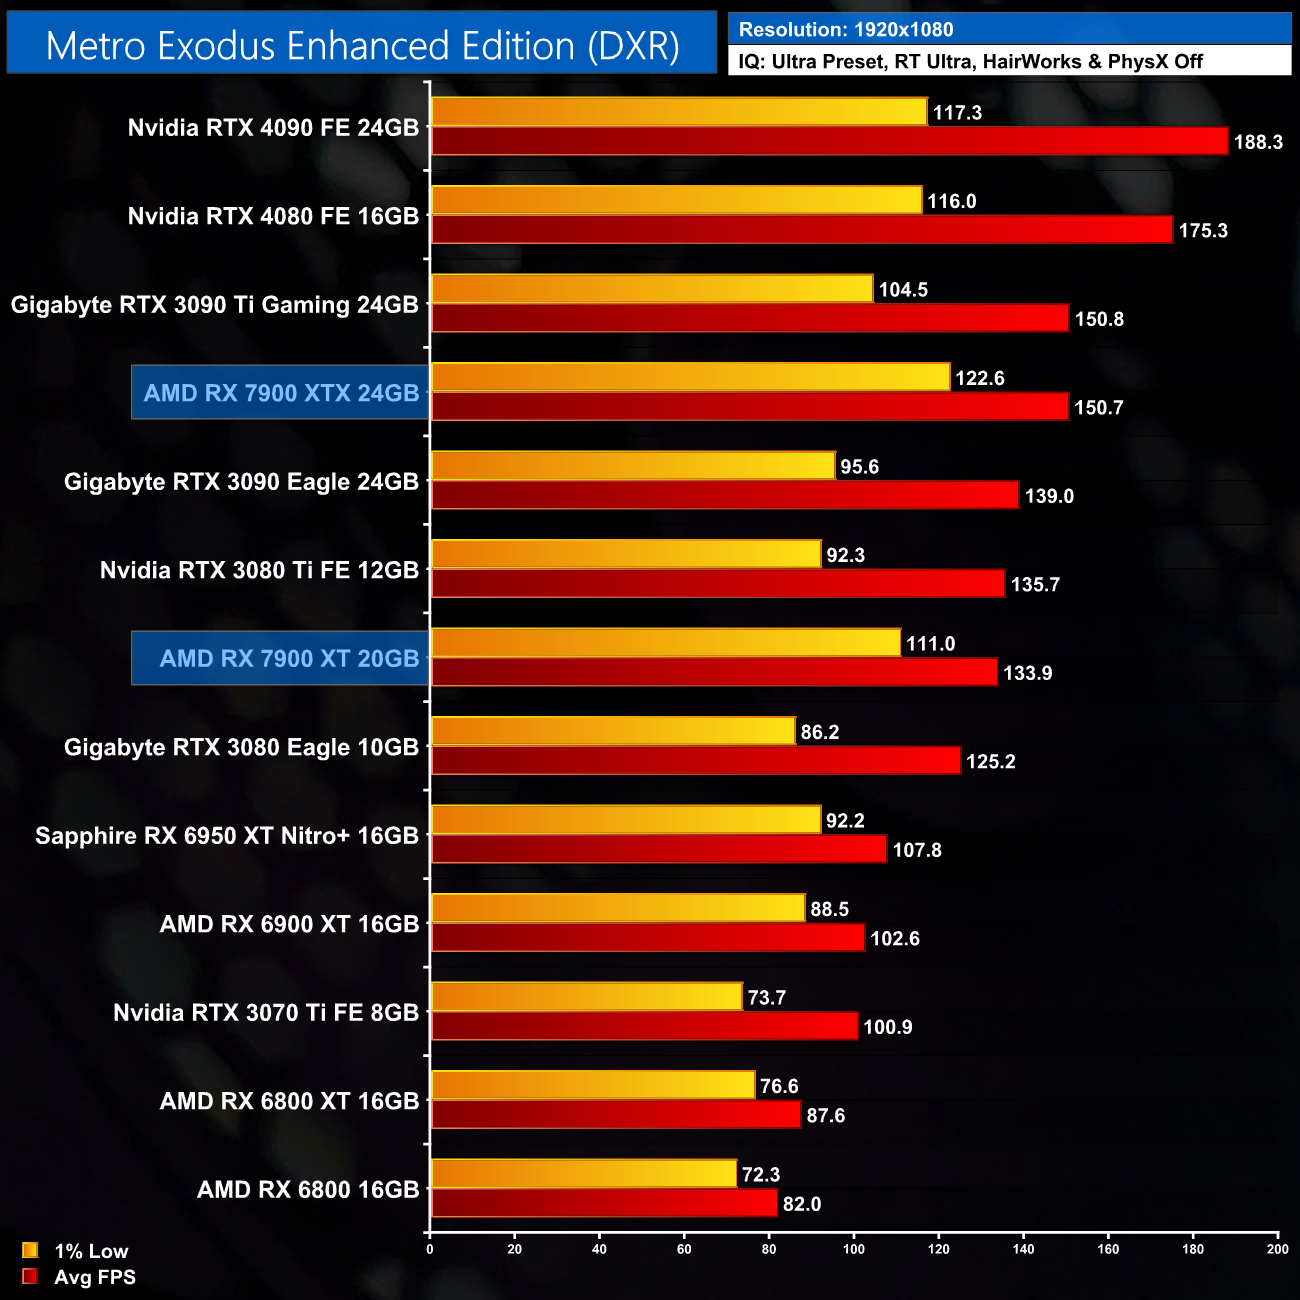
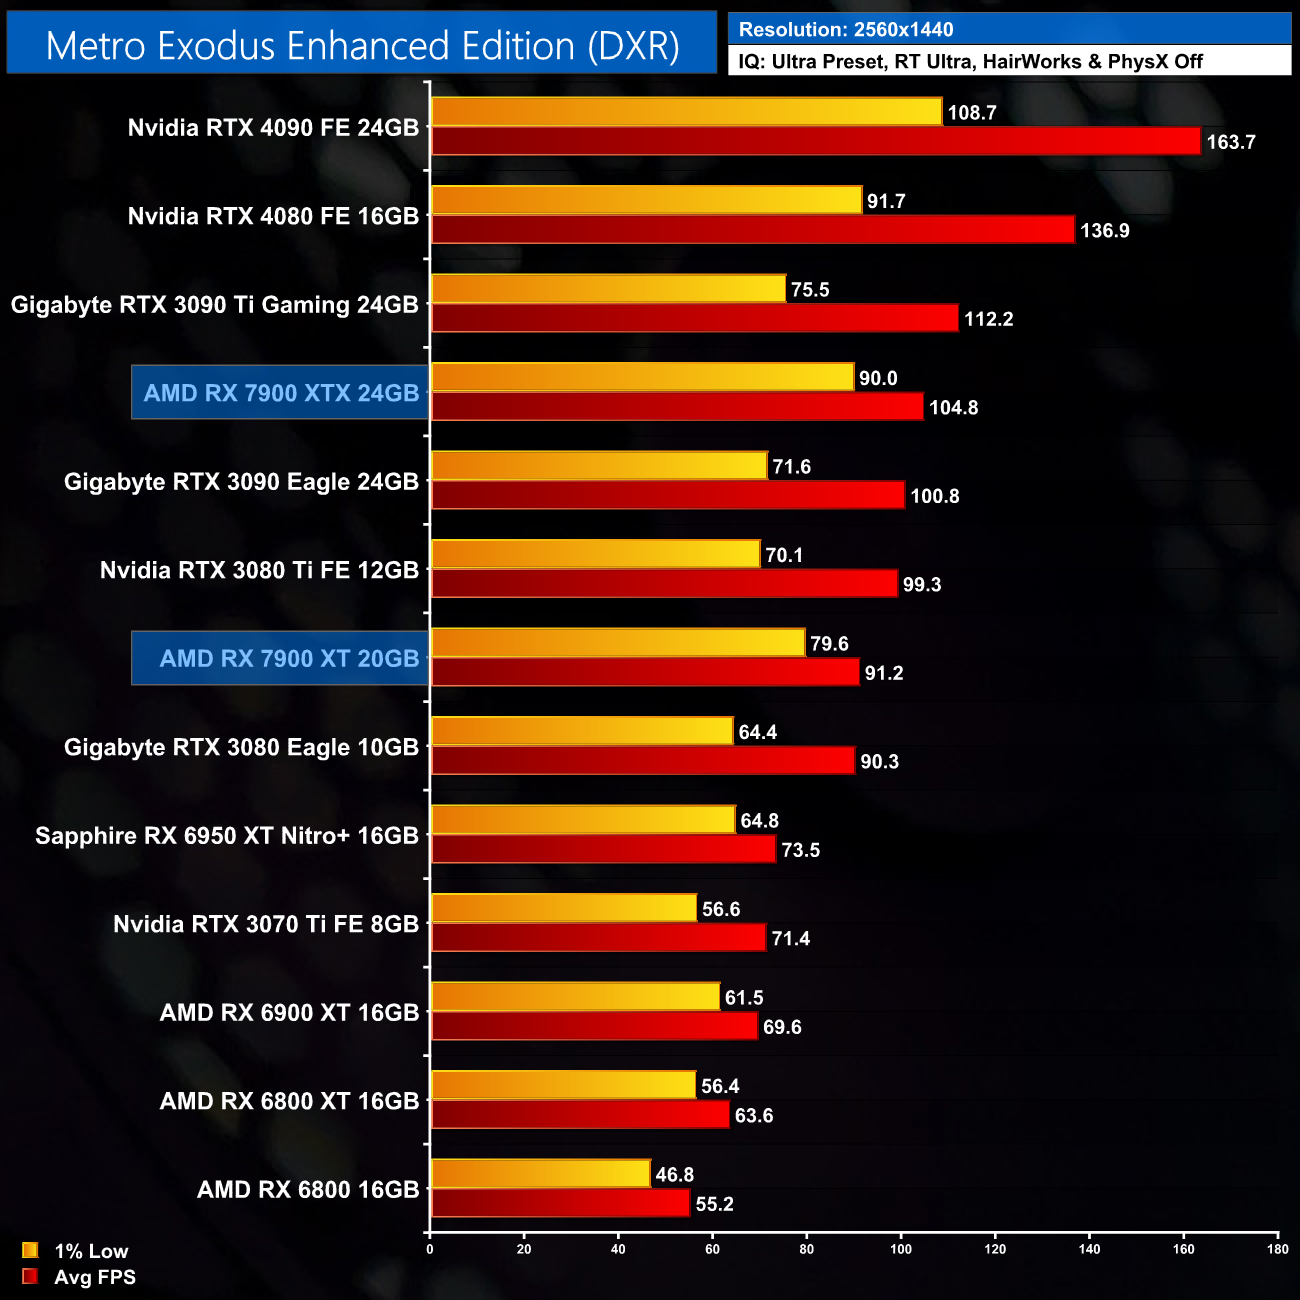
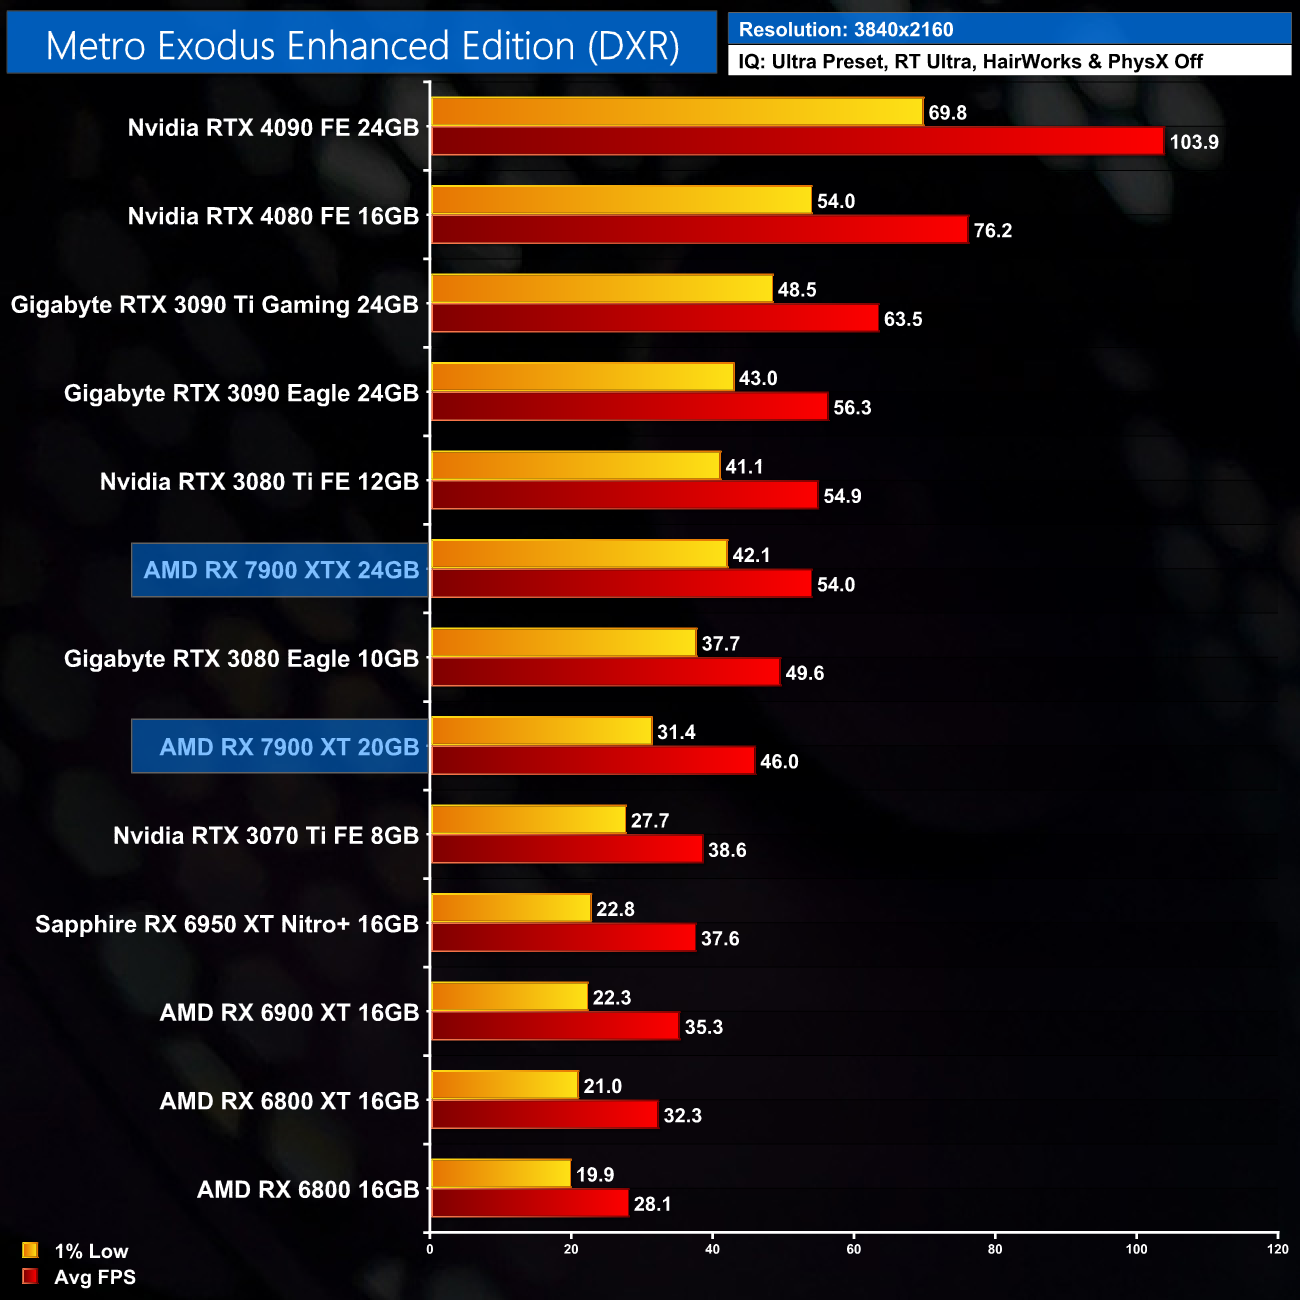
Metro Exodus Enhanced Edition sees the 7900 XT sitting in-line with the RTX 3080 at 1440p, though it does have better 1% low performance. Up at 4K however, the XT drops below the RTX 3080, coming in 7% slower.
Here we test Resident Evil Village, this time testing with the in-game ray tracing effects set to High. DLSS/FSR are disabled.
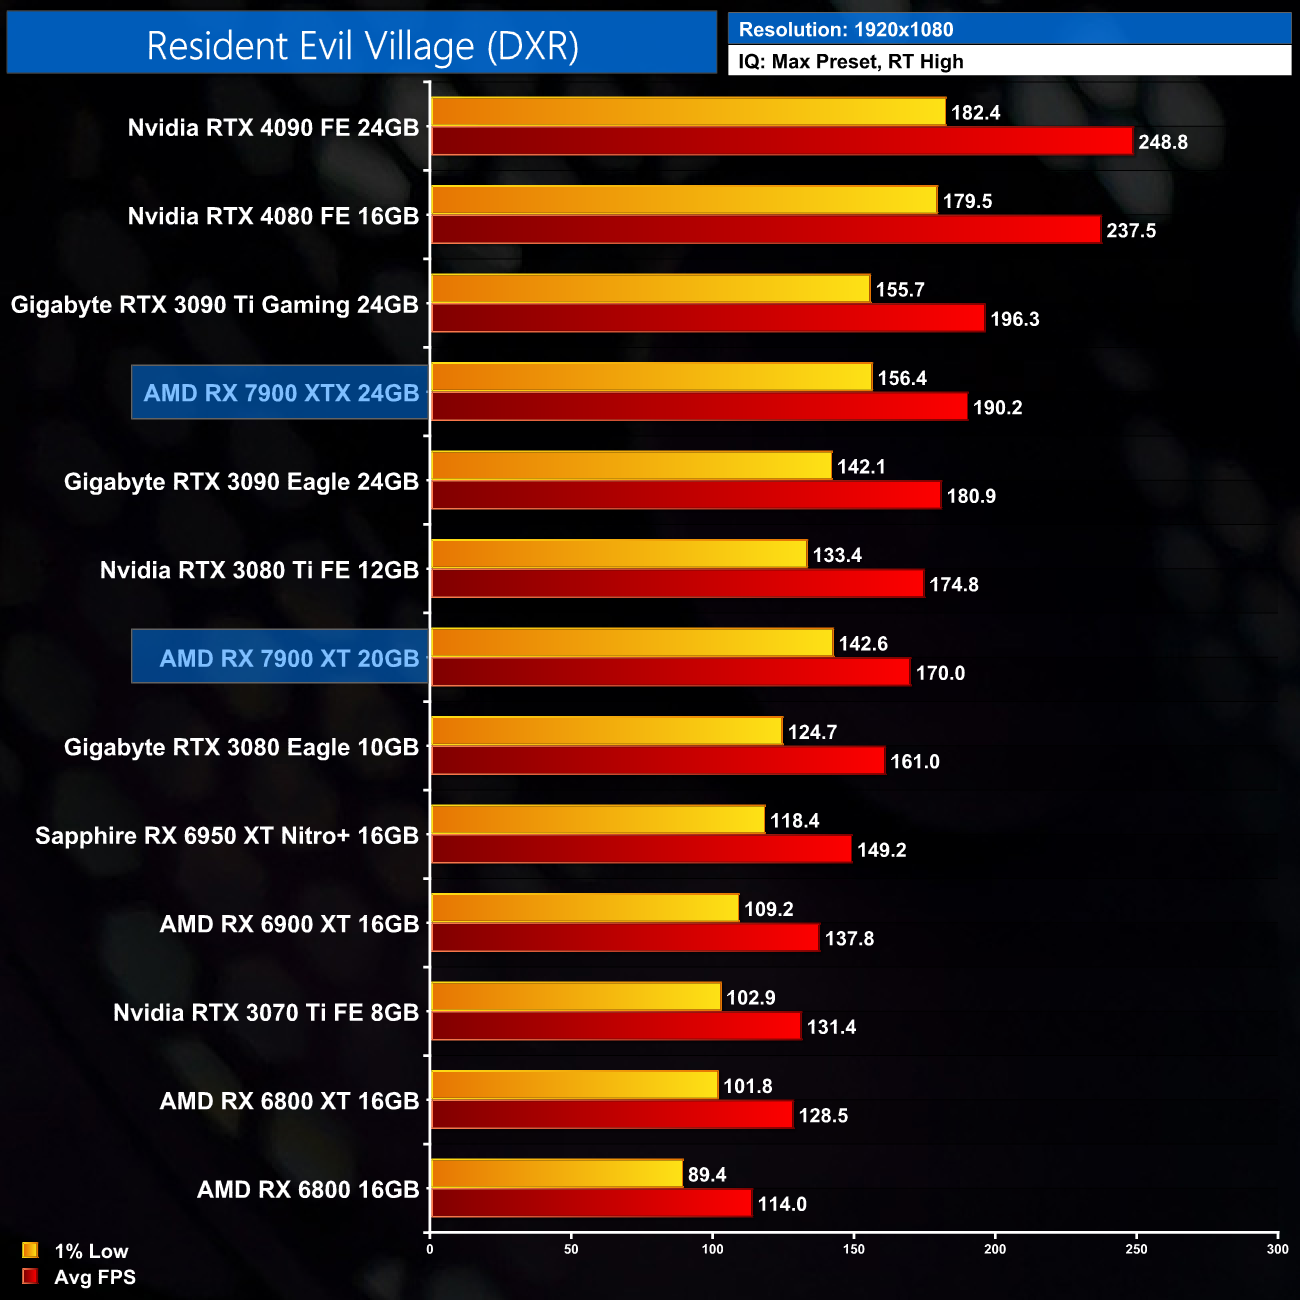
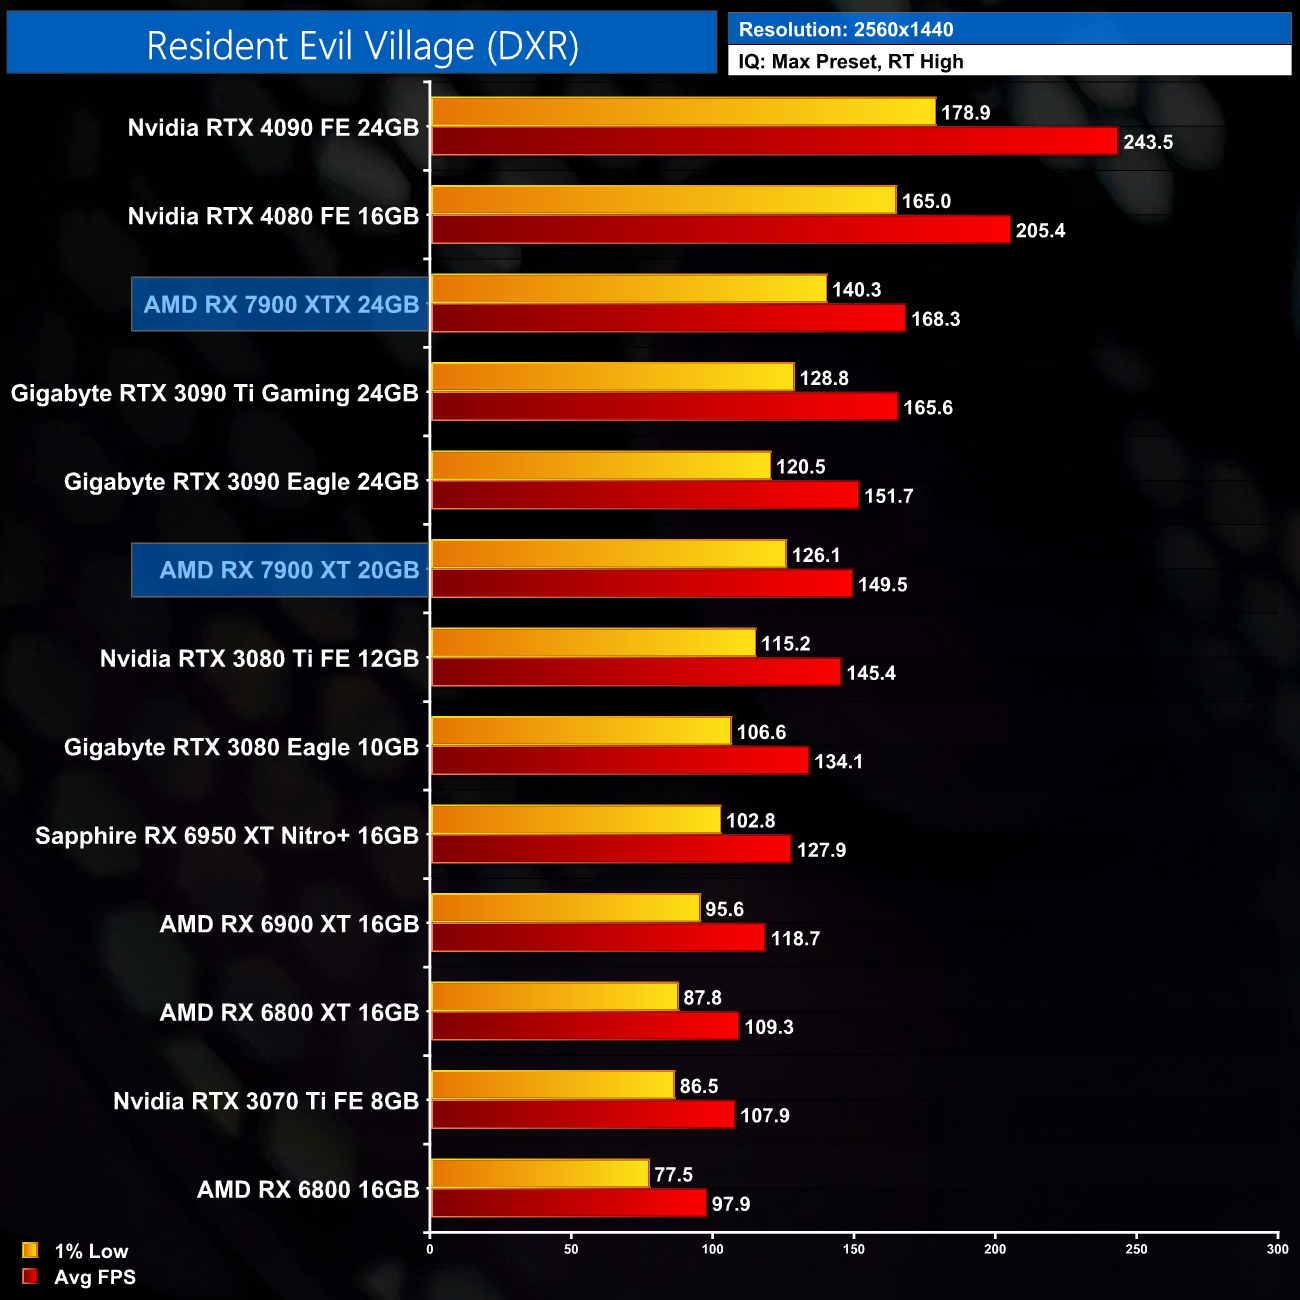
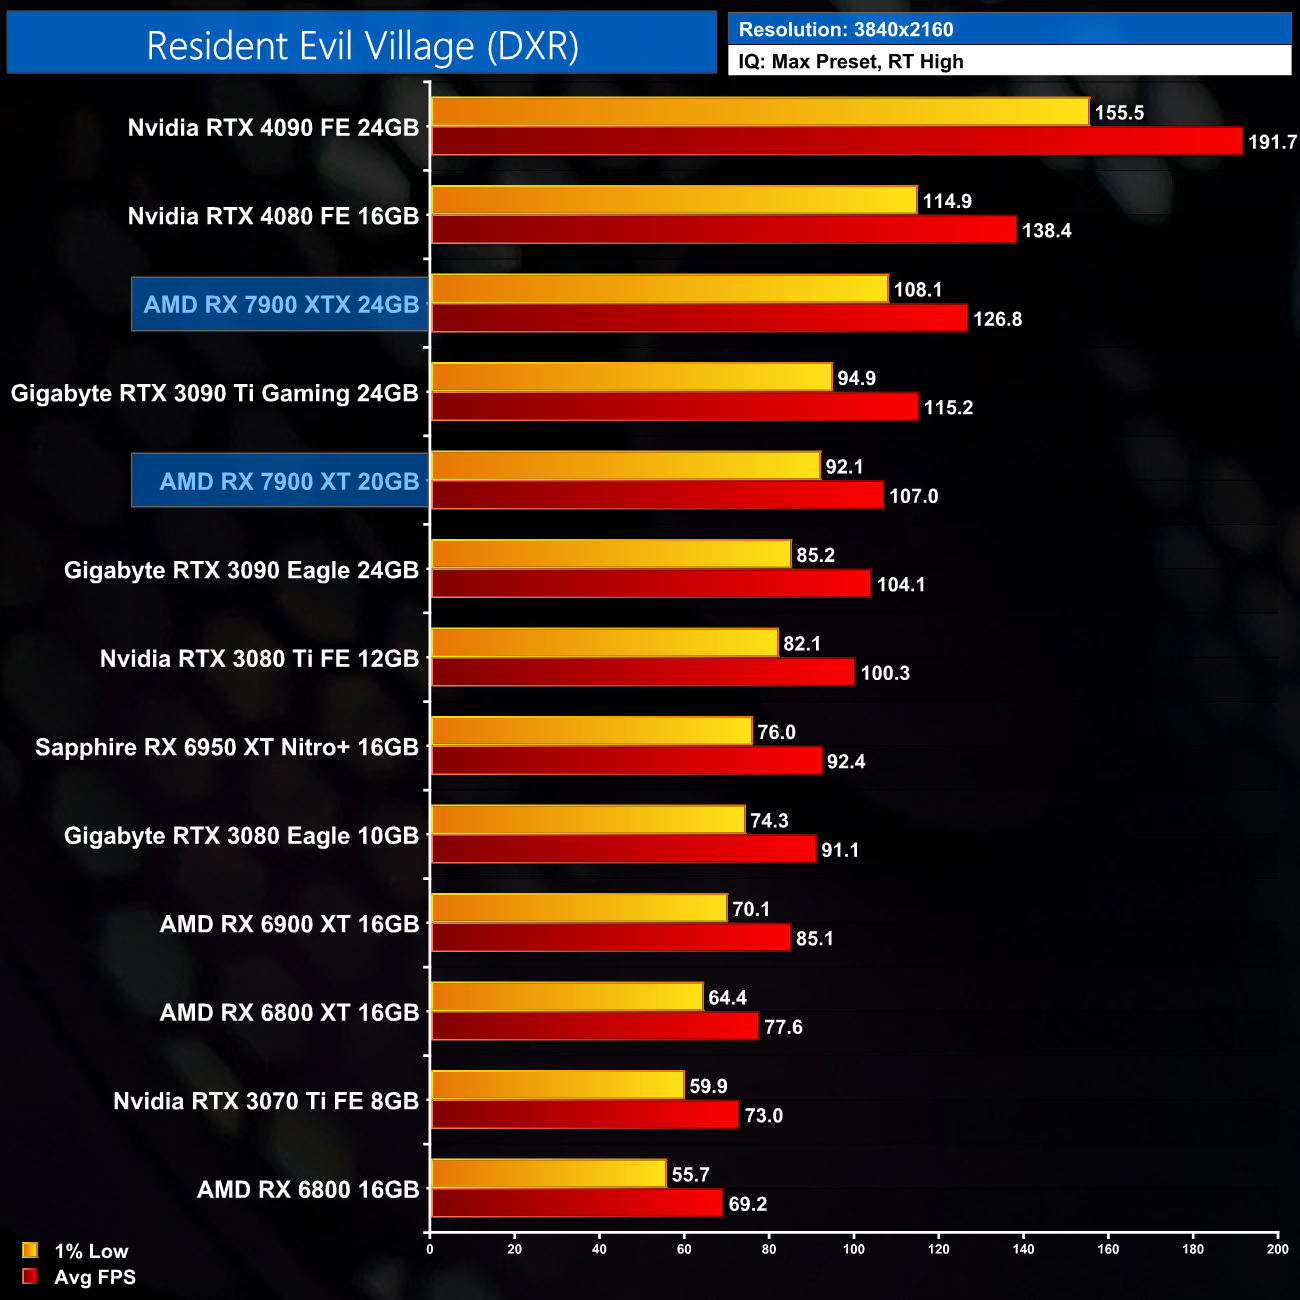
Lastly, we finish up with a look at Resident Evil Village. Here the 7900 XT breezes through the game's relatively light RT effects, and it's a rough match for the RTX 3090 at 1440p and 4K, averaging 107FPS at the latter resolution.
Here we present the average clock speed for each graphics card while running Cyberpunk 2077 for 30 minutes. We use GPU-Z to record the GPU core frequency during gameplay. We calculate the average core frequency during the 30 minute run to present here.
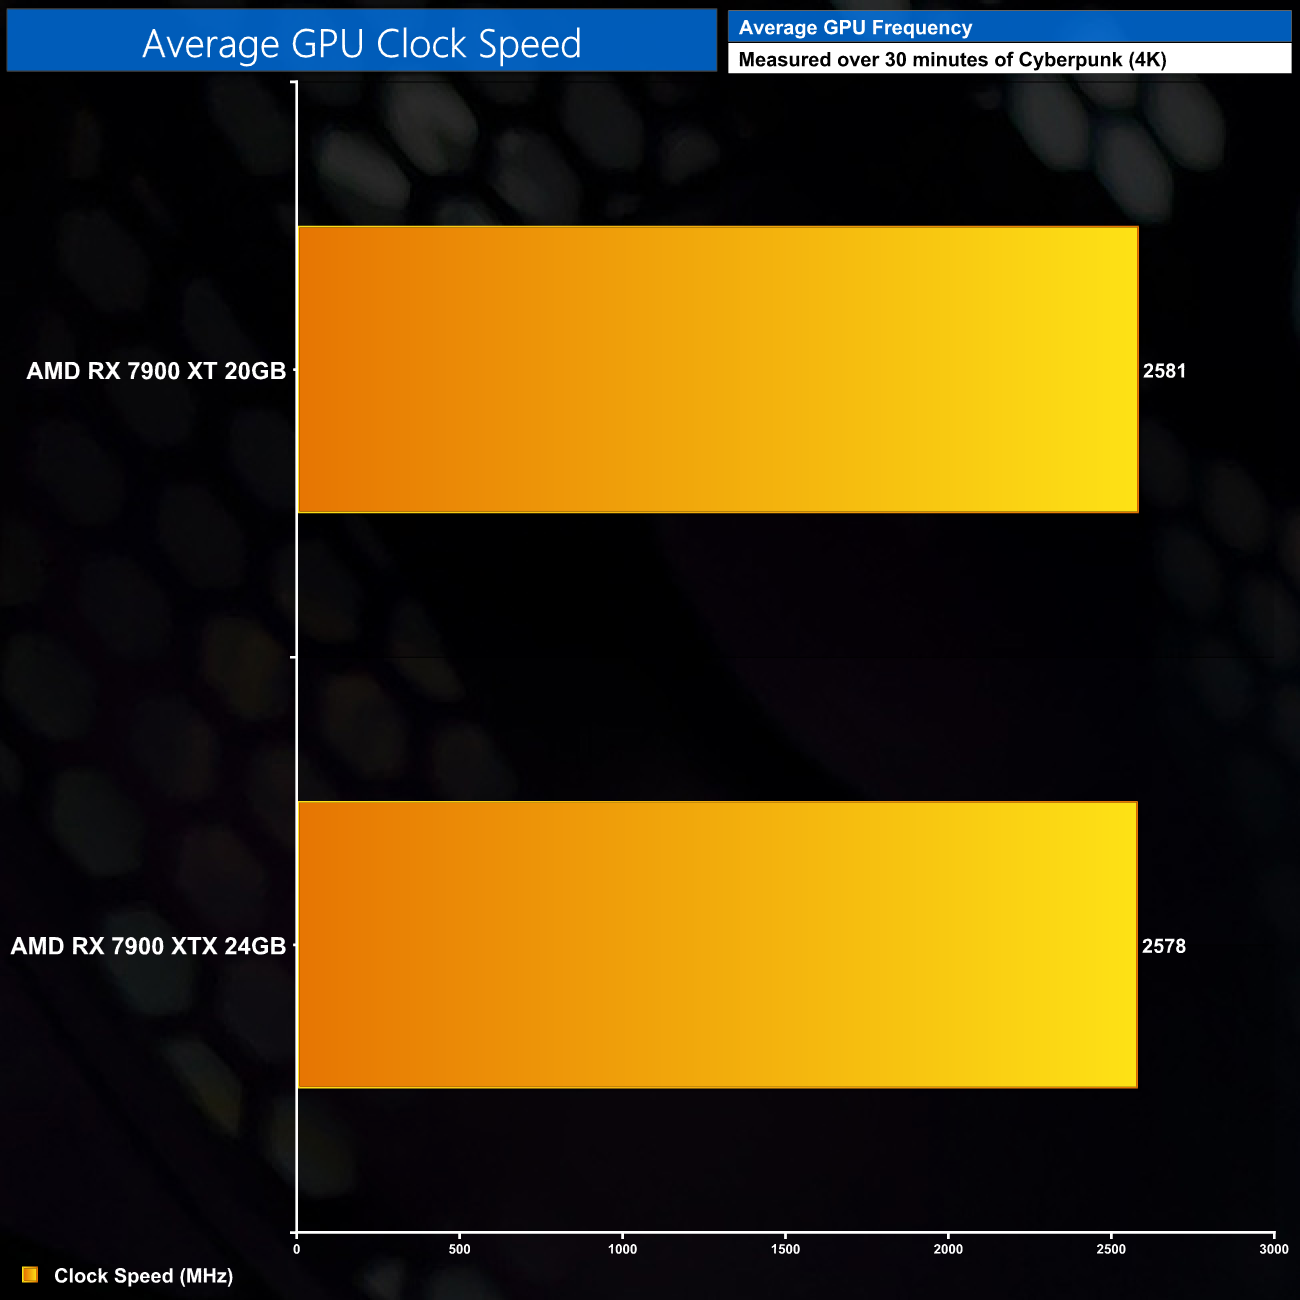

Looking now at the RX 7900 XT's operating clock speed, over our thirty minute stress test it averaged 2581MHz. Interestingly, we can see the clocks bounced around a lot more on the XT card rather than the XTX, which was a lot more stable over our thirty minute stress test. It's possible the XT was hitting its power limit more frequently than the XTX, though that's just an educated guess for now.
For our temperature testing, we measure the peak GPU core temperature under load. A reading under load comes from running Cyberpunk 2077 for 30 minutes.
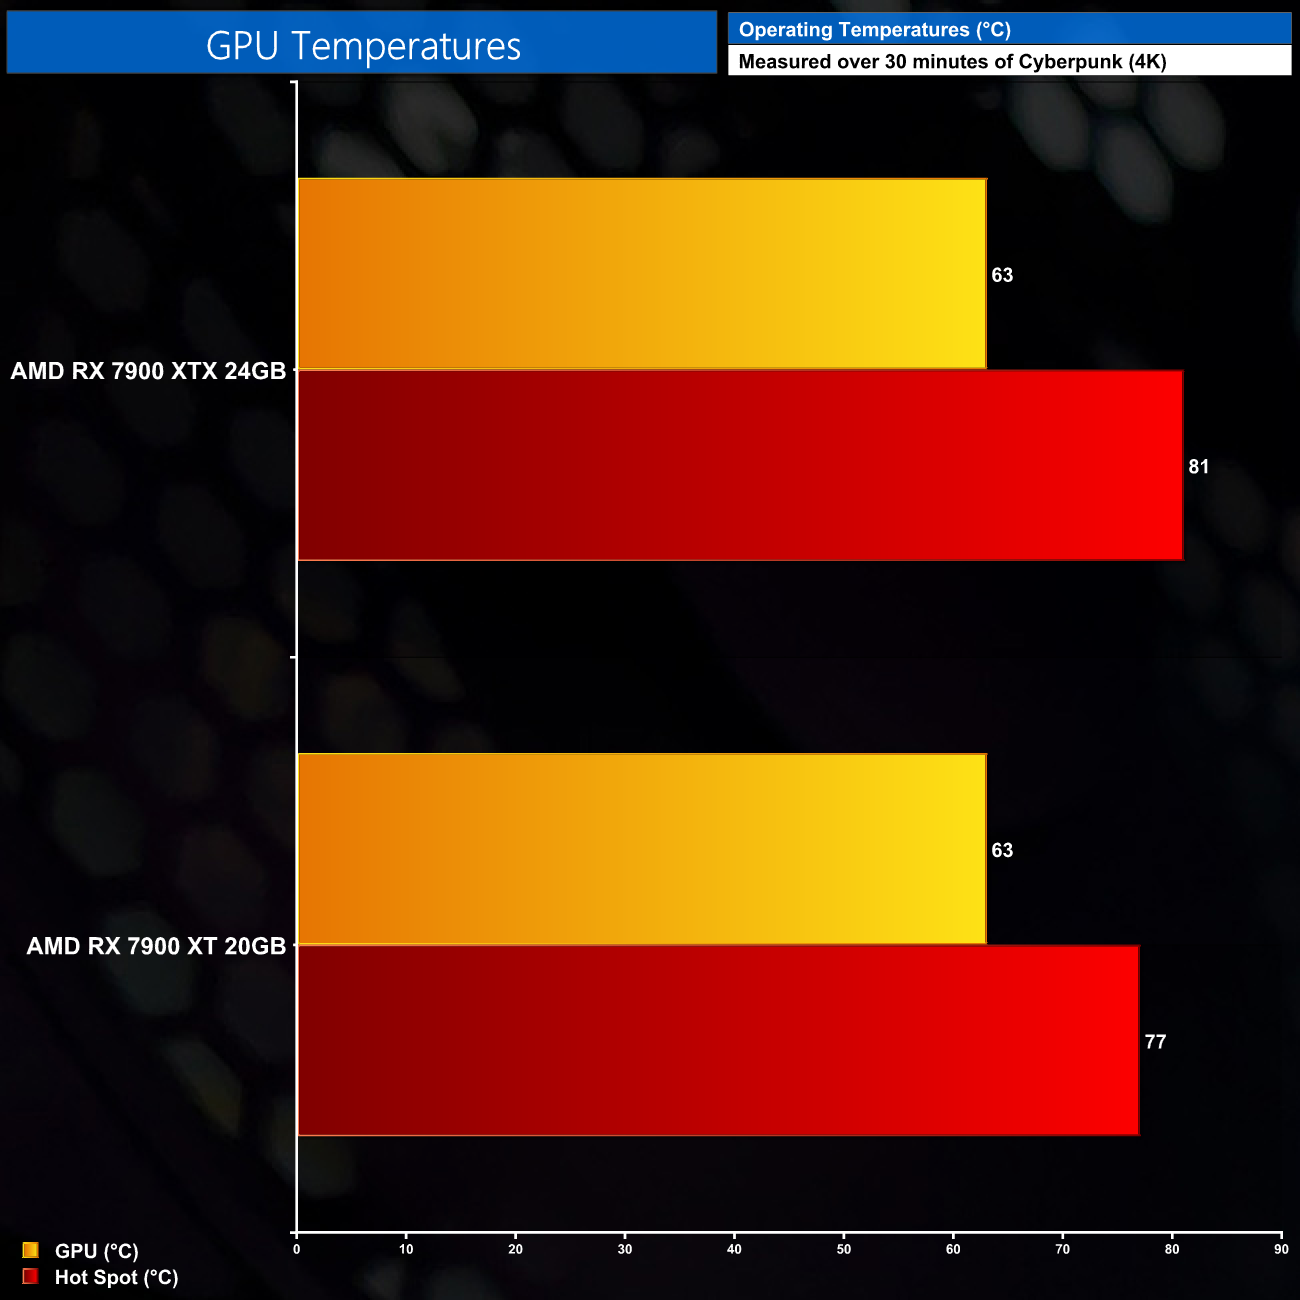
As for thermals, the reference RX 7900 XT is perfectly fine for dealing with the 315W GPU. The GPU itself peaked at 63C, with the hot spot at 77C. We'll have to wait and see as to what AMD's partners can do with their custom solutions over the next few weeks.
We take our noise measurements with the sound meter positioned 1 foot from the graphics card. I measured the noise floor to be 32 dBA, thus anything above this level can be attributed to the graphics cards. The power supply is passive for the entire power output range we tested all graphics cards in, while all CPU and system fans were disabled. A reading under load comes from running Metro Exodus Enhanced Edition for 30 minutes.
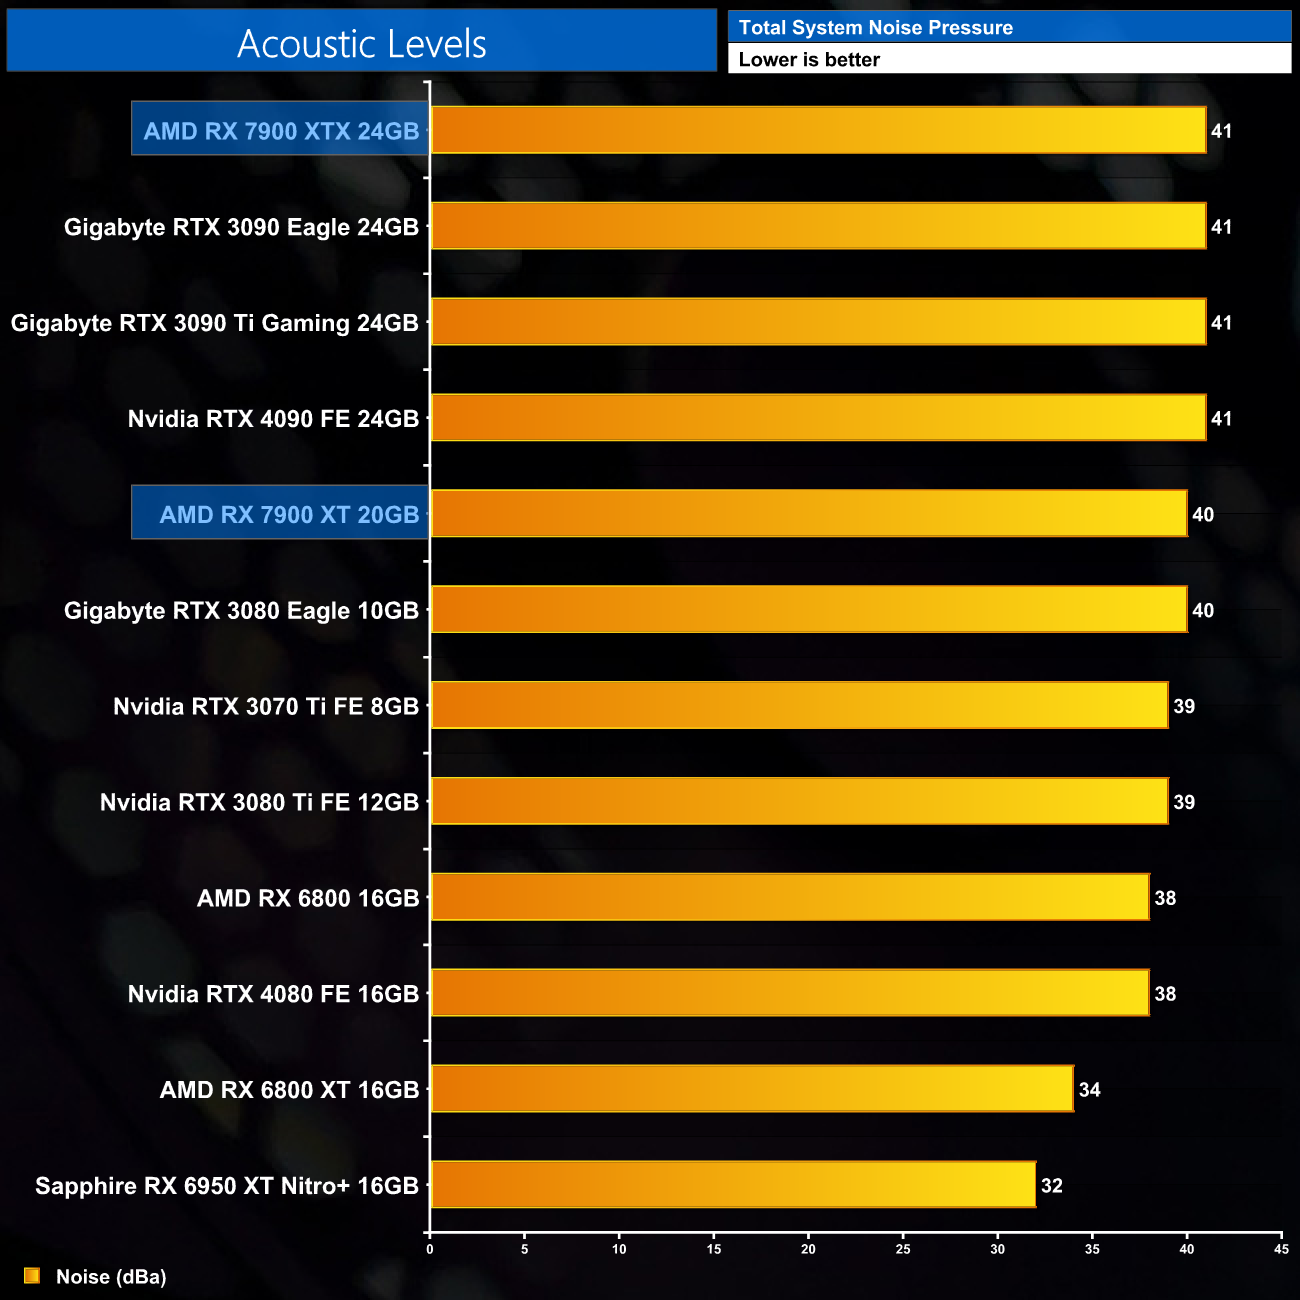
Noise levels are also fine – the 7900 XT isn't the quietest card out there but it's not obnoxiously loud. We saw the fans ramp up to 64%, or 1710rpm under prolonged load. There was also some coil whine from our sample, but nothing major – you can hear this in action in our video review.
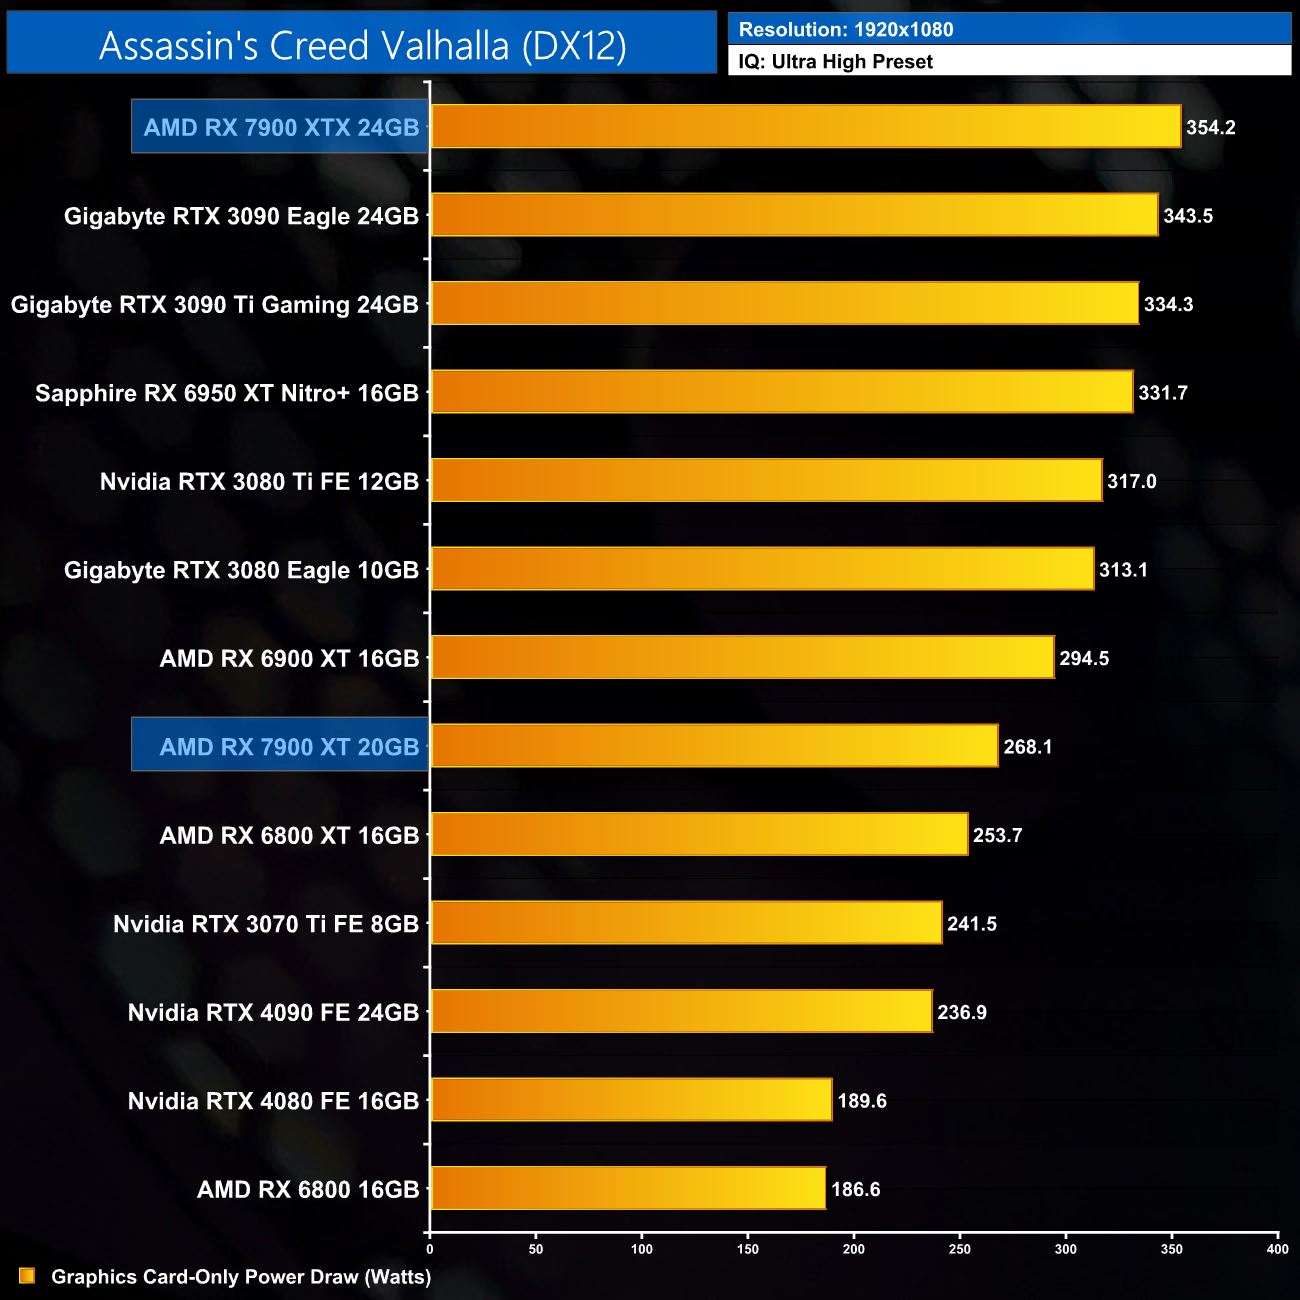
Here we present power draw figures for the graphics card-only, on a per-game basis for all twelve games we tested at 1080p. This is measured using Nvidia's Power Capture Analysis Tool, also known as PCAT. You can read more about our updated power draw testing methodology HERE.
Per-Game Results at 1080p:
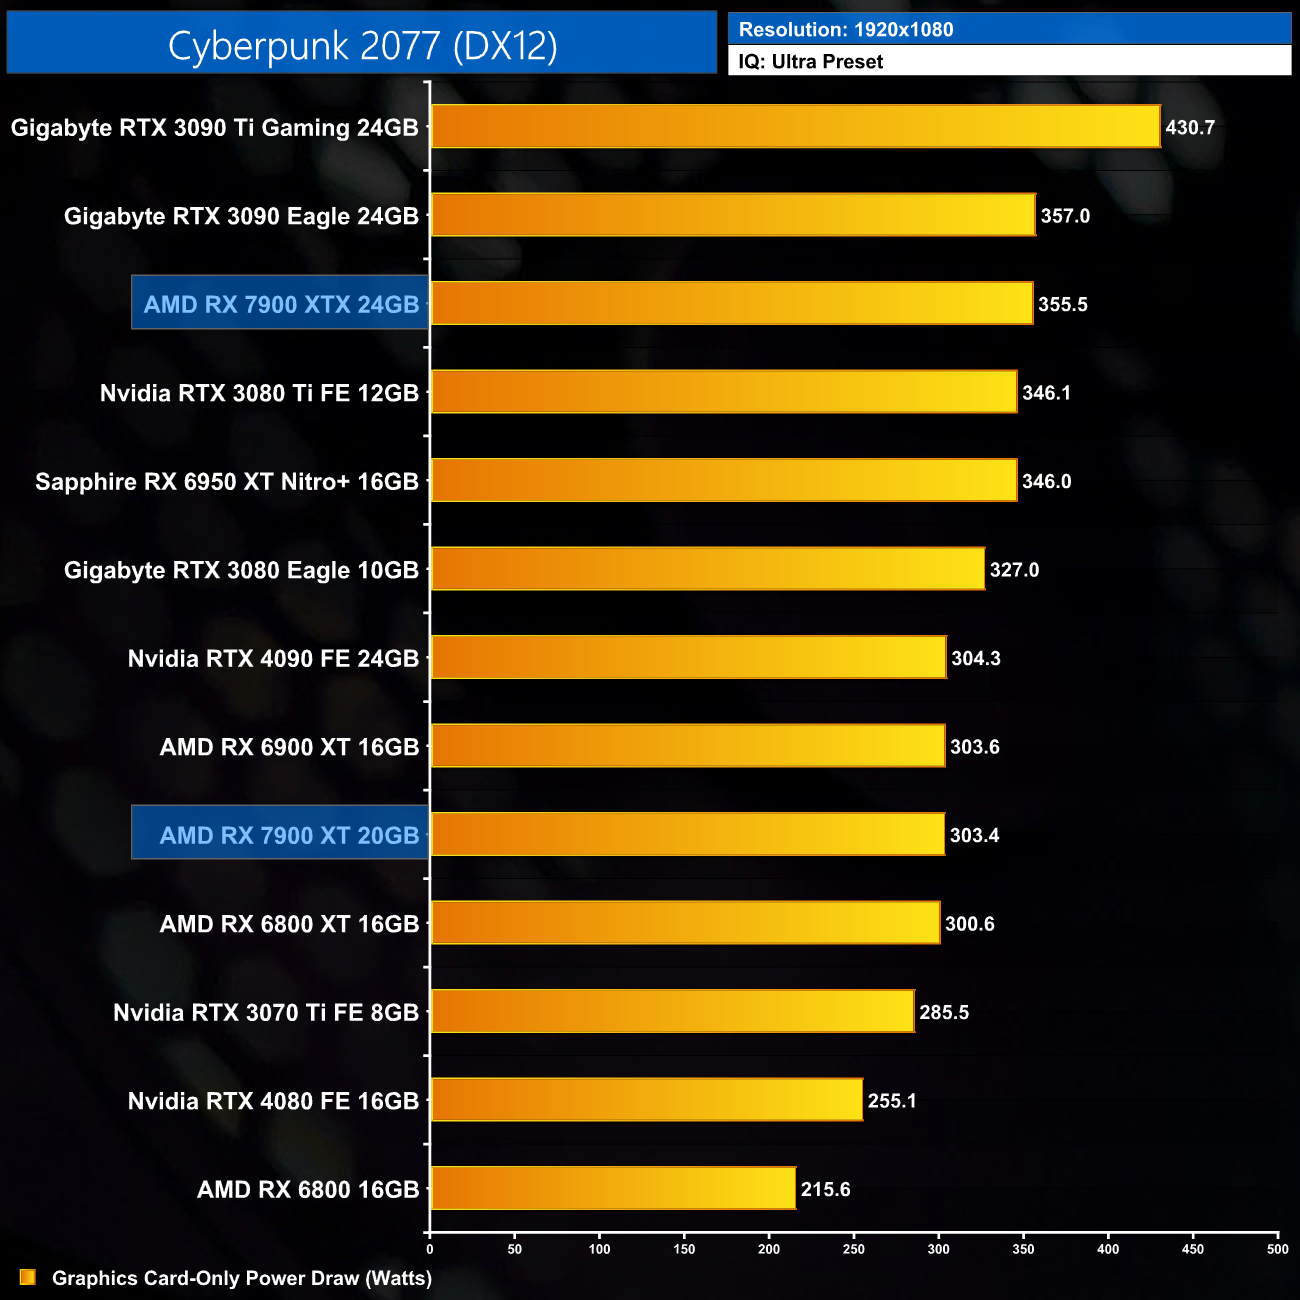
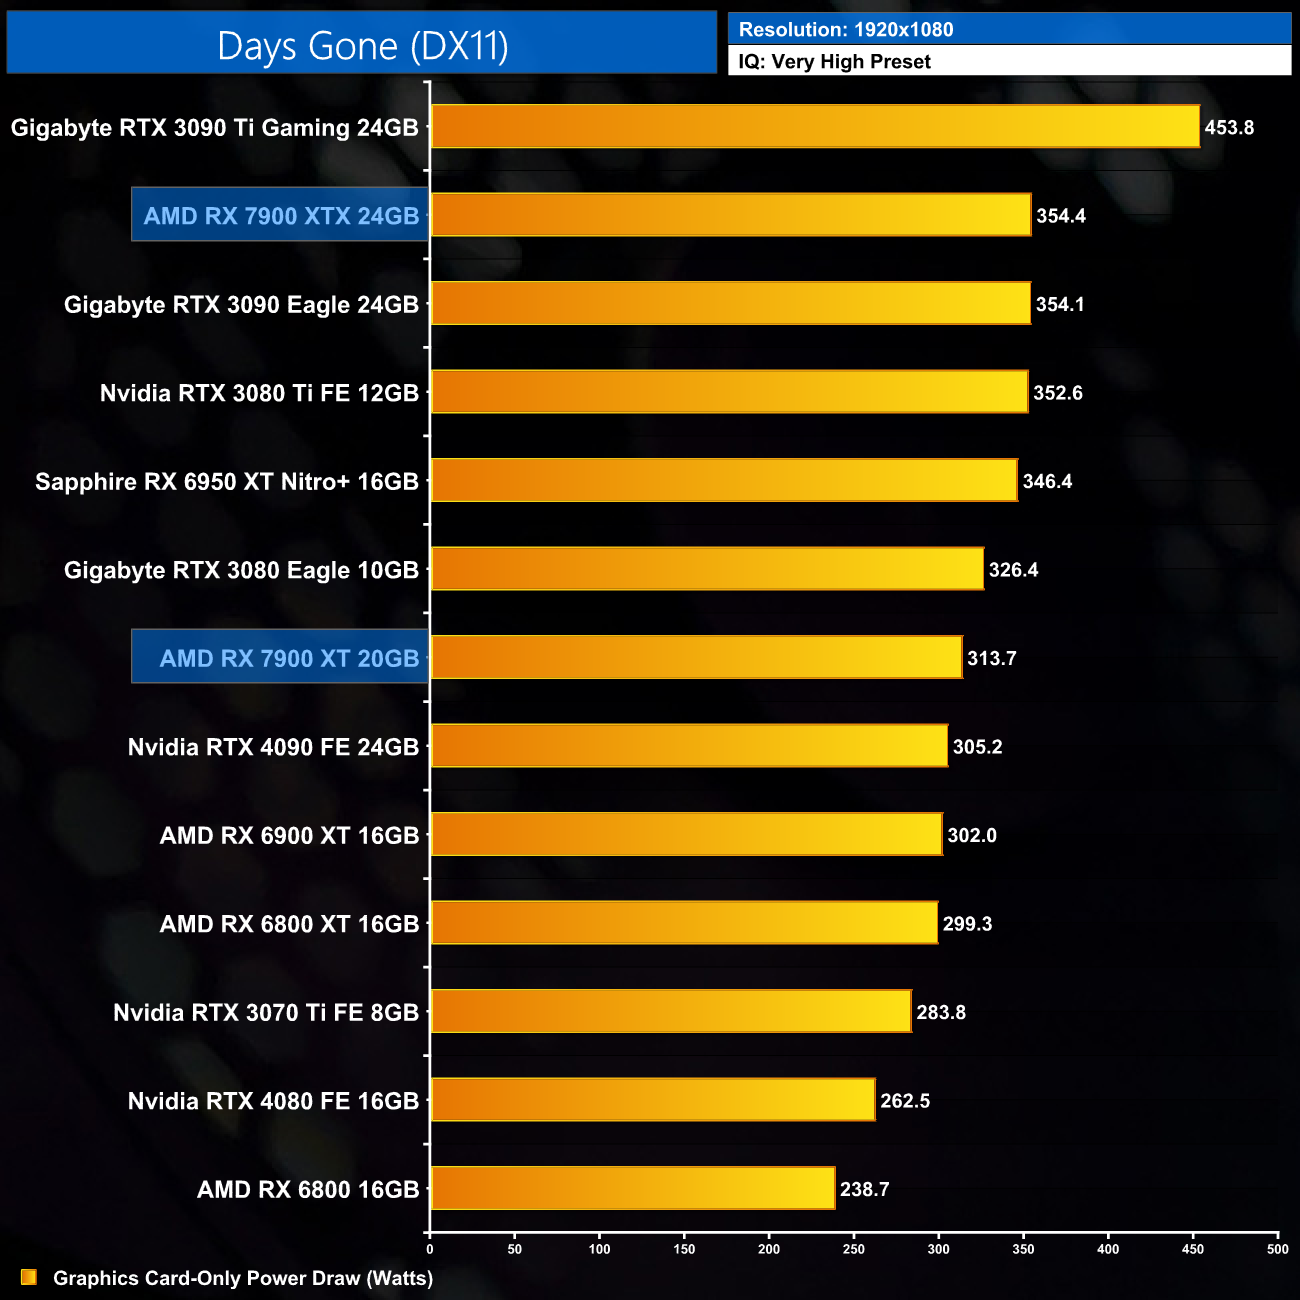
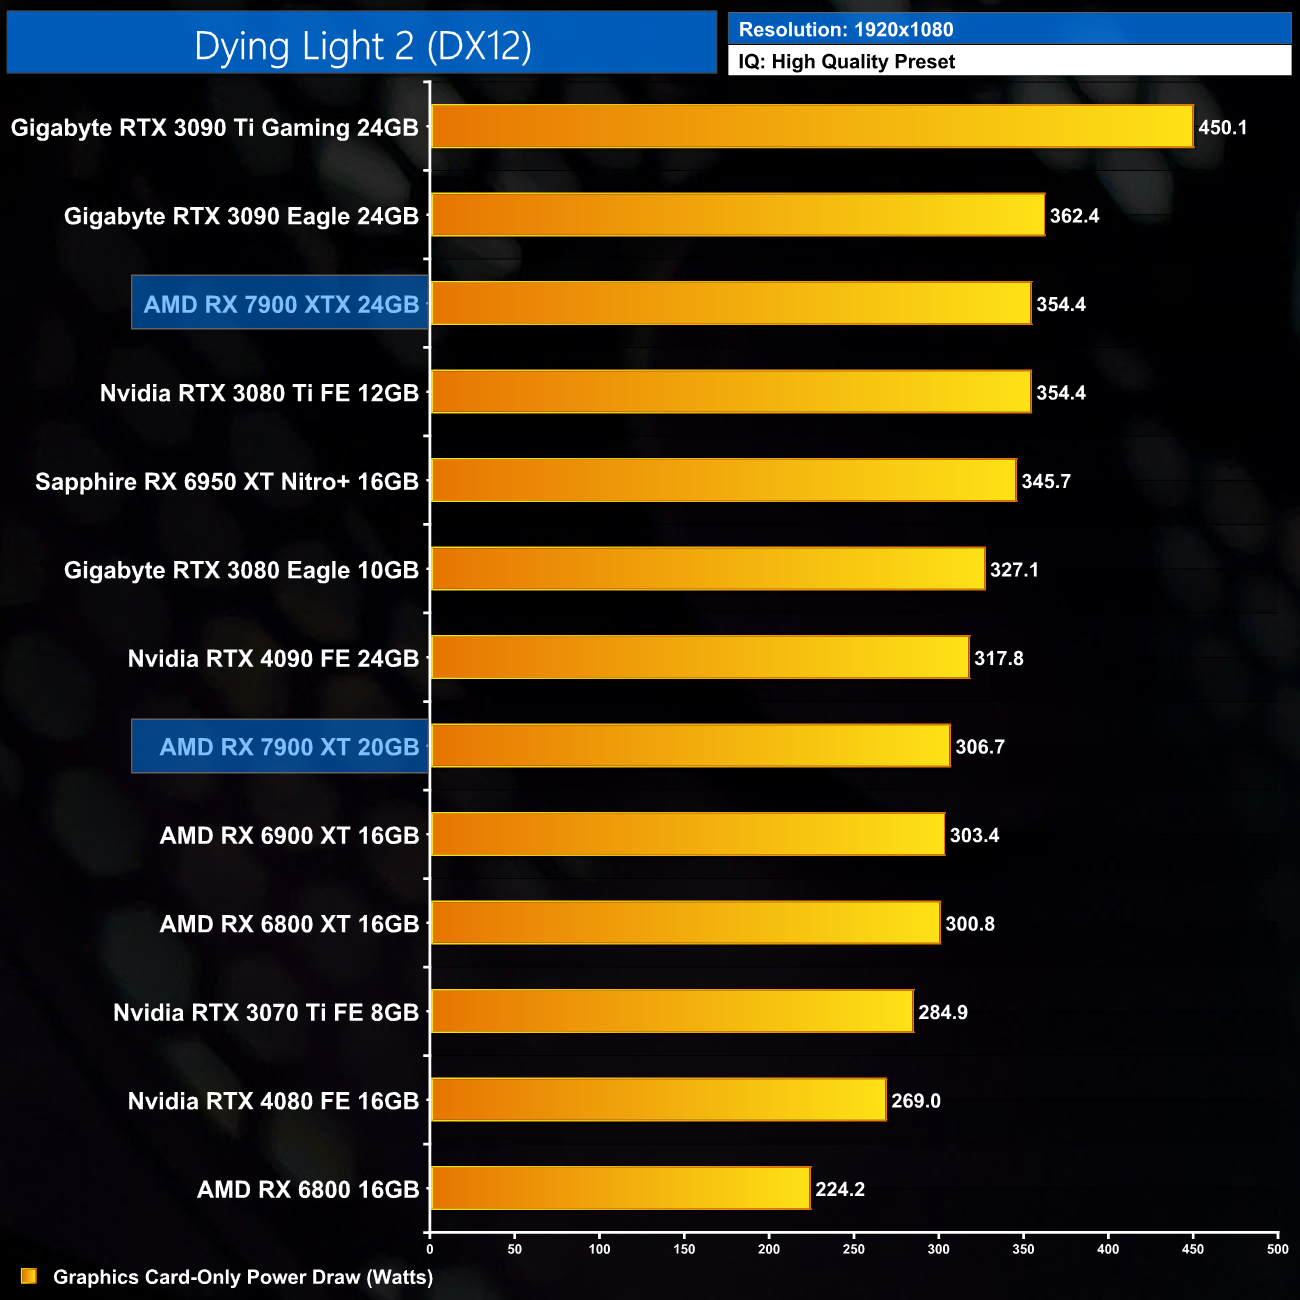
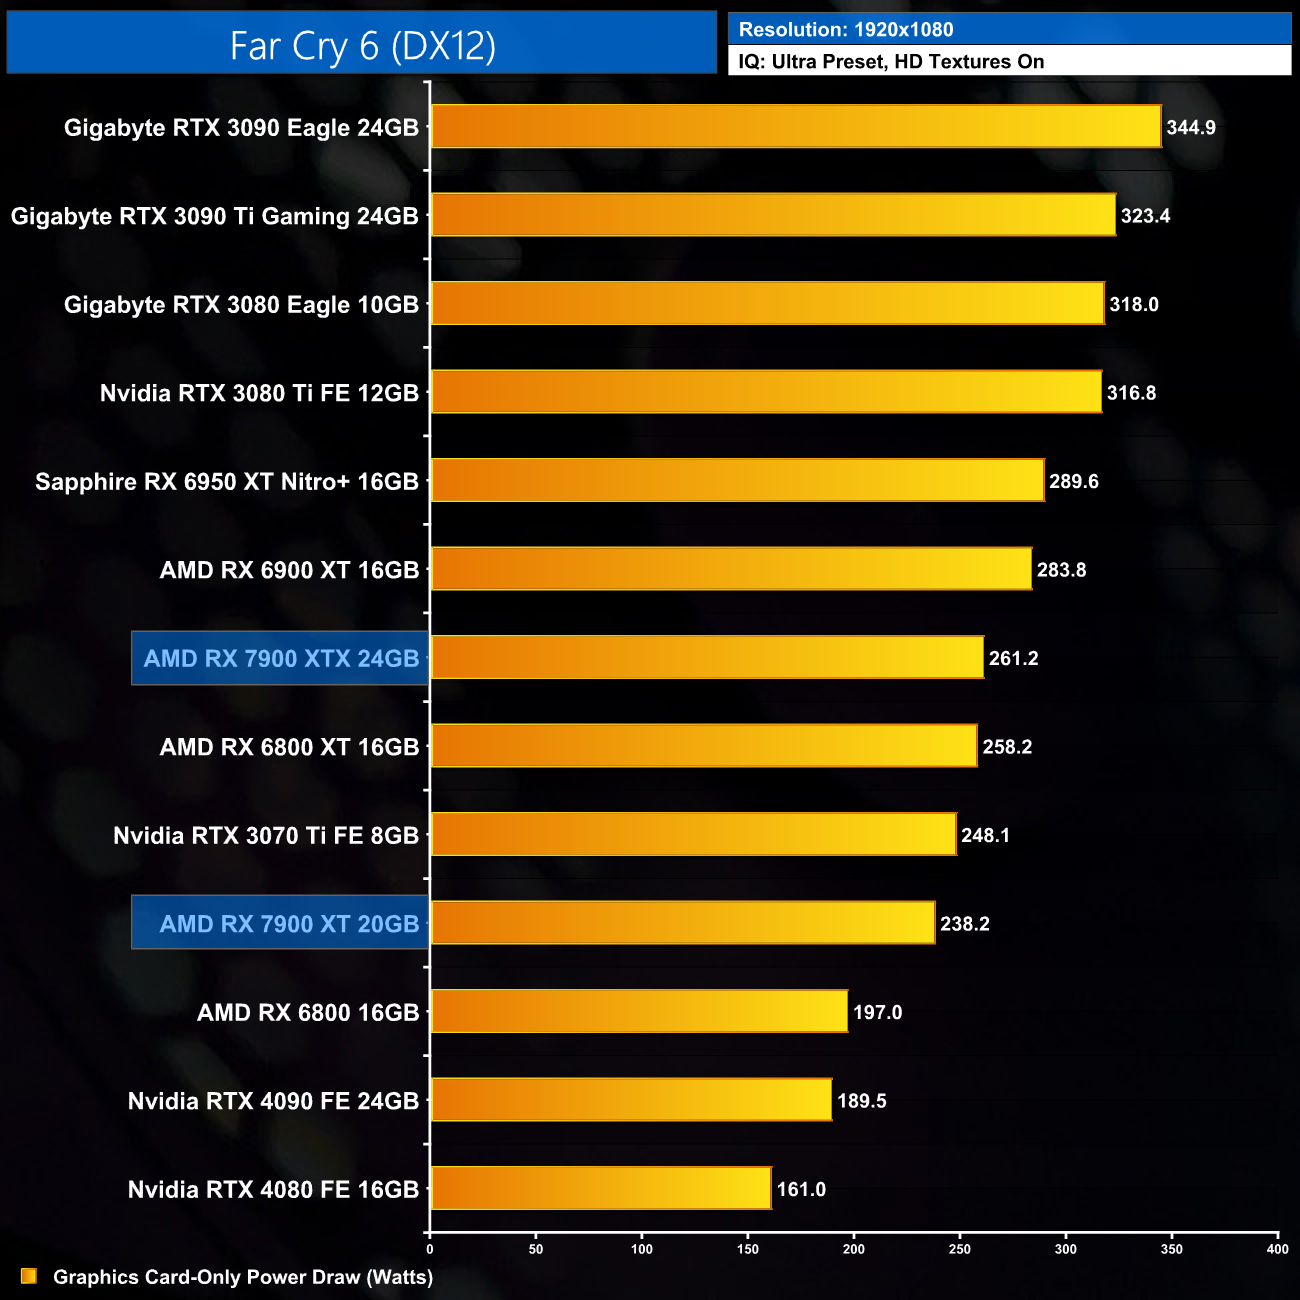
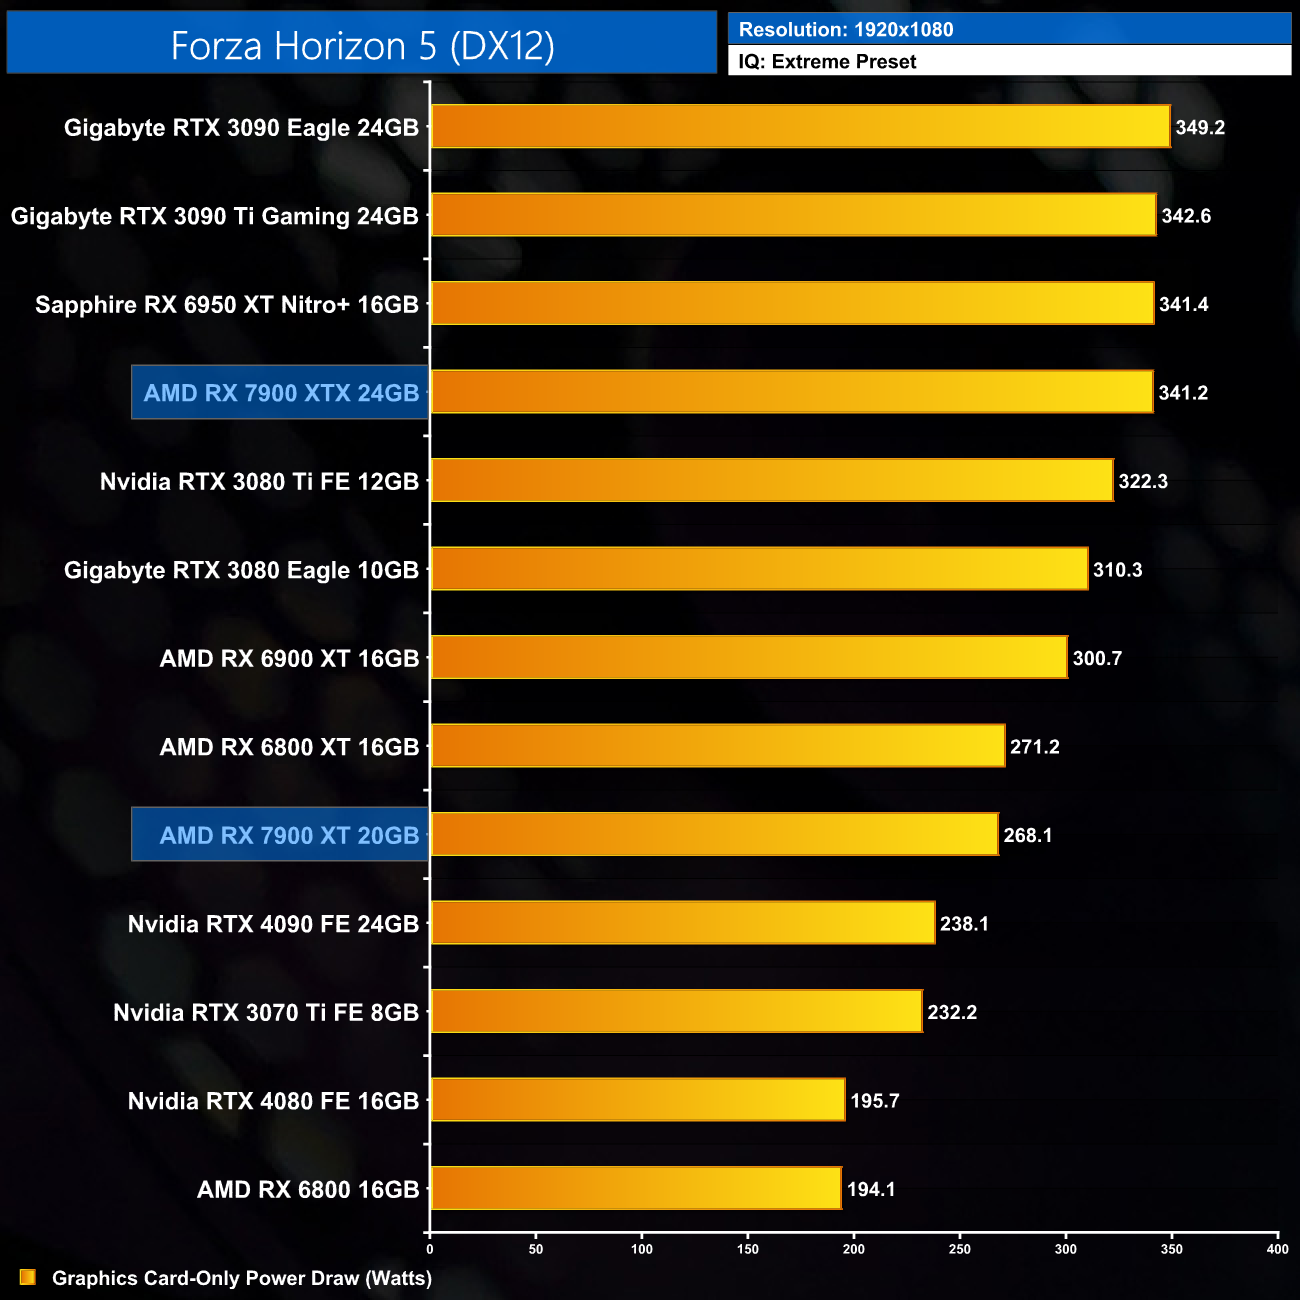
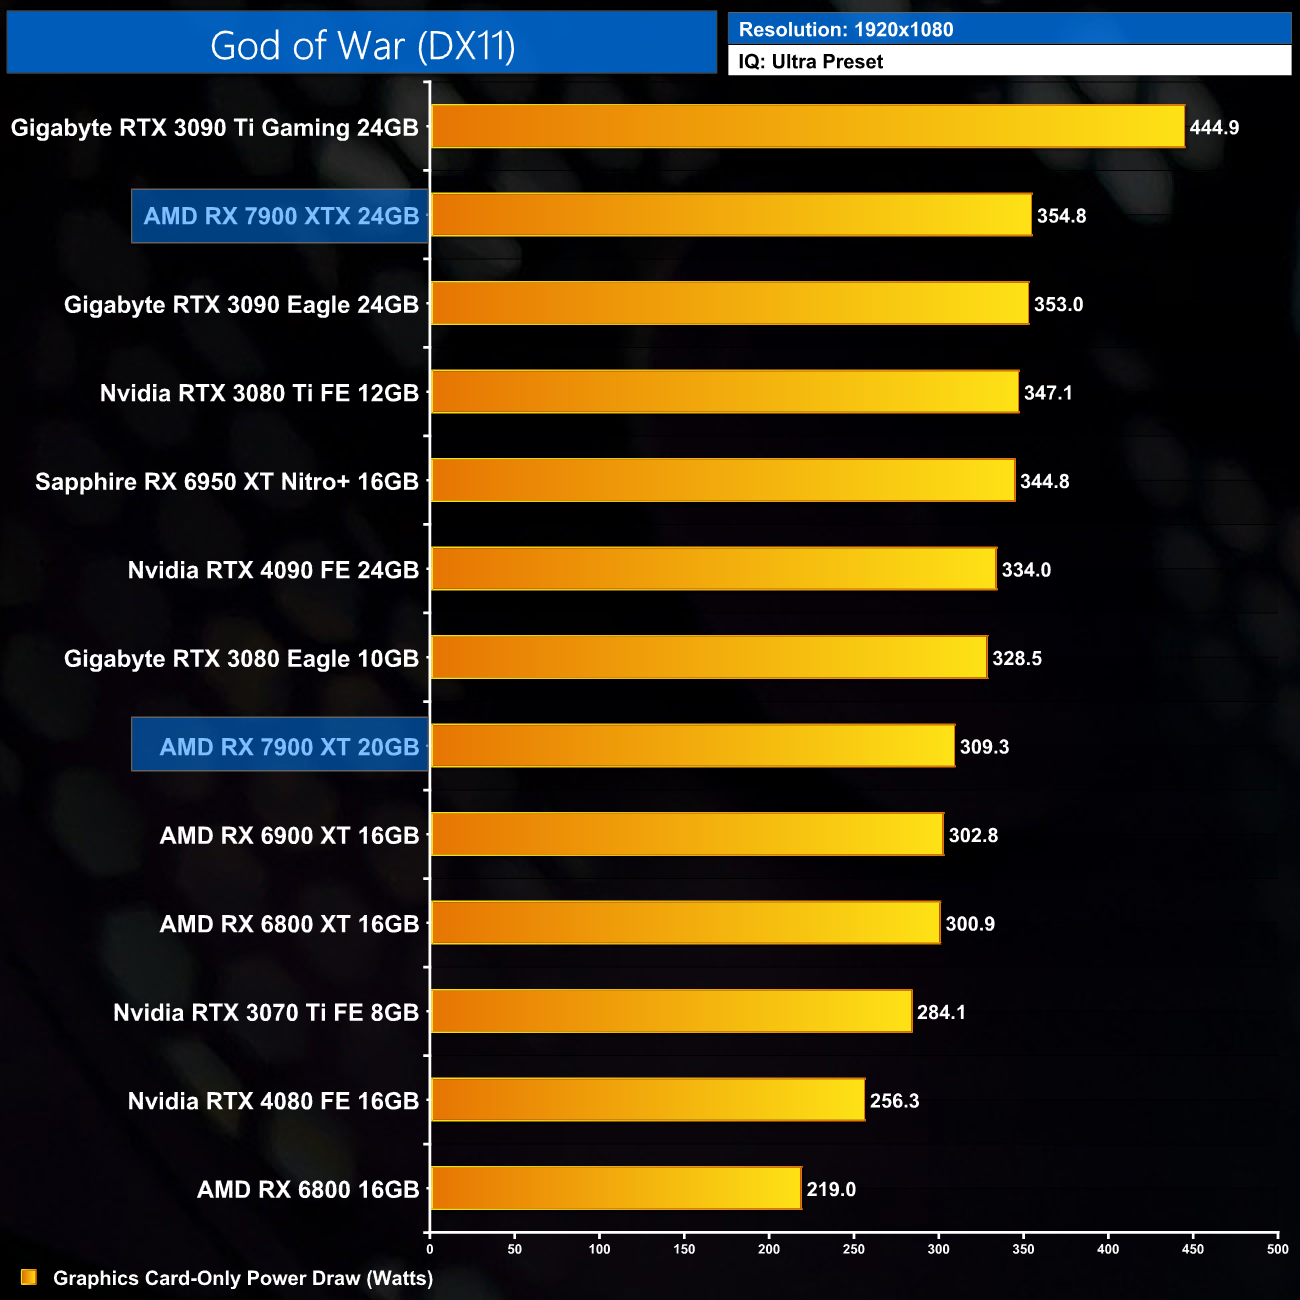
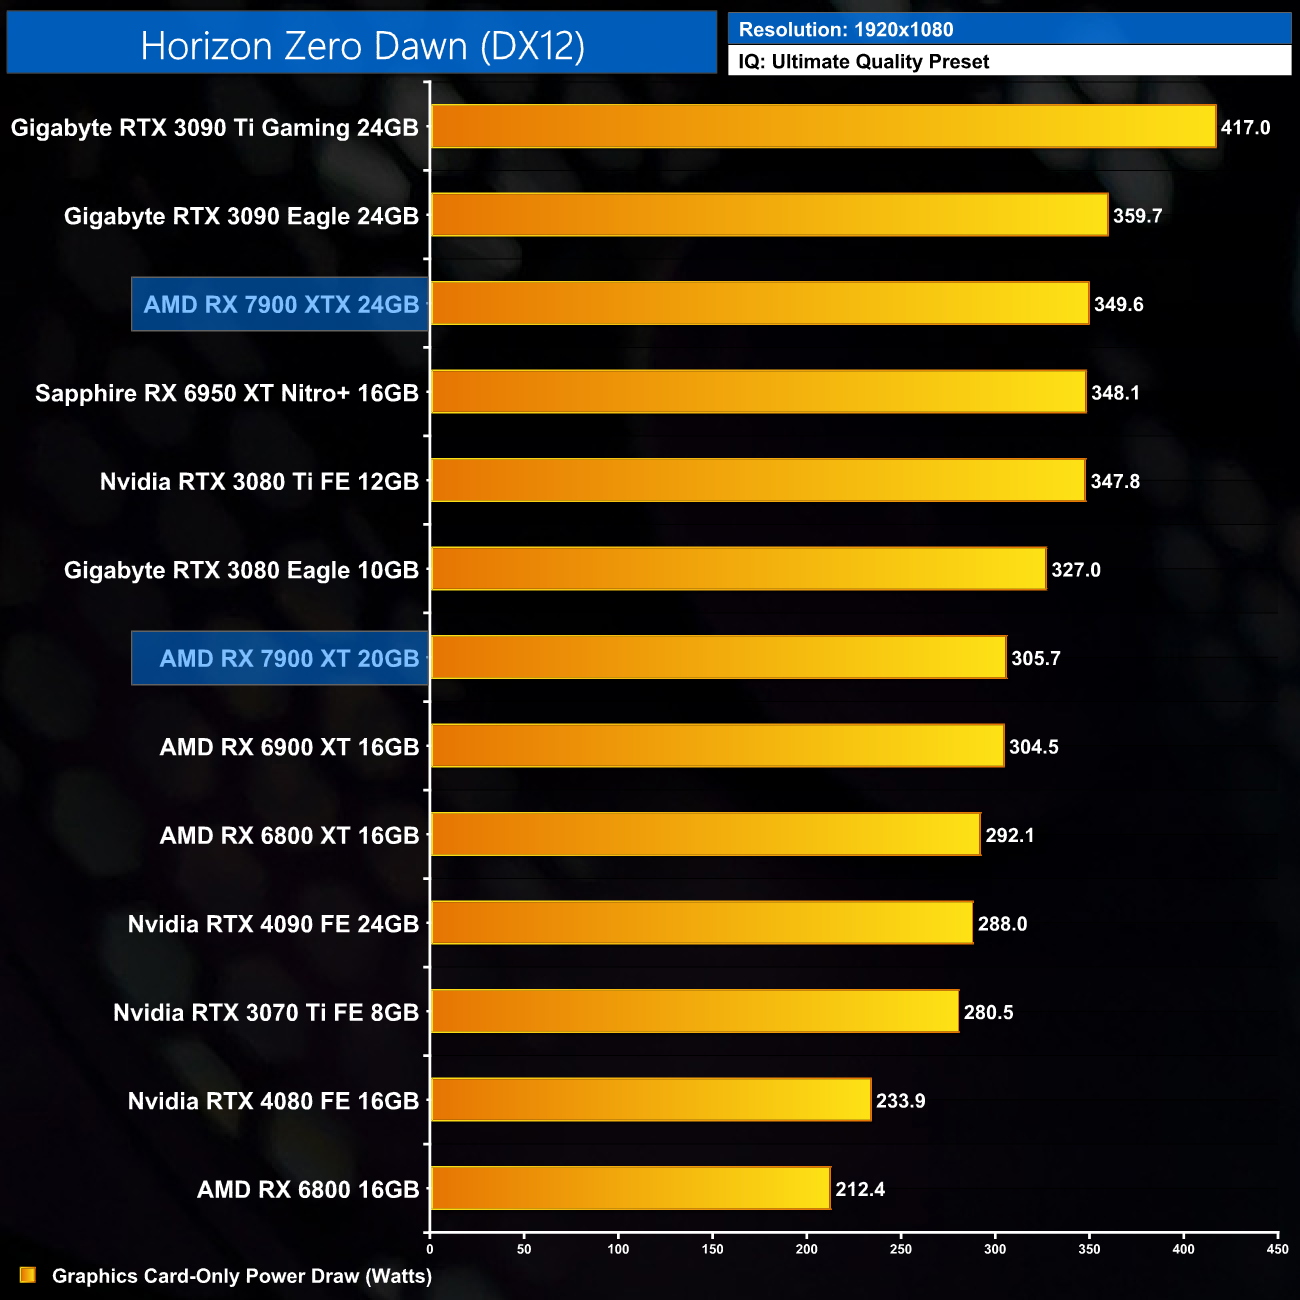
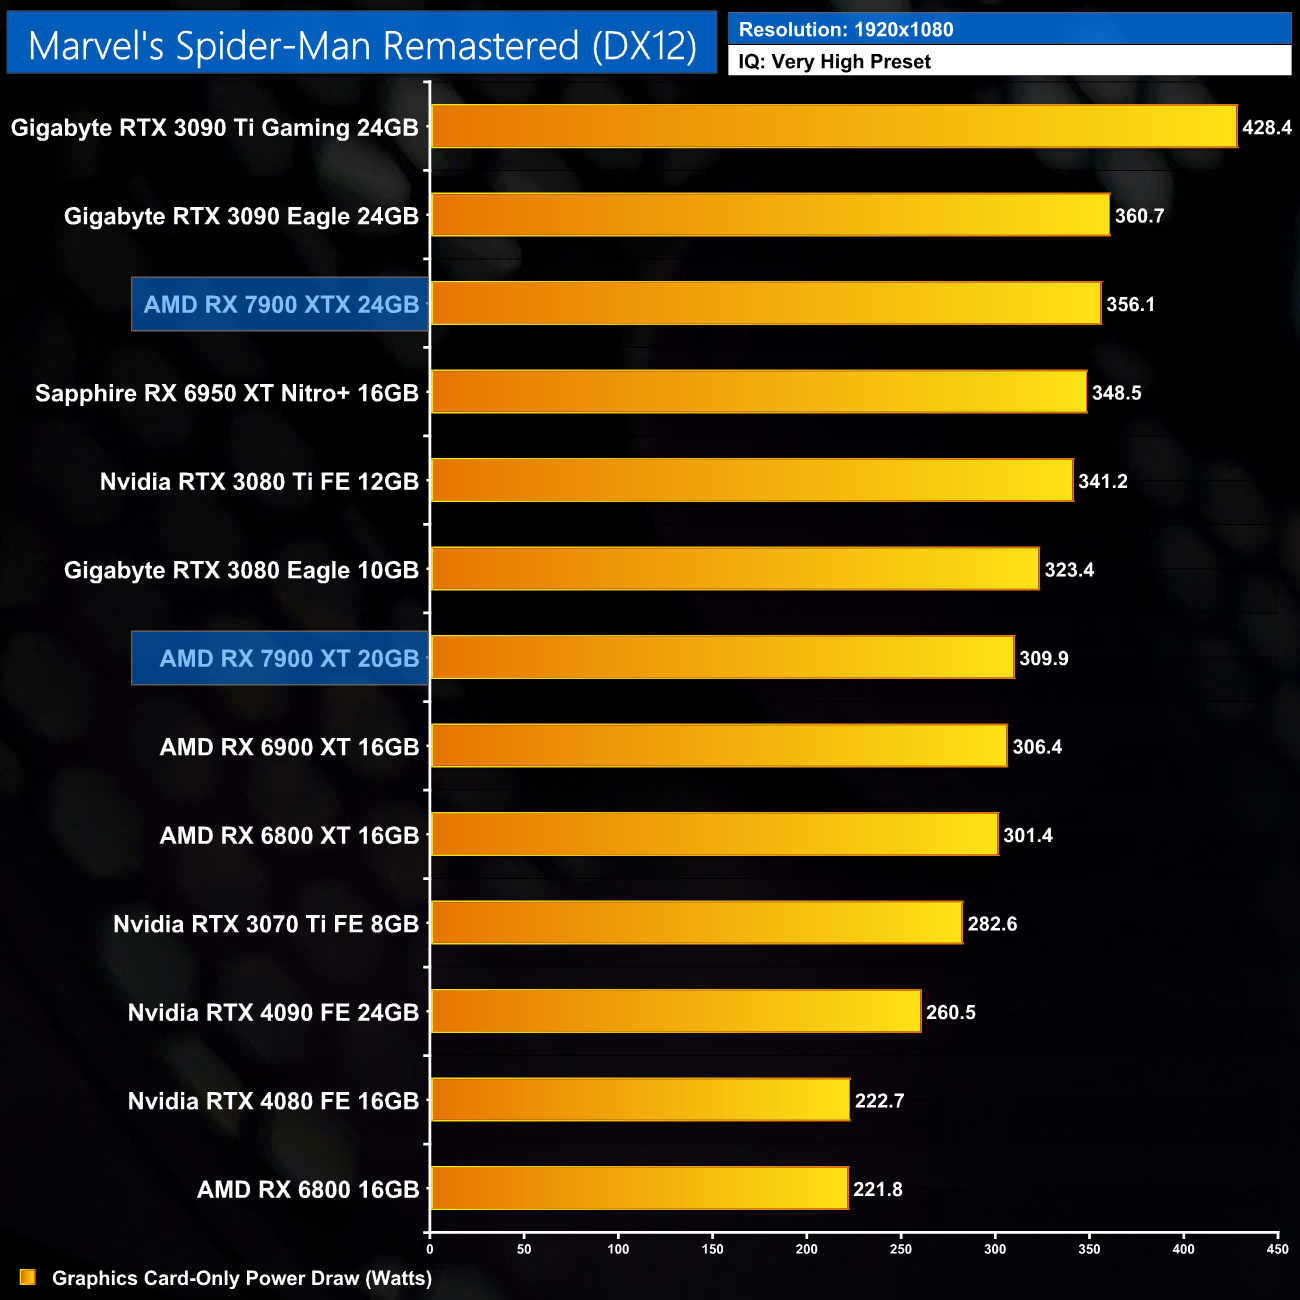

Click to enlarge.
12-Game Average at 1080p:
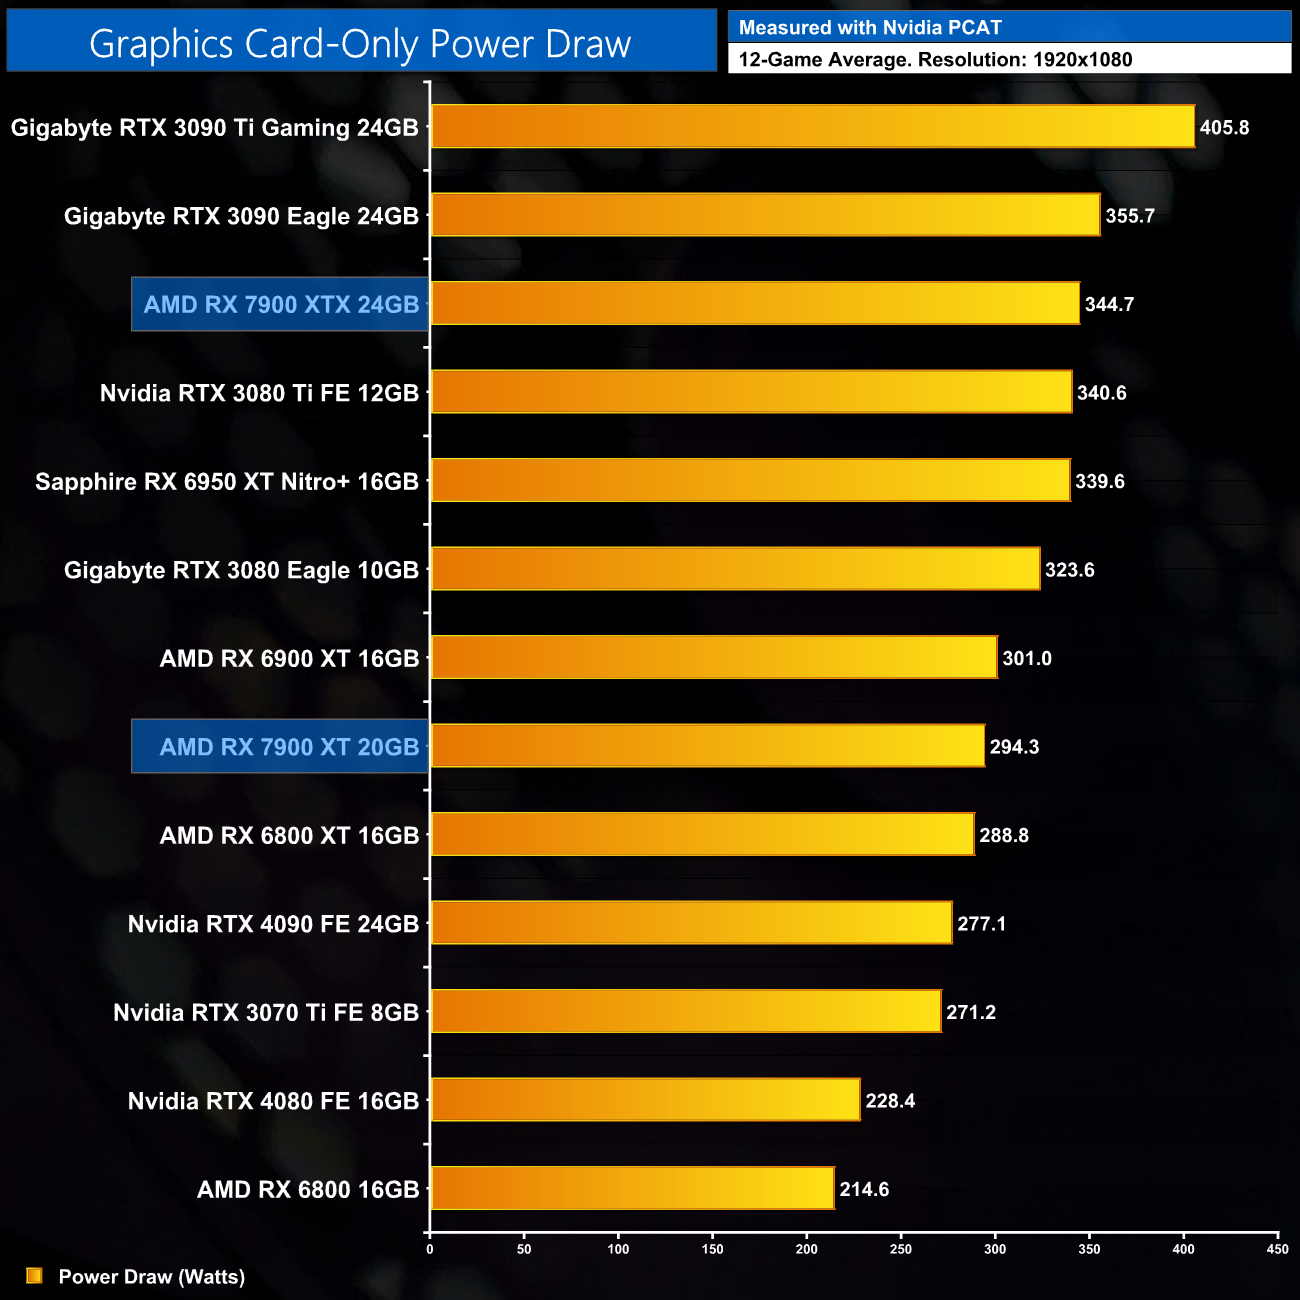
Looking now at power draw, with a 315W TBP rating, at 1080p we saw the 7900 XT average 294.3W over the twelve games we tested – which is actually more power than the RTX 4090.
Here we present power draw figures for the graphics card-only, on a per-game basis for all twelve games we tested at 1440p. This is measured using Nvidia's Power Capture Analysis Tool, also known as PCAT. You can read more about our updated power draw testing methodology HERE.
Per-Game Results at 1440p:


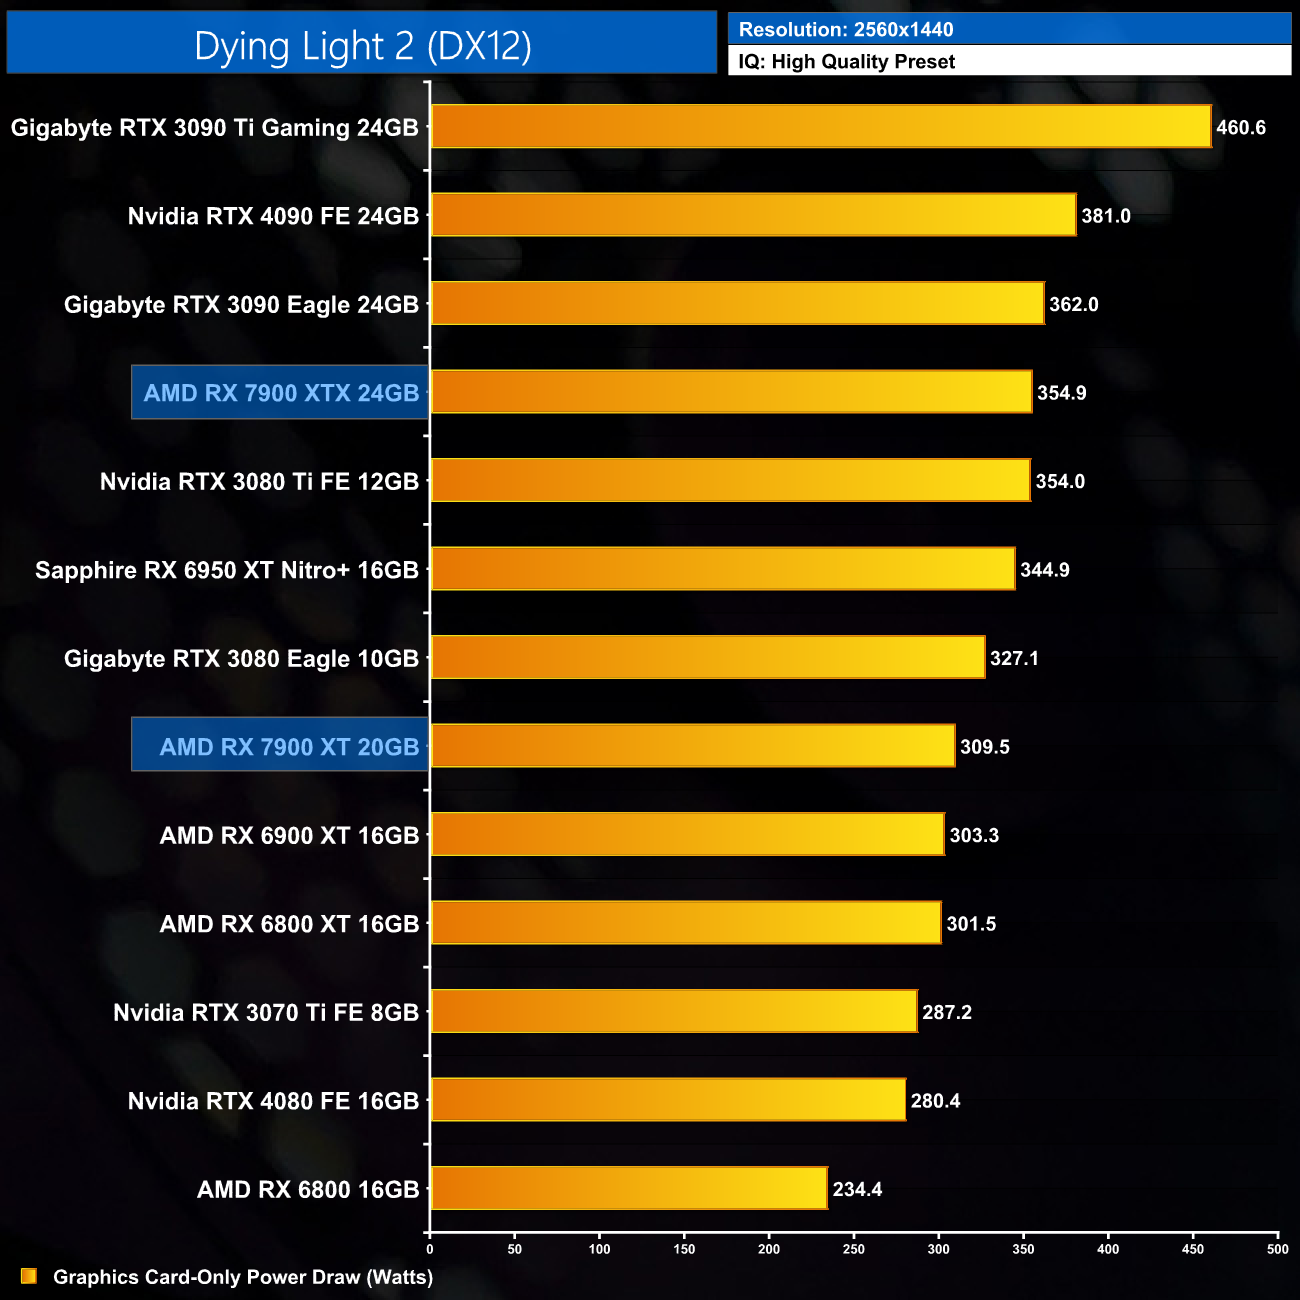
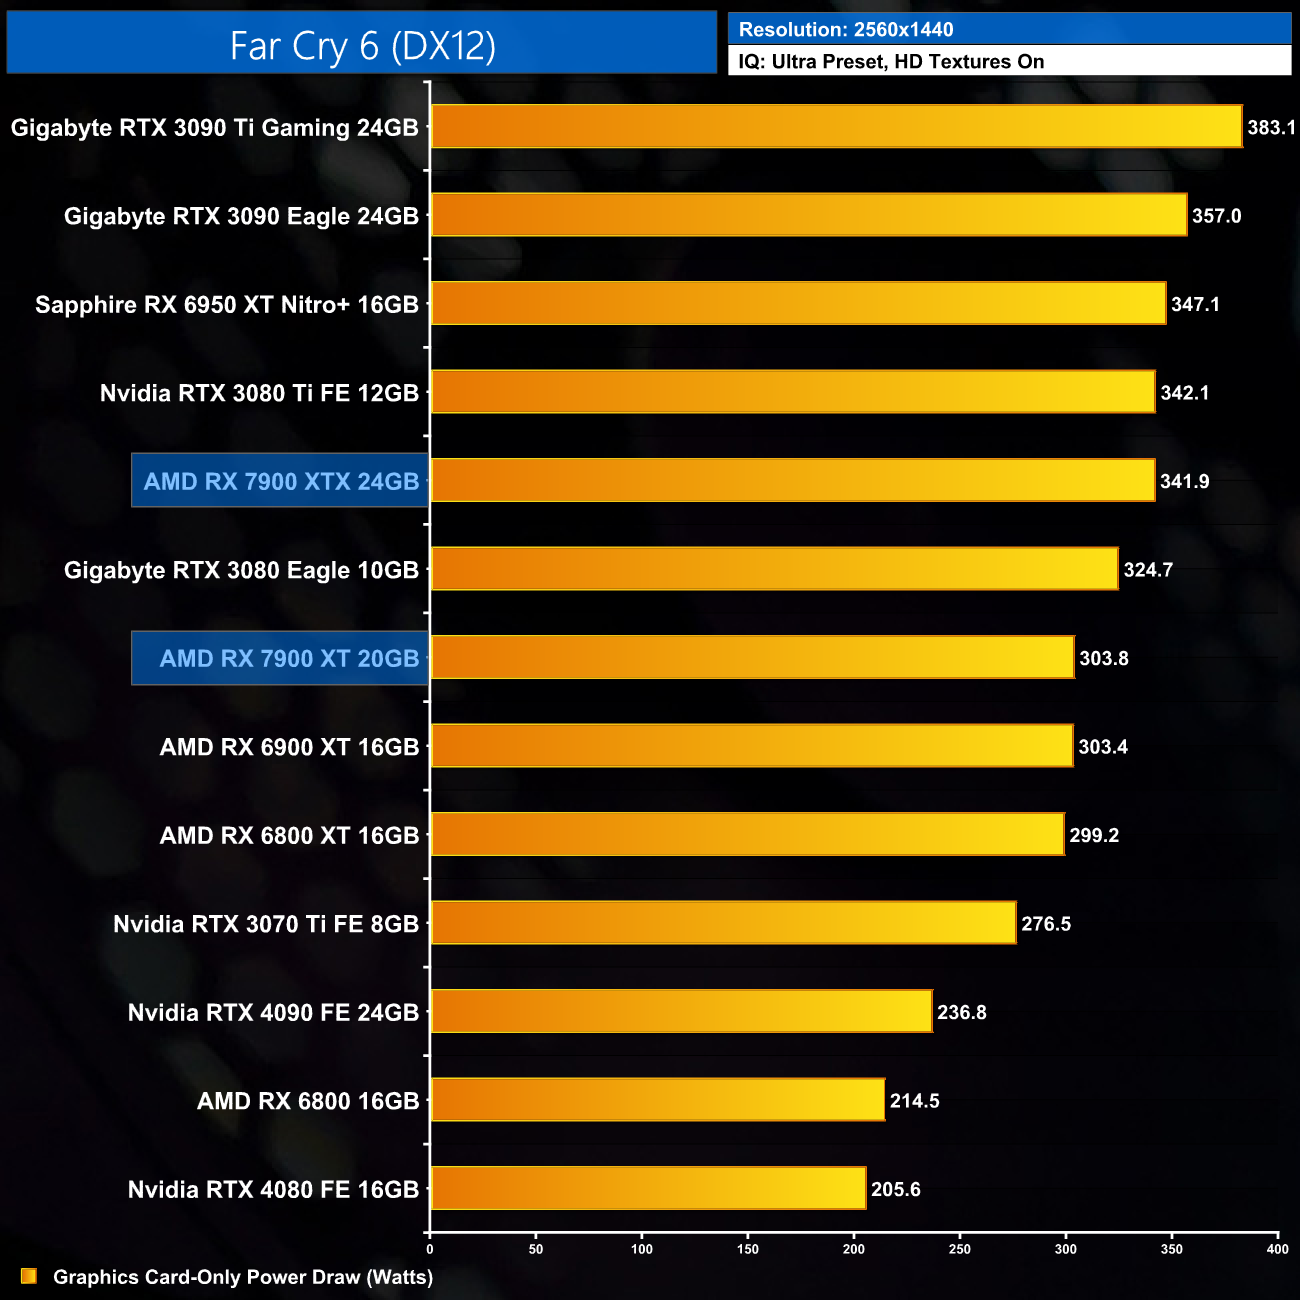
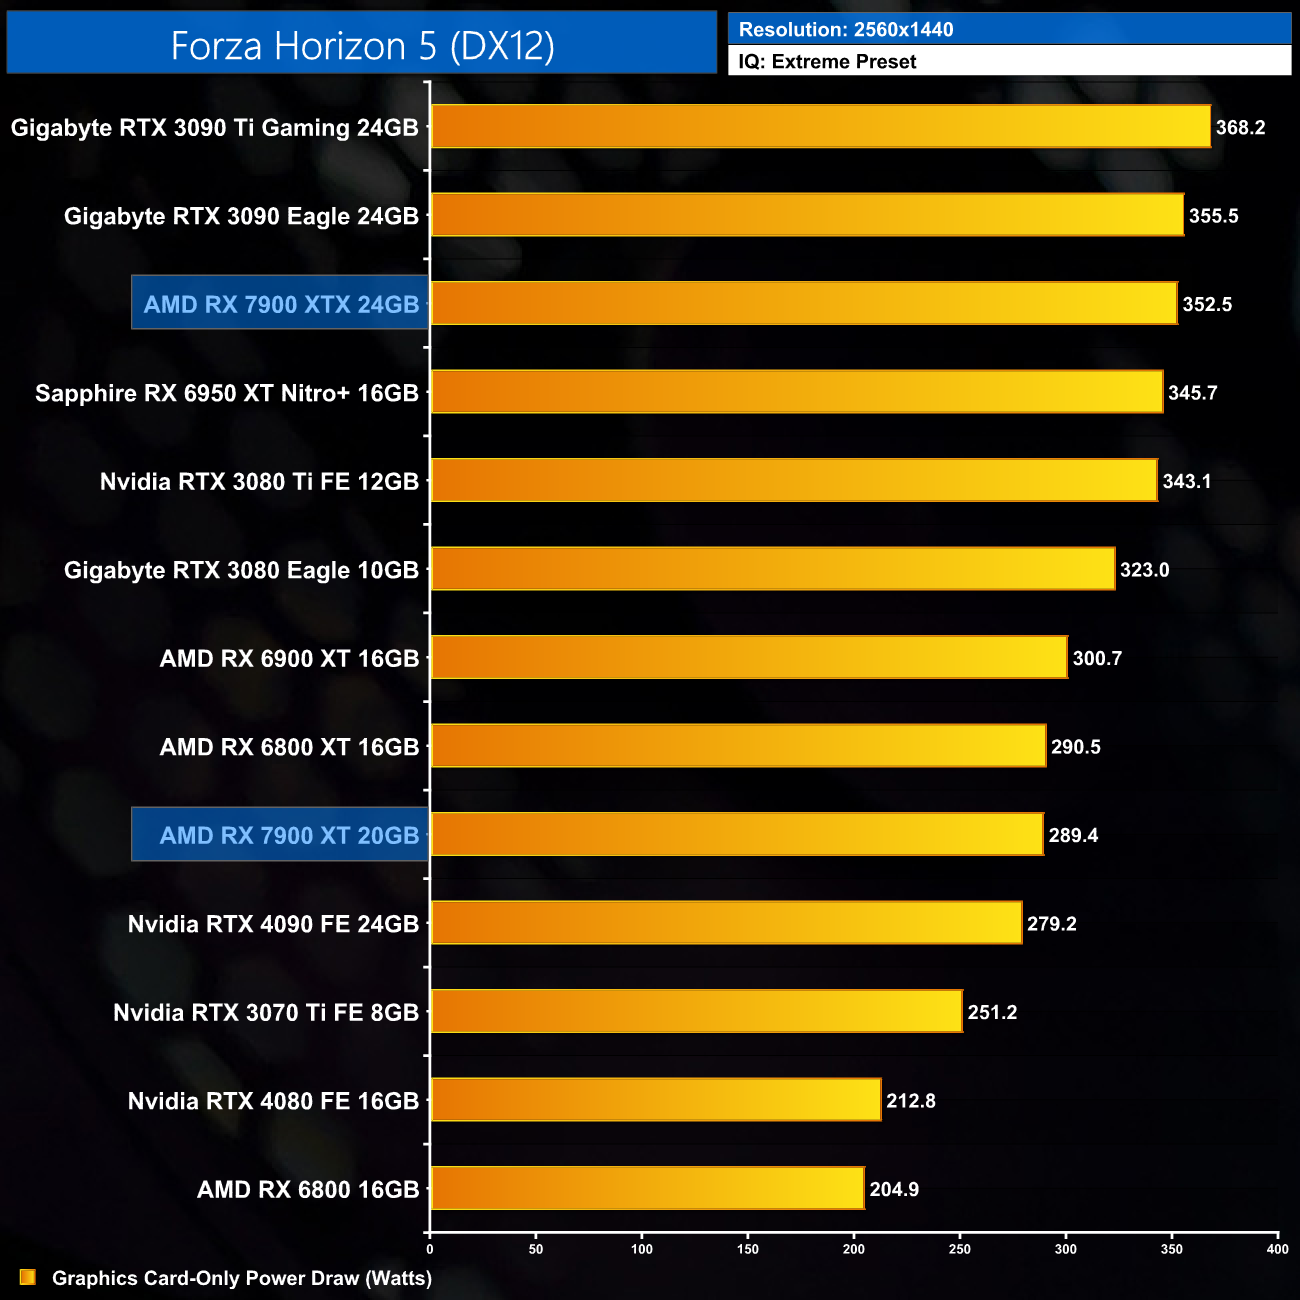
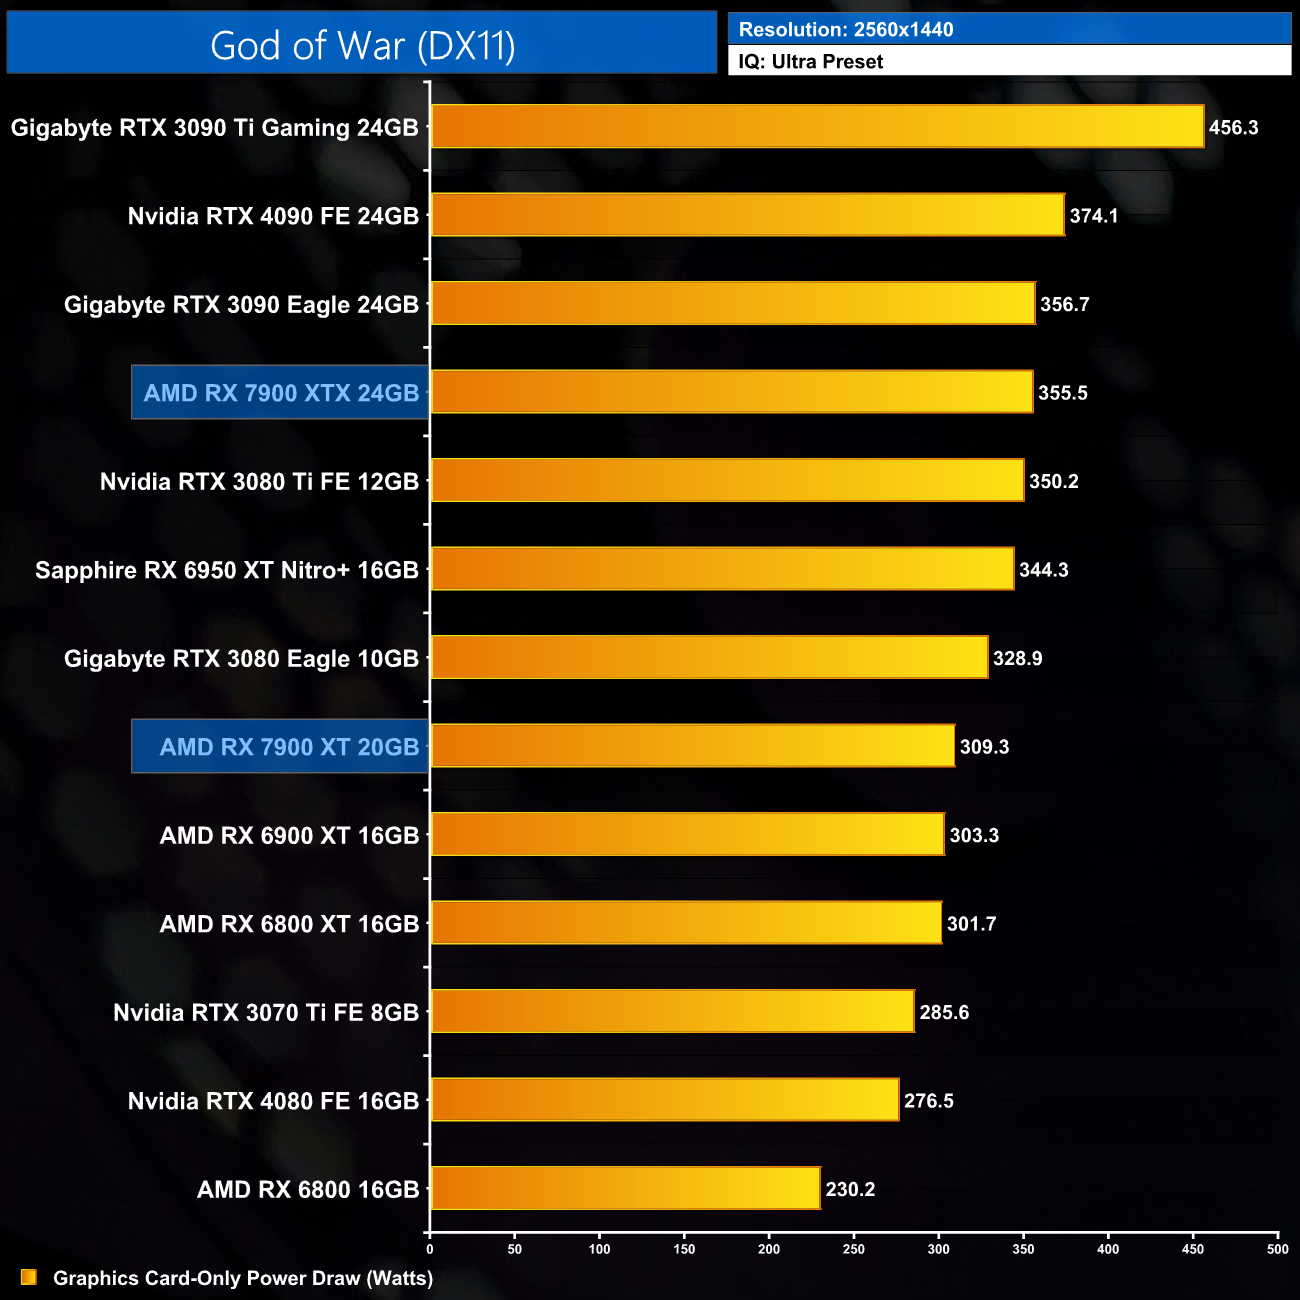
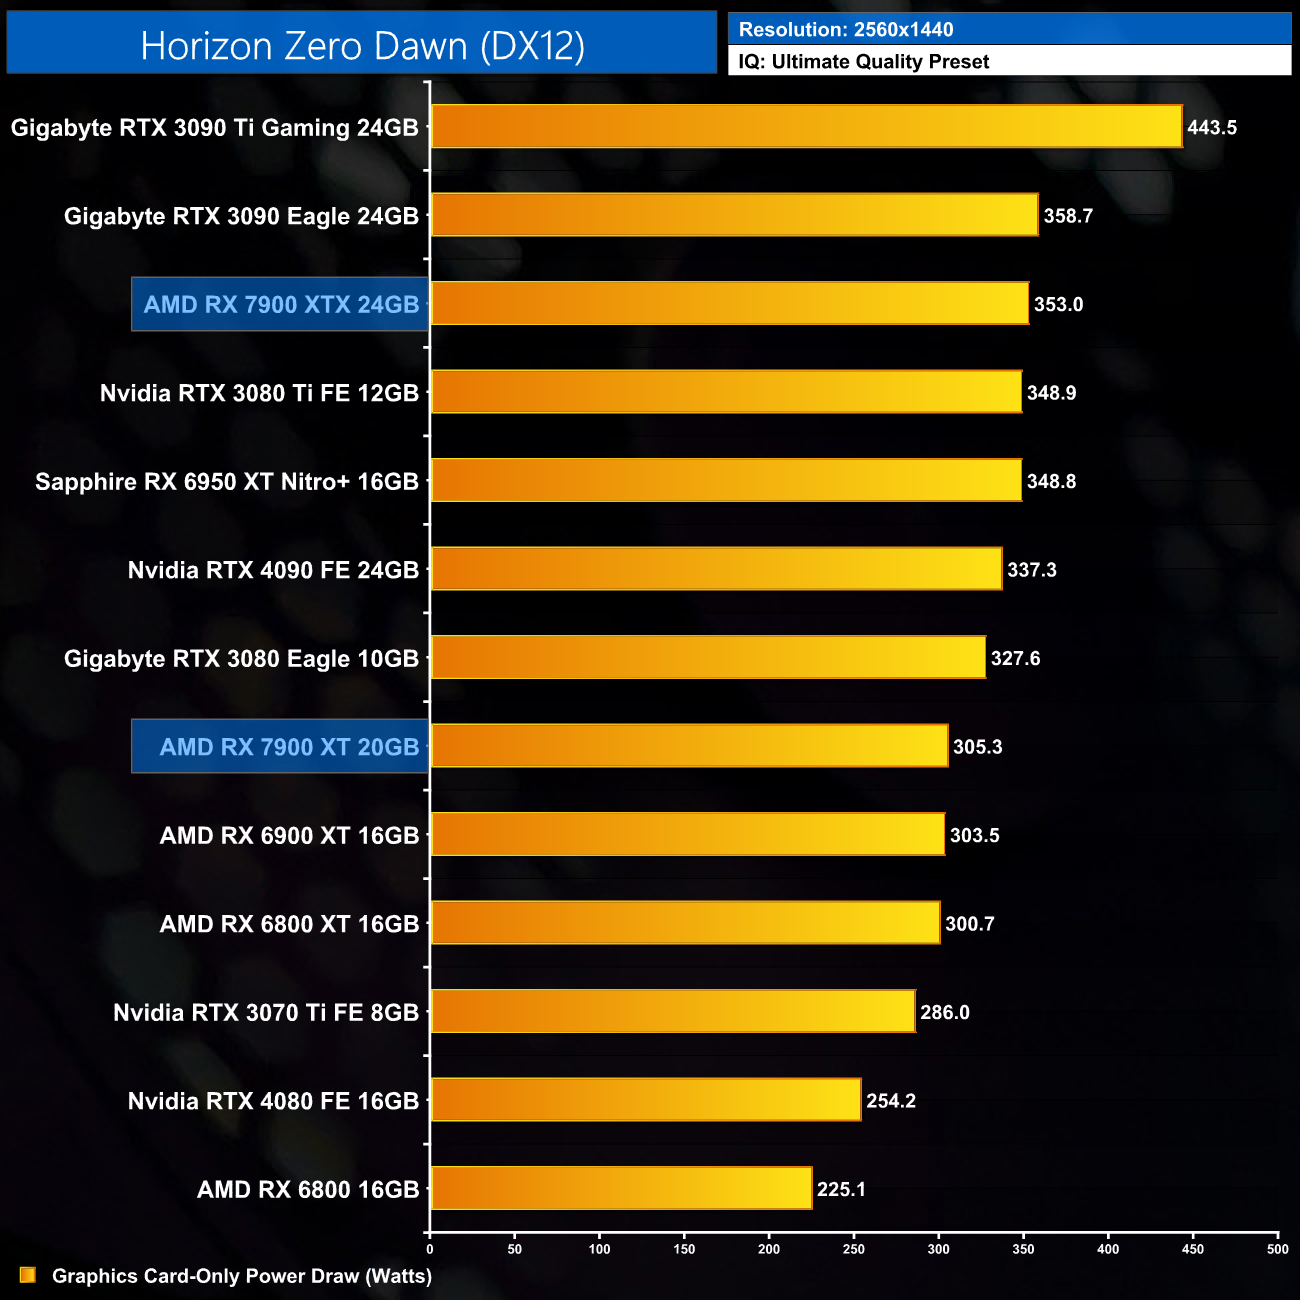
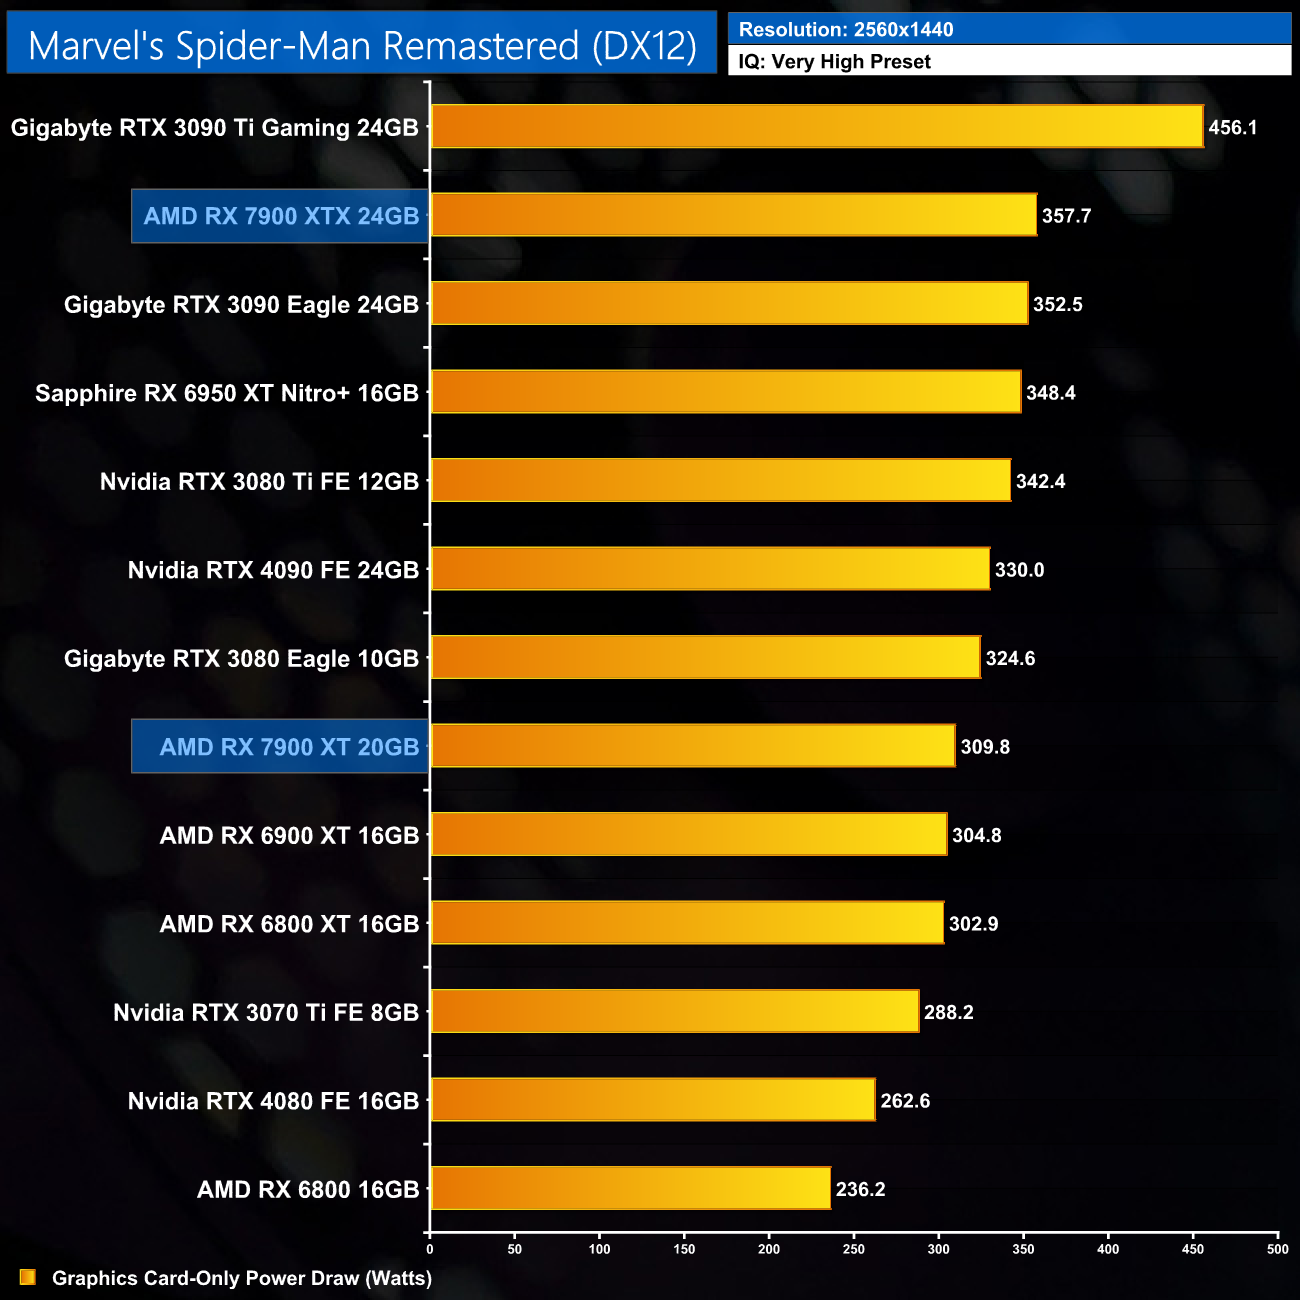
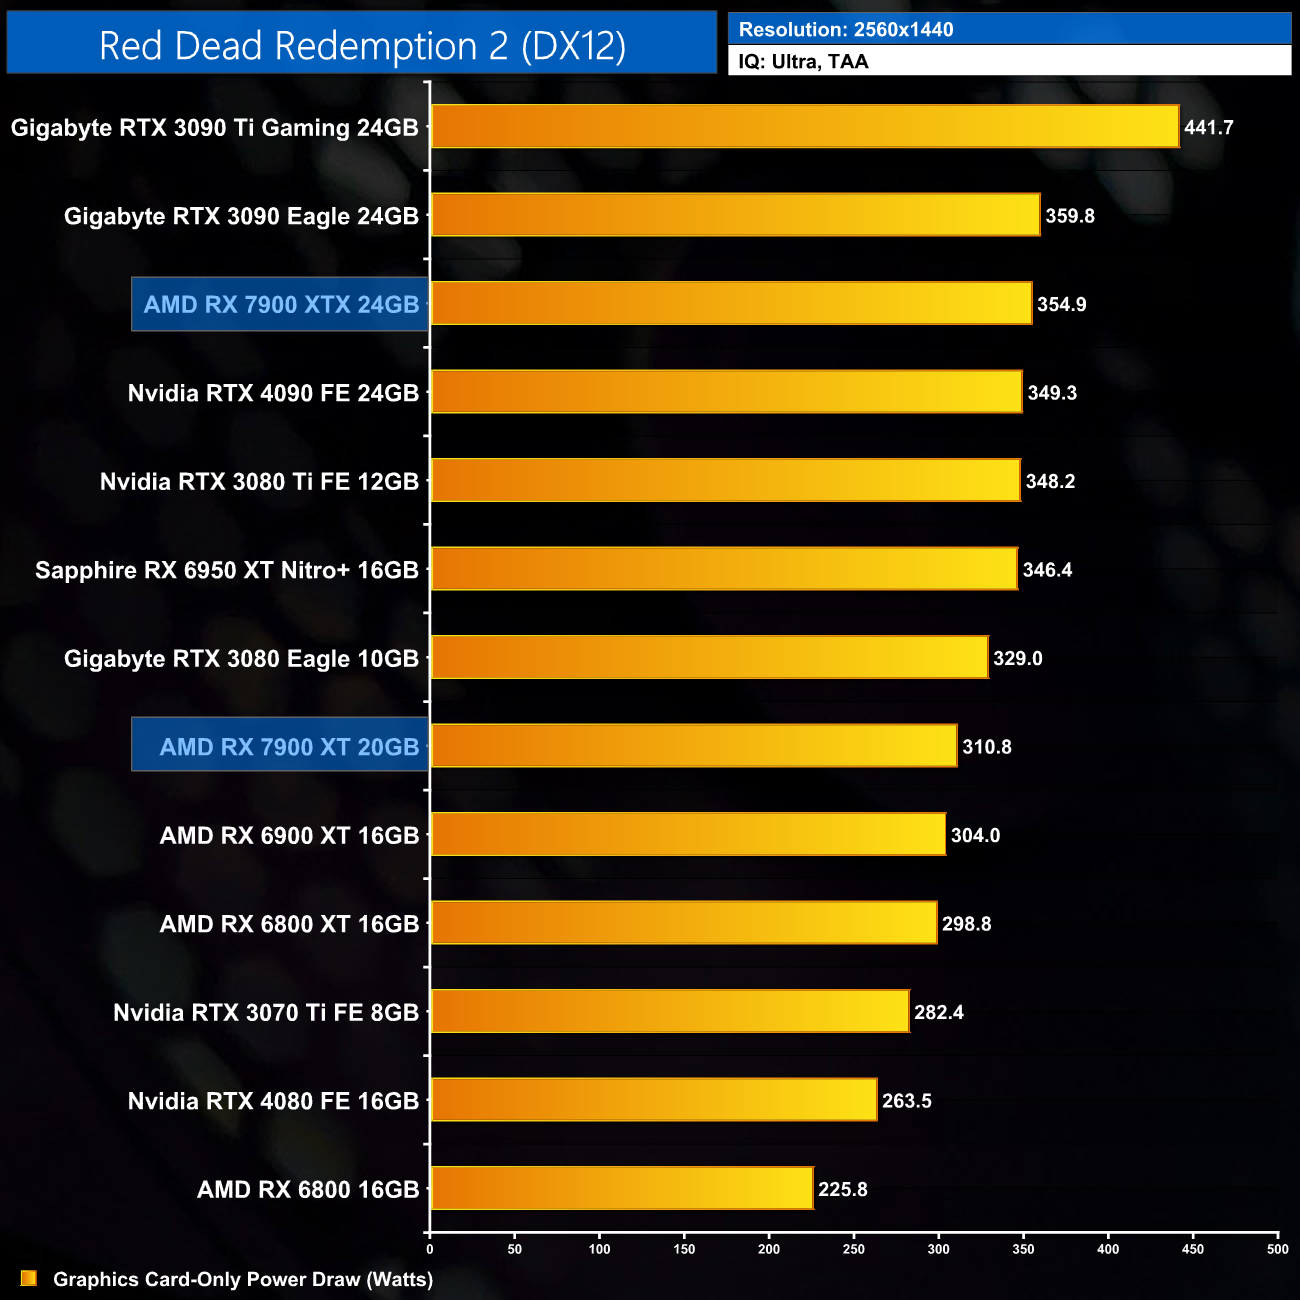
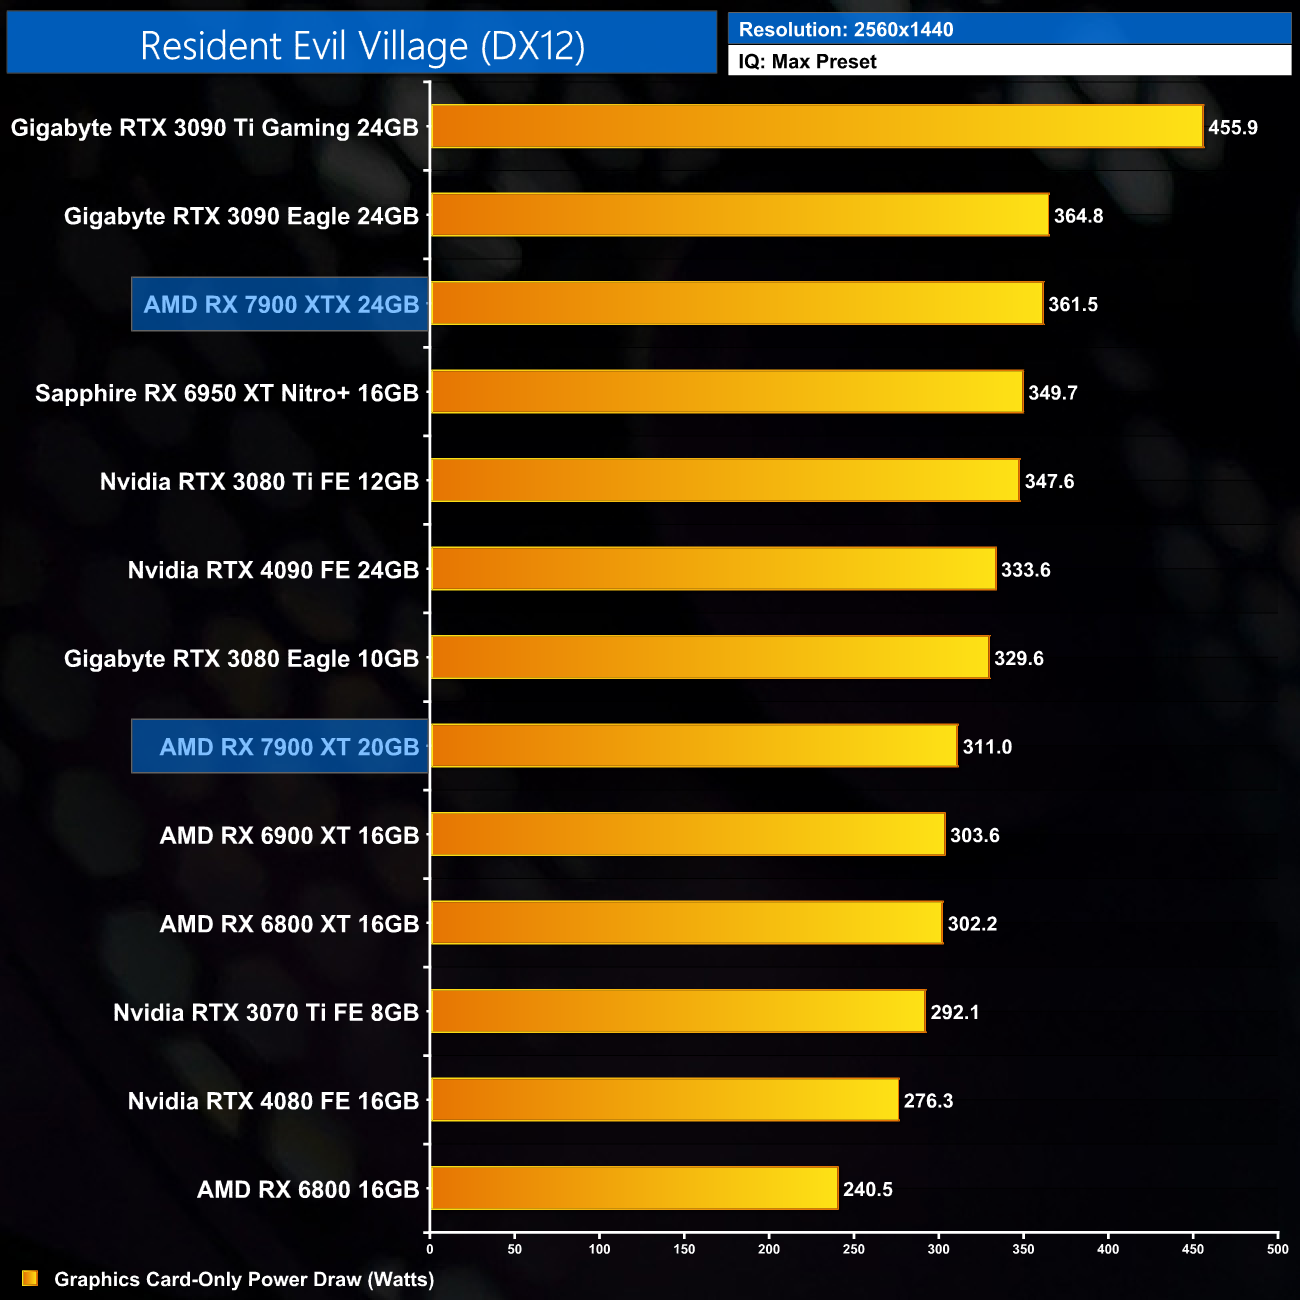
Click to enlarge.
12-Game Average at 1440p:
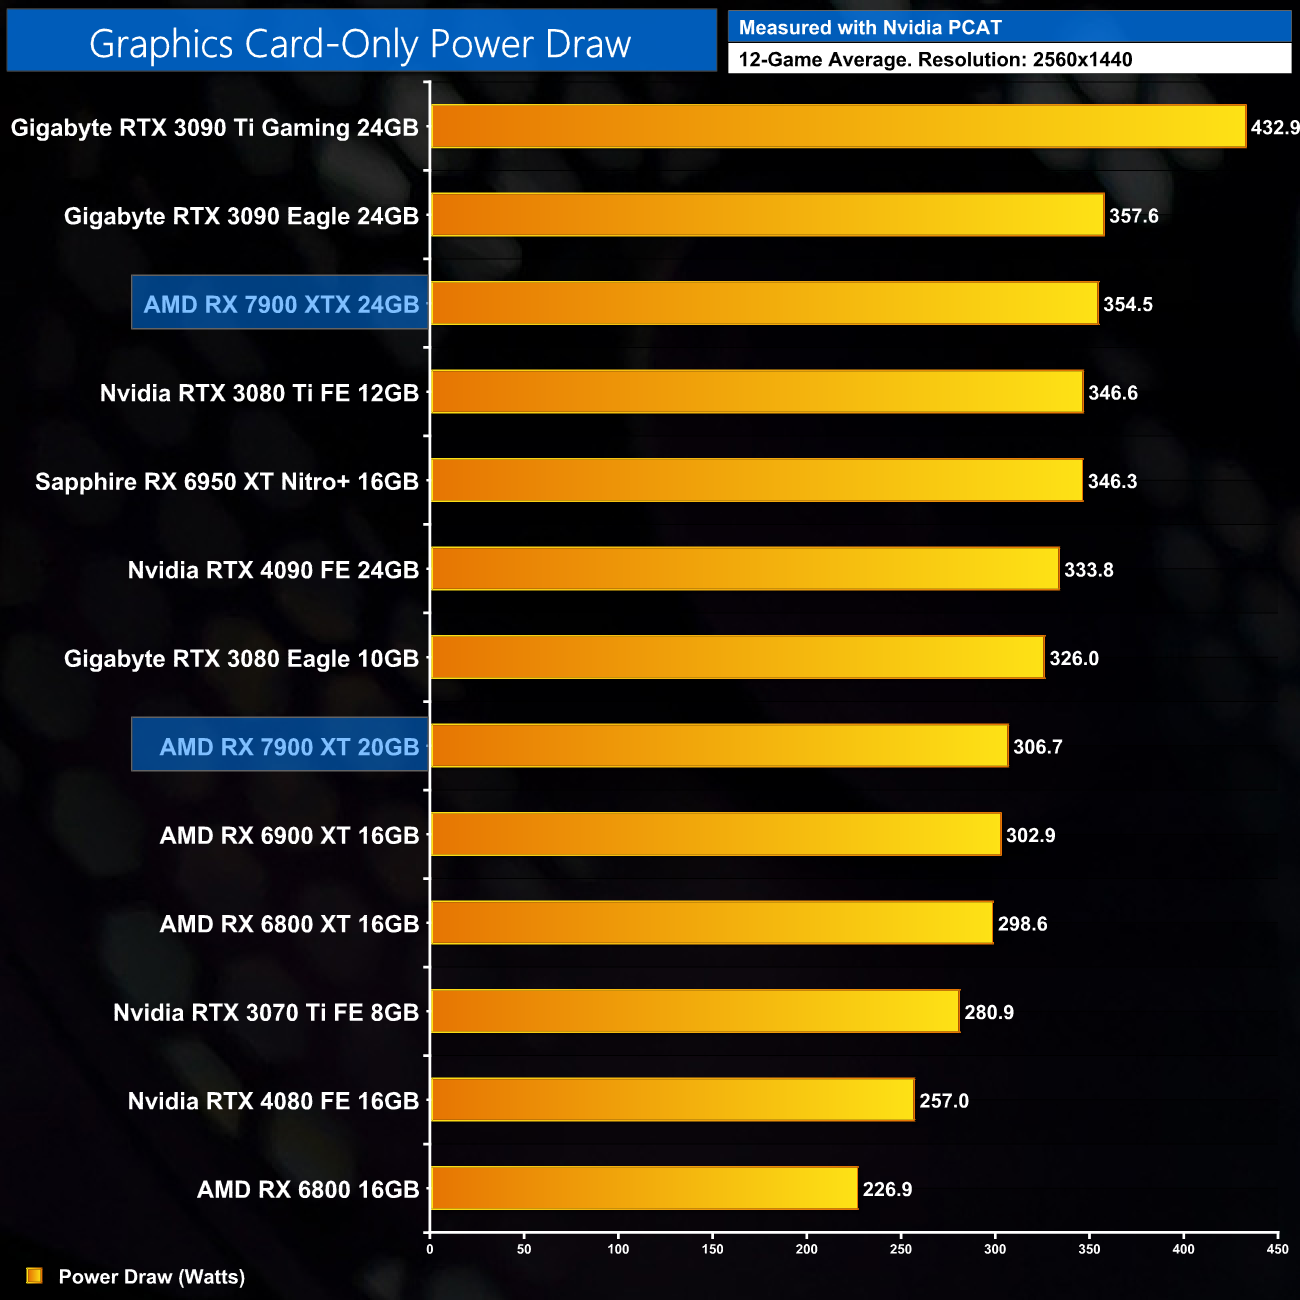
As for 1440p, here the RX 7900 XT averaged 306.7W across our testing, just slightly below its 315W TBP. Nvidia GPUs have a clear advantage in terms of power draw however, as they draw significantly less when not fully utilised, whereas RDNA 3 GPUs still draw similar amounts of power even when not fully loaded. Far Cry 6 and Forza Horizon 5 are great examples of this.
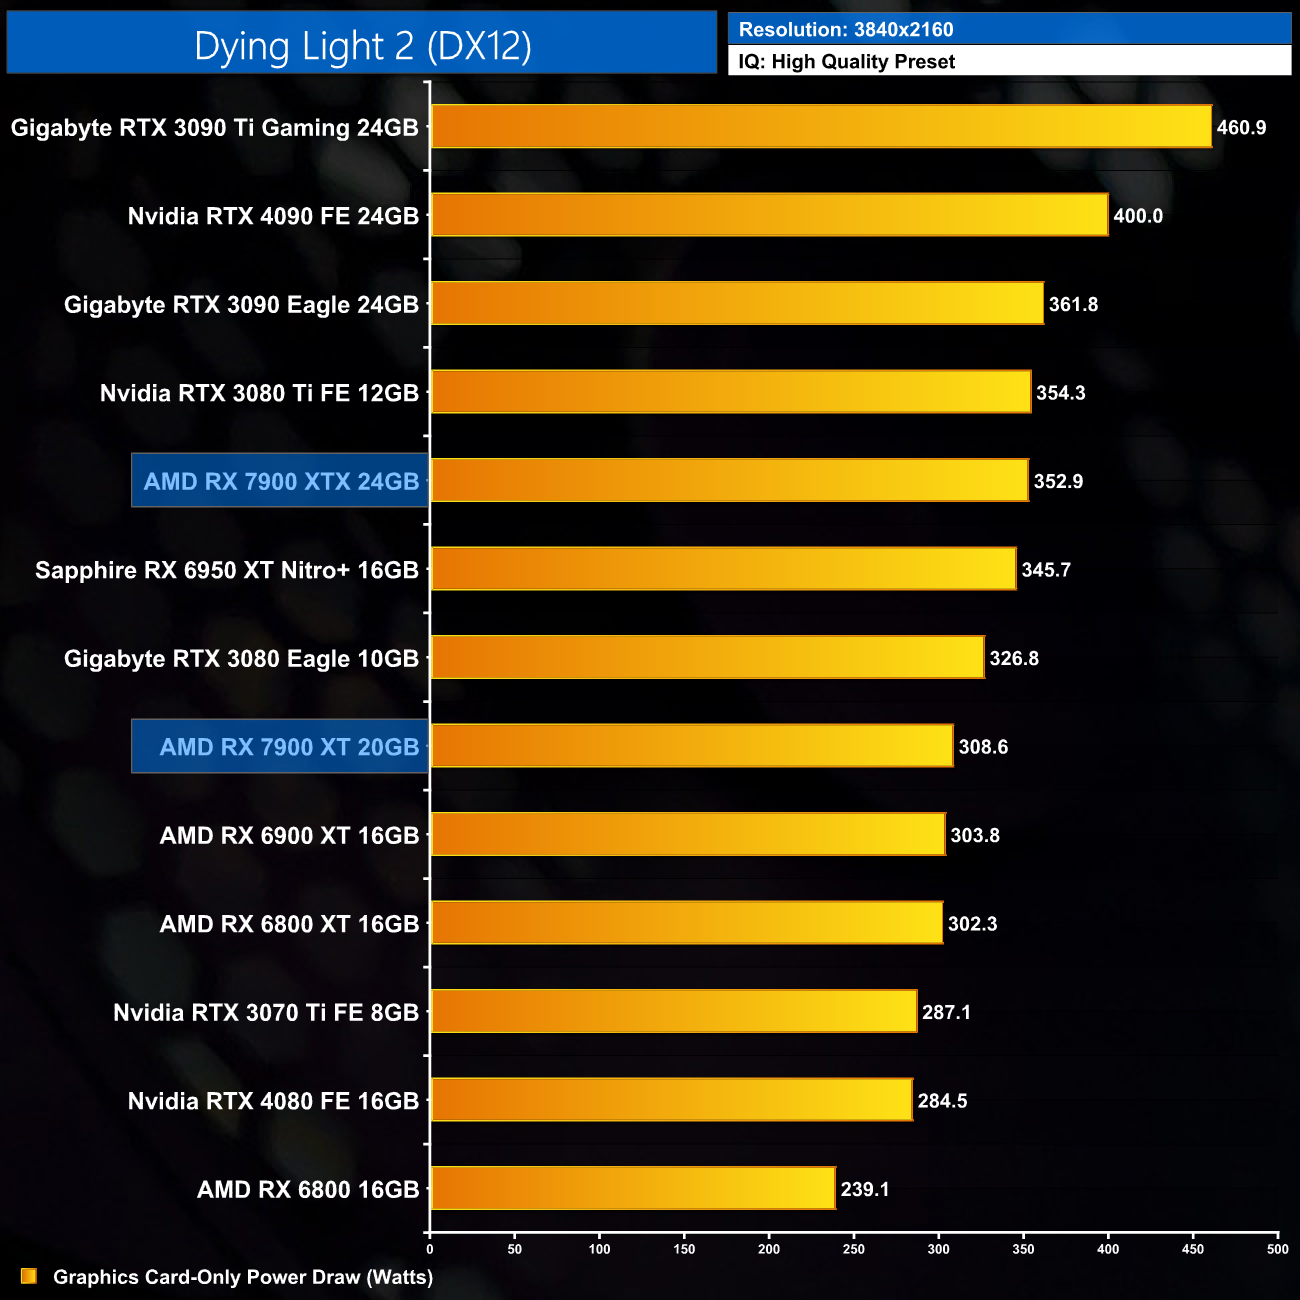
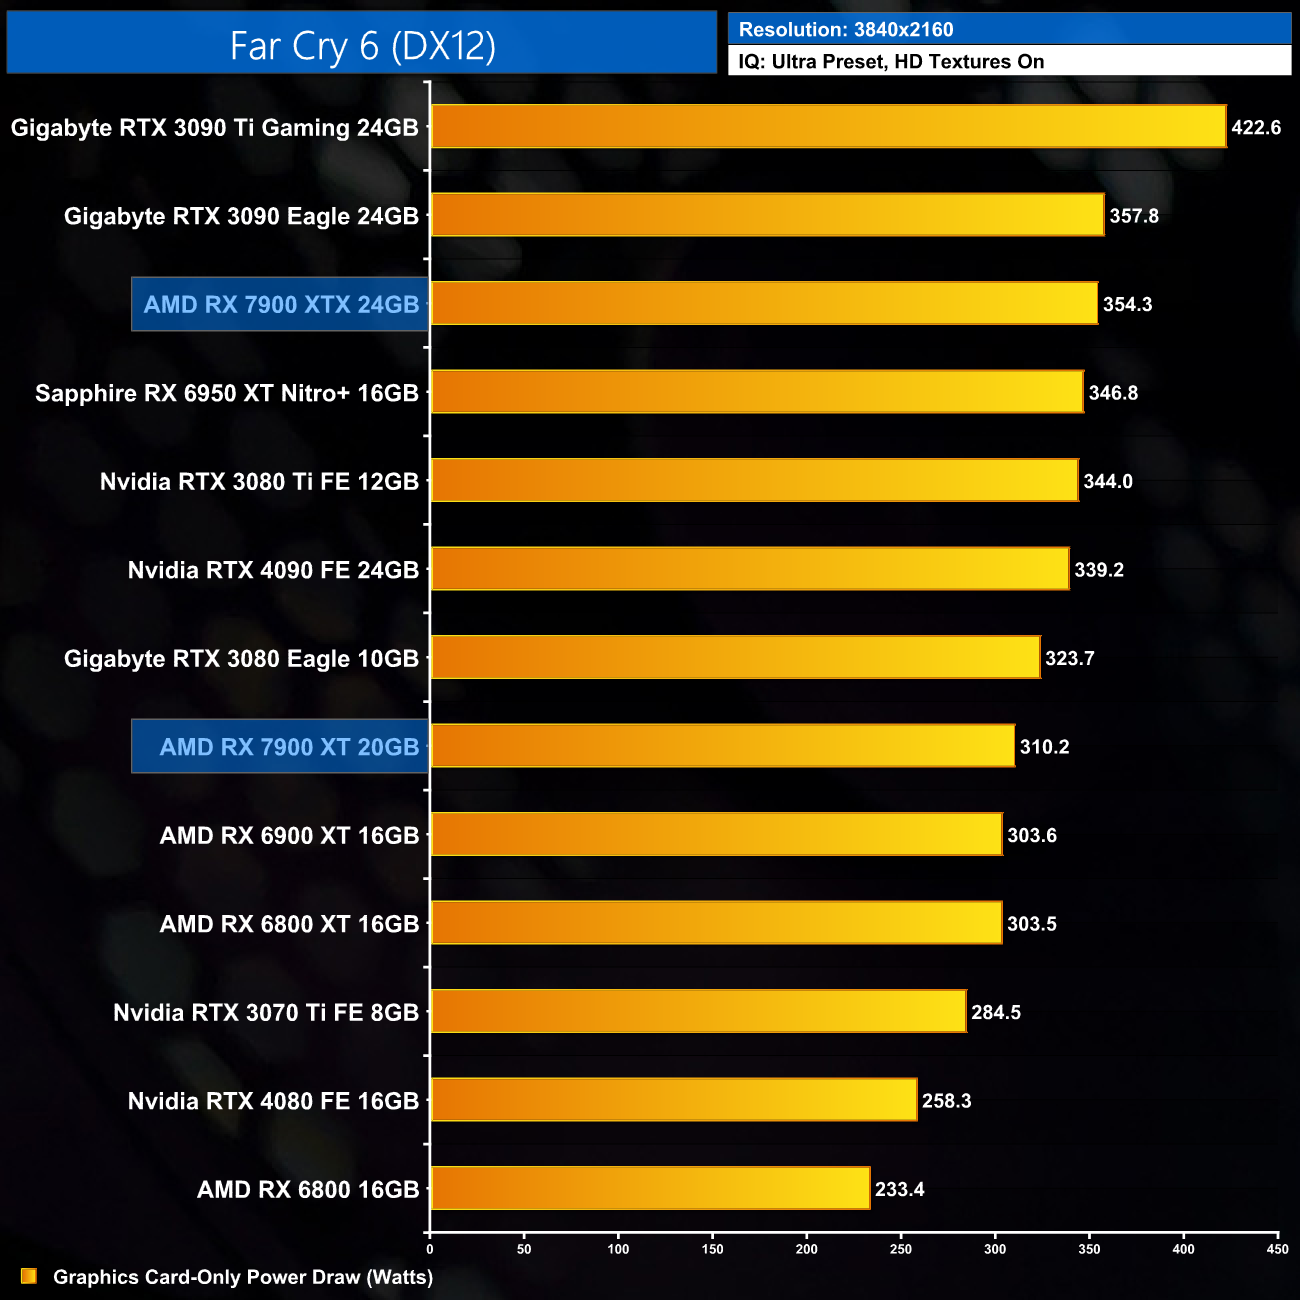
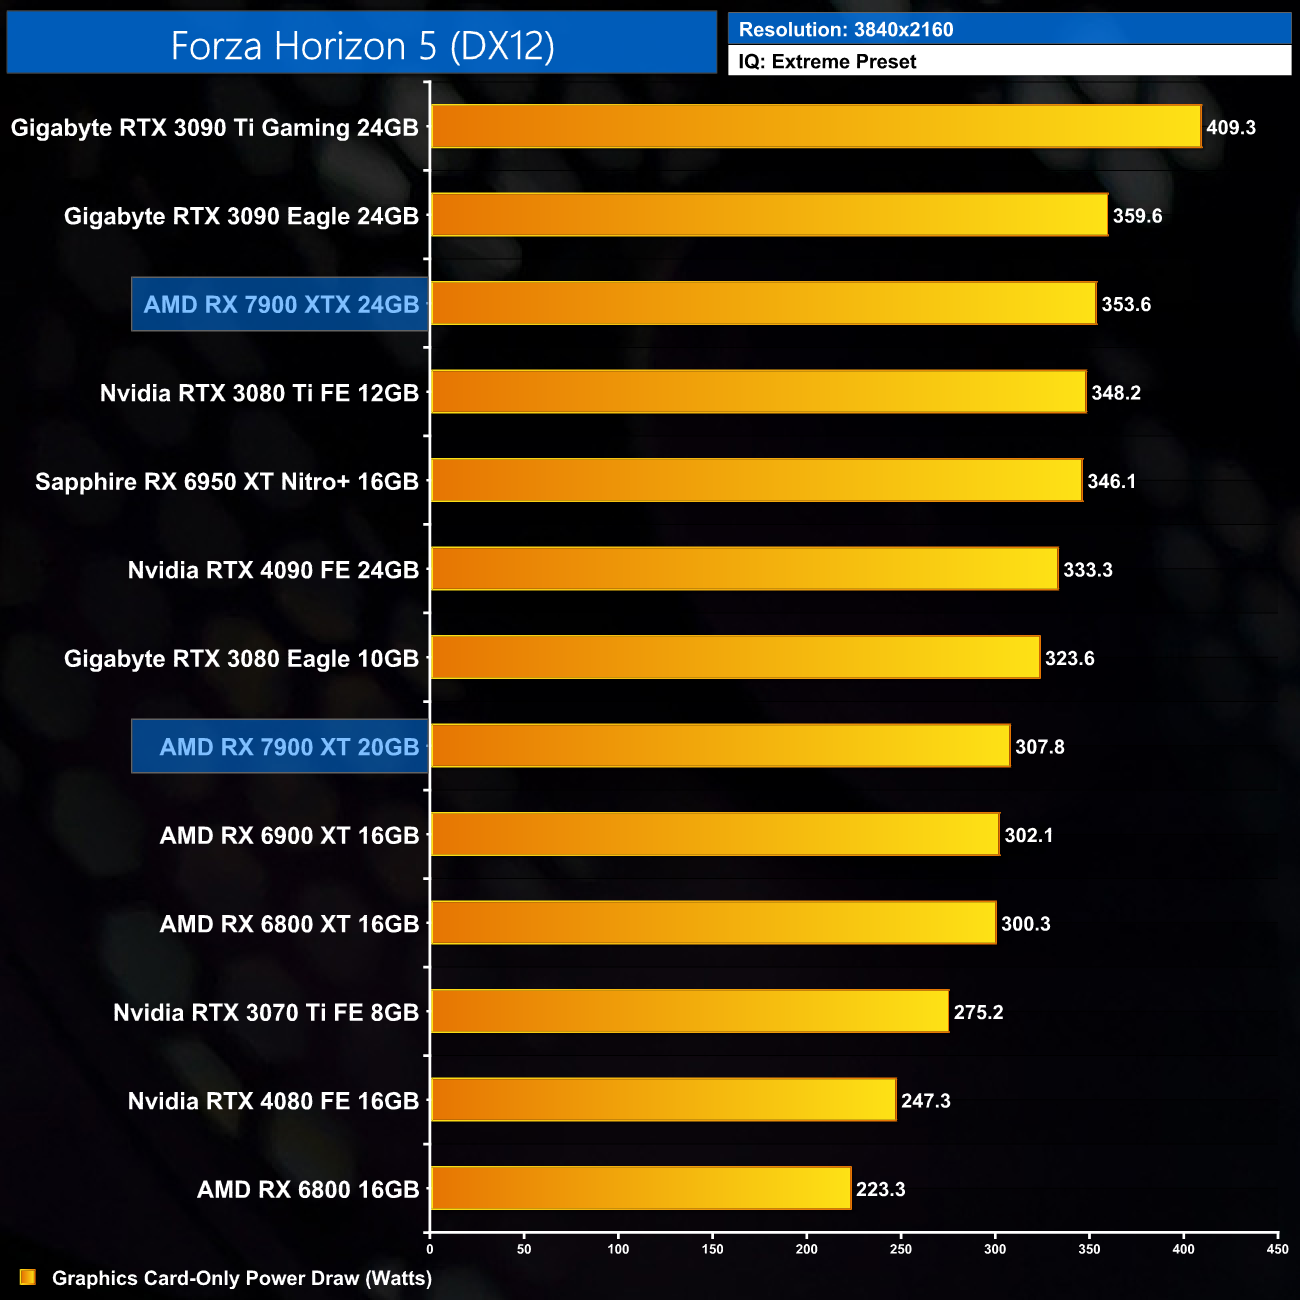
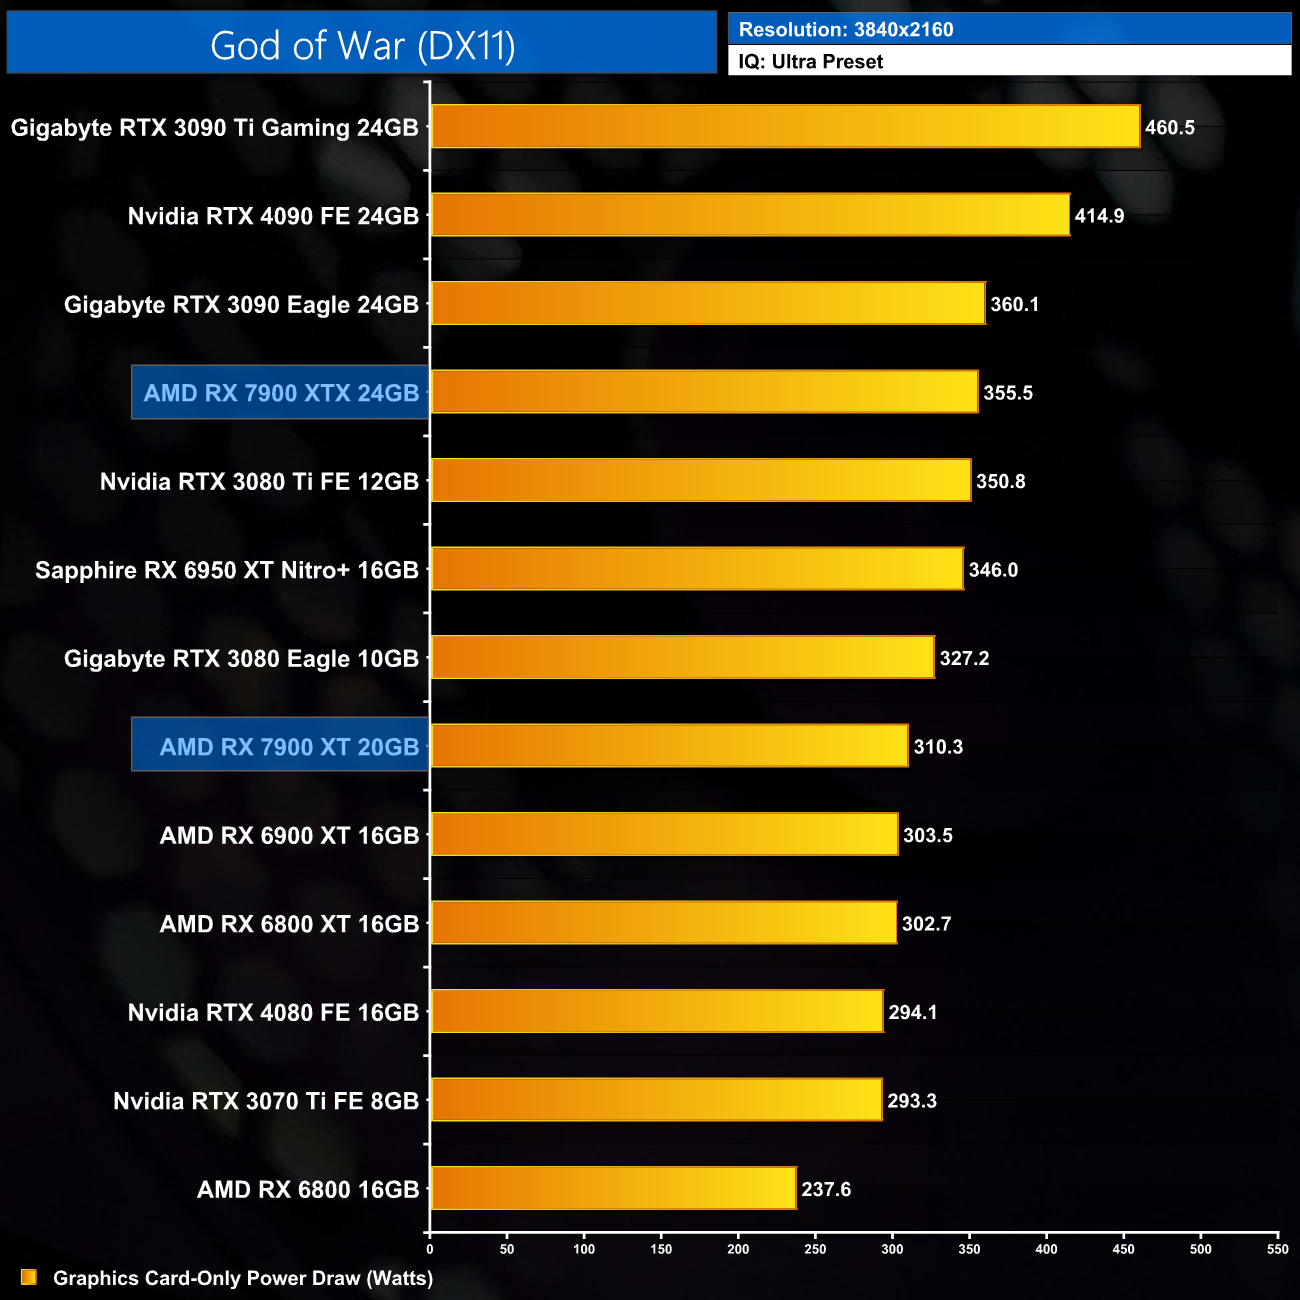
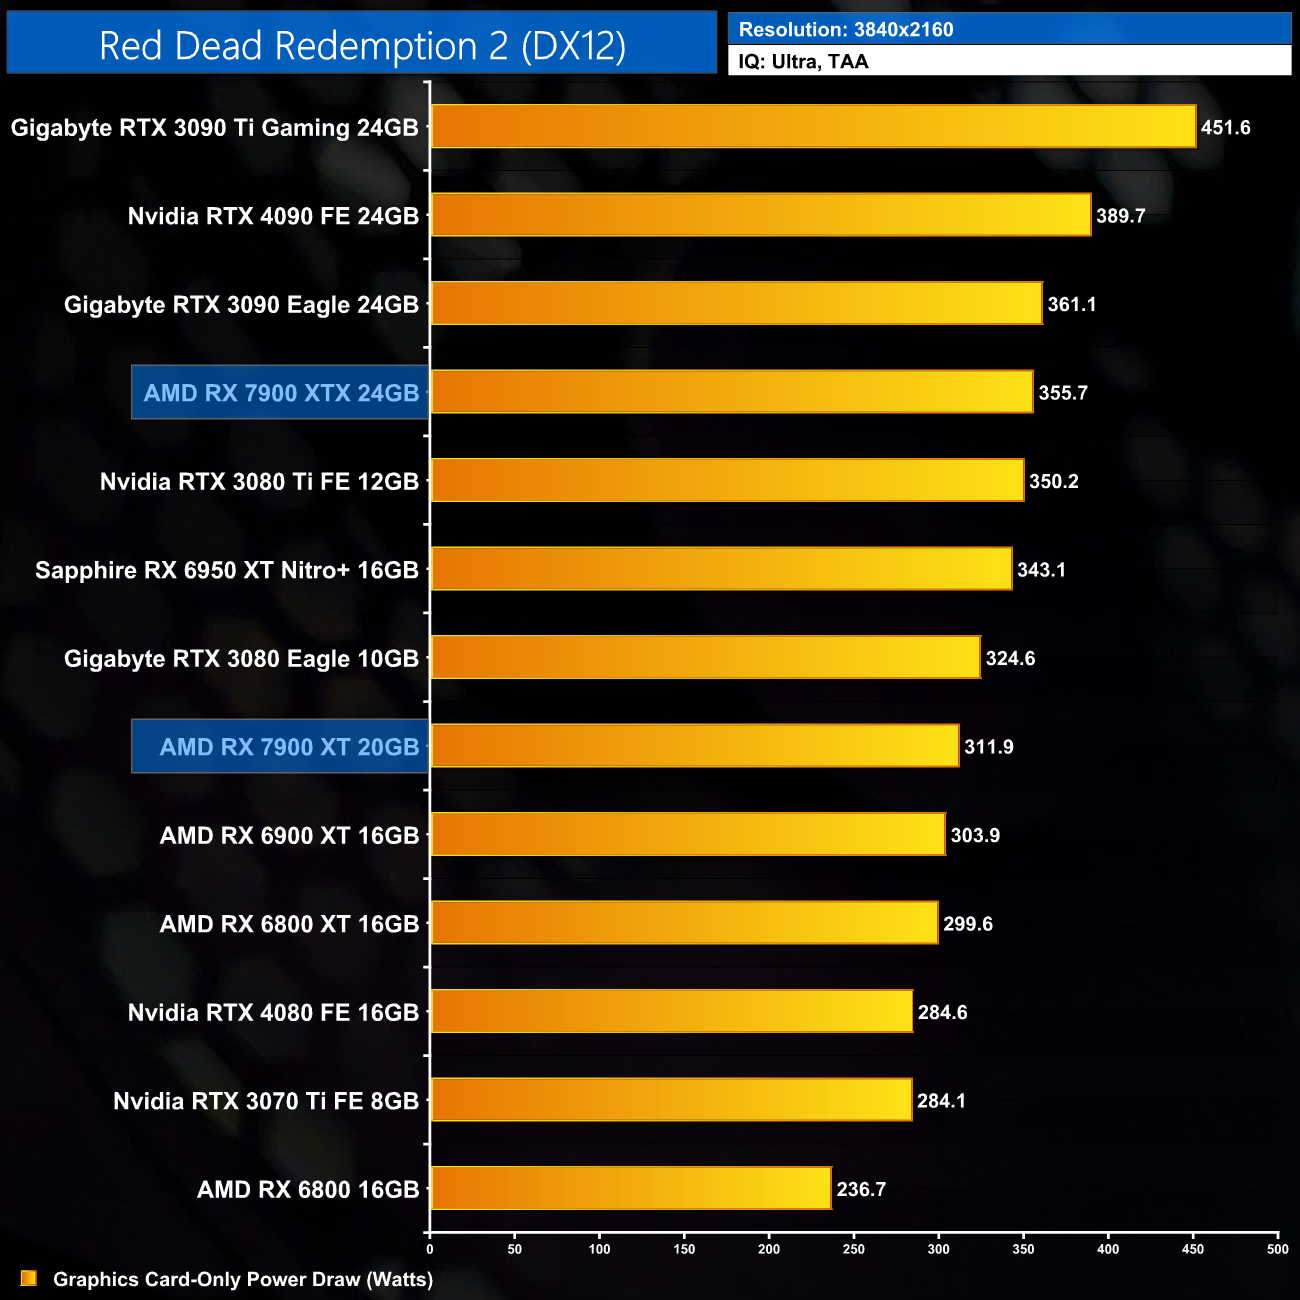
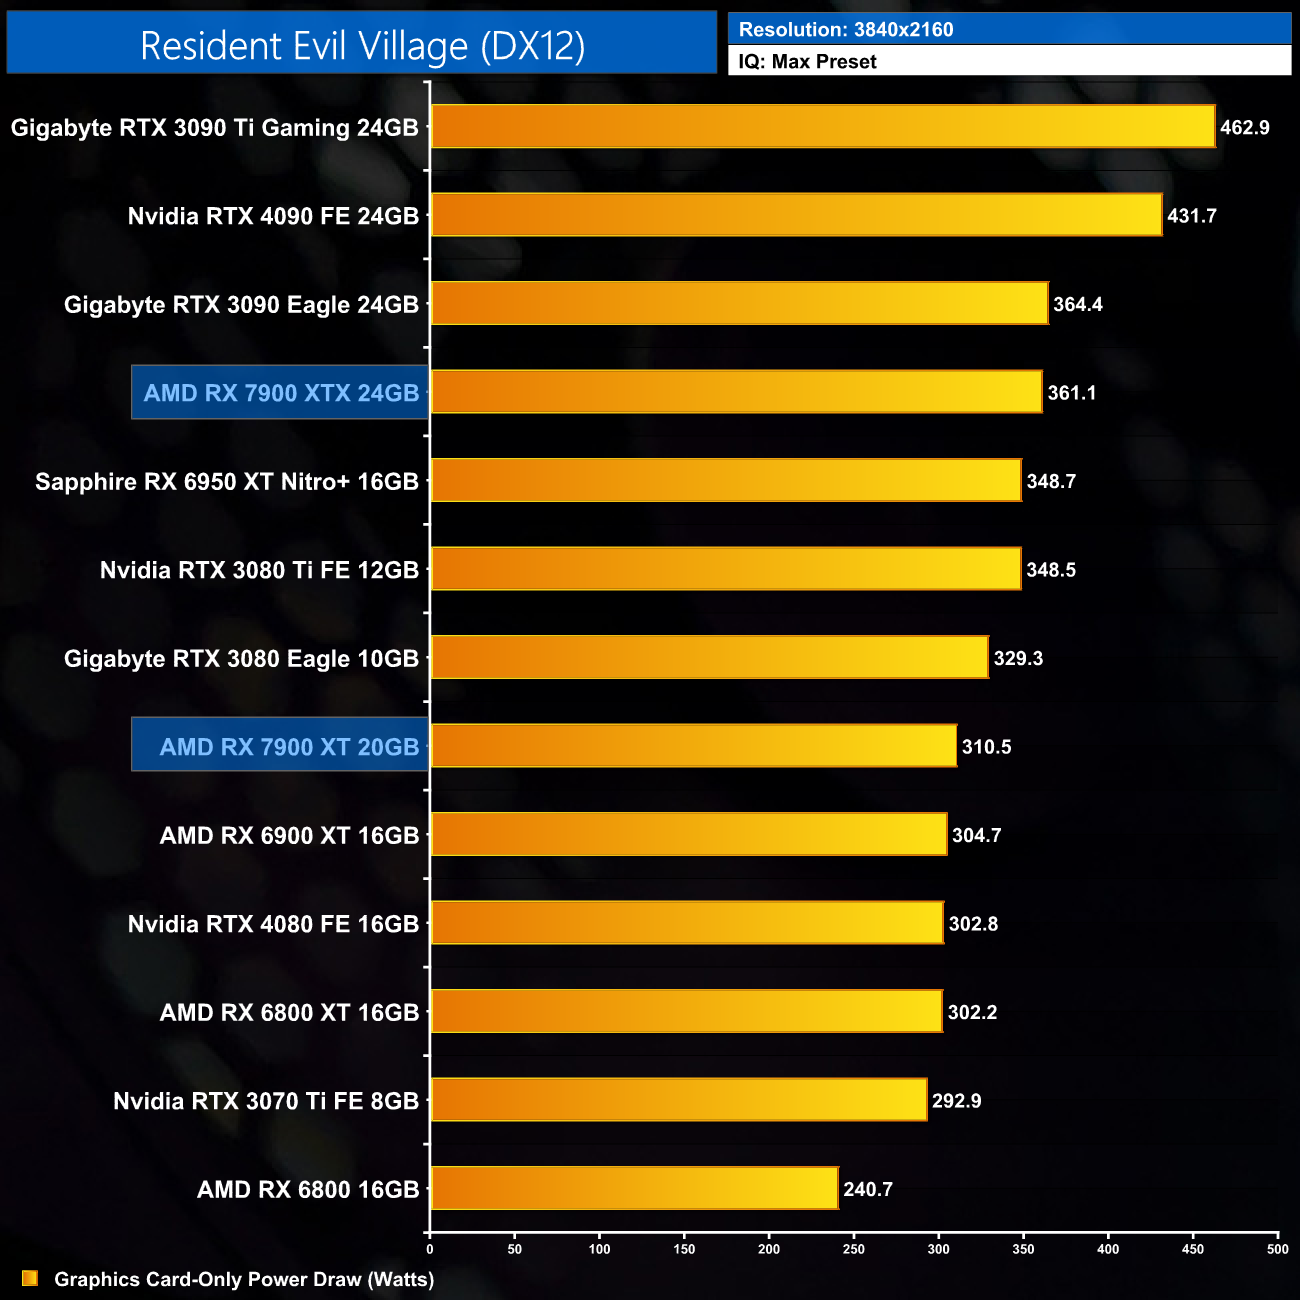
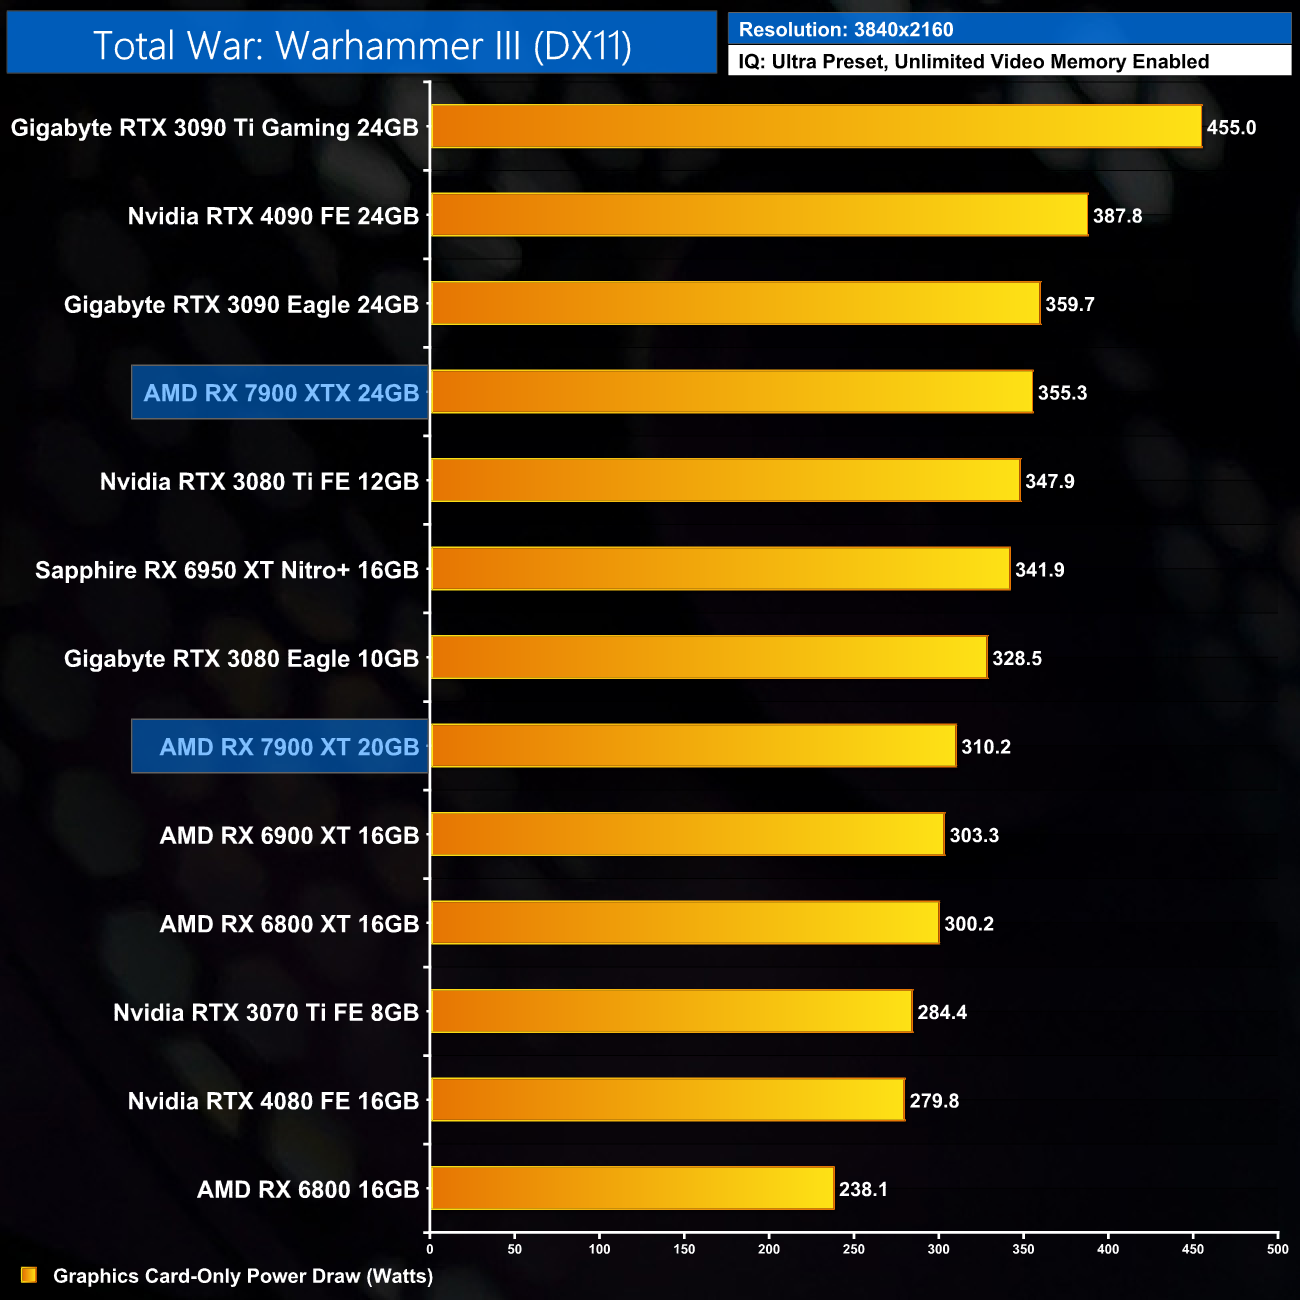
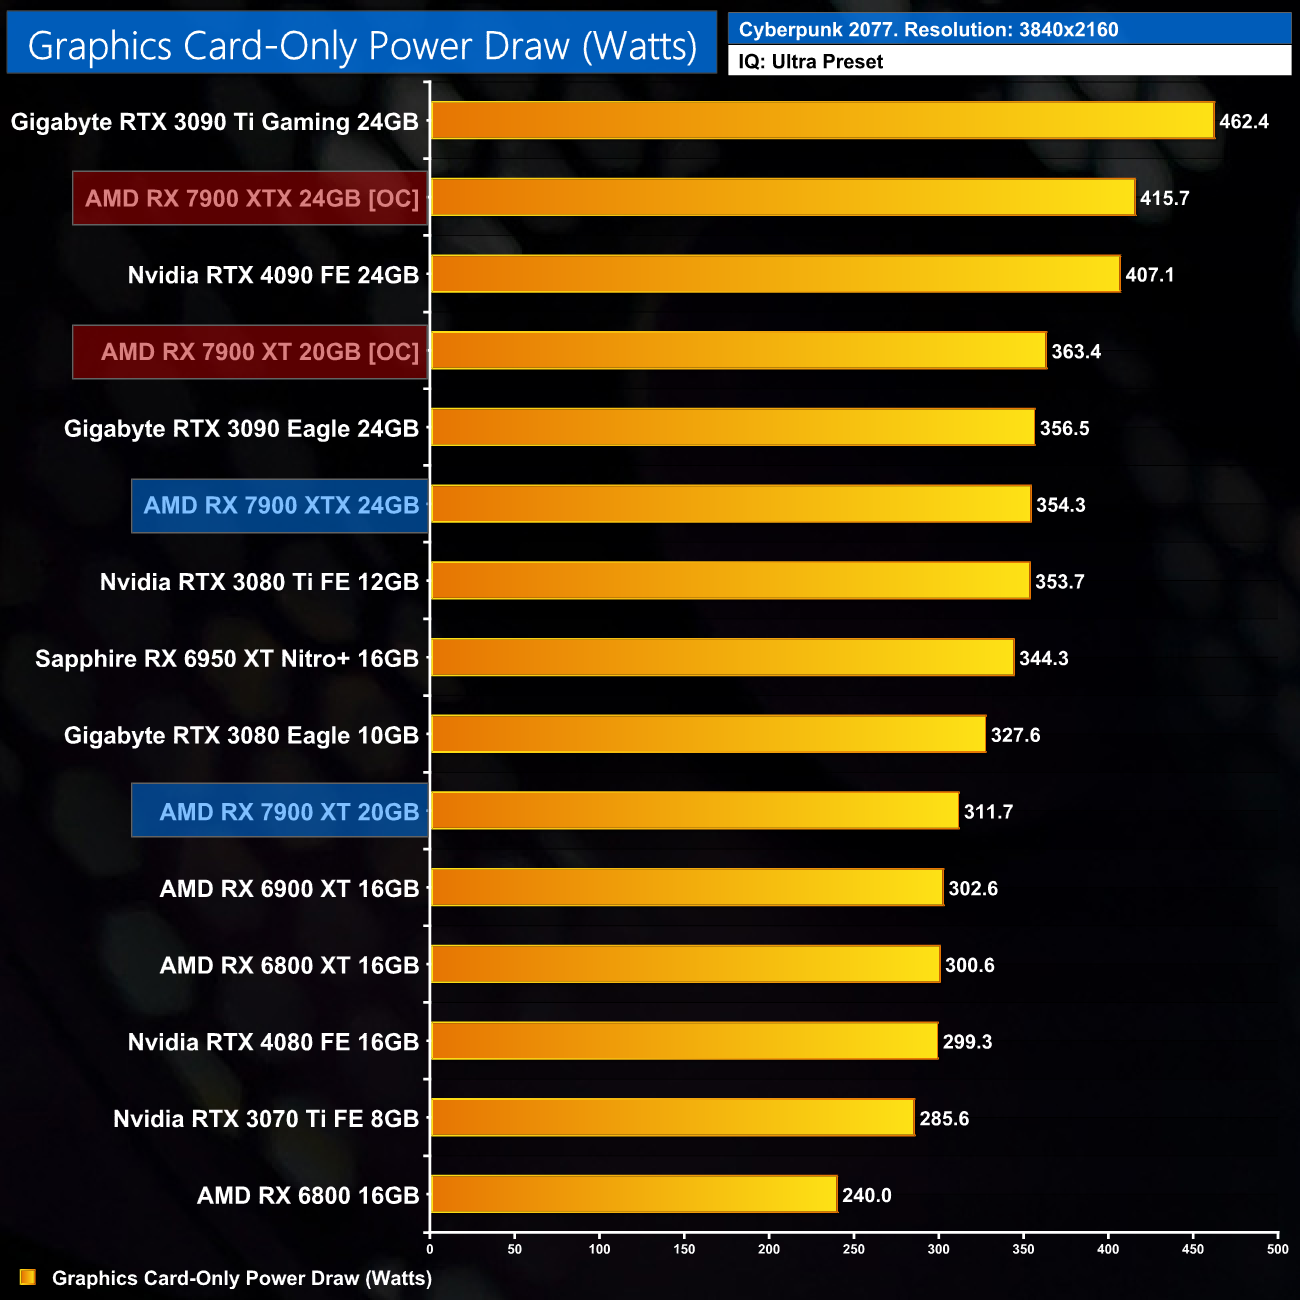
Here we present power draw figures for the graphics card-only, on a per-game basis for all twelve games we tested at 2160p (4K). This is measured using Nvidia's Power Capture Analysis Tool, also known as PCAT. You can read more about our updated power draw testing methodology HERE.
Per-Game Results at 2160p (4K):


Click to enlarge.
12-Game Average at 2160p (4K):
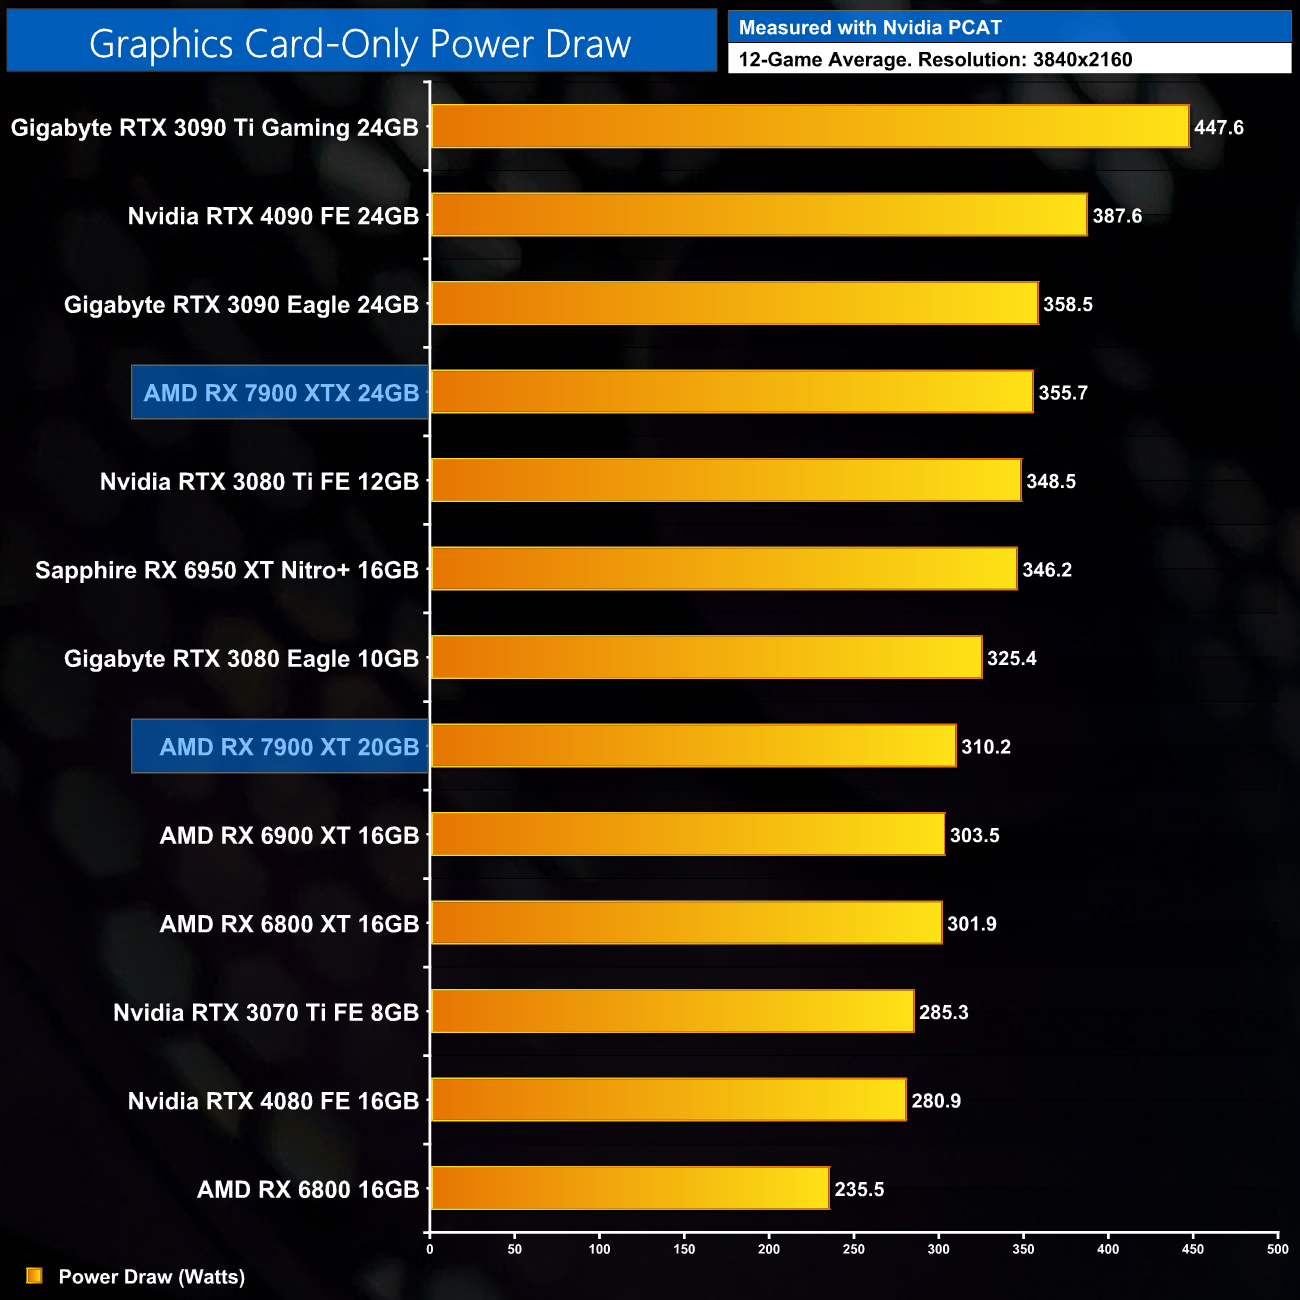
At 4K, the 7900 XT averaged 310.2W power draw, so that's a very small increase relative to the RX 6900 XT, and it's about 30W more power hungry than the RTX 4080, despite being the slower GPU. As we shall see on the following pages, that has clear implications for overall efficiency.
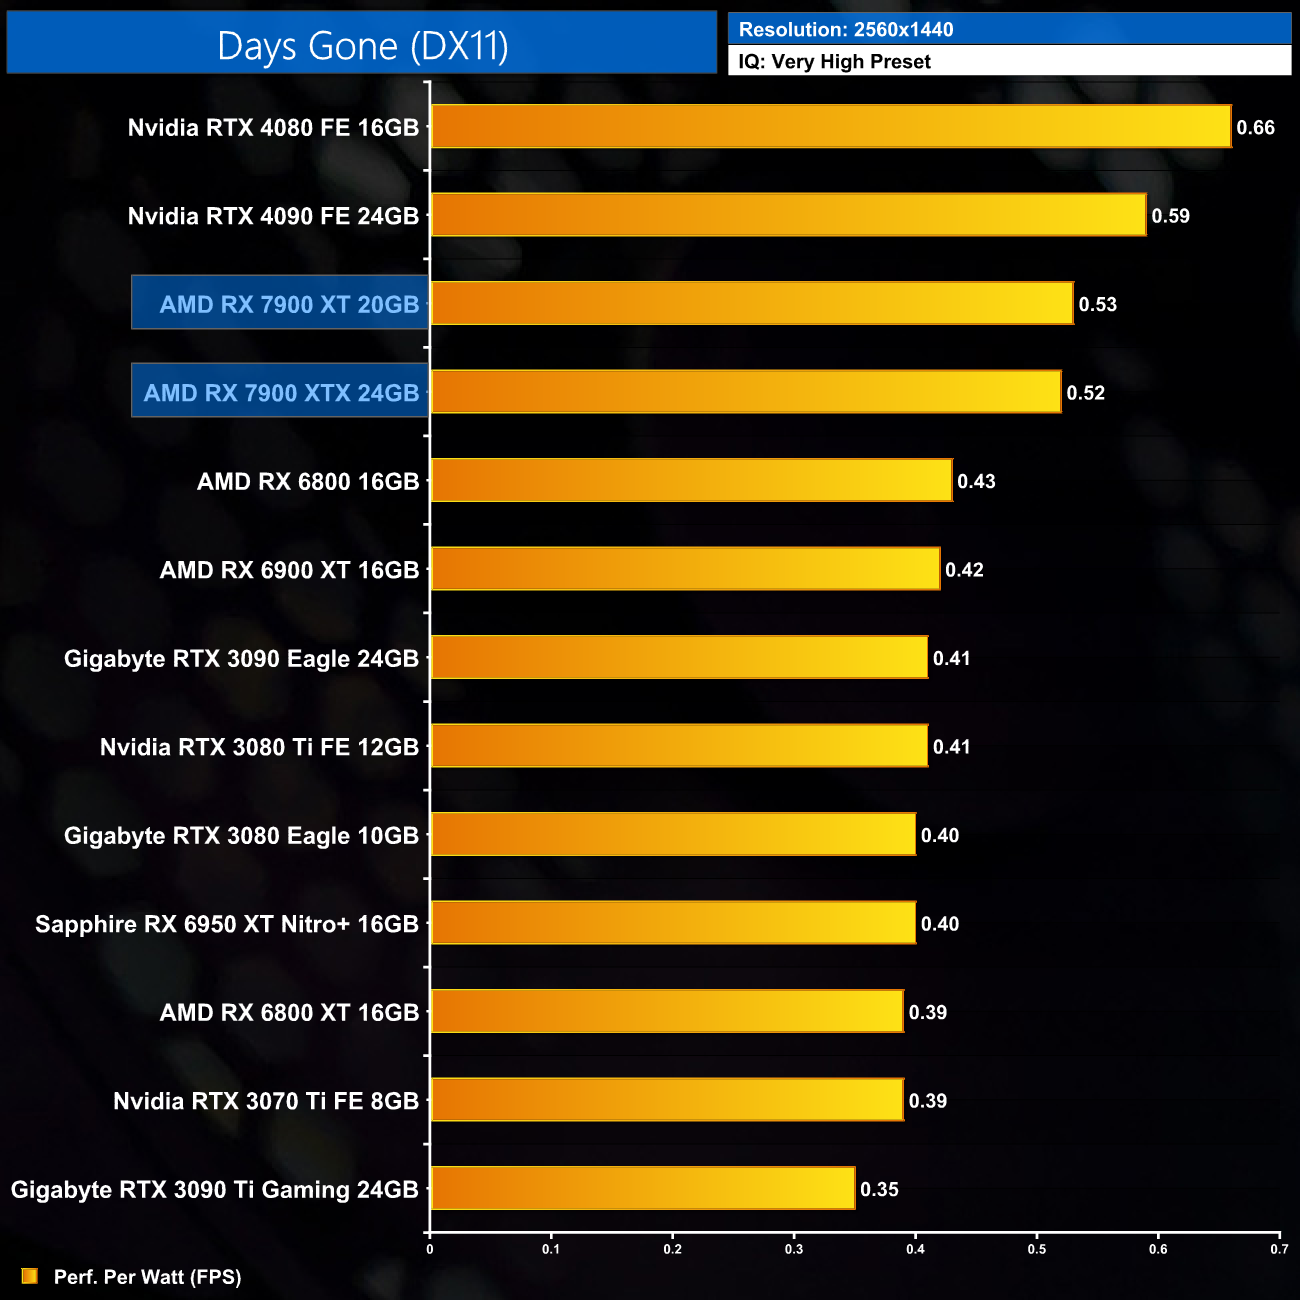
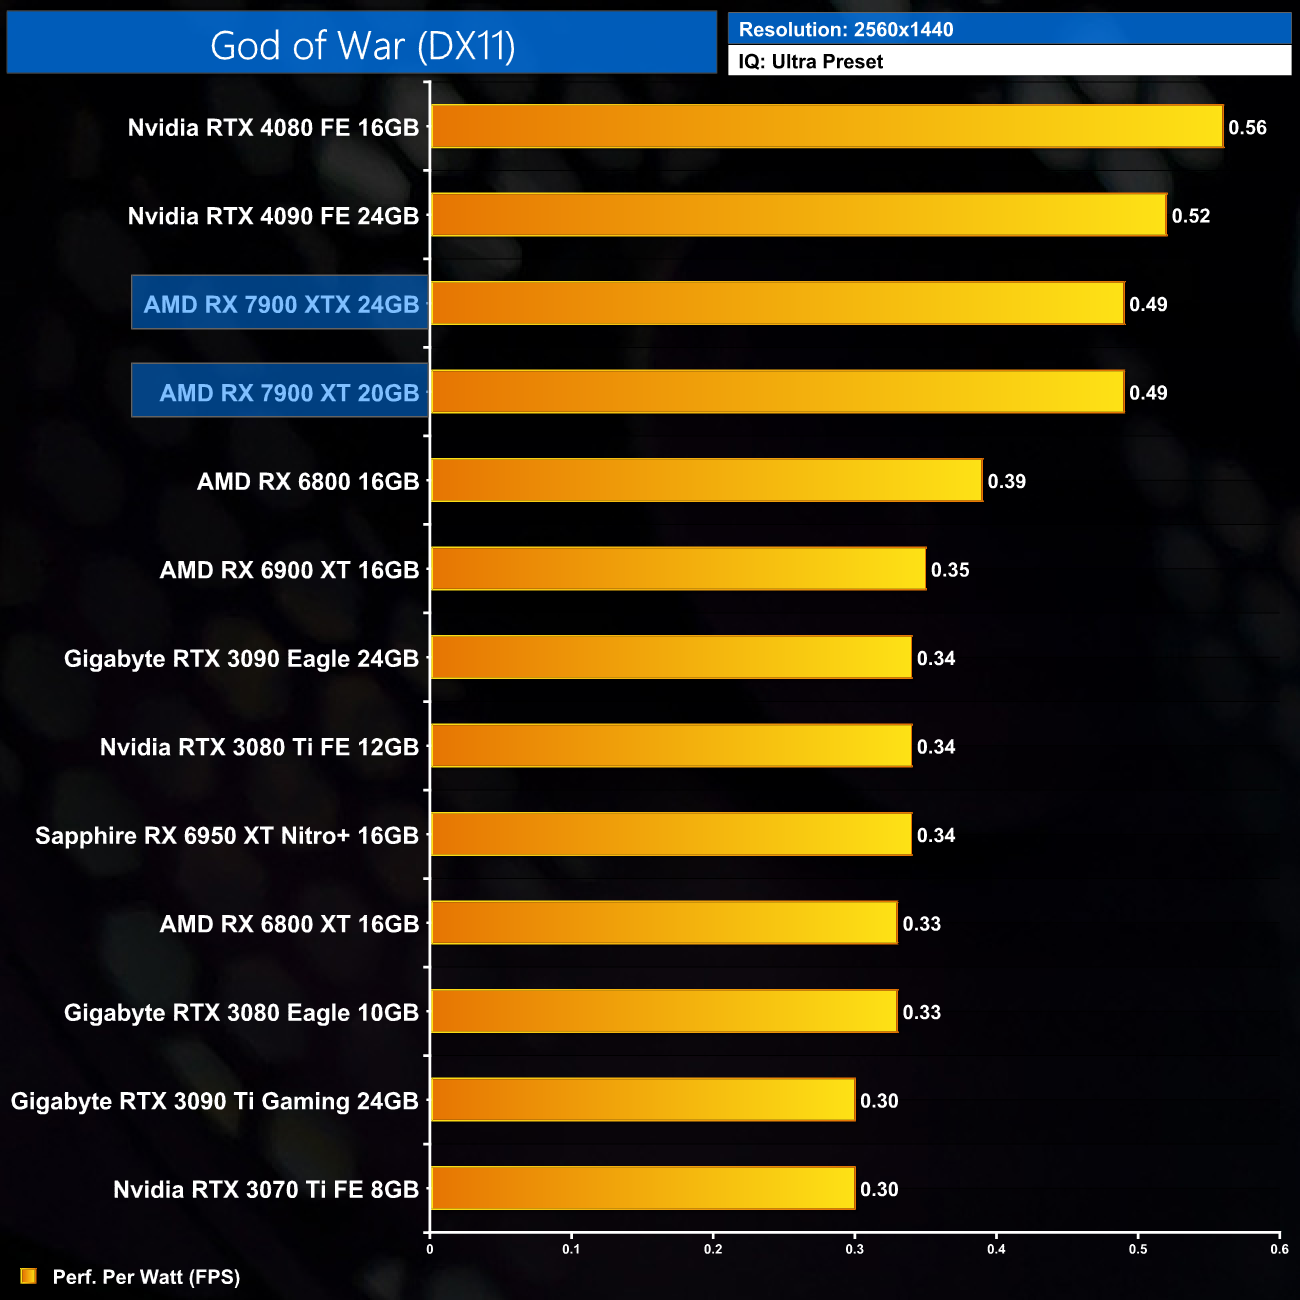
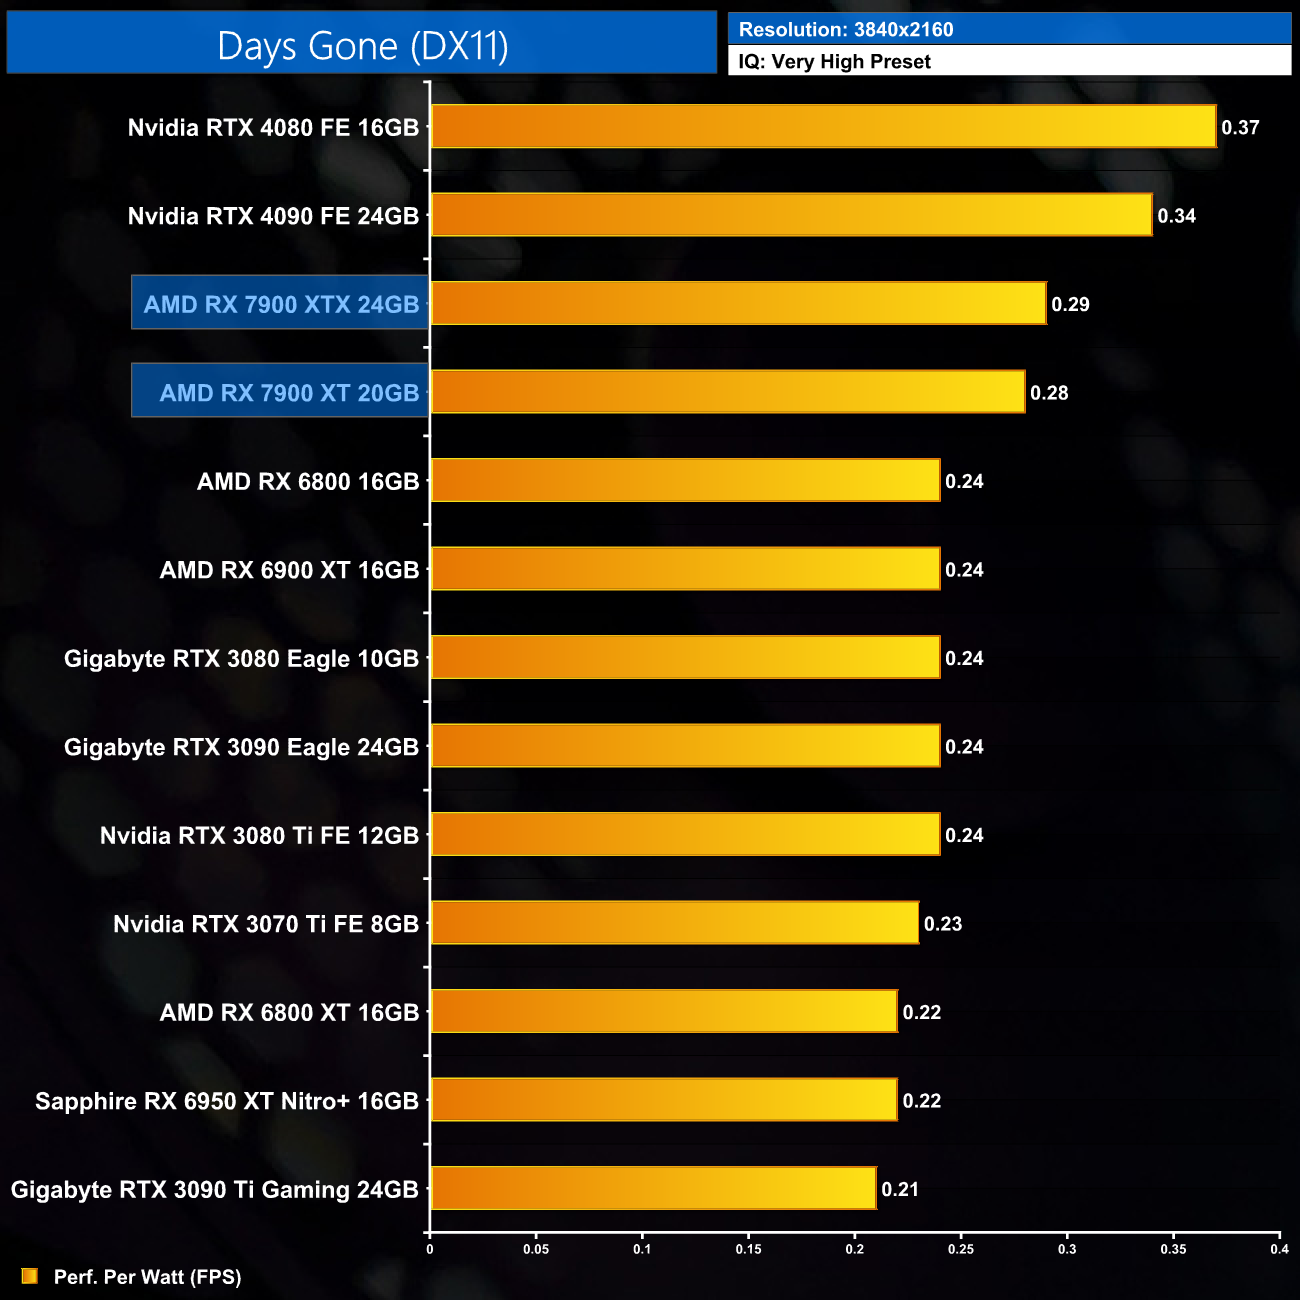
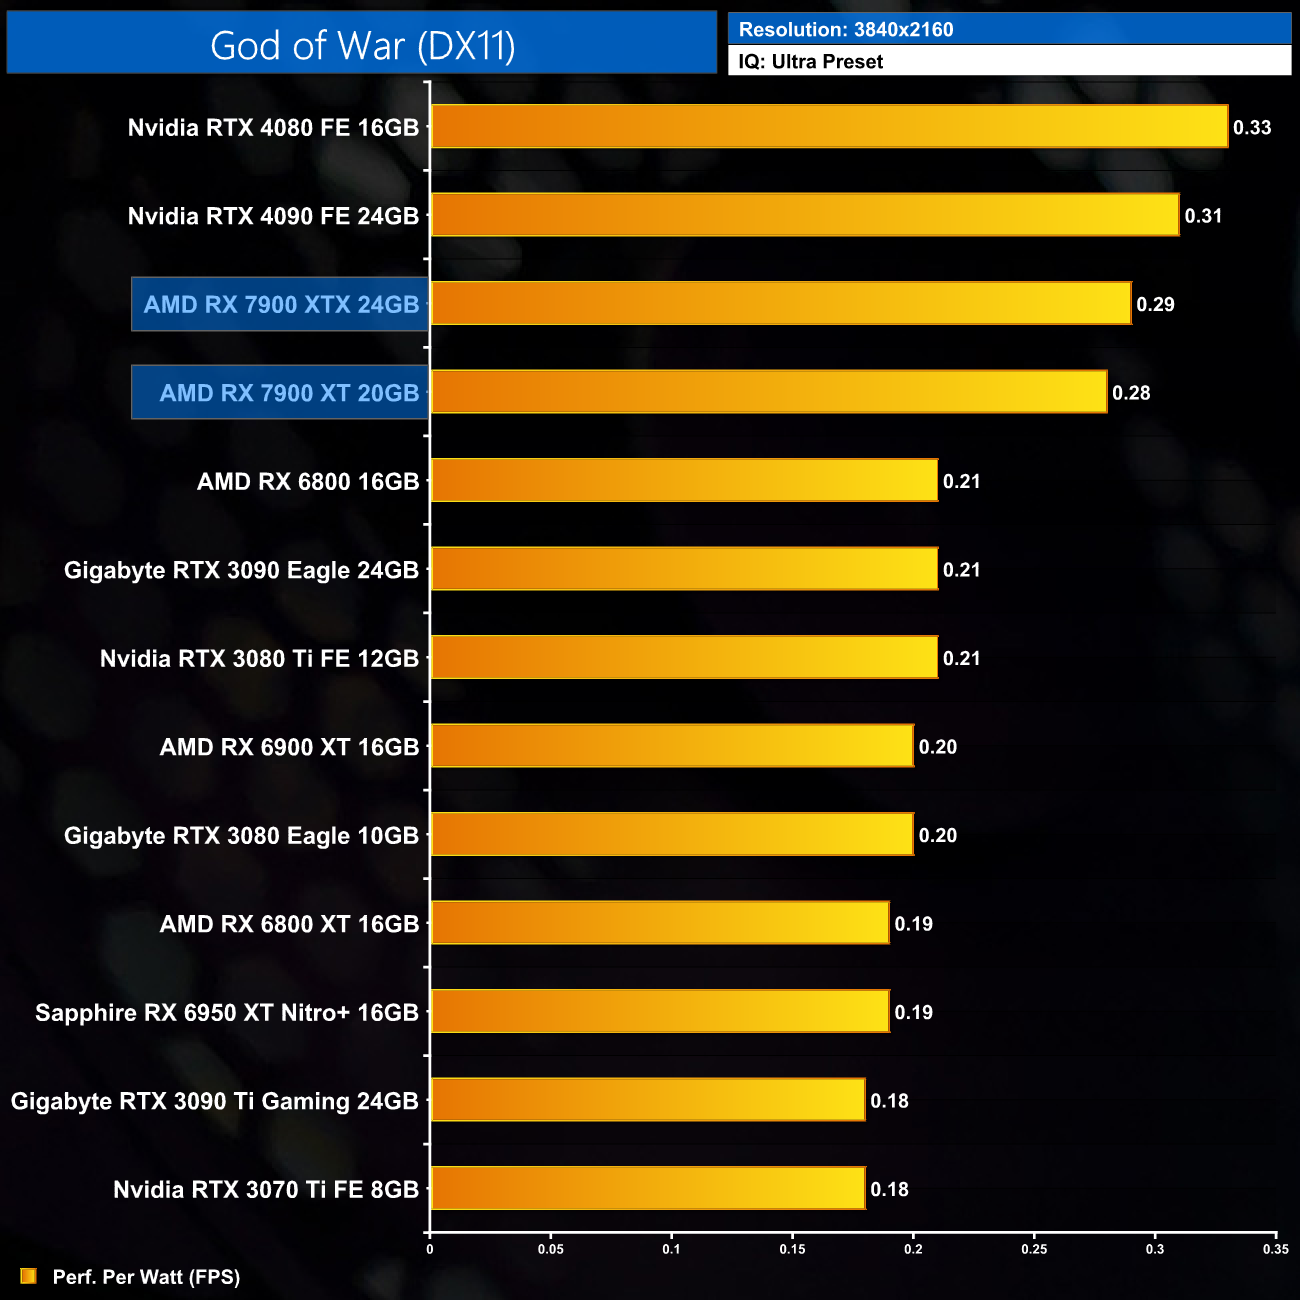
Using the graphics card-only power draw figures presented earlier in the review, here we present performance per Watt on a per-game basis for all twelve games we tested at 1080p.
Per-Game Results at 1080p:
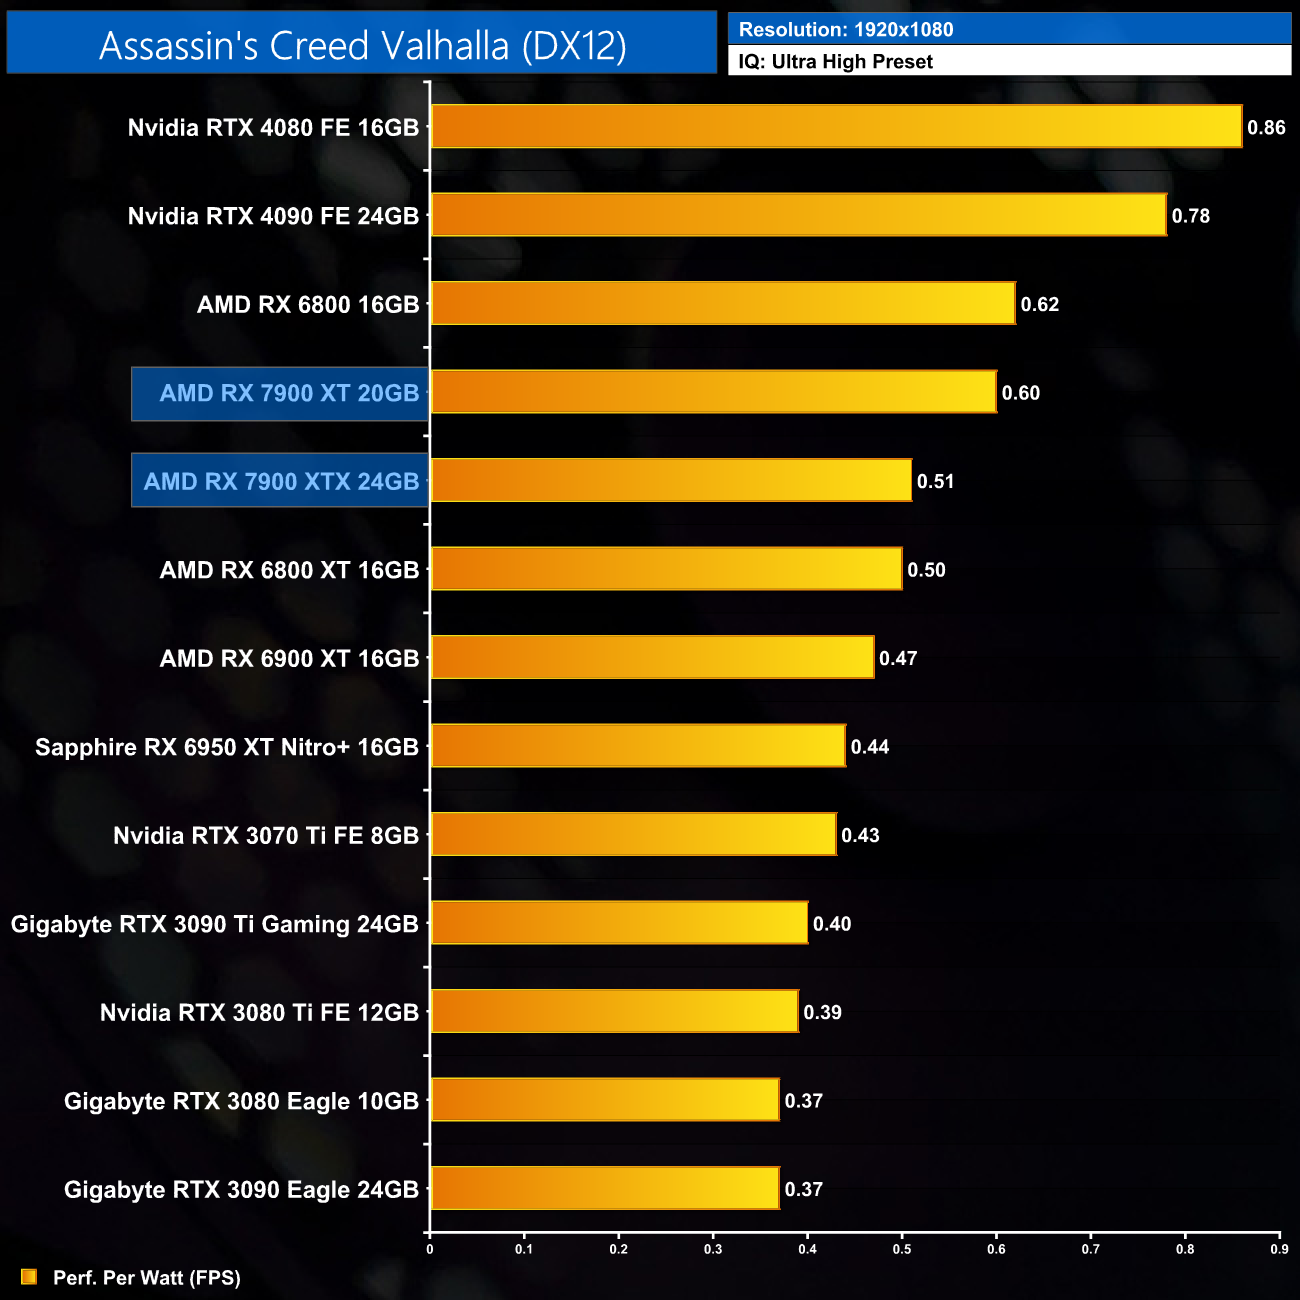
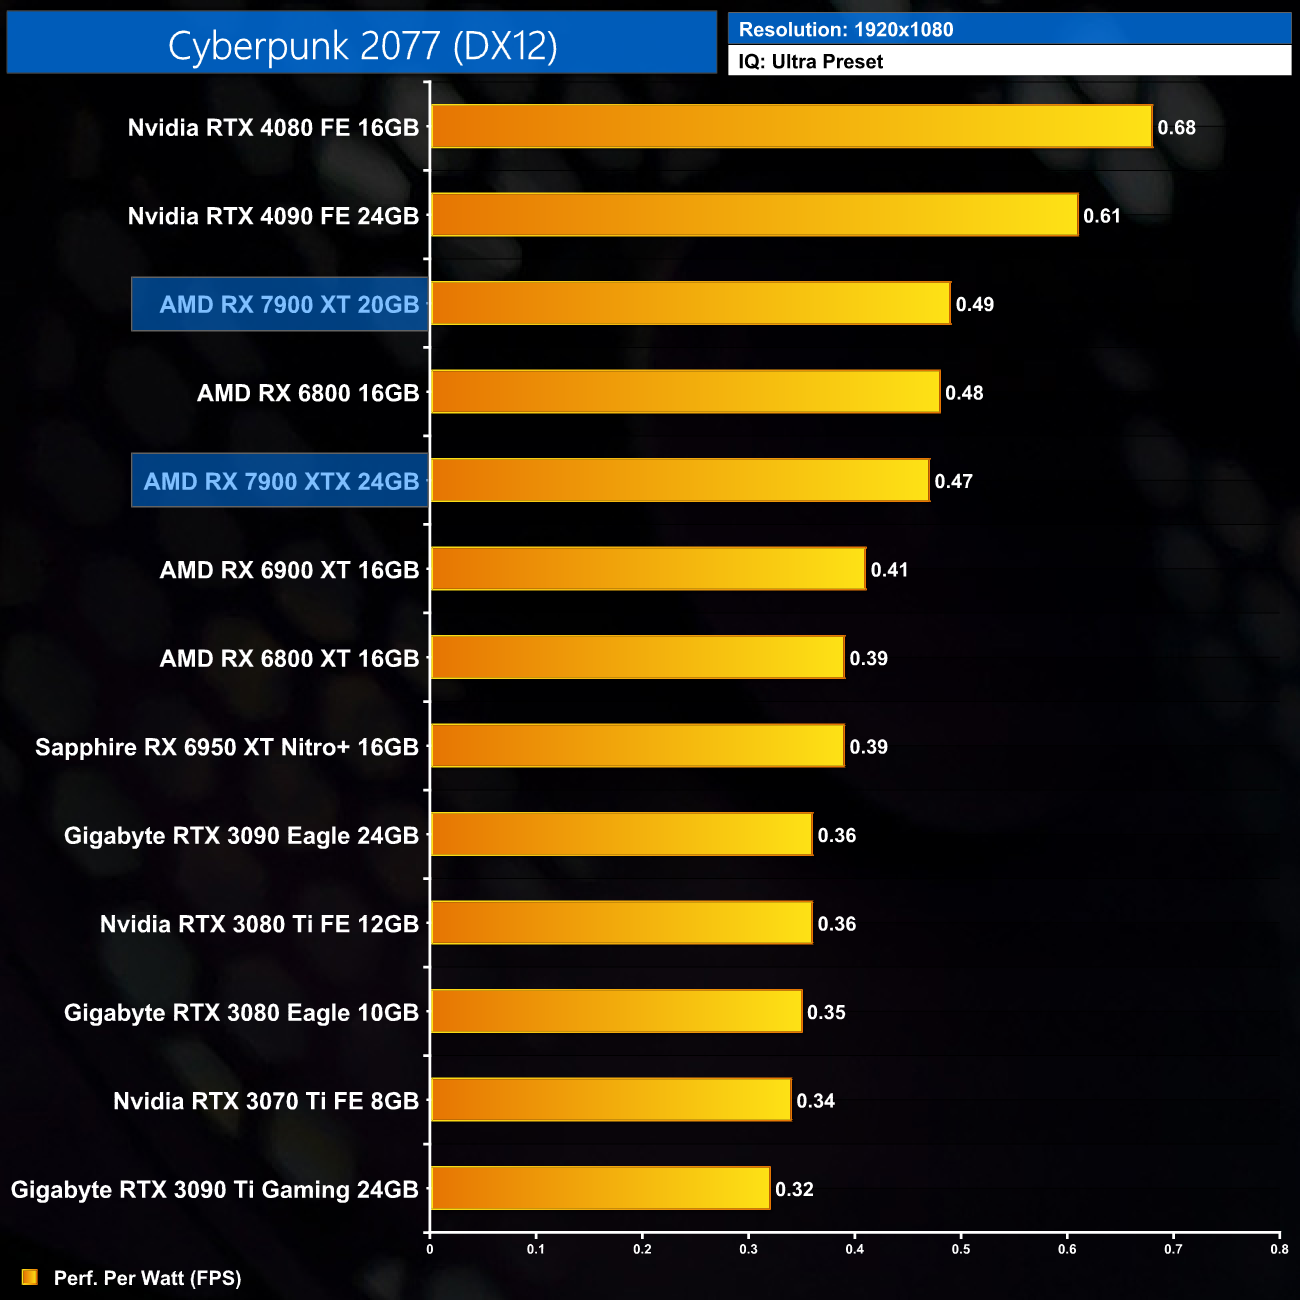
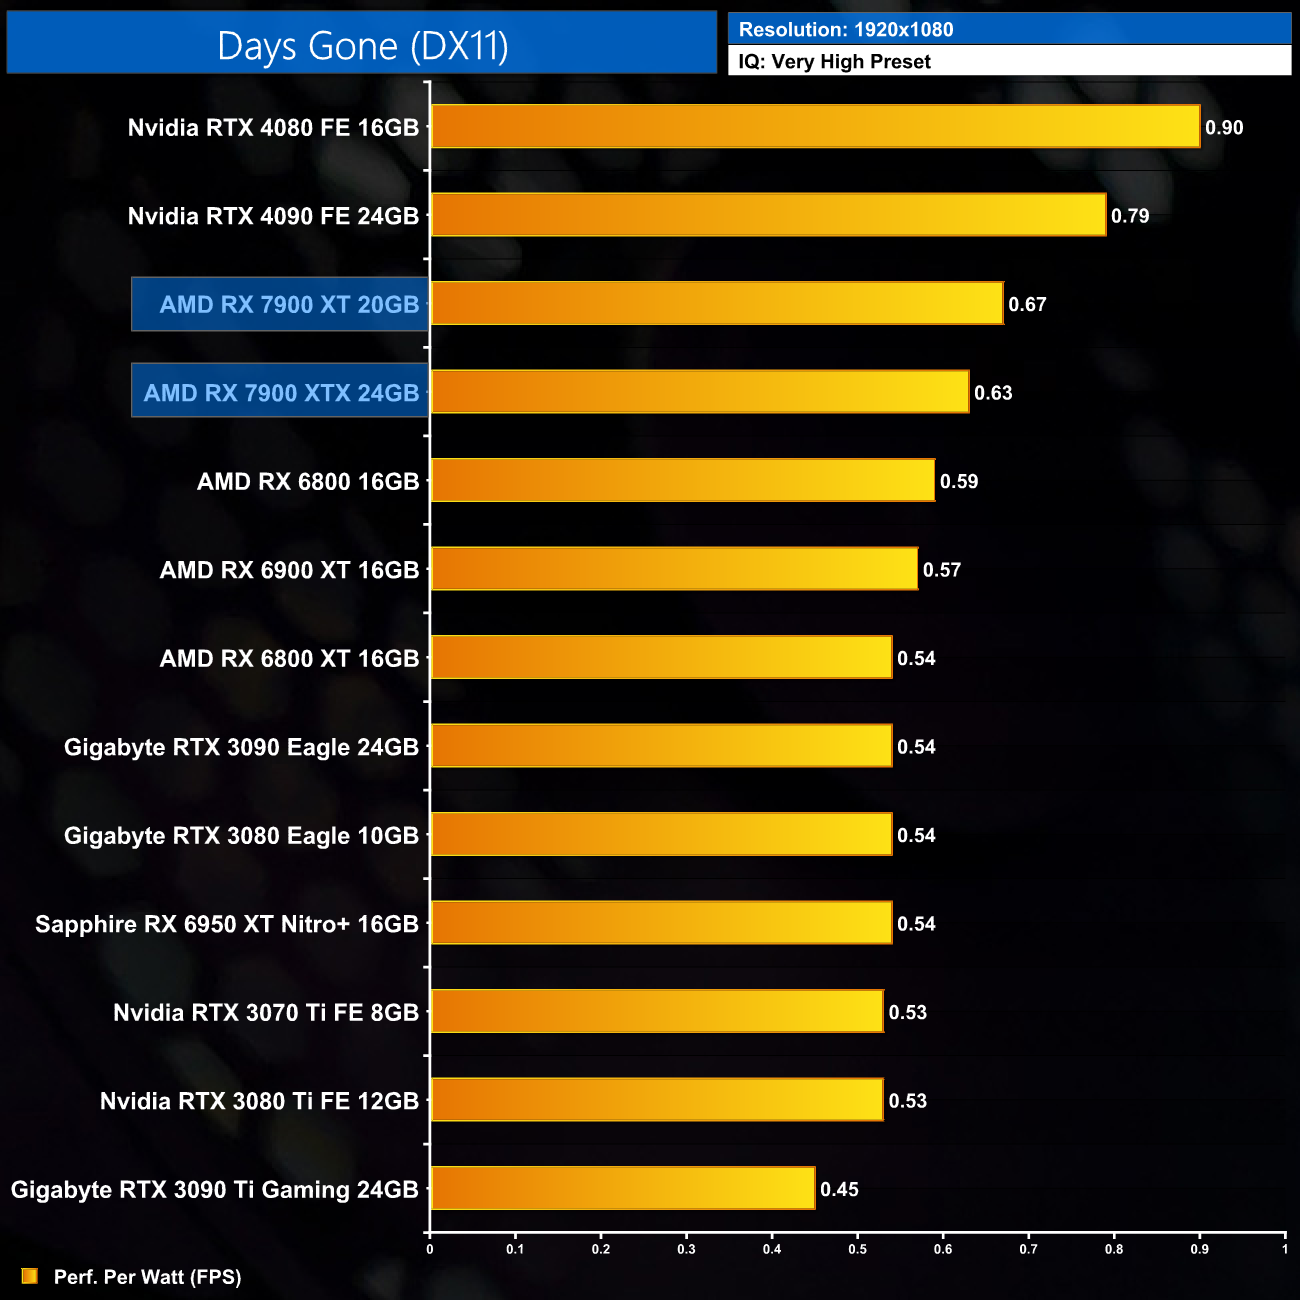
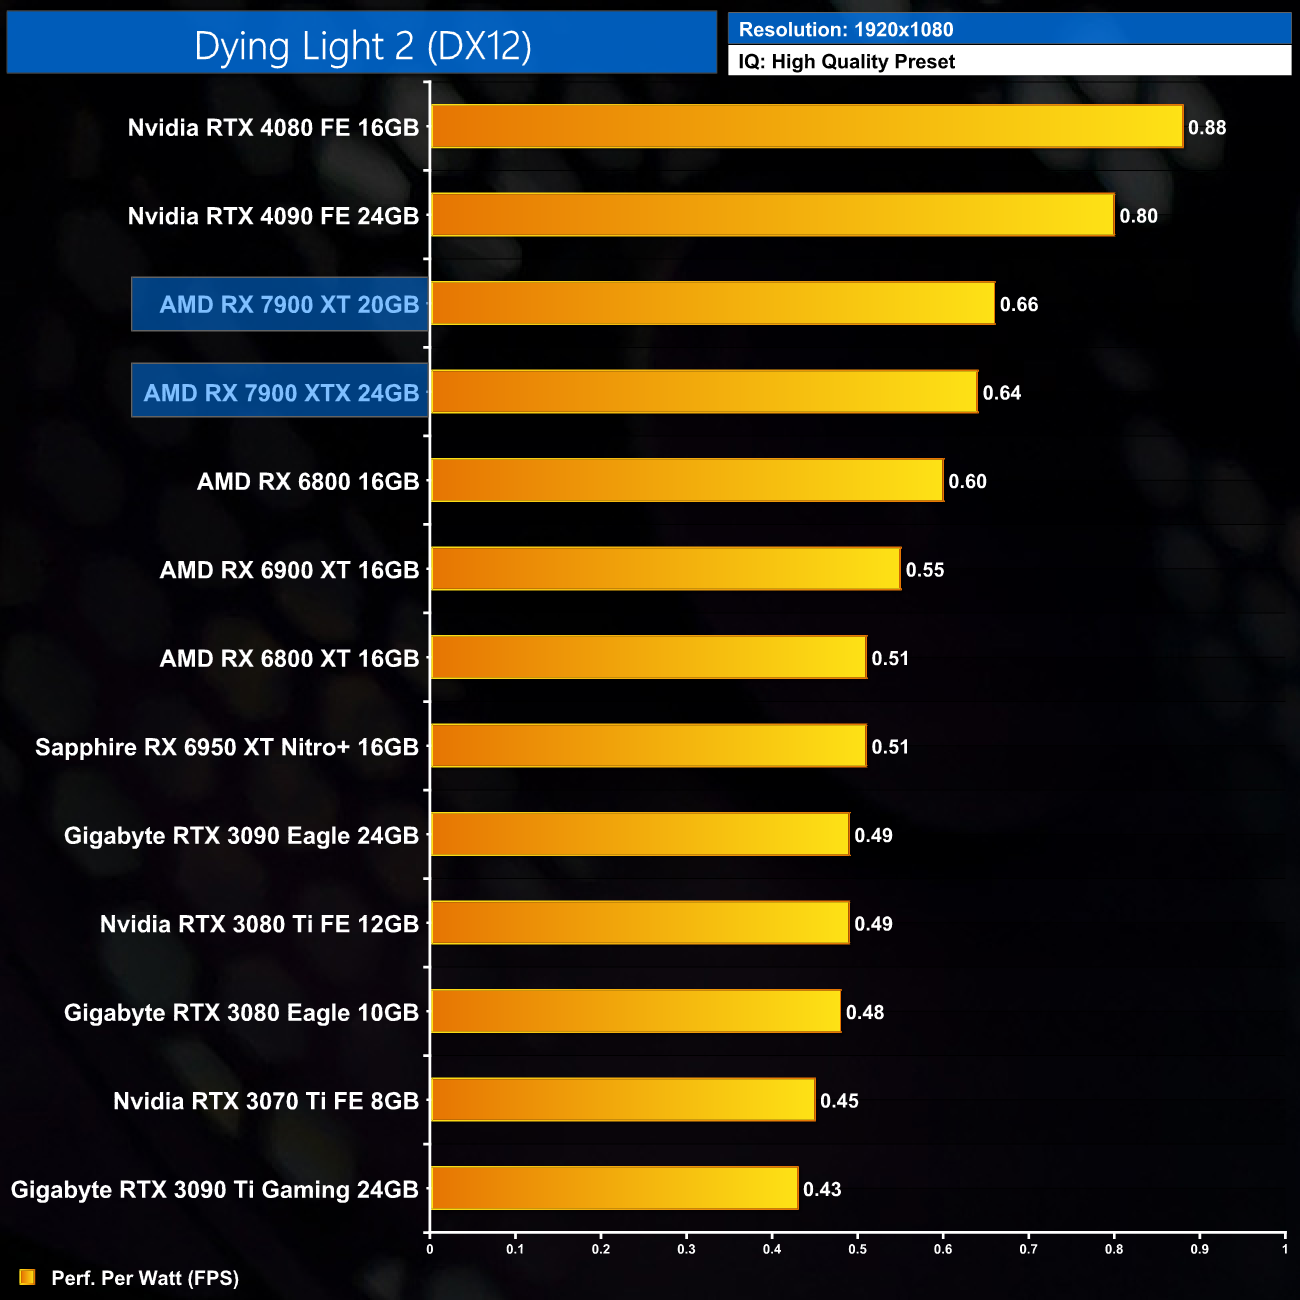
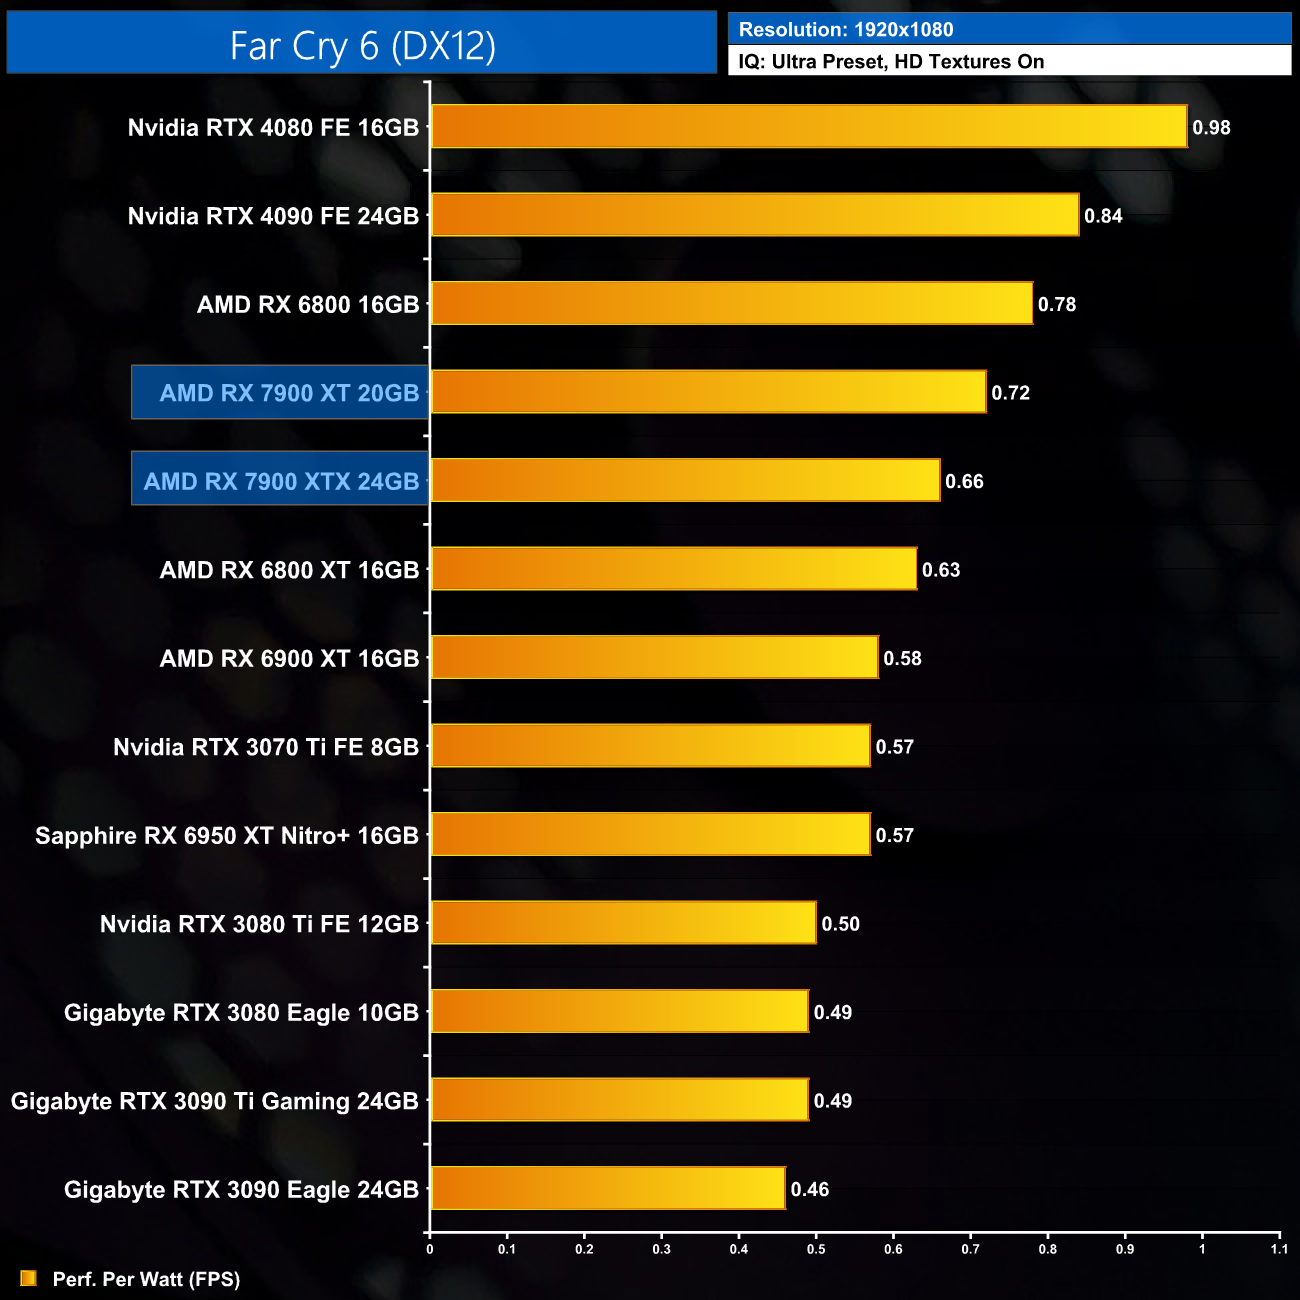

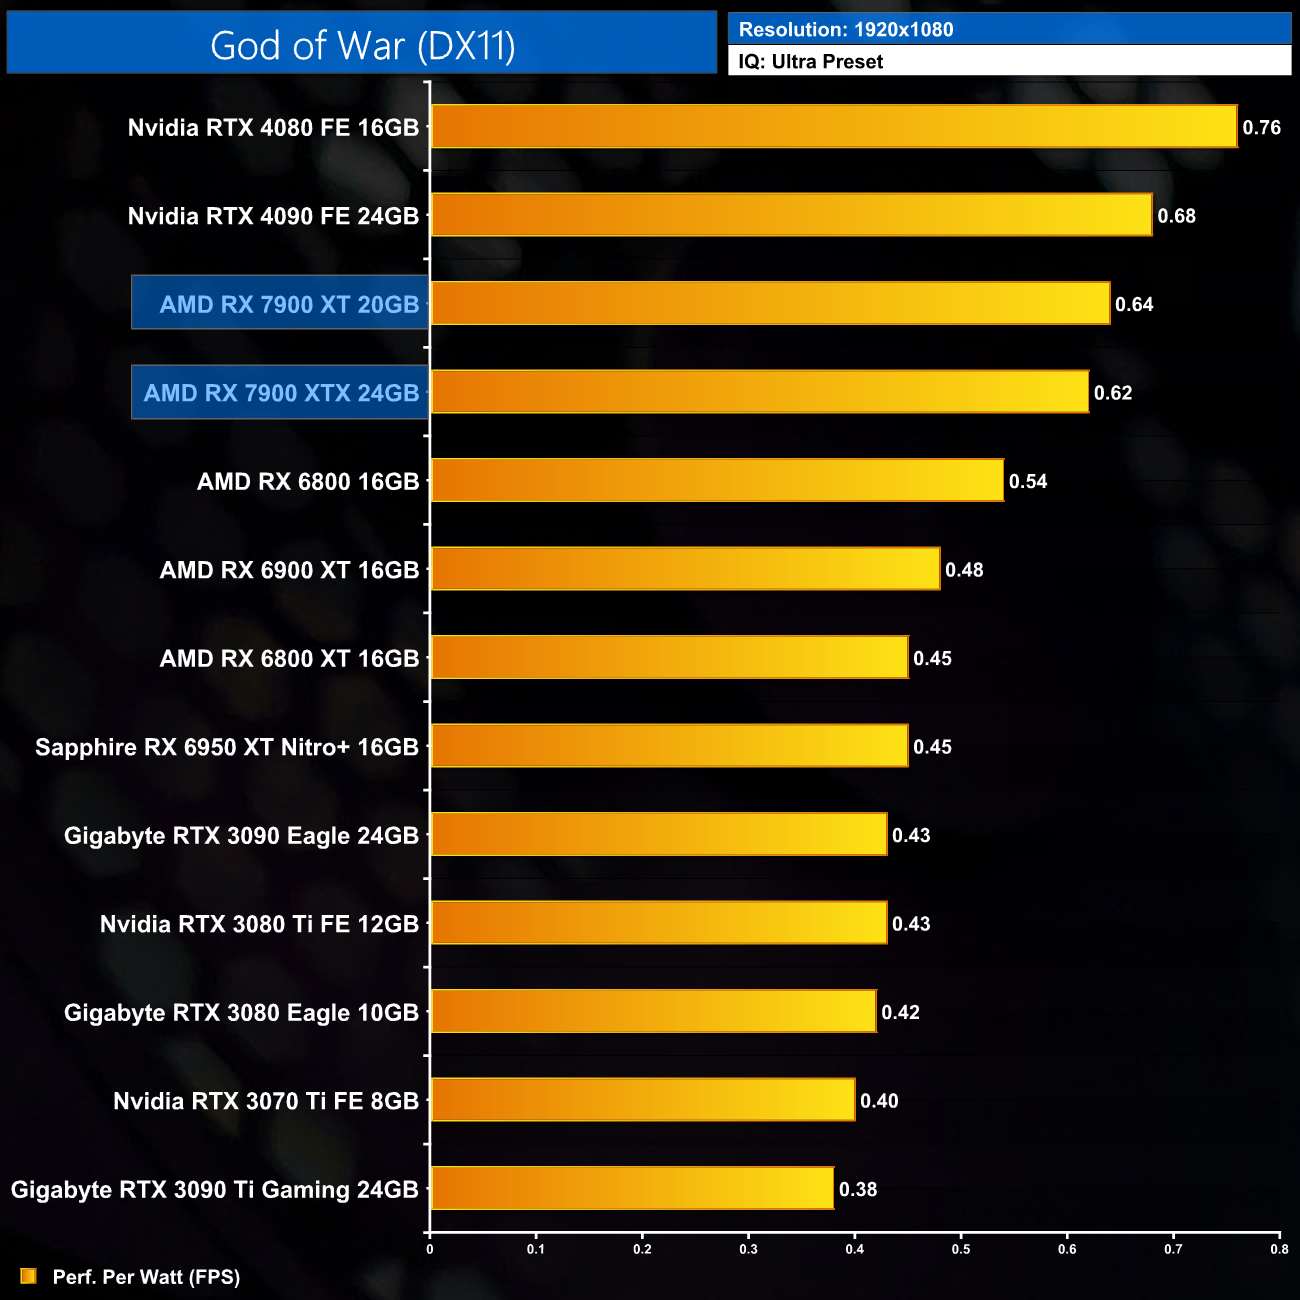

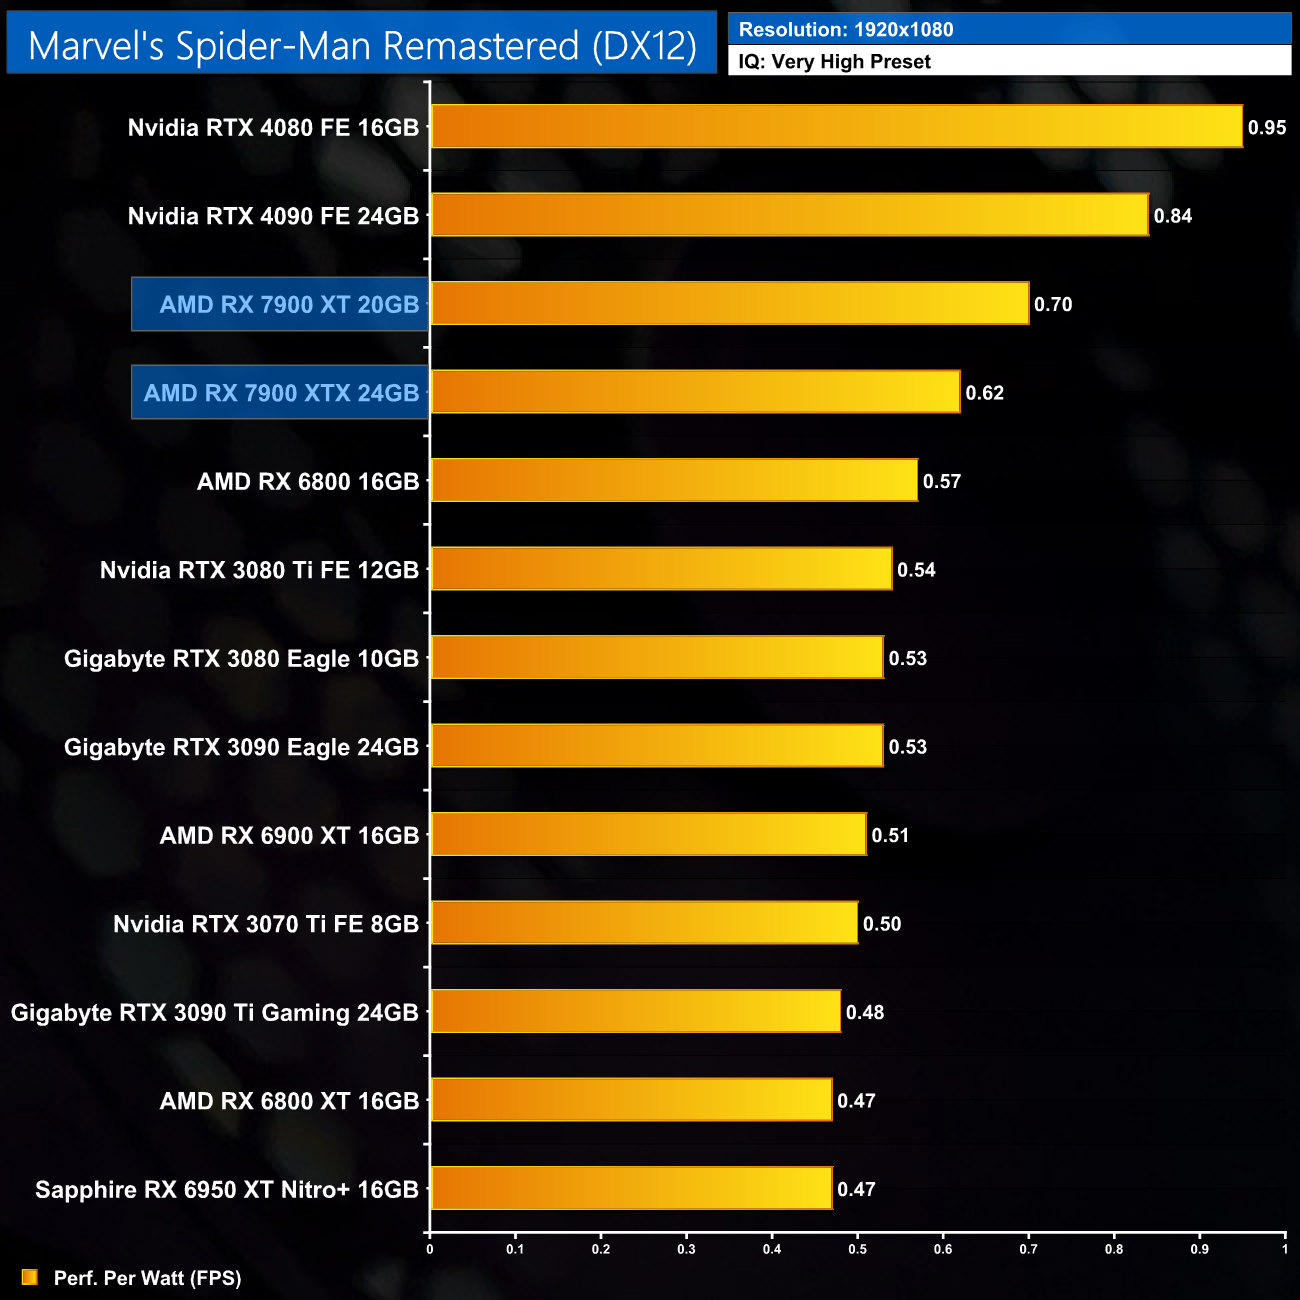
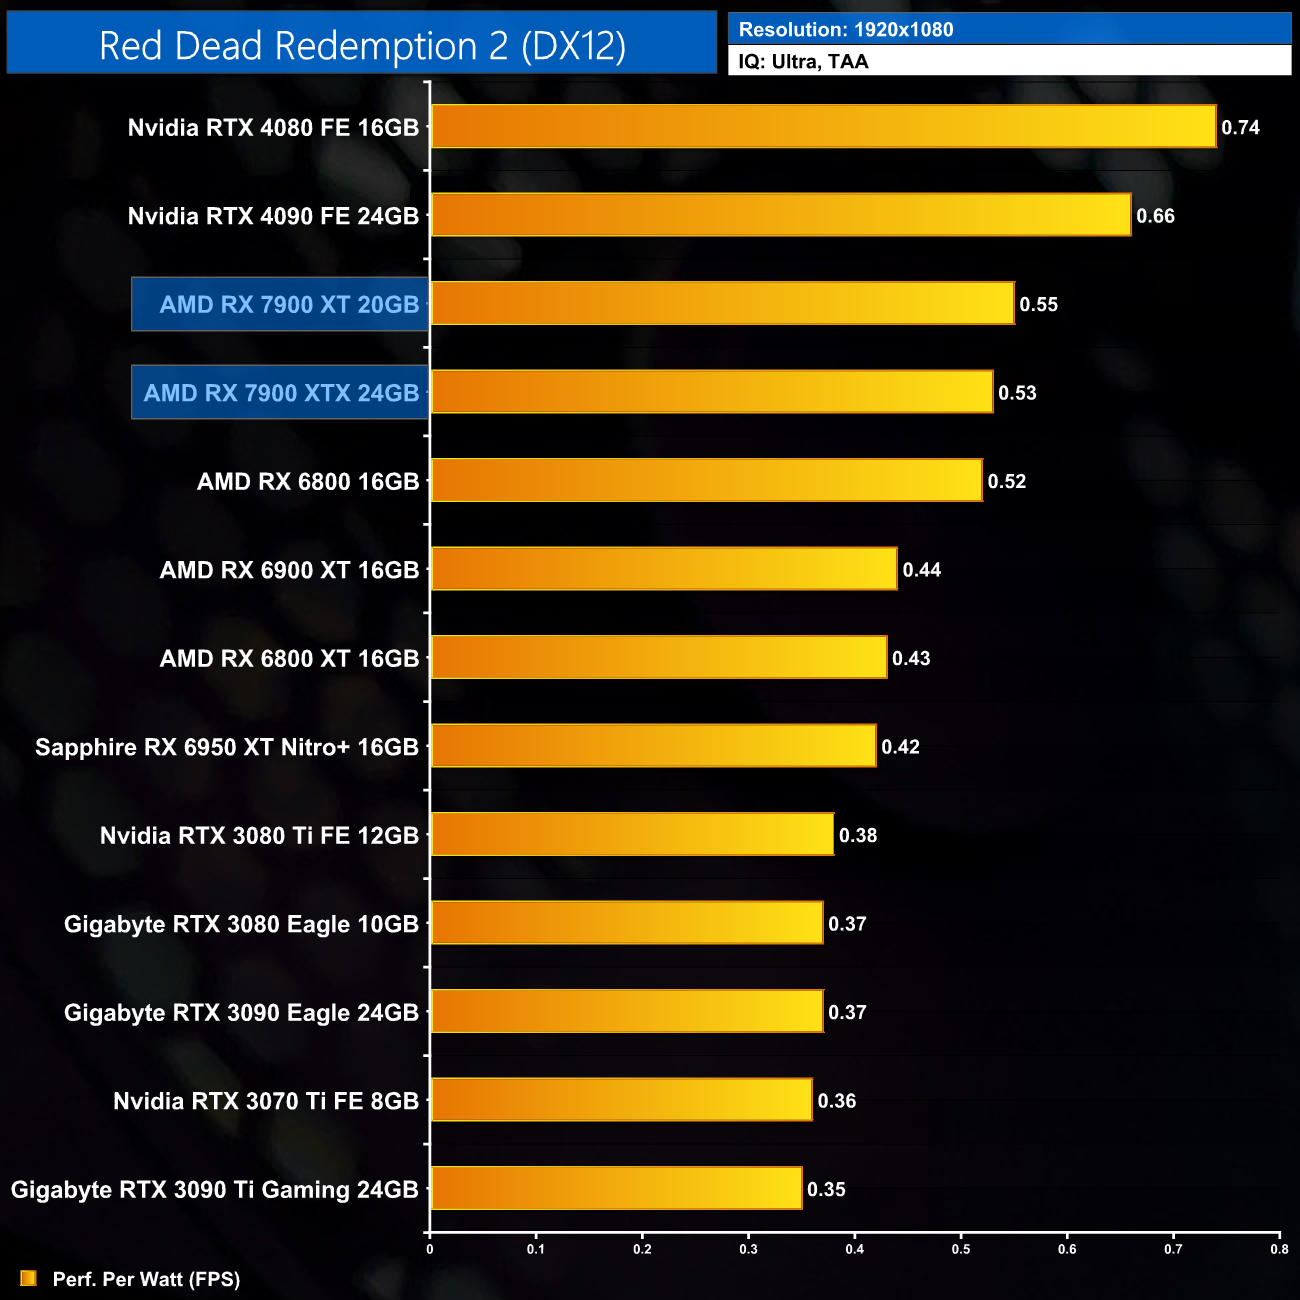
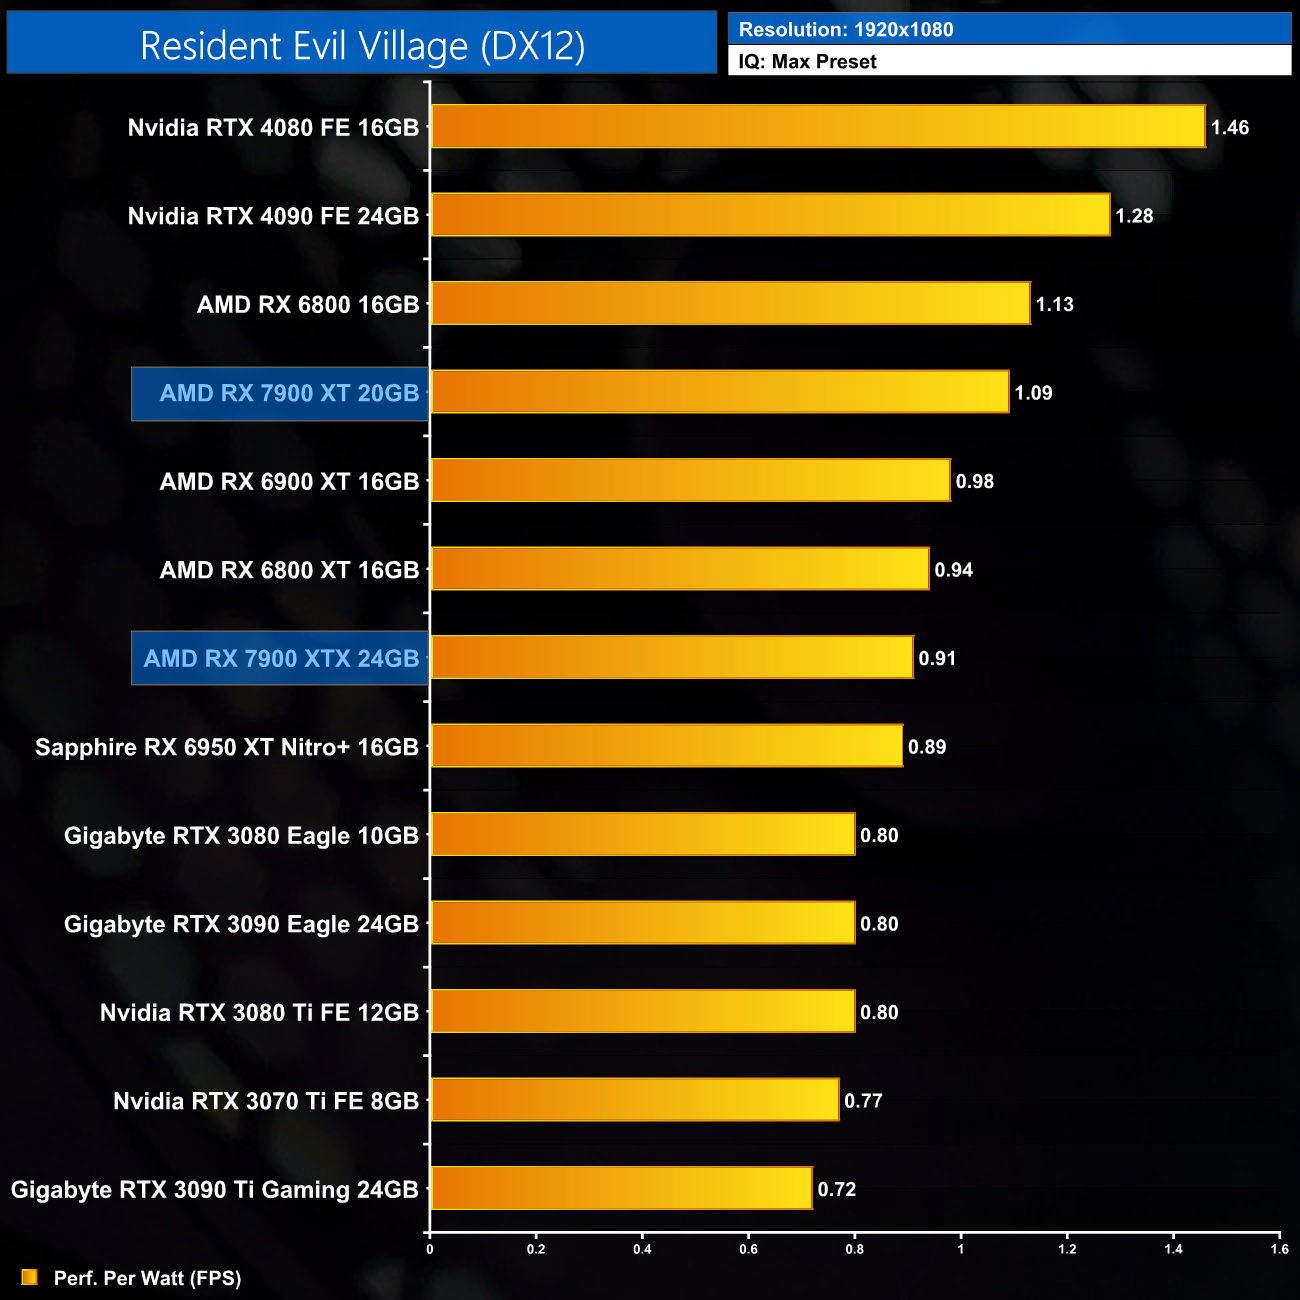
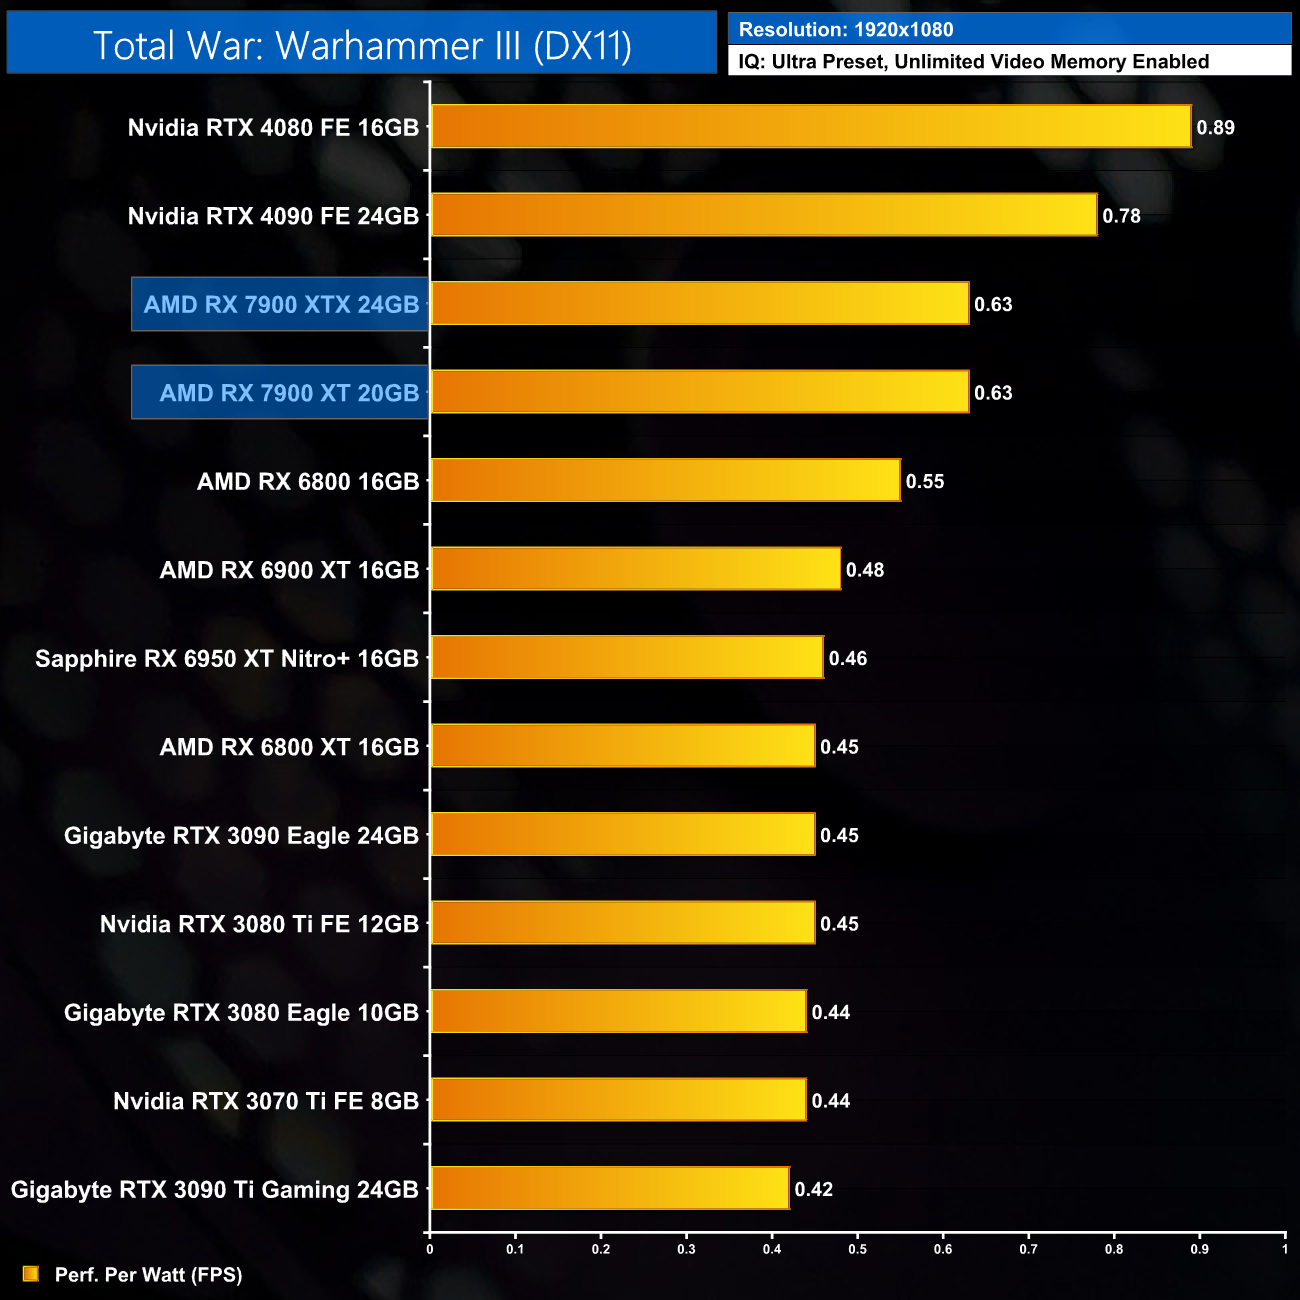
Click to enlarge.
12-Game Average at 1080p:
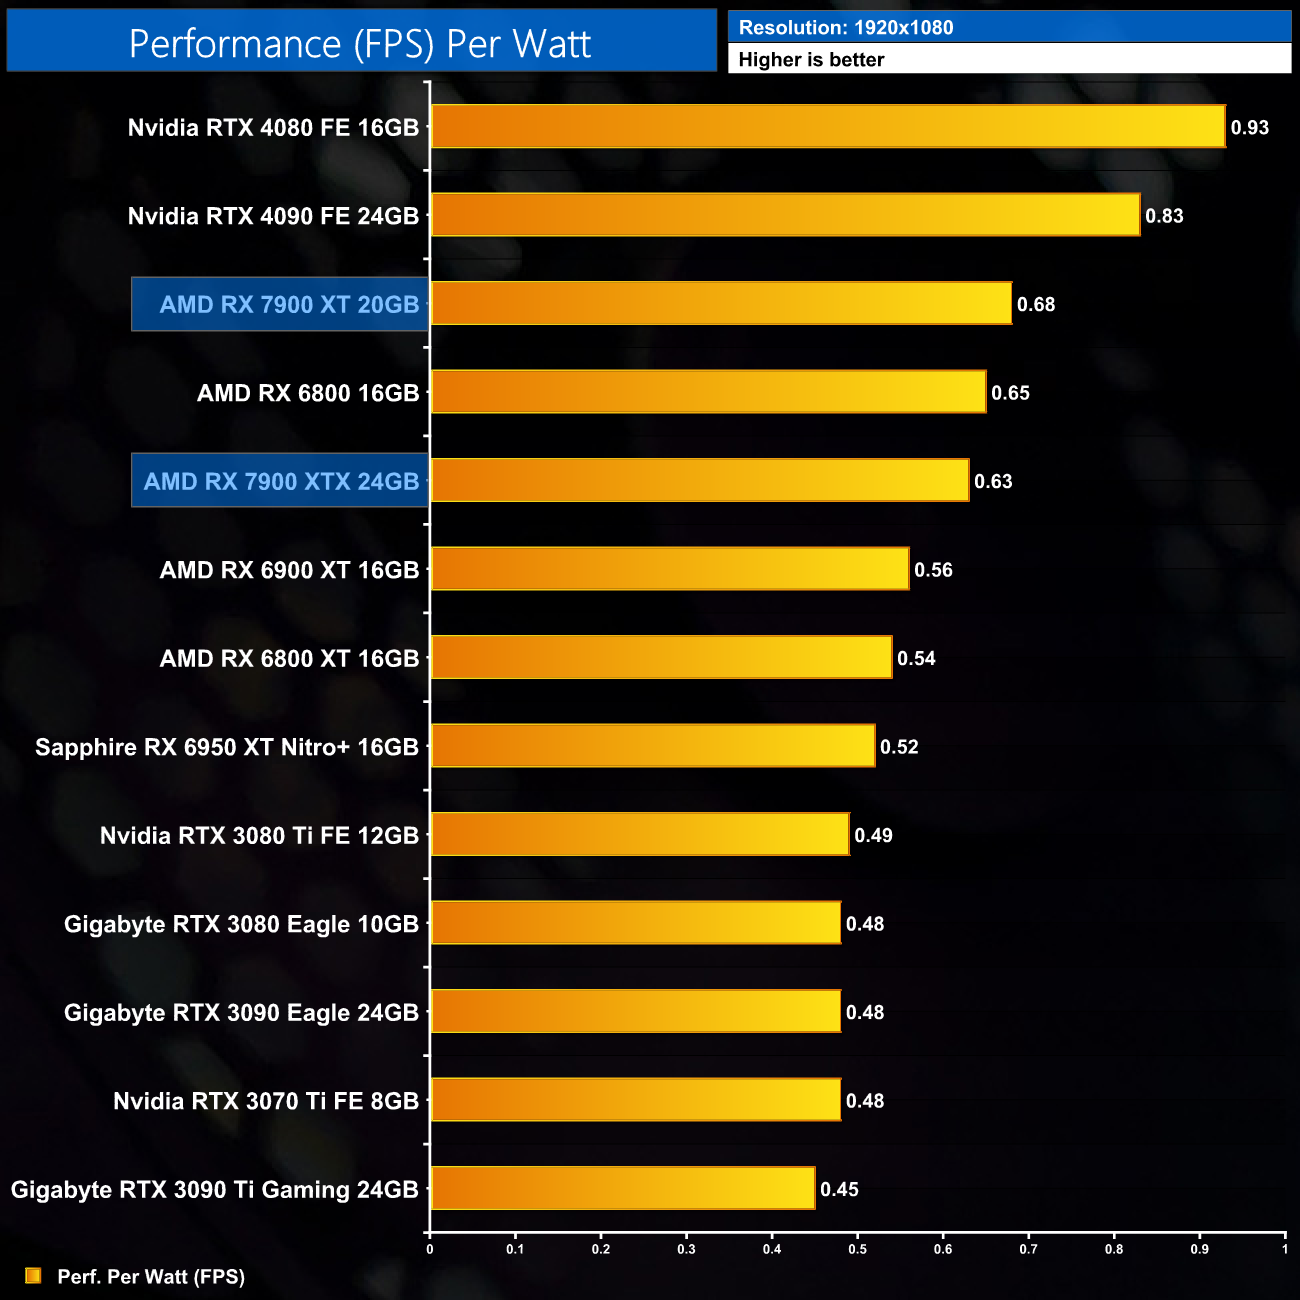
Looking now at performance per Watt, at 1080p the RX 7900 XT isn't a massive step forward over the RX 6800, offering an 8% improvement in efficiency, while it lags behind the RTX 4080 significantly.
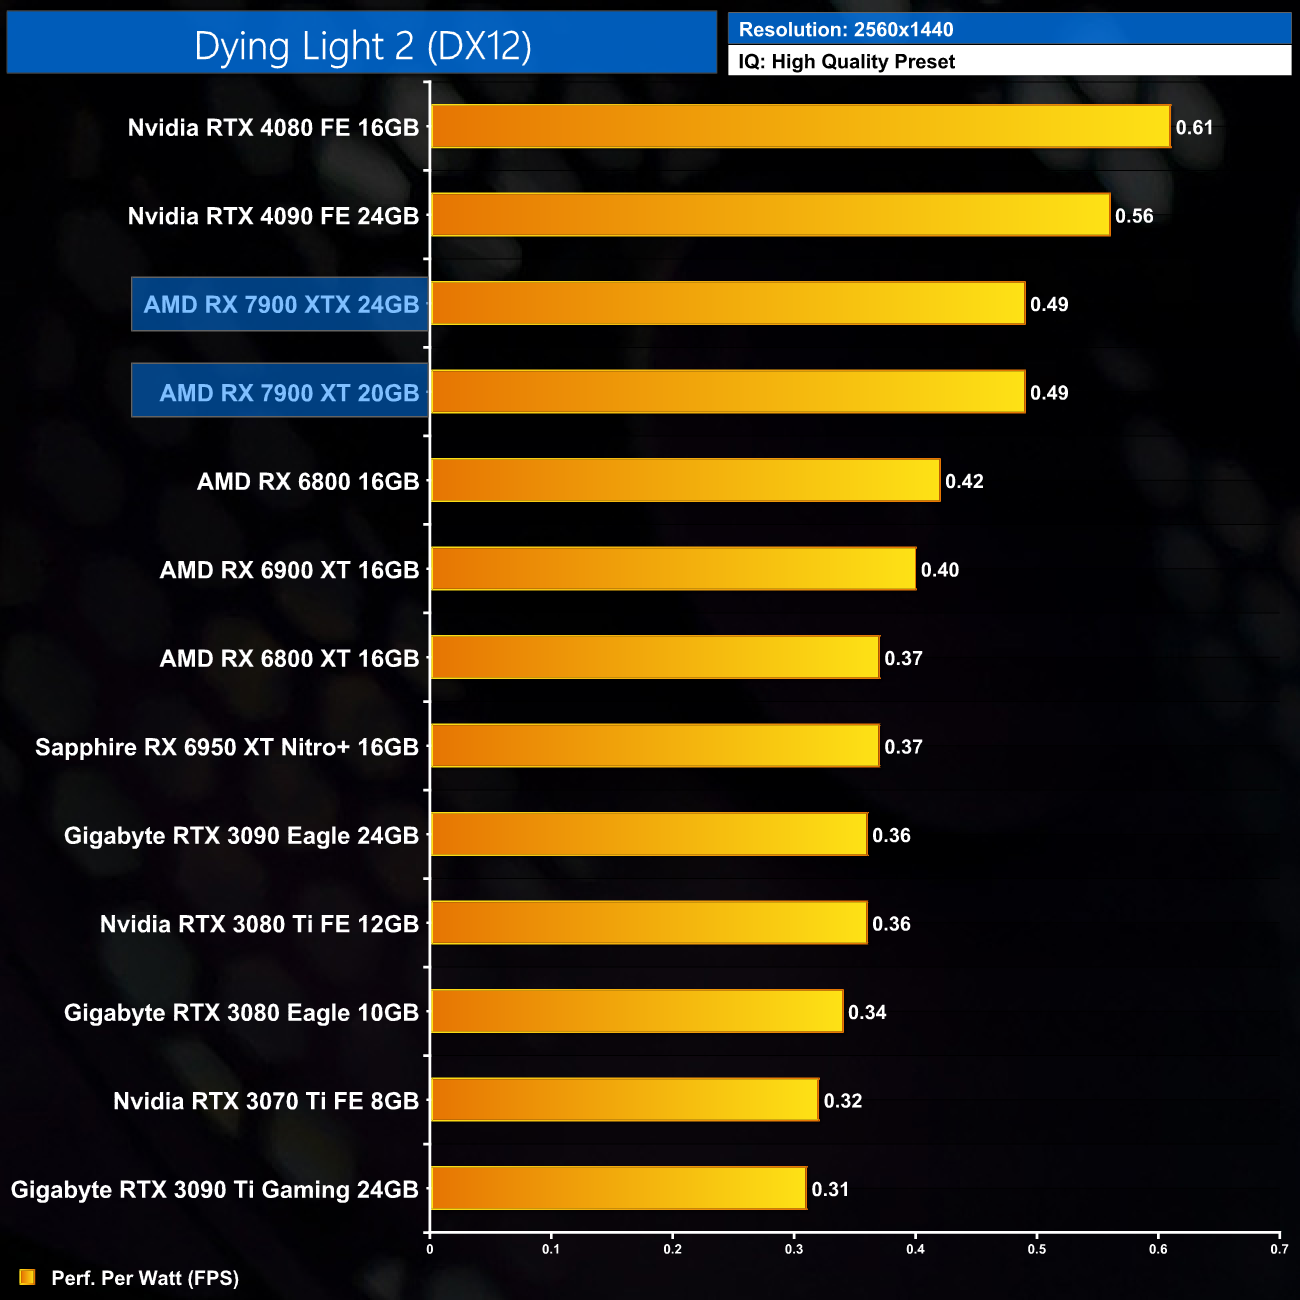
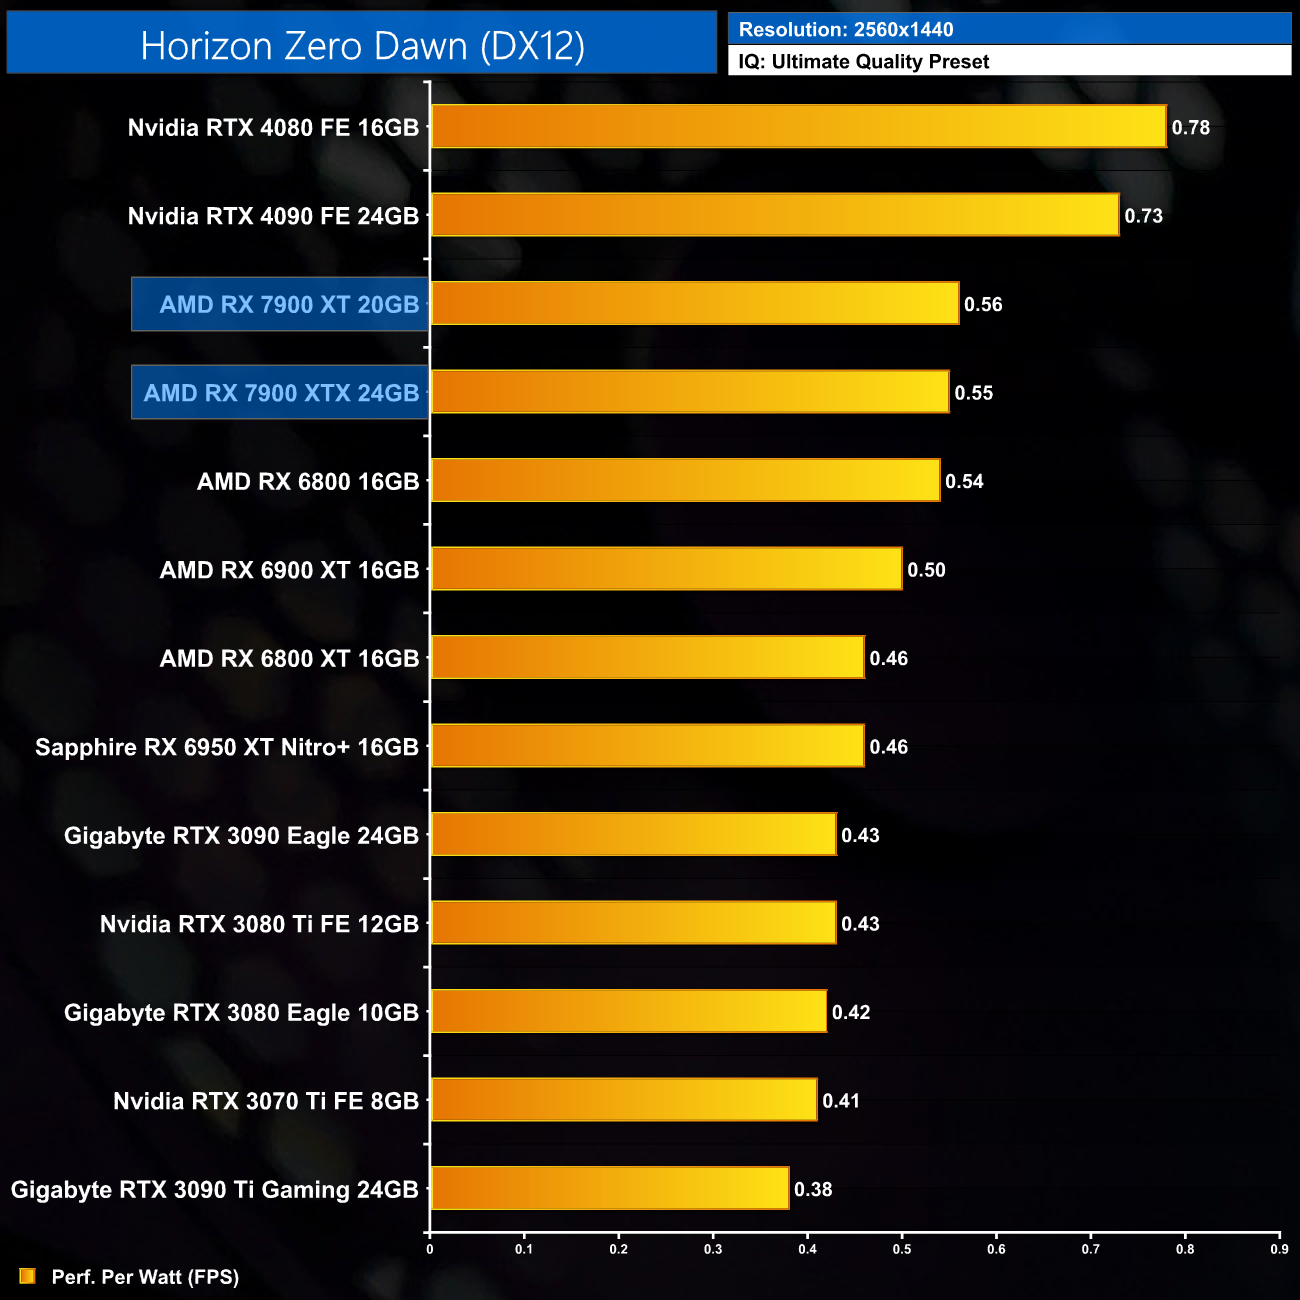
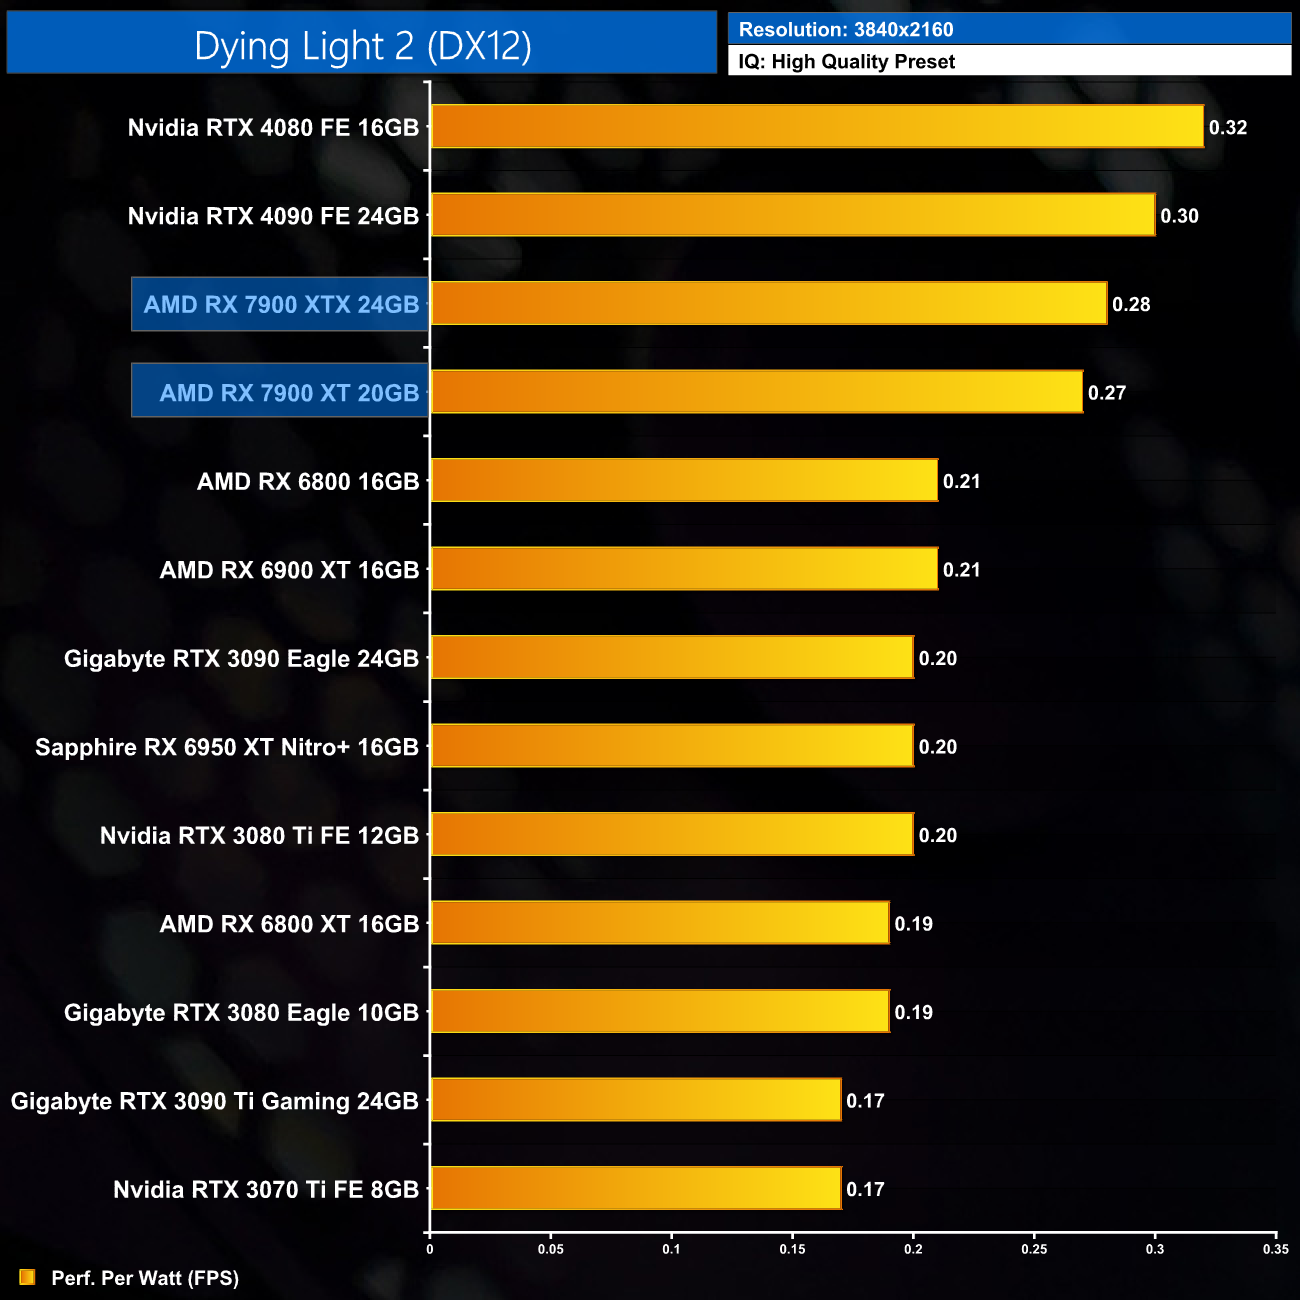
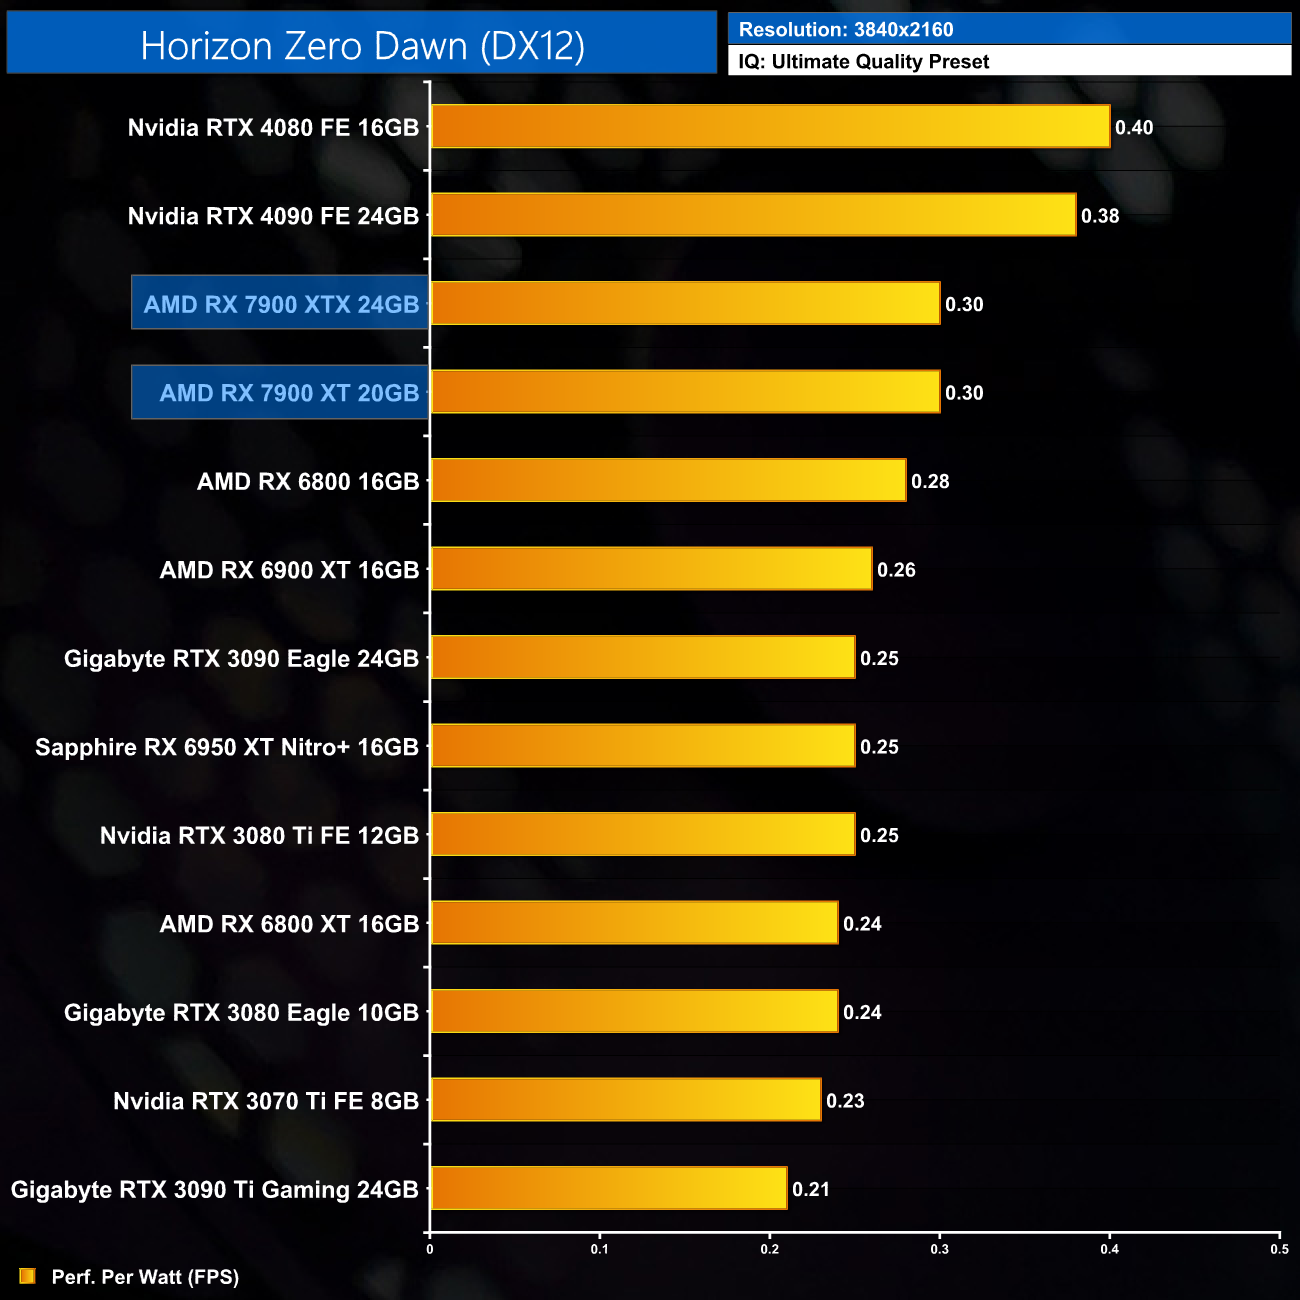
Using the graphics card-only power draw figures presented earlier in the review, here we present performance per Watt on a per-game basis for all twelve games we tested at 1440p.
Per-Game Results at 1440p:


Click to enlarge.
12-Game Average at 1440p:
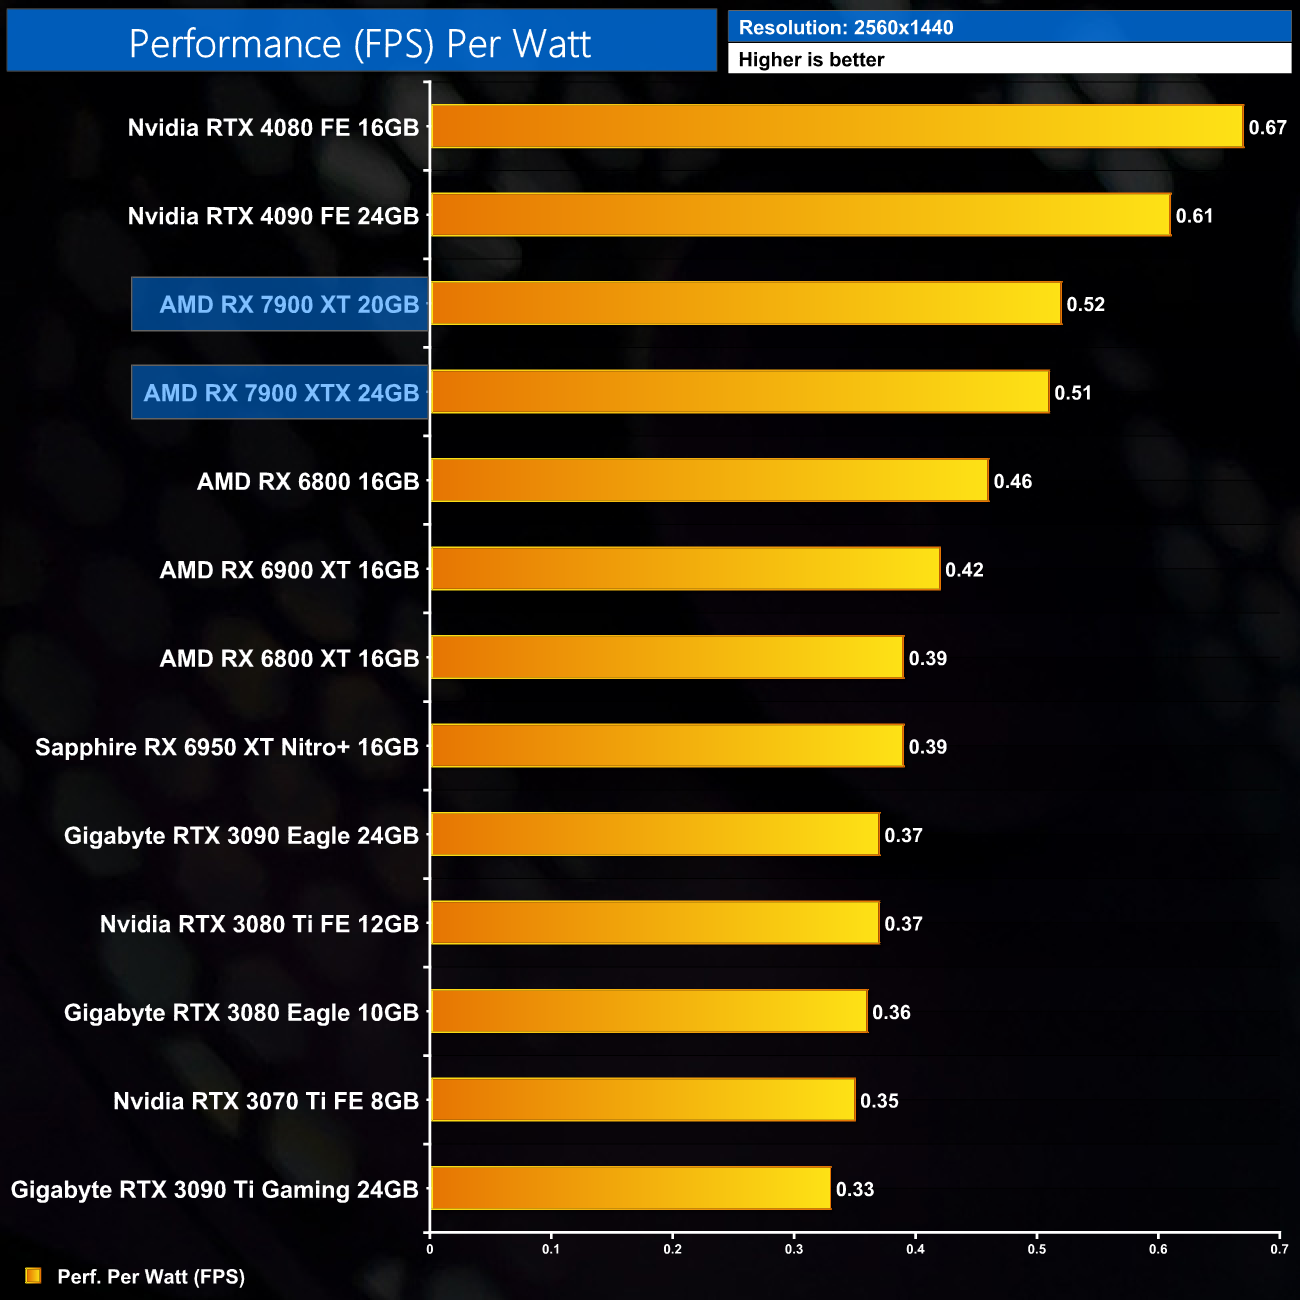
Stepping up to 1440p, there the RX 7900 XT offers a 24% improvement to performance per Watt versus the RX 6900 XT, though it's also 15% less efficient than the RTX 4080.
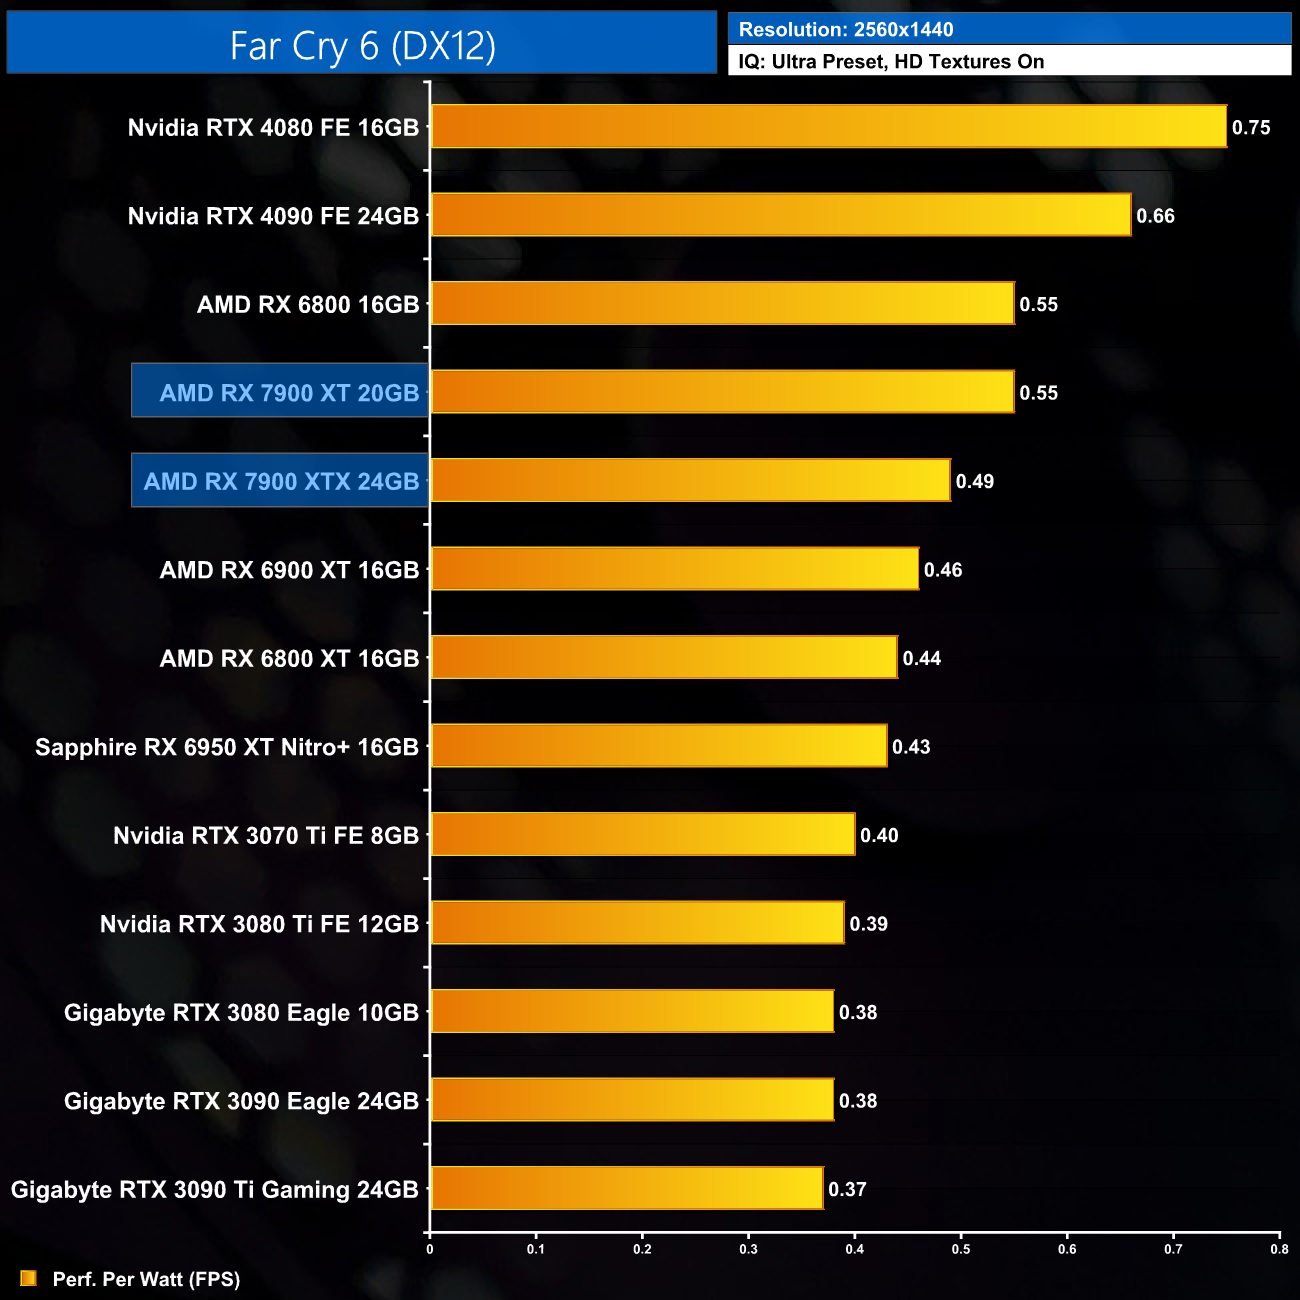
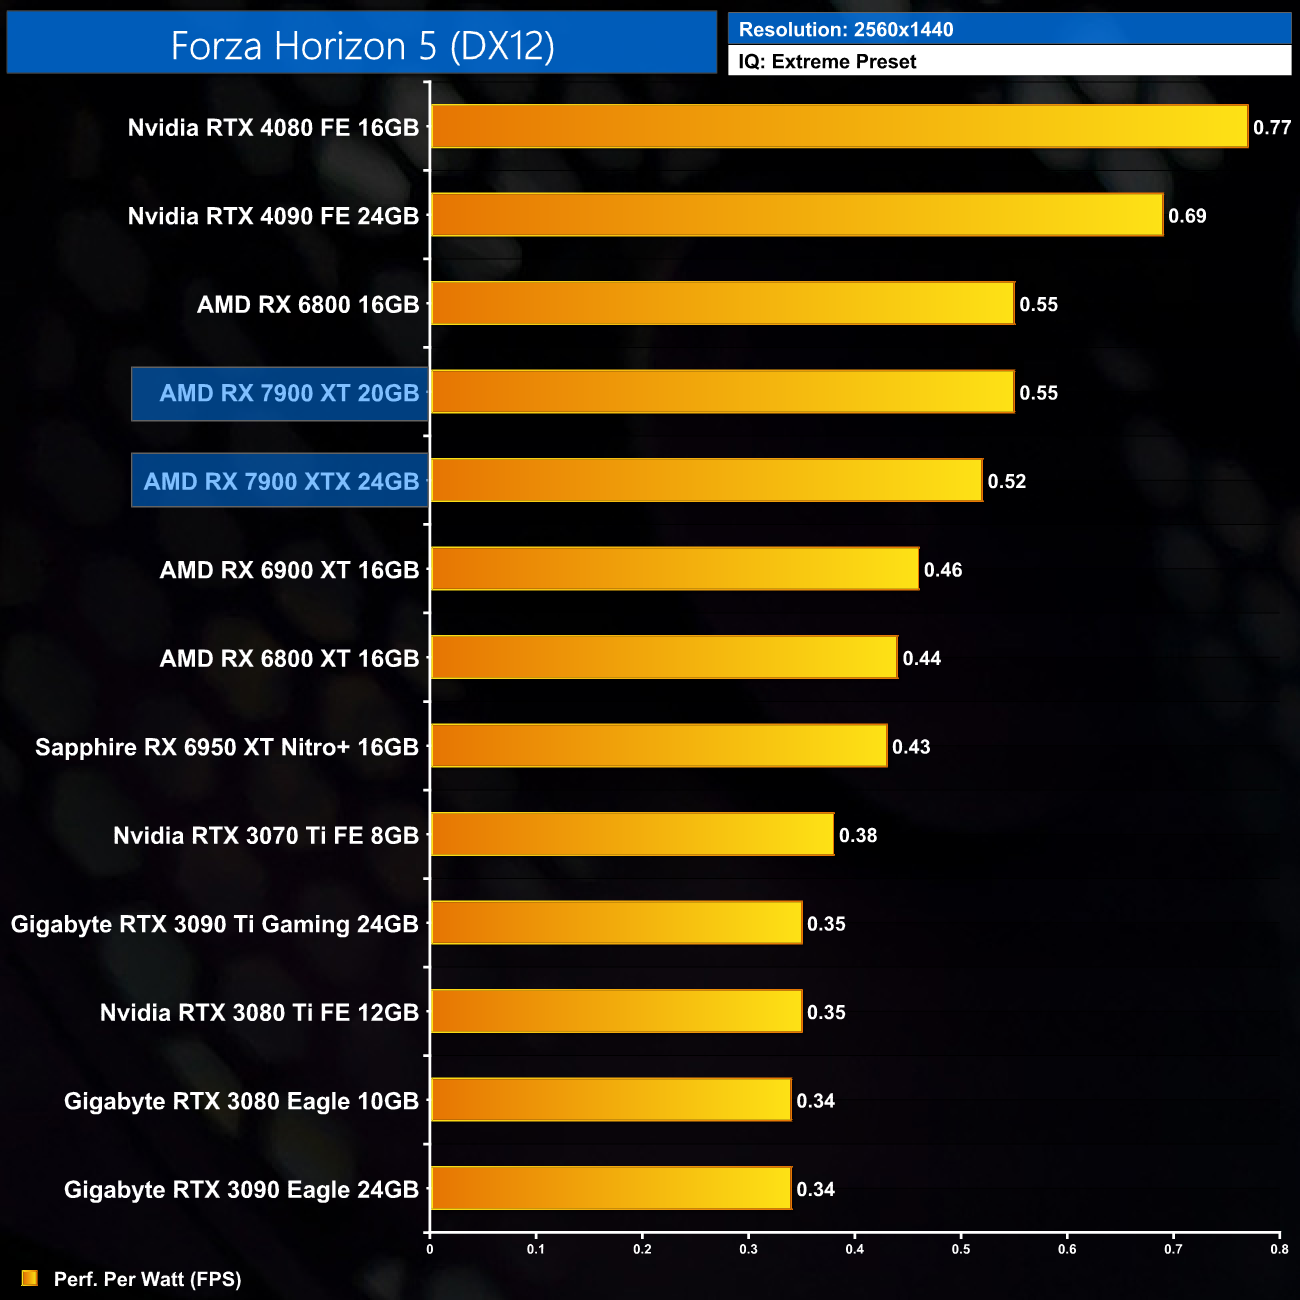
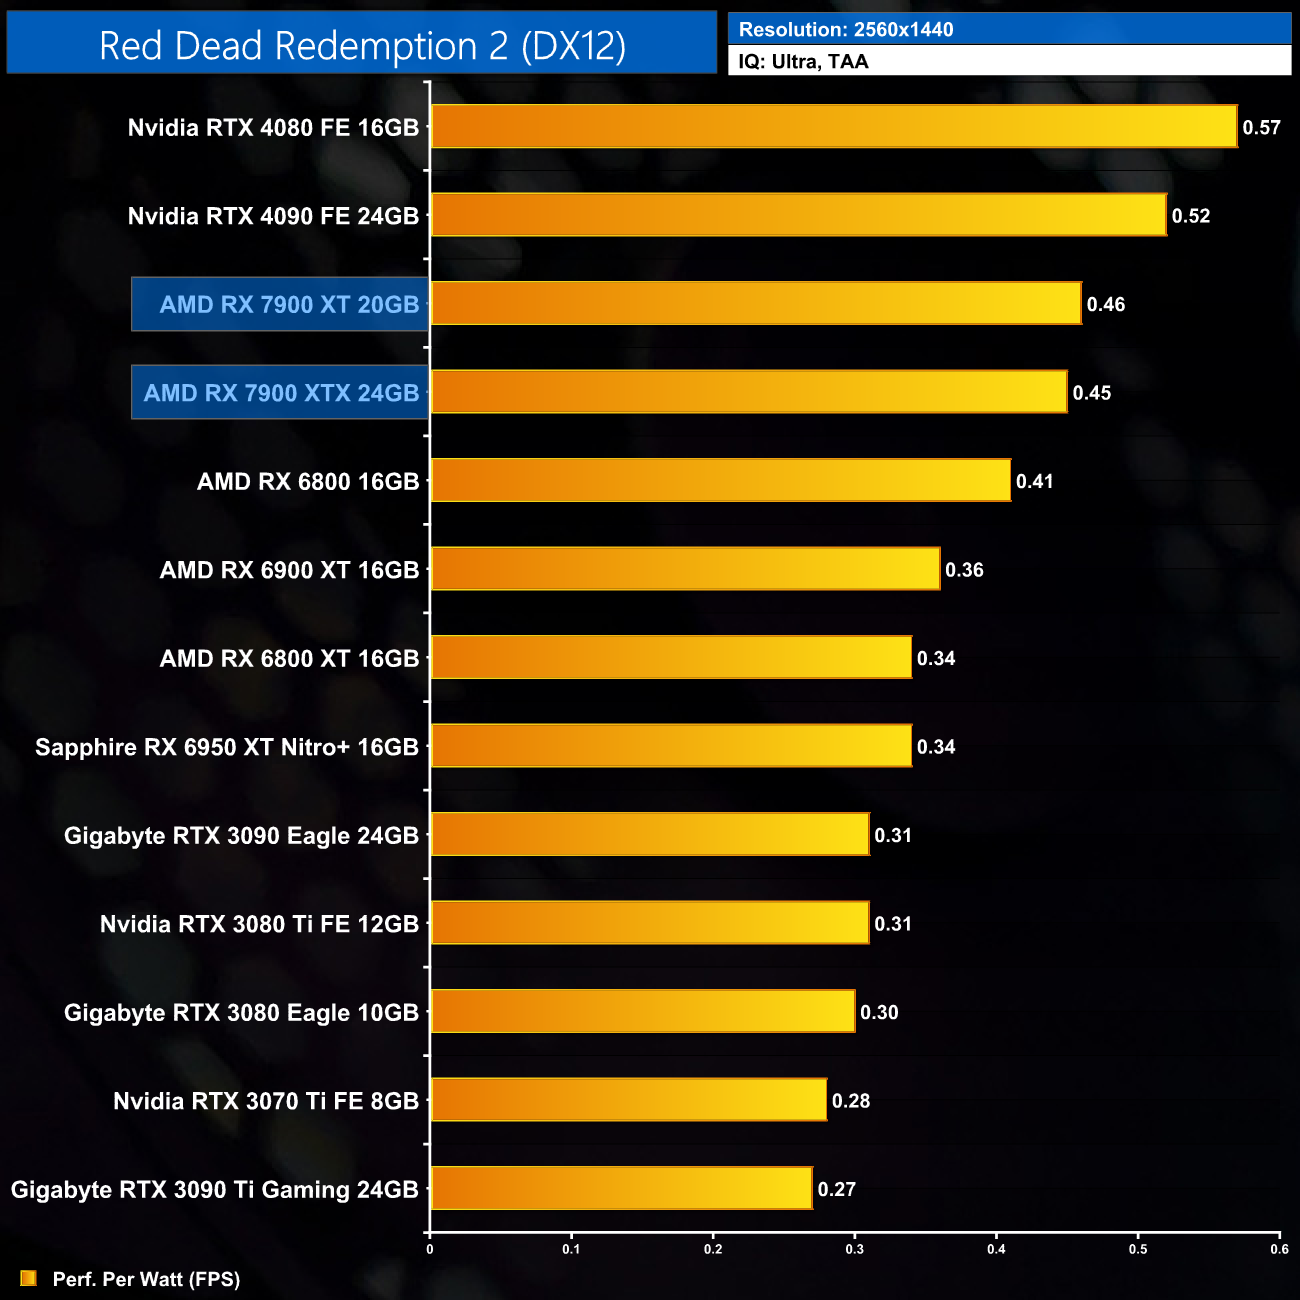
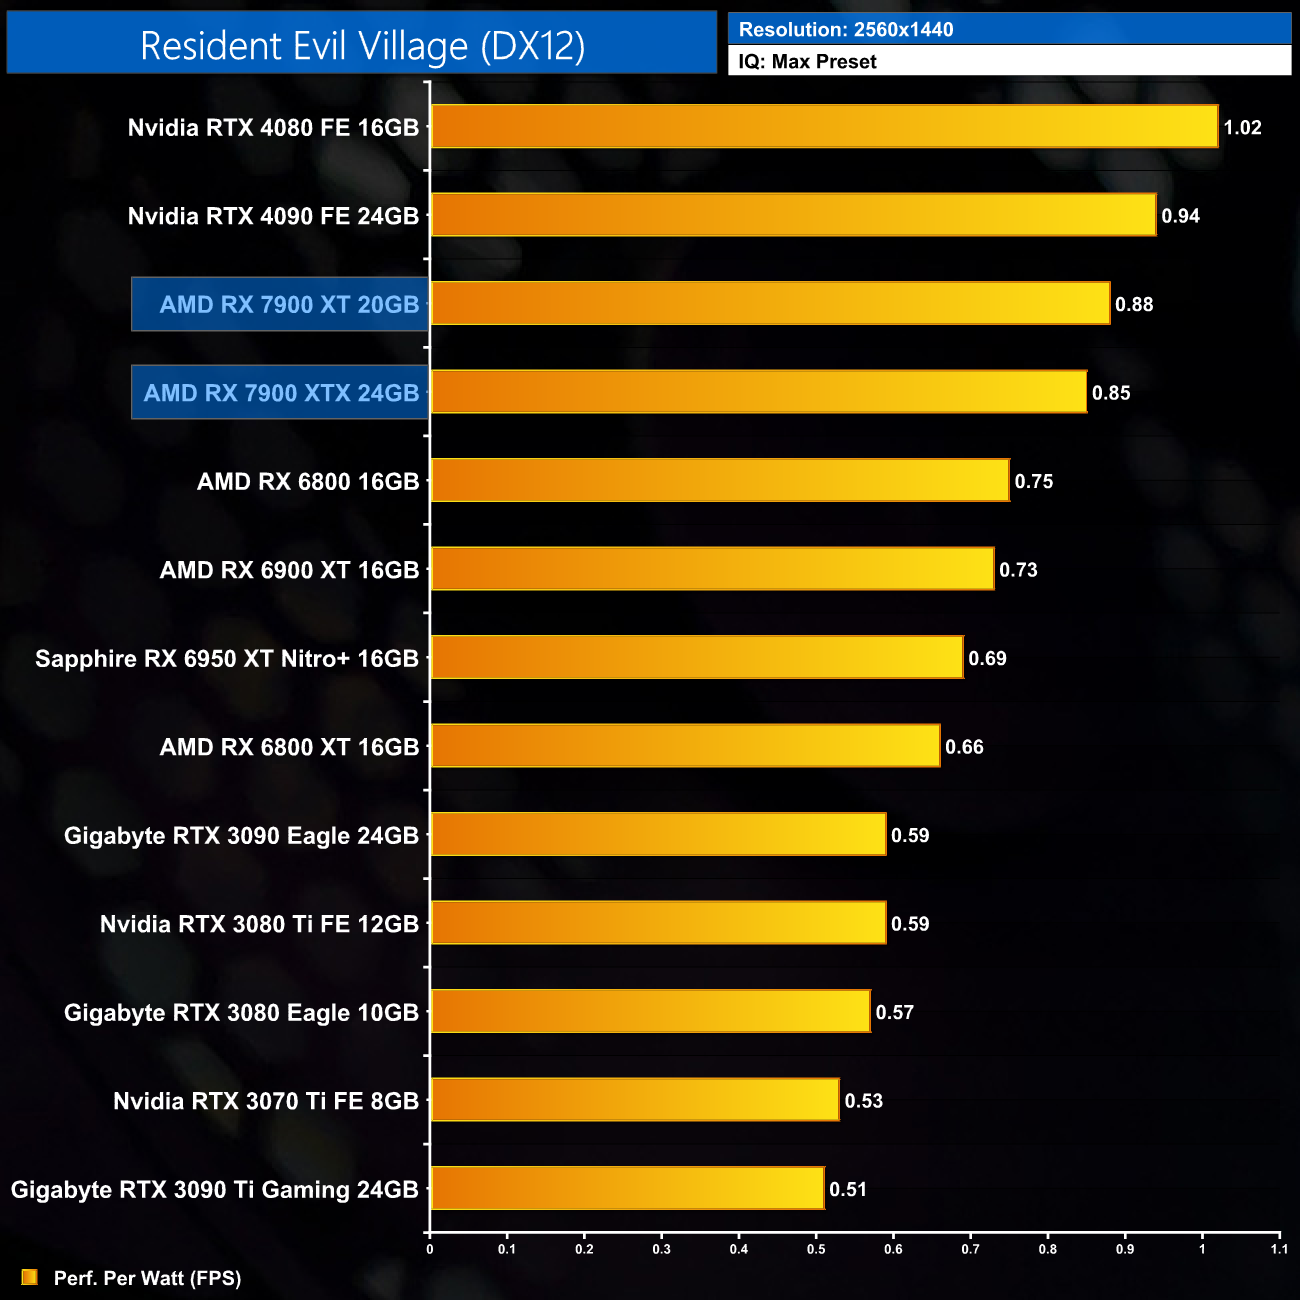
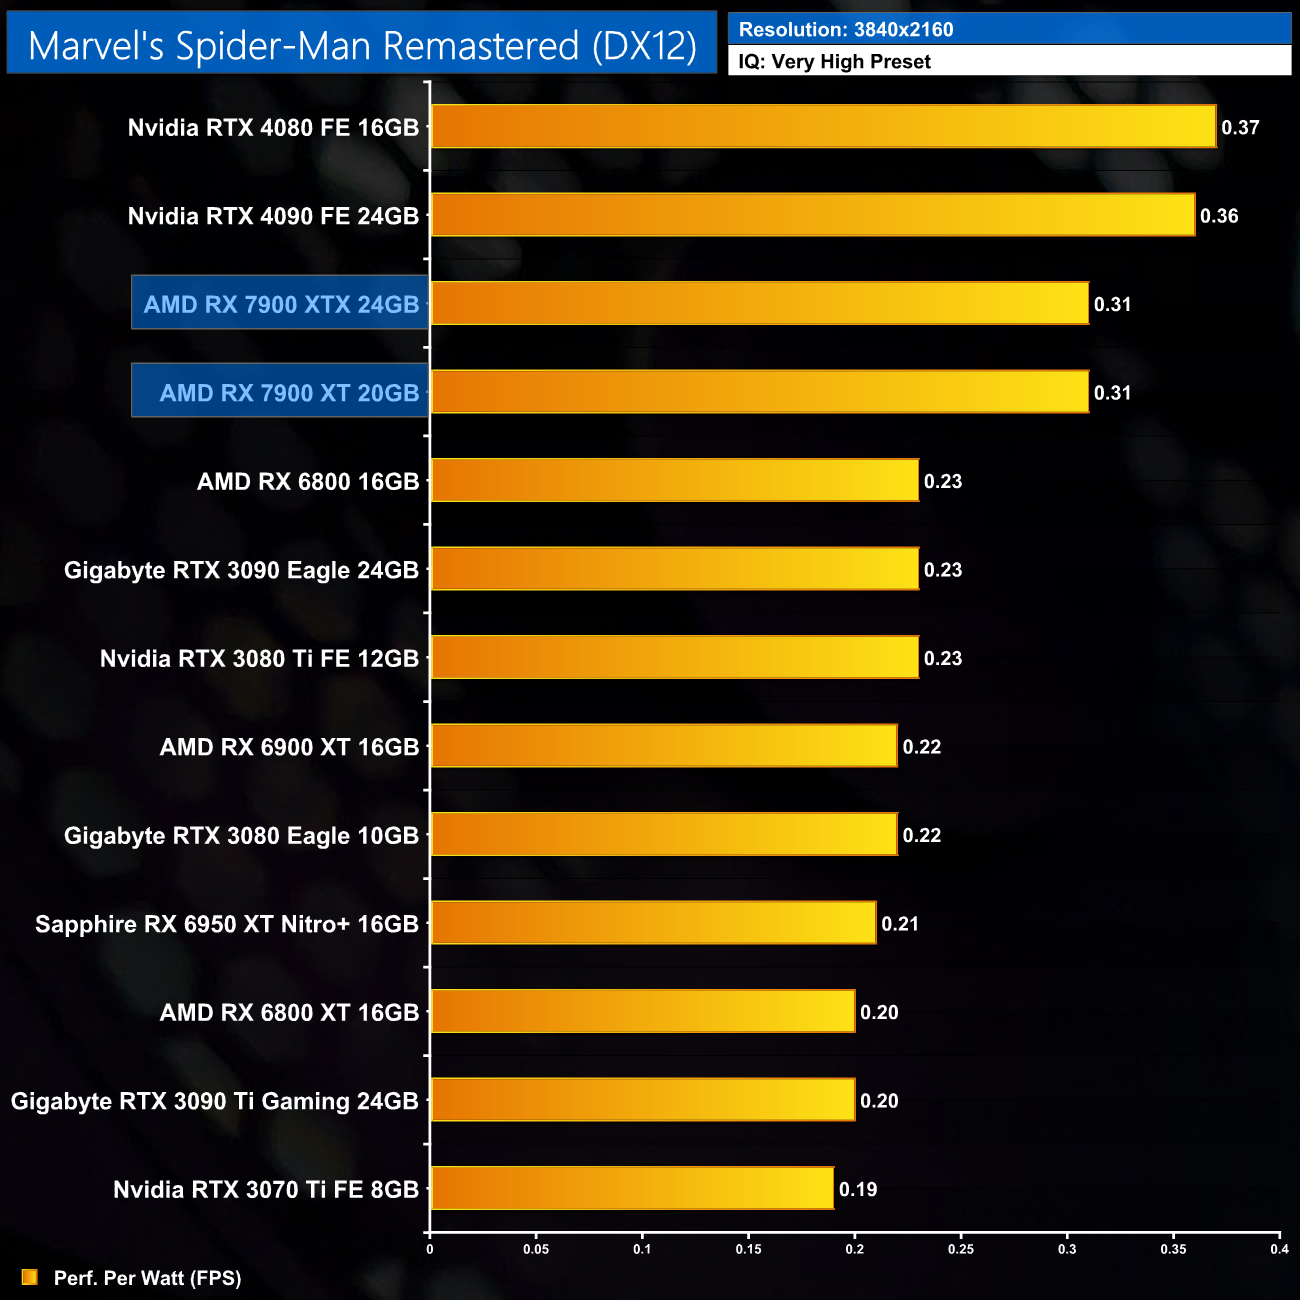
Using the graphics card-only power draw figures presented earlier in the review, here we present performance per Watt on a per-game basis for all twelve games we tested at 2160p (4K).
Per-Game Results at 2160p (4K):
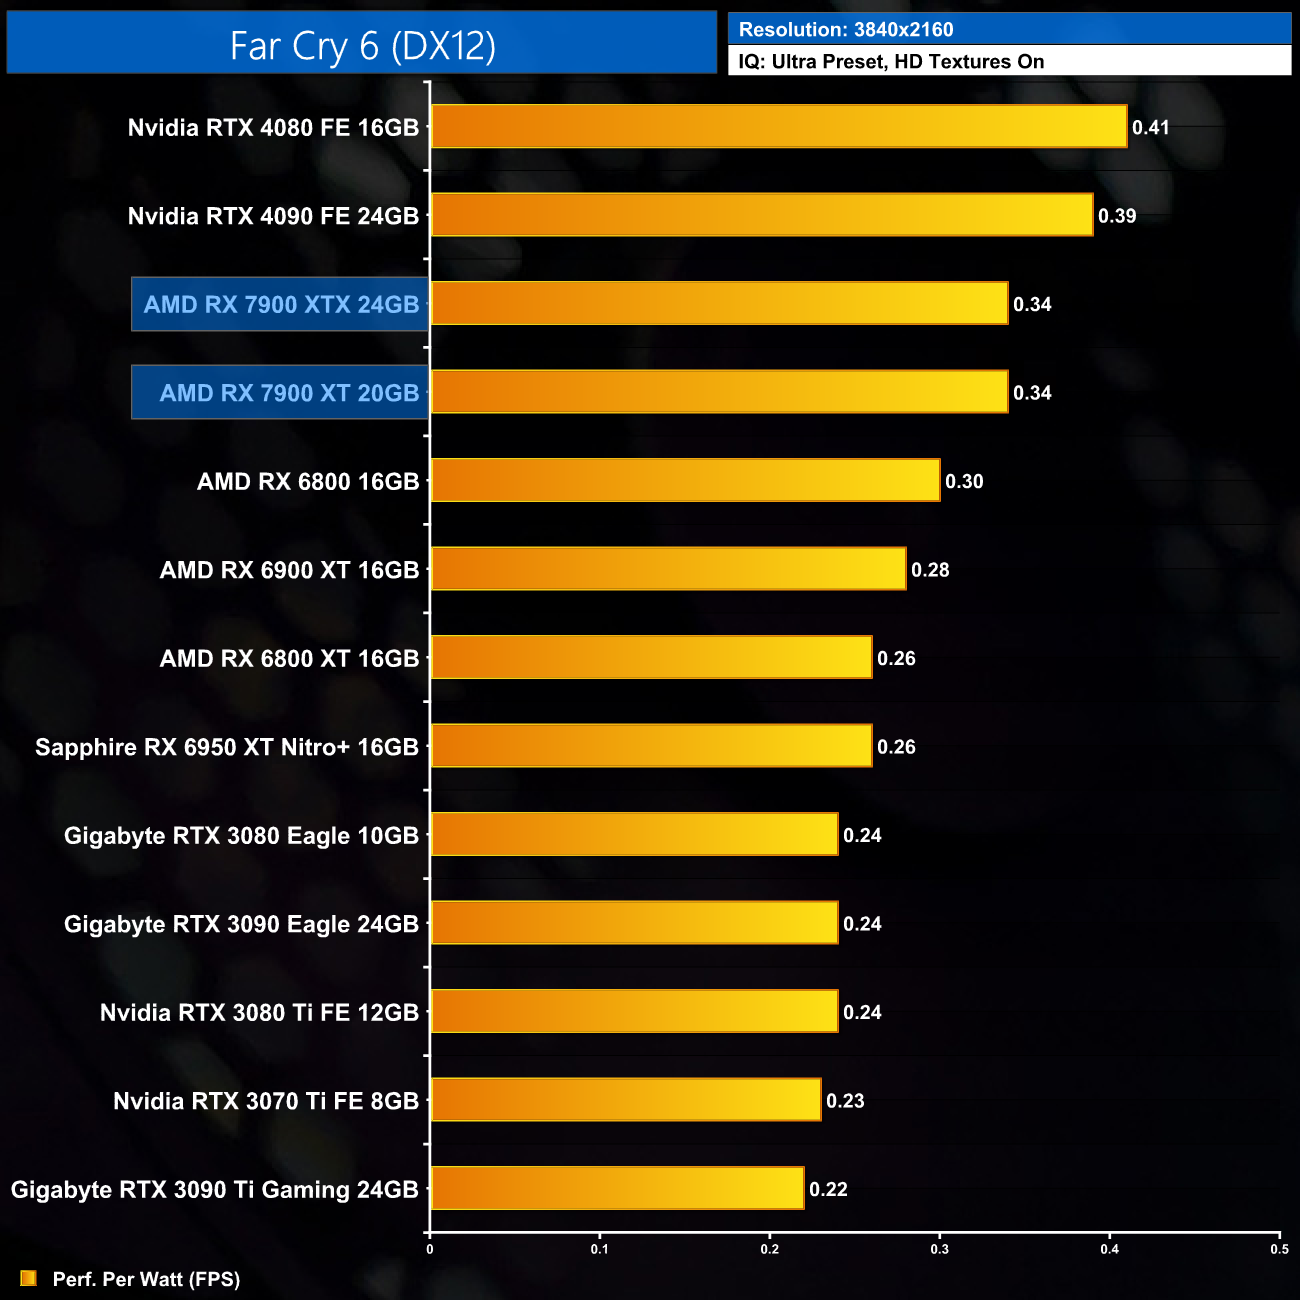
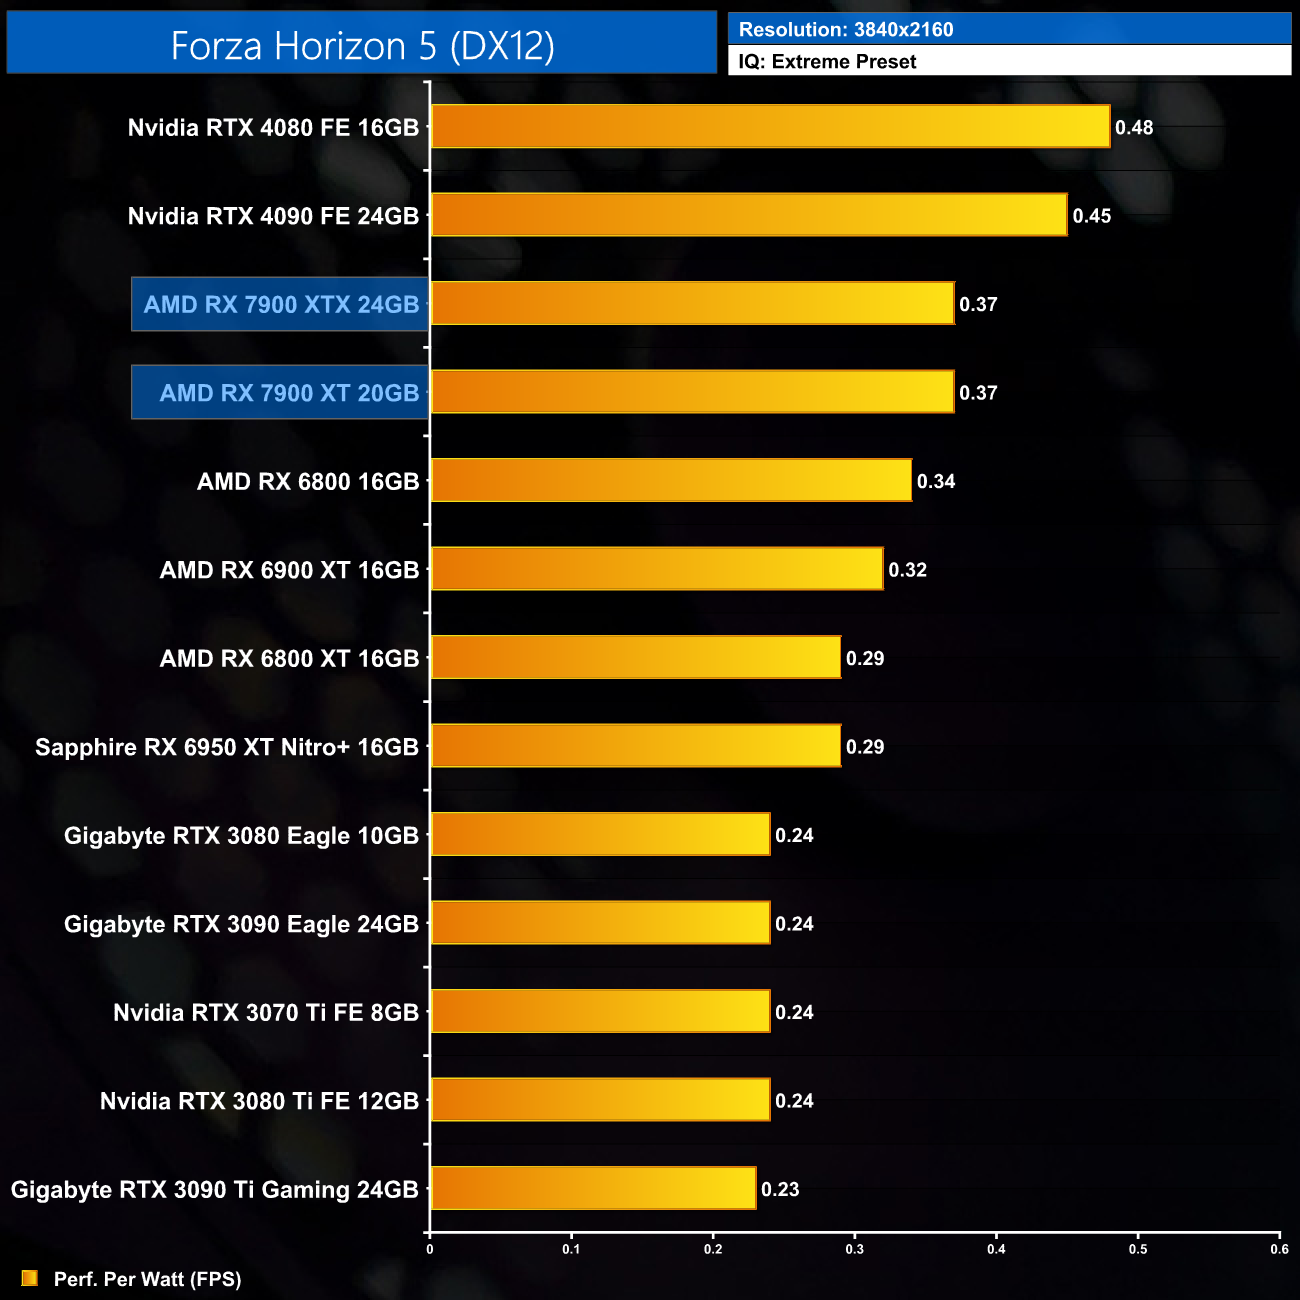
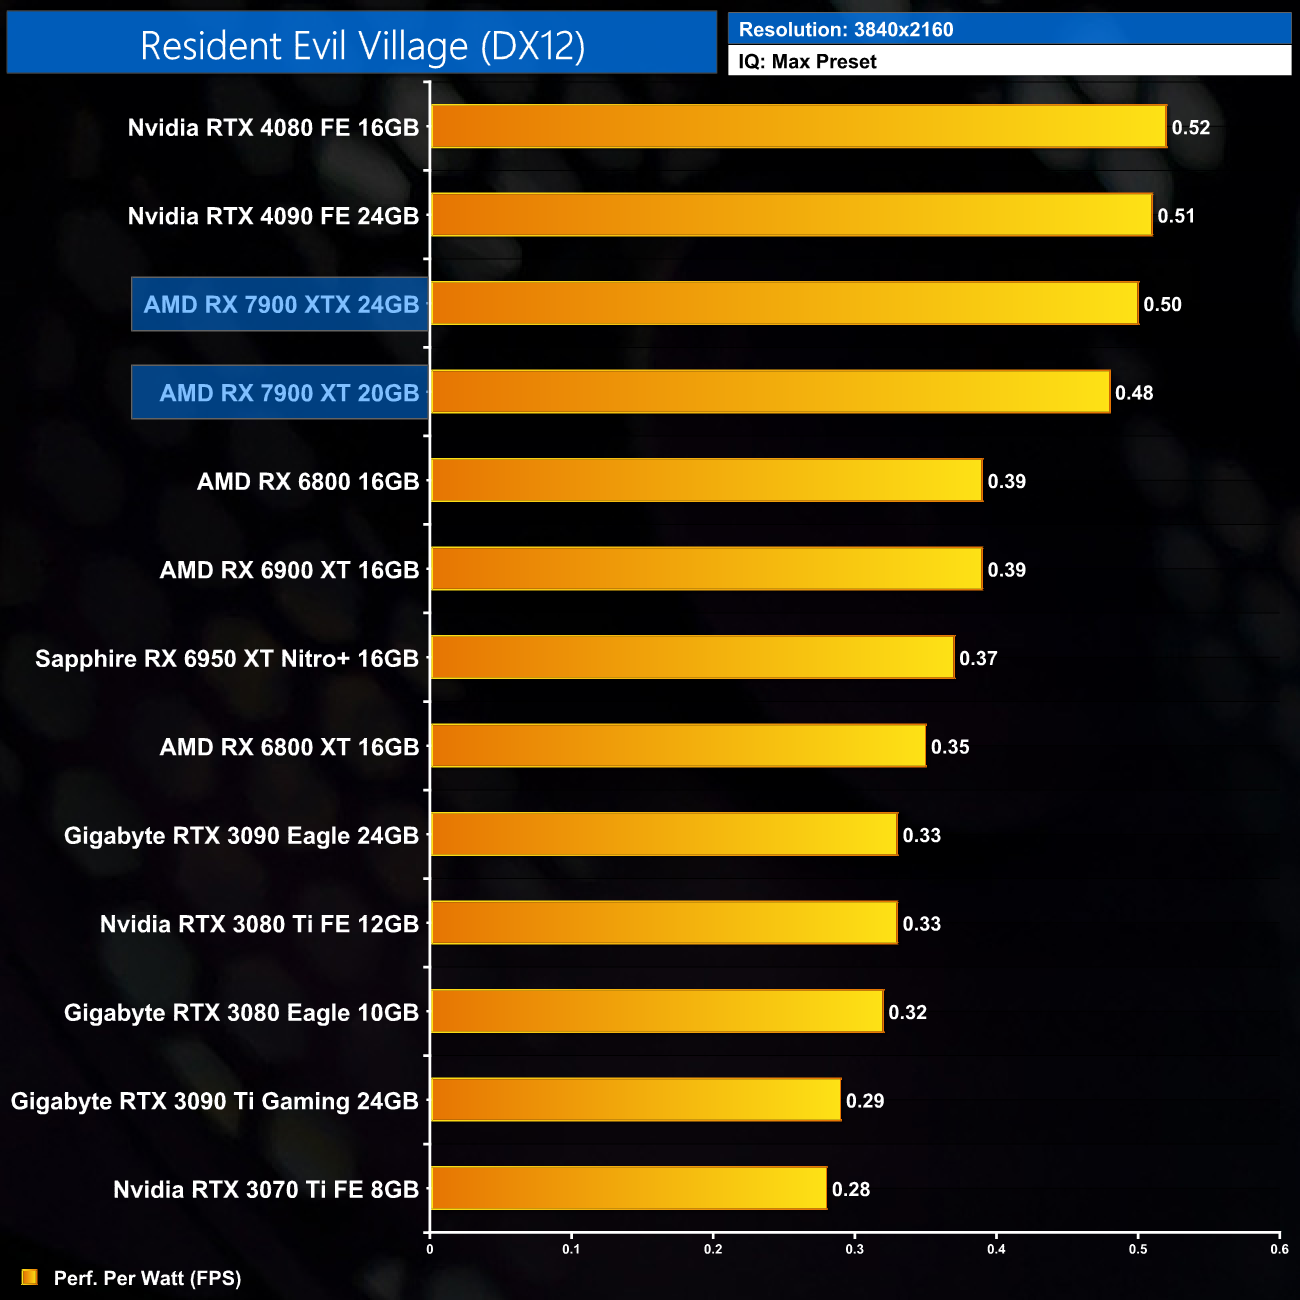
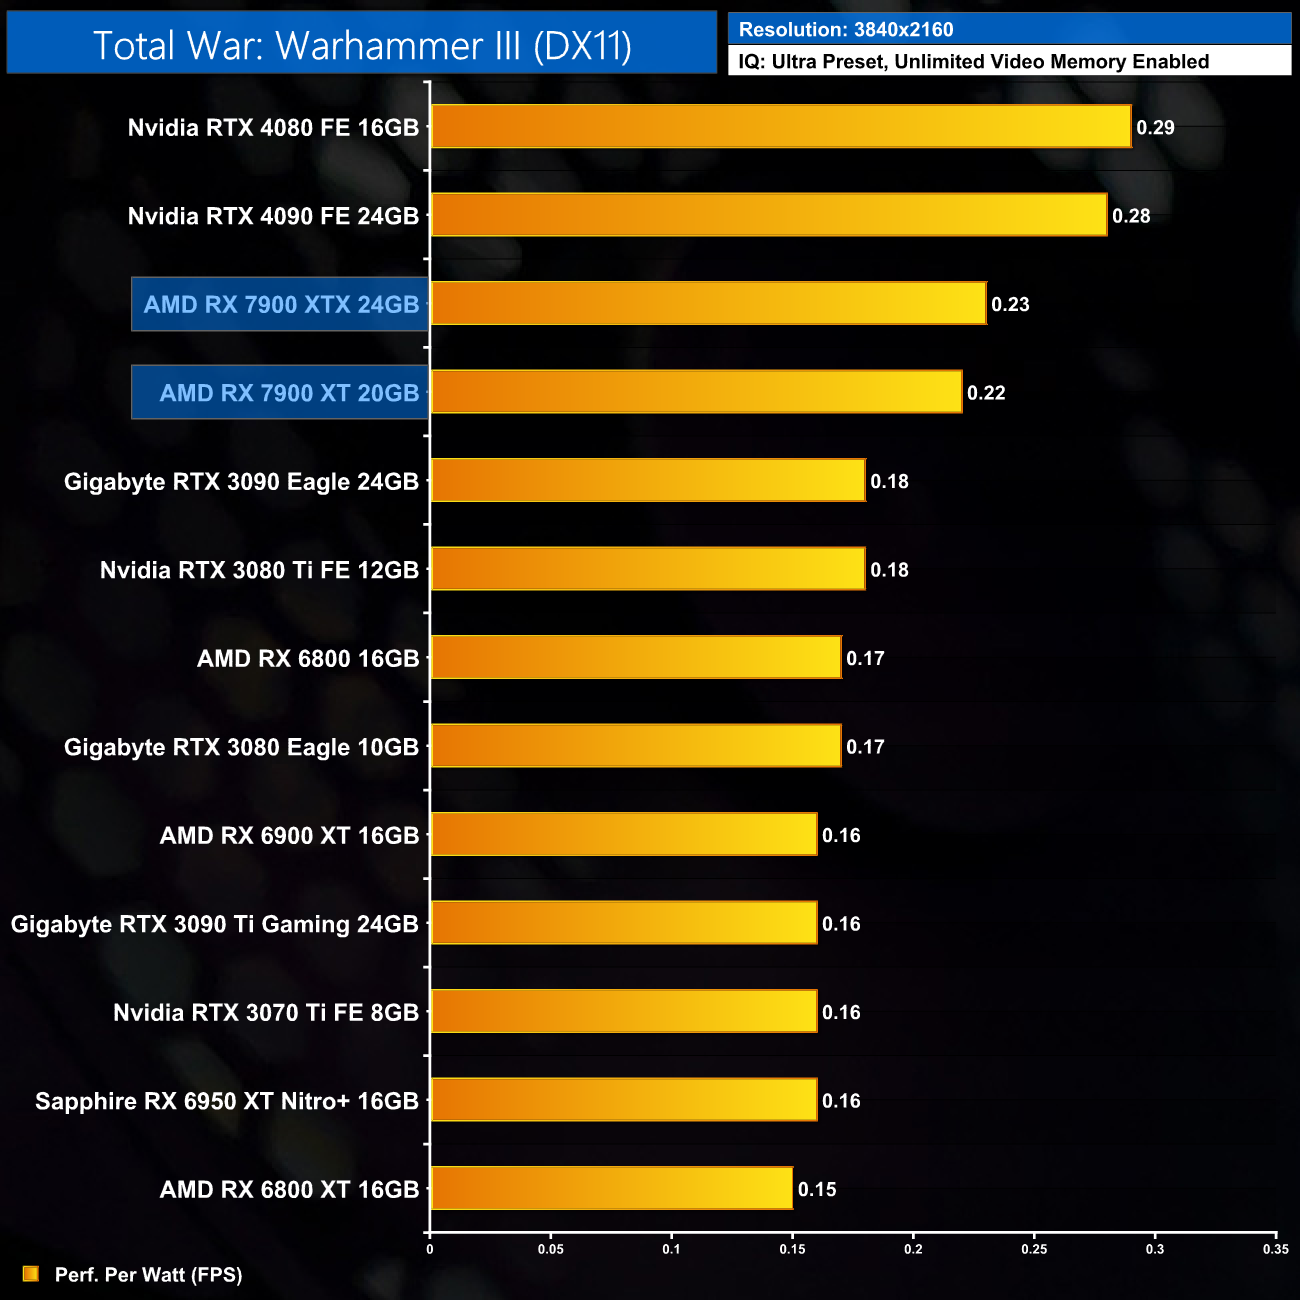
Click to enlarge.
12-Game Average at 2160p (4K):
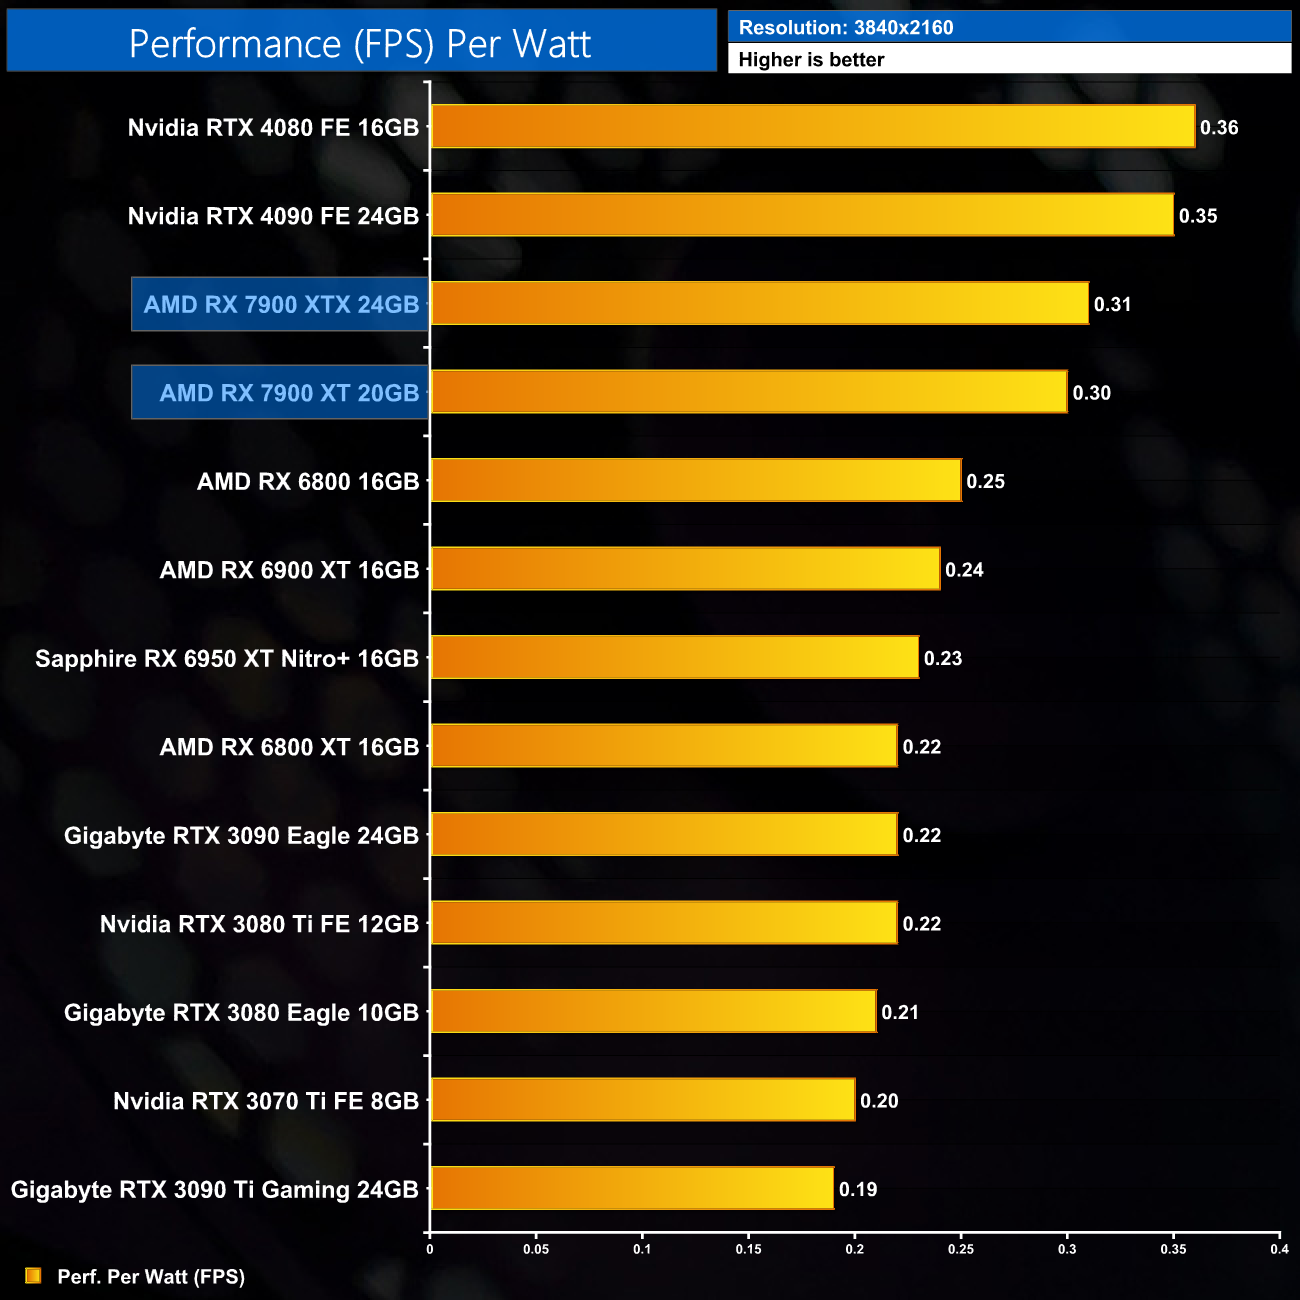
Lastly, at 4K, here the RX 7900 XT is actually a touch less efficient than the XTX – again not something we usually see as typically the lower power SKUs are more efficient. There's only 3% in it but it was measurable over the 12 games we tested.
We measure system-wide power draw from the wall while running Cyberpunk 2077 for 30 minutes. We do this at 1080p, 1440p and 2160p (4K) to give you a better idea of total system power draw across a range of resolutions, where CPU power is typically higher at the lower resolutions.
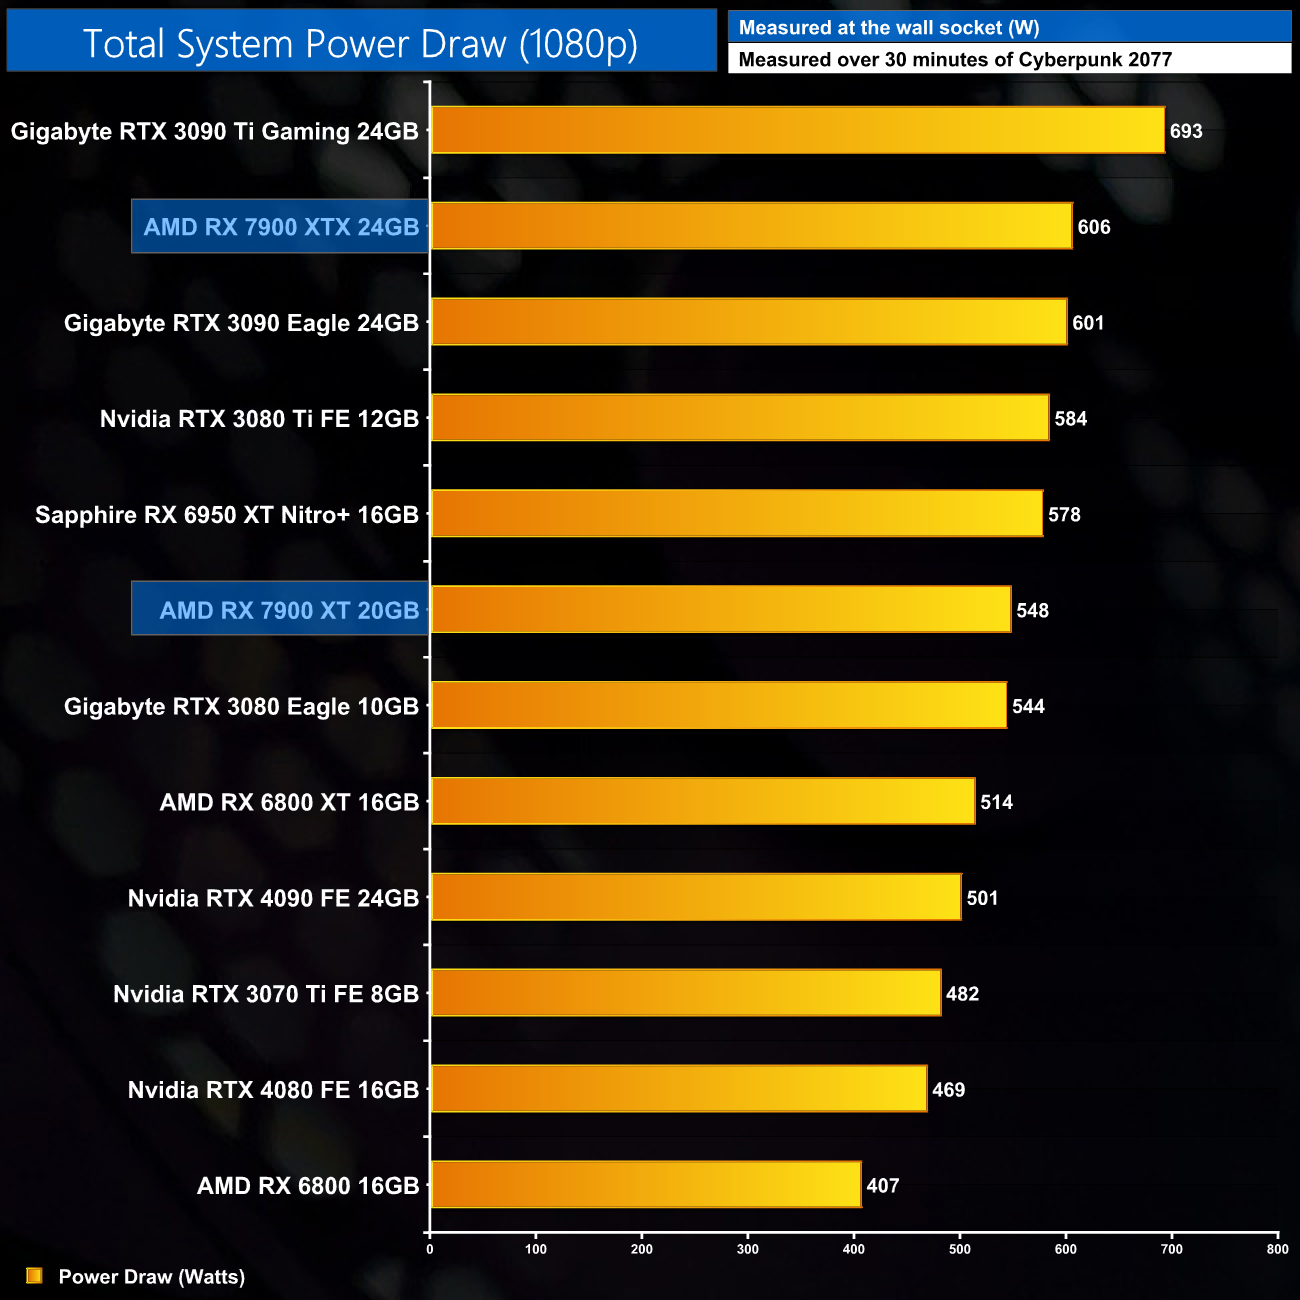
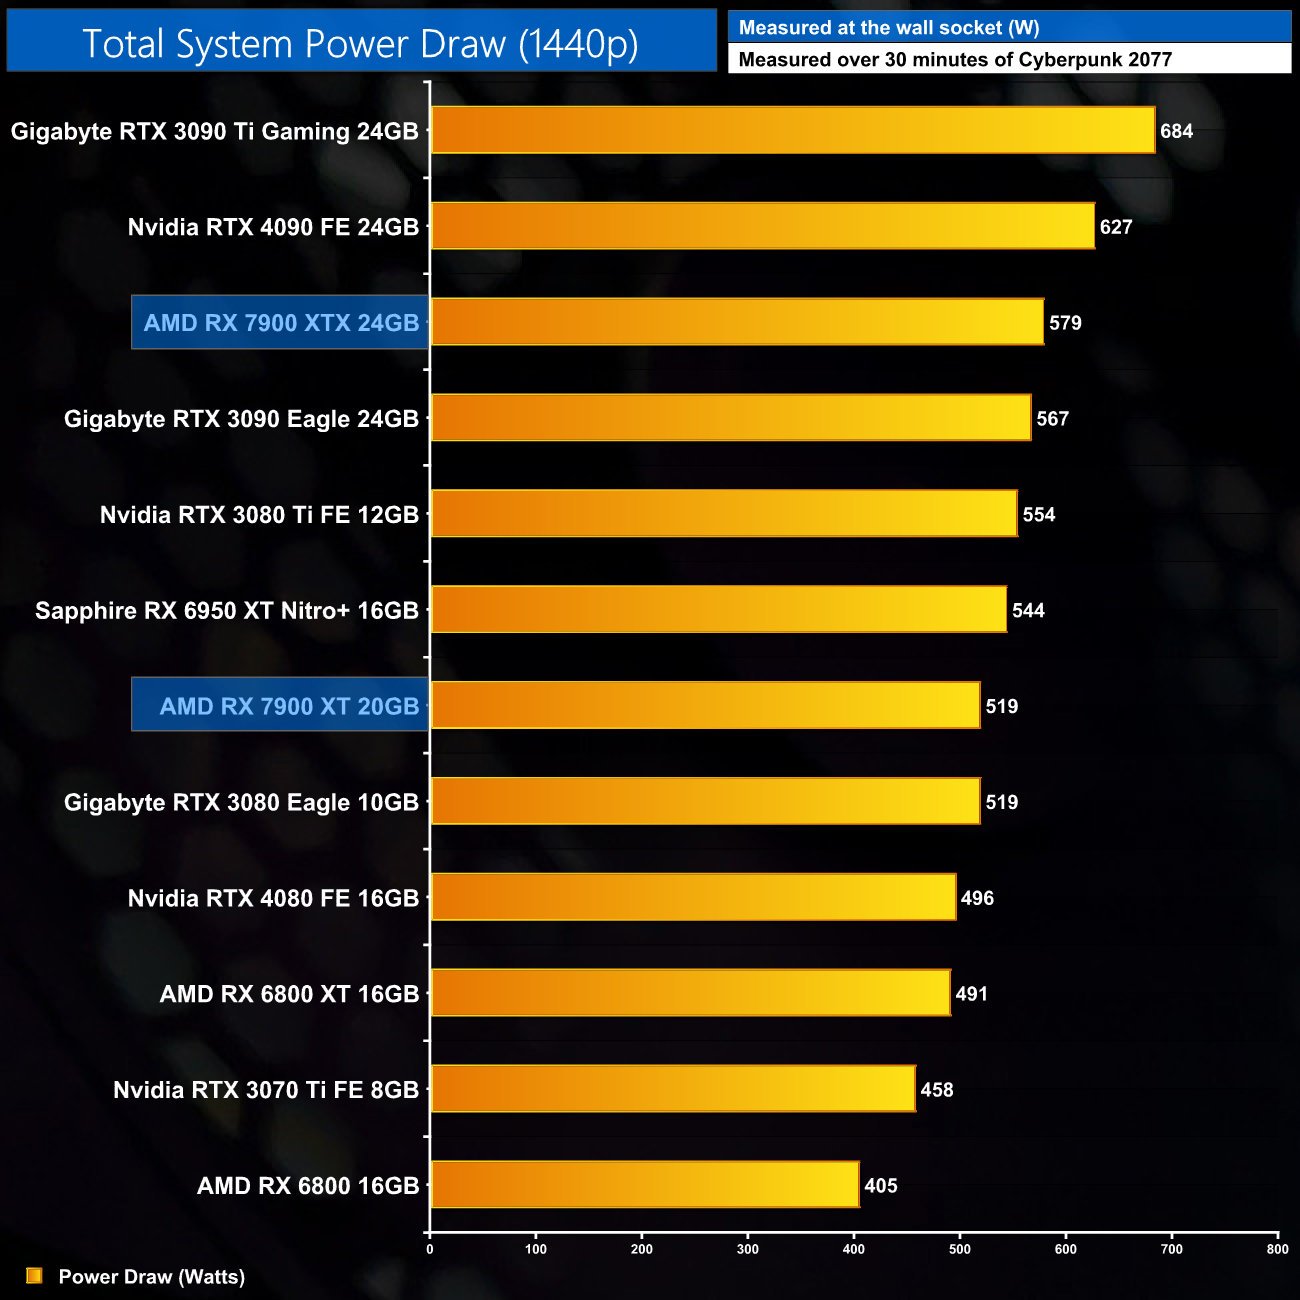
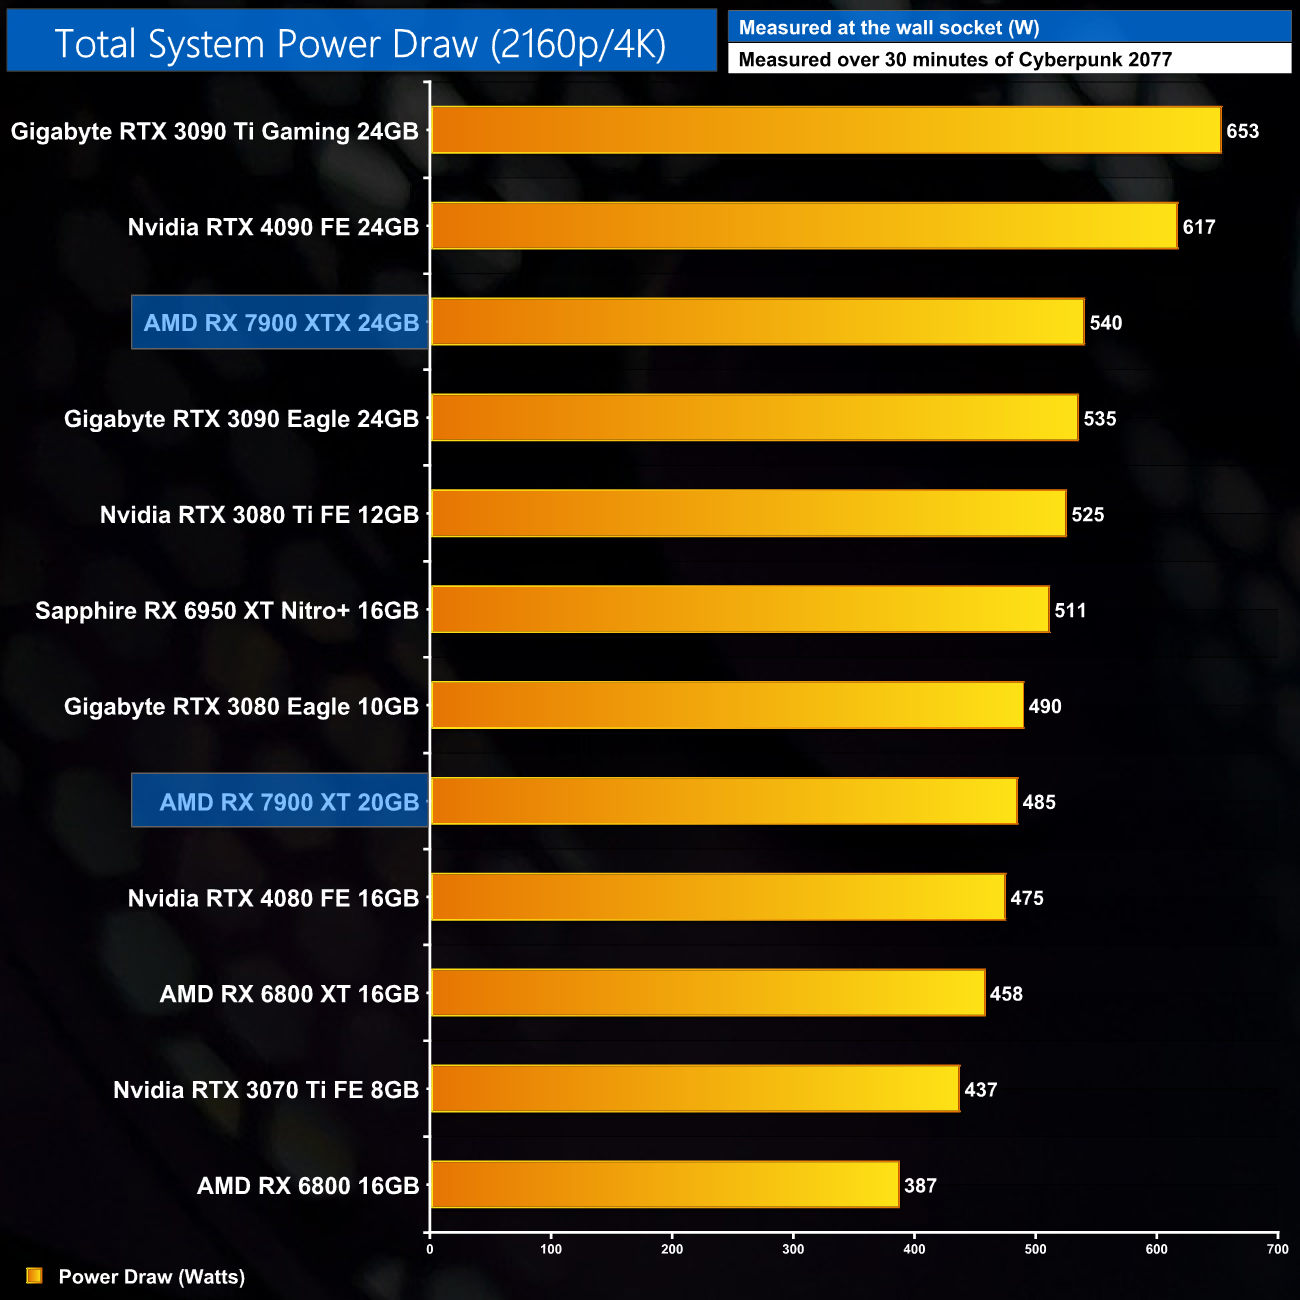
As for total system power draw, we test a range of resolutions to give you an idea of what to expect. This does vary from game to game, as of course CPU load is included in these figures, but we're looking at 510-550W in Cyberpunk 2077 so that gives you a good idea. AMD officially recommends a 750W PSU.
For our manual overclocking tests, we used AMD's built in tuning tool. Our best results are as below.
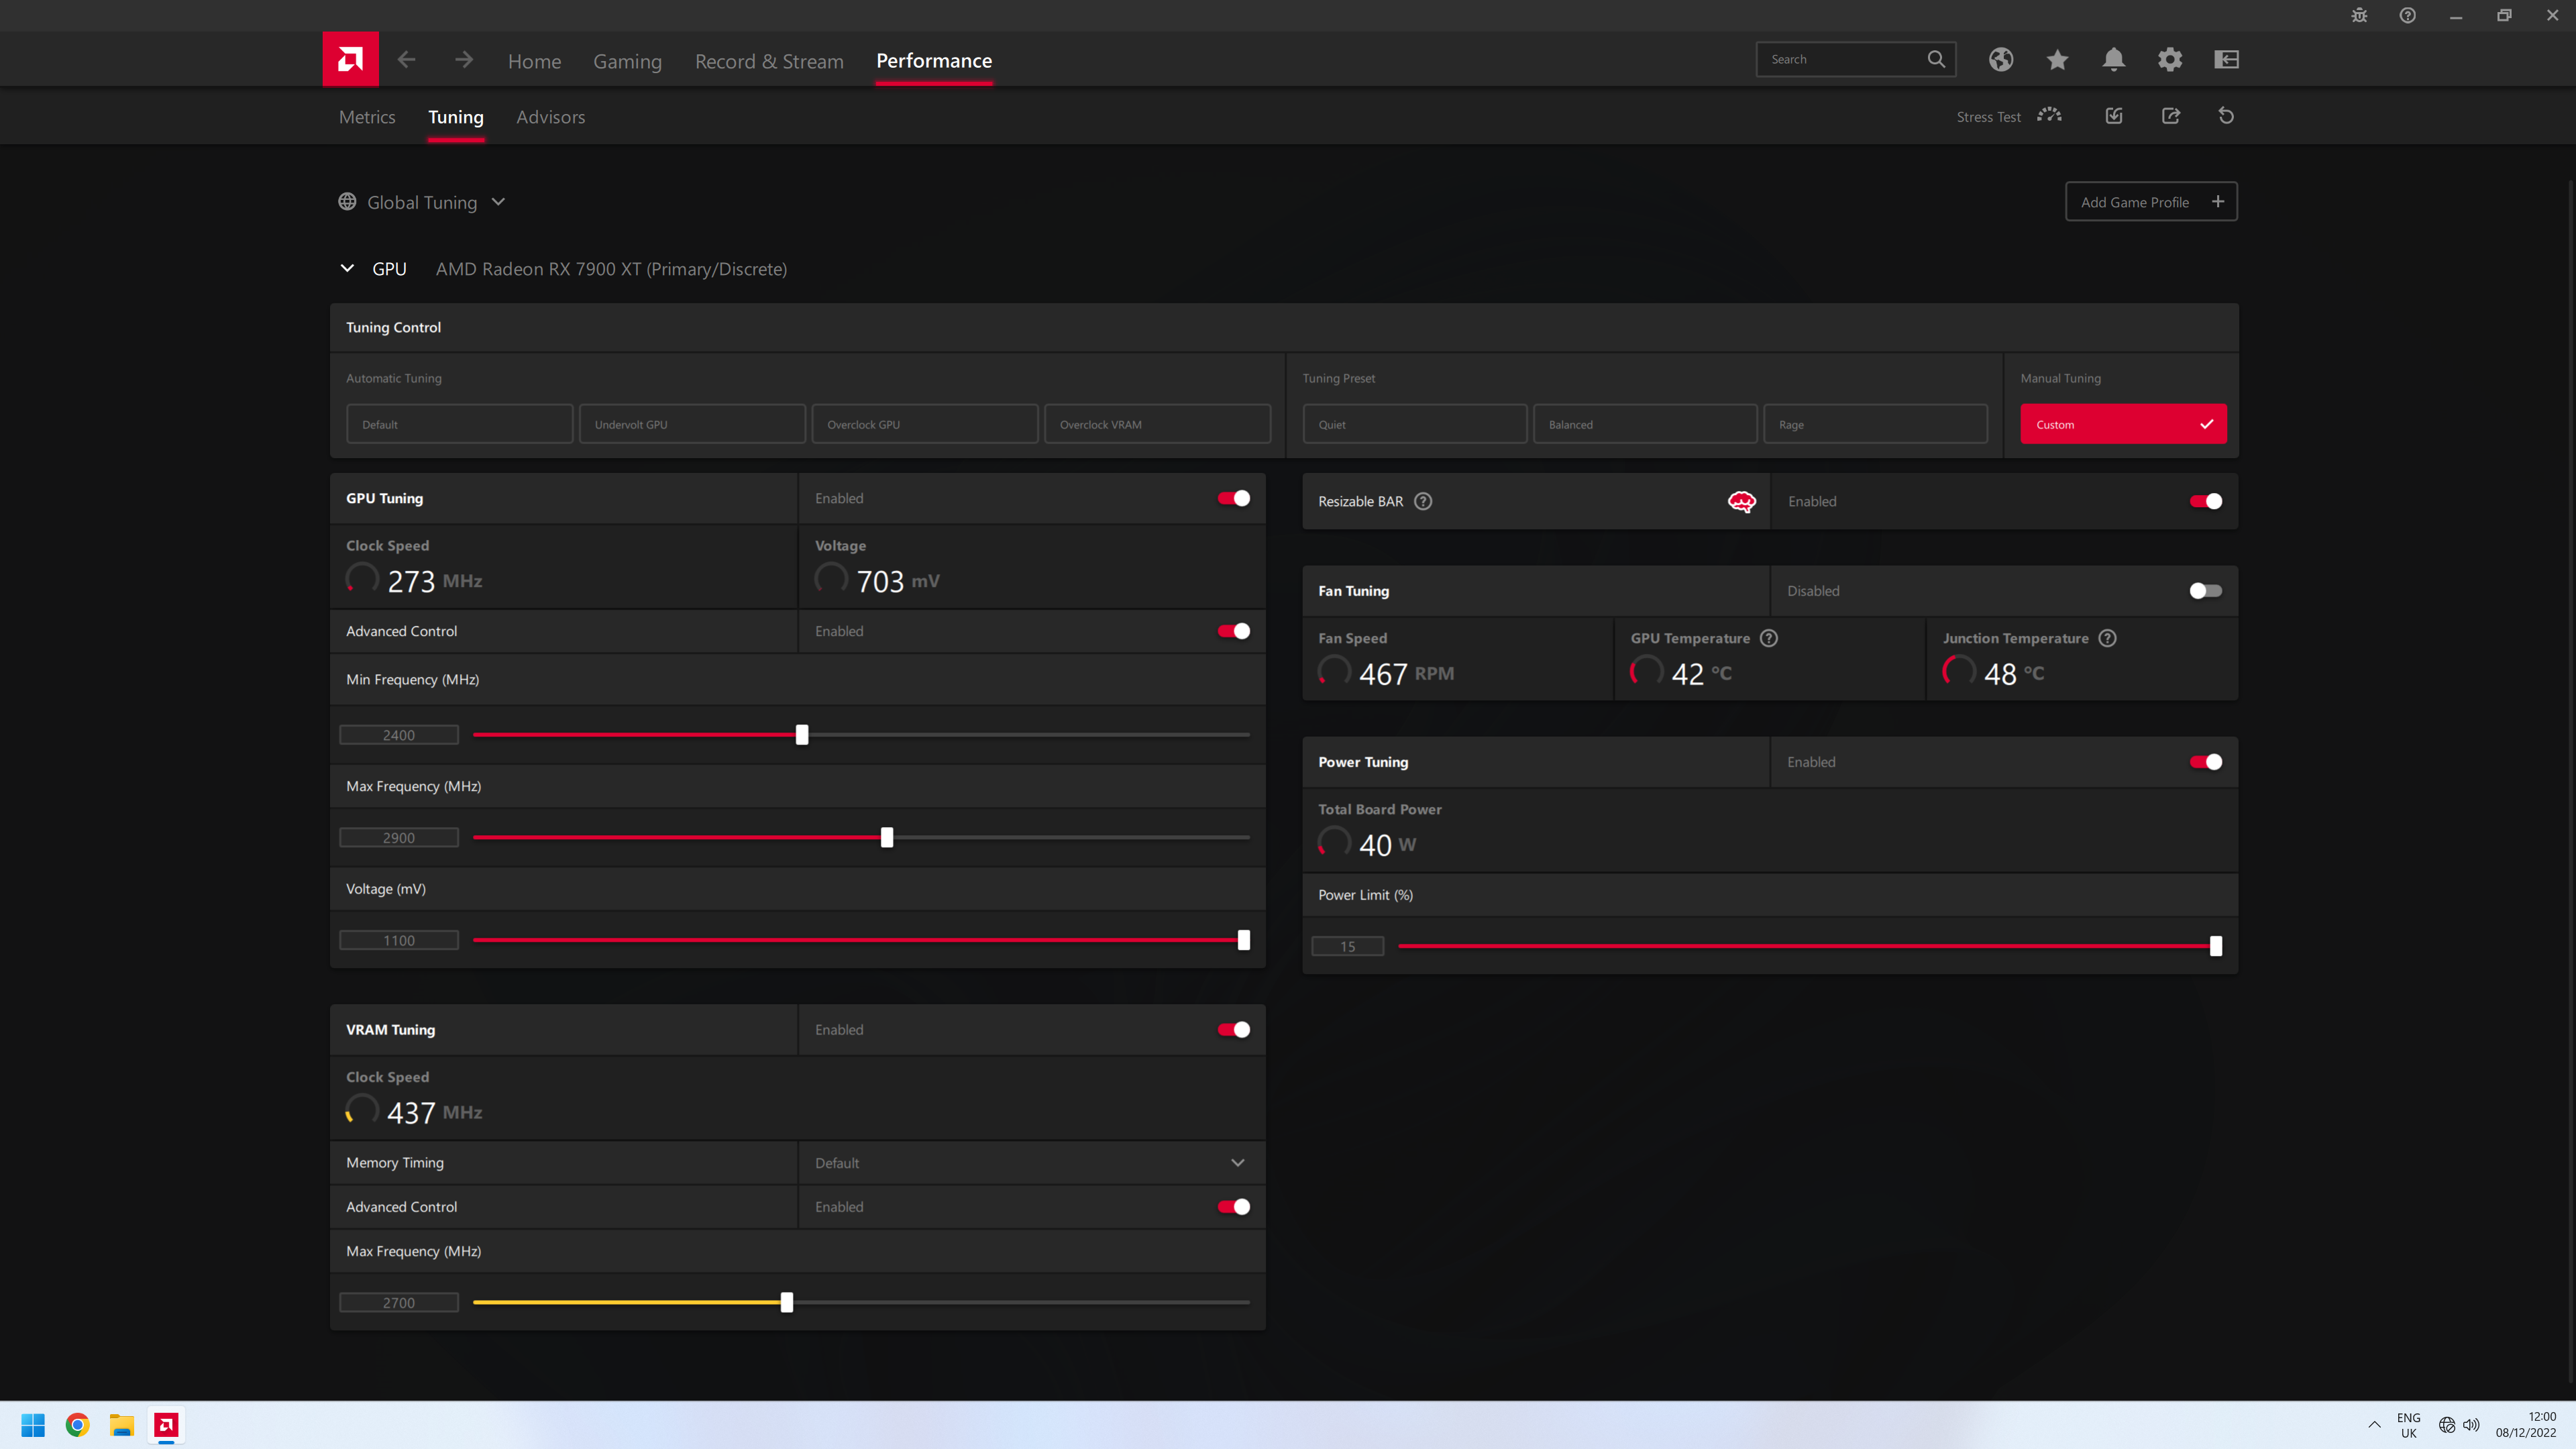
We set the minimum frequency to 2400MHz, the maximum to 2900MHz and the memory slider up to 2700MHz.
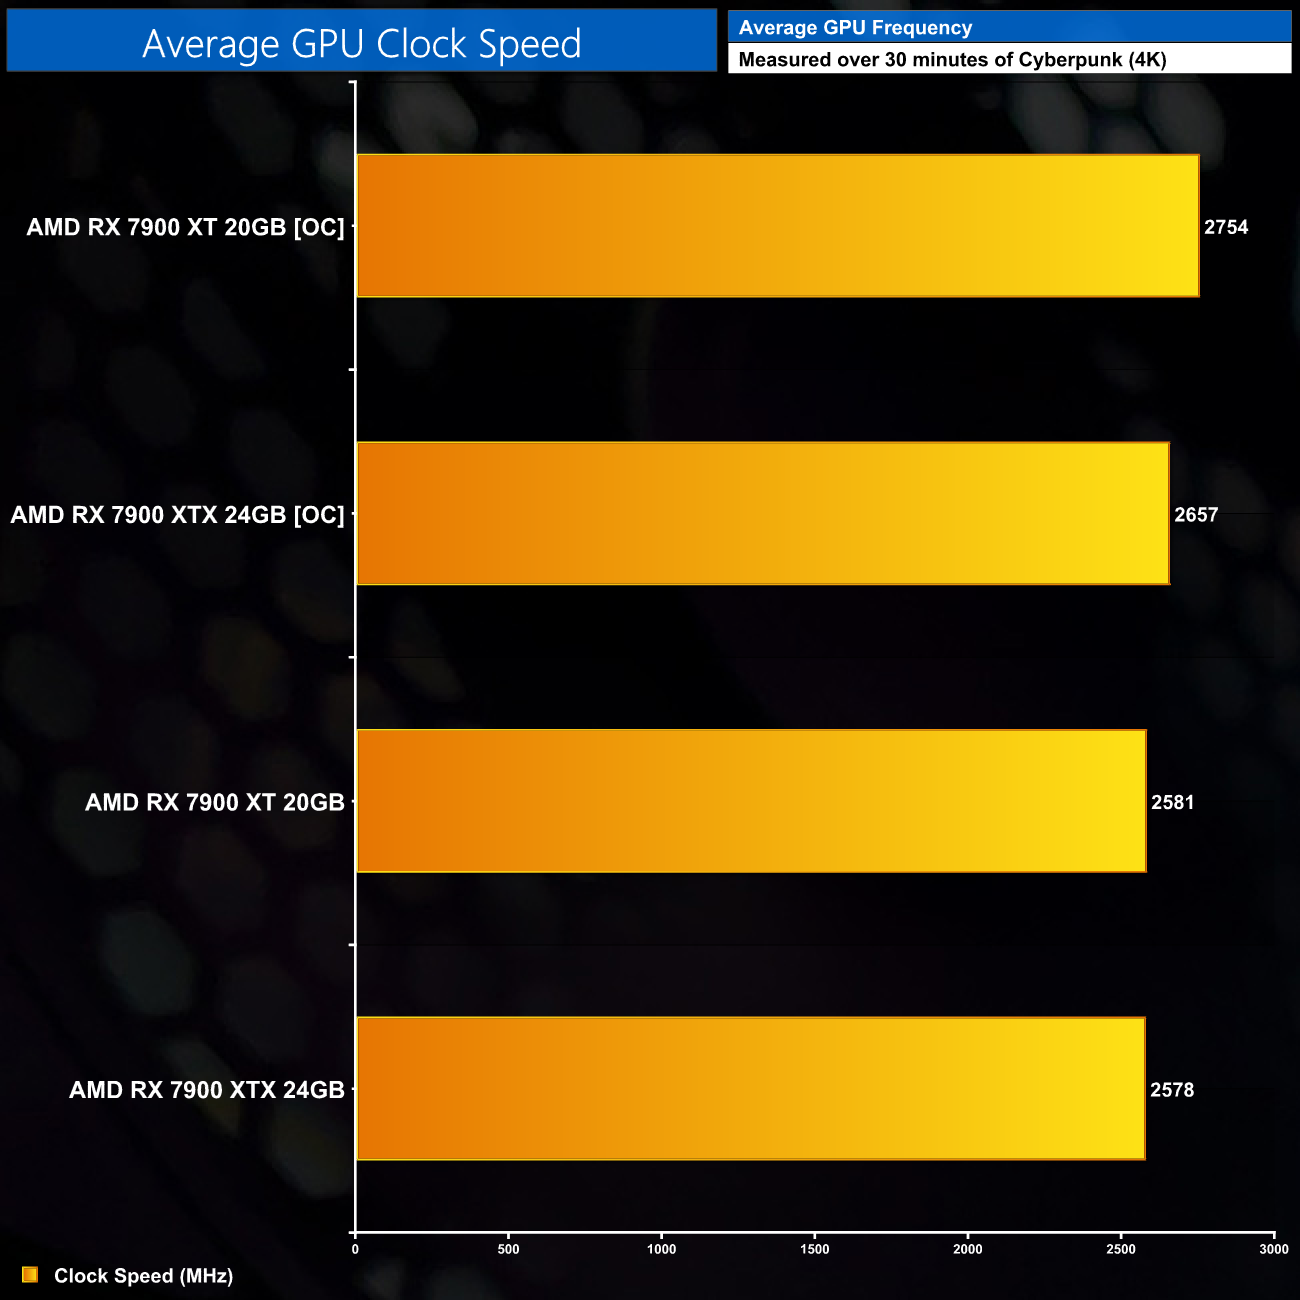
This saw GPU frequency increase to 2754MHz – up by about 170MHz.

This overclock netted performance gains of 6-7%, which is OK but not outrageous.
Power draw did also rise considerably, up from 312W to 363W, a 17% increase.
While there has been plenty of discussion online about AMD's RX 7900 XTX, the RX 7900 XT seems to have flown under the radar somewhat. Built on a cut-down Navi 31 GPU, the 7900 XT offers fewer cores and less memory than its XTX sibling, but at a lower price point of £899.99.
That does make things slightly tricky, as right now there is no clear competitor to the 7900 XT. We'd expect it to go head-to-head with the RTX 4070 Ti that's rumoured for a CES 2023 reveal, but currently it is only competing with last-gen products, and the 7900 XTX itself.
Still, we can of course talk about the levels on performance on offer. There's no doubt it's a capable graphics card, offering 160FPS on average at 1440p, and 90FPS on average at 4K. It isn't a huge upgrade over the RX 6900 XT however, proving to be 26% faster at 1440p and 28% faster at 4K. Then again, it's also 11% and 7% faster than the RTX 3090 Ti at 1440p and 4K, respectively, and that GPU retailed for close to £2000 only earlier this year, so it depends how you look at it.
Arguably the most important comparison is against the RX 7900 XTX however, and here the XT comes in 11% slower at 1440p and 15% slower at 4K. That's despite being just 10% cheaper, so it's actually worse value than the RDNA 3 flagship, when we'd usually expect the cheaper product to offer better value. That is not the case here.
Ray tracing performance is another matter entirely. I do want to make it clear that RDNA 3 has made strides here and you will get a much more playable experience in-game with ray tracing enabled versus RDNA 2, there's no doubt that Nvidia still has the upper hand here. In RT-heavy games like Cyberpunk 2077 and Metro Exodus Enhanced Edition, the RX 7900 XT is slower than the RTX 3080 10GB – a card that's cheaper than the 7900 XT and launched over two years ago.
Of course, how important this is to you will vary from person to person. That said, I do think the landscape has changed, and while I didn't think the relatively poor ray tracing performance was that big of a deal when RDNA 2 launched two years ago, more games than ever now support the technology and that's only going to ramp up as we head into 2023 and beyond.

AMD's new reference design graphics card is another impressive piece of work. We found that the cooler comfortably dealt with the 315W power output, and while noise levels aren't super quiet at 40dBa, it isn't overly loud either. I did notice a bit of coil whine in certain situations however, it was nothing awful but was audible over my case fans in certain games.
Speaking of power draw, this is a keen area of interest for me, and in this review we have deployed our in-depth methodology where we test power draw of each GPU across twelve games at three different resolutions (which you can find starting on page 27 of this review). As it turns out, the 7900 XT draws pretty close to its rated 315W TBP in almost all situations – there are some slight fluctuations here and there, but it averaged 306.7W power draw at 1440p and 310.2W at 4K.
Considering that the 7900 XT is therefore more power hungry than an RTX 4080 (which averages 280W at 4K), while also being the slower GPU, it's pretty clear to see that RDNA 3 isn't able to match Ada Lovelace in terms of efficiency. Against the RX 6900 XT, we're looking at a a 25% uplift in performance per Watt, though that shrinks to 20% against the RX 6800. These are decent strides, yes, but the 40-series has won back the overall efficiency crown for this generation.
All told, the RX 7900 XT is a bit of funny graphics card to assess. As mentioned, we don't yet know how it will slot in against the rumoured RTX 4070 Ti, but even against its own big brother, it actually offers worse value for 1440p and 4K gaming, while also proving less efficient at 4K. The margins aren't huge, and there may well be some reading this who could just about stretch to paying £900 for a GPU, but for whom £1000 is just too much.
Then again, it seems to me that the RX 7900 XT is intended to be the classic option designed to upsell you into paying £100 more for the XTX model. It's not a bad graphics card in its own right, but it's certainly not as alluring as the XTX. Only time will tell how it stacks up against Nvidia's RTX 4070 Ti.
![]()
A final note on stock. We've been in talks with Overclockers UK who reckon they have in about 1000 units, with MBA (Made By AMD) cards ready to ship on December 13. Custom boards are looking thin on the ground however, but we are expecting supply to come through in 2-4 weeks for XT, but slightly longer for XTX.
The 7900 XT will be available to purchase from OCUK HERE.
Discuss on our Facebook page HERE.
Pros
- Objectively good rasterisation performance, faster than RTX 3090 Ti.
- Ray tracing, while still not always competitive, has at least improved significantly versus RDNA 2.
- Reasonable improvement to efficiency over RDNA 2.
- Sleek reference design, more compact than 4080 Founders Edition.
- DisplayPort 2.1 support.
Cons
- Worse value than RX 7900 XTX for 1440p and 4K gaming.
- Power draw is higher than RTX 4080.
- Less efficient than Ada Lovelace/RTX 40-series.
- Still expensive at £900.
- Some audible coil whine.
KitGuru says: We will get a better idea of how the RX 7900 XT fits in once the RTX 4070 Ti is released, but it's certainly the weaker of the two 7900 series graphics cards released today.