
Launched last month, today we take a look at MSI's flagship RX 6900 XT graphics card – the Gaming X Trio. Unlike the company's graphics cards from the RX 5700-series, MSI has opted for a unified design approach between its AMD and Nvidia GPUs this generation, meaning the RX 6900 XT Gaming X Trio looks almost identical to the RTX 3080 Gaming X Trio, with a beefy triple-slot and triple-fan cooler. Let's take a closer look and see if this could be a card to consider.
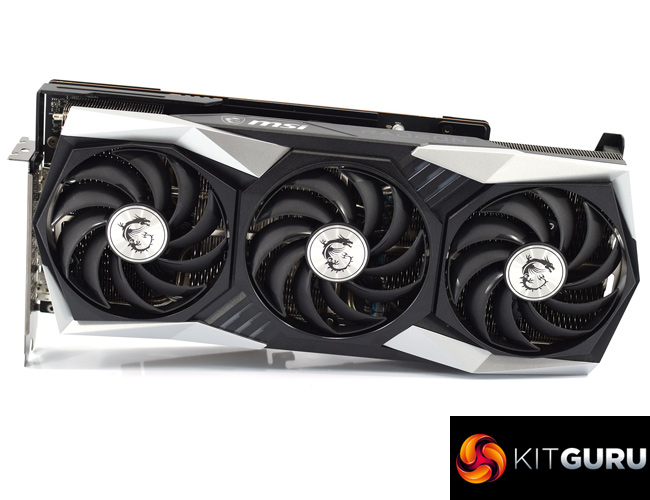
The MSI RX 6900 XT Gaming X Trio is the third air-cooled RX 6900 XT we have reviewed, coming after AMD's reference design and also Gigabyte's Gaming OC. It is the highest clocked of the three, with a rated boost speed of 2340MHz, which is 90MHz faster than the reference card. It's also got the largest cooler, plenty of RGB lighting as well as a metal backplate.
| RX 6900 XT | RX 6800 XT | RX 6800 | RX 5700 XT | RX 5700 | |
| Architecture | RDNA 2 | RDNA 2 | RDNA 2 | RDNA | RDNA |
| Manufacturing Process | 7nm | 7nm | 7nm | 7nm | 7nm |
| Transistor Count | 26.8 billion | 26.8 billion | 26.8 billion | 10.3 billion | 10.3 billion |
| Die Size | 519 mm² | 519 mm² | 519 mm² | 251 mm² | 251mm² |
| Ray Accelerators | 80 | 72 | 60 | n/a | n/a |
| Compute Units | 80 | 72 | 60 | 40 | 36 |
| Stream Processors | 5120 | 4608 | 3840 | 2560 | 2304 |
| Game GPU Clock | Up to 2015MHz | Up to 2015MHz | Up to 1815MHz | Up to 1755MHz | Up to 1625MHz |
| Boost GPU Clock | Up to 2250MHz | Up to 2250MHz | Up to 2105MHz | Up to 1905MHz | Up to 1725MHz |
| Peak SP Performance | Up to 23.04 TFLOPS | Up to 20.74 TFLOPS | Up to 16.17 TFLOPS | Up to 9.75 TFLOPS | Up to 7.95 TFLOPS |
| Peak Half Precision Performance | Up to 46.08 TFLOPS | Up to 41.47 TFLOPS | Up to 32.33 TFLOPS | Up to 19.5 TFLOPS | Up to 15.9 TFLOPS |
| Peak Texture Fill-Rate | Up to 720 GT/s | Up to 648.0 GT/s | Up to 505.2 GT/s | Up to 304.8 GT/s | Up to 248.4 GT/s |
| ROPs | 128 | 128 | 96 | 64 | 64 |
| Peak Pixel Fill-Rate | Up to 288.0 GP/s | Up to 288.0 GP/s | Up to 202.1 GP/s | Up to 121.9 GP/s | Up to 110.4 GP/s |
| AMD Infinity Cache | 128MB | 128MB | 128MB | n/a | n/a |
| Memory | 16GB GDDR6 | 16GB GDDR6 | 16GB GDDR6 | 8GB GDDR6 | 8GB GDDR6 |
| Memory Bandwidth | 512 GB/s | 512 GB/s | 512 GB/s | 448 GB/s | 448 GB/s |
| Memory Interface | 256-bit | 256-bit | 256-bit | 256-bit | 256-bit |
| Board Power | 300W | 300W | 250W | 225W | 185W |
The make-up of the RX 6900 XT GPU has many similarities to the RX 6800 XT. Still fabricated on TSMC’s 7nm process node, it uses the same Navi 21 GPU, measuring 519 mm². The key difference is that the RX 6900 XT silicon is fully populated, with 80 Compute Units (CUs) compared to 72 for the 6800 XT. This means the flagship chip has an extra 512 Stream Processors, giving a grand total of 5120 shaders.
Rated clock speed is also identical between these two RDNA 2 GPUs. Reference RX 6900 XT has a rated game clock of 2015MHz and a rated boost clock of up to 2250MHz, but MSI has pushed the rated boost clock up to 2340MHz for the Gaming X Trio.
AMD has also increased the memory capacity, with 16GB of GDDR6 memory found on the RX 6800, RX 6800 XT and RX 6900 XT, while the RX 6700 XT has 12GB GDDR6. Here, the memory is clocked at 16Gbps and operates over a 256-bit memory interface for total bandwidth of 512 GB/s. However, AMD has also implemented a 128MB Infinity Cache on the Navi 21 GPU, to significantly increase effective memory bandwidth without excess power draw.
Speaking of power, the reference RX 6900 XT has a rated total board power (TBP) of 300W. MSI has increased this for the Gaming X Trio to 350W based on our testing, but we look at power draw in more detail later on in the review.
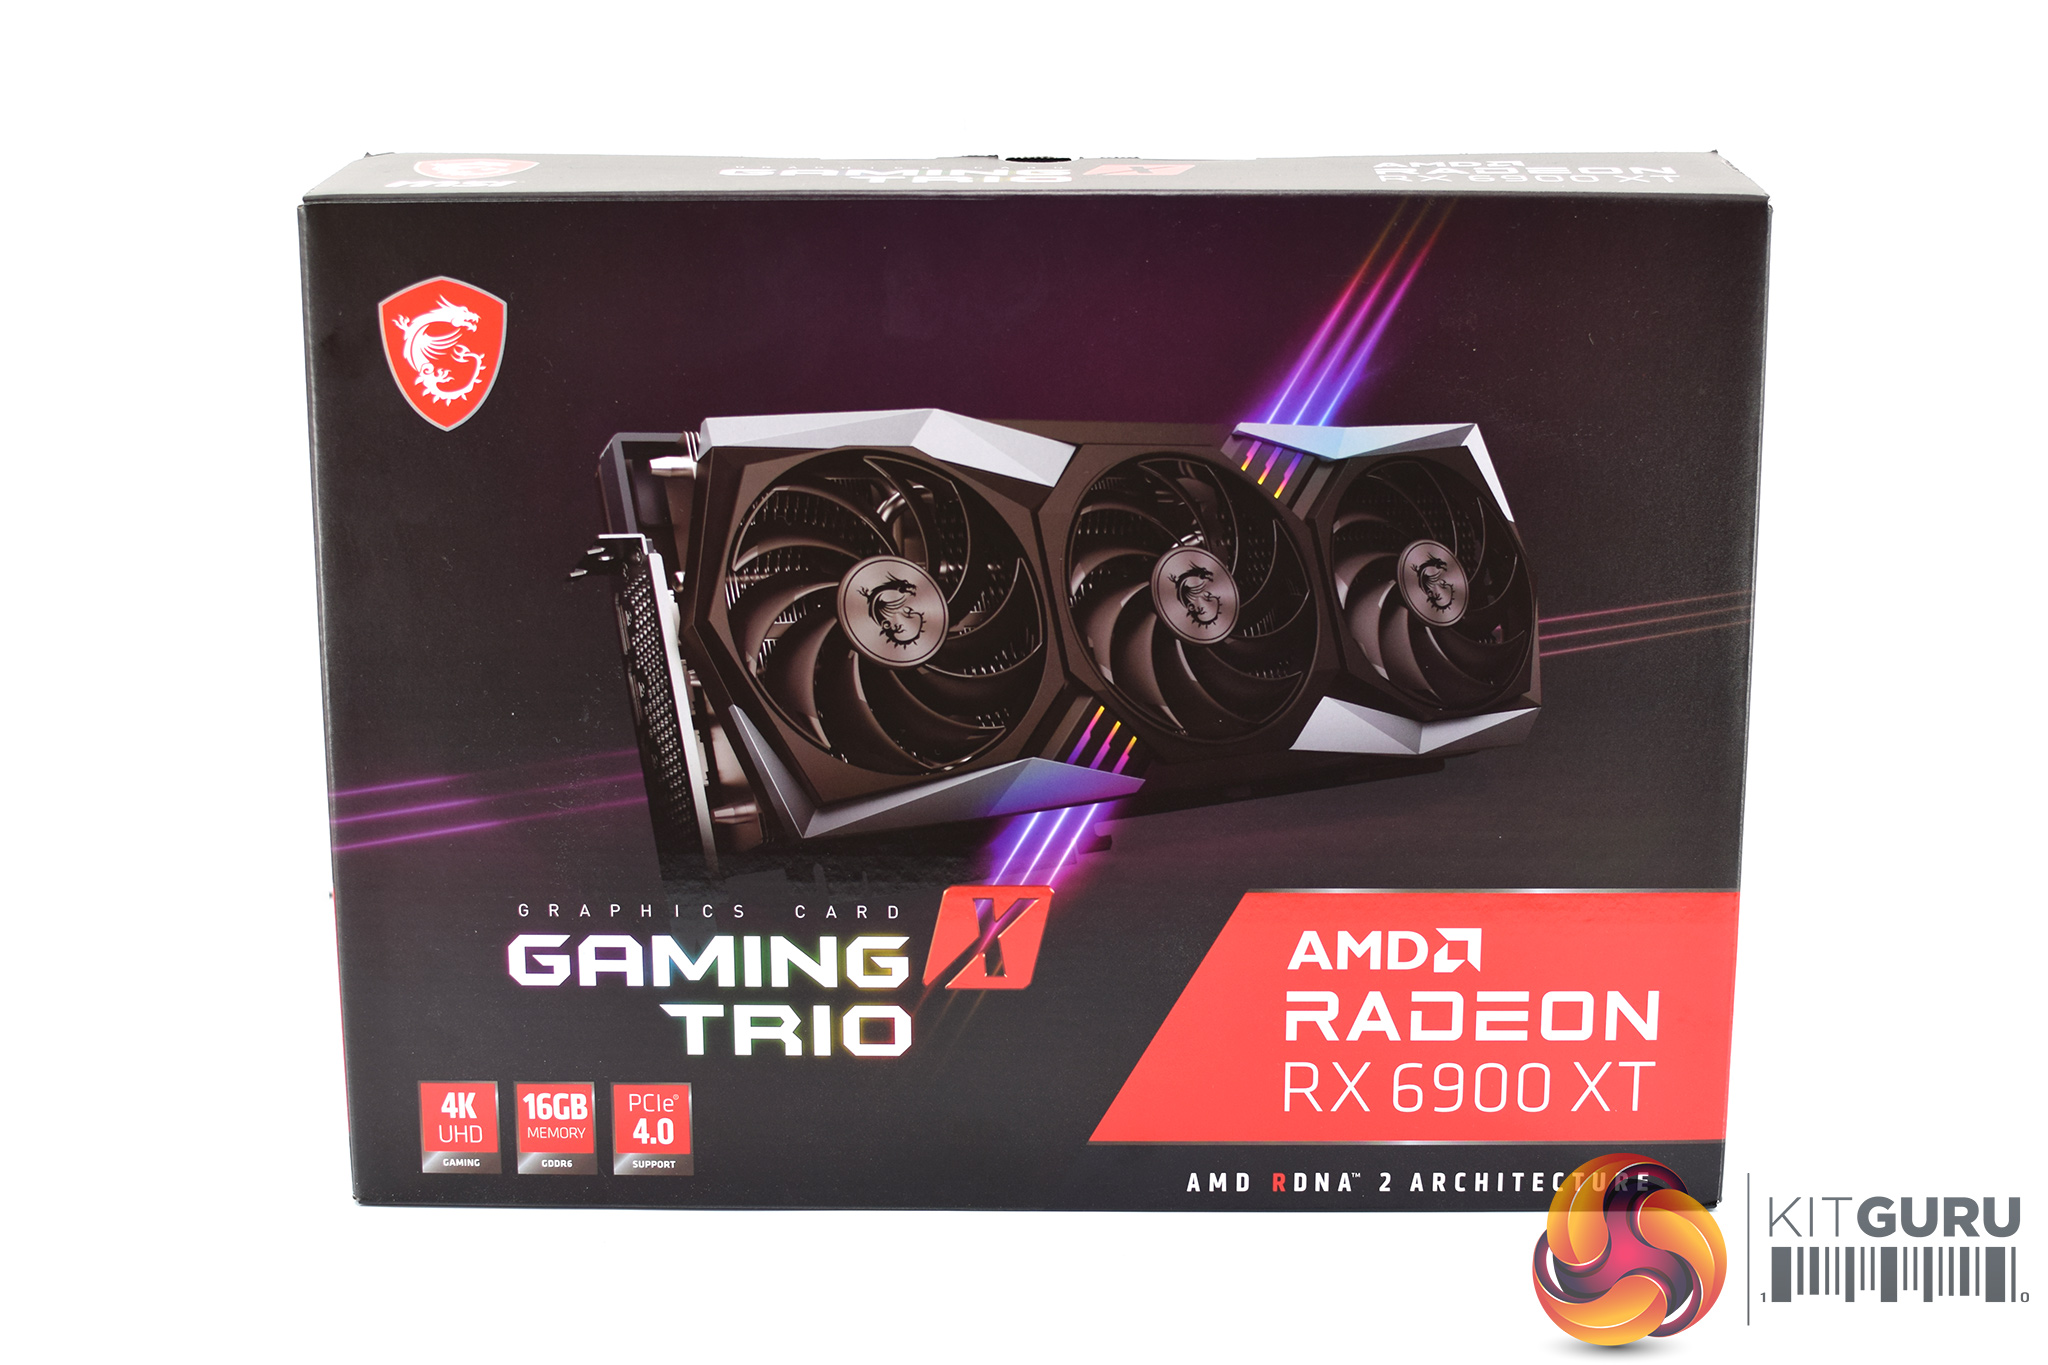
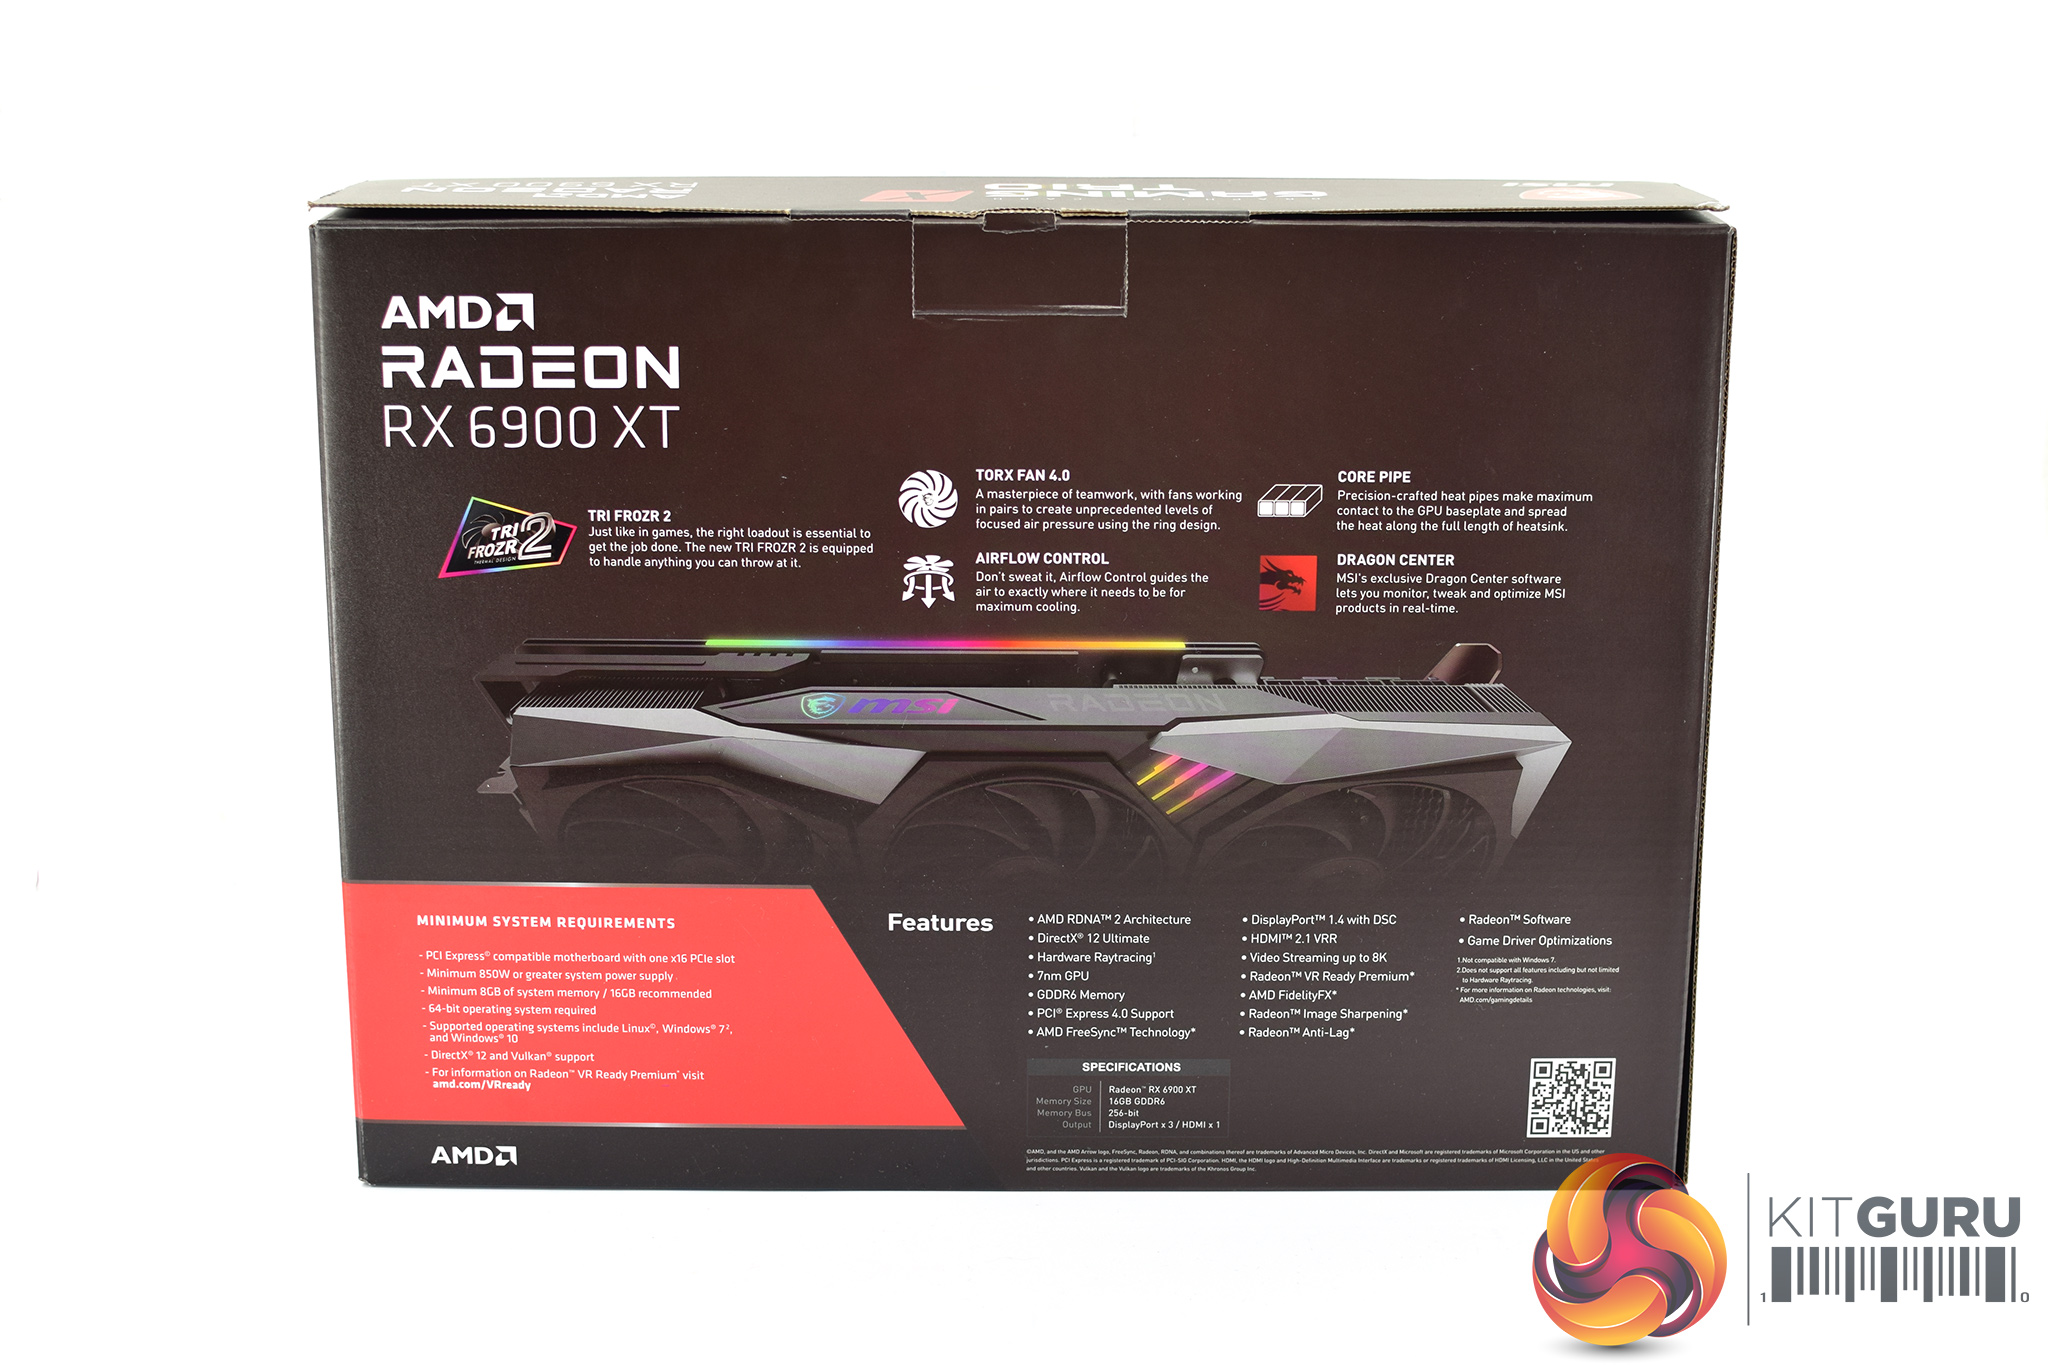
The MSI RX 6900 XT Gaming X Trio ships in a dark box, with an image of the graphics card taking pride of place in the centre. On the back, MSI highlights a few key features, including the Torx 4.0 fans and Dragon Center software.
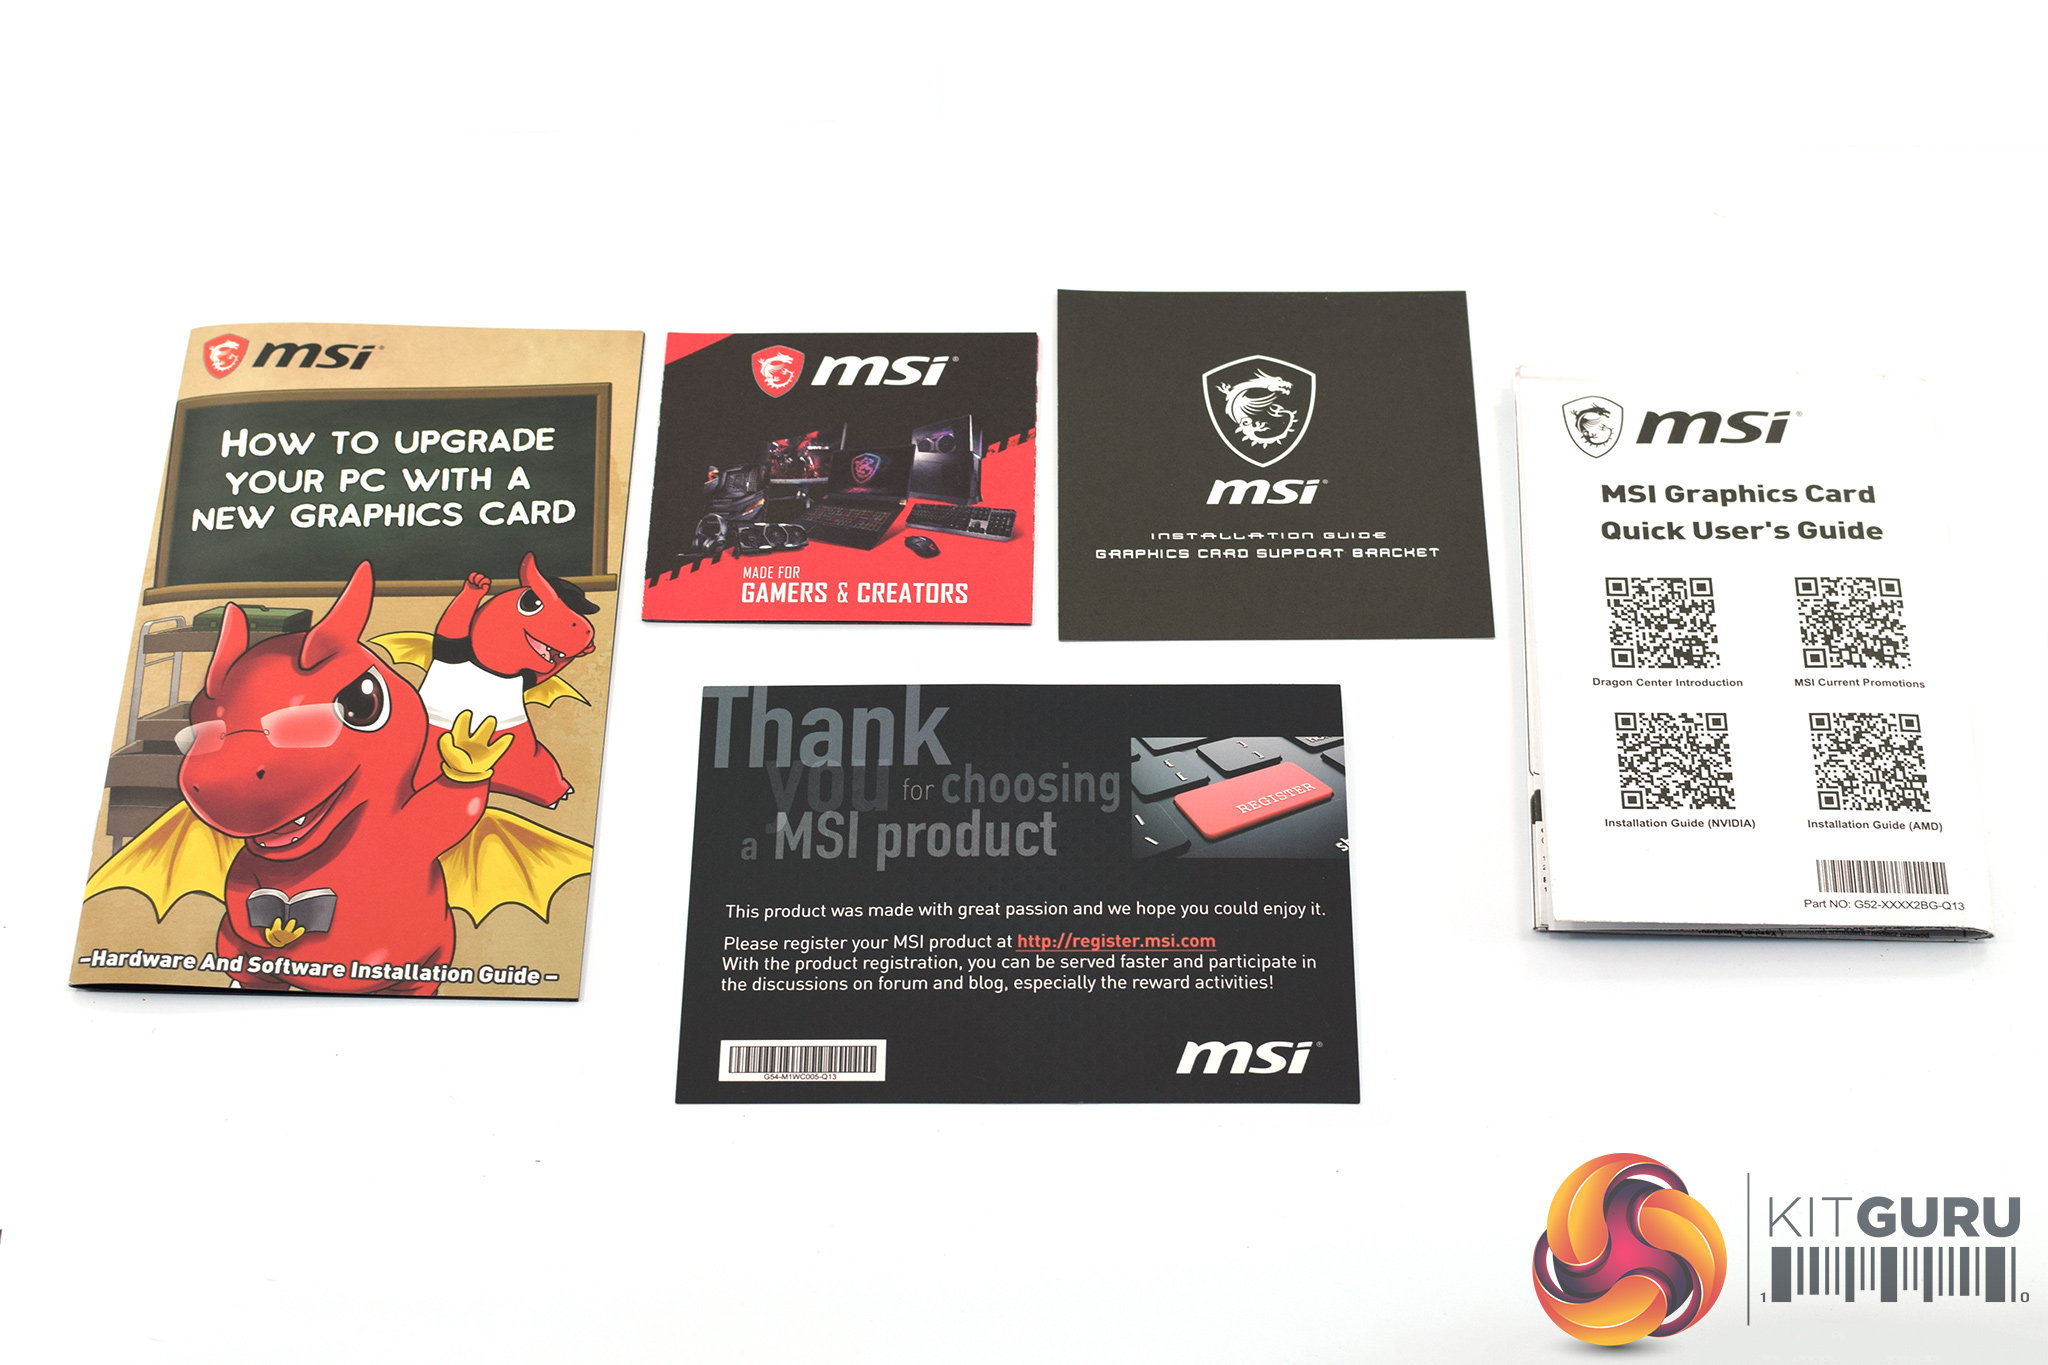
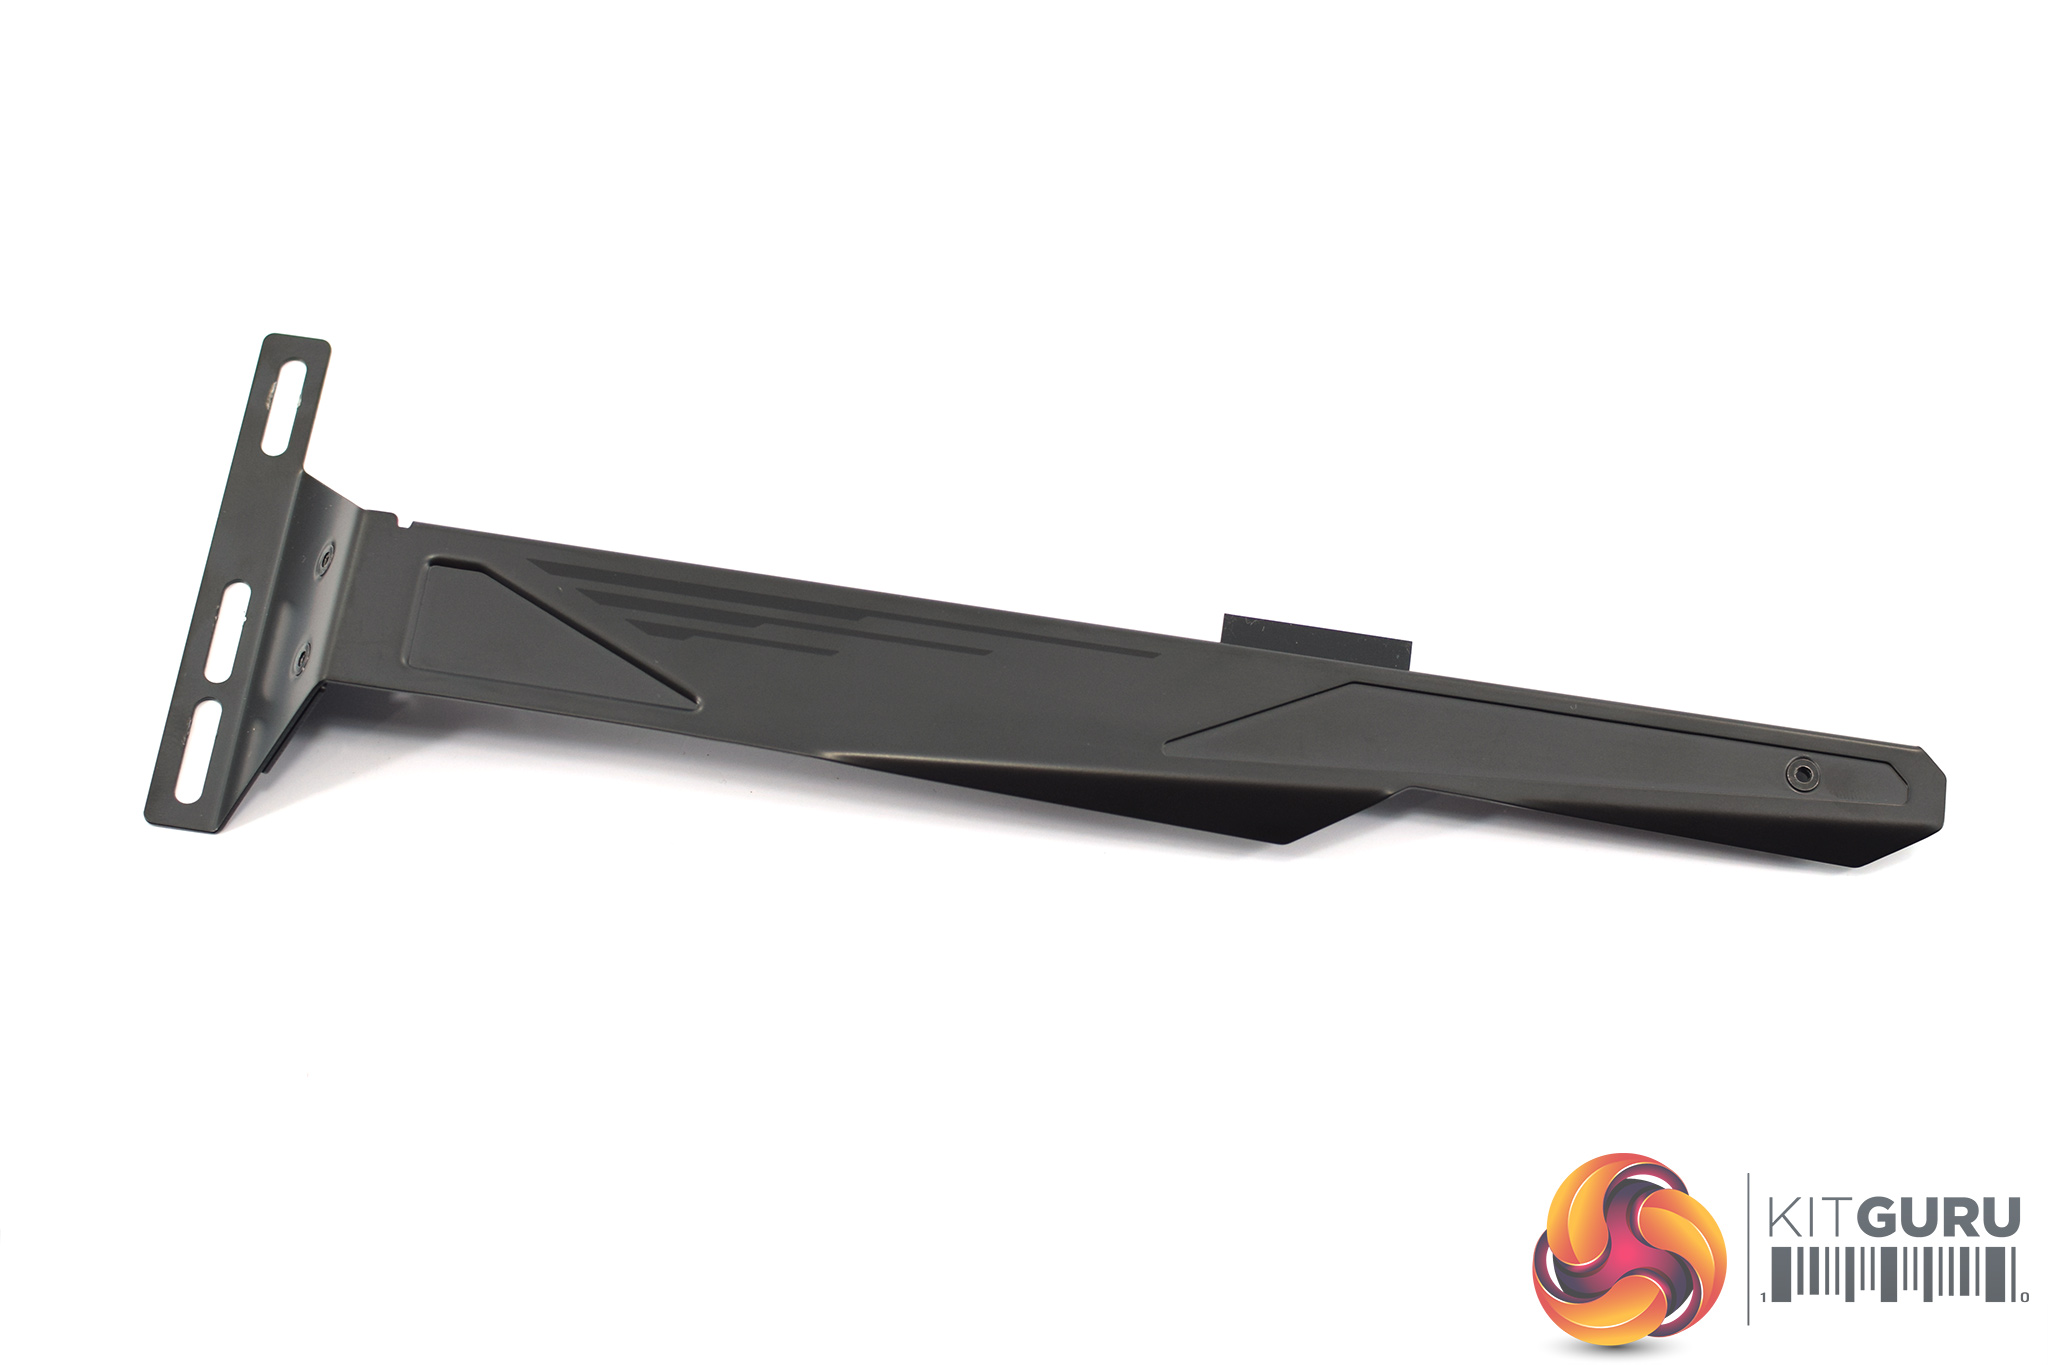
Inside, MSI includes its usual assortment of leaflets and booklets, while we also find a metal support bracket, designed to eliminate any potential GPU sag.
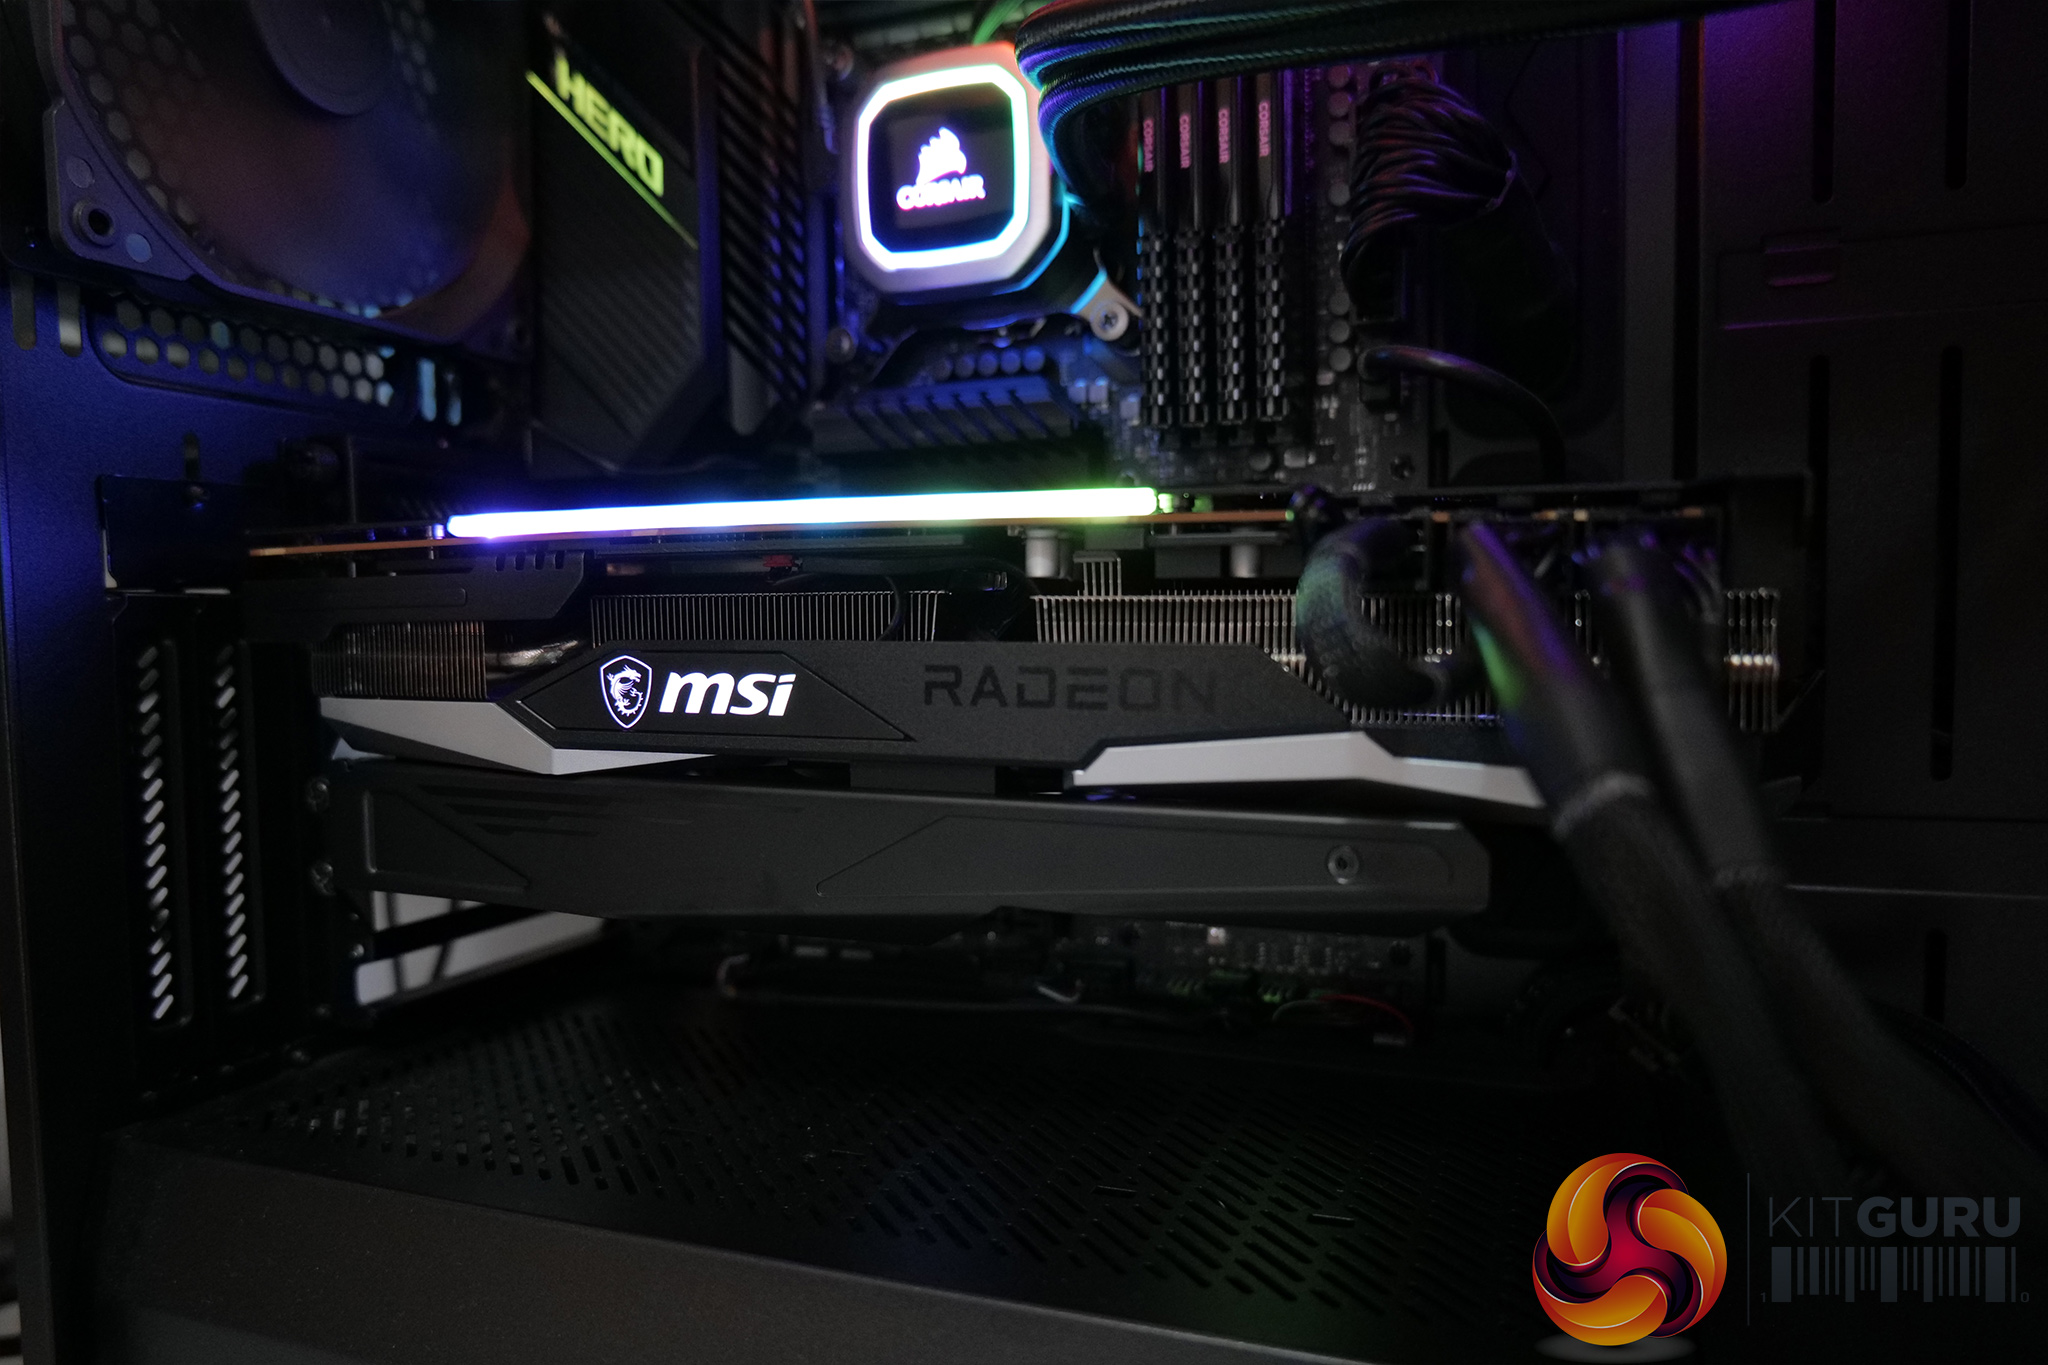
Here we can see the bracket in action, keeping the card pretty level inside our Fractal Design Meshify S2.
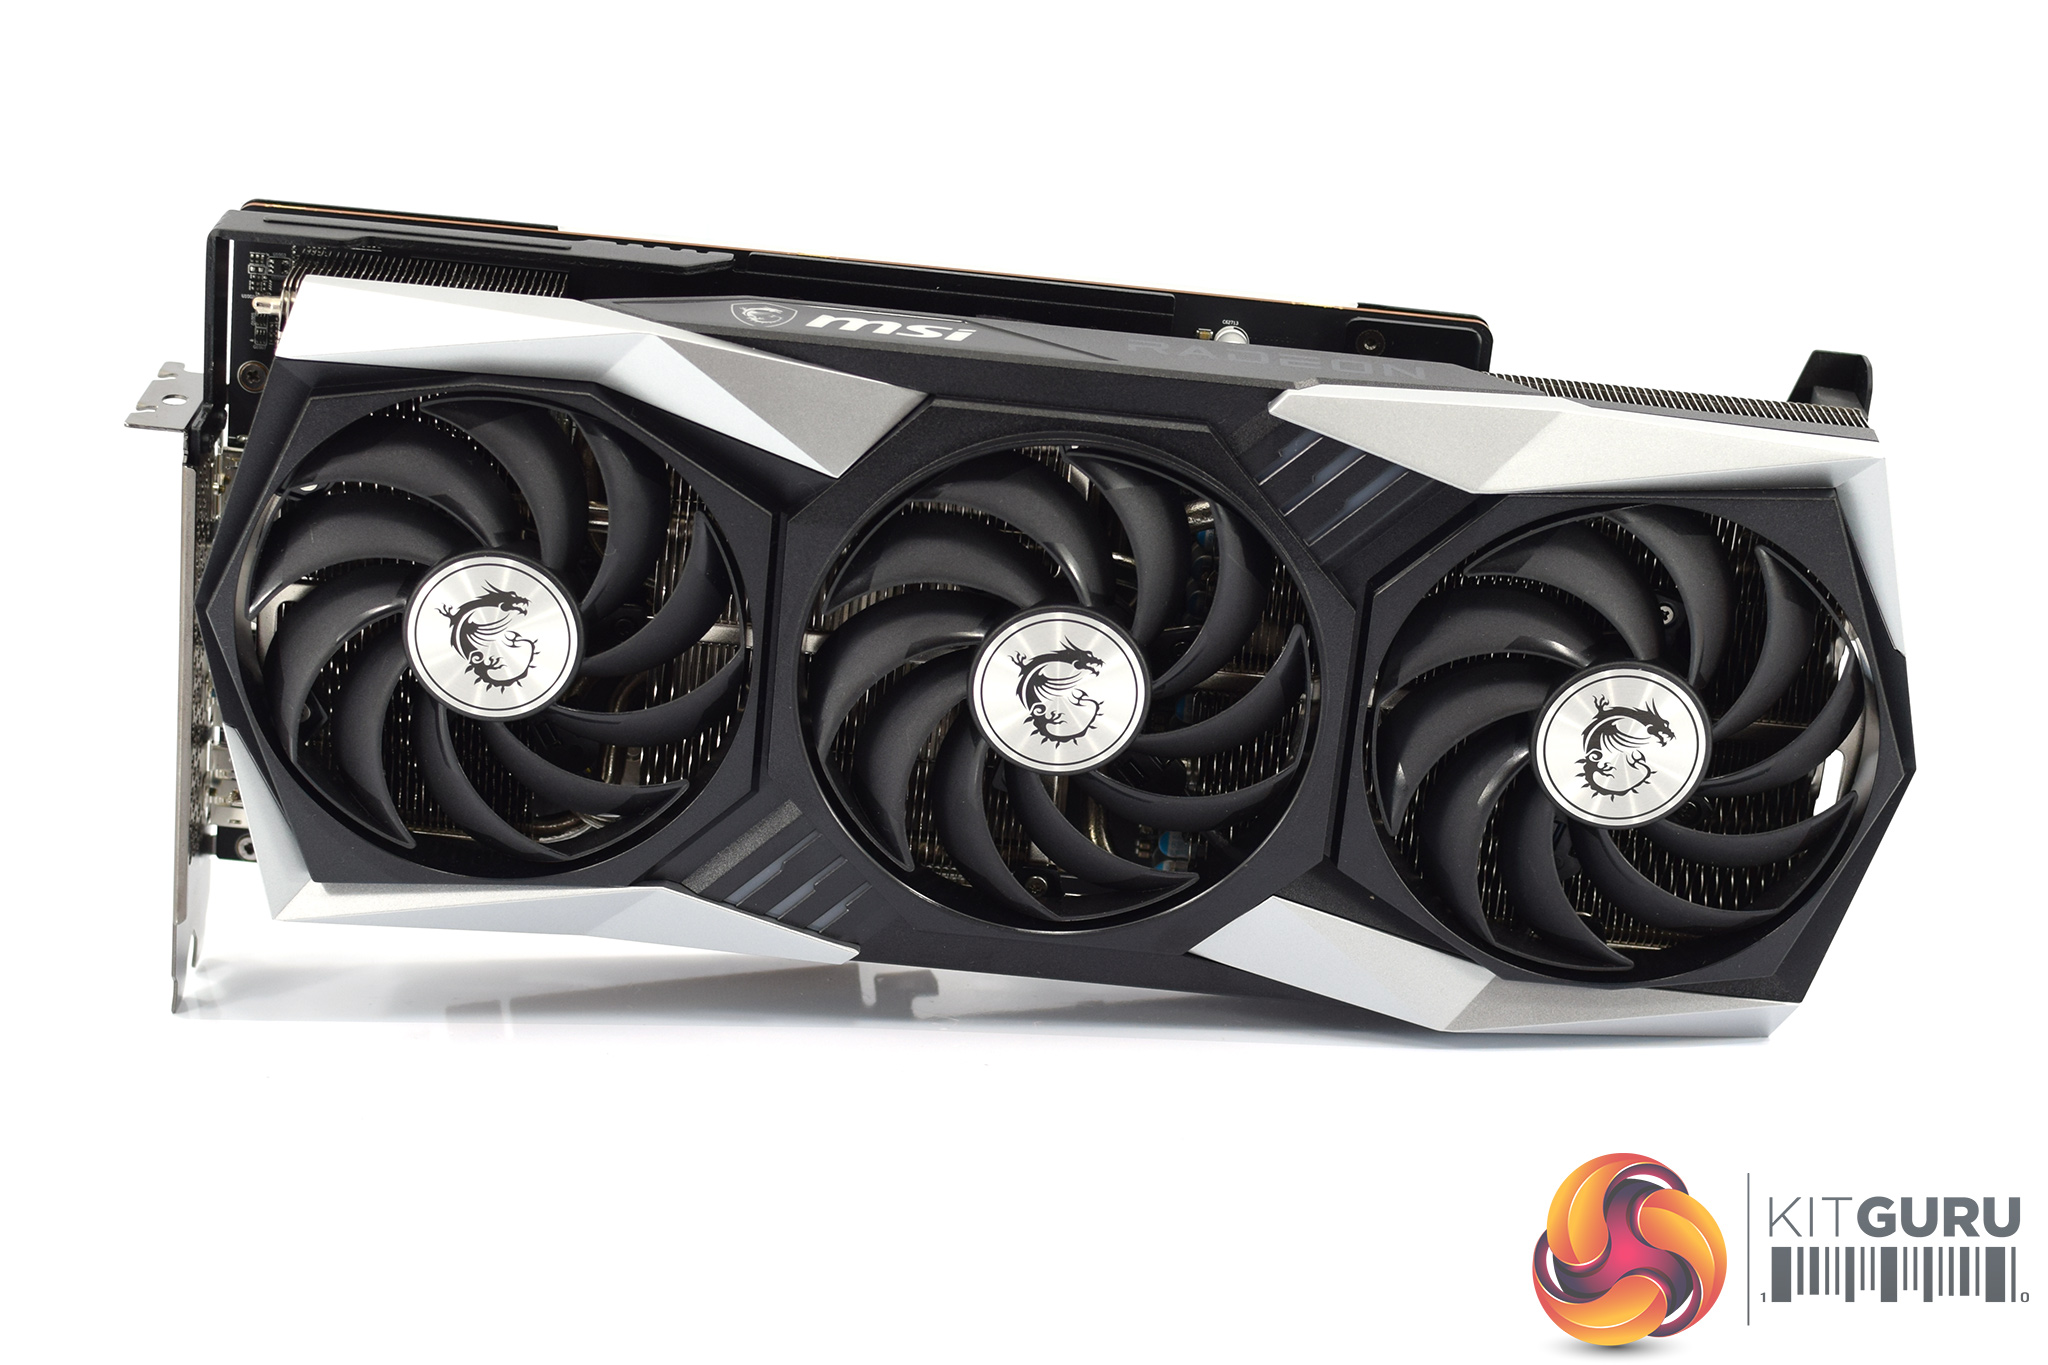
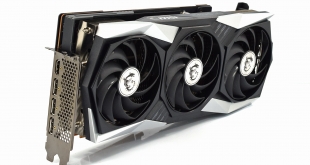
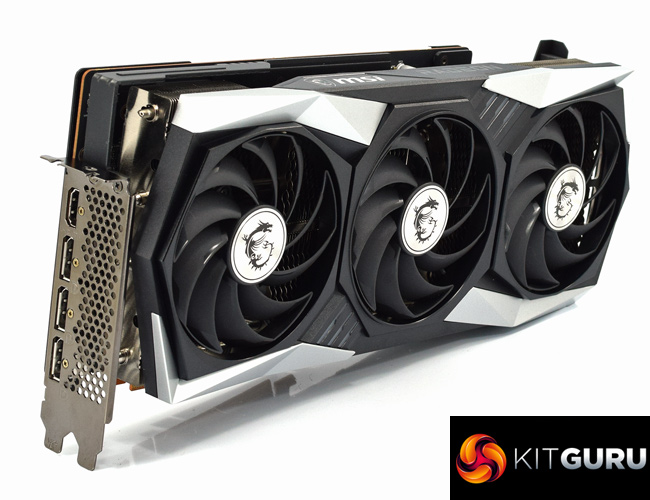
The card itself will look instantly familiar to anyone who's seen one of the RTX 30-series Gaming X Trio models, and that's because MSI is sharing the overall design of its cards between AMD and Nvidia GPUs this generation. The RX 5700 XT Gaming X, for instance, had a different overall appearance to the RTX 2070 Super Gaming X Trio, but that is no longer the case.
That means we have a large plastic shroud which is mostly black, aside for a few silver accents. It's a fairly aggressive, ‘gamer-y' look but not nearly as bold as some other designs we have seen in recent uses. It's very colour-neutral, so it should be fine in a colour-coordinated build.
We can also see the three Torx 4.0 fans MSI uses as part of its cooler, with each fan measuring 90mm.
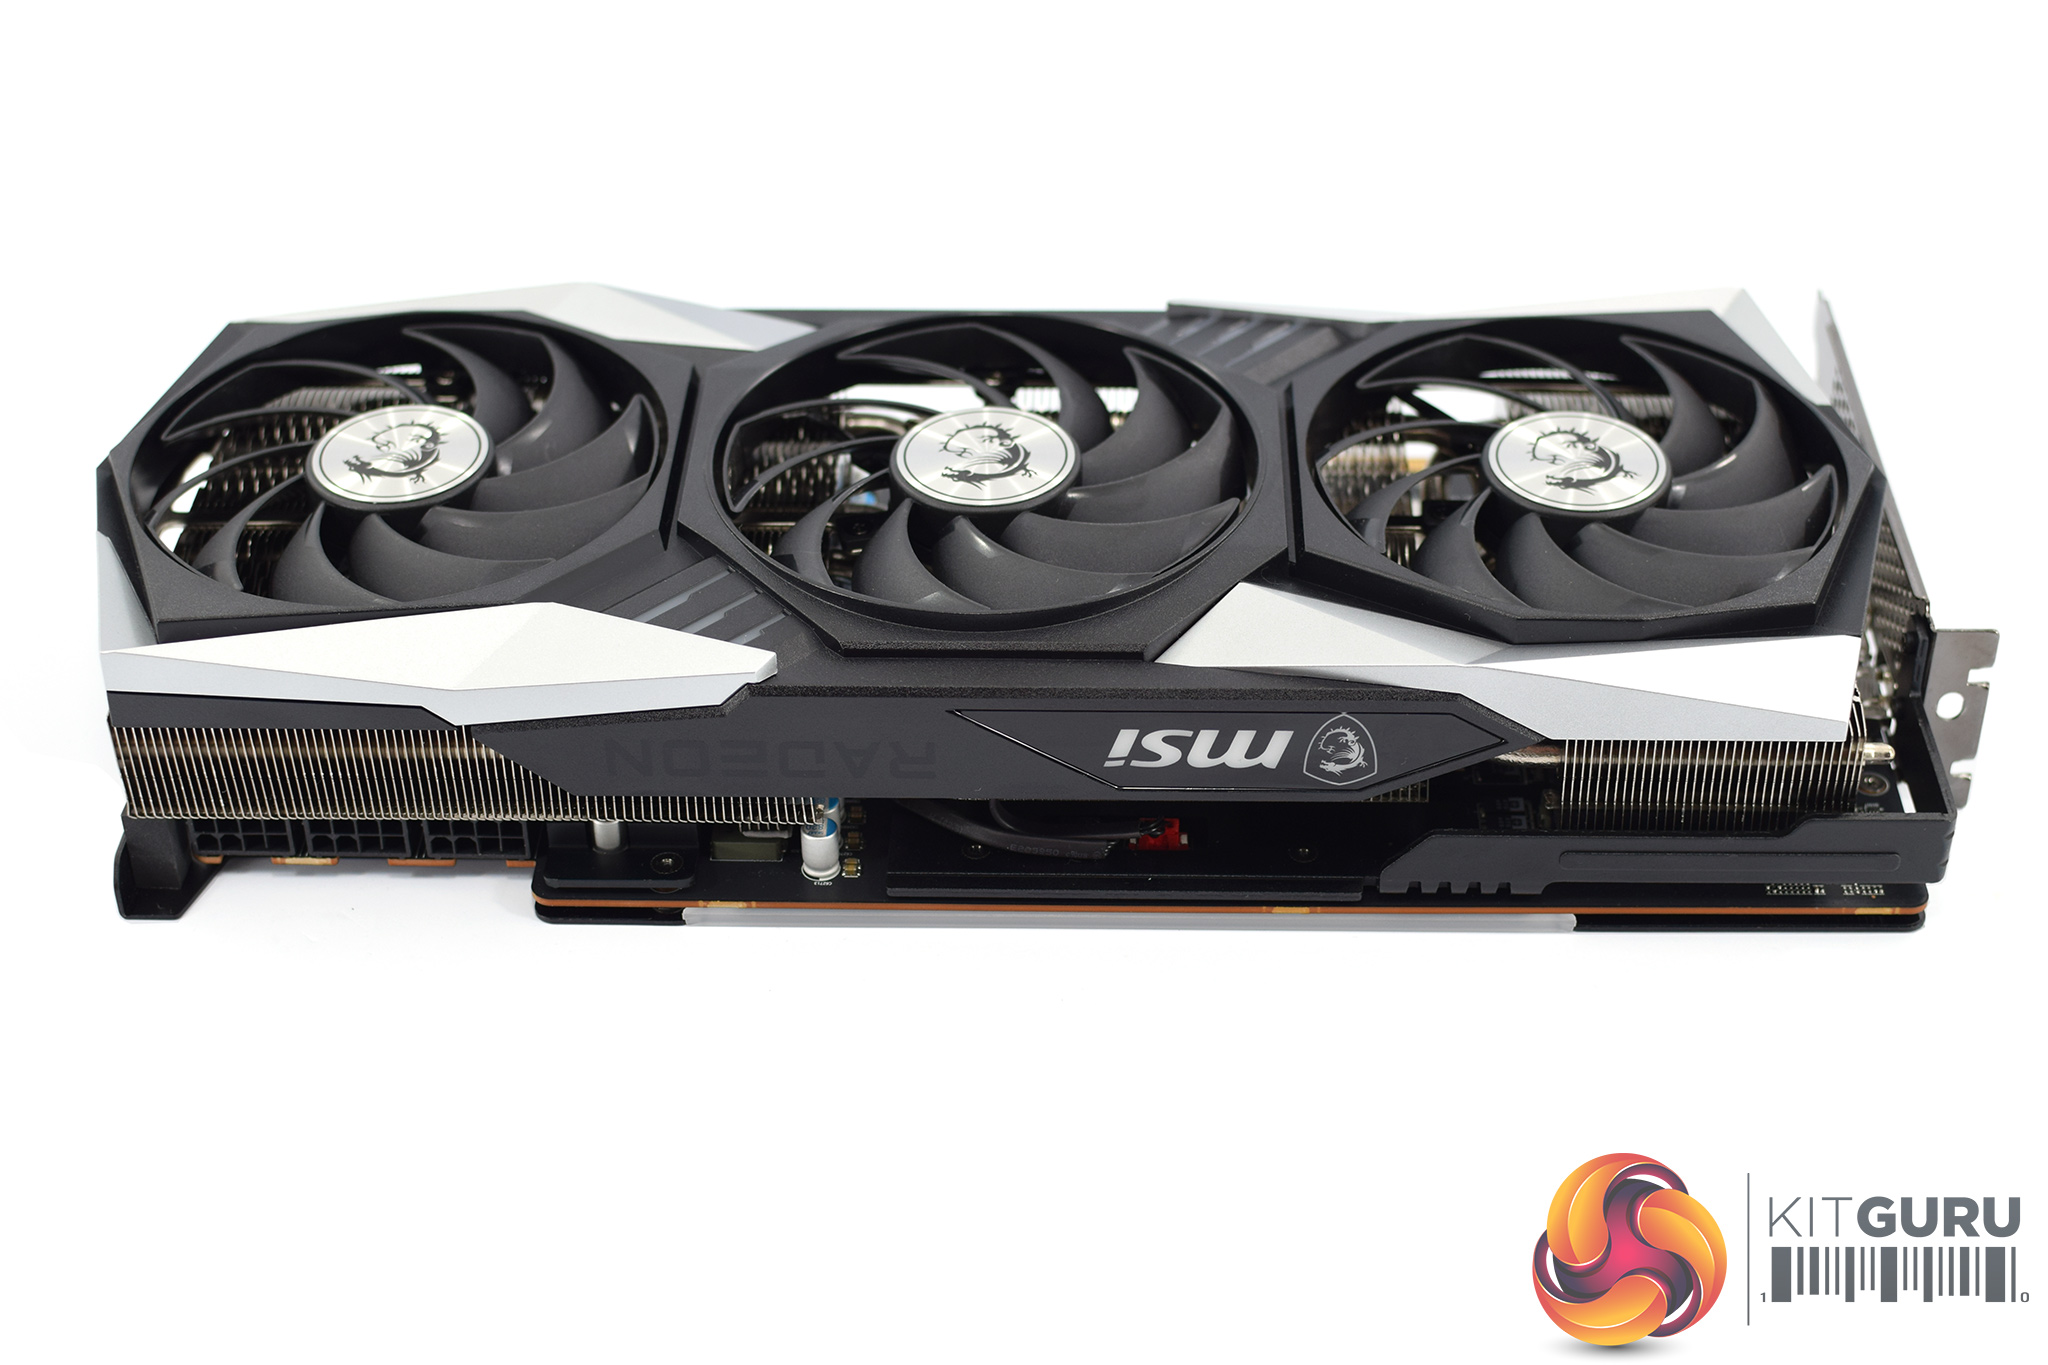
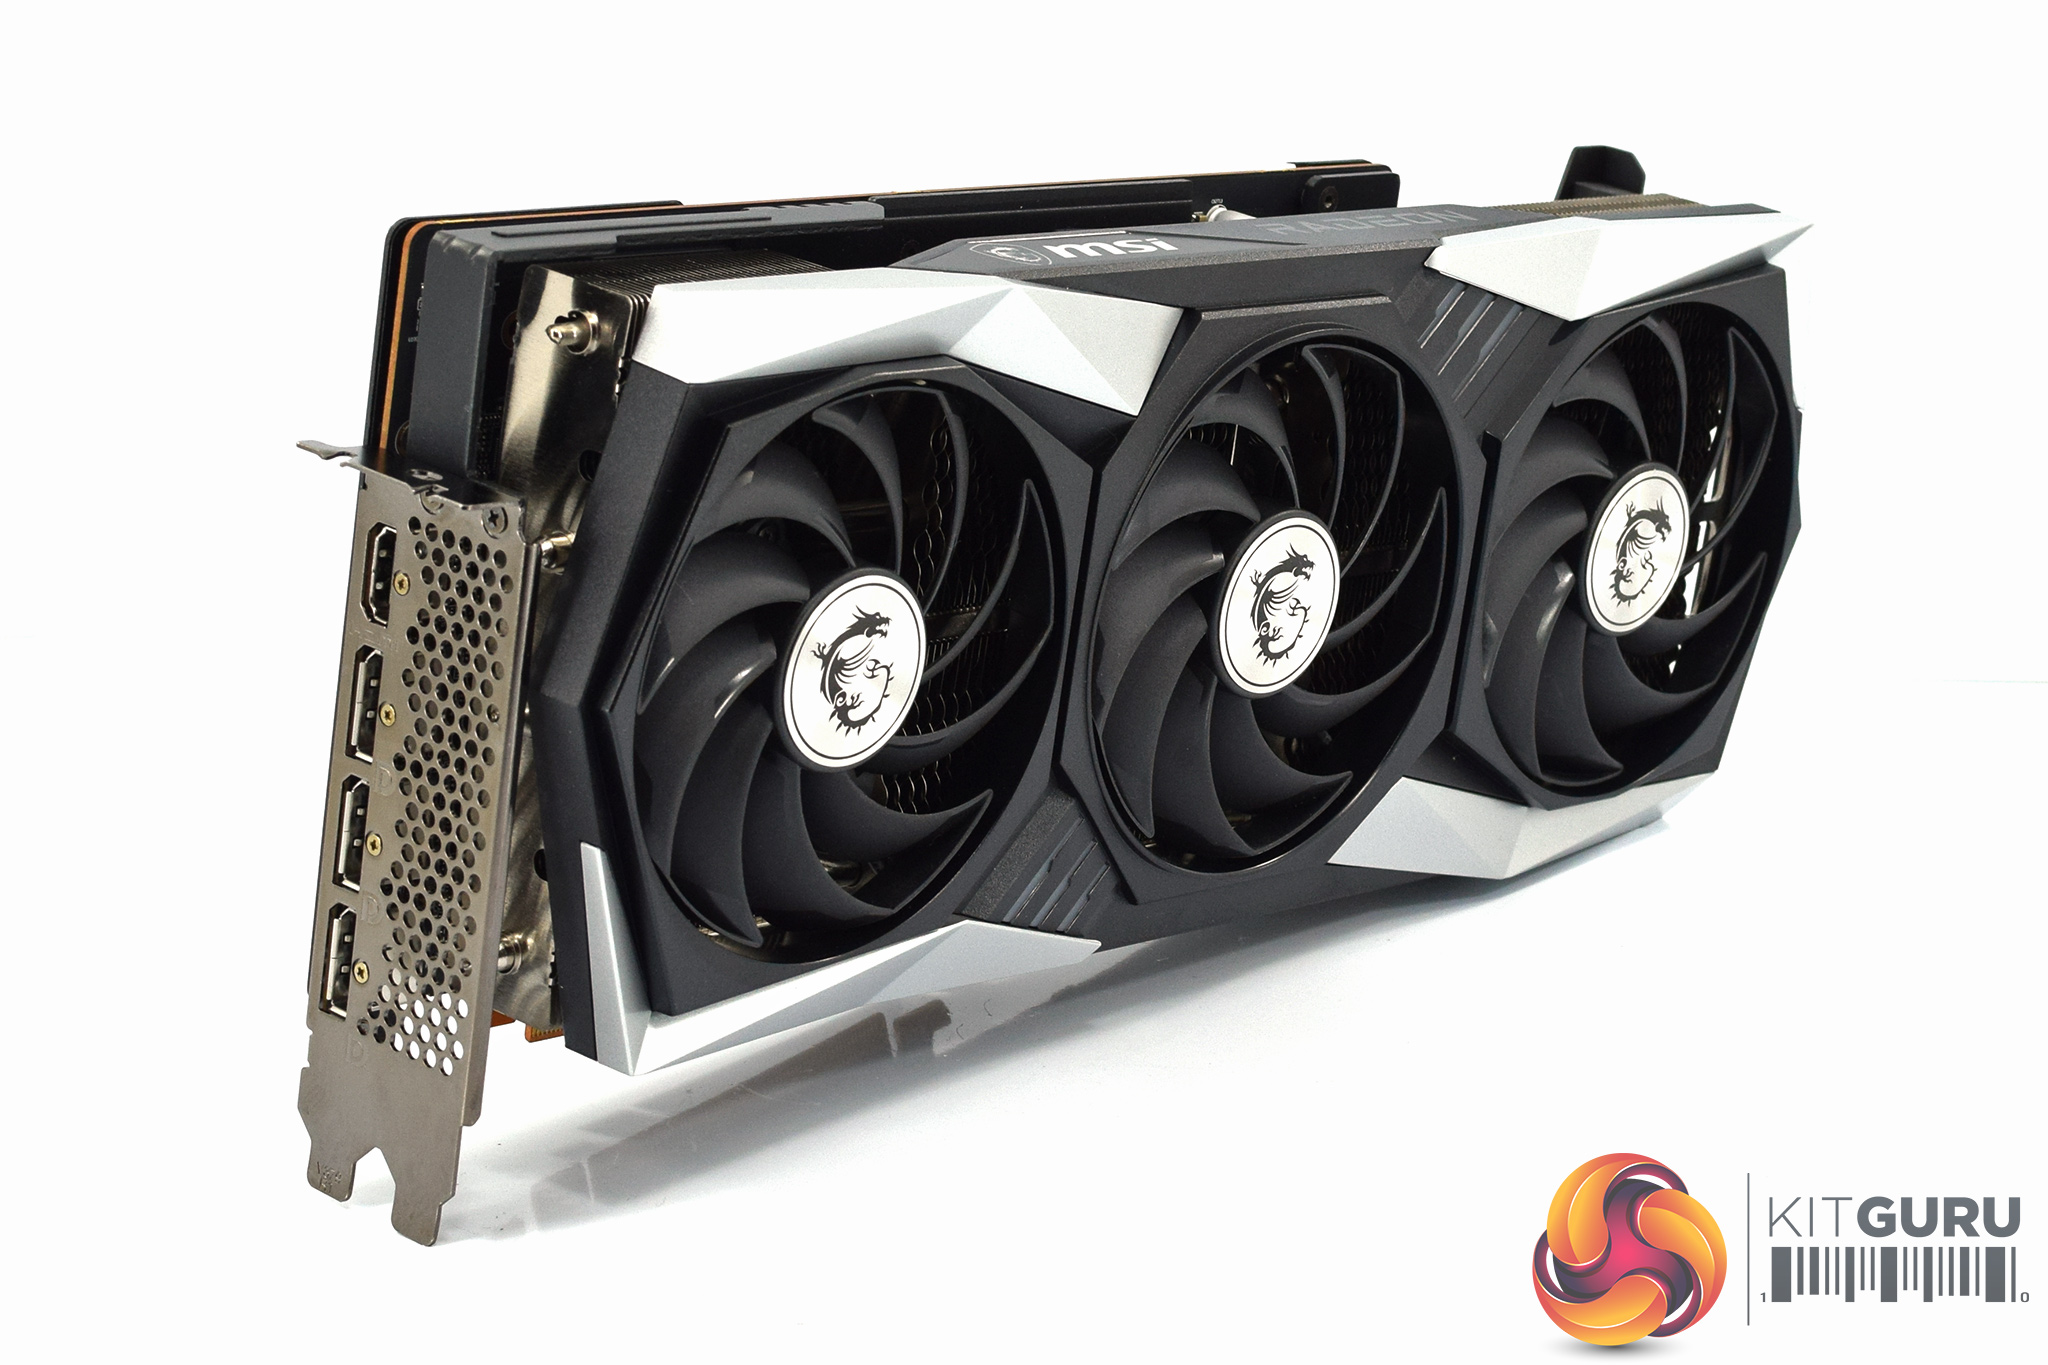
In terms of dimensions, the Gaming X Trio is certainly not one of the faint of heart. We don't have official measurements from MSI, but my tape measure tells me this card is approximately 320mm long and just over 140mm tall. It also weighed in at over 1.5KG on my scales.
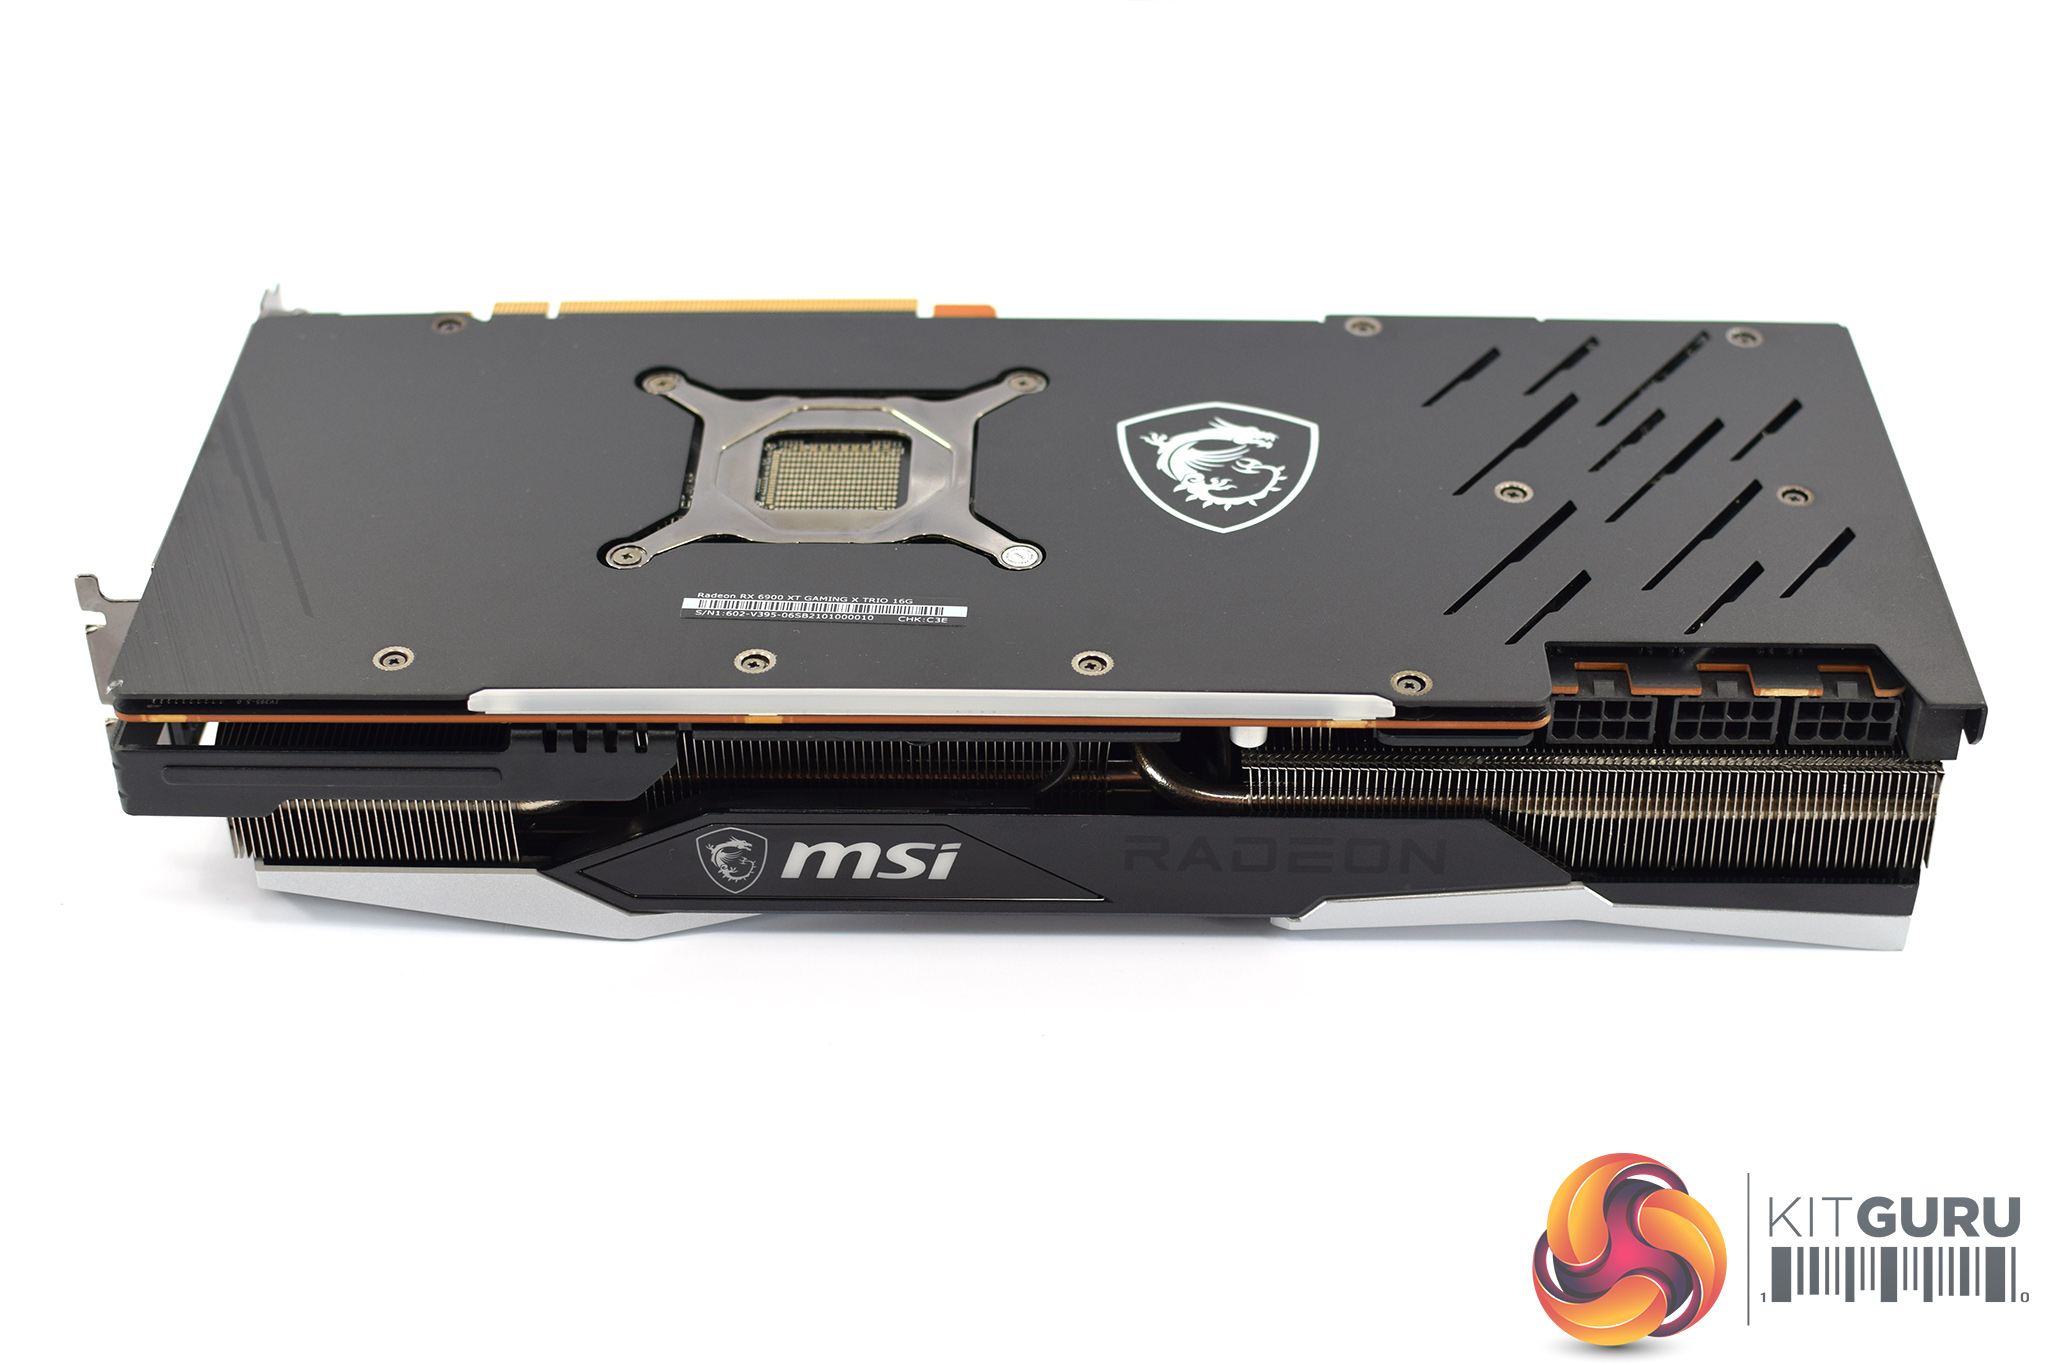
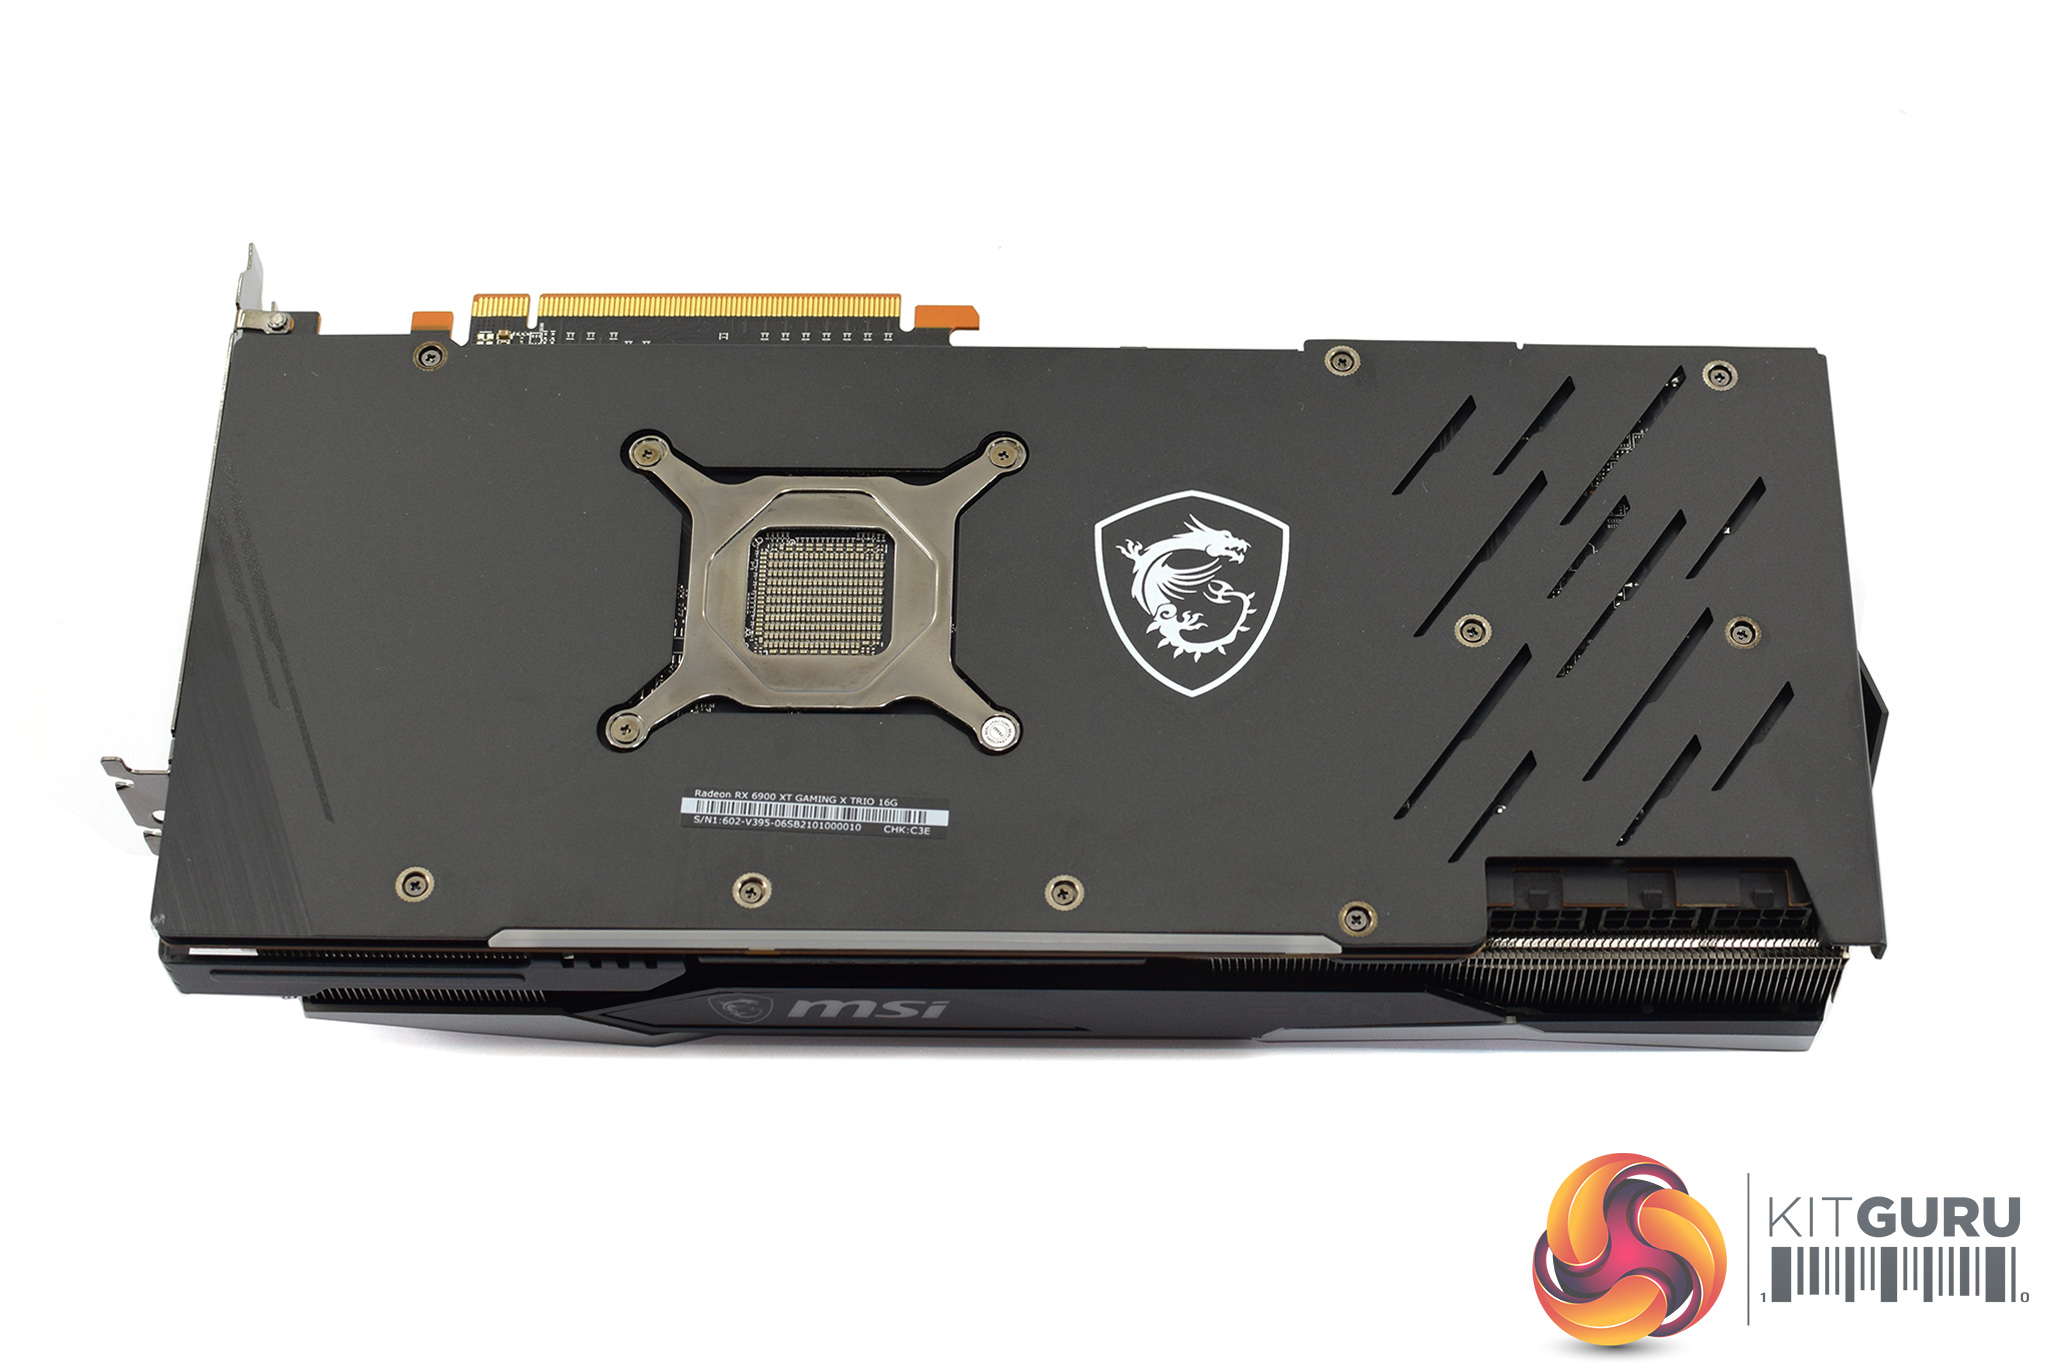
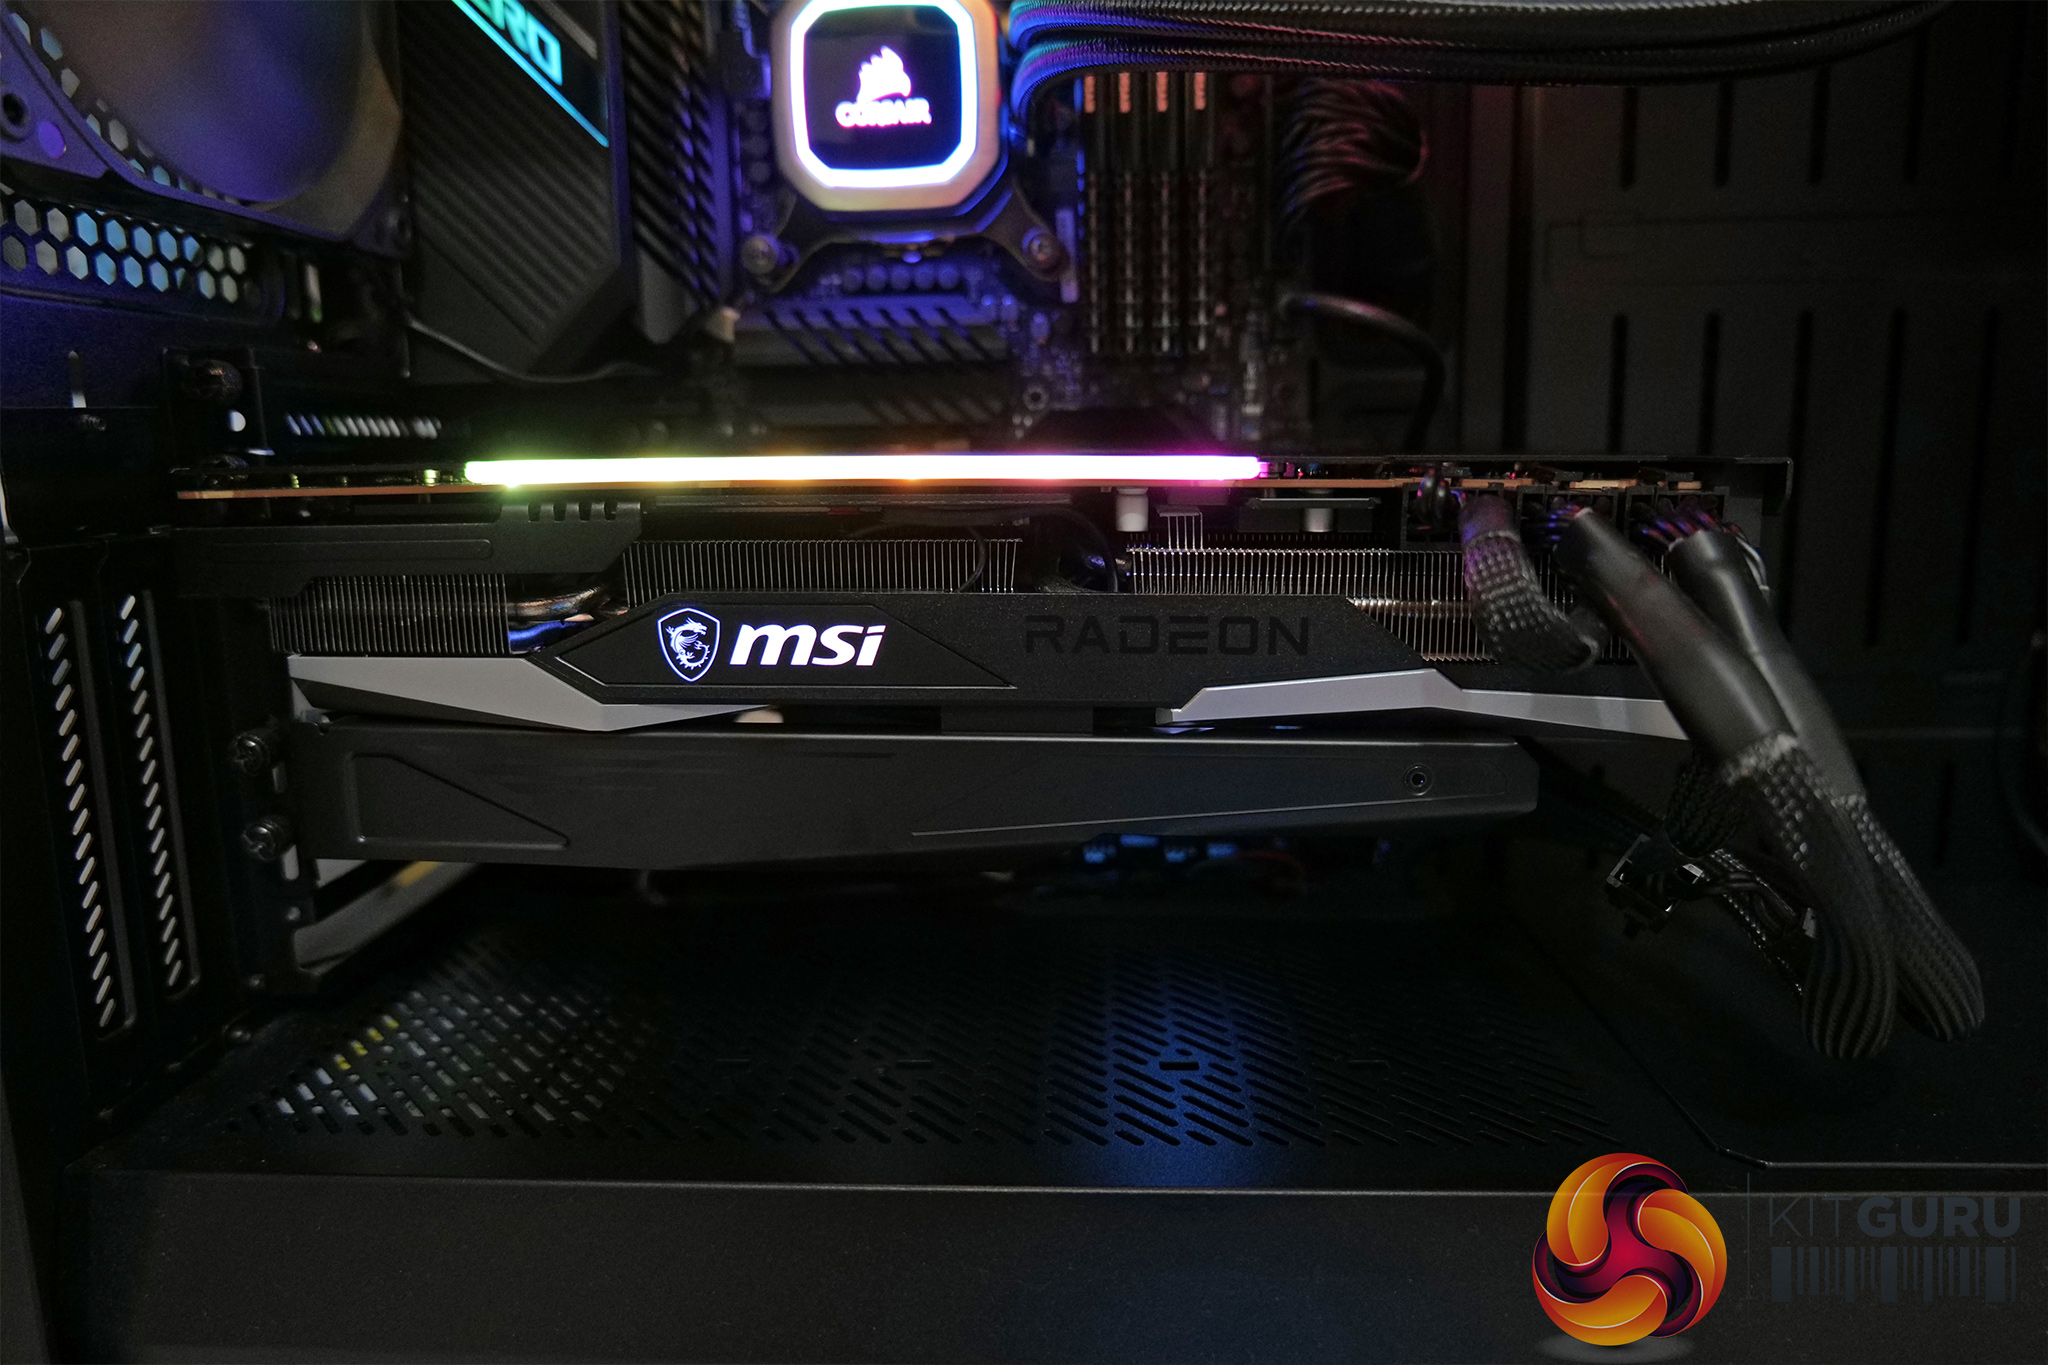
On the front side of the card, the MSI logo is positioned on the shroud of the card, while we can see an ARGB lightbar positioned by the backplate. Speaking of the backplate, it's great to see MSI using a metal plate here, extending the length of the card. It's a very stealthy matte black design – I'd guess it is anodised aluminium – with just the MSI dragon logo printed in white.
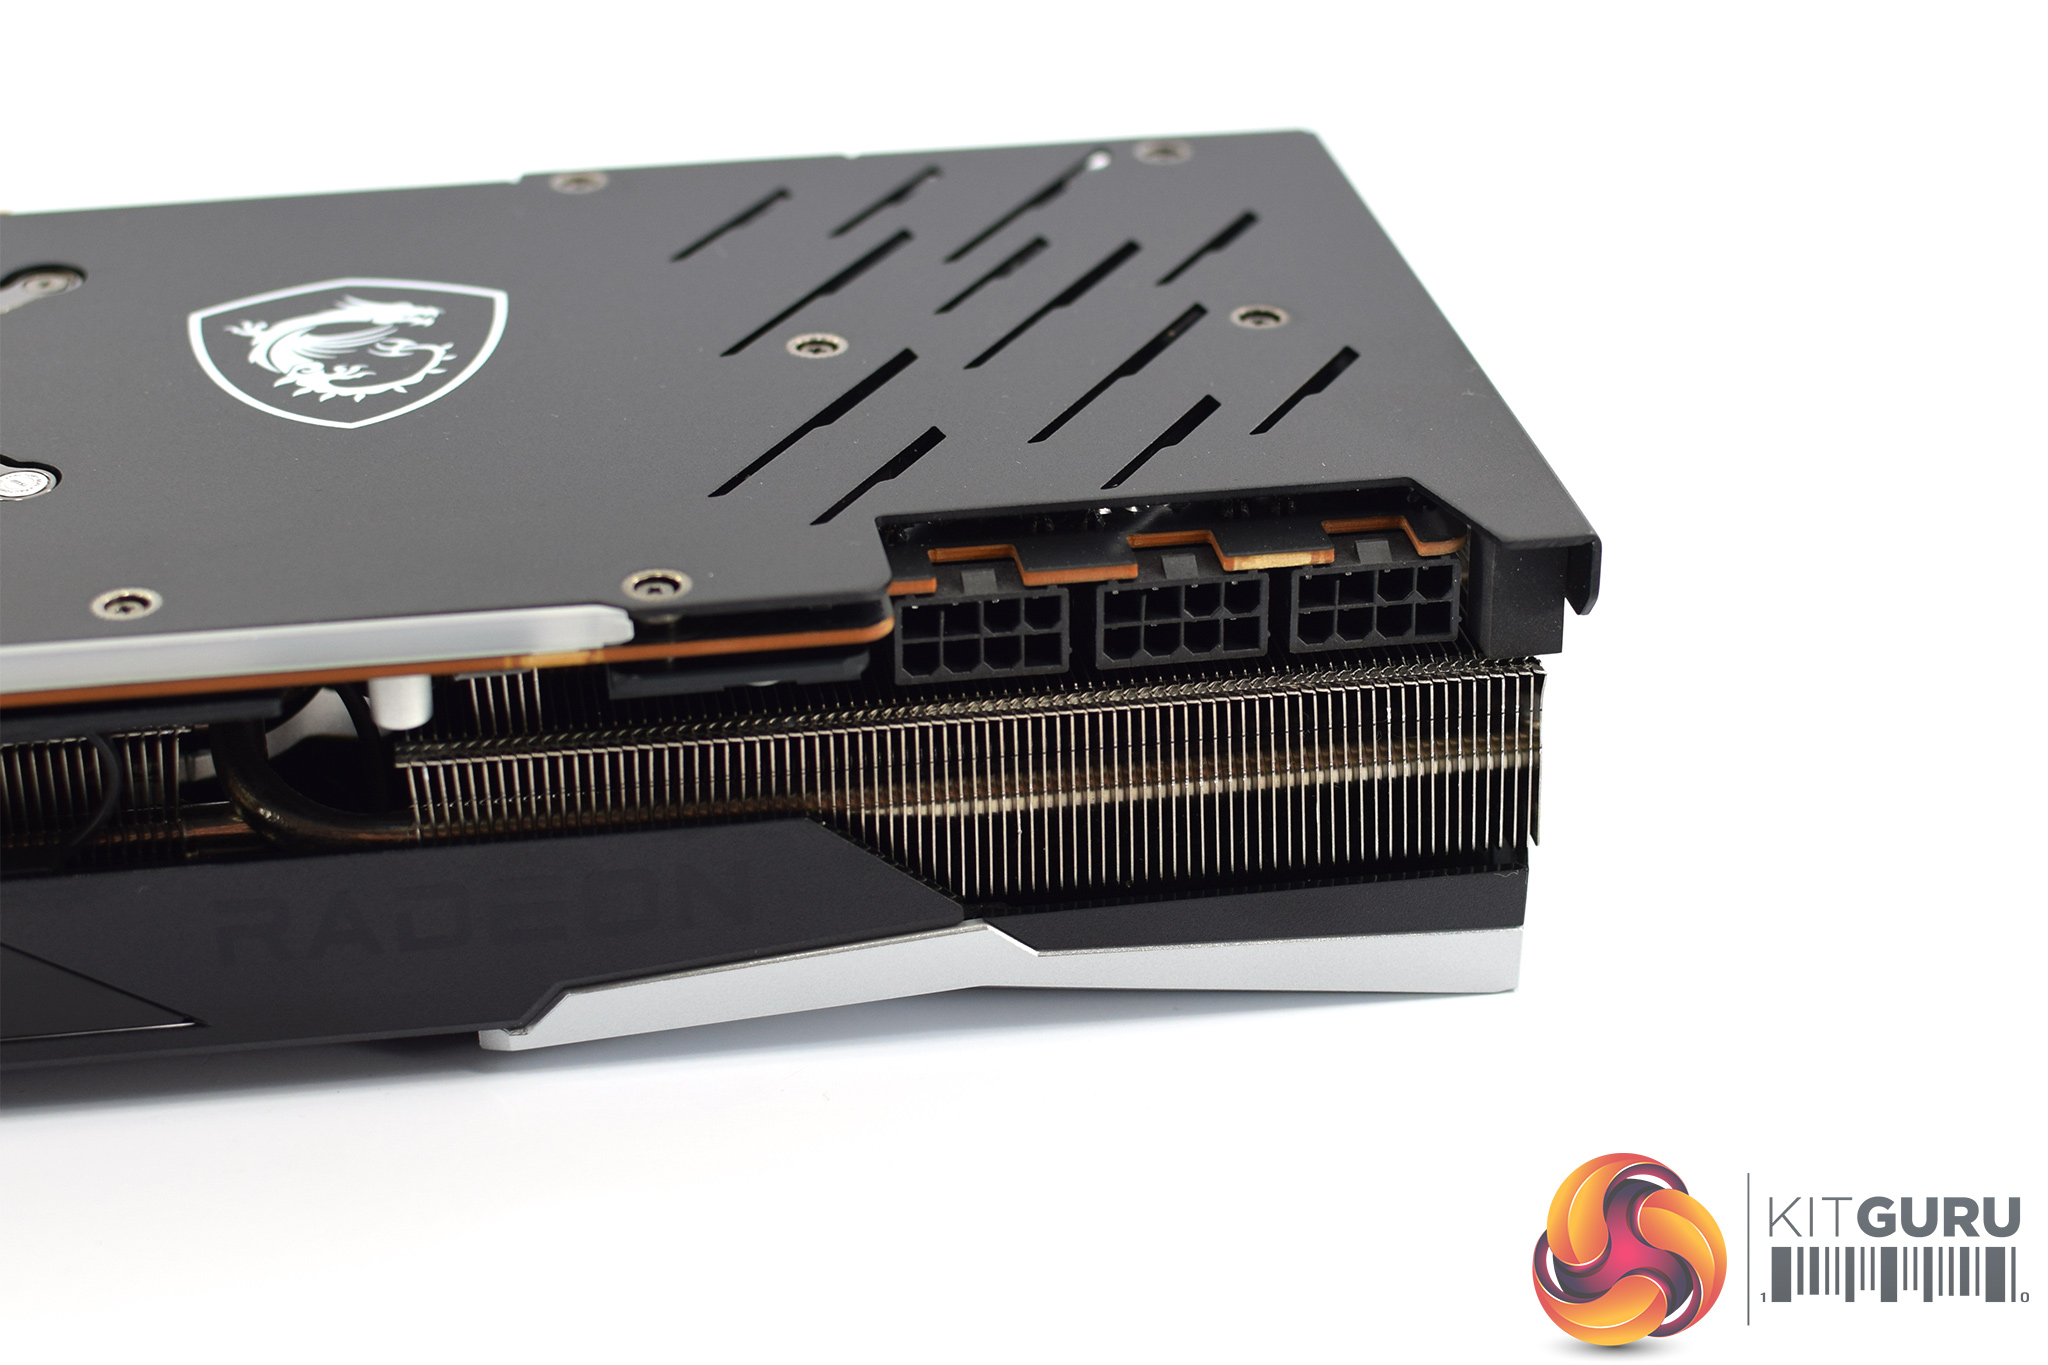
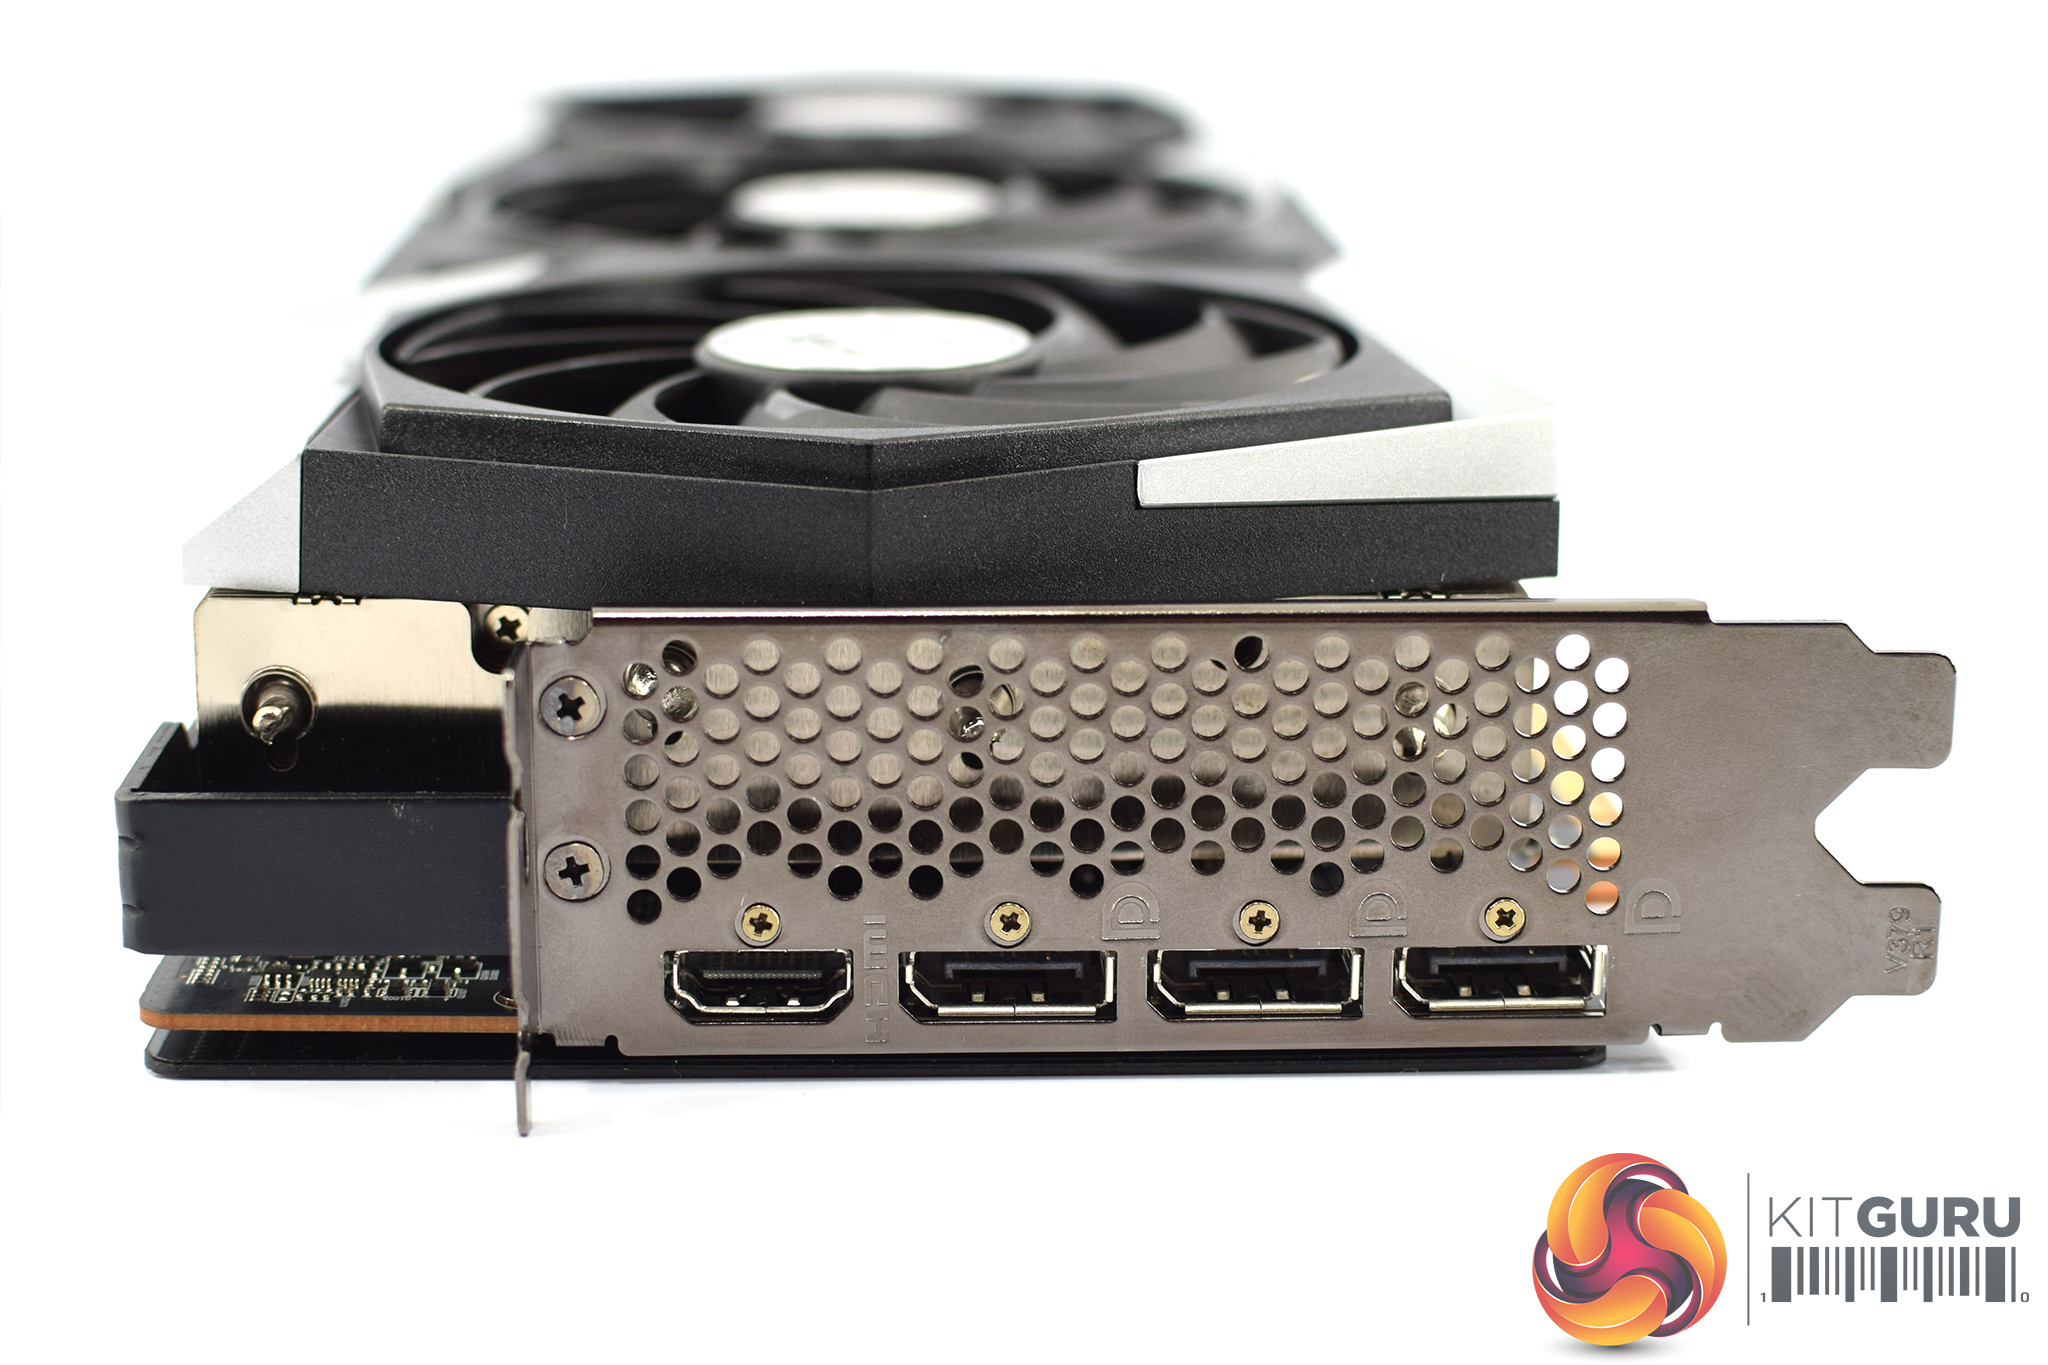
Power requirements consist of 3x 8-pin PCIe power connectors. We can also note 3x DisplayPort 1.4 and 1x HDMI 2.1 display outputs.
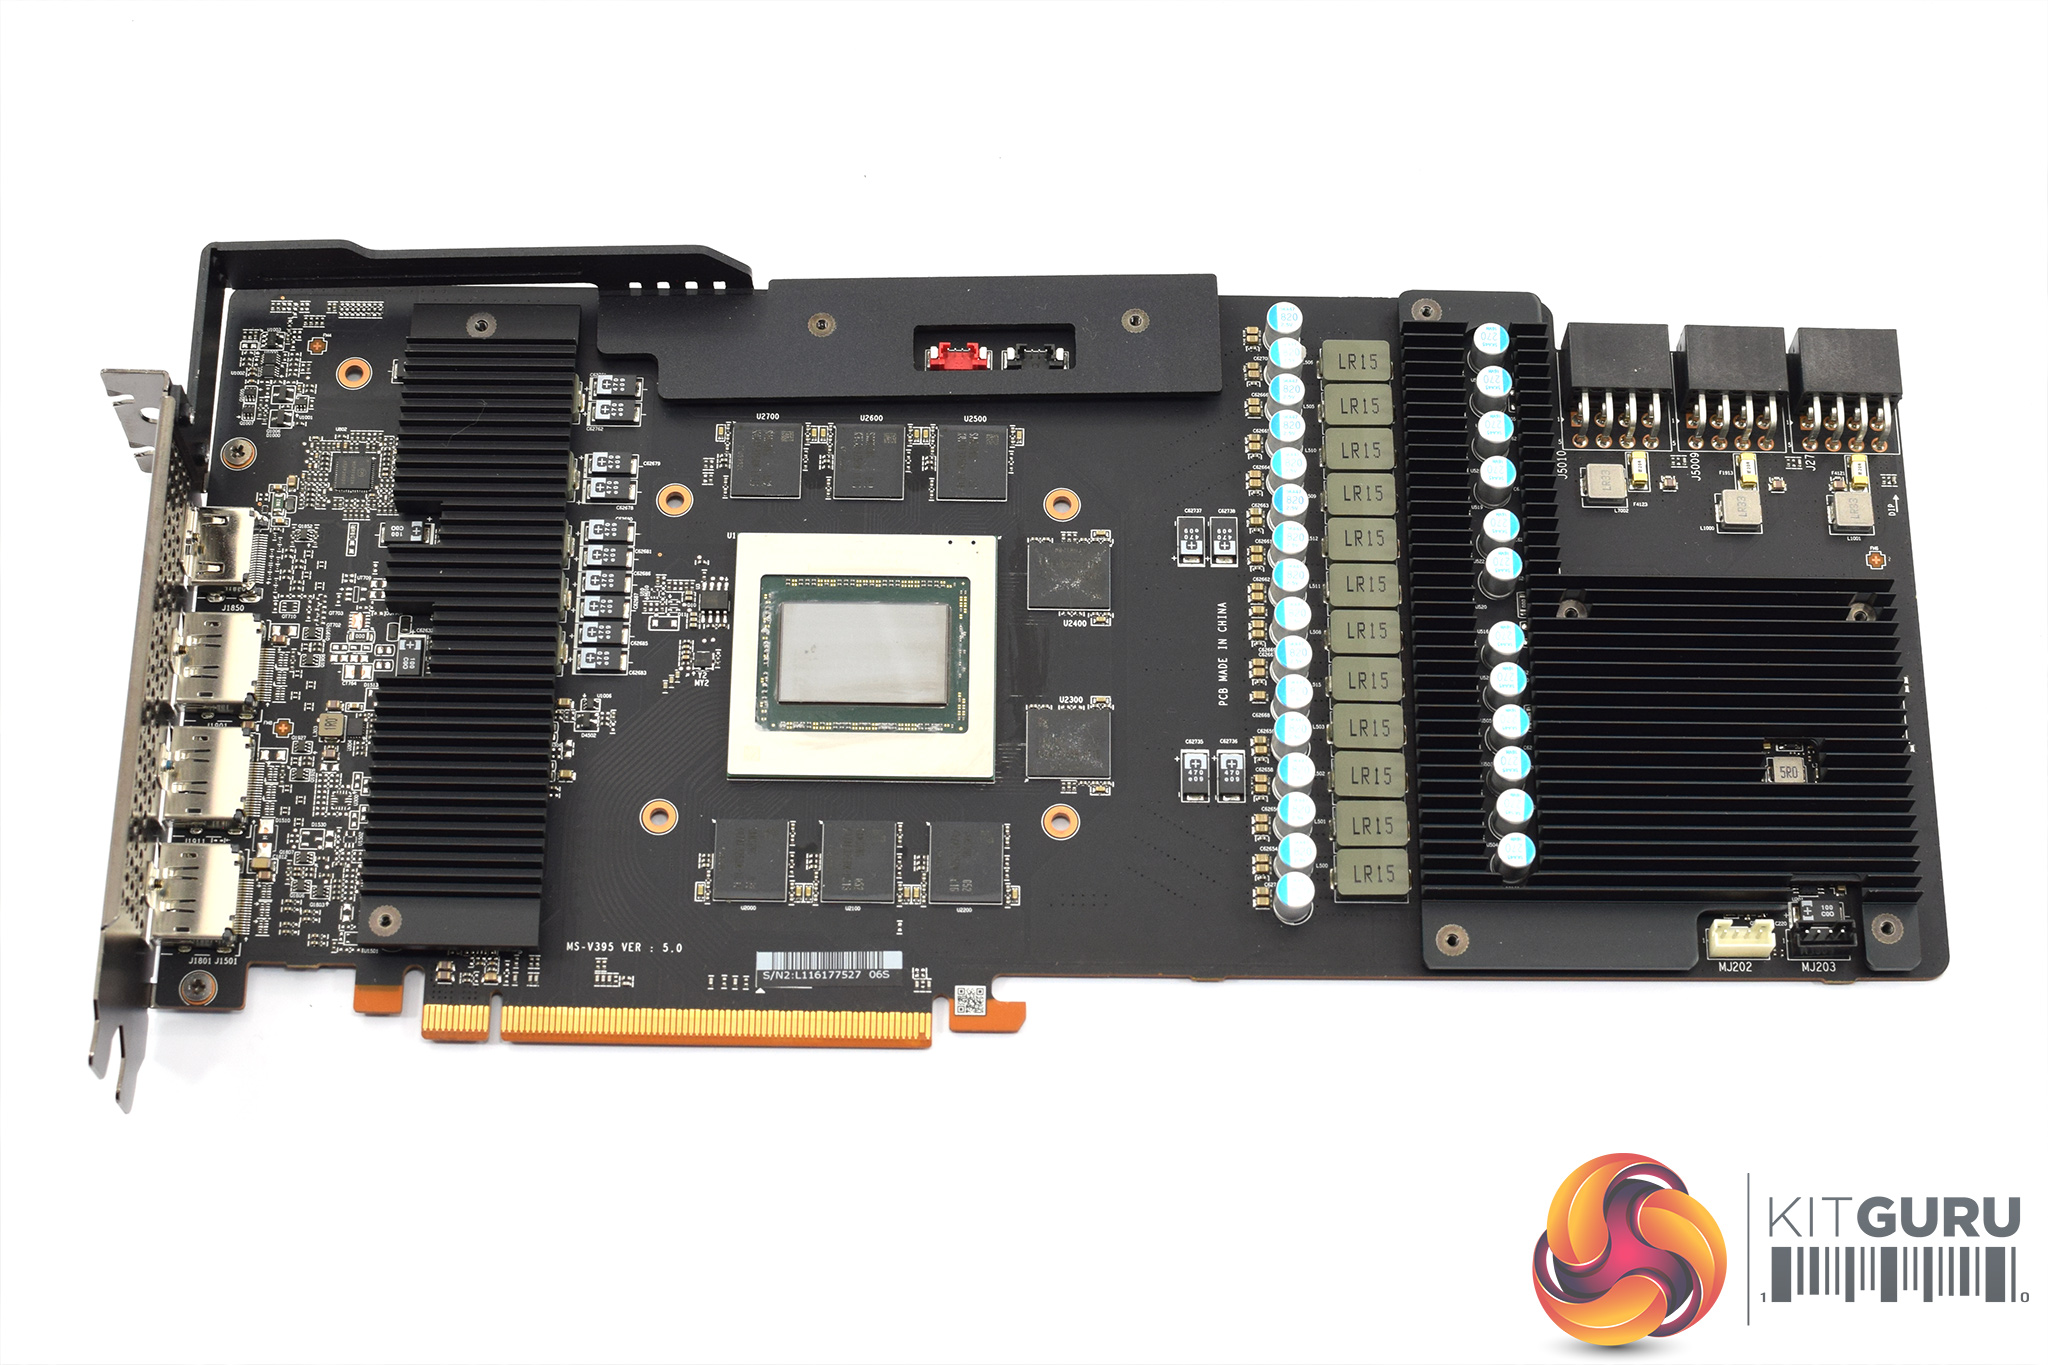
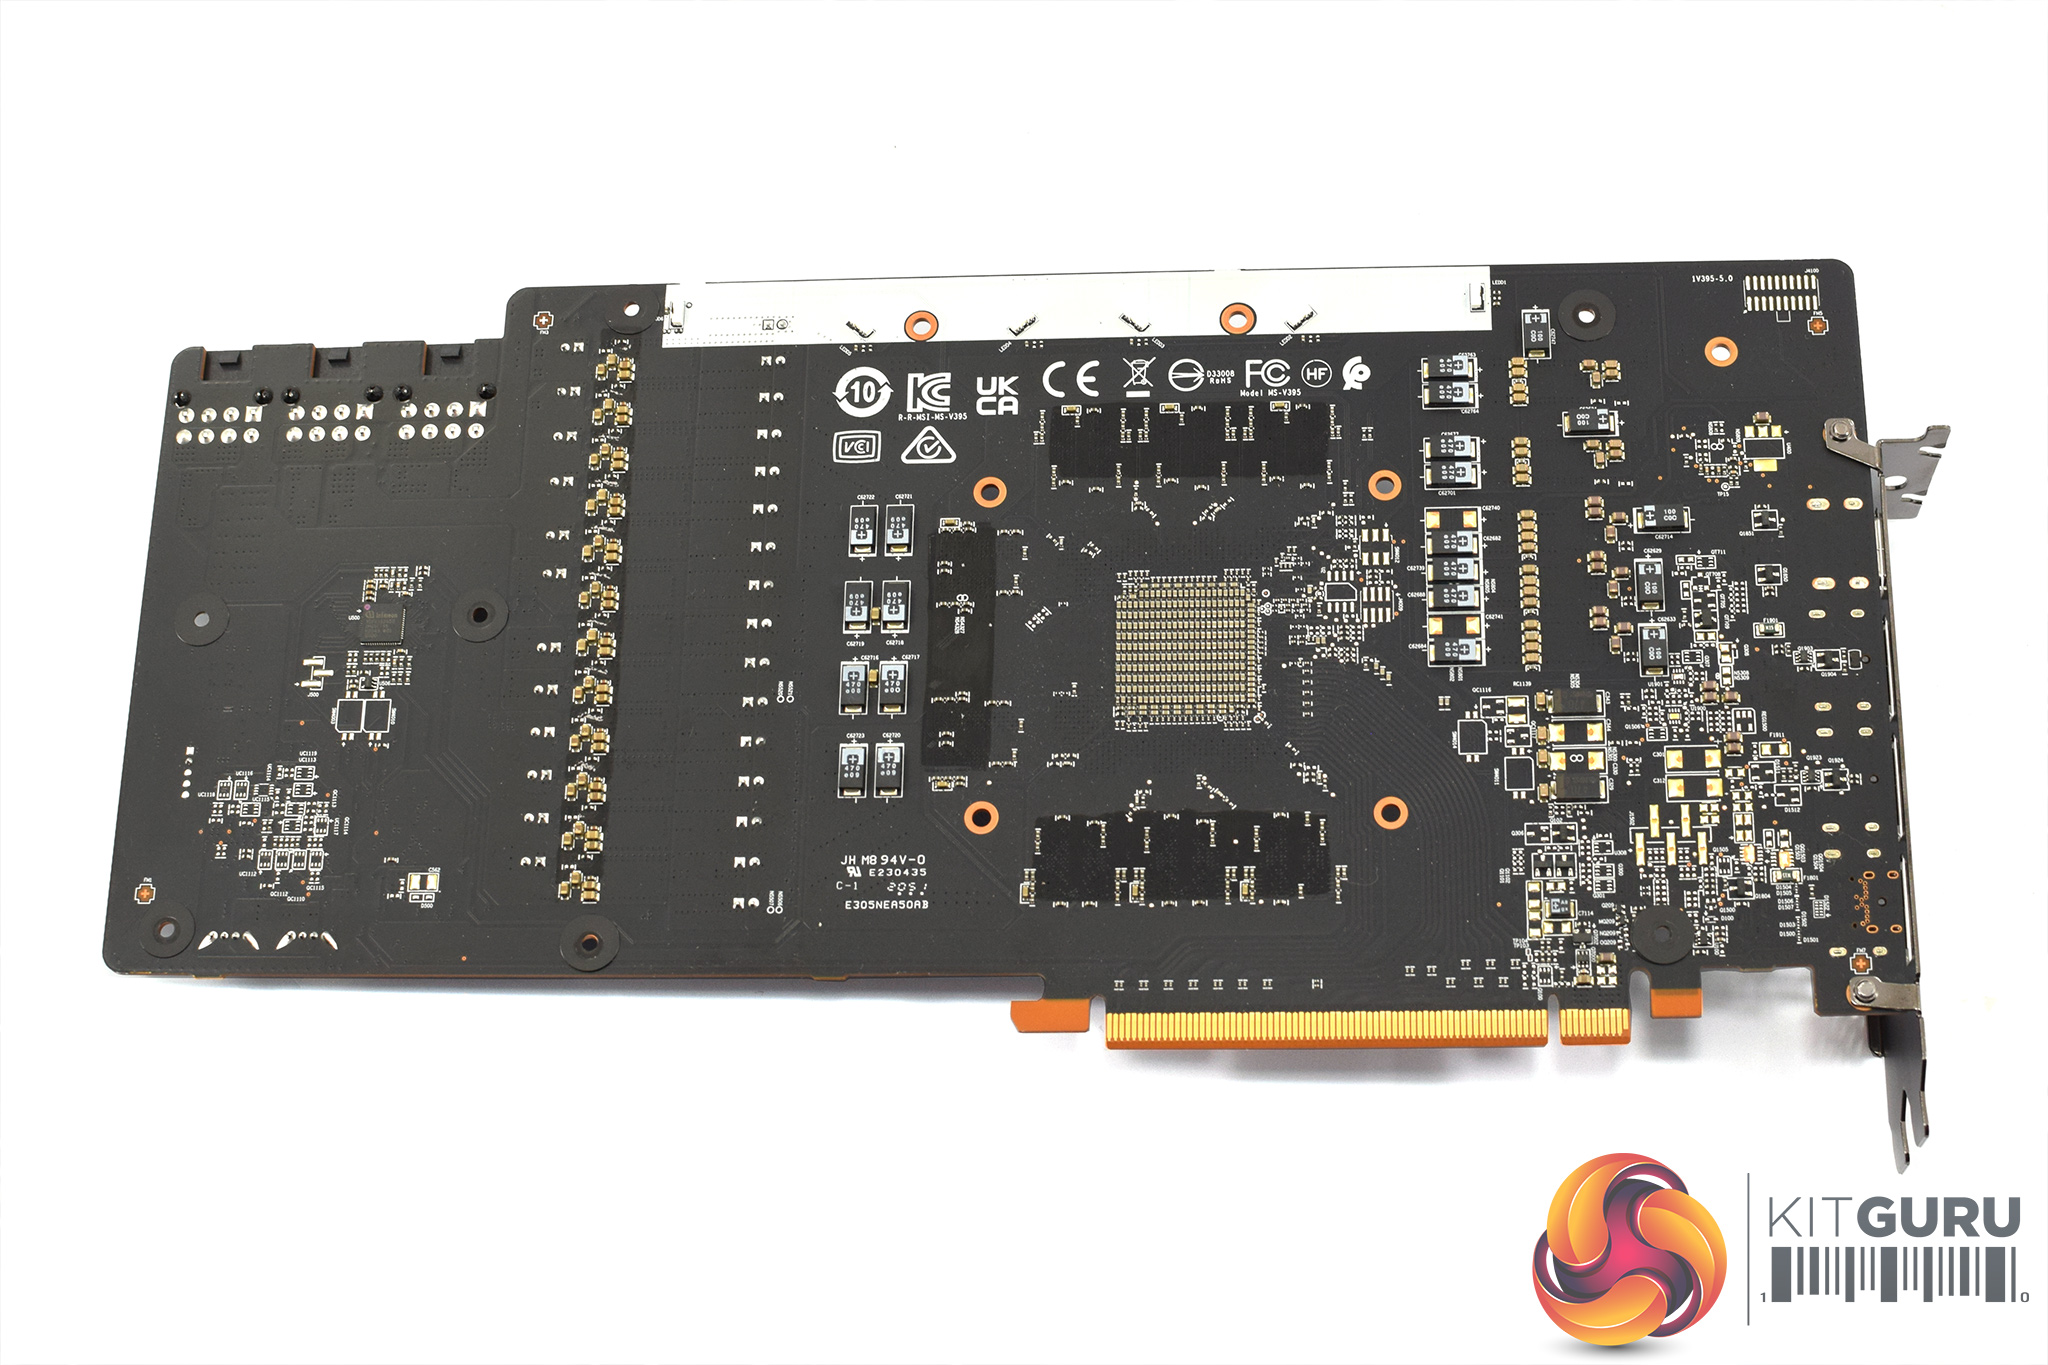
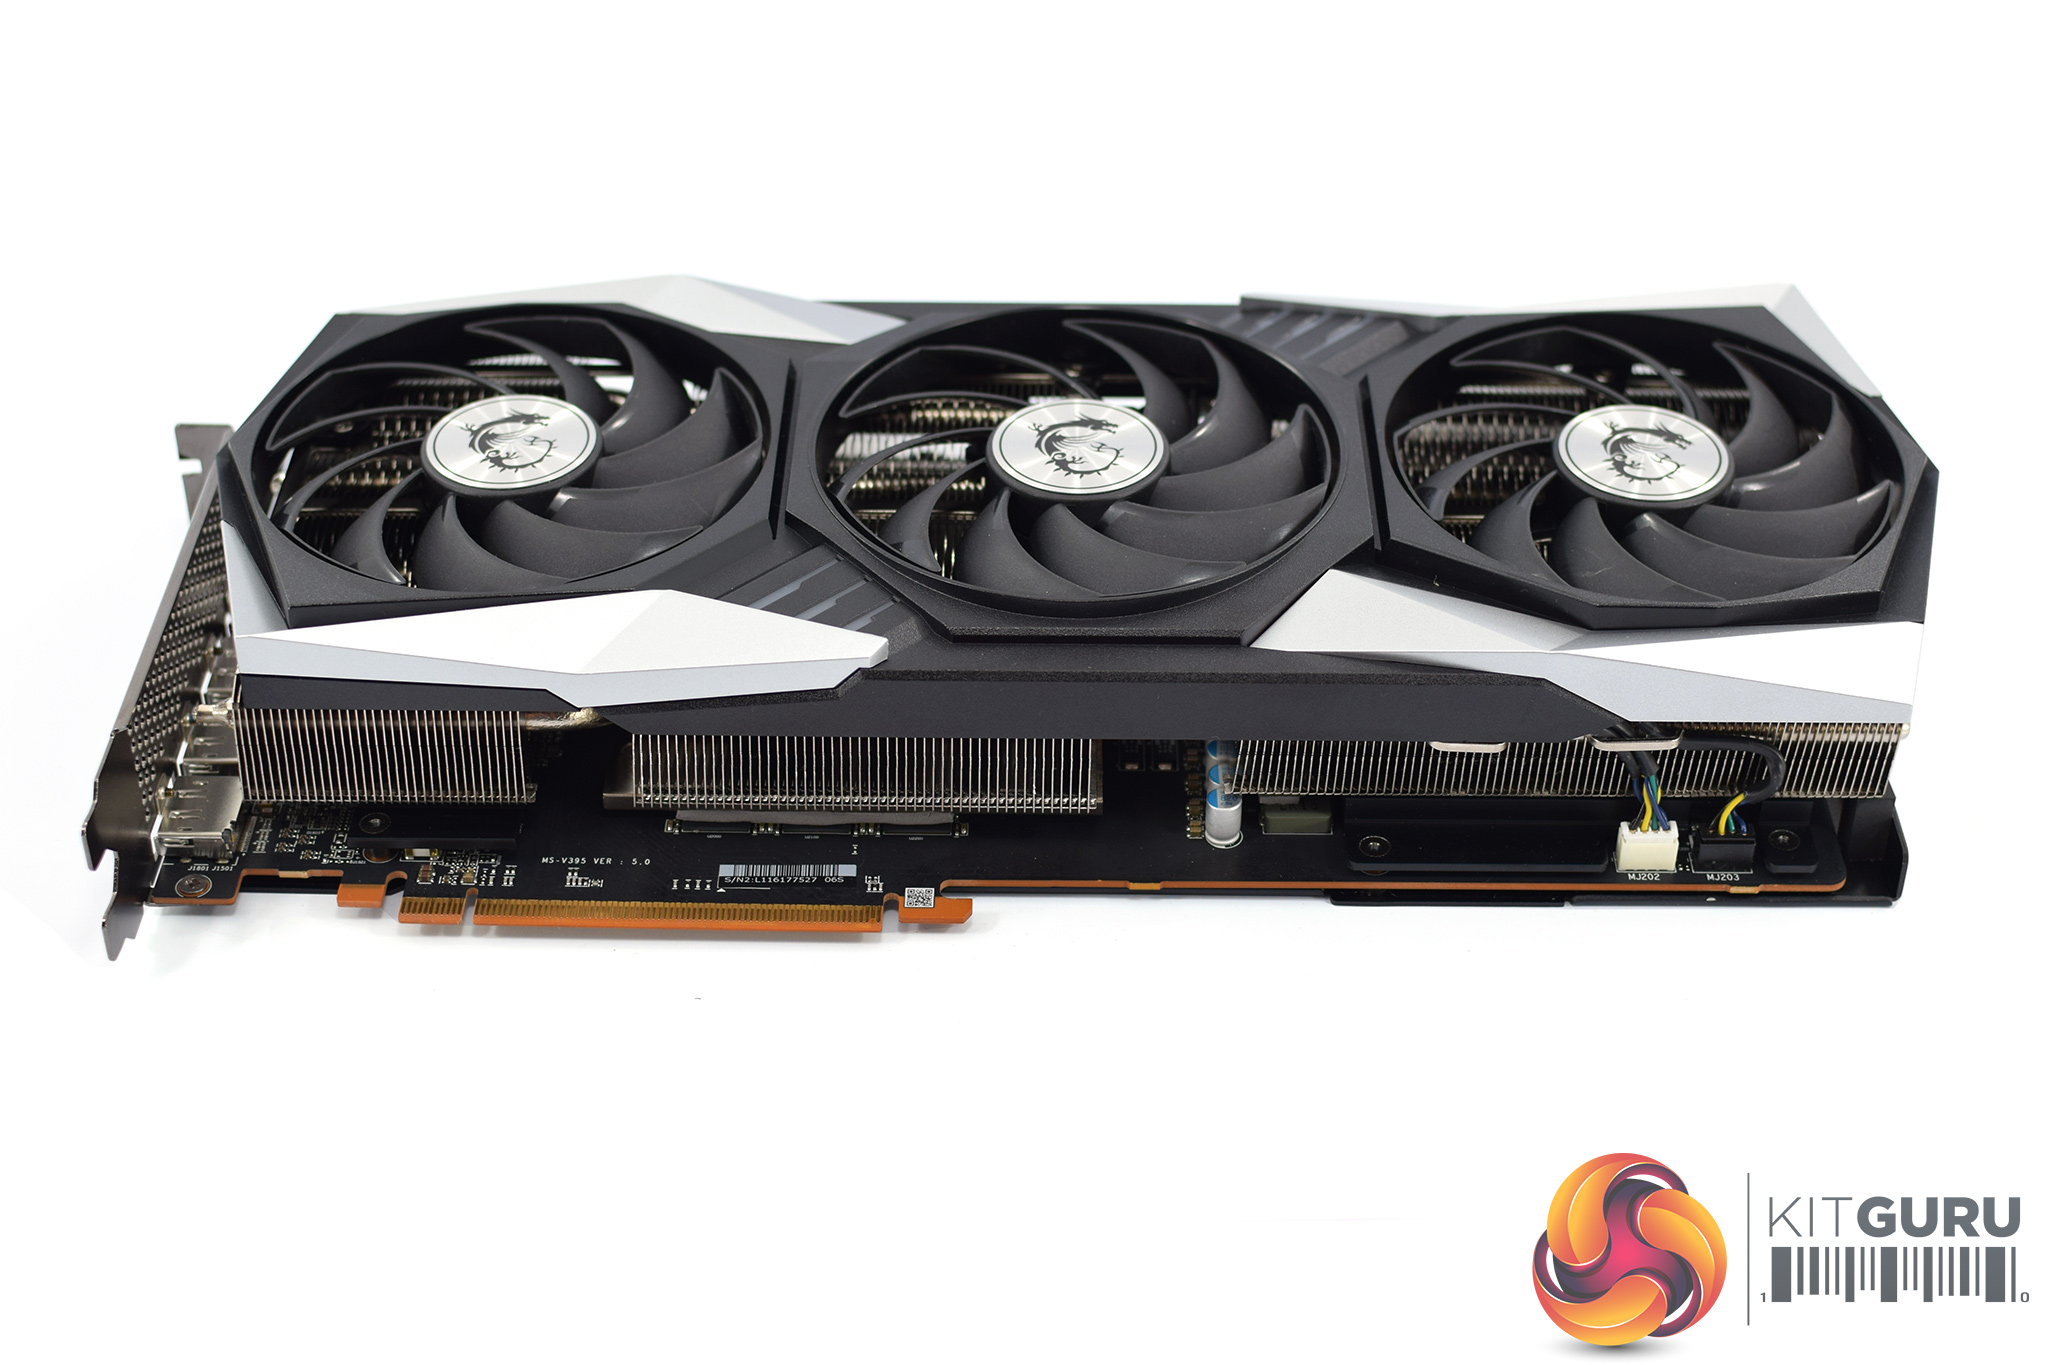
Moving onto the PCB, the first thing to note is the use of two secondary heatsinks which cool the VRM. There's also a small support bracket which screws into the I/O bracket, which MSI claims should help overall rigidity.
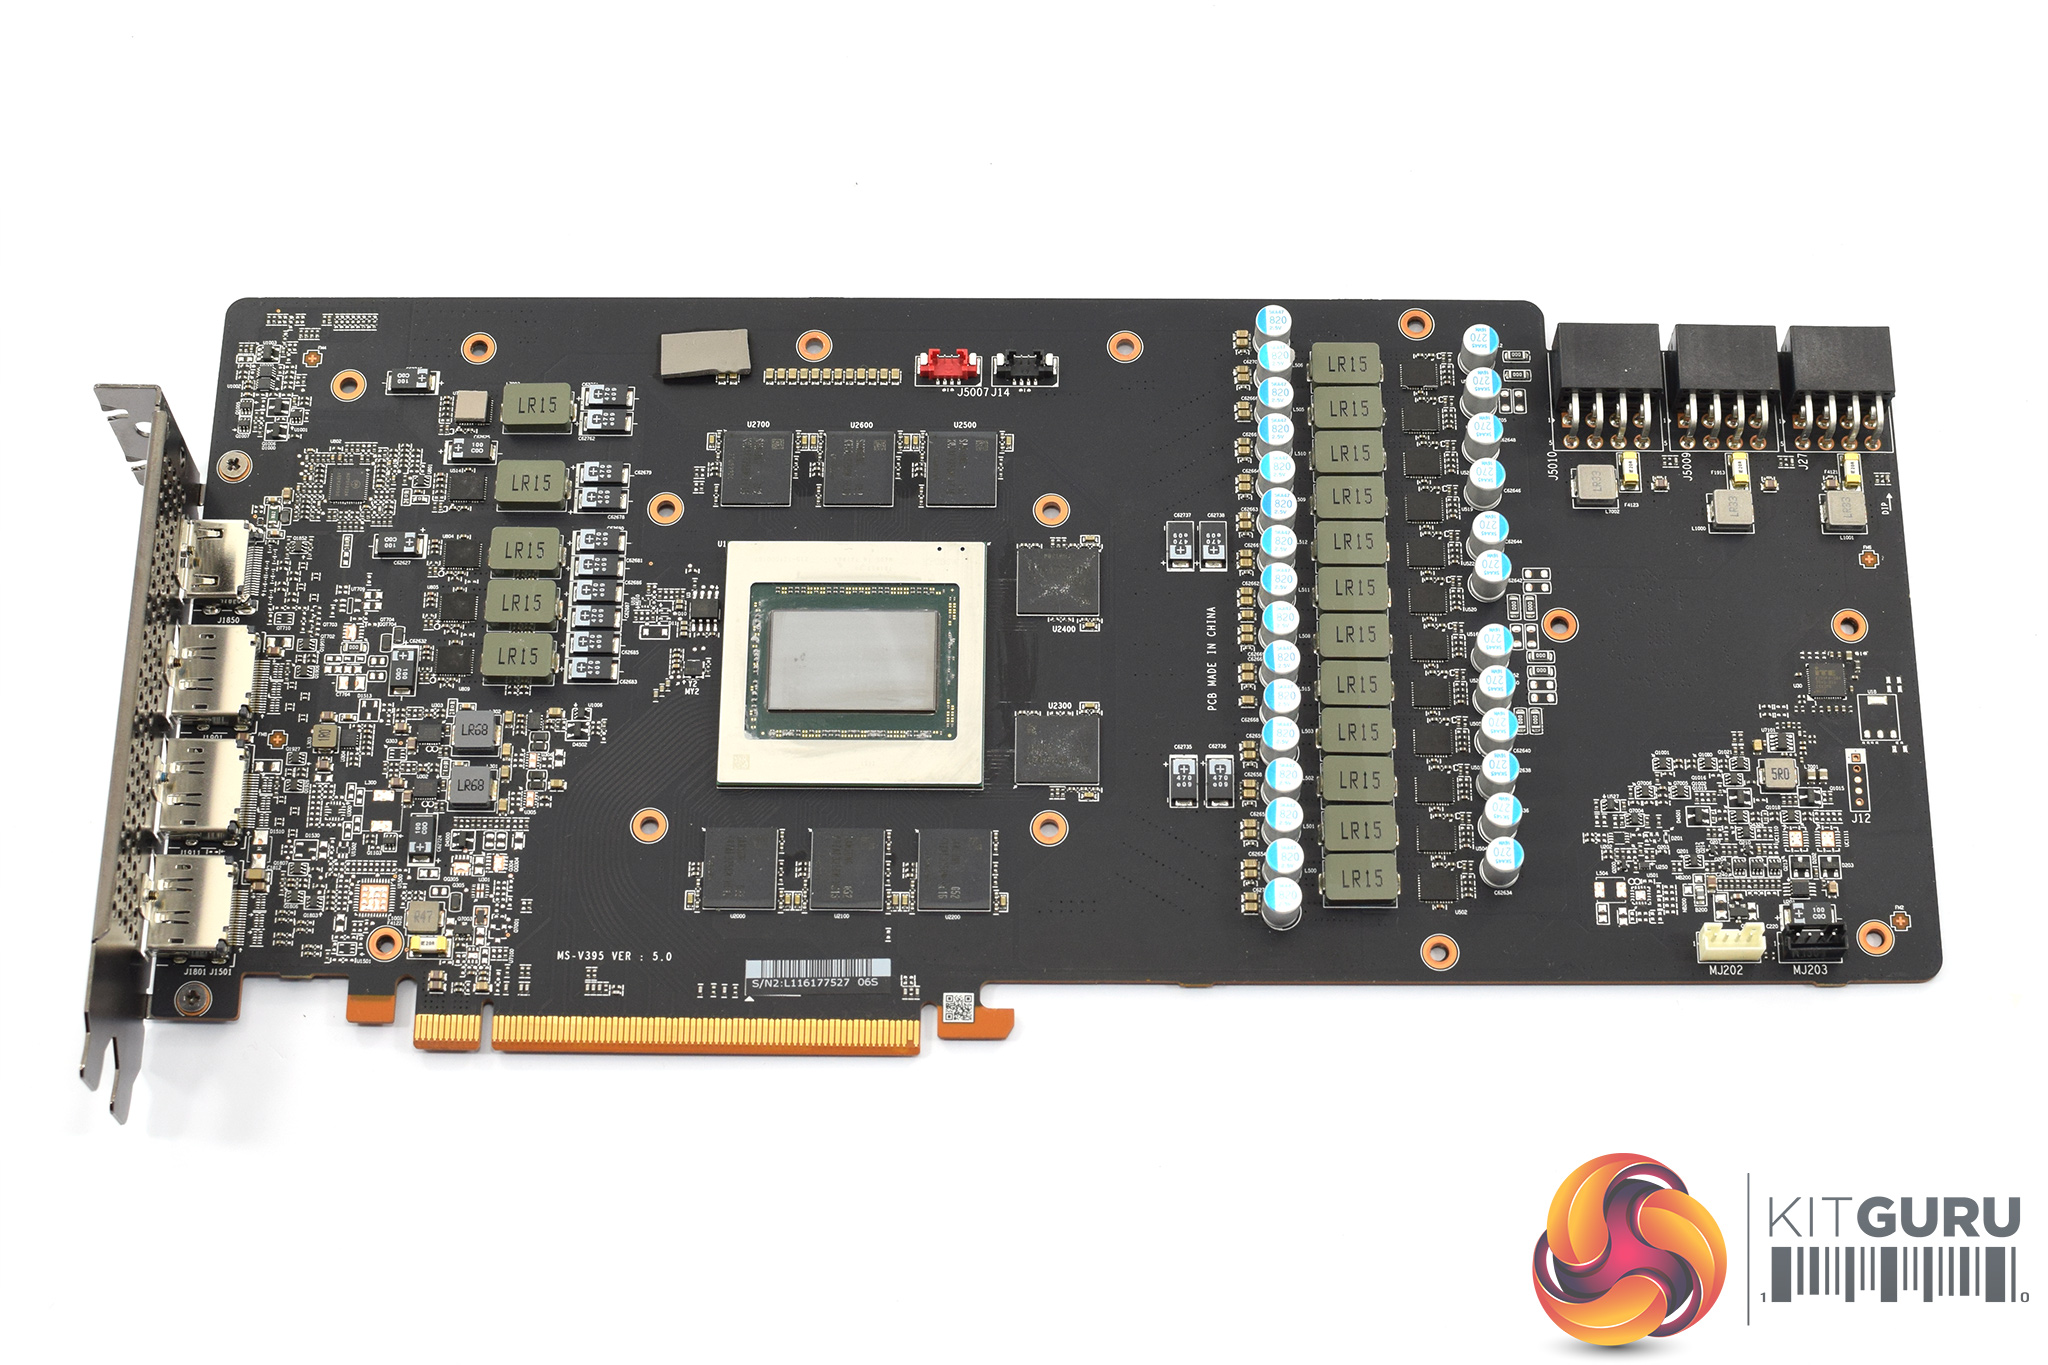
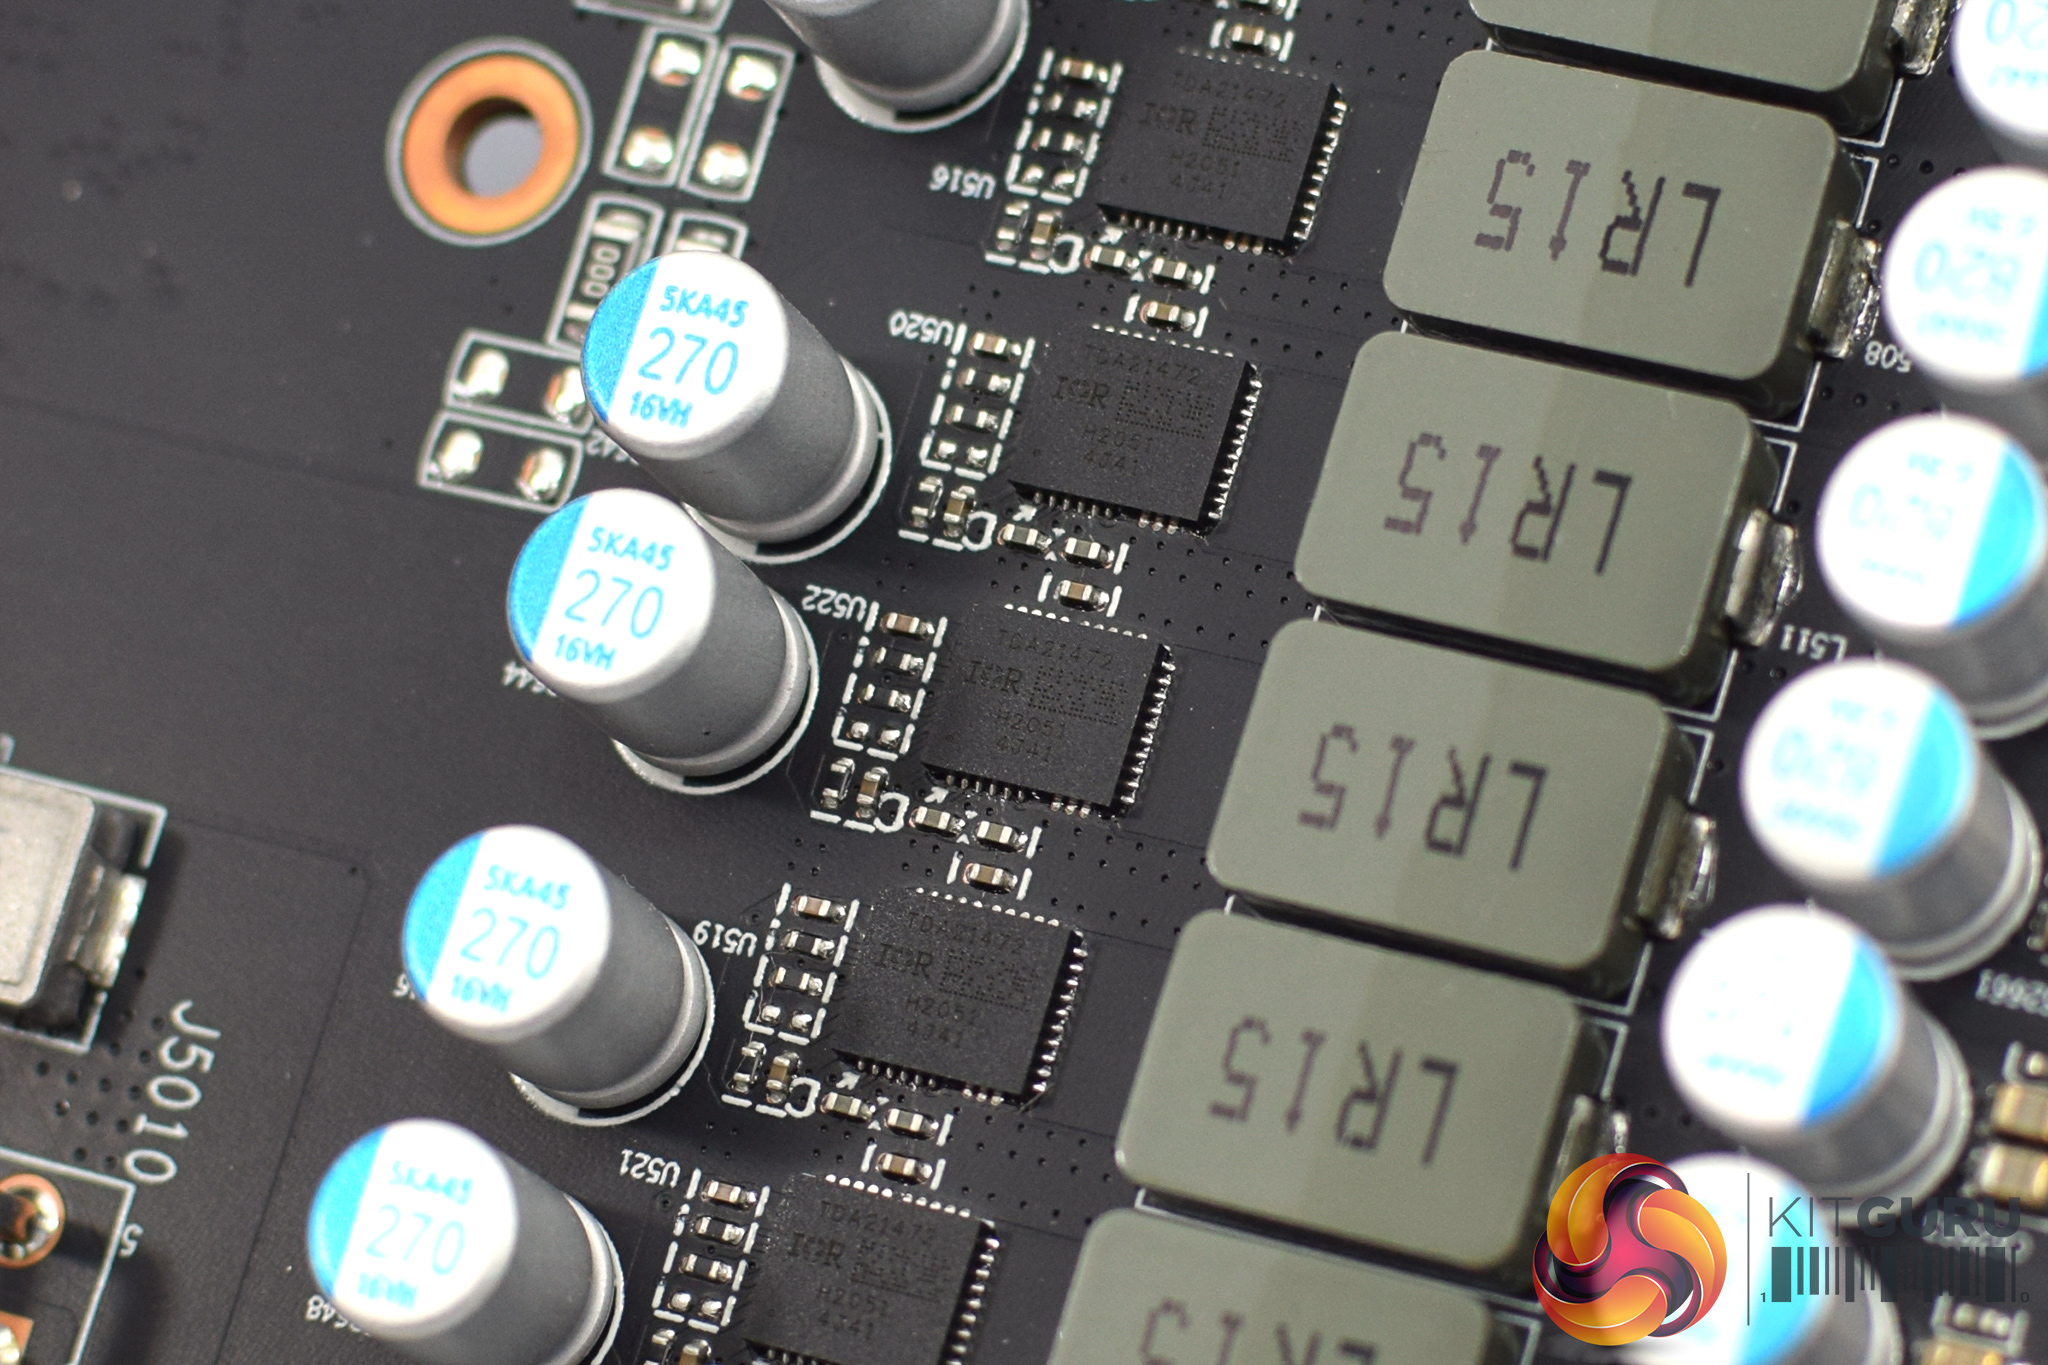
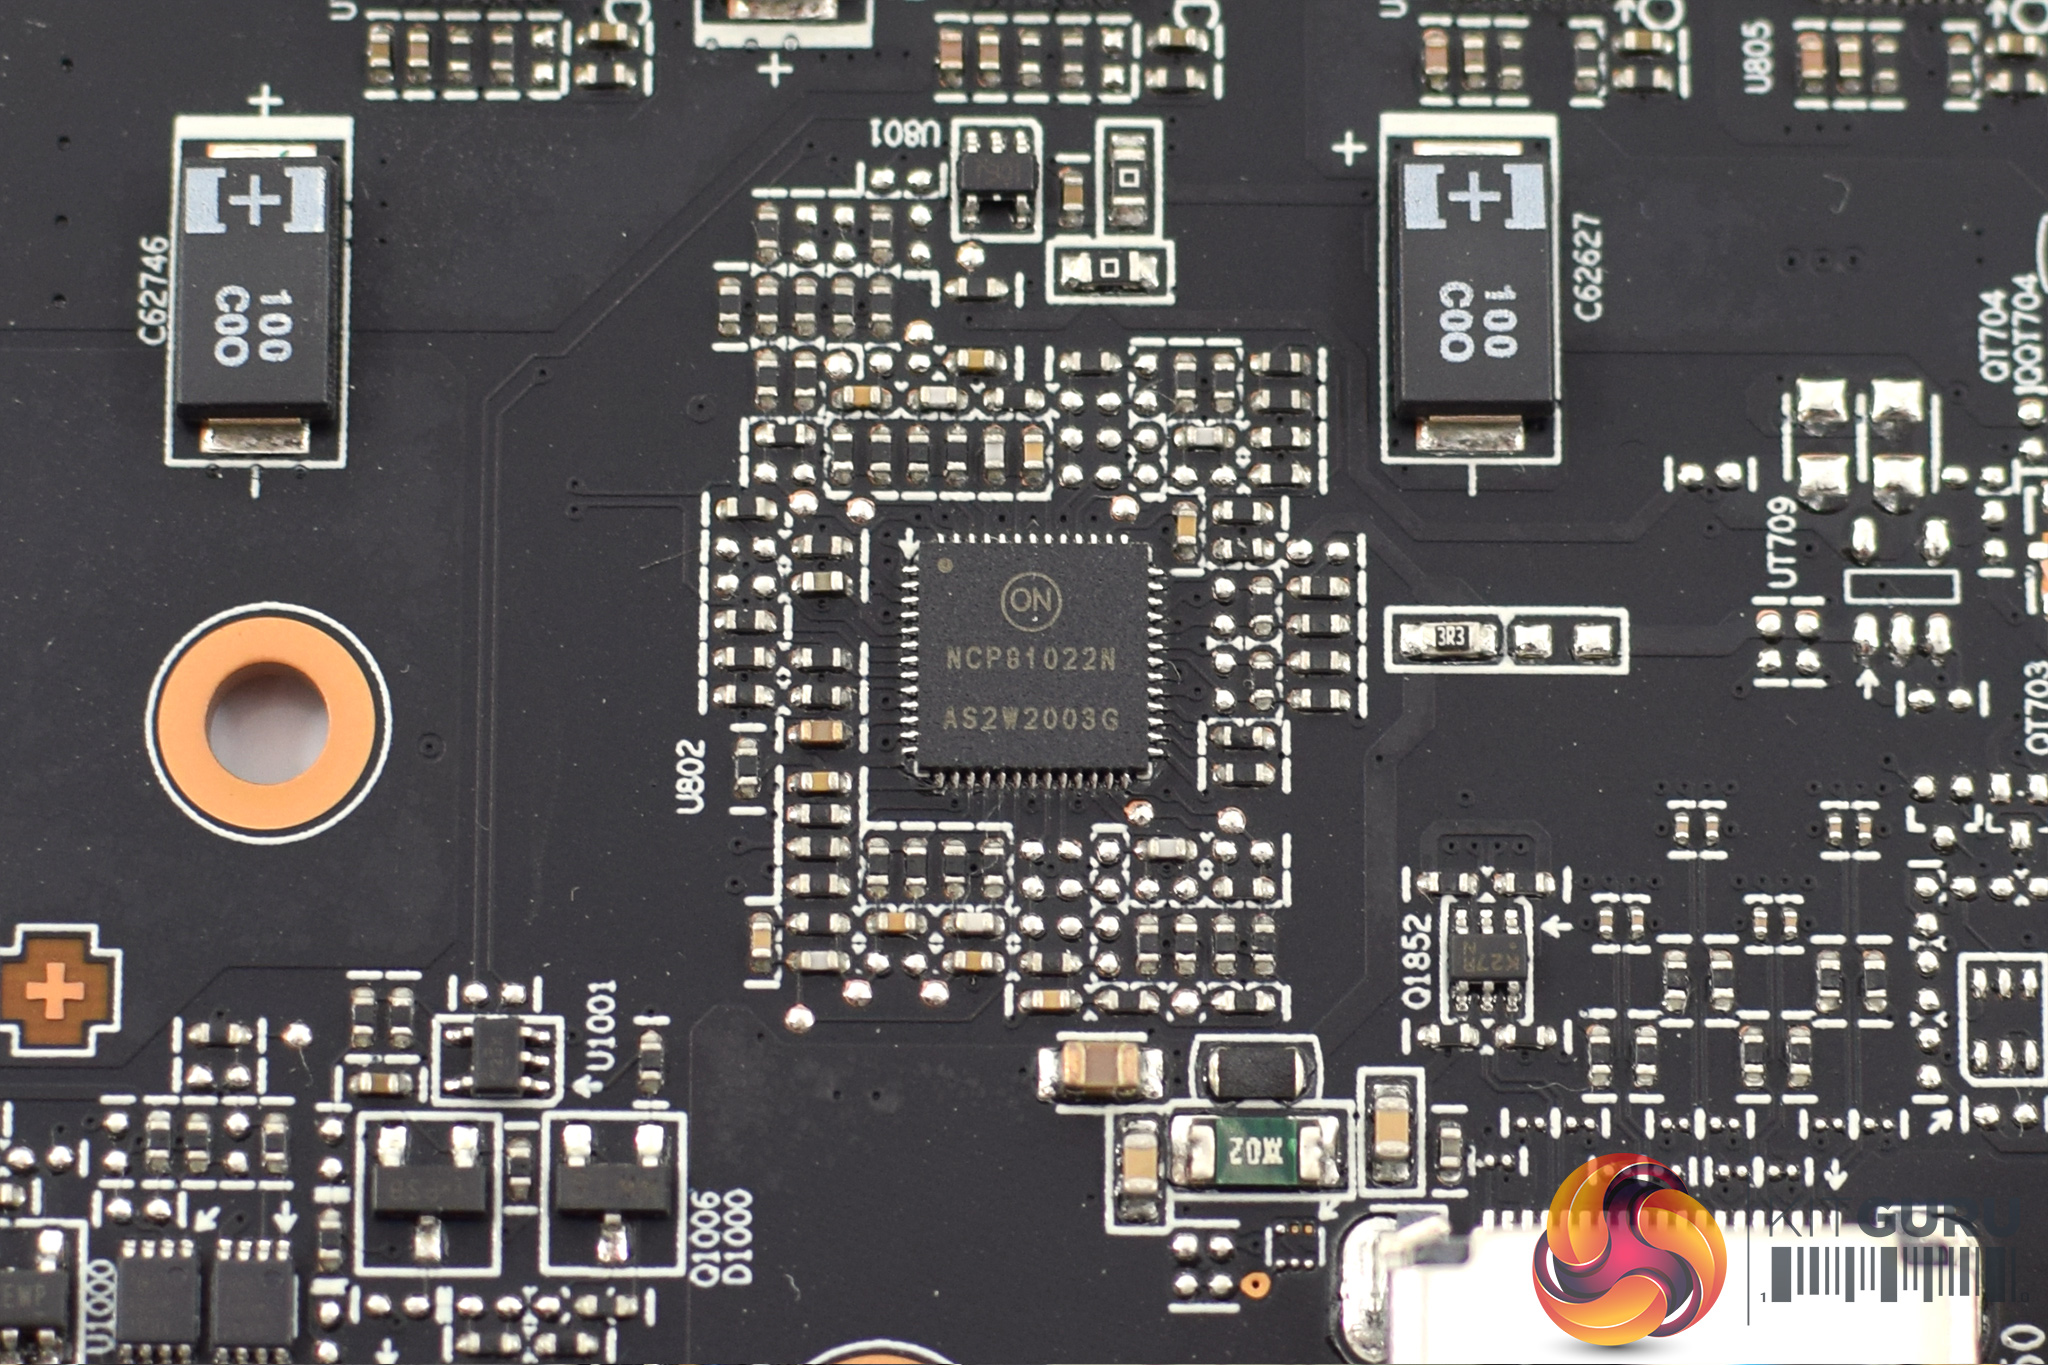
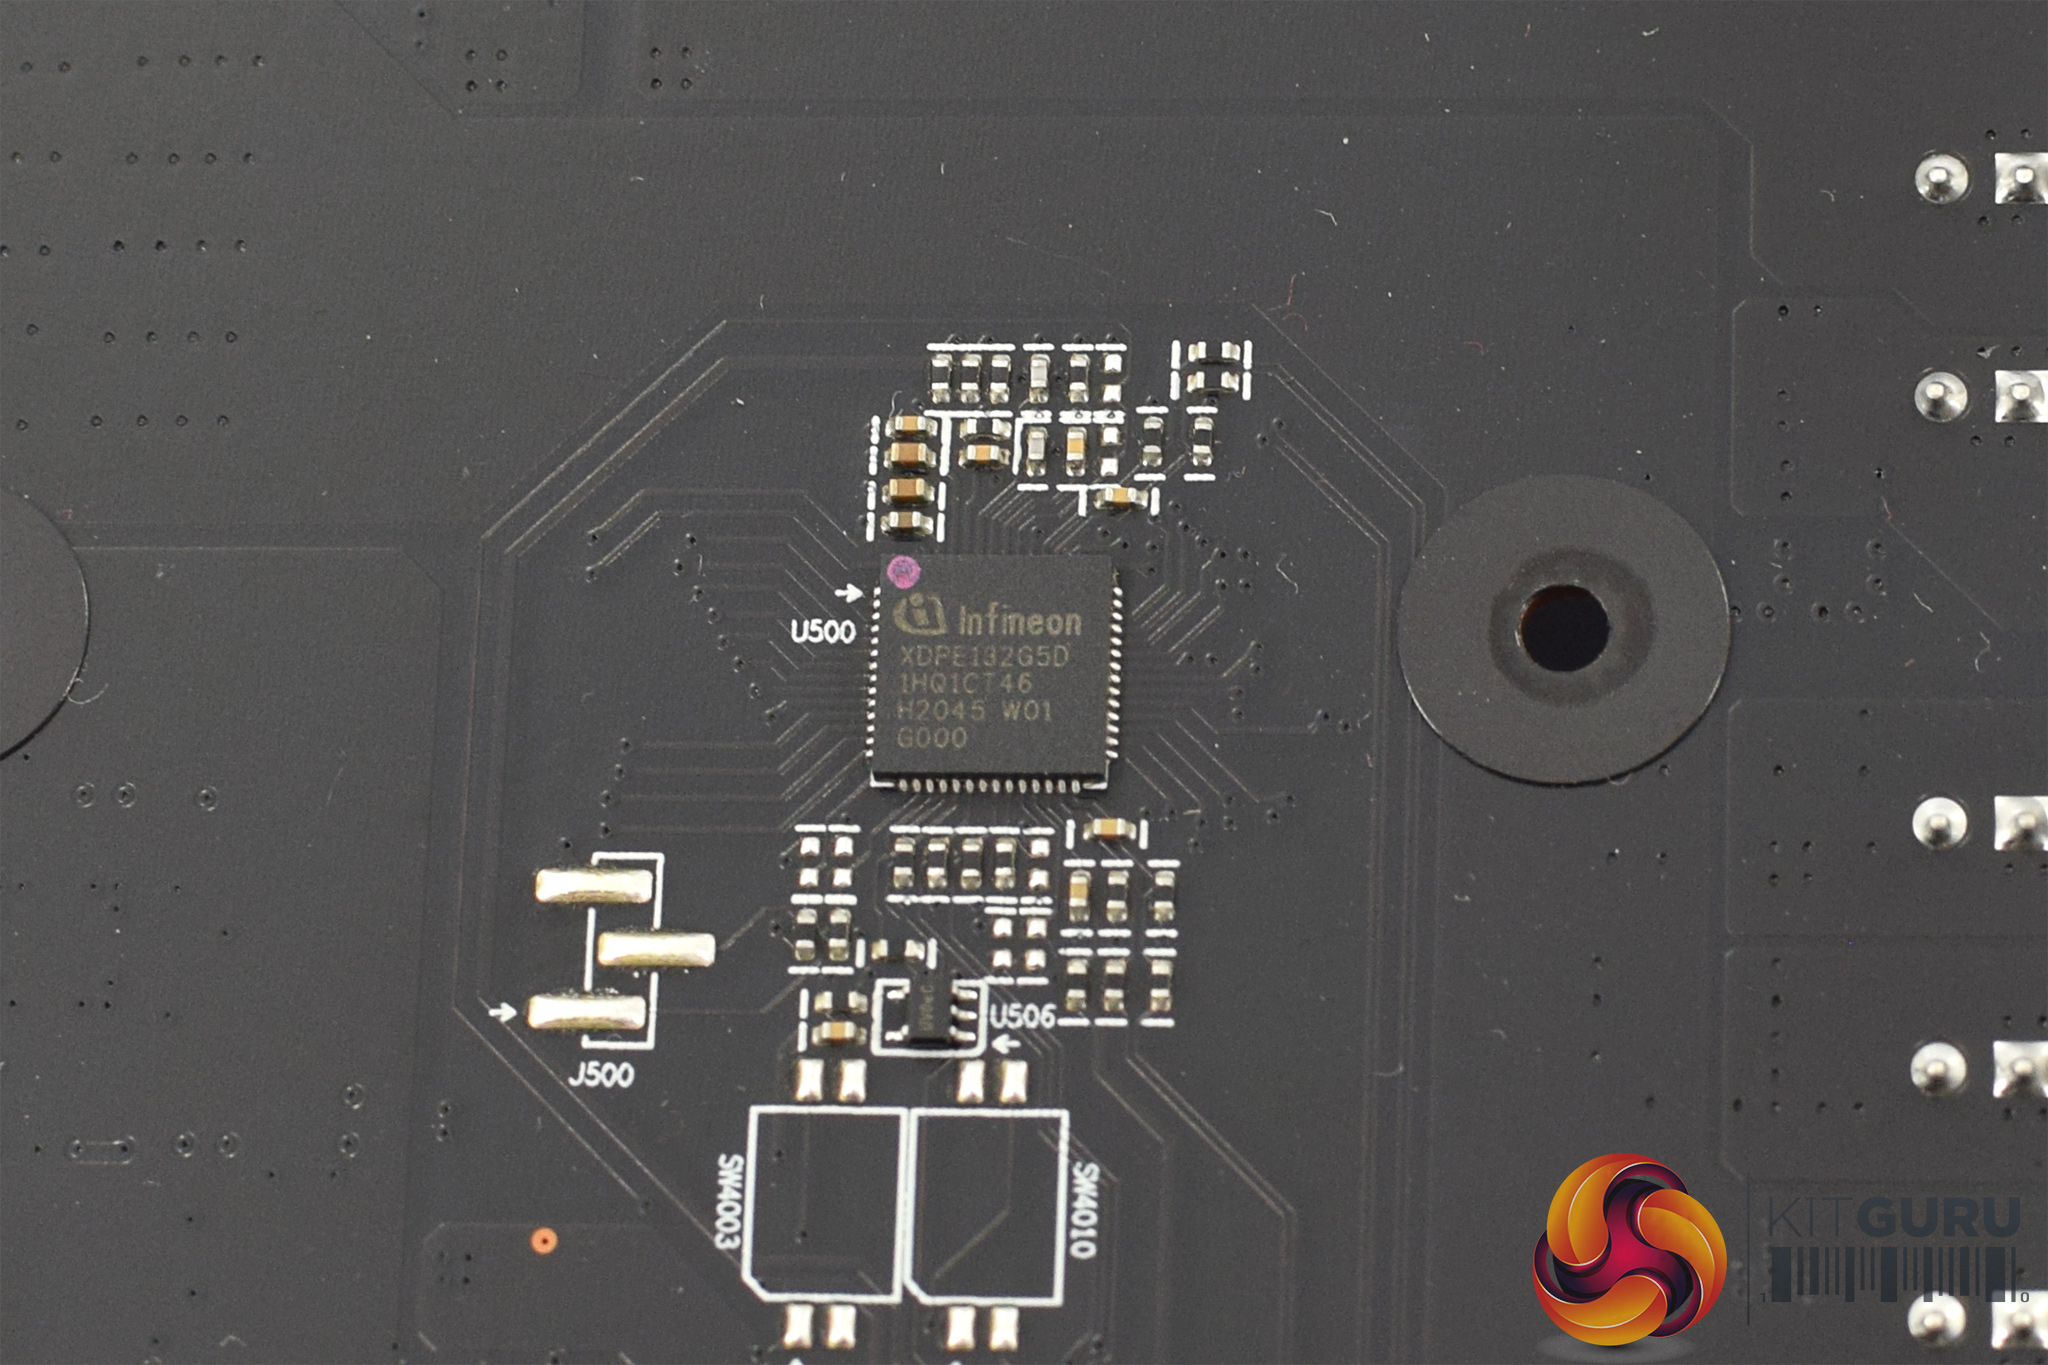
Once those are removed, we can get a closer look at the PCB and the underlying componentry. There's a total of 17 stages used here, split in a 14+3 configuration. MSI is using International Rectifier TDA21472 MOSFETs, rated for 70Amps. We can also note the Infineon XDPE132G5D controlled used for the GPU VRM, while MSI deploys the OnSemi NCP80122 controller to handle the memory.
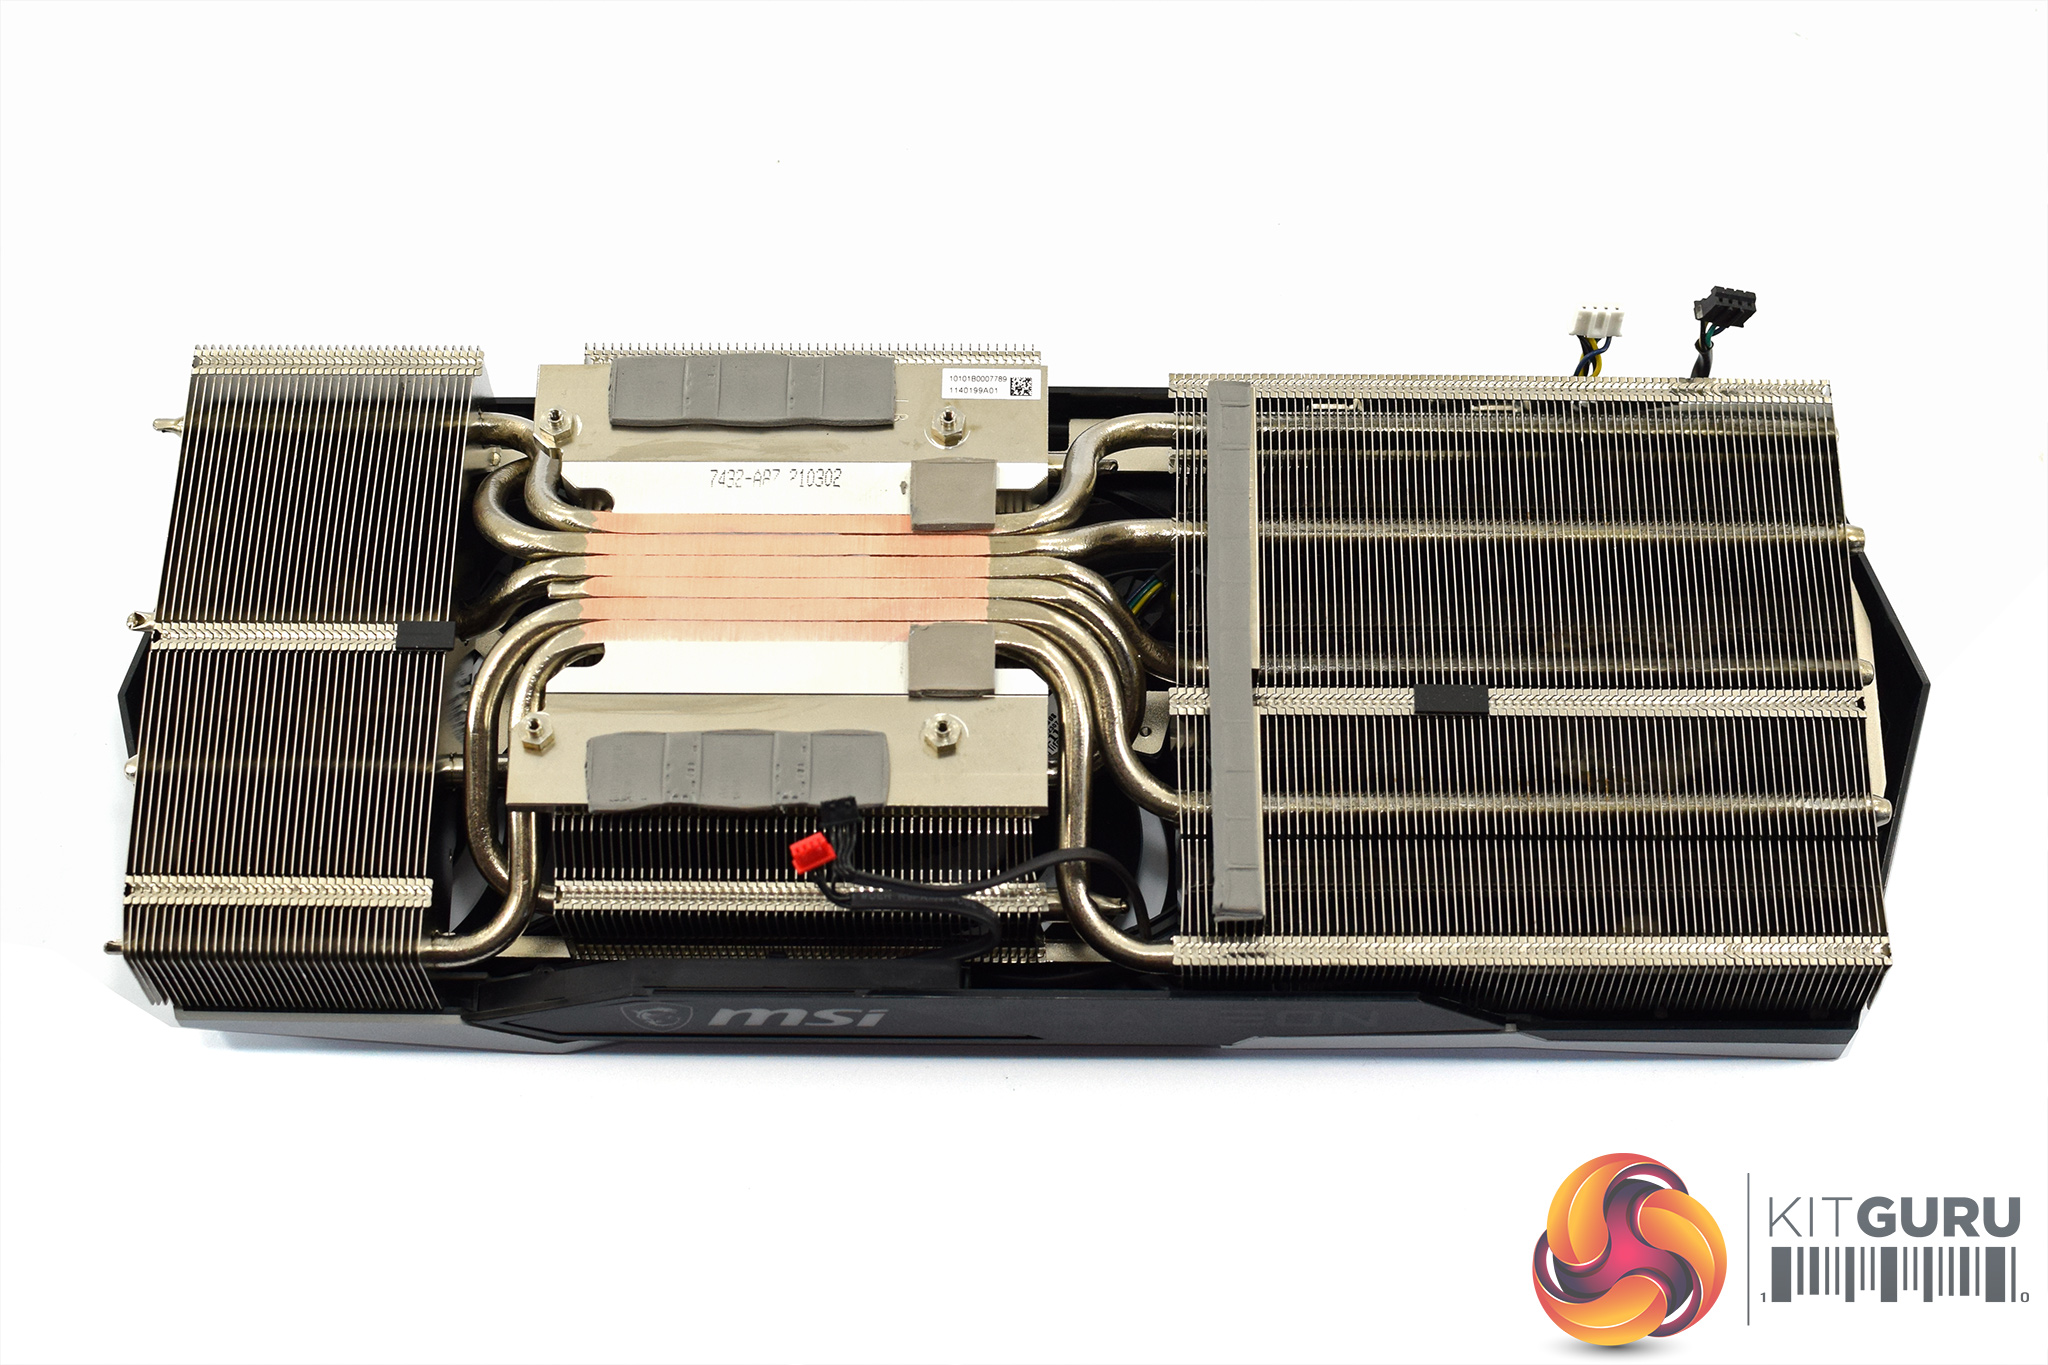
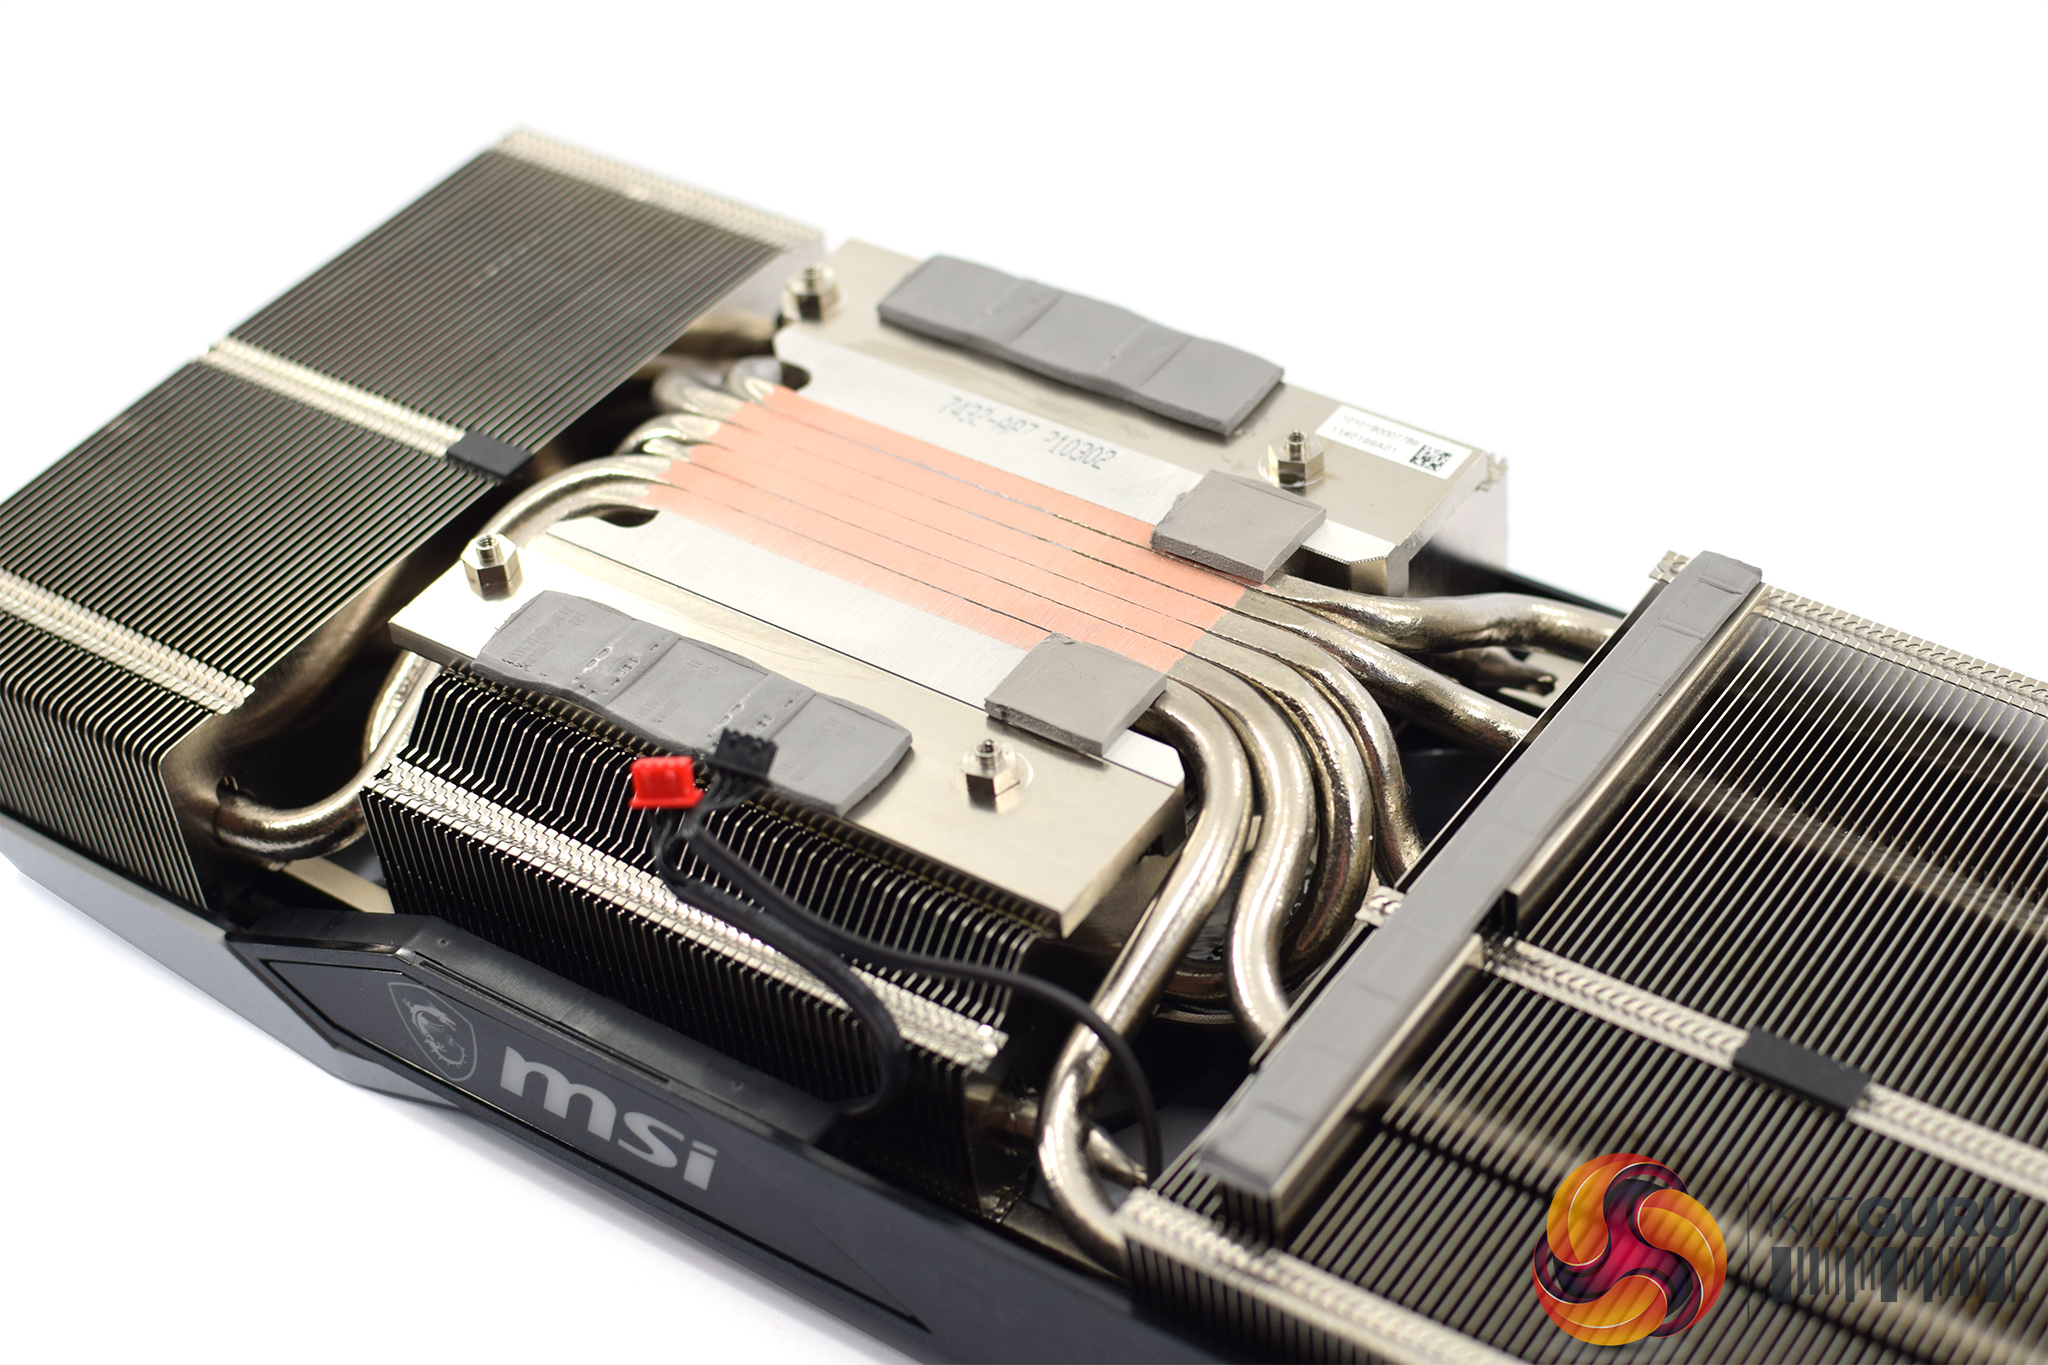
The cooler is comprised of three finstacks, connected by a total of 6x 6mm heatpipes. These heatpipes make direct contact with the GPU die, while the memory contacts with the surrounding baseplate via thermal pads.
Driver Notes
- All Nvidia GPUs (except RTX 3060 Ti) were benchmarked with the 457.09 driver.
- RTX 3060 Ti was benchmarked with the 457.40 driver supplied to press.
- All AMD GPUs (except RX 6000) were benchmarked with the Adrenalin 20.11.1 driver.
- RX 6800 and RX 6800 XT were benchmarked with the Adrenalin 20.45.12.1 driver supplied to press.
- RX 6900 XT was benchmarked with the Adrenalin 20.45.01.14 driver supplied to press.
We did all of our game testing using Toxic Boost, the one-click overclock built into TriXX. We test Toxic Boost alongside the Performance and Quiet BIOS when looking at power, thermals and noise.
Test System
We test using the a custom built system from PCSpecialist, based on Intel’s latest Comet Lake-S platform. You can read more about it over HERE, and configure your own system from PCSpecialist HERE.
| CPU |
Intel Core i9-10900K
Overclocked to 5.1GHz on all cores |
| Motherboard |
ASUS ROG Maximus XII Hero Wi-Fi
|
| Memory |
Corsair Vengeance DDR4 3600MHz (4 X 8GB)
CL 18-22-22-42
|
| Graphics Card |
Varies
|
| System Drive |
500GB Samsung 970 Evo Plus M.2
|
| Games Drive | 2TB Samsung 860 QVO 2.5″ SSD |
| Chassis | Fractal Meshify S2 Blackout Tempered Glass |
| CPU Cooler |
Corsair H115i RGB Platinum Hydro Series
|
| Power Supply |
Corsair 1200W HX Series Modular 80 Plus Platinum
|
| Operating System |
Windows 10 2004
|
Comparison Graphics Cards List
- Gigabyte RTX 3090 Eagle OC 24GB
- Nvidia RTX 3080 FE 10GB
- Nvidia RTX 3070 FE 8GB
- Nvidia RTX 3060 Ti FE 8GB
- Nvidia RTX 2080 Ti FE 11GB
- Nvidia RTX 2080 Super FE 8GB
- Nvidia RTX 2080 FE 8GB
- Nvidia RTX 2070 Super FE 8GB
- Nvidia RTX 2060 Super FE 8GB
- AMD Radeon VII 16GB
- AMD RX 6900 XT 16GB
- Gigabyte RX 6900 XT Gaming OC 16GB
- Sapphire RX 6900 XT Toxic 16GB
- AMD RX 6800 XT 16GB
- AMD RX 6800 16GB
- AMD RX 5700 XT 8GB
- AMD RX Vega 64 8GB
Software and Games List
- 3DMark Fire Strike & Fire Strike Ultra (DX11 Synthetic)
- 3DMark Time Spy (DX12 Synthetic)
- 3DMark Raytracing Feature Test (DXR Synthetic)
- Borderlands 3 (DX12)
- Control (DX12)
- Death Stranding (DX12)
- The Division 2 (DX12)
- F1 2020 (DX12)
- Far Cry New Dawn (DX11)
- Gears 5 (DX12)
- Ghost Recon: Breakpoint (Vulkan)
- Metro: Exodus (DX12)
- Middle Earth: Shadow of War (DX11)
- Red Dead Redemption 2 (Vulkan)
- Shadow of the Tomb Raider (DX12)
- Total War Saga: Troy (DX11)
- Watch Dogs: Legion (DX12)
We run each benchmark/game three times, and present mean averages in our graphs. We use OCAT to measure average frame rates as well as 1% low values across our three runs.
Fire Strike is a showcase DirectX 11 benchmark for modern gaming PCs. Its ambitious real-time graphics are rendered with detail and complexity far beyond other DirectX 11 benchmarks and games. Fire Strike includes two graphics tests, a physics test and a combined test that stresses the CPU and GPU. (UL).
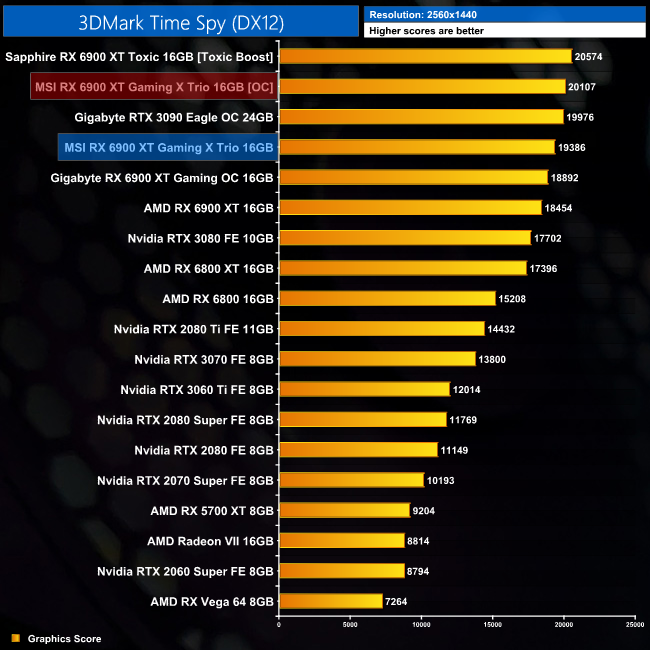
3DMark Time Spy is a DirectX 12 benchmark test for Windows 10 gaming PCs. Time Spy is one of the first DirectX 12 apps to be built the right way from the ground up to fully realize the performance gains that the new API offers. With its pure DirectX 12 engine, which supports new API features like asynchronous compute, explicit multi-adapter, and multi-threading, Time Spy is the ideal test for benchmarking the latest graphics cards. (UL).
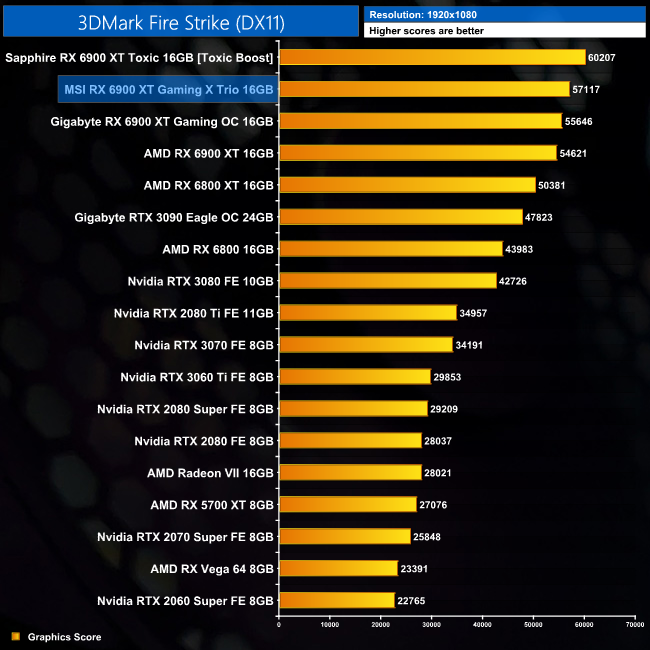
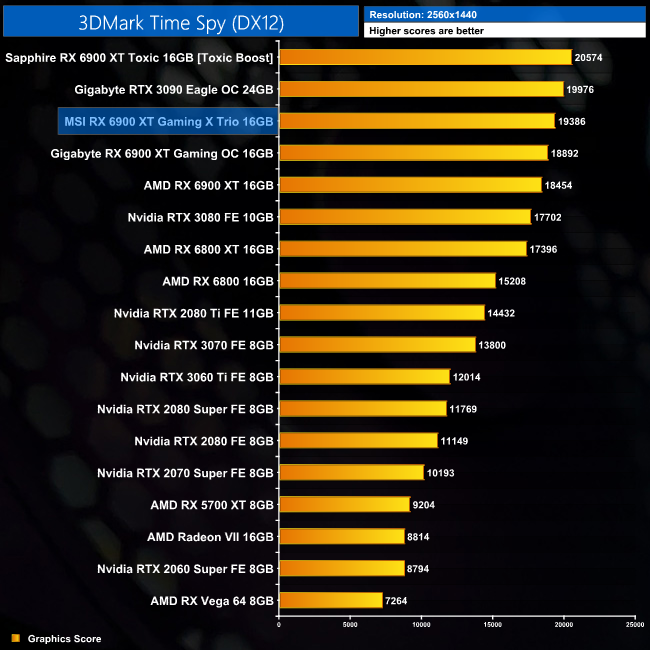
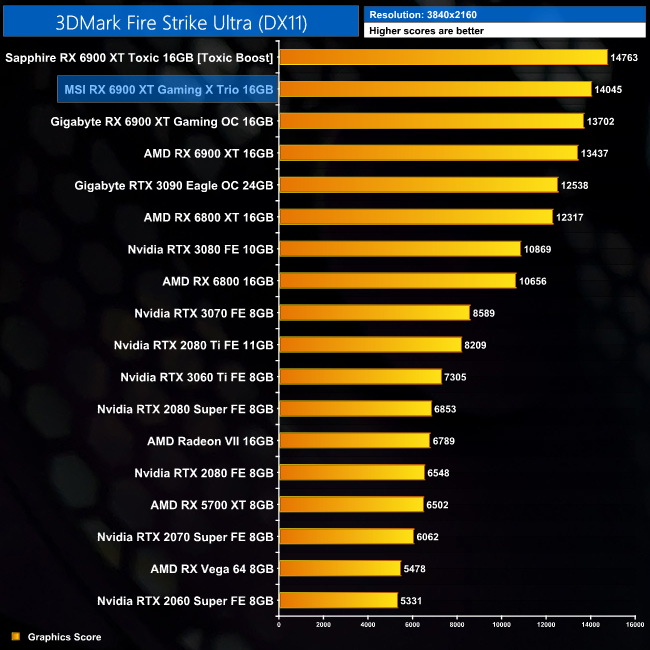
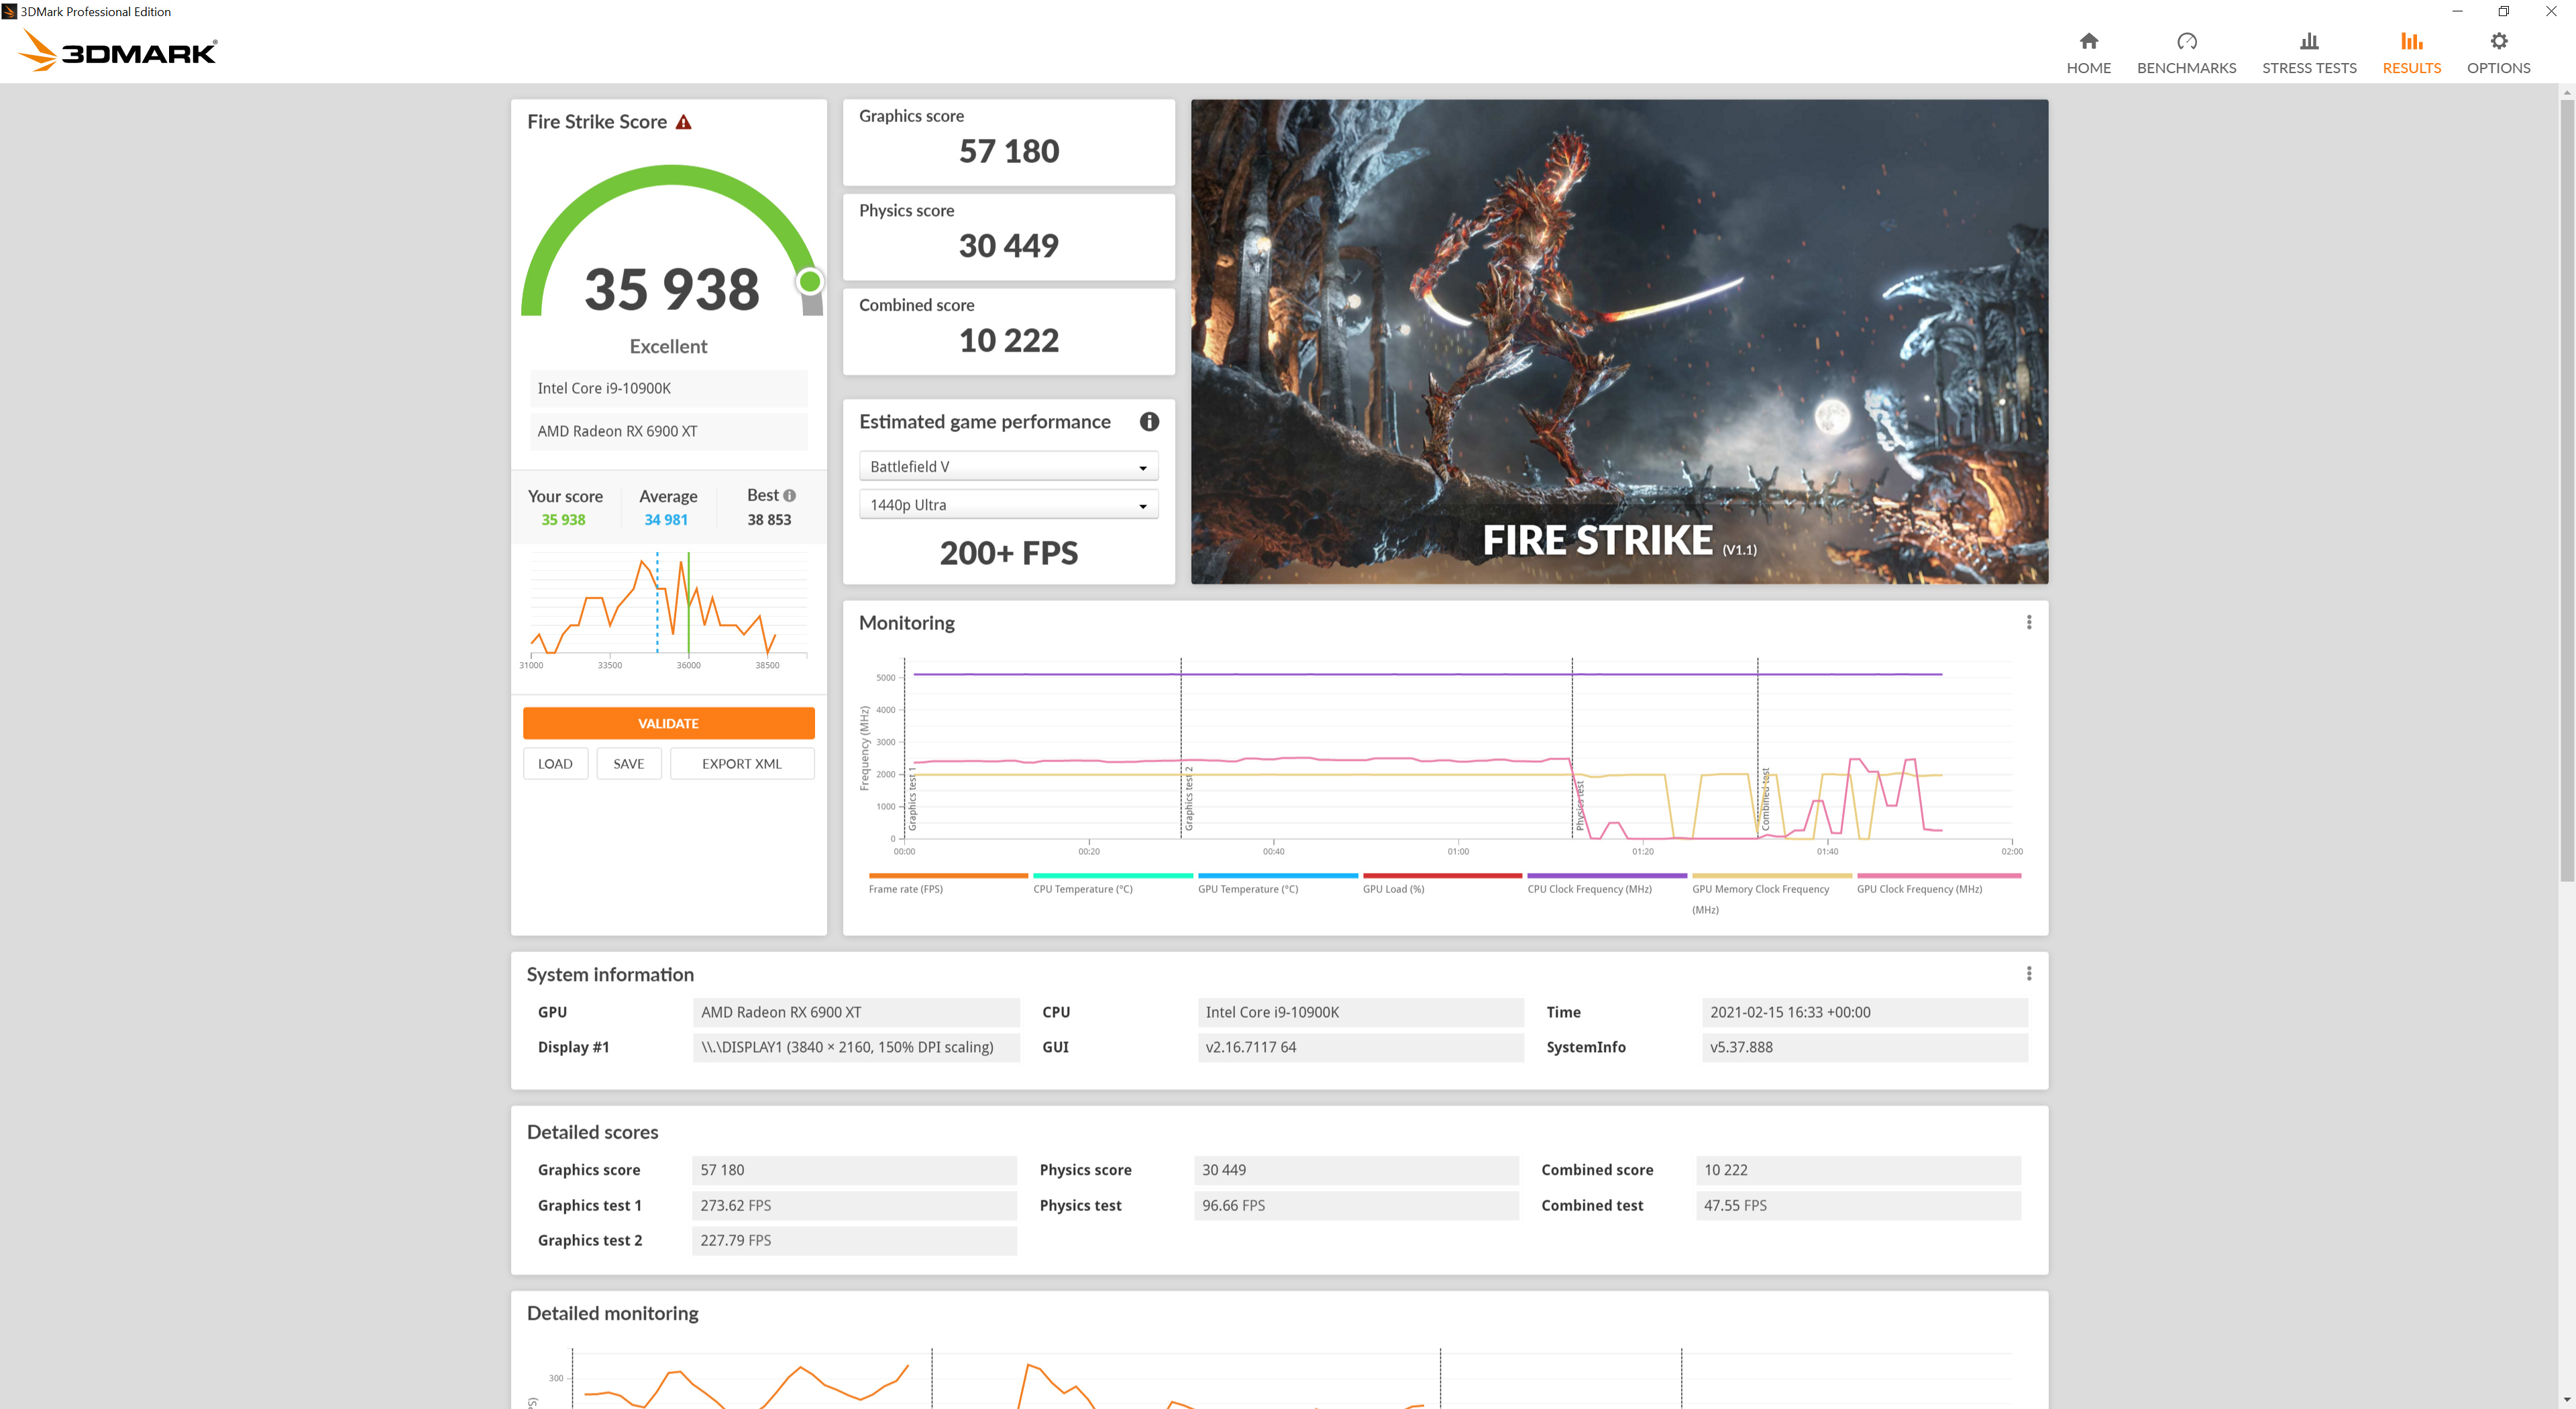
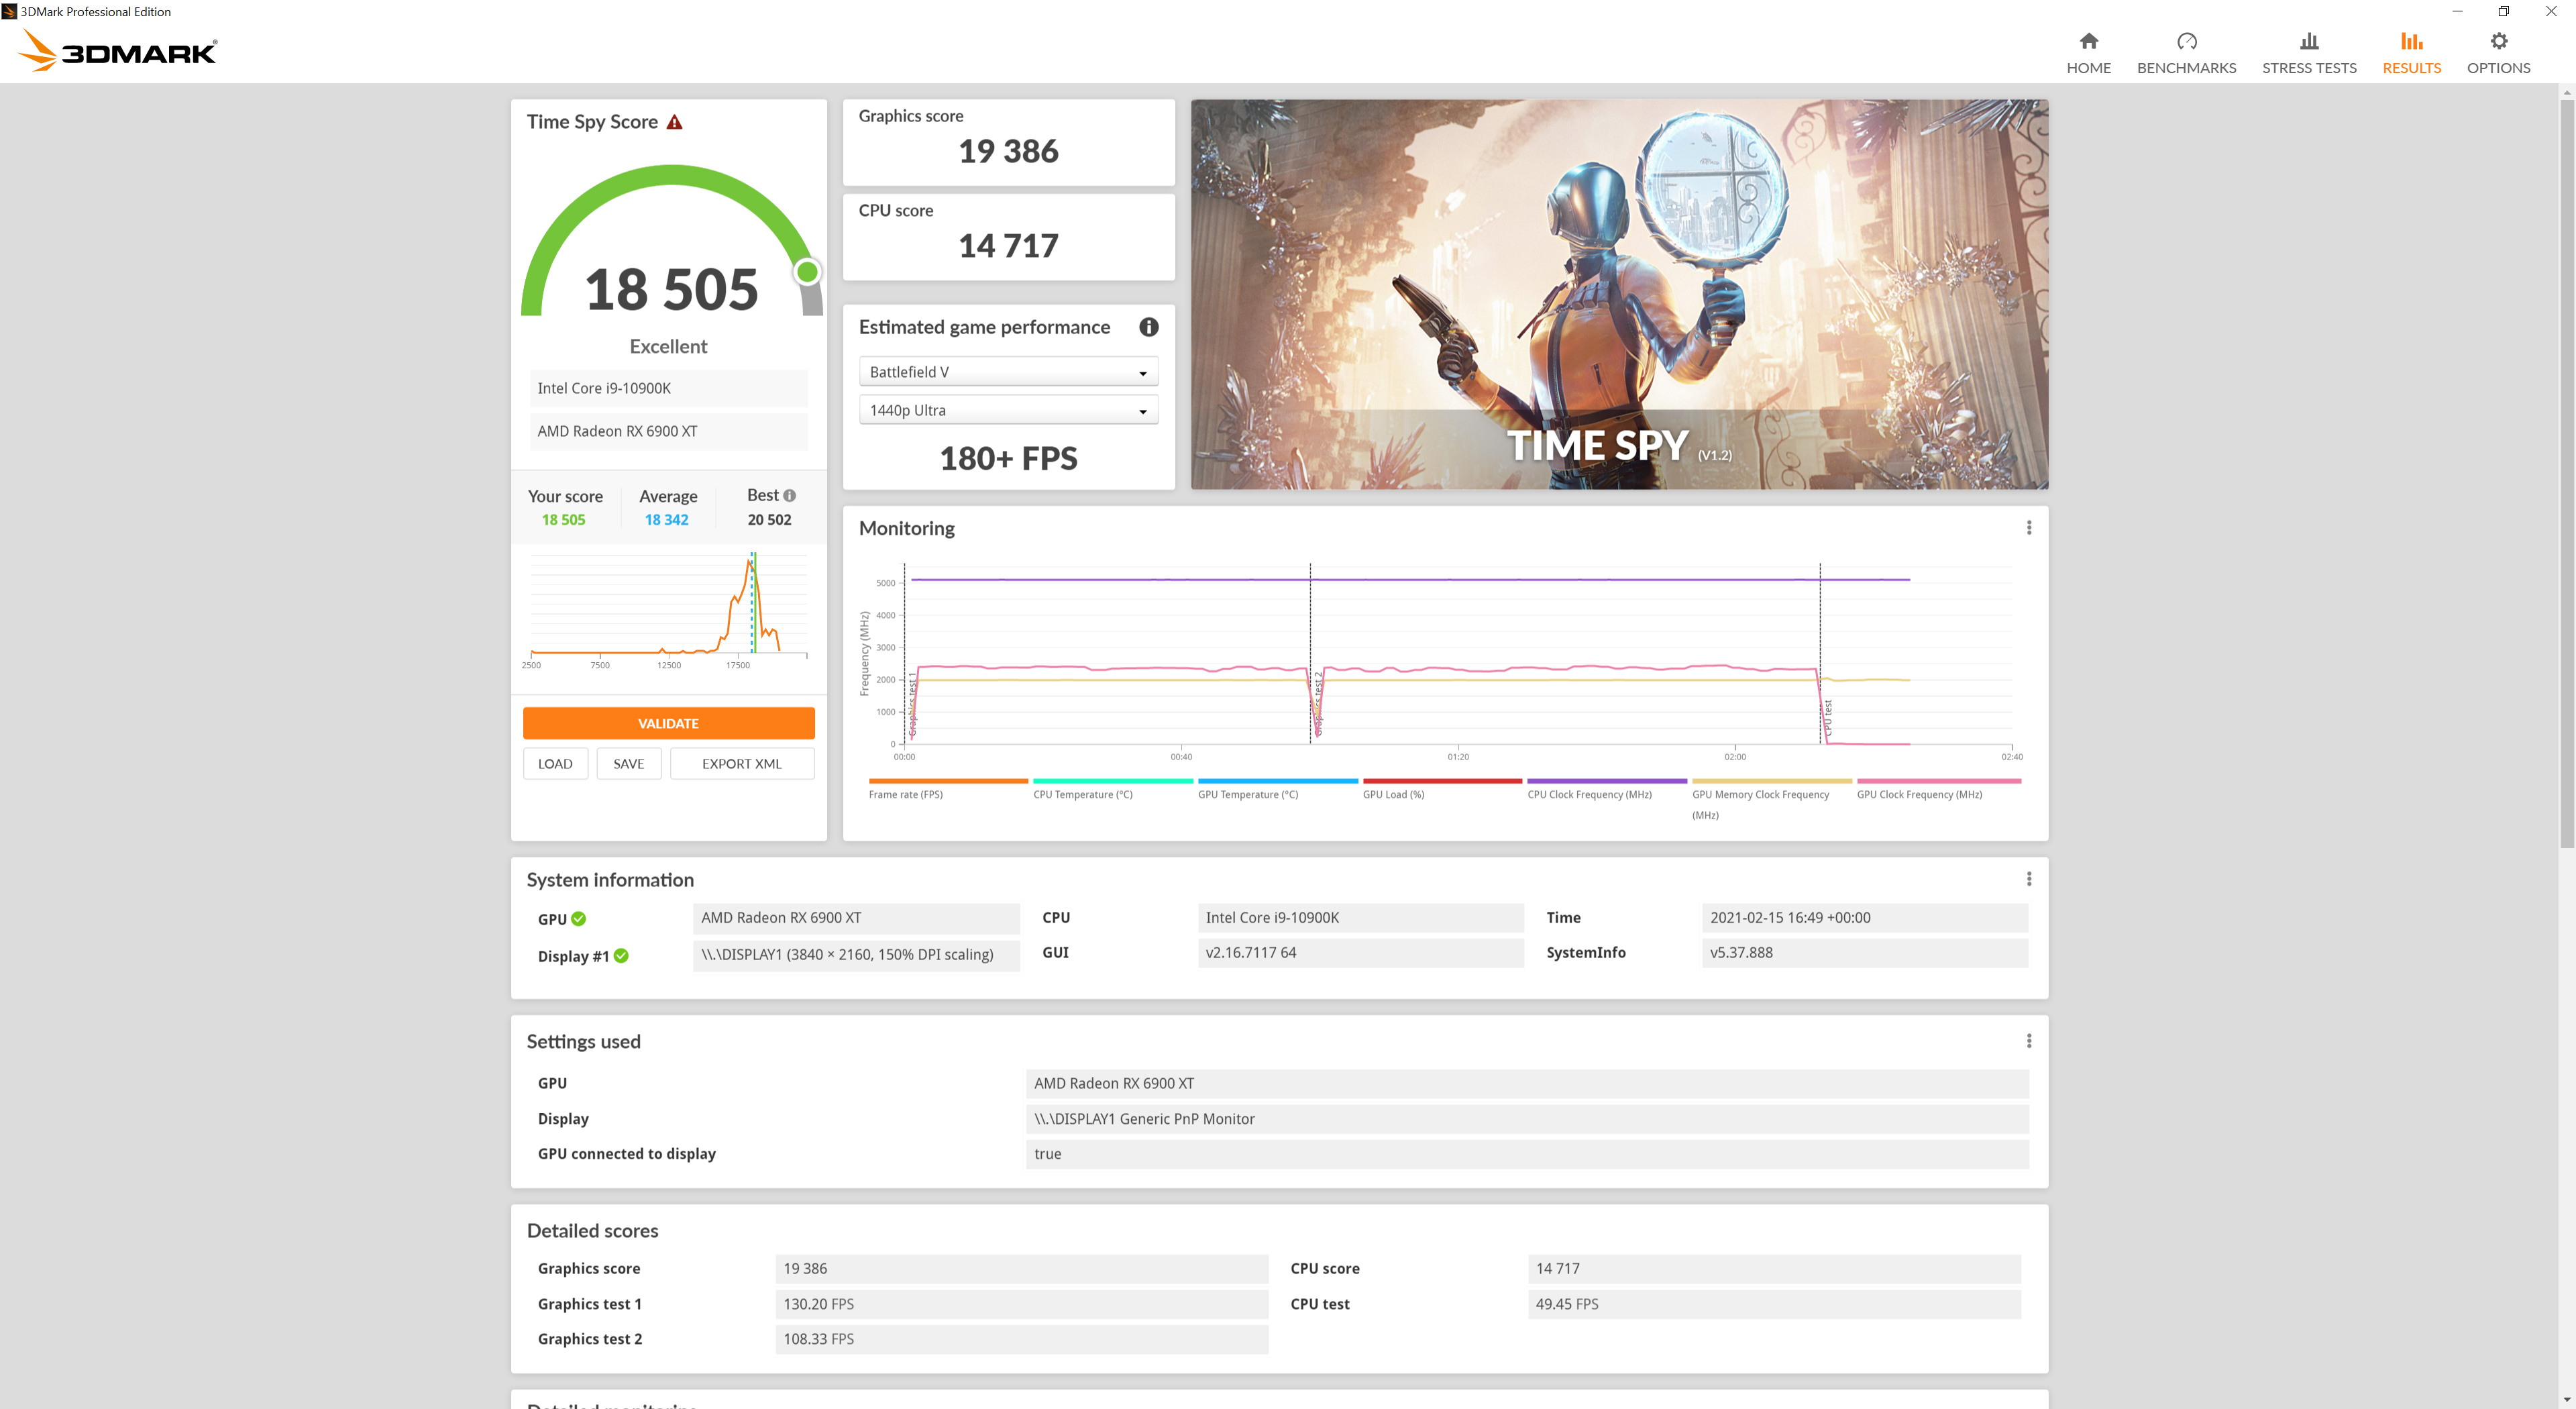
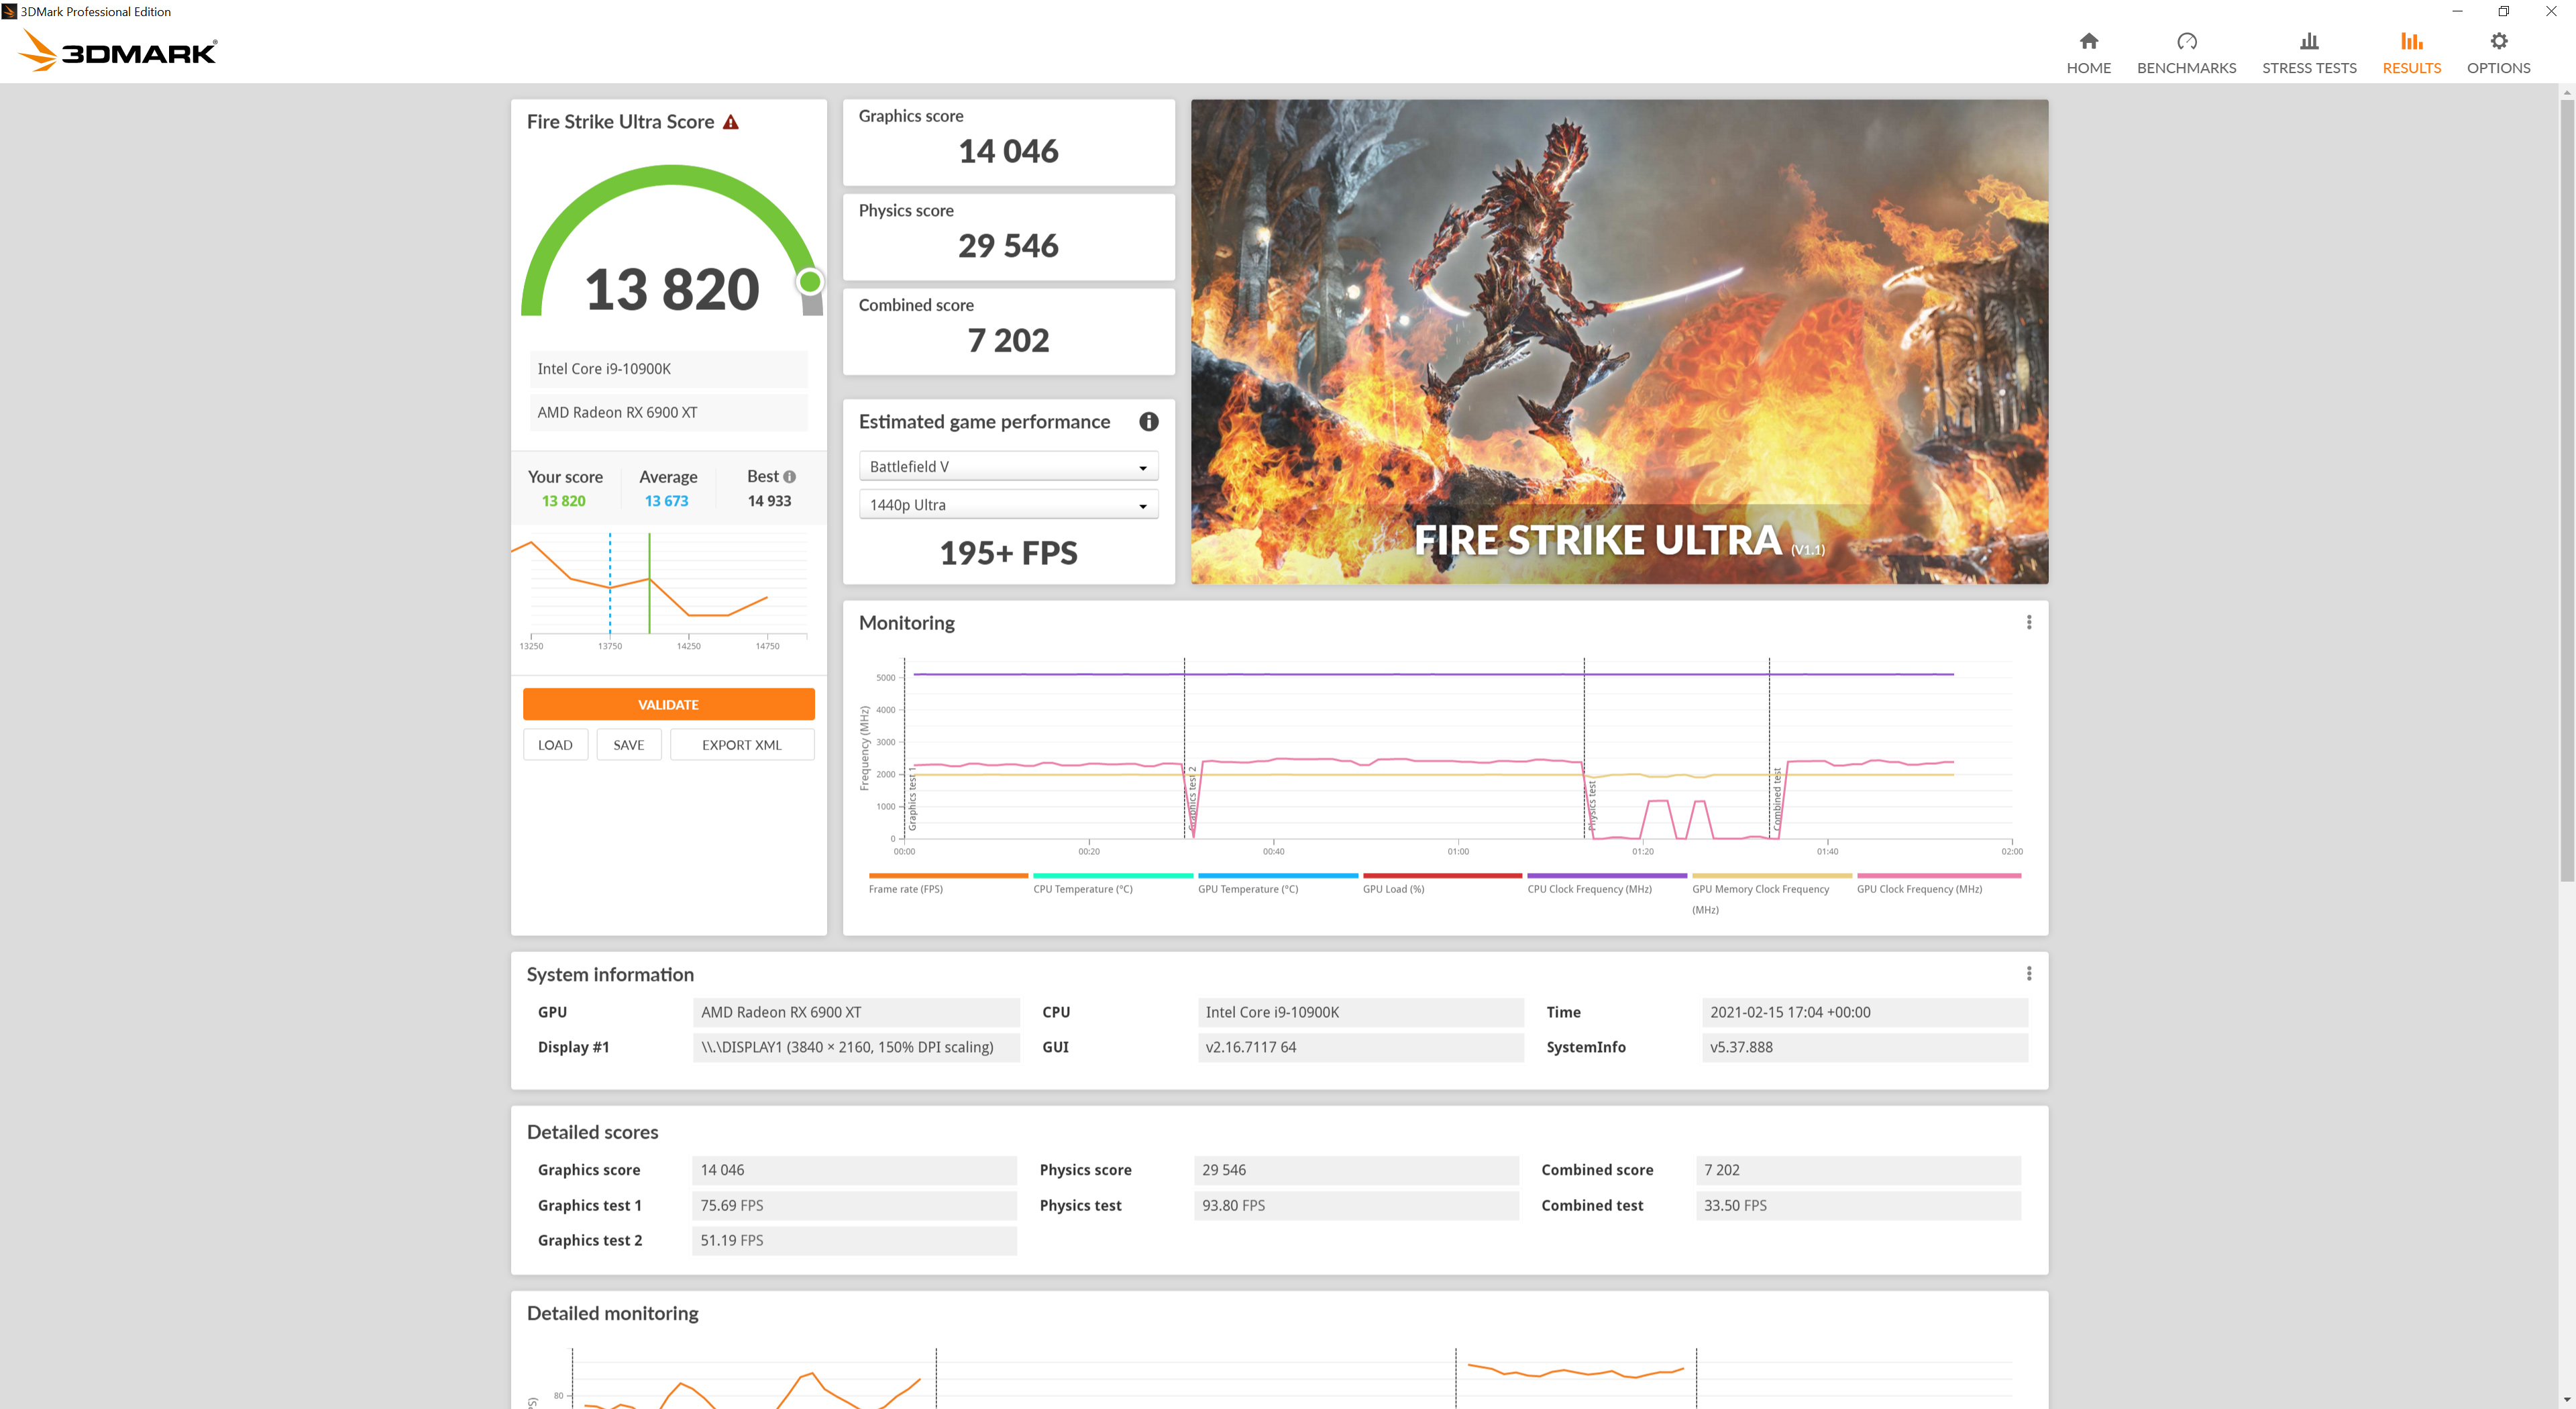
Starting off with 3DMark, we can see some decent results from the Gaming X Trio. Across all three tests, it is 5% faster than the reference card, and only 3% slower than RTX 3090 in Time Spy.
Real-time ray tracing is incredibly demanding. The latest graphics cards have dedicated hardware that’s optimized for ray-tracing. The 3DMark DirectX Raytracing feature test measures the performance of this dedicated hardware. Instead of using traditional rendering techniques, the whole scene is ray-traced and drawn in one pass. The result of the test depends entirely on ray-tracing performance. (UL).
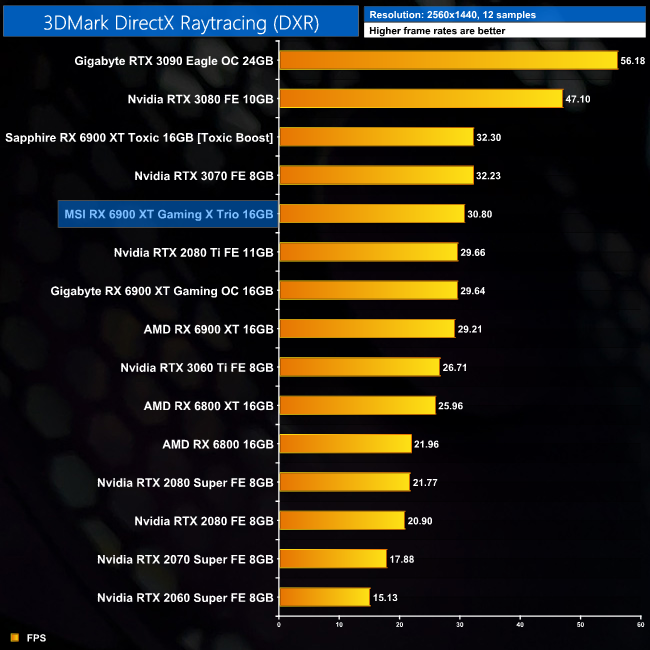
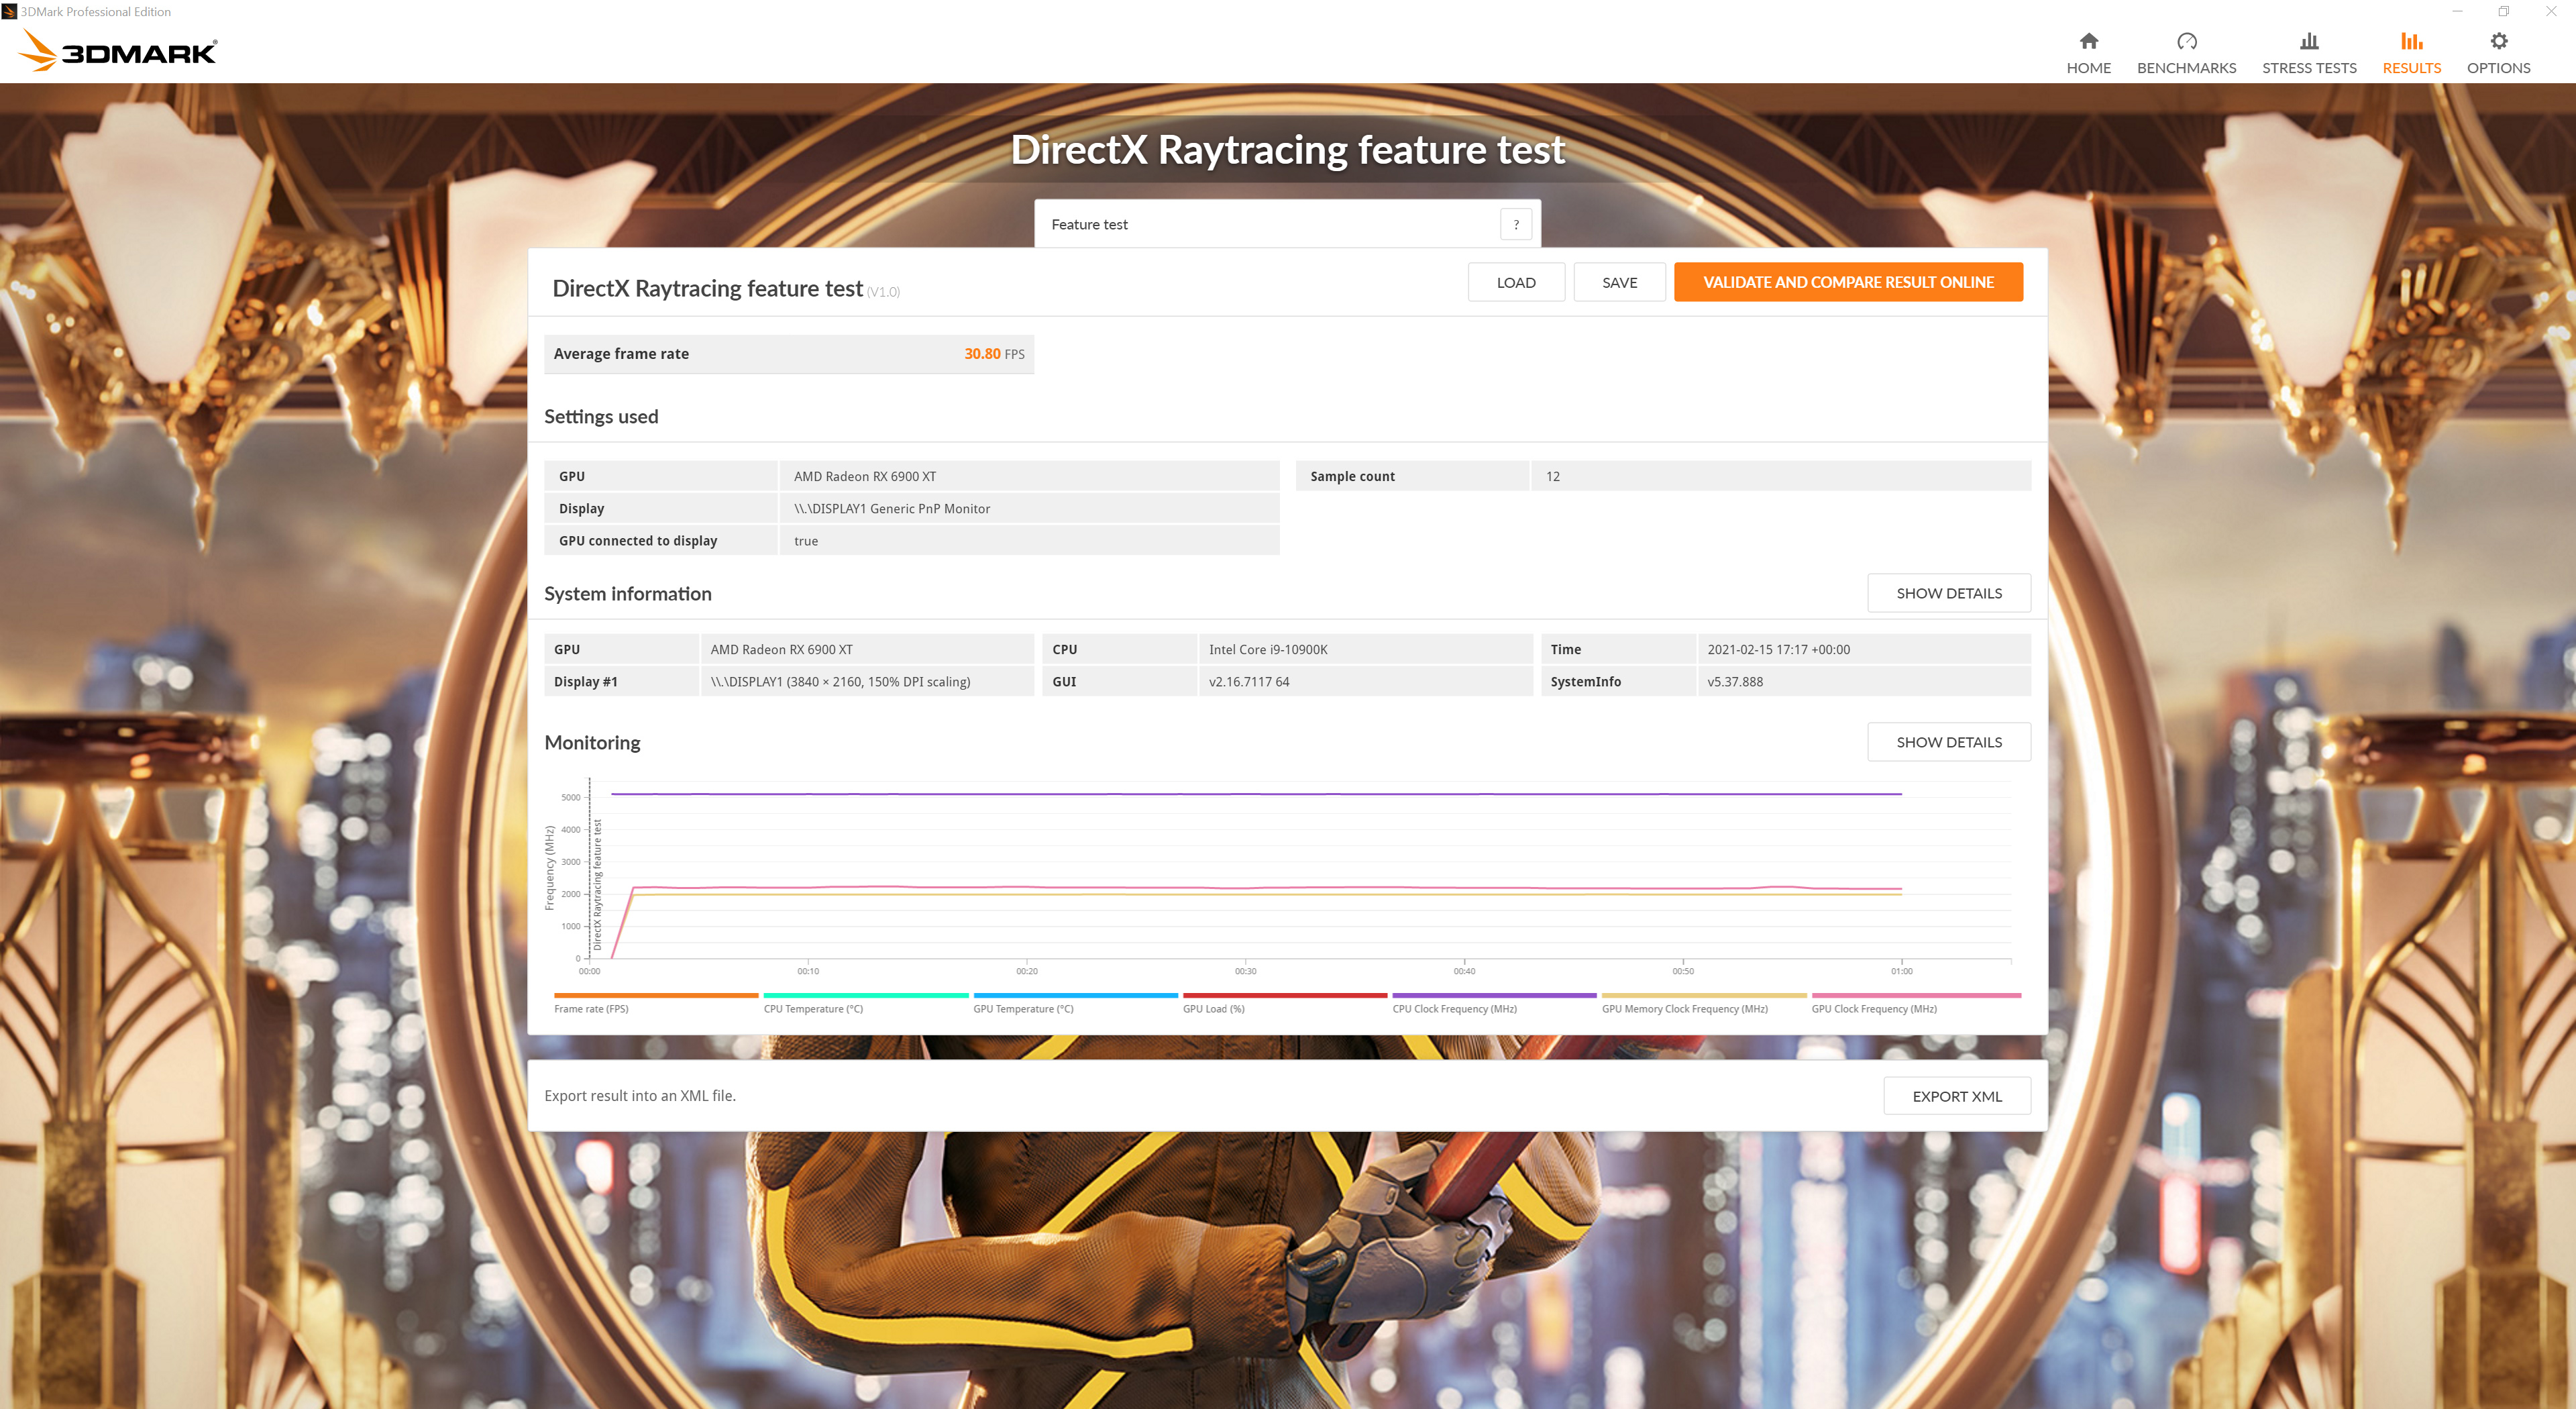
In the DXR feature test, AMD cards do suffer compared to the Nvidia competition. Here, the Gaming X Trio is still 5% faster than reference, but 45% slower than RTX 3090.
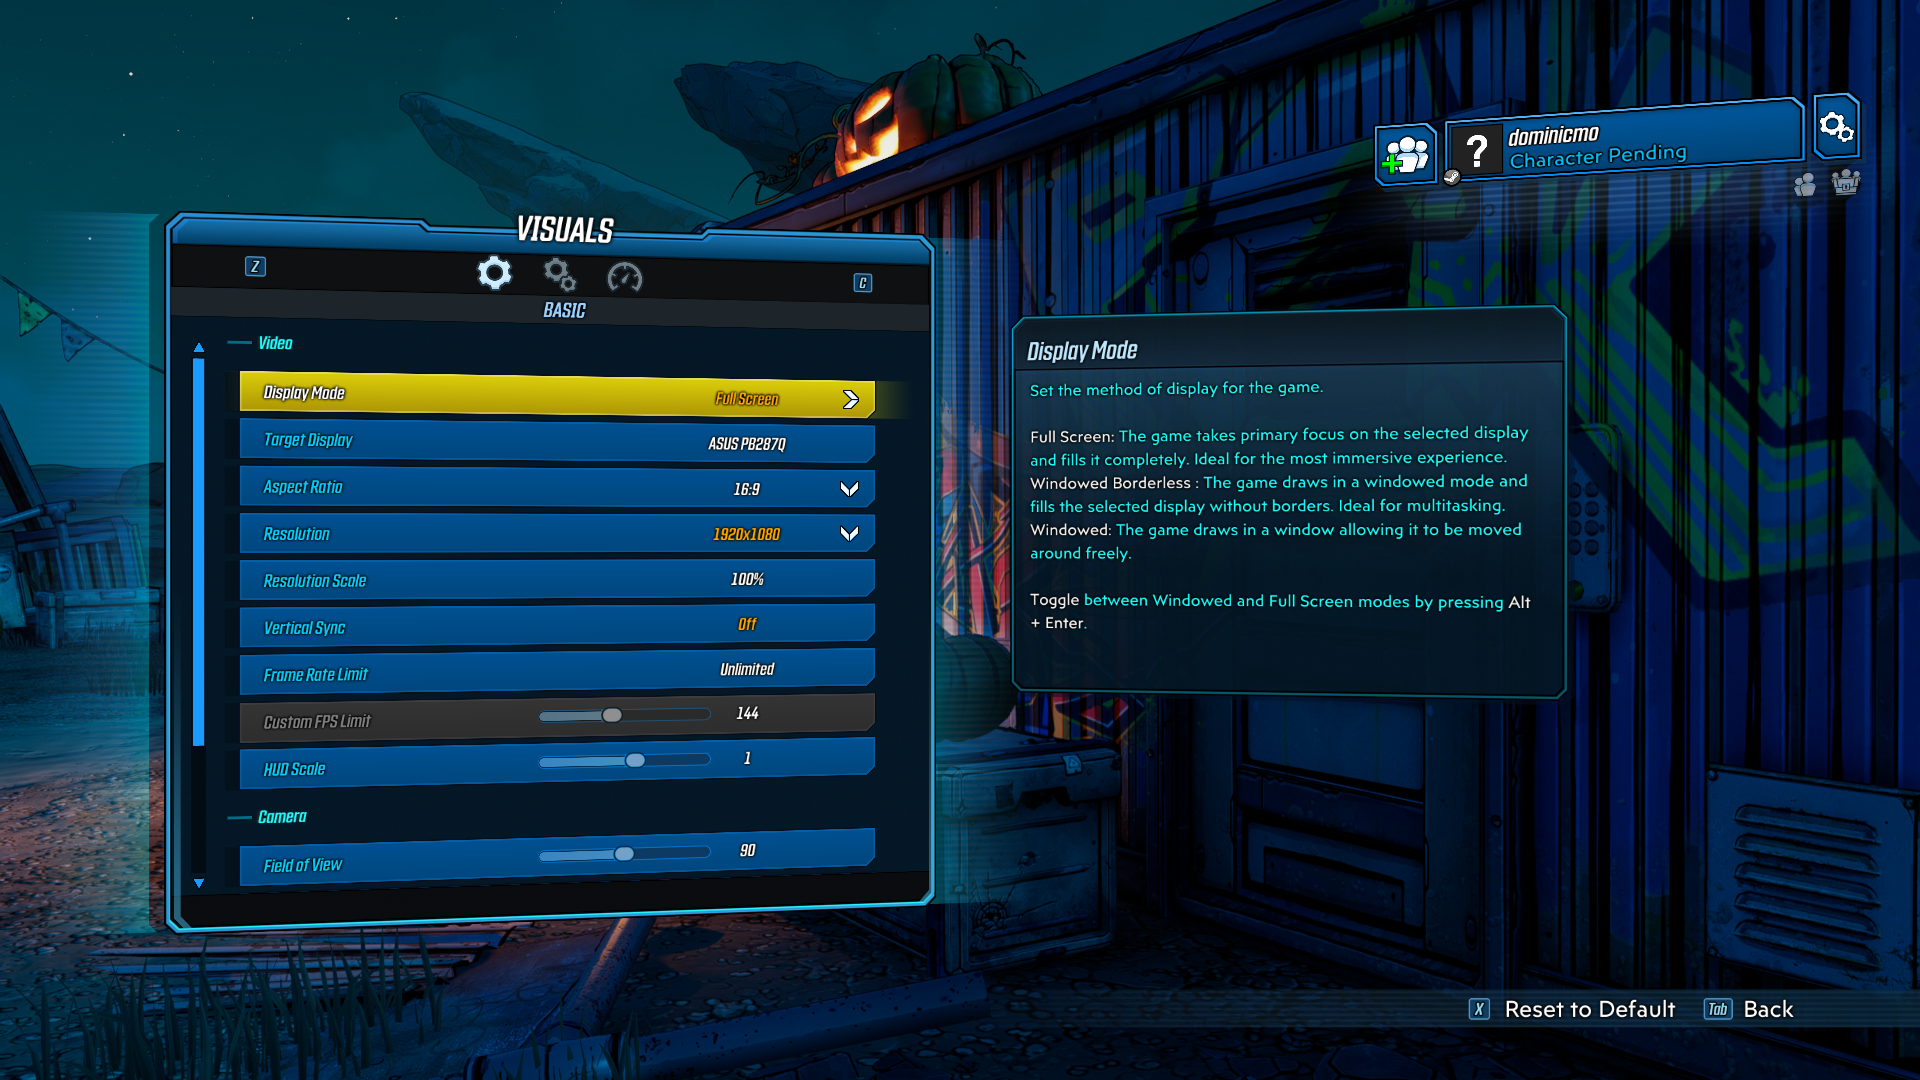
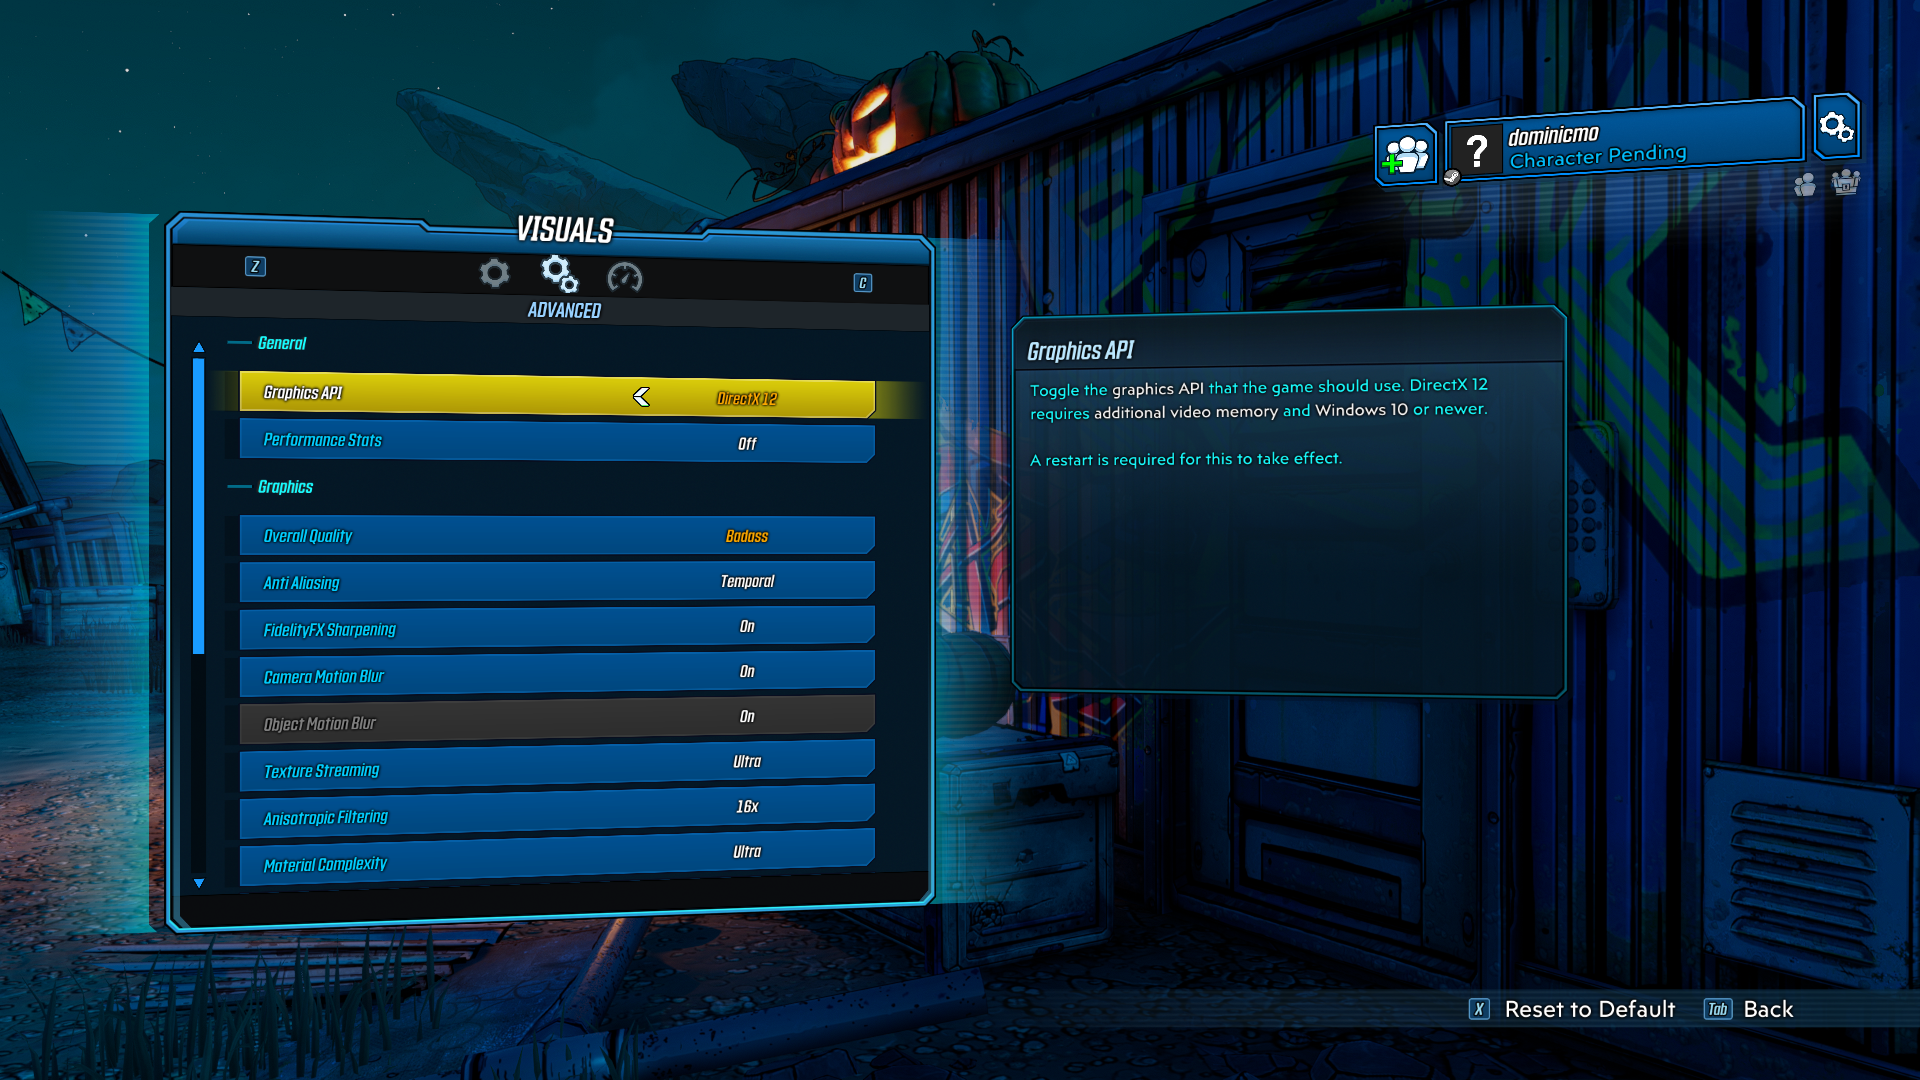
Borderlands 3 is an action role-playing first-person shooter video game developed by Gearbox Software and published by 2K Games. It is a sequel to 2012's Borderlands 2, and the fourth entry in the main Borderlands series. Borderlands 3 was released on 13 September 2019 for Microsoft Windows, PlayStation 4, Xbox One. (Wikipedia).
Engine: Unreal Engine 4. We test using the Badass preset, DX12 API.
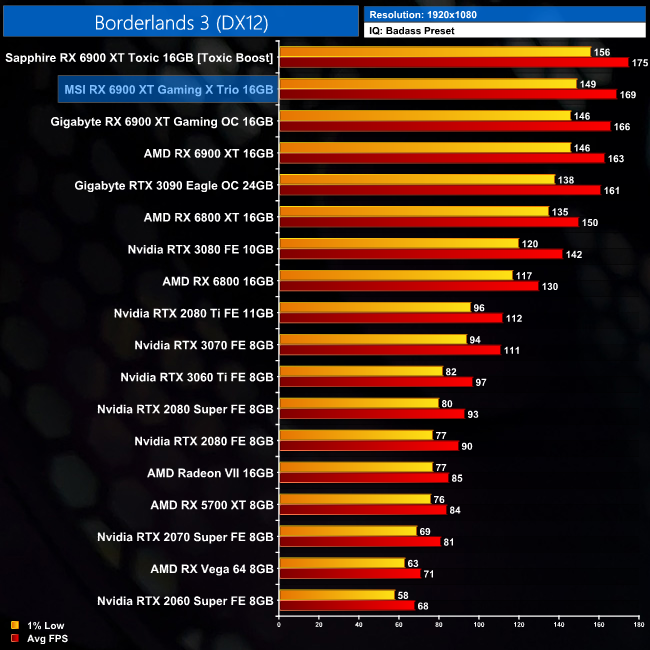
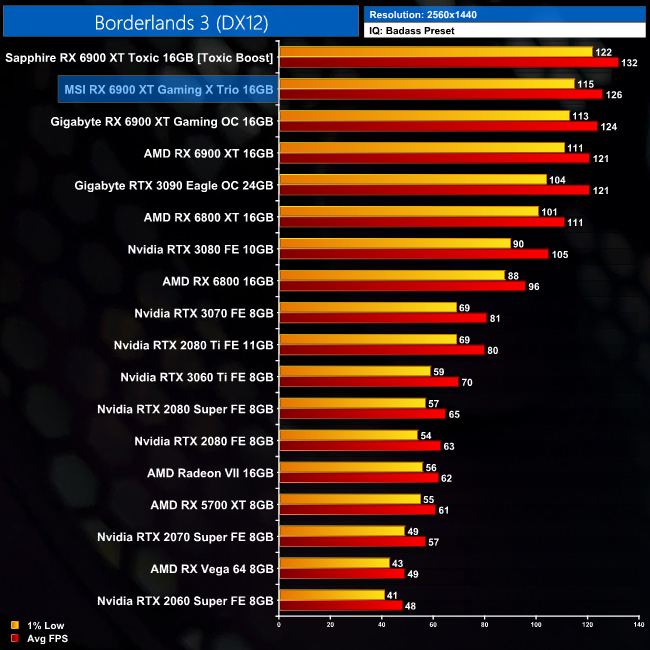
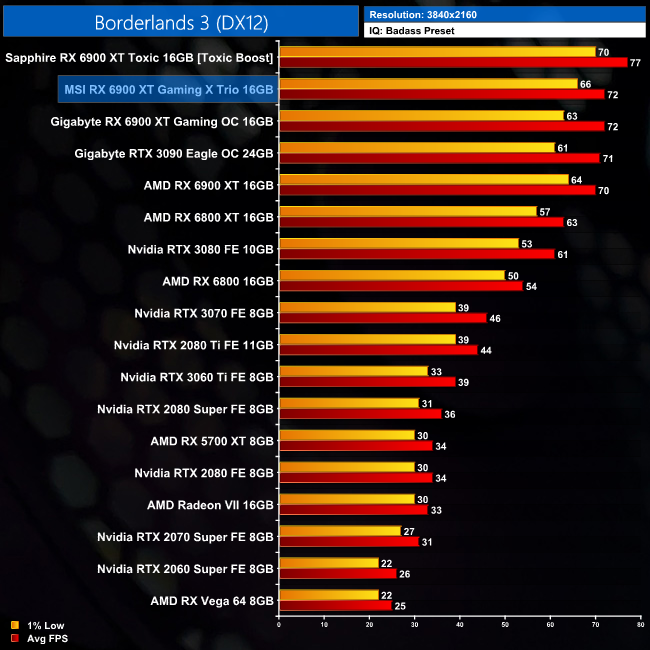
Borderlands 3 is an AMD-sponsored game, and here we see the Gaming X Trio pull a single frame ahead of the RTX 3090 at 4K. It is 3% faster than the reference 6900 XT at that same resolution.Control is an action-adventure video game developed by Remedy Entertainment and published by 505 Games. Control was released on 27 August 2019 for Microsoft Windows, PlayStation 4, and Xbox One. (Wikipedia).
Engine: Northlight Engine. We test using the High preset, with 4x MSAA, DX12 API.
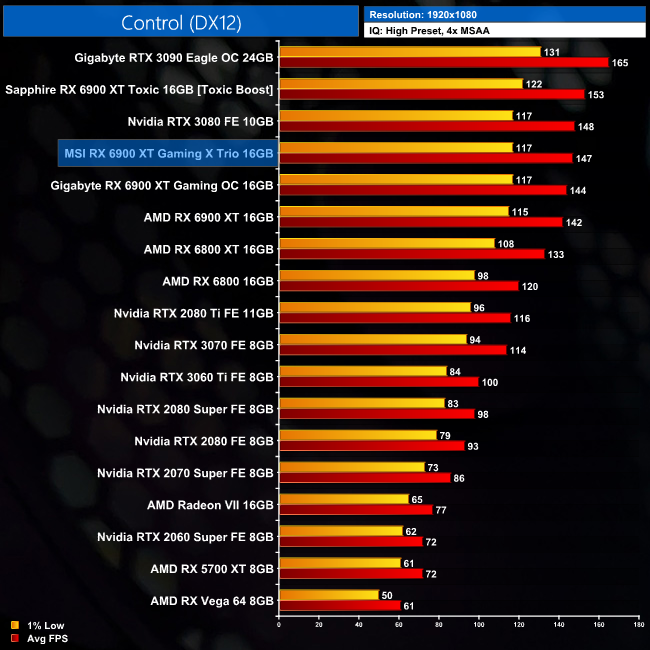
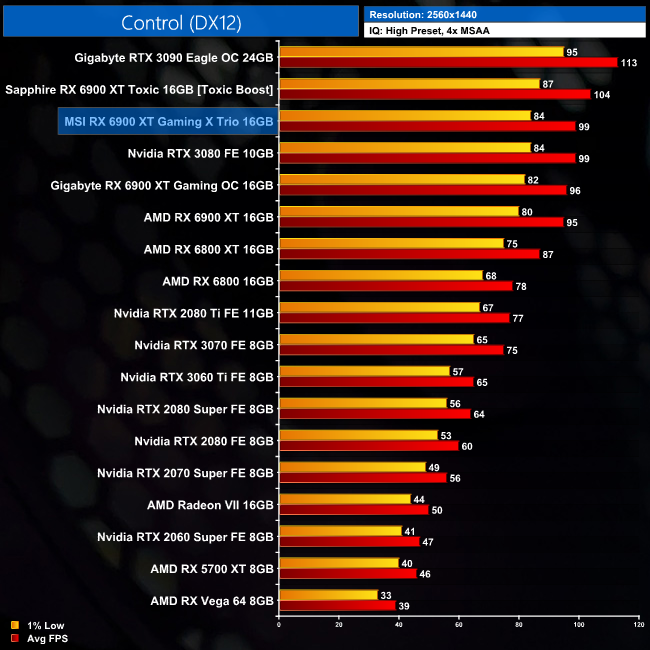
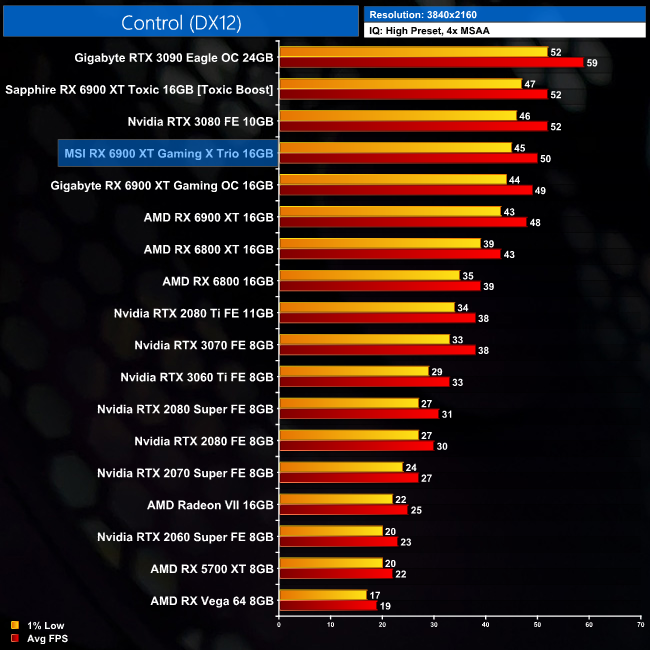
Control shows remarkably consistent scaling for the Gaming X Trio, as it is 4% faster than the reference design at every resolution we tested. It does fall away at 4K compared to the RTX 3090, as it is 15% slower there, compared to an 11% deficit at 1080p.
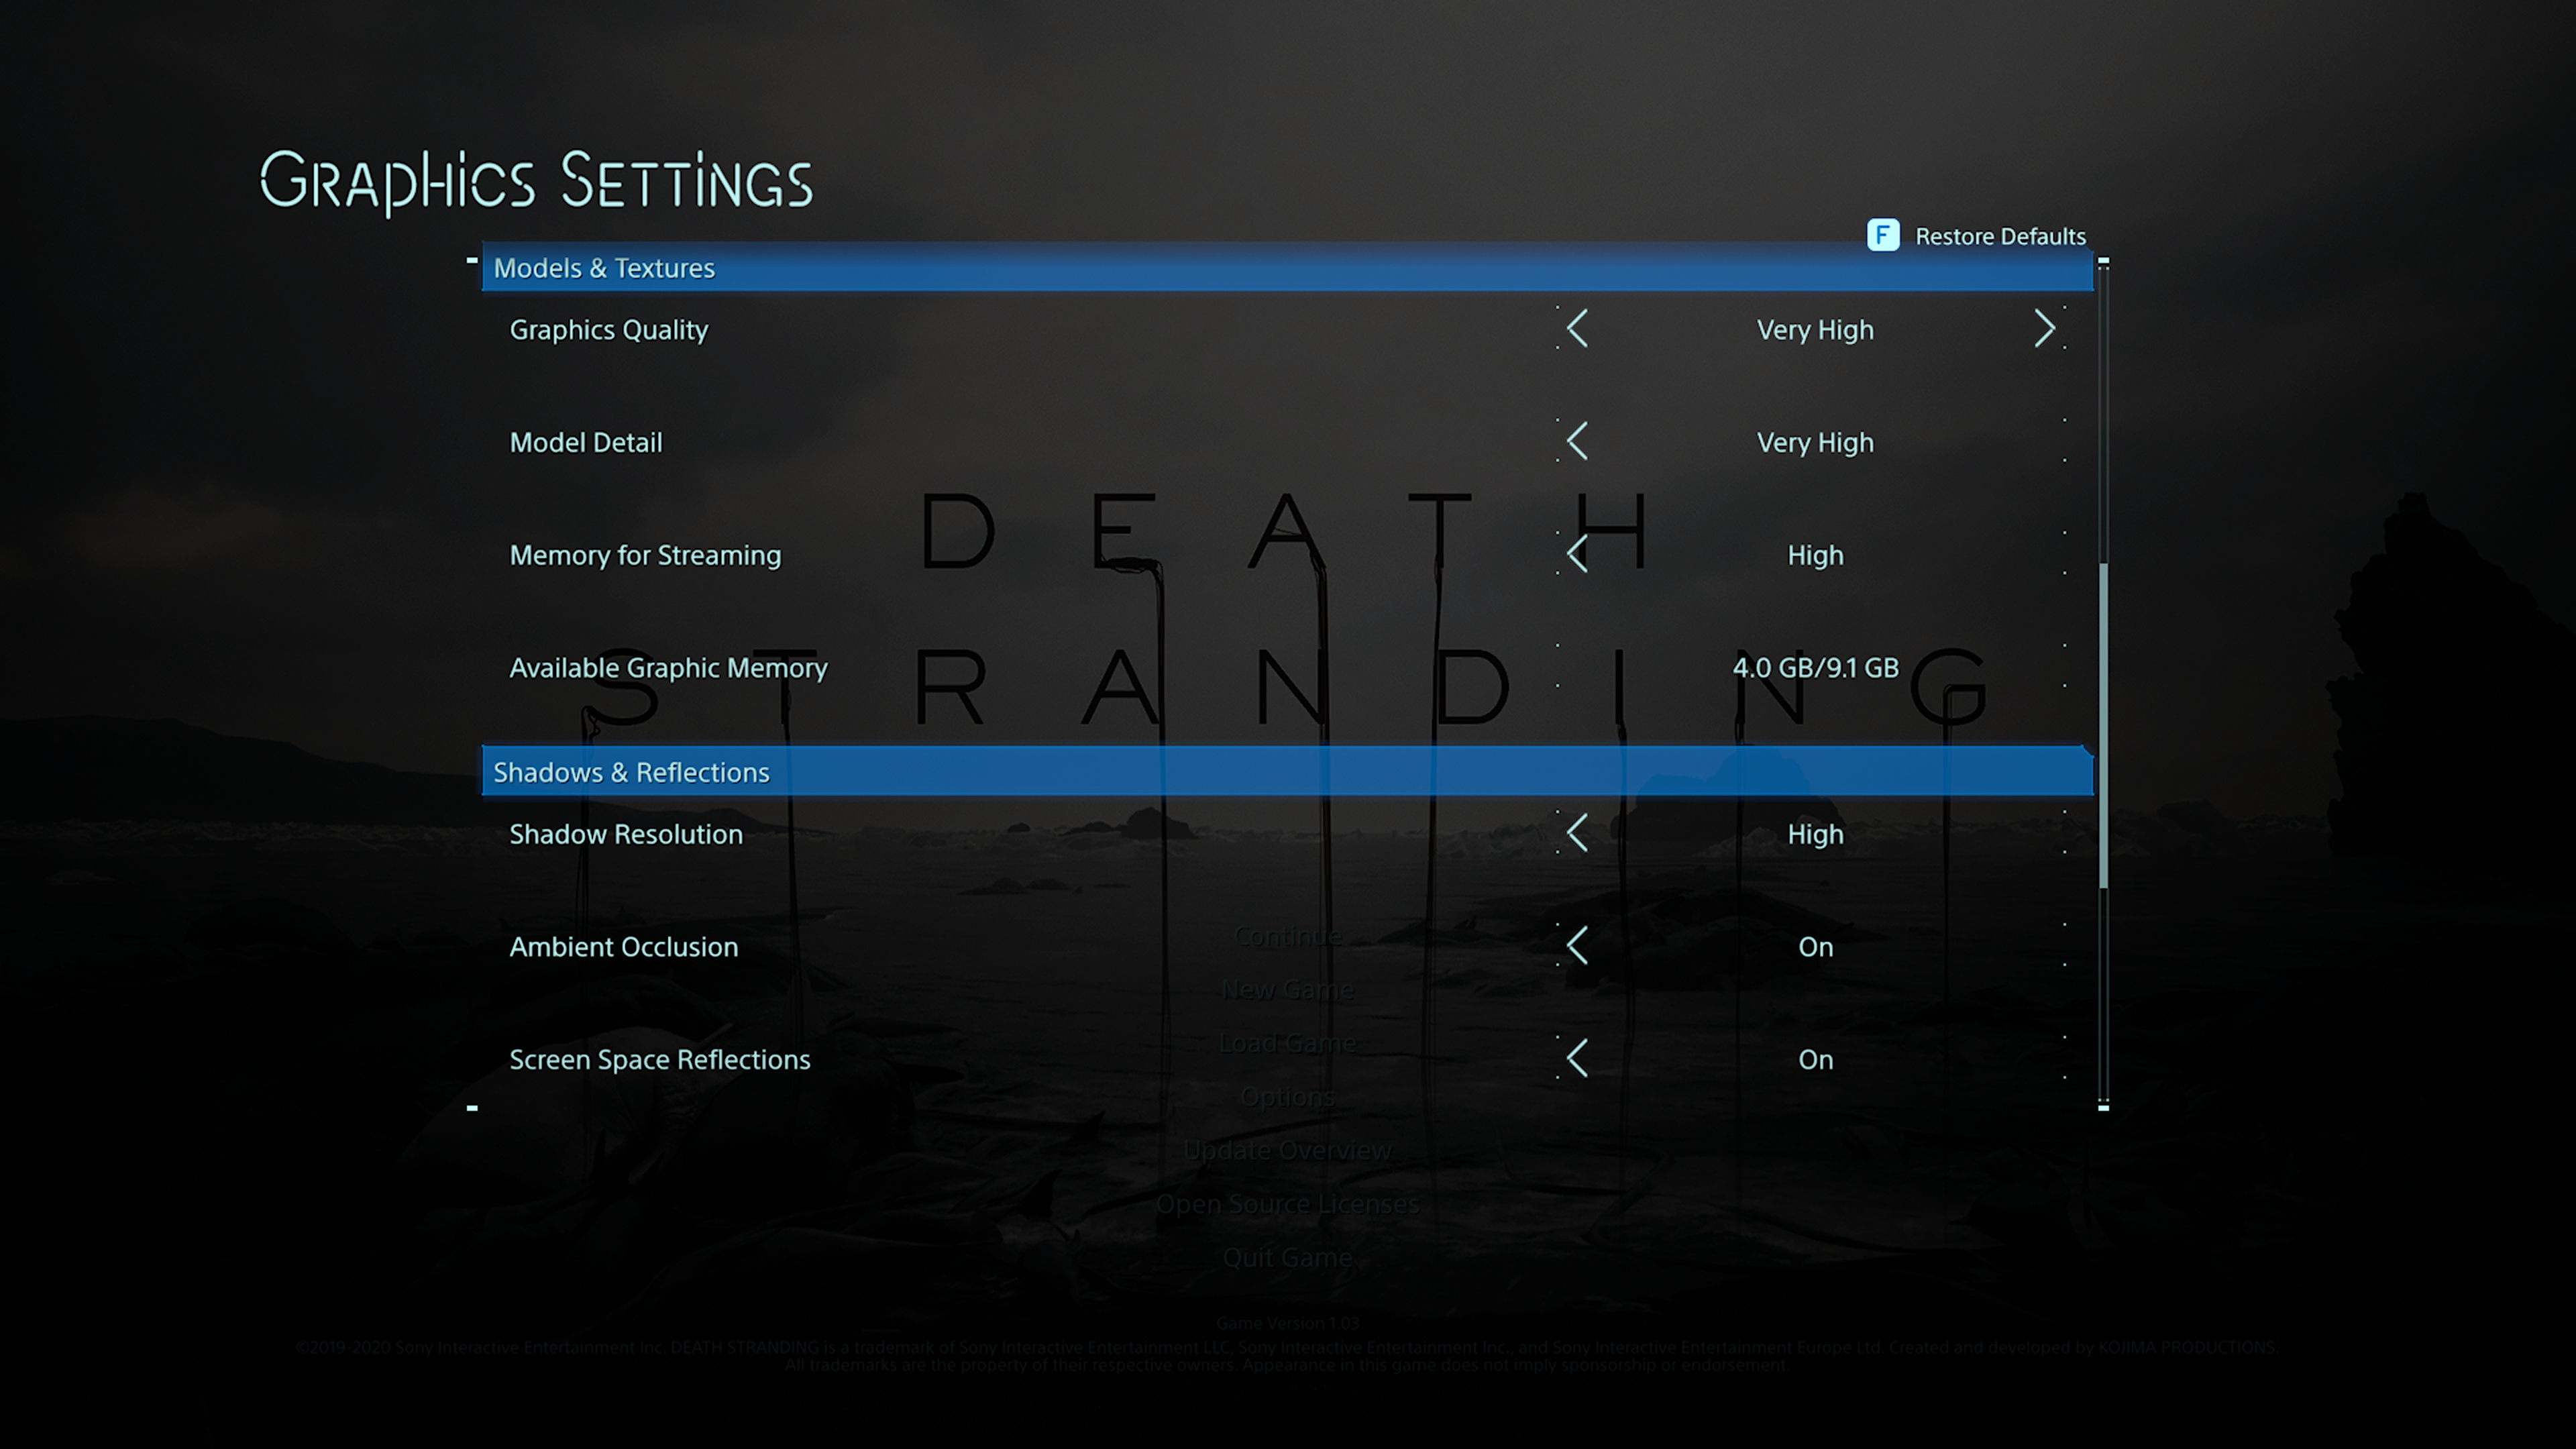
Death Stranding is an action game developed by Kojima Productions. It is the first game from director Hideo Kojima and Kojima Productions after their split from Konami in 2015. It was released by Sony Interactive Entertainment for the PlayStation 4 in November 2019 and by 505 Games for Windows in July 2020. (Wikipedia).
Engine: Decima. We test using the Very High preset, with TAA, DX12 API.
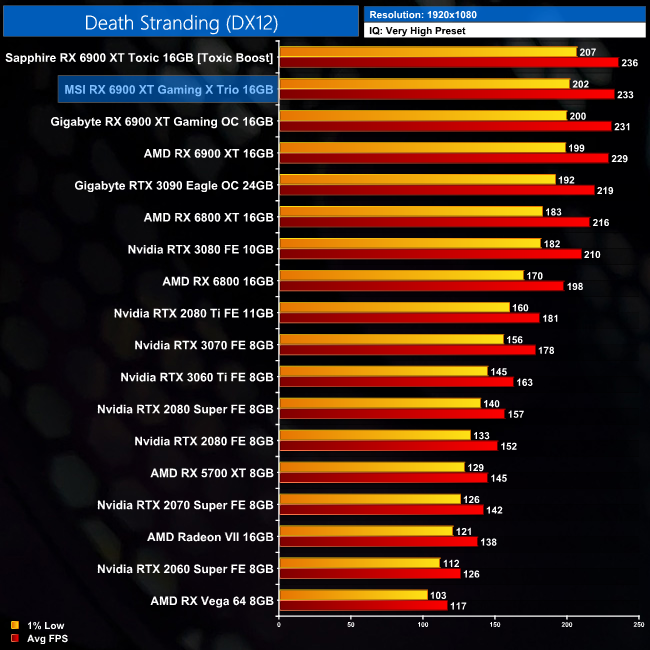
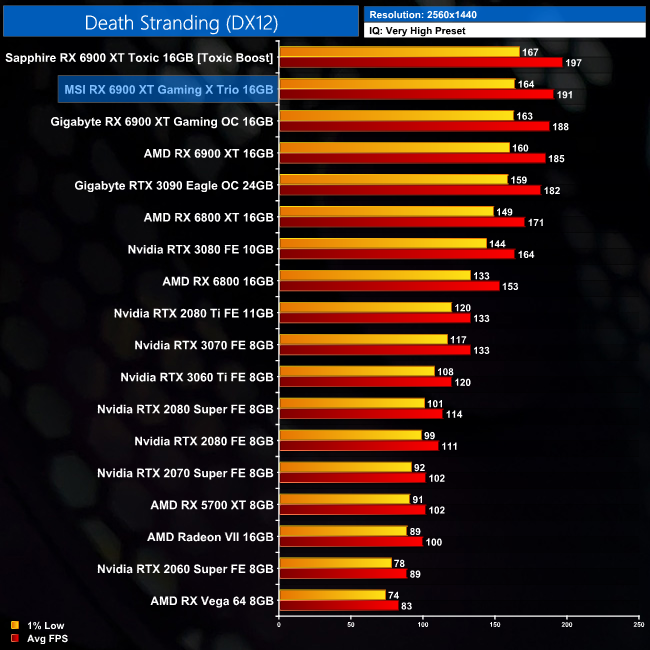
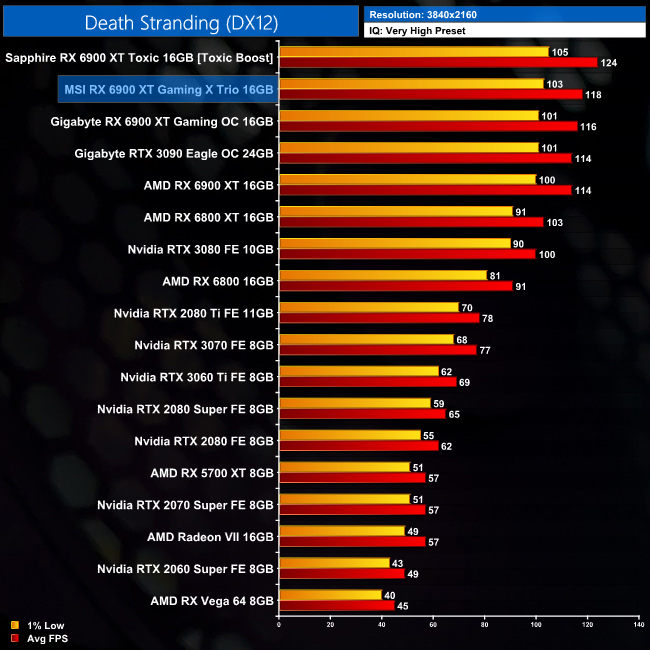
Death Stranding sees the Gaming X Trio pull ahead of the reference card by another 4% margin at 4K. Given both the reference 6900 XT and RTX 3090 averaged 144FPS, the MSI card is also 4% faster than Nvidia's flagship GPU here.Tom Clancy's The Division 2 is an online action role-playing video game developed by Massive Entertainment and published by Ubisoft. The sequel to Tom Clancy's The Division (2016), it is set in a near-future Washington, D.C. in the aftermath of a smallpox pandemic, and follows an agent of the Strategic Homeland Division as they try to rebuild the city. (Wikipedia).
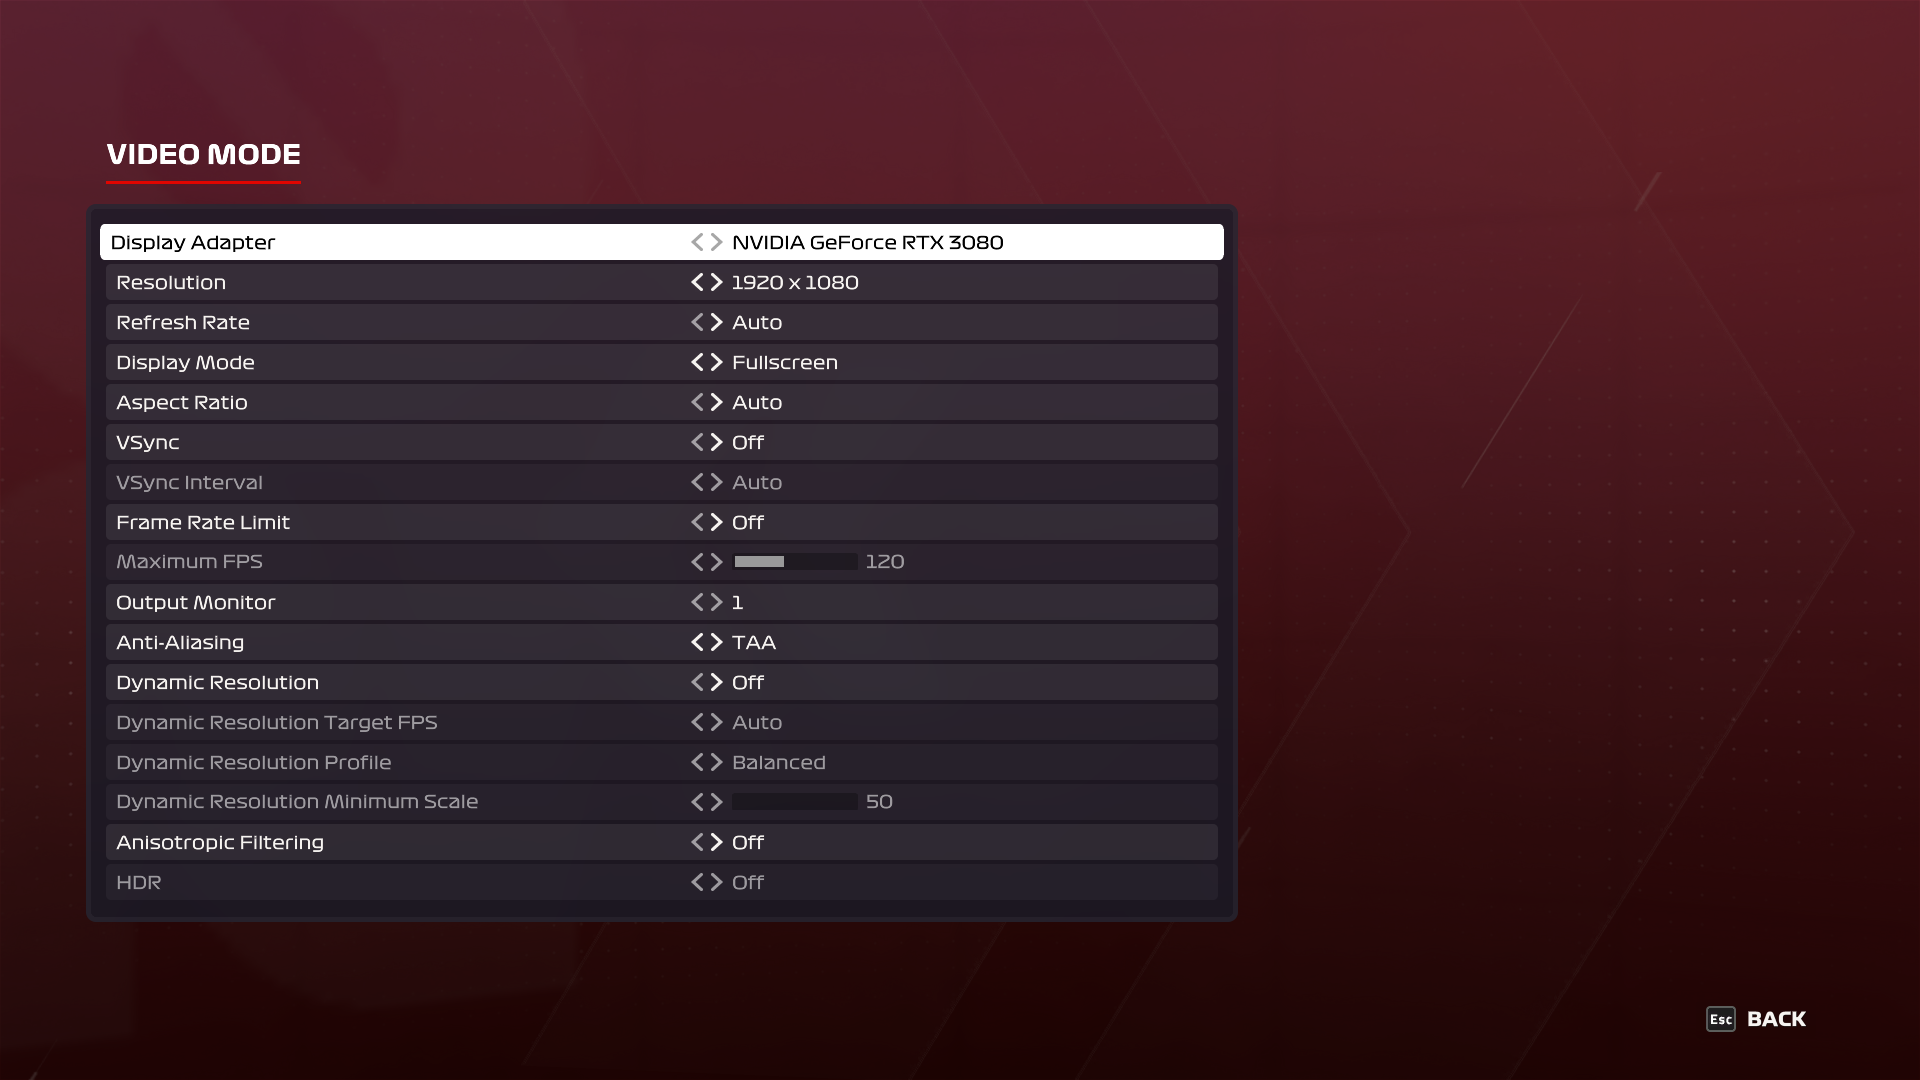
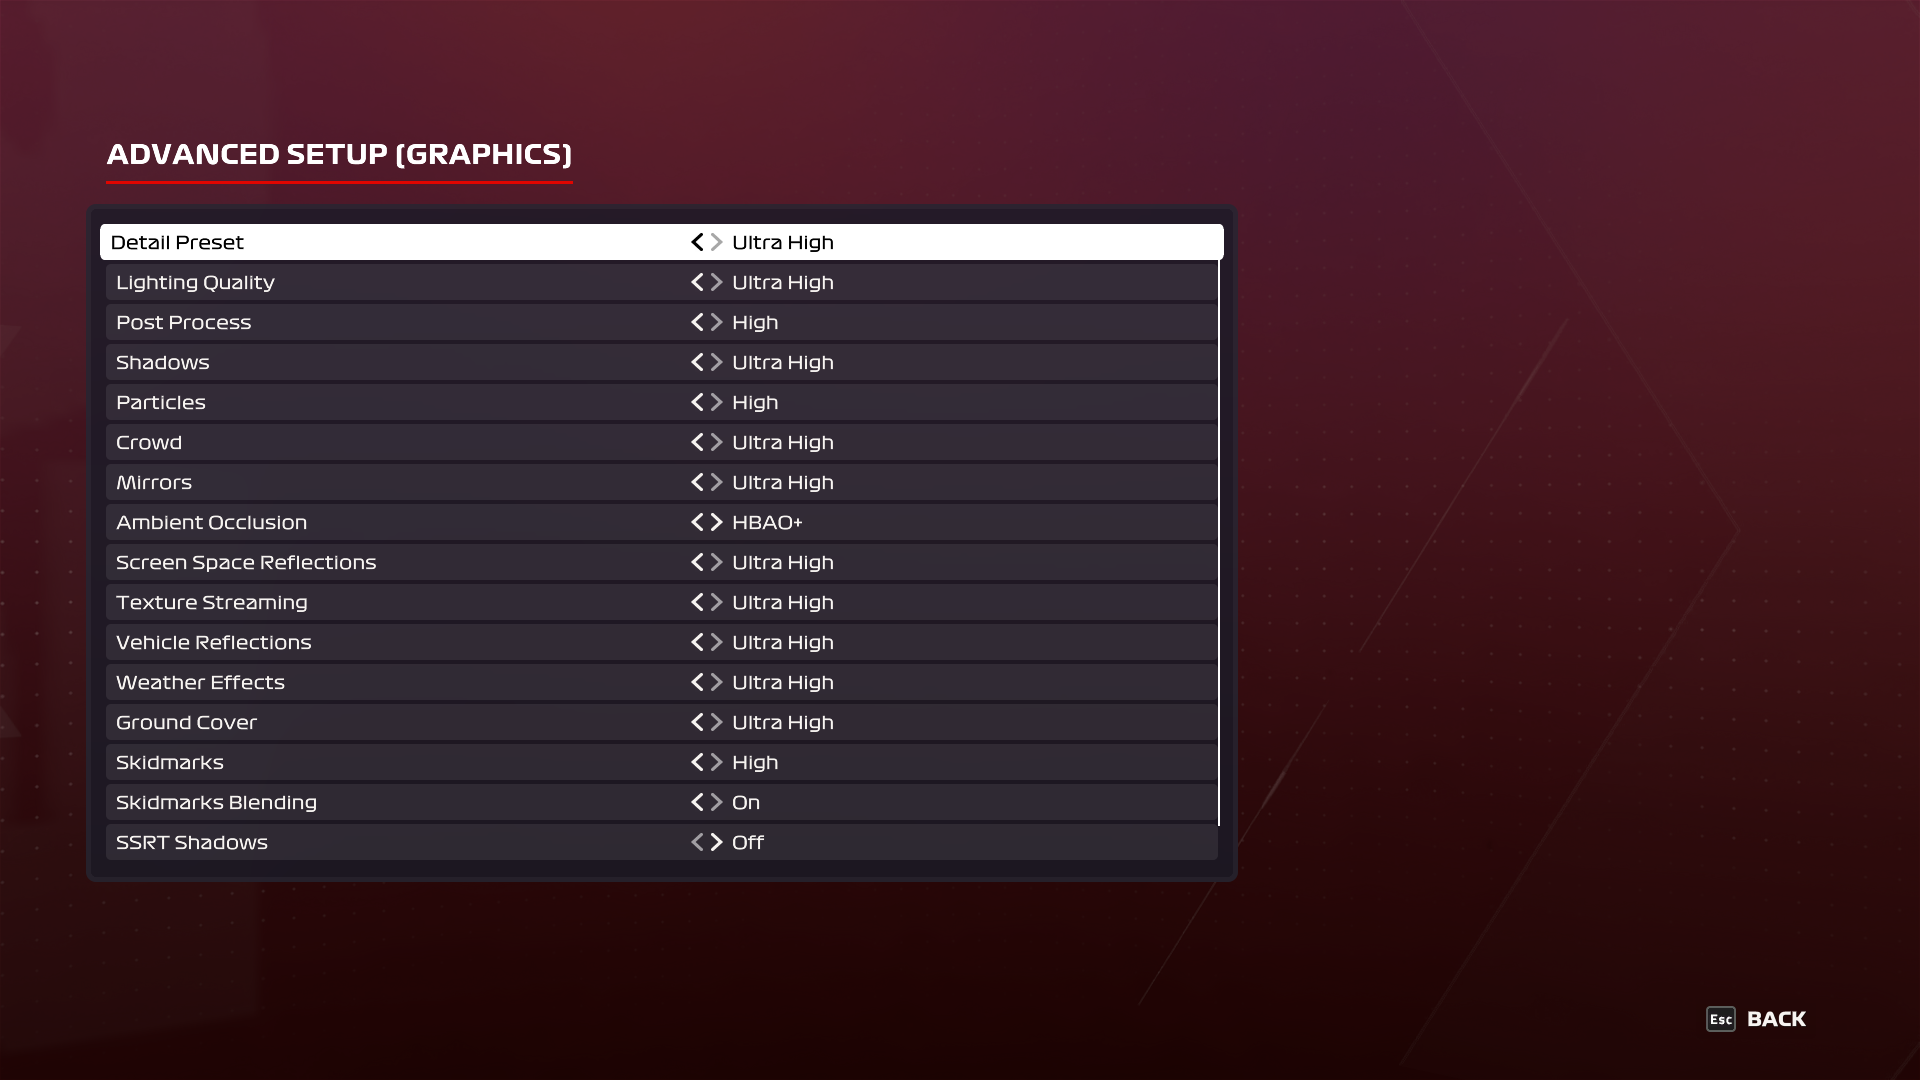
Engine: Snowdrop. We test using the Ultra preset, but with V-Sync disabled, DX12 API.
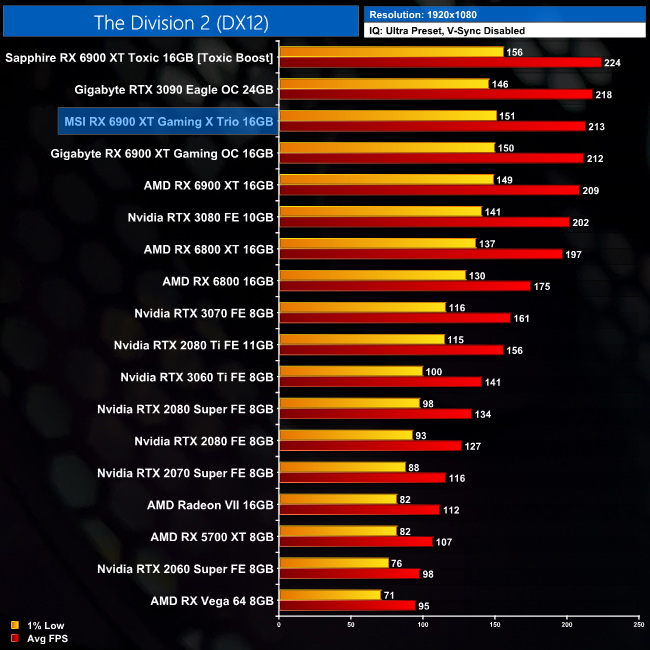
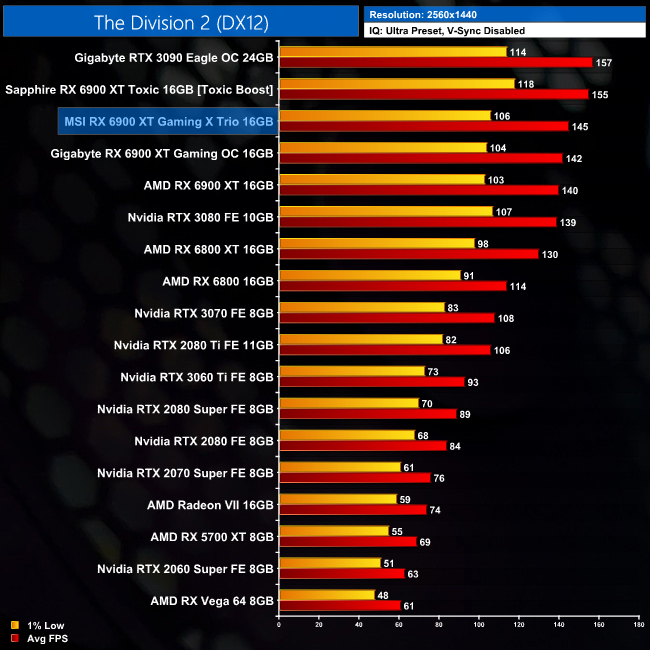
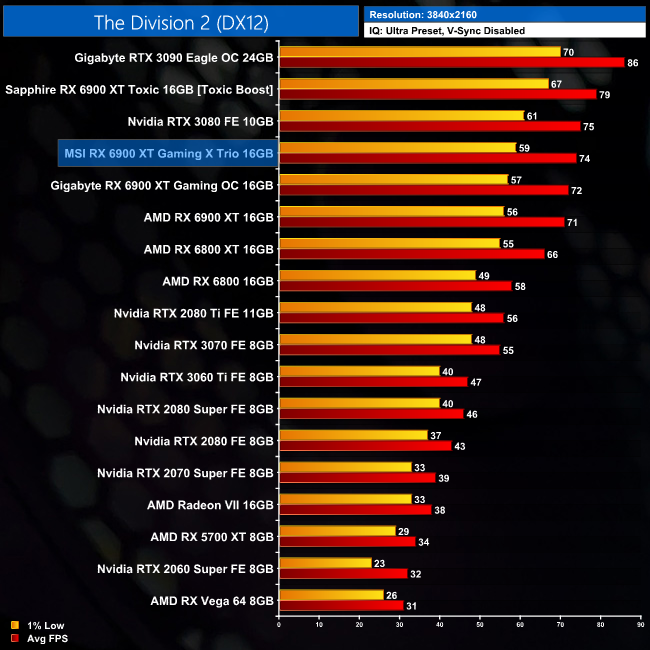
As for The Division 2, the Gaming X Trio comes in 14% slower than the RTX 3090 at 4K. It is, however, still 4% faster than the reference card here.
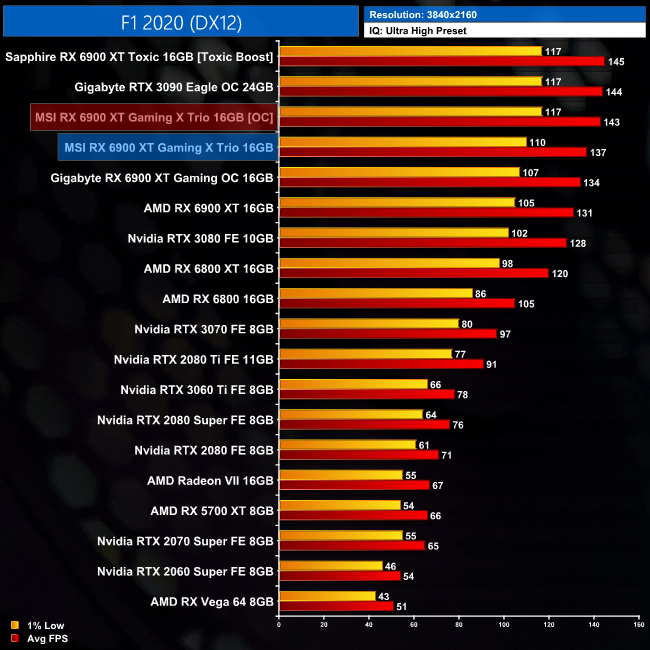
F1 2020 is the official video game of the 2020 Formula 1 and Formula 2 Championships developed and published by Codemasters. It is the thirteenth title in the Formula 1 series developed by the studio and was released on 7 July 2020 for pre-orders of the Michael Schumacher Edition and 10 July 2020 for the Seventy Edition on Microsoft Windows, PlayStation 4, Xbox One. (Wikipedia).
Engine: EGO. We test using the Ultra High preset, DX12 API.
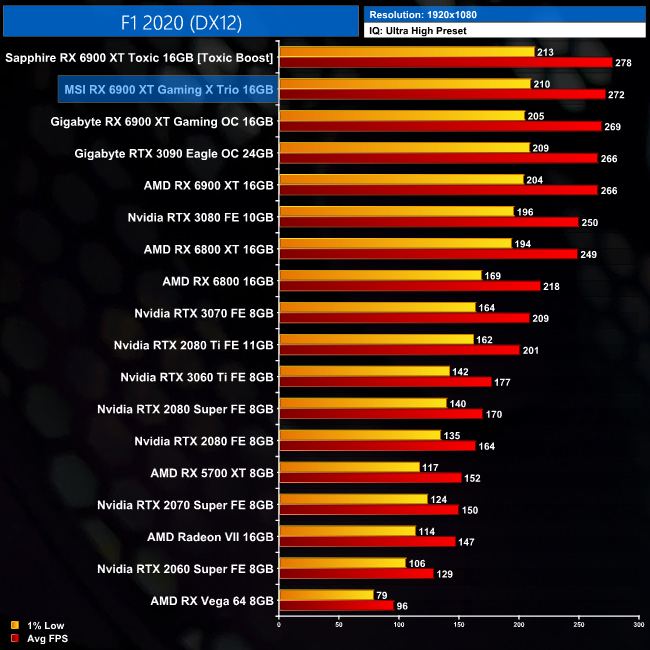
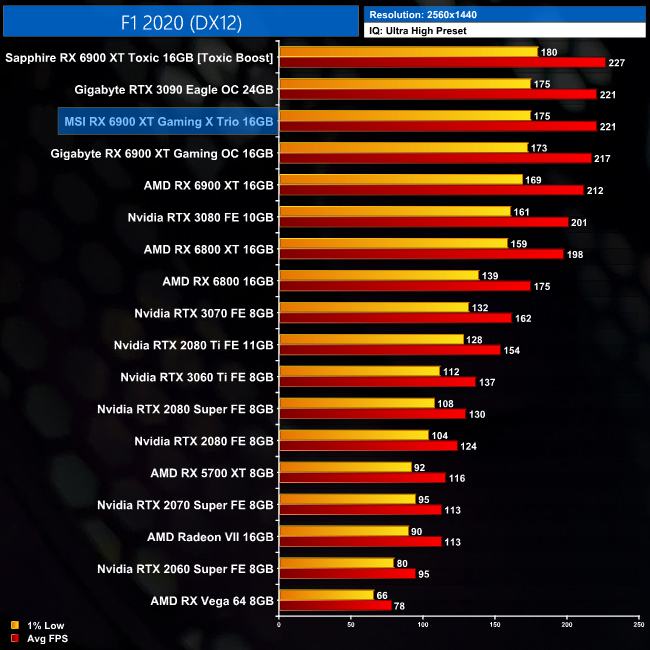
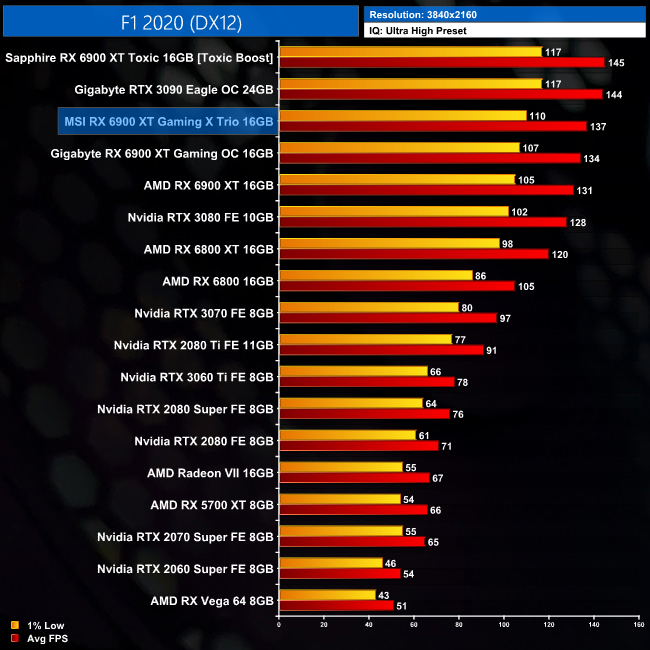
Next up we come to F1 2020. At 4K, we see the single biggest improvement for the Gaming X Trio, compared to the reference card, that we will see across our testing today – MSI's card is 5% faster at that resolution. It is still 5% slower than the RTX 3090, though.
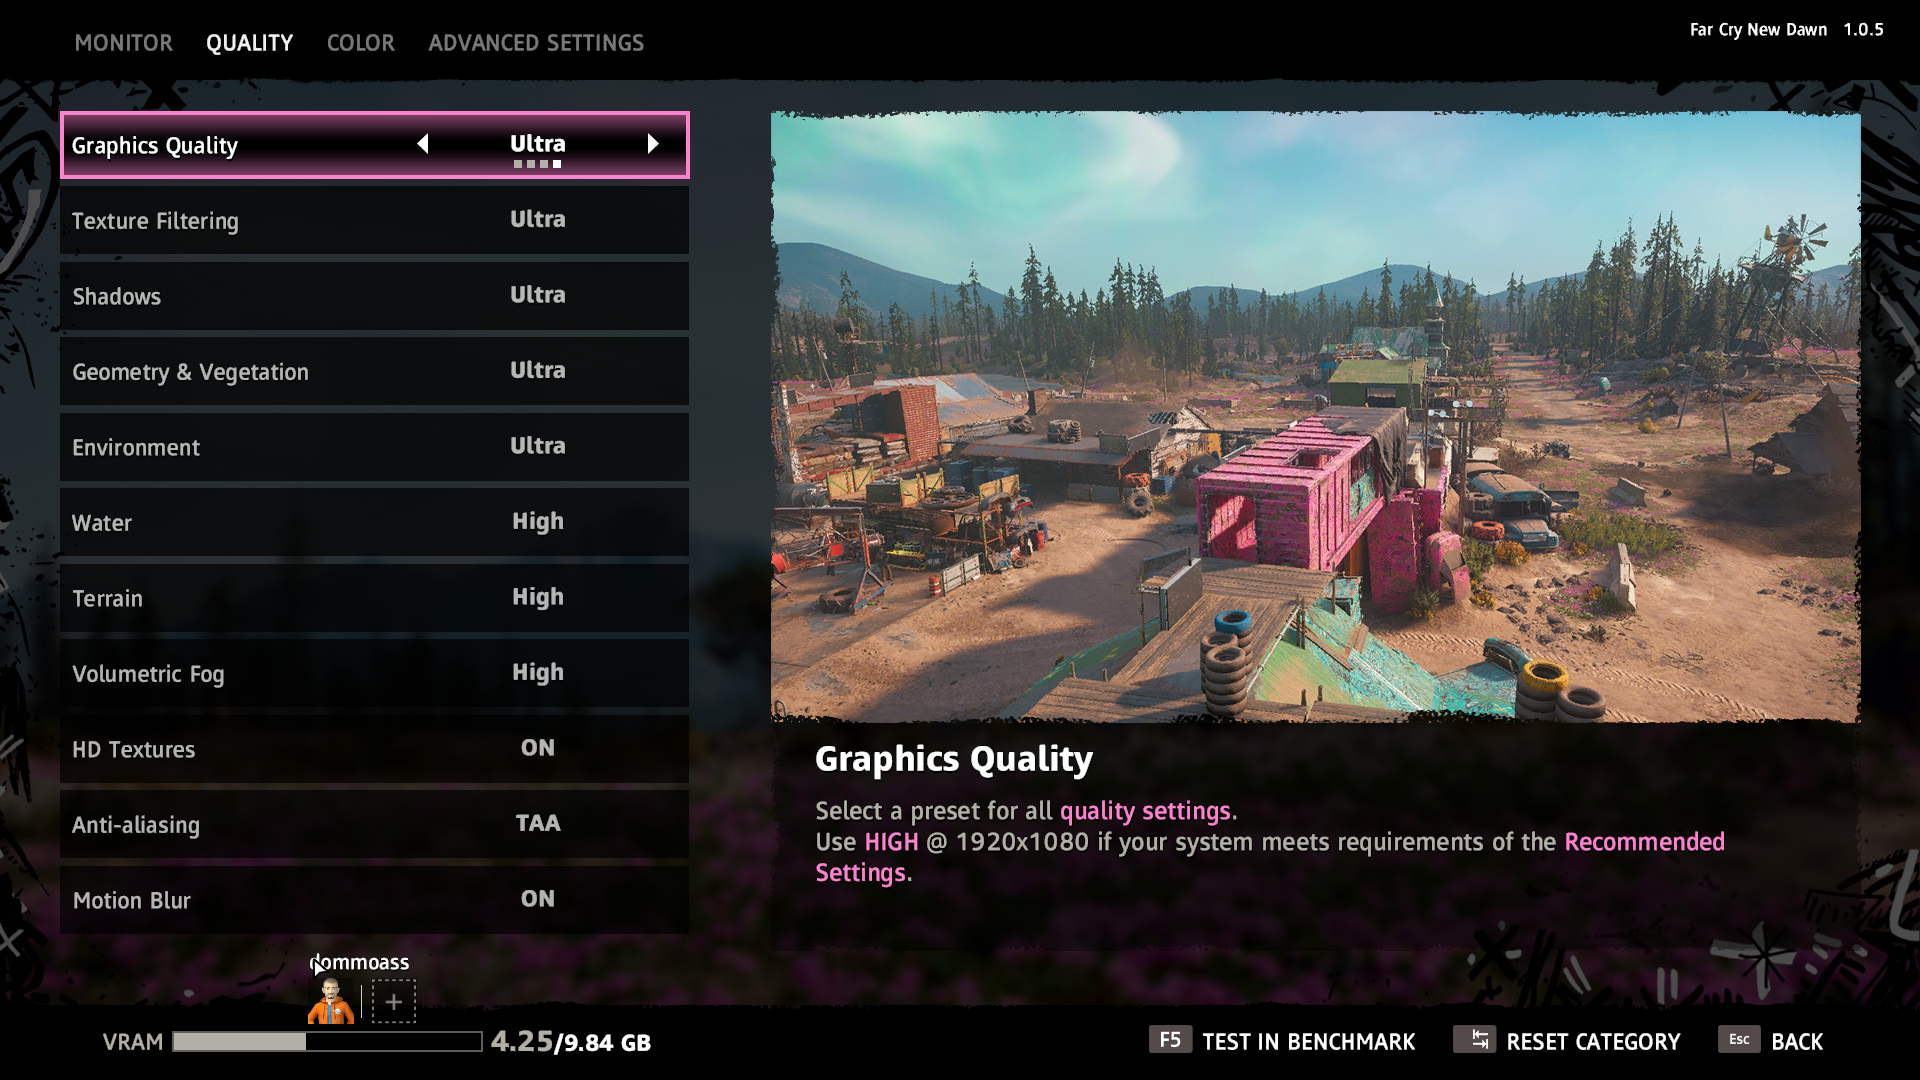
Far Cry New Dawn is an action-adventure first-person shooter developed by Ubisoft Montreal and published by Ubisoft. The game is a spin-off of the Far Cry series and a narrative sequel to Far Cry 5. It was released for Microsoft Windows, PlayStation 4 and Xbox One on February 15, 2019. (Wikipedia).
Engine: Dunia 2. We test using the Ultra preset, with the HD Textures pack, DX11 API.
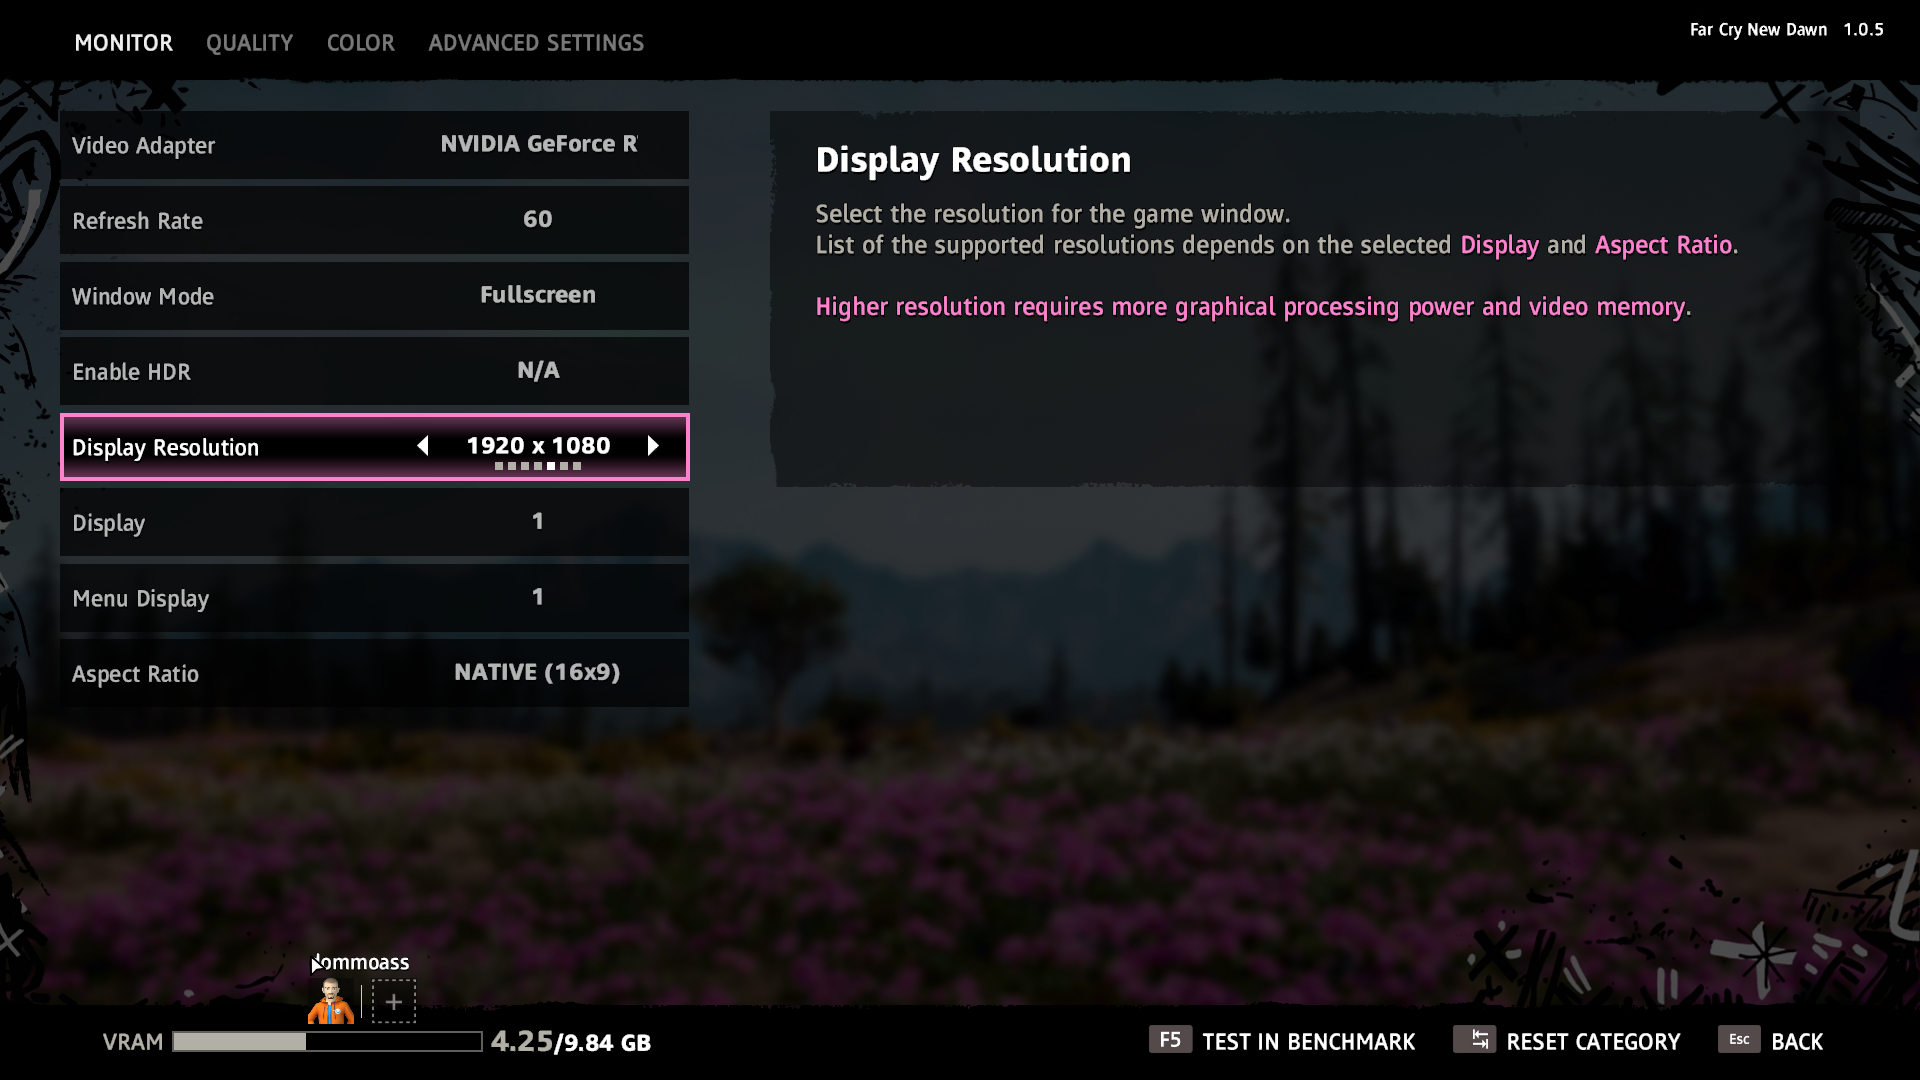
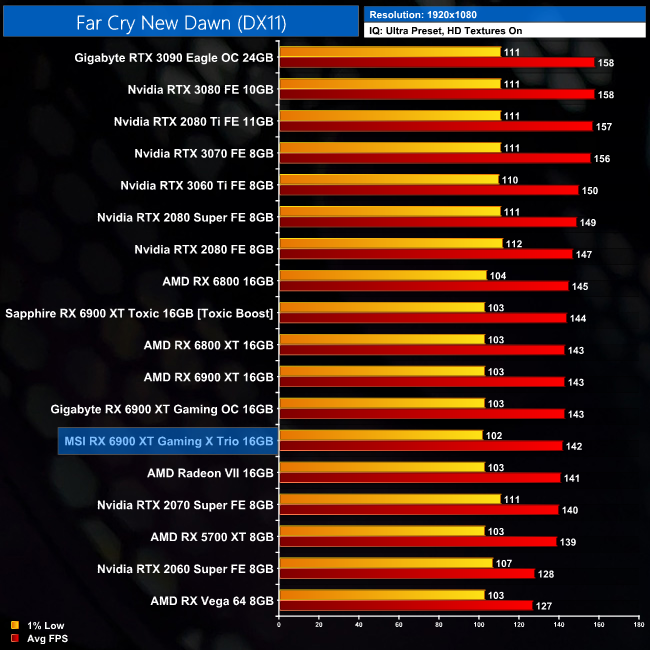
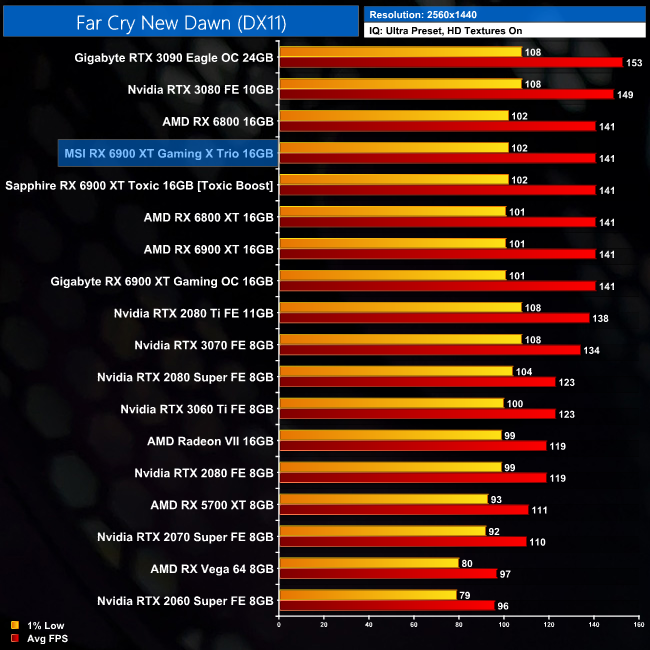
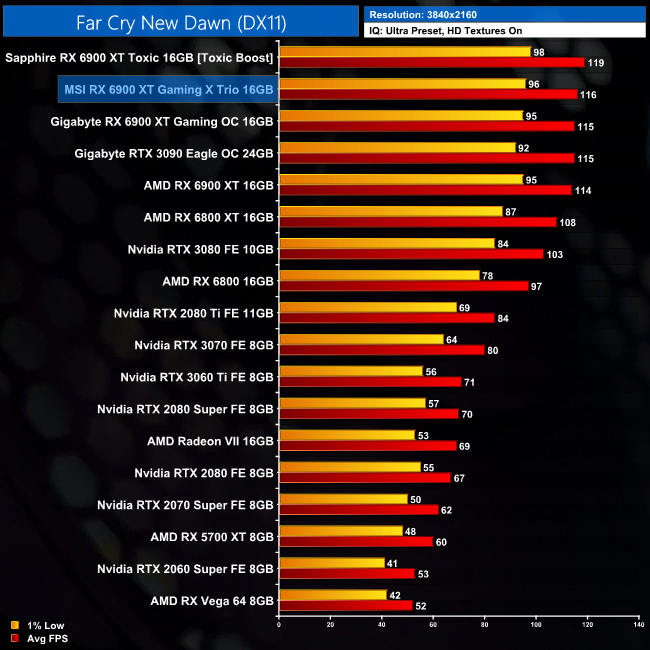
Far Cry New Dawn is heavily CPU bottlenecked, even at 1440p, and this is actually going to be the last review in which we benchmark this game for that very reason. At 4K though, where the CPU limitation is alleviated, the Gaming X Trio comes in just 2% faster than the reference 6900 XT.
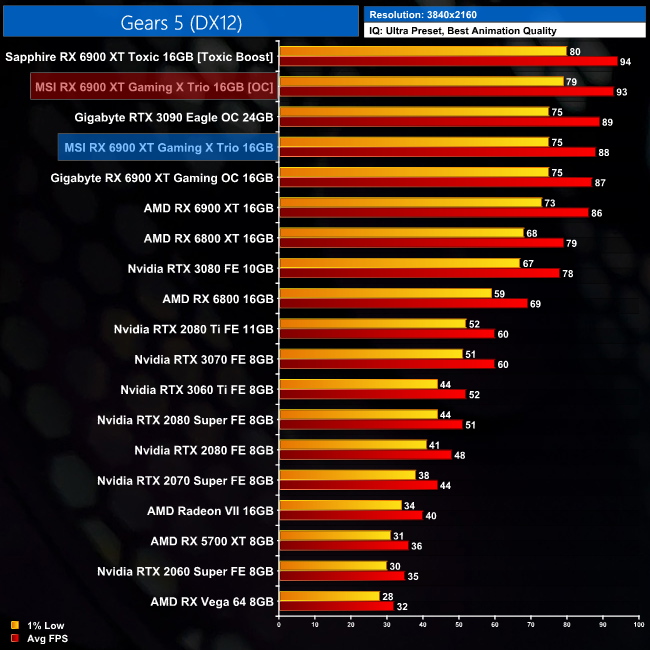
Gears 5 is a third-person shooter video game developed by The Coalition and published by Xbox Game Studios for Xbox One, Microsoft Windows and Xbox Series X. It is the fifth installment of the Gears of War series and the sequel to Gears of War 4. The ultimate edition was released on September 6, 2019, while the standard edition of the game was released worldwide on September 10, 2019. (Wikipedia).
Engine: Unreal Engine 4. We test using the Ultra preset, with Best Animation Quality (instead of Auto), DX12 API.
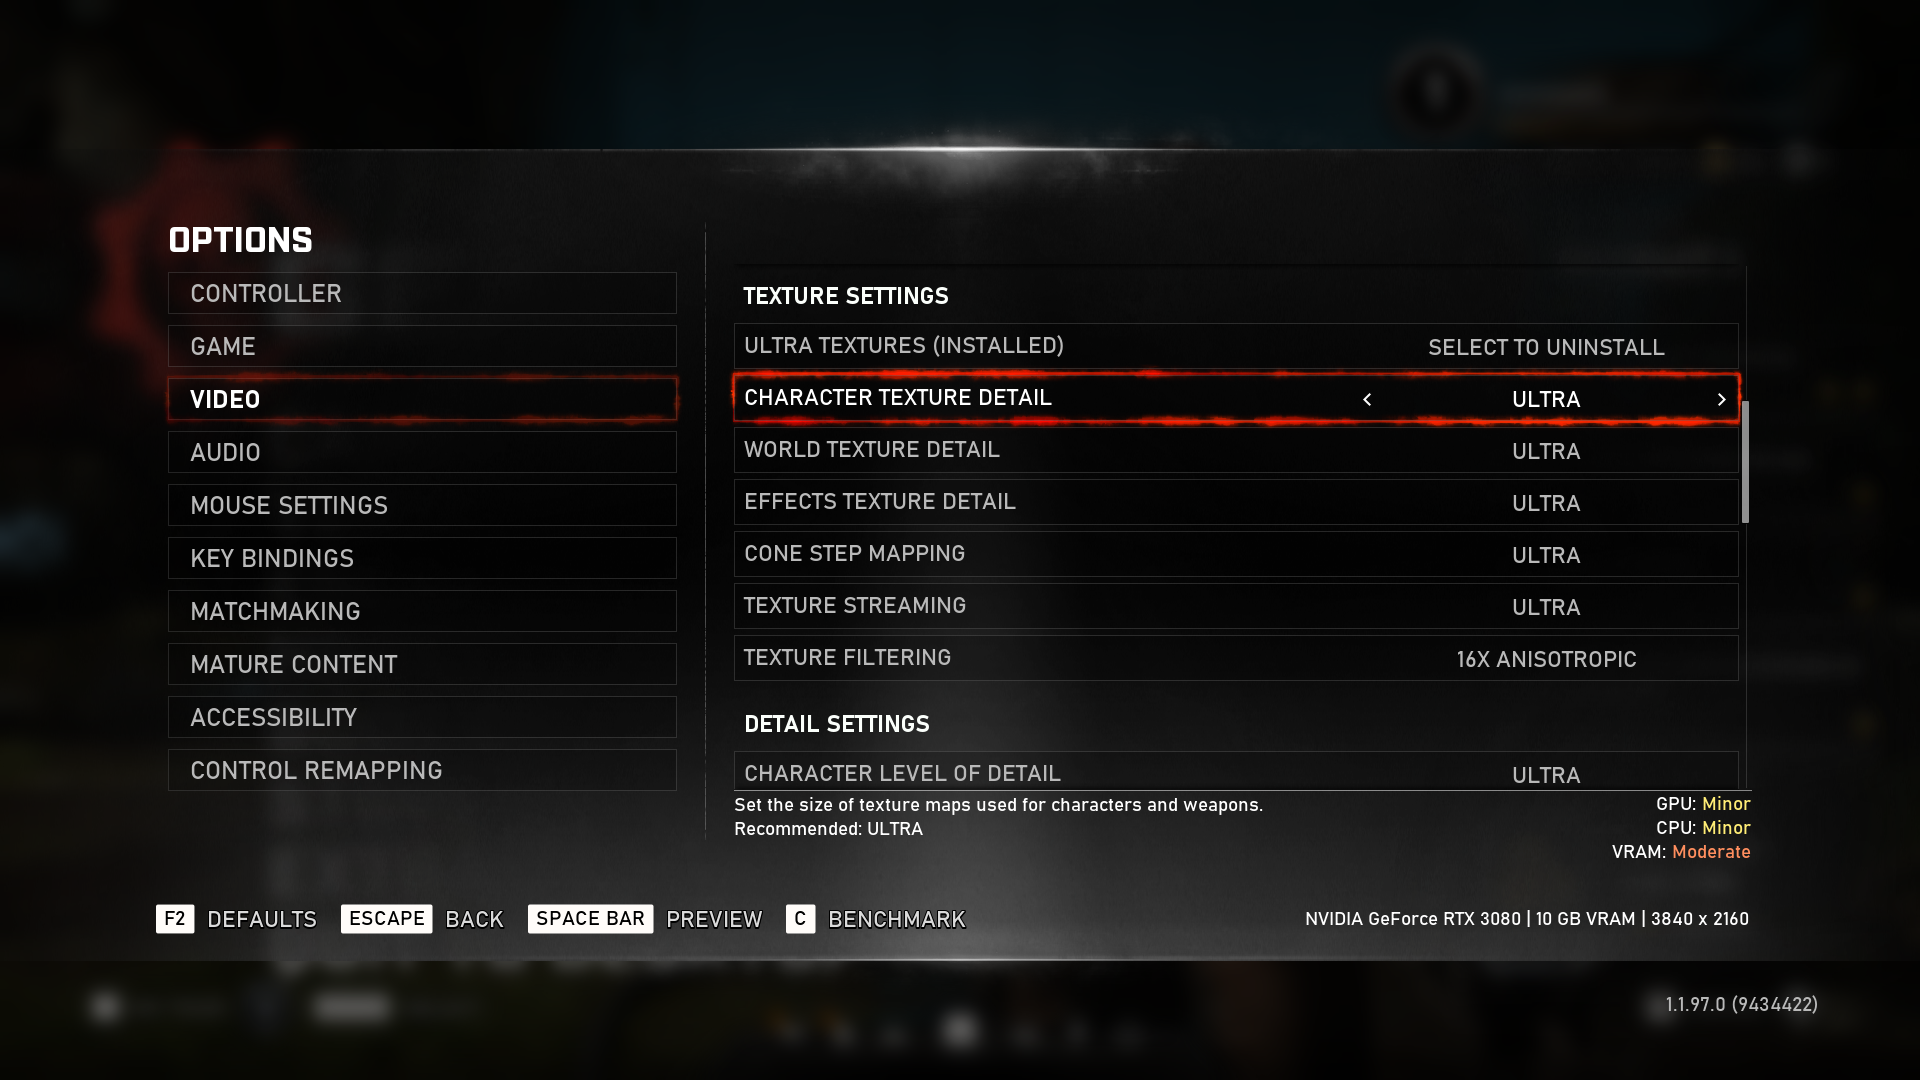
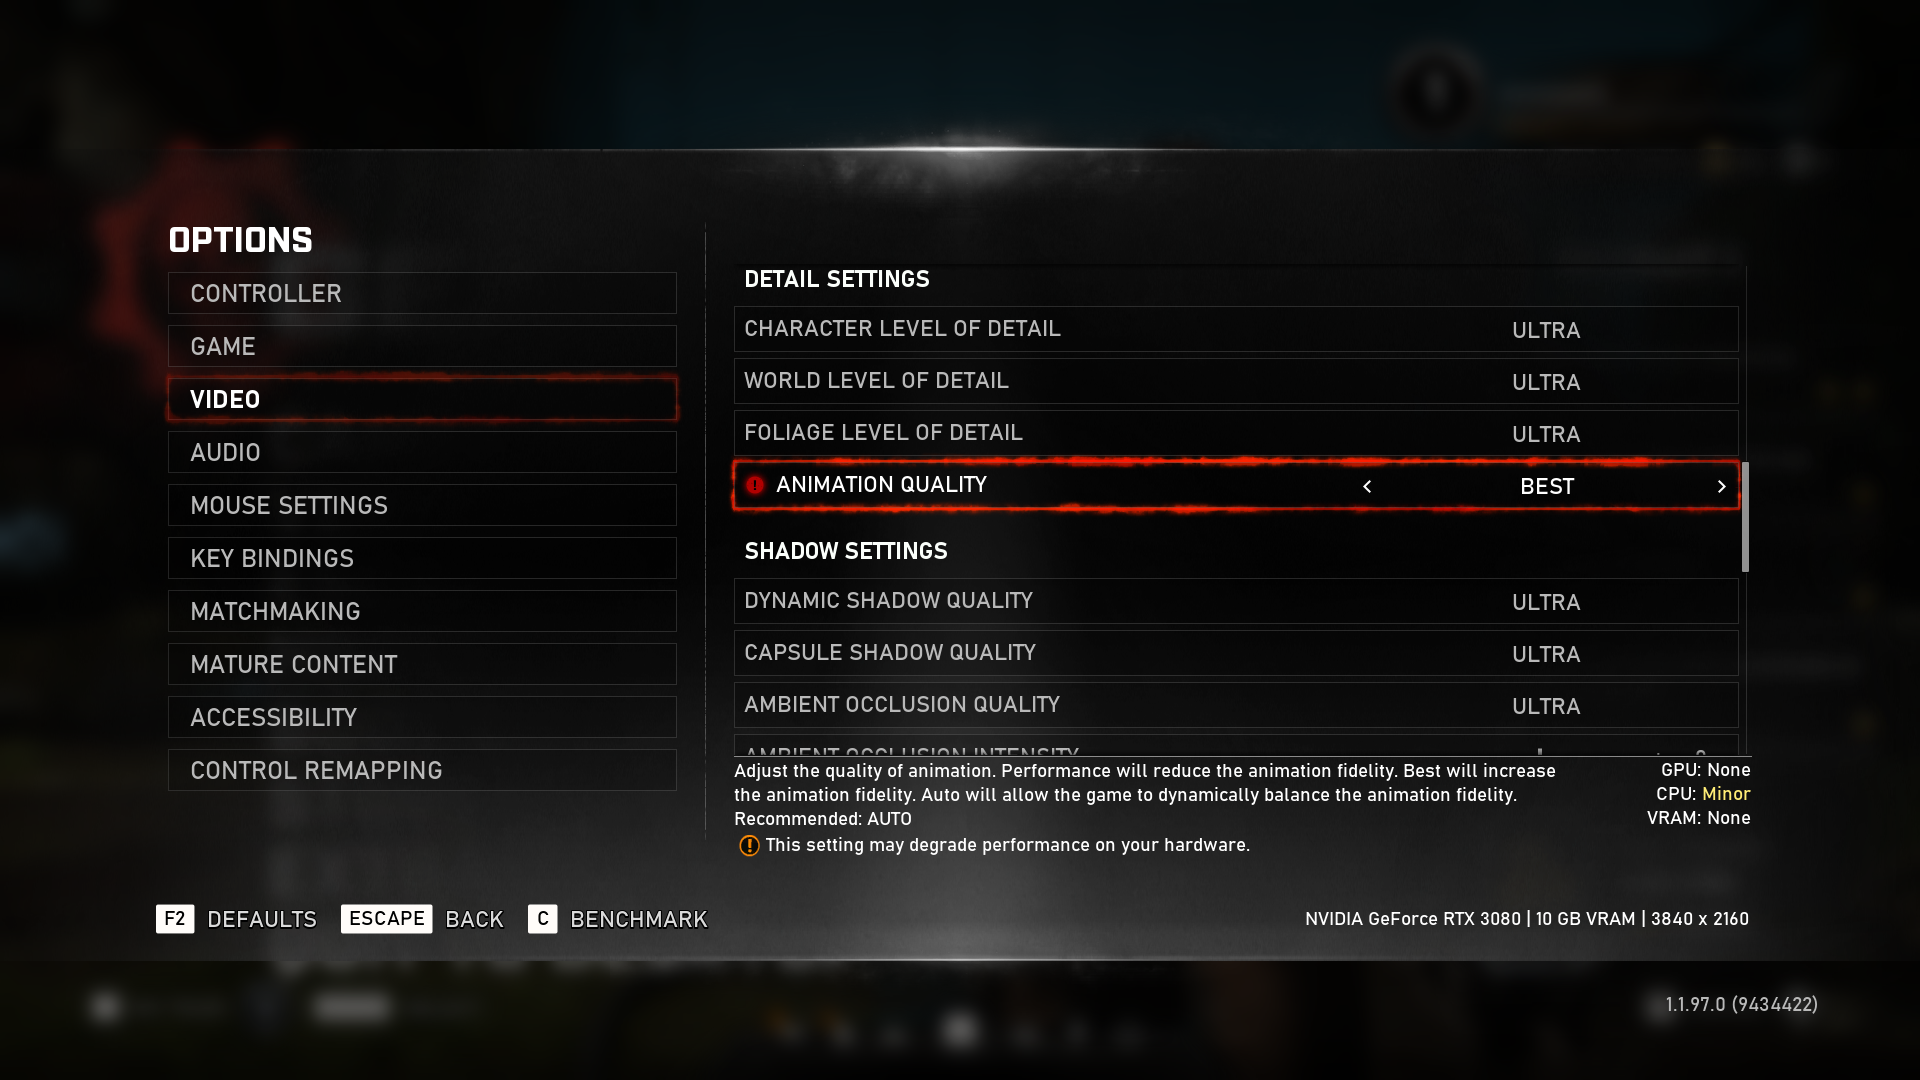
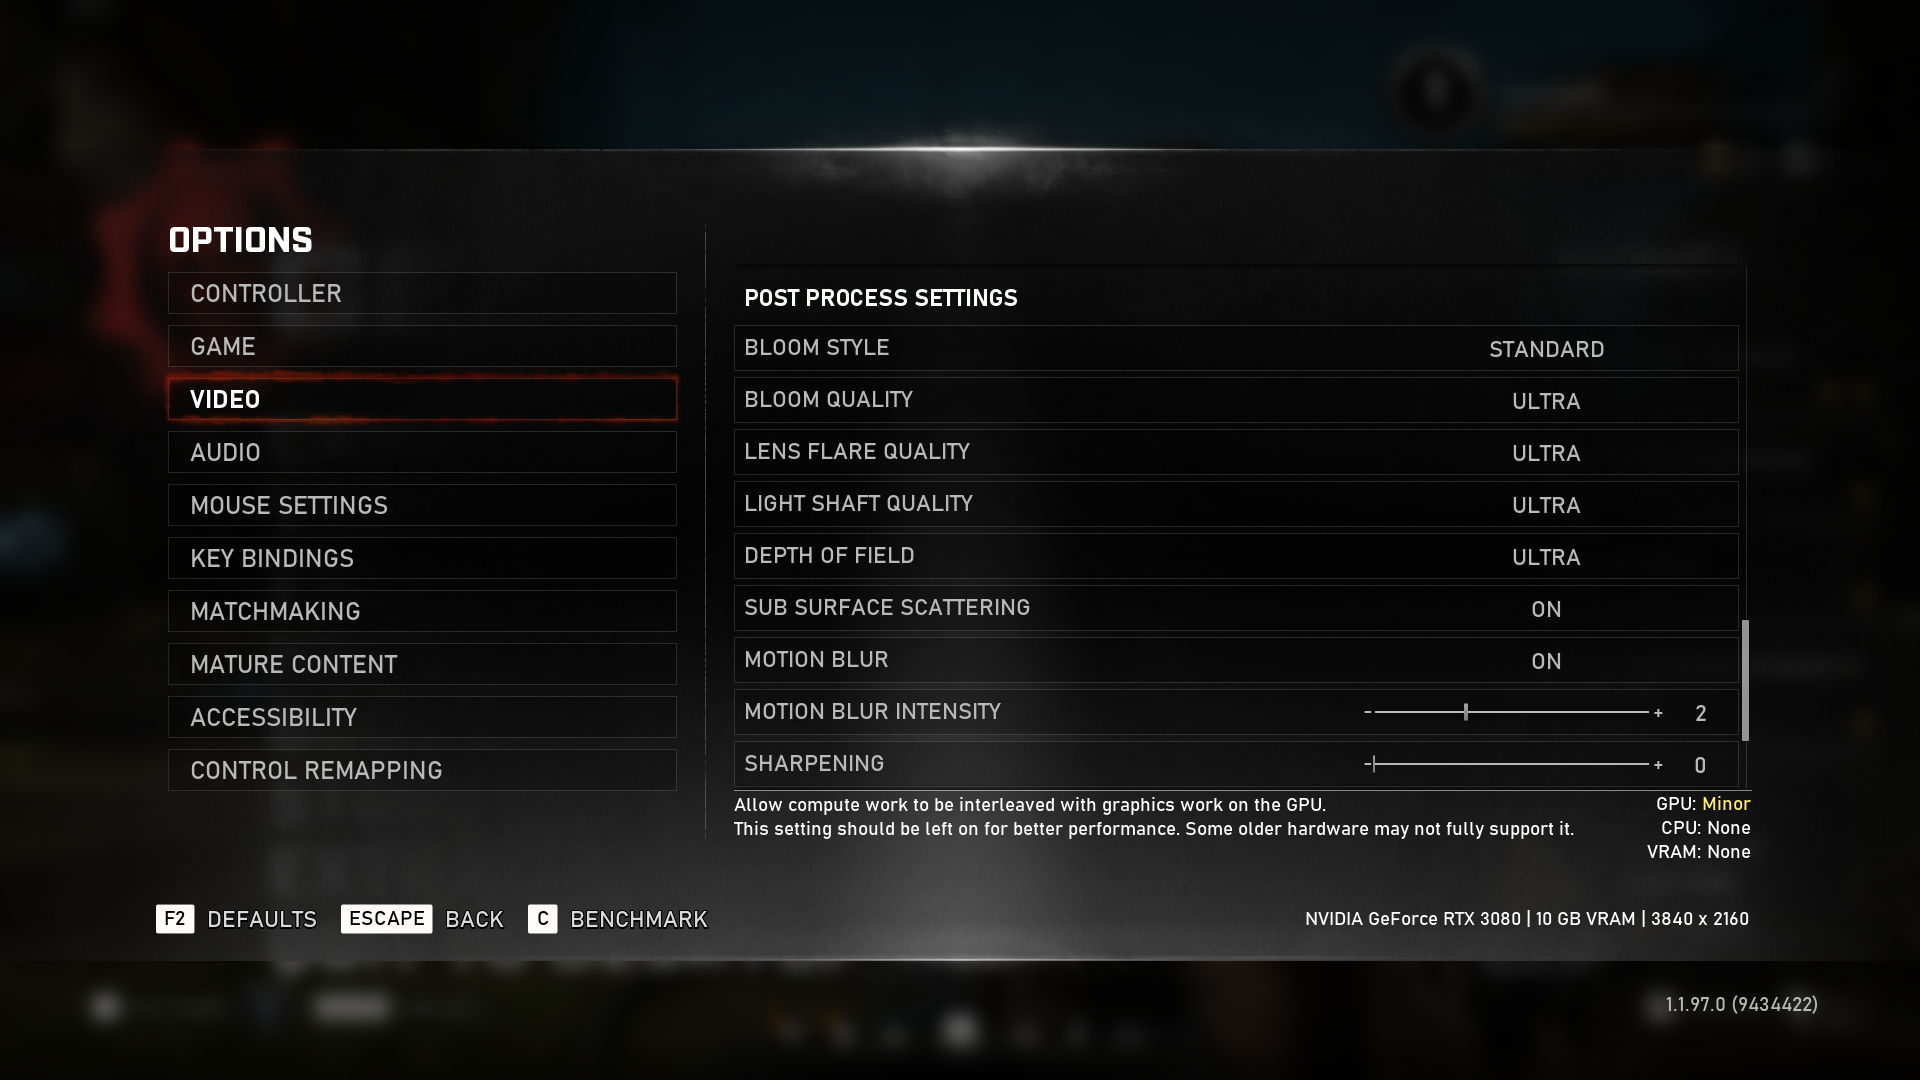
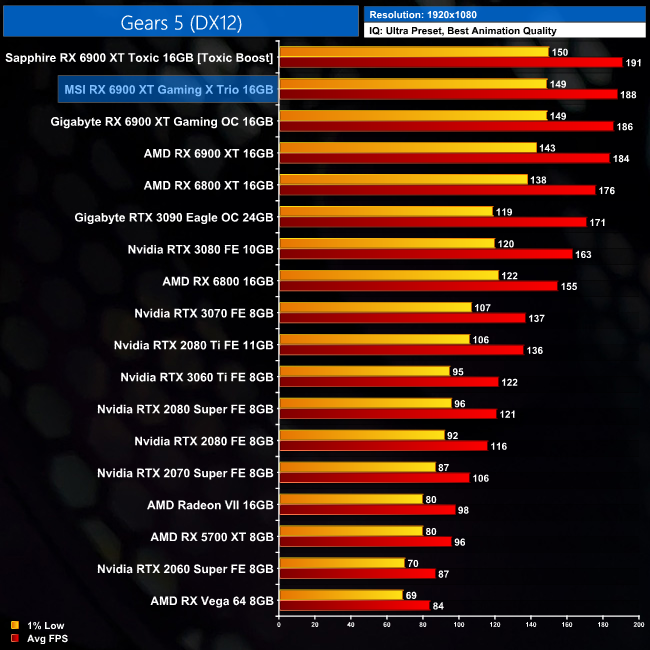
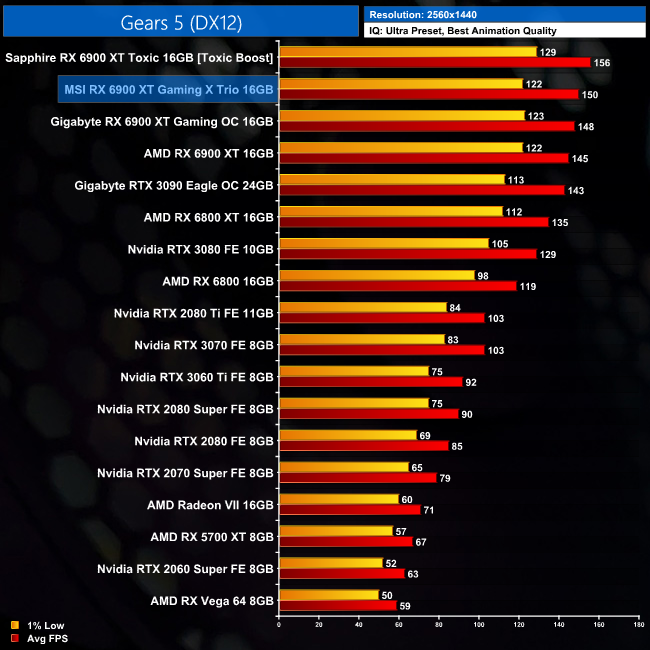
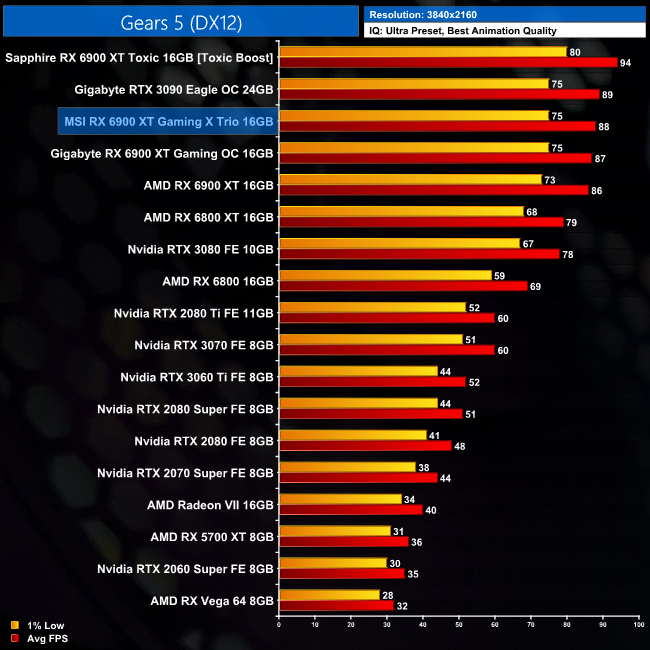
Gears 5 sees a smaller boost for the Gaming X Trio compared to the reference card, as it is just 2% faster at 4K. Compared to the RTX 3090, things are neck-and-neck.
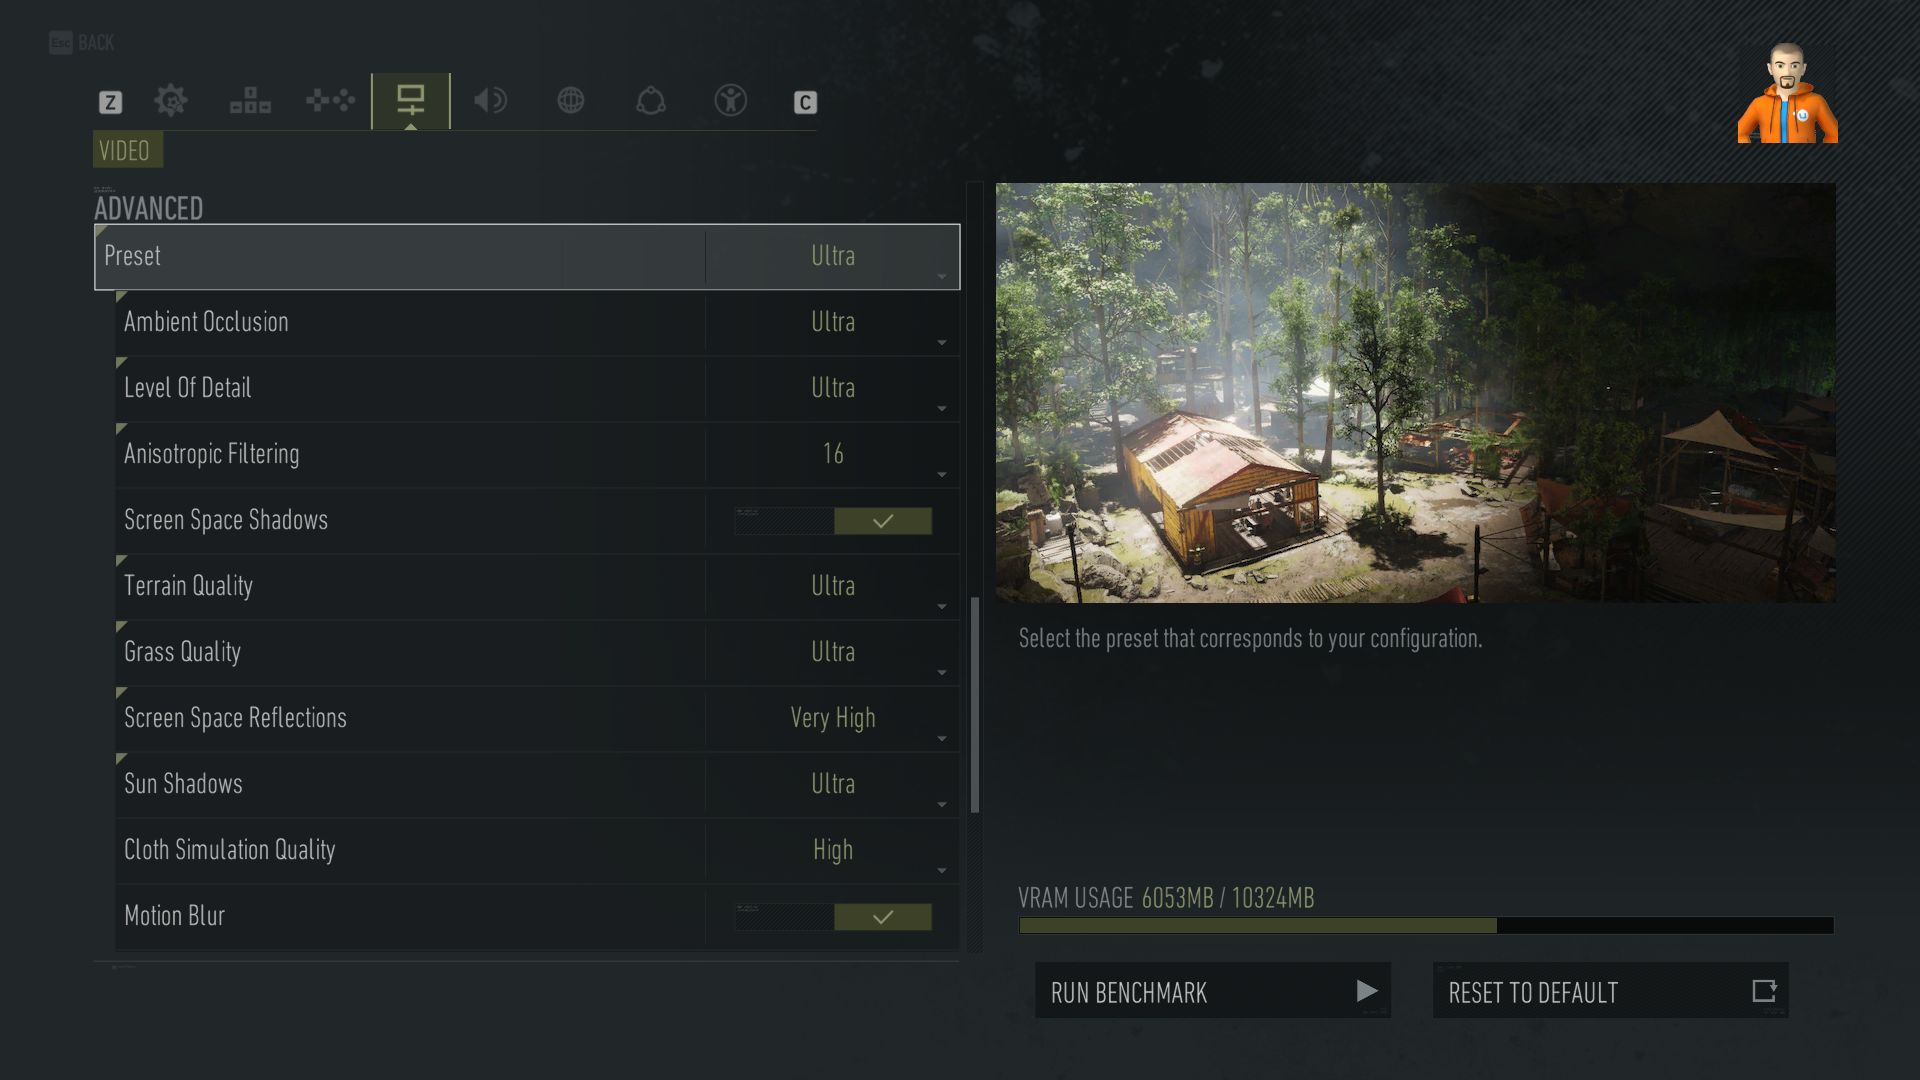
Tom Clancy's Ghost Recon Breakpoint is an online tactical shooter video game developed by Ubisoft Paris and published by Ubisoft. The game was released worldwide on 4 October 2019, for Microsoft Windows, PlayStation 4 and Xbox One, (Wikipedia).
Engine: AnvilNext 2.0. We test using the Ultra preset, with AA disabled, Vulkan API.

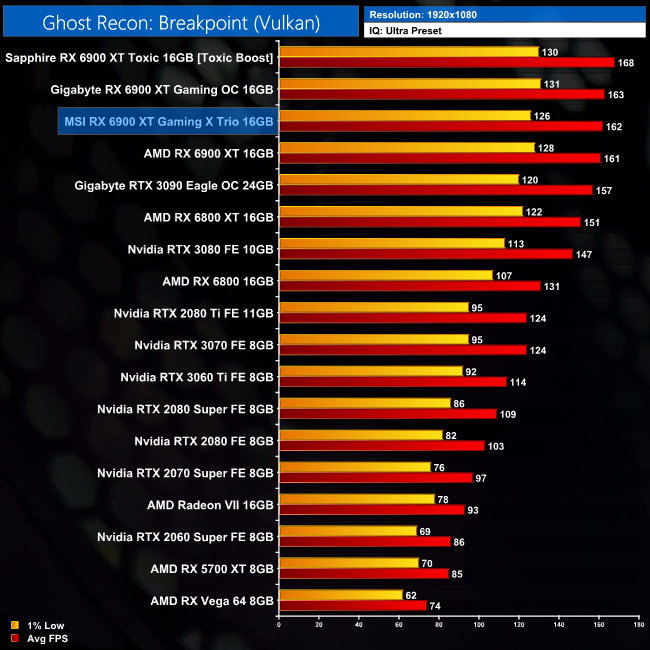


Here we come to Ghost Recon Breakpoint. The Gaming X Trio is once more looking at a sizable 15% performance deficit compared to the RTX 3090 at 4K. It is however 3% faster than the reference card.
Metro Exodus is a first-person shooter video game developed by 4A Games and published by Deep Silver in 2019. It is the third instalment in the Metro video game series based on Dmitry Glukhovsky's novels, following the events of Metro 2033 and Metro: Last Light. (Wikipedia).
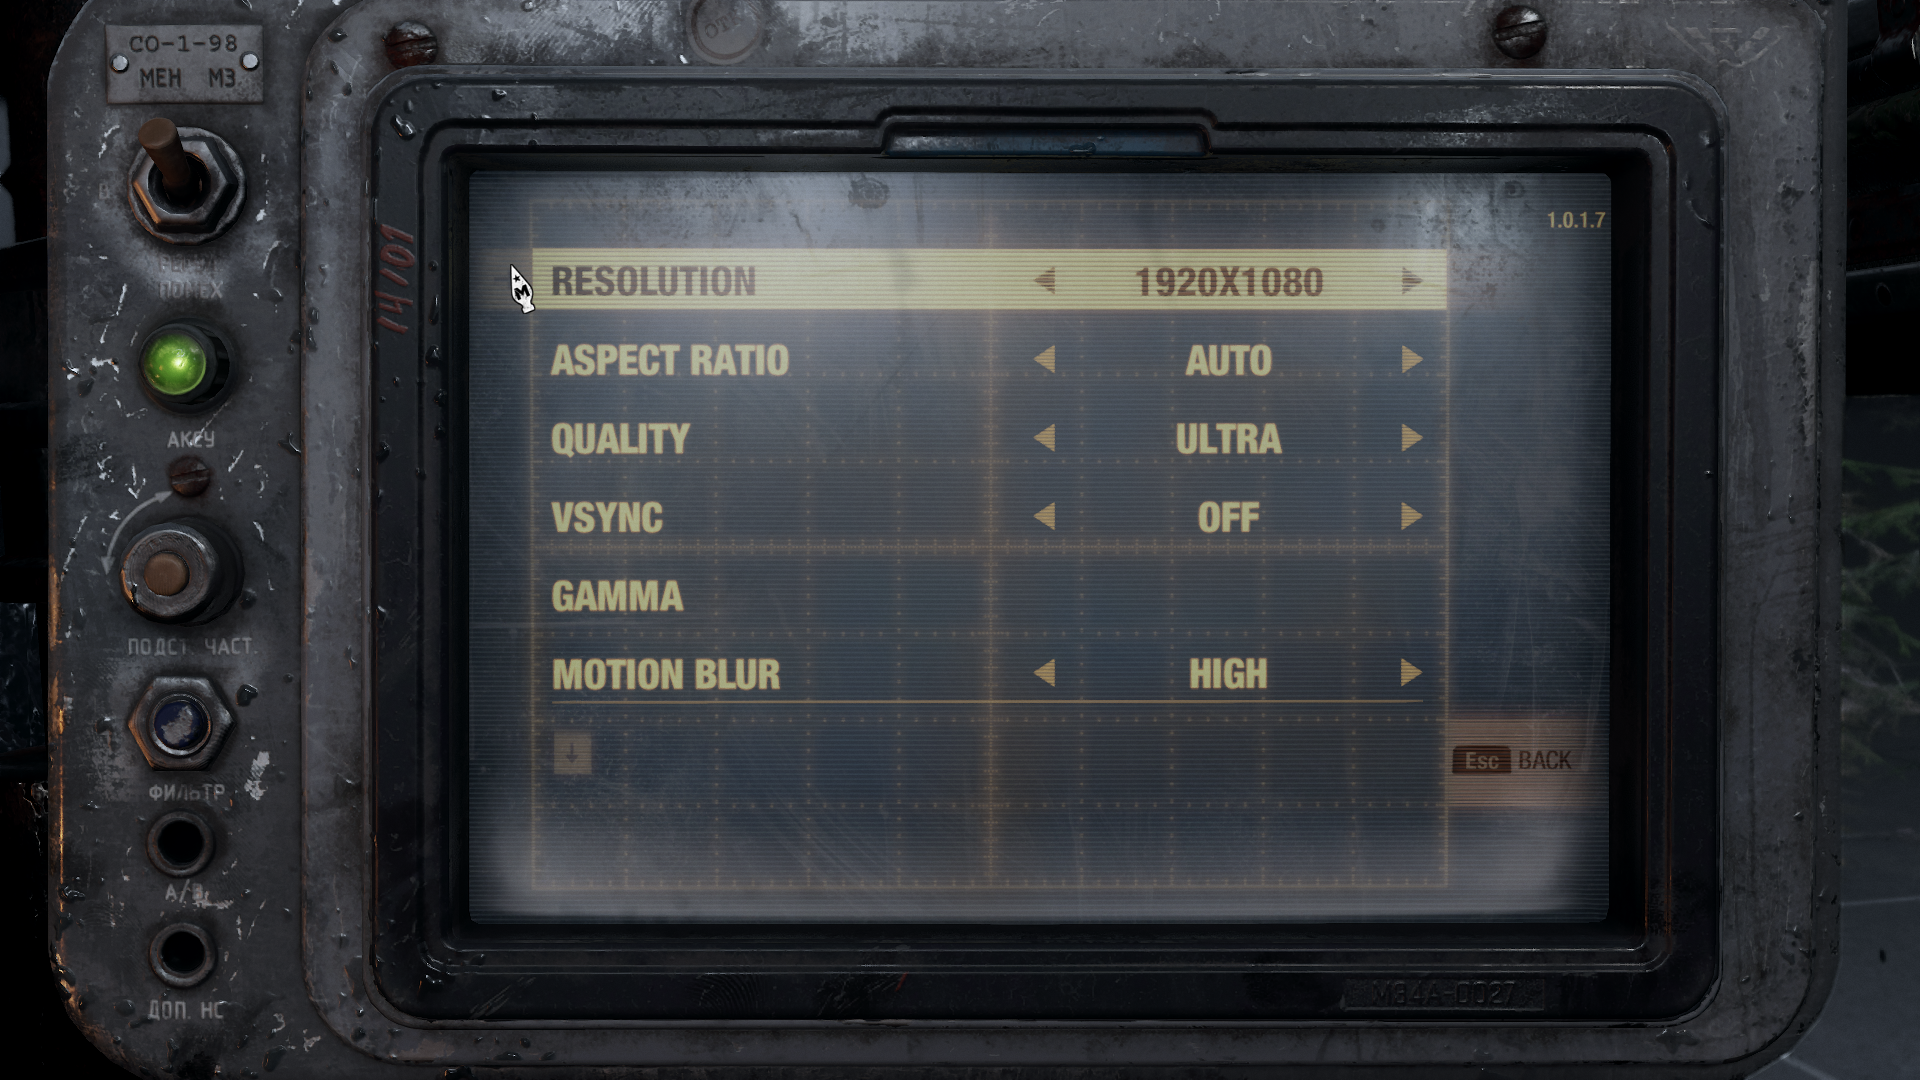
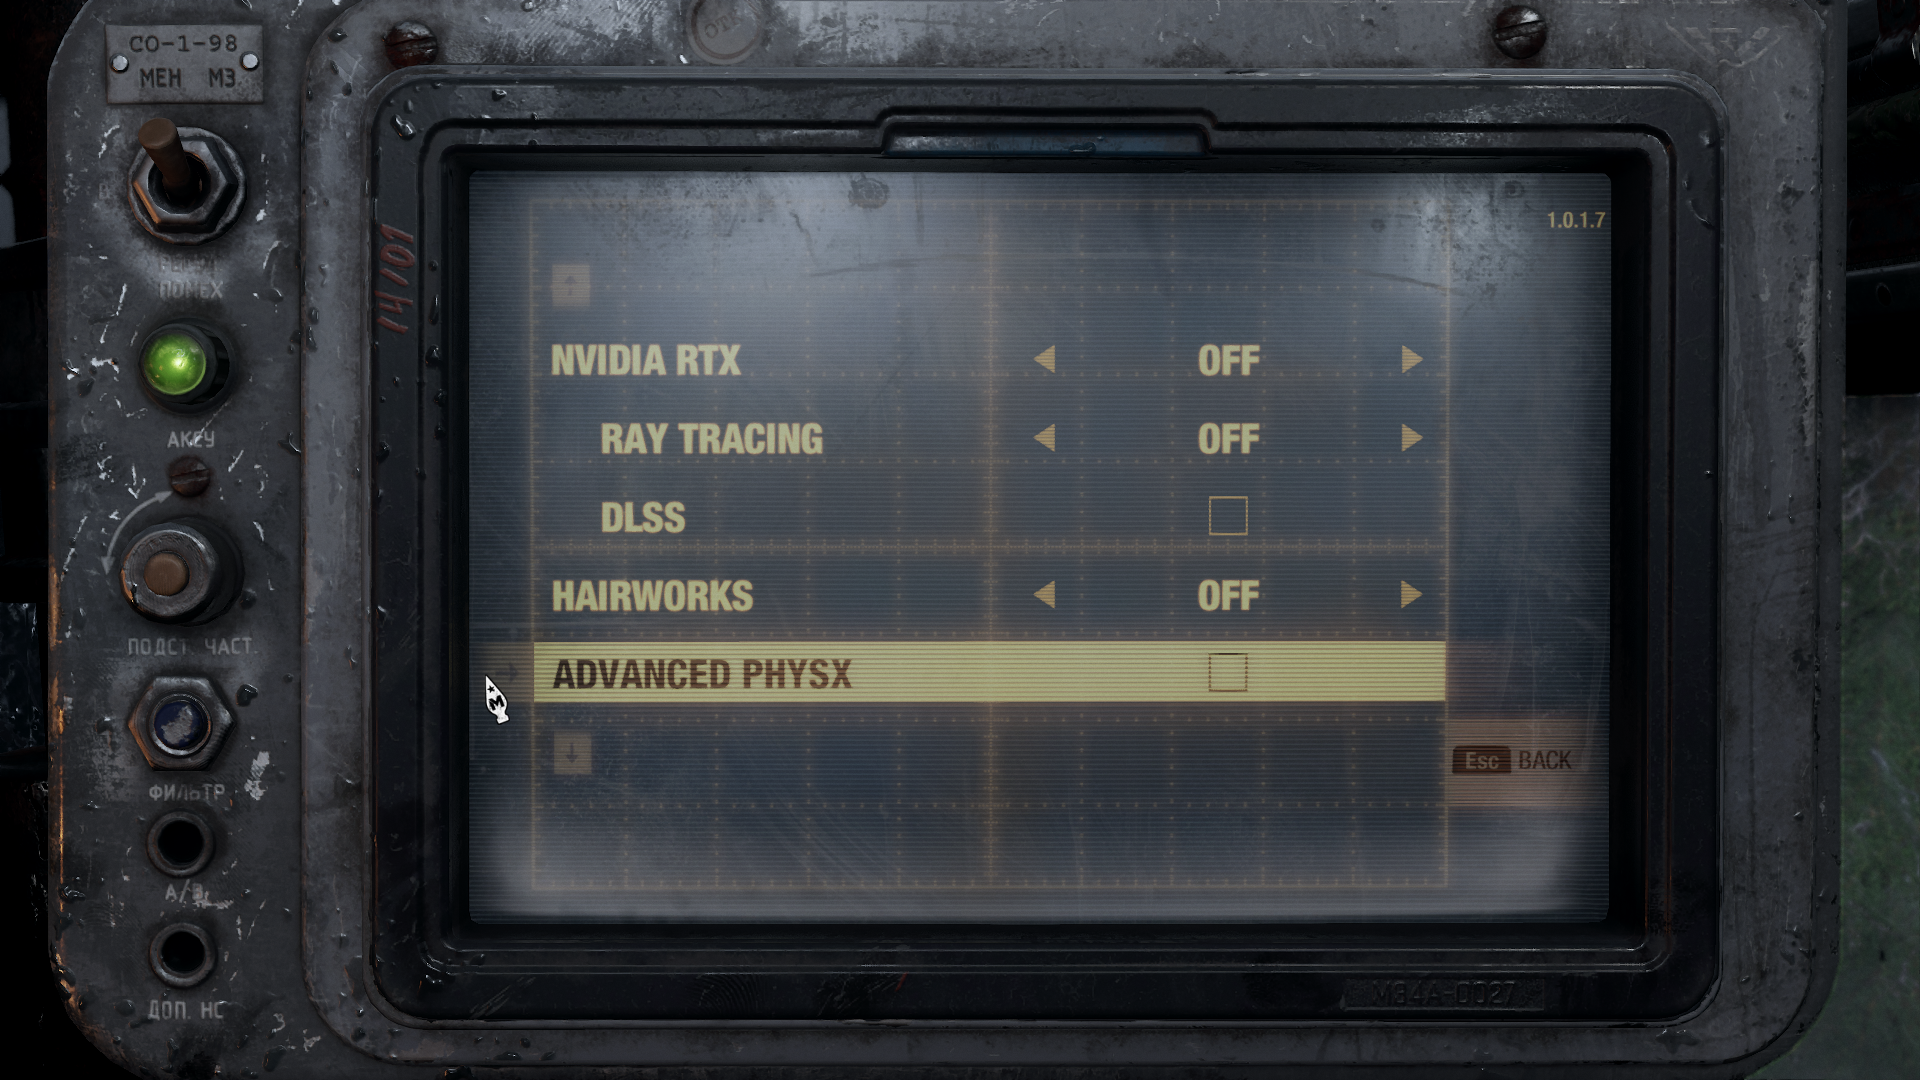
Engine: 4A Engine. We test using the Ultra preset, but with Hairworks and Advanced PhysX turned off, DX12 API.
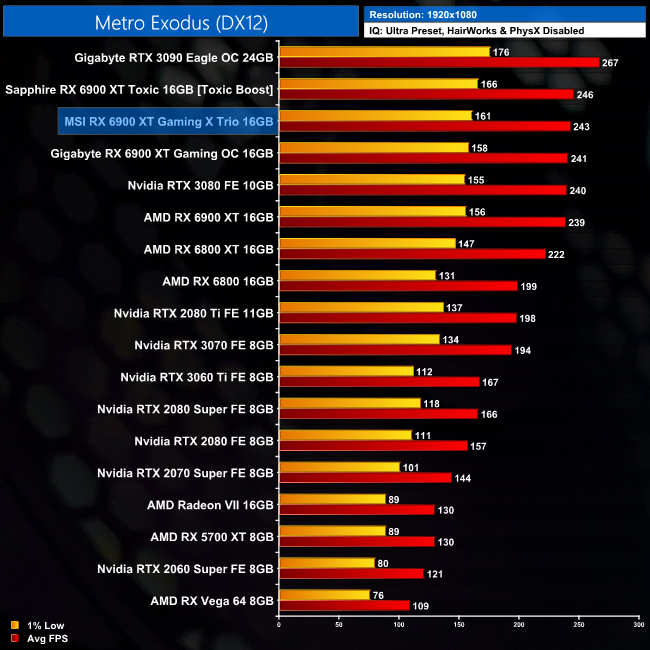
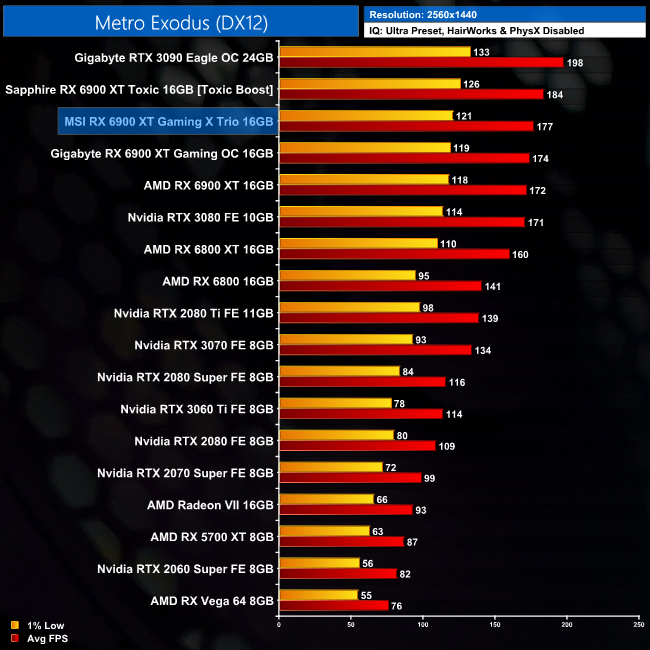
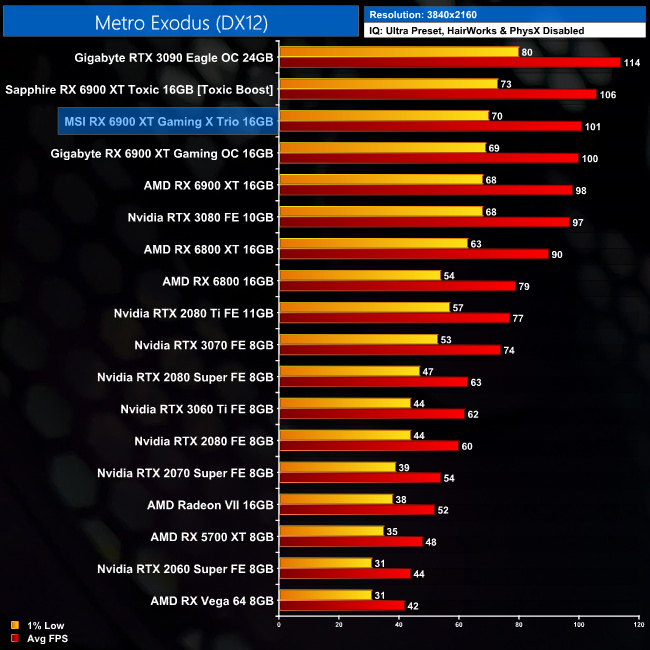
Metro Exodus sees the Gaming X Trio outperform the reference card by 3%, at both 1440p and 4K. It is 11% slower than the RTX 3090 at both resolutions.
Middle-earth: Shadow of War is an action role-playing video game developed by Monolith Productions and published by Warner Bros. Interactive Entertainment. It is the sequel to 2014’s Middle-earth: Shadow of Mordor, and was released worldwide for Microsoft Windows, PlayStation 4, and Xbox One on October 10, 2017. (Wikipedia).
Engine: LithTech Firebird. We test using the Very High preset, DX11 API.
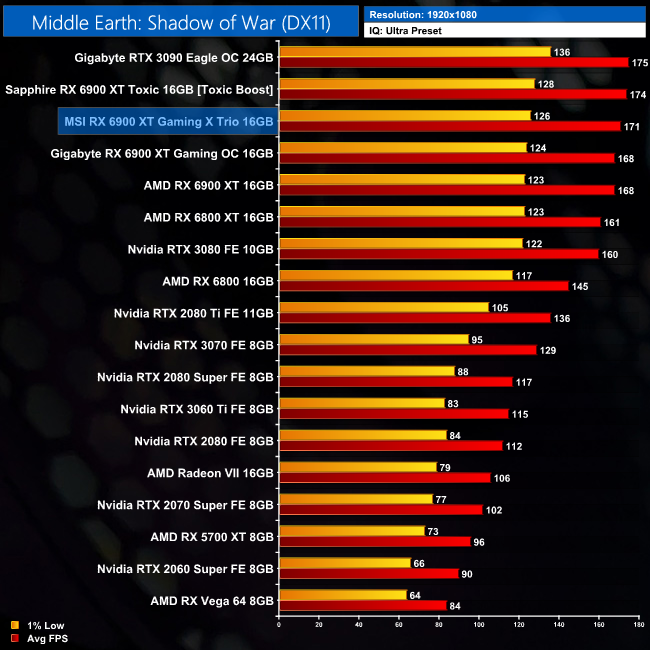
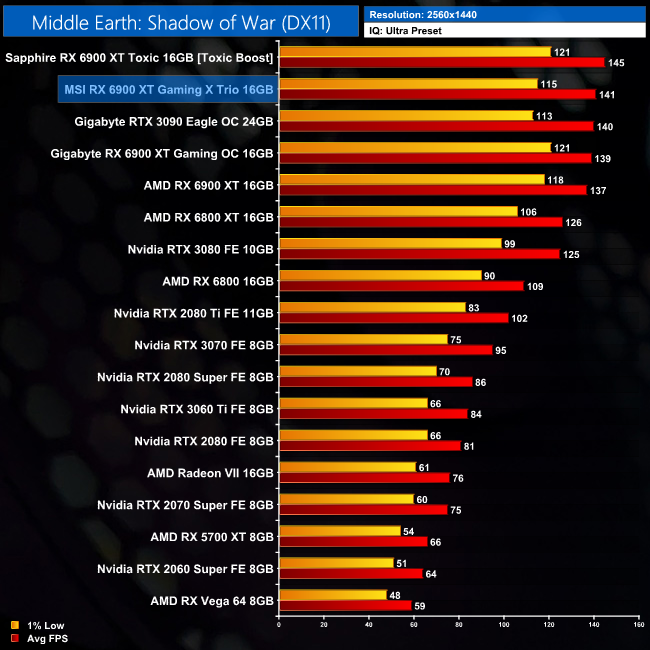
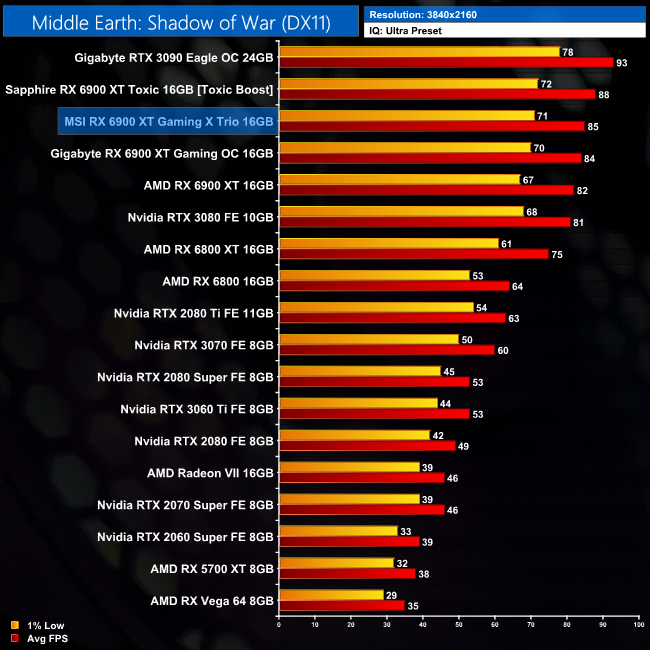
Moving on, we come to Shadow of War. This sees a 4% gain for the Gaming X Trio, compared to AMD's reference card, when testing at 4K, though it is still 9% slower than the RTX 3090 here.
Red Dead Redemption 2 is a 2018 action-adventure game developed and published by Rockstar Games. The game is the third entry in the Red Dead series and is a prequel to the 2010 game Red Dead Redemption. Red Dead Redemption 2 was released for the PlayStation 4 and Xbox One in October 2018, and for Microsoft Windows and Stadia in November 2019. (Wikipedia).
Engine: Rockstar Advance Game Engine (RAGE). We test by manually selecting Ultra settings (or High where Ultra is not available), TAA, Vulkan API.


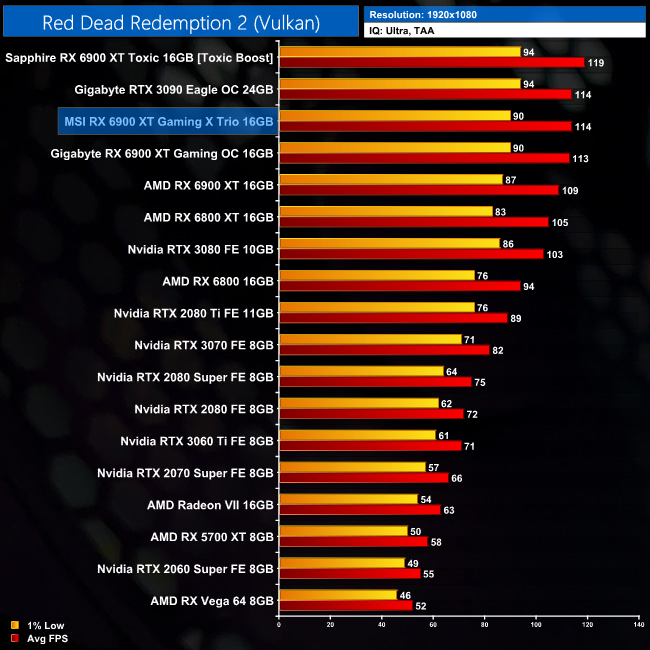
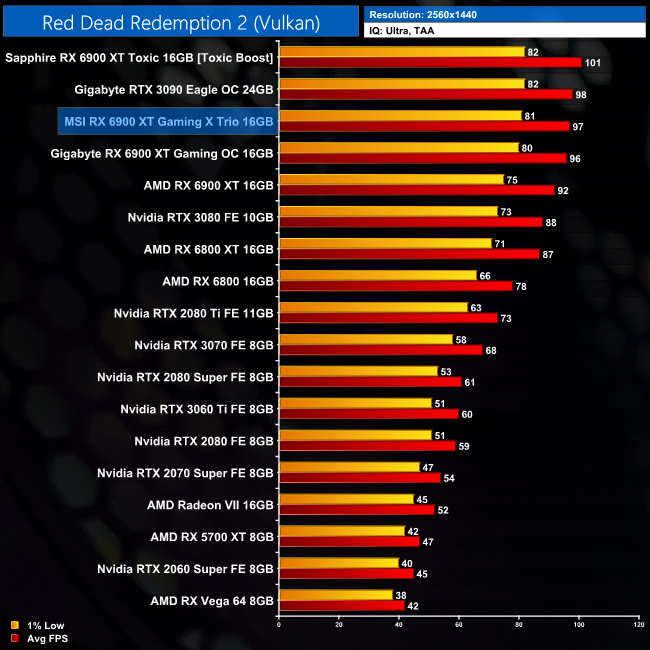
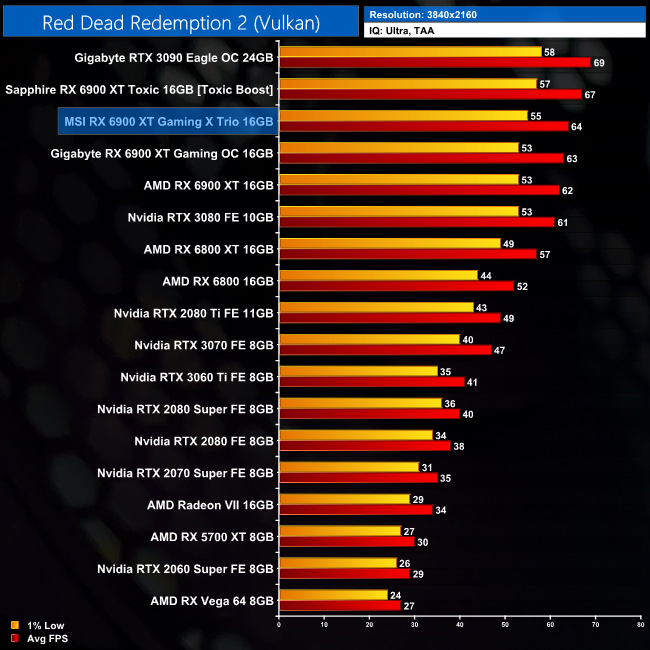
Red Dead Redemption 2 sees the Gaming X Trio edge ahead of the reference card by 3% at 4K, while it is 7% slower than RTX 3090.
Shadow of the Tomb Raider is an action-adventure video game developed by Eidos Montréal in conjunction with Crystal Dynamics and published by Square Enix. It continues the narrative from the 2013 game Tomb Raider and its sequel Rise of the Tomb Raider, and is the twelfth mainline entry in the Tomb Raider series. The game released worldwide on 14 September 2018 for Microsoft Windows, PlayStation 4 and Xbox One. (Wikipedia).
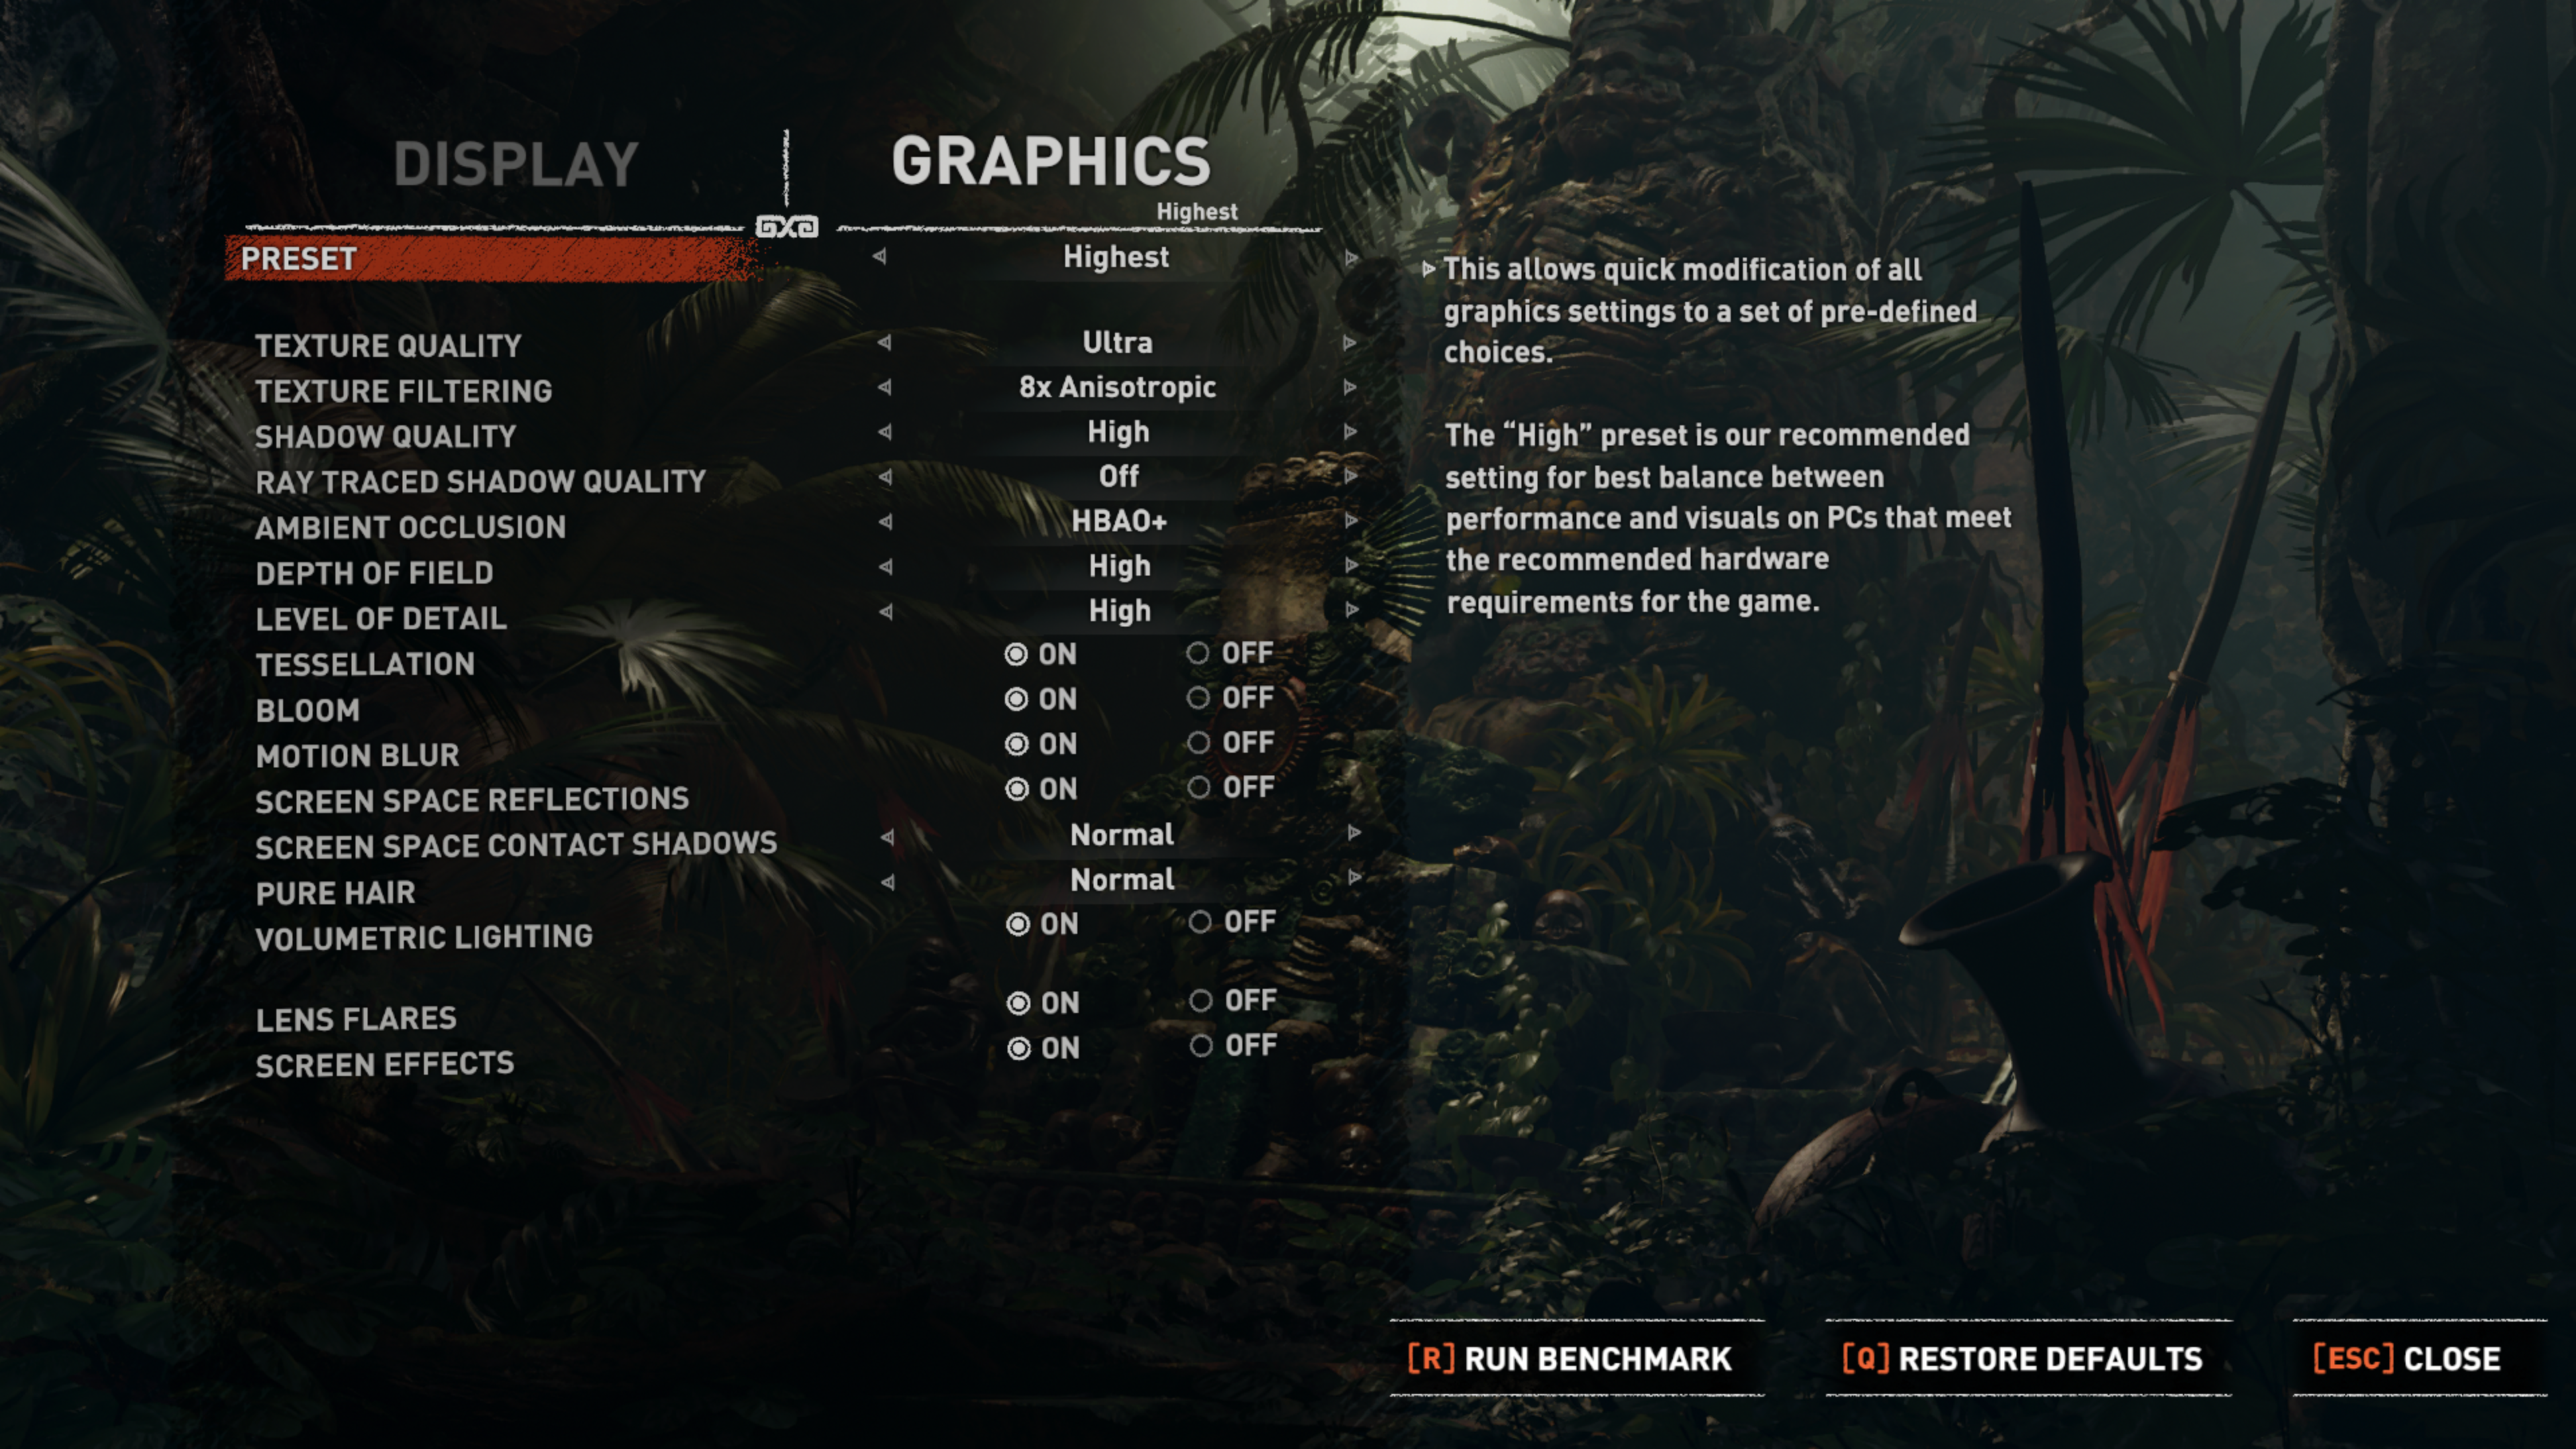
Engine: Foundation Engine. We test using the Highest preset, with TAA, DX12 API.
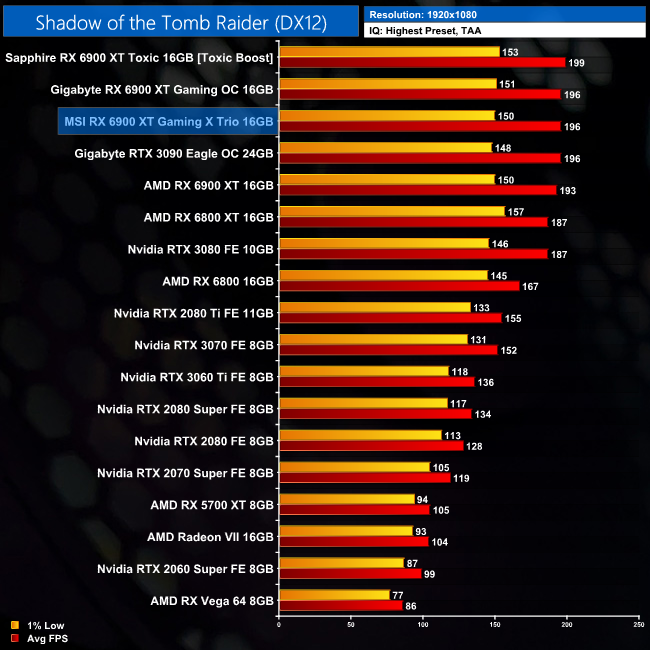
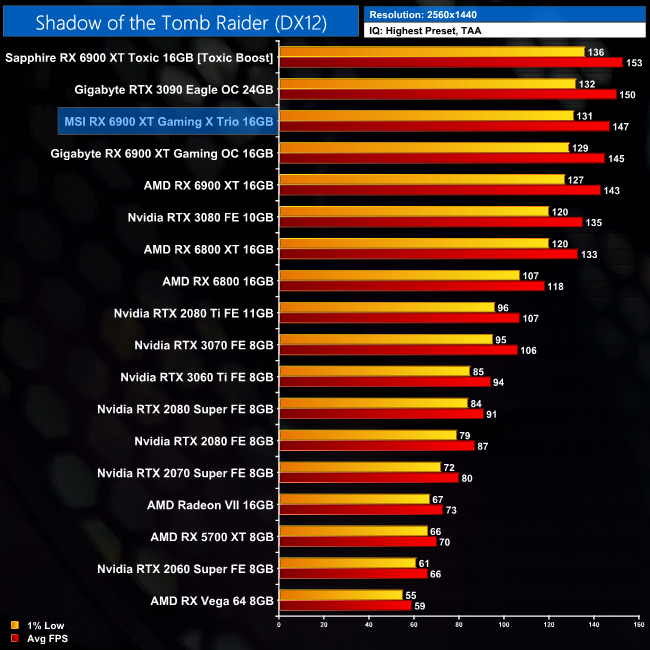
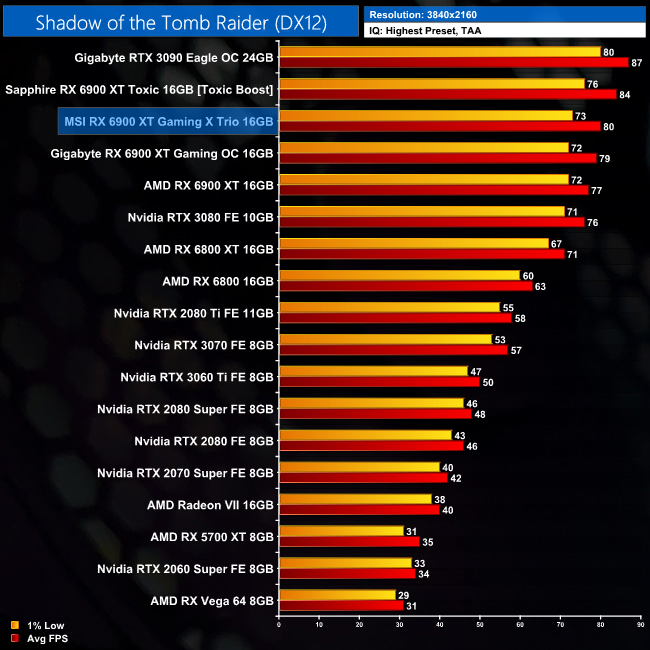
Shadow of the Tomb Raider is another game we will be retiring from our test suite soon, but here we can see the Gaming X Trio is 4% faster than the reference card when testing at 4K. Compared to the RTX 3090, it is 8% slower.
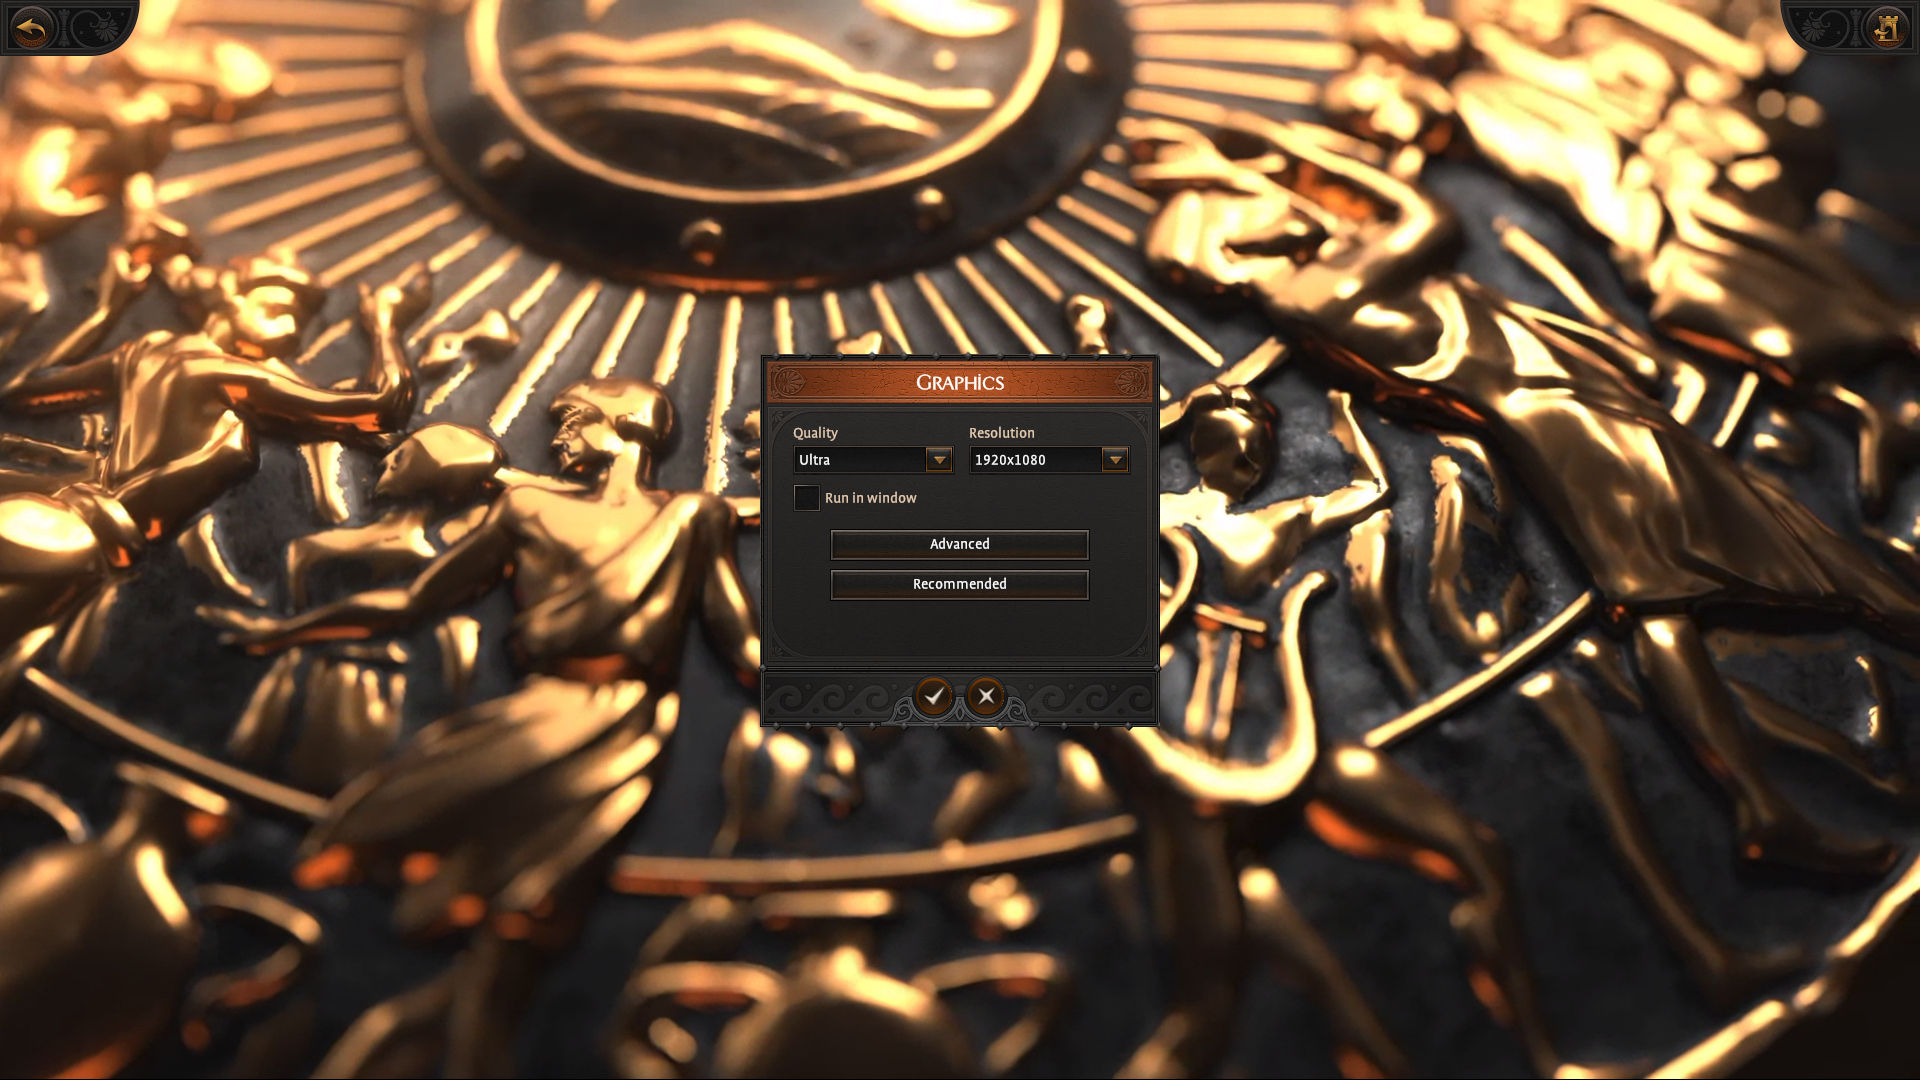
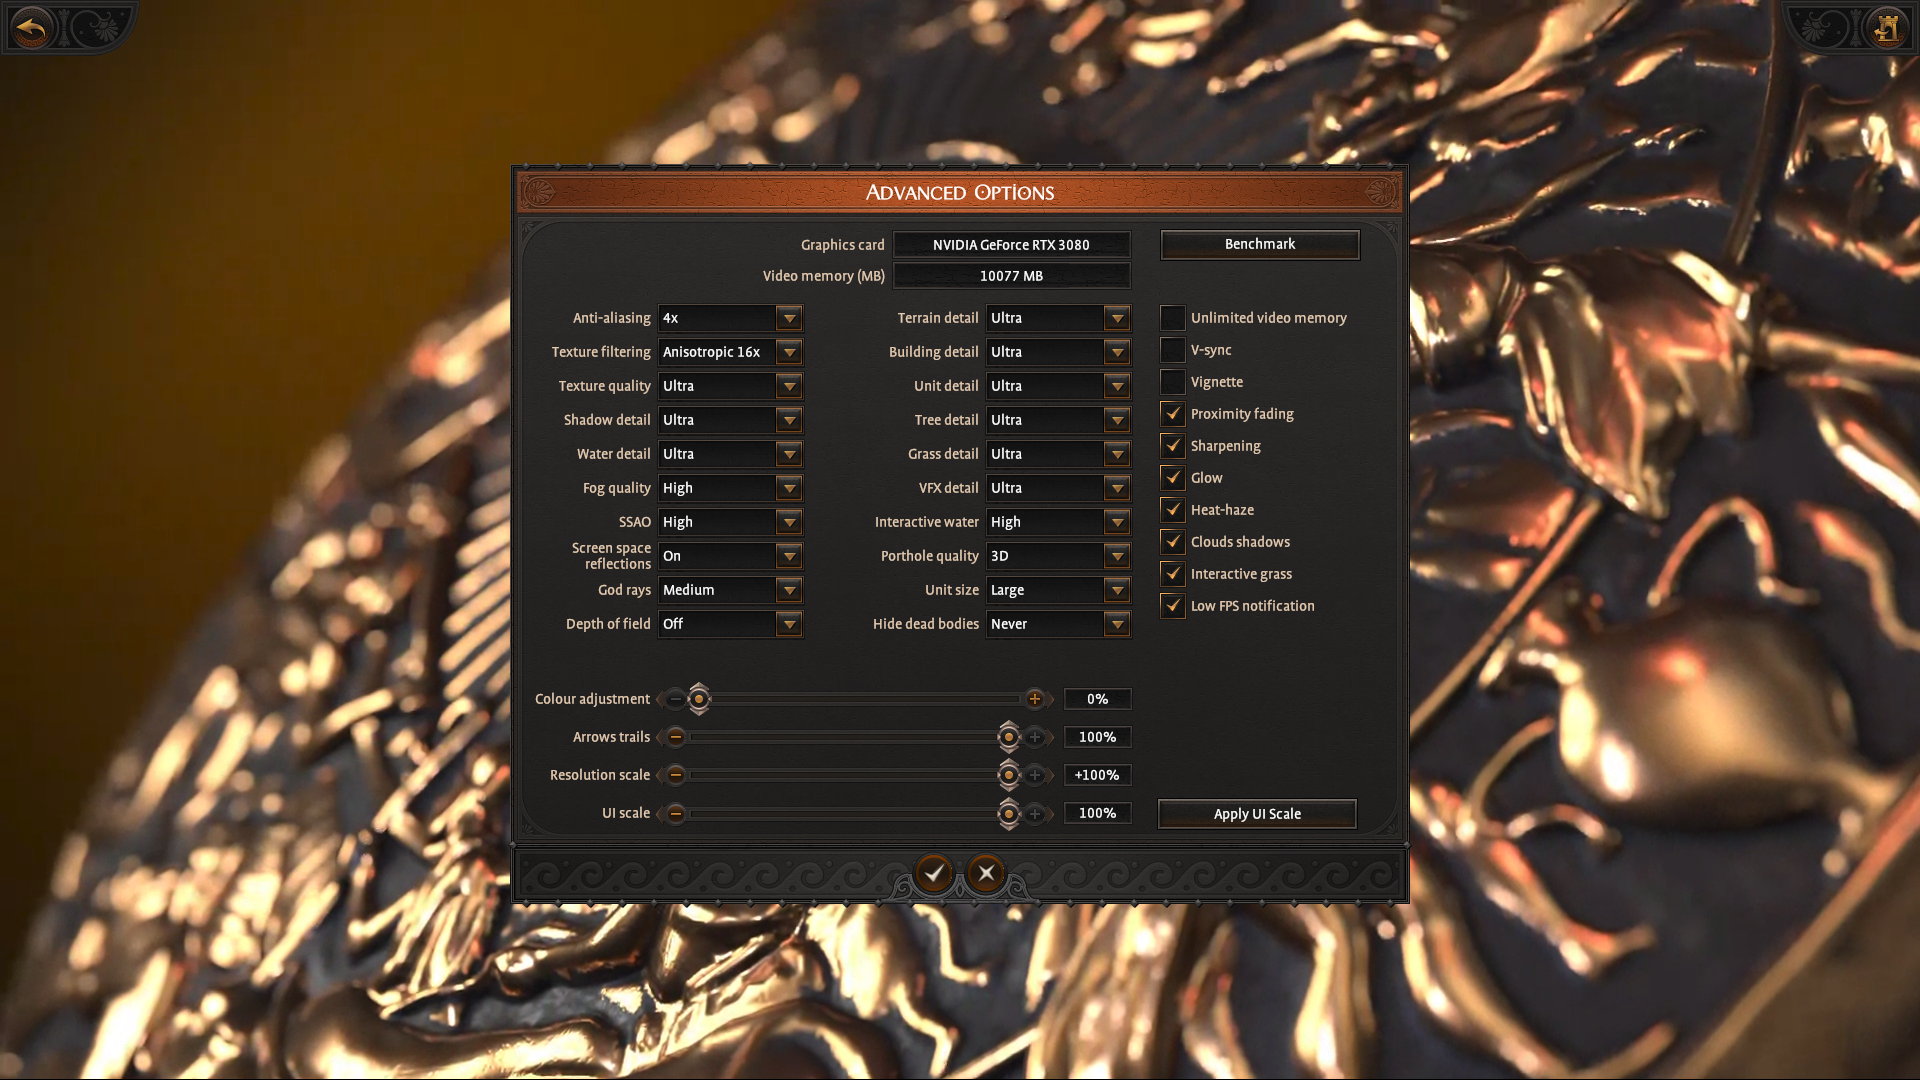
Total War Saga: Troy is a 2020 turn-based strategy video game developed by Creative Assembly Sofia and published by Sega. The game was released for Windows on 13 August 2020 as the second installment in the Total War Saga subseries, succeeding Thrones of Britannia (2018). (Wikipedia).
Engine: TW 3 Engine. We test using the Ultra preset, DX11 API.
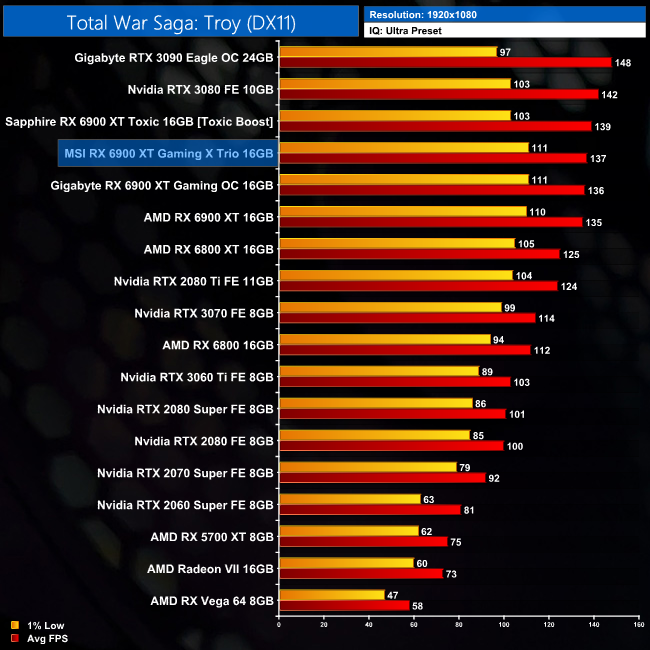
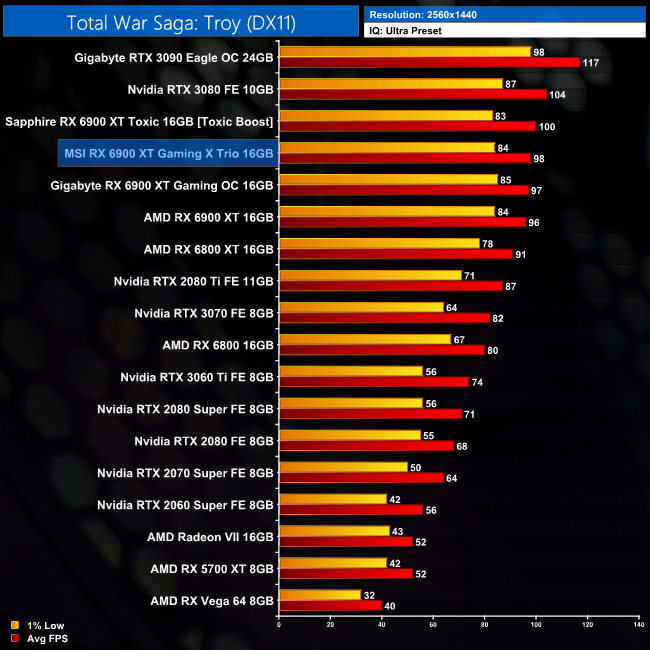
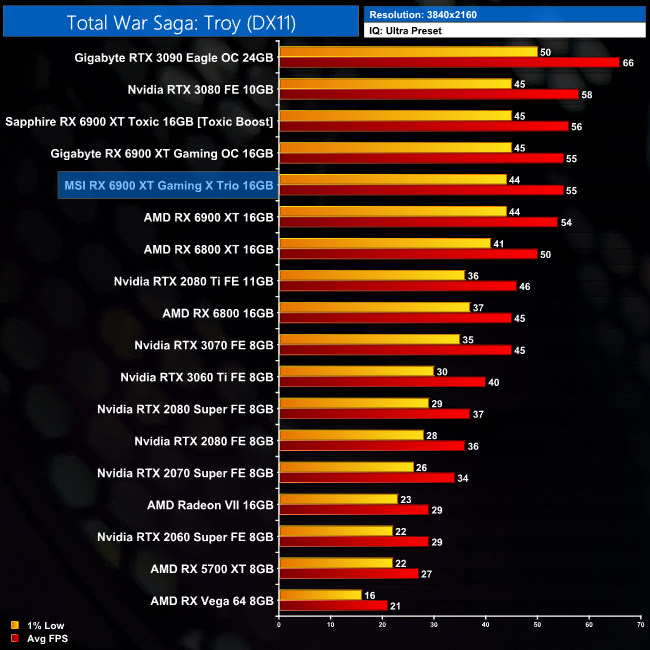
Total War Saga: Troy is a game where frequency doesn't seem to matter much, and as a result the Gaming X Trio is only 2% faster than AMD's reference card, at both 1440p and 4K. Compared to the RTX 3090, it is 16% slower at 1440p and 17% slower at 4K.
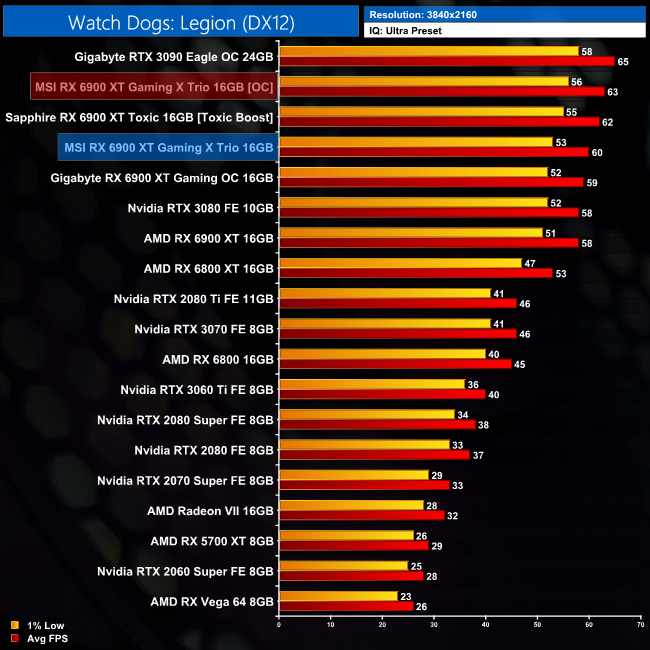
Watch Dogs: Legion is a 2020 action-adventure game published by Ubisoft and developed by its Toronto studio. It is the third instalment in the Watch Dogs series, and the sequel to 2016's Watch Dogs 2. Legion was released on October 29, 2020 for Microsoft Windows, PlayStation 4, Xbox One, and Stadia. (Wikipedia).
Engine: Disrupt. We test using the Ultra preset, DX12 API.

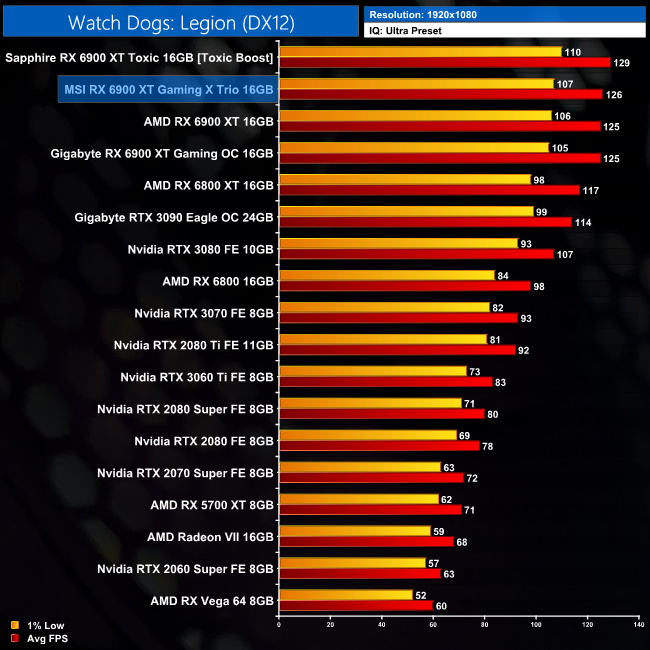
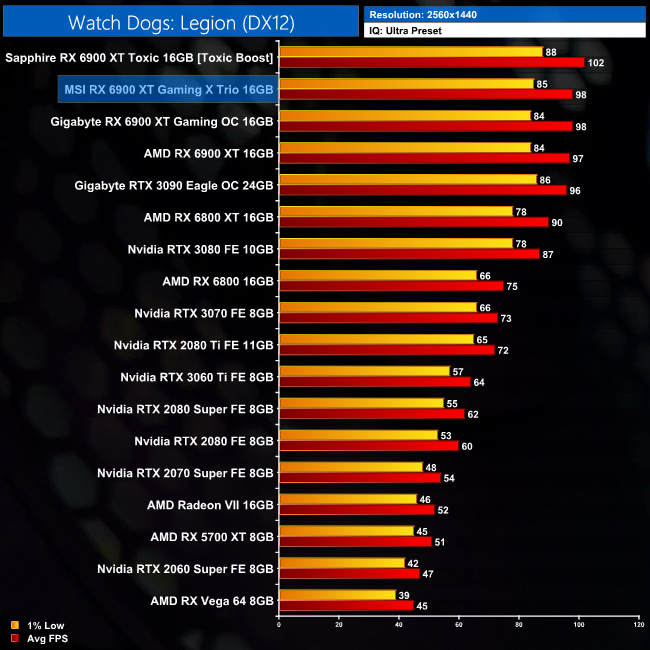
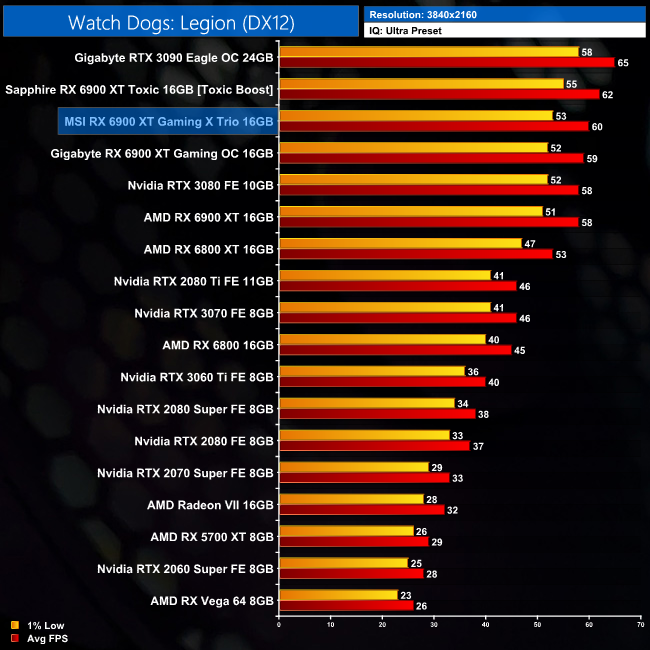
Lastly, we come to Watch Dogs: Legion. Here, the Gaming X Trio stretches to a 3% advantage over the reference card when testing at 4K. It is 8% slower than RTX 3090 at that same resolution.
Here we present the average clock speed for each graphics card while running the 3DMark Time Spy stress test for 30 minutes. We use GPU-Z to record the GPU core frequency during the Time Spy runs. We calculate the average core frequency during the 30 minute run to present here.
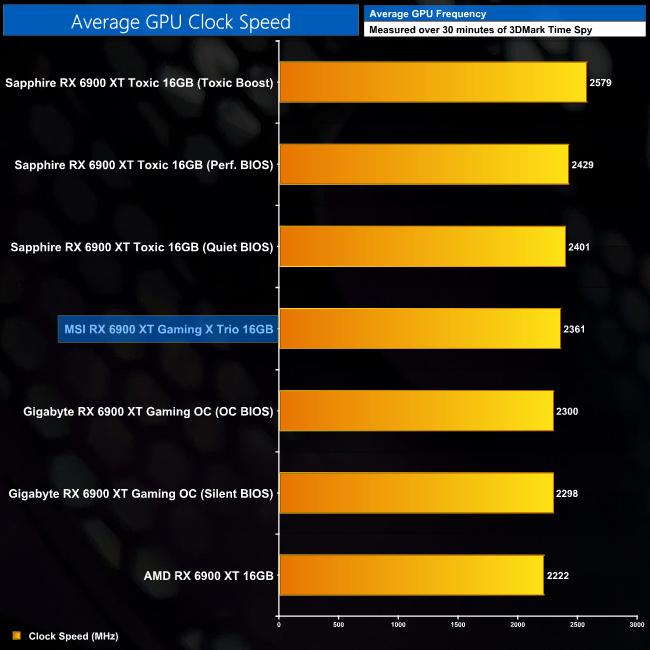
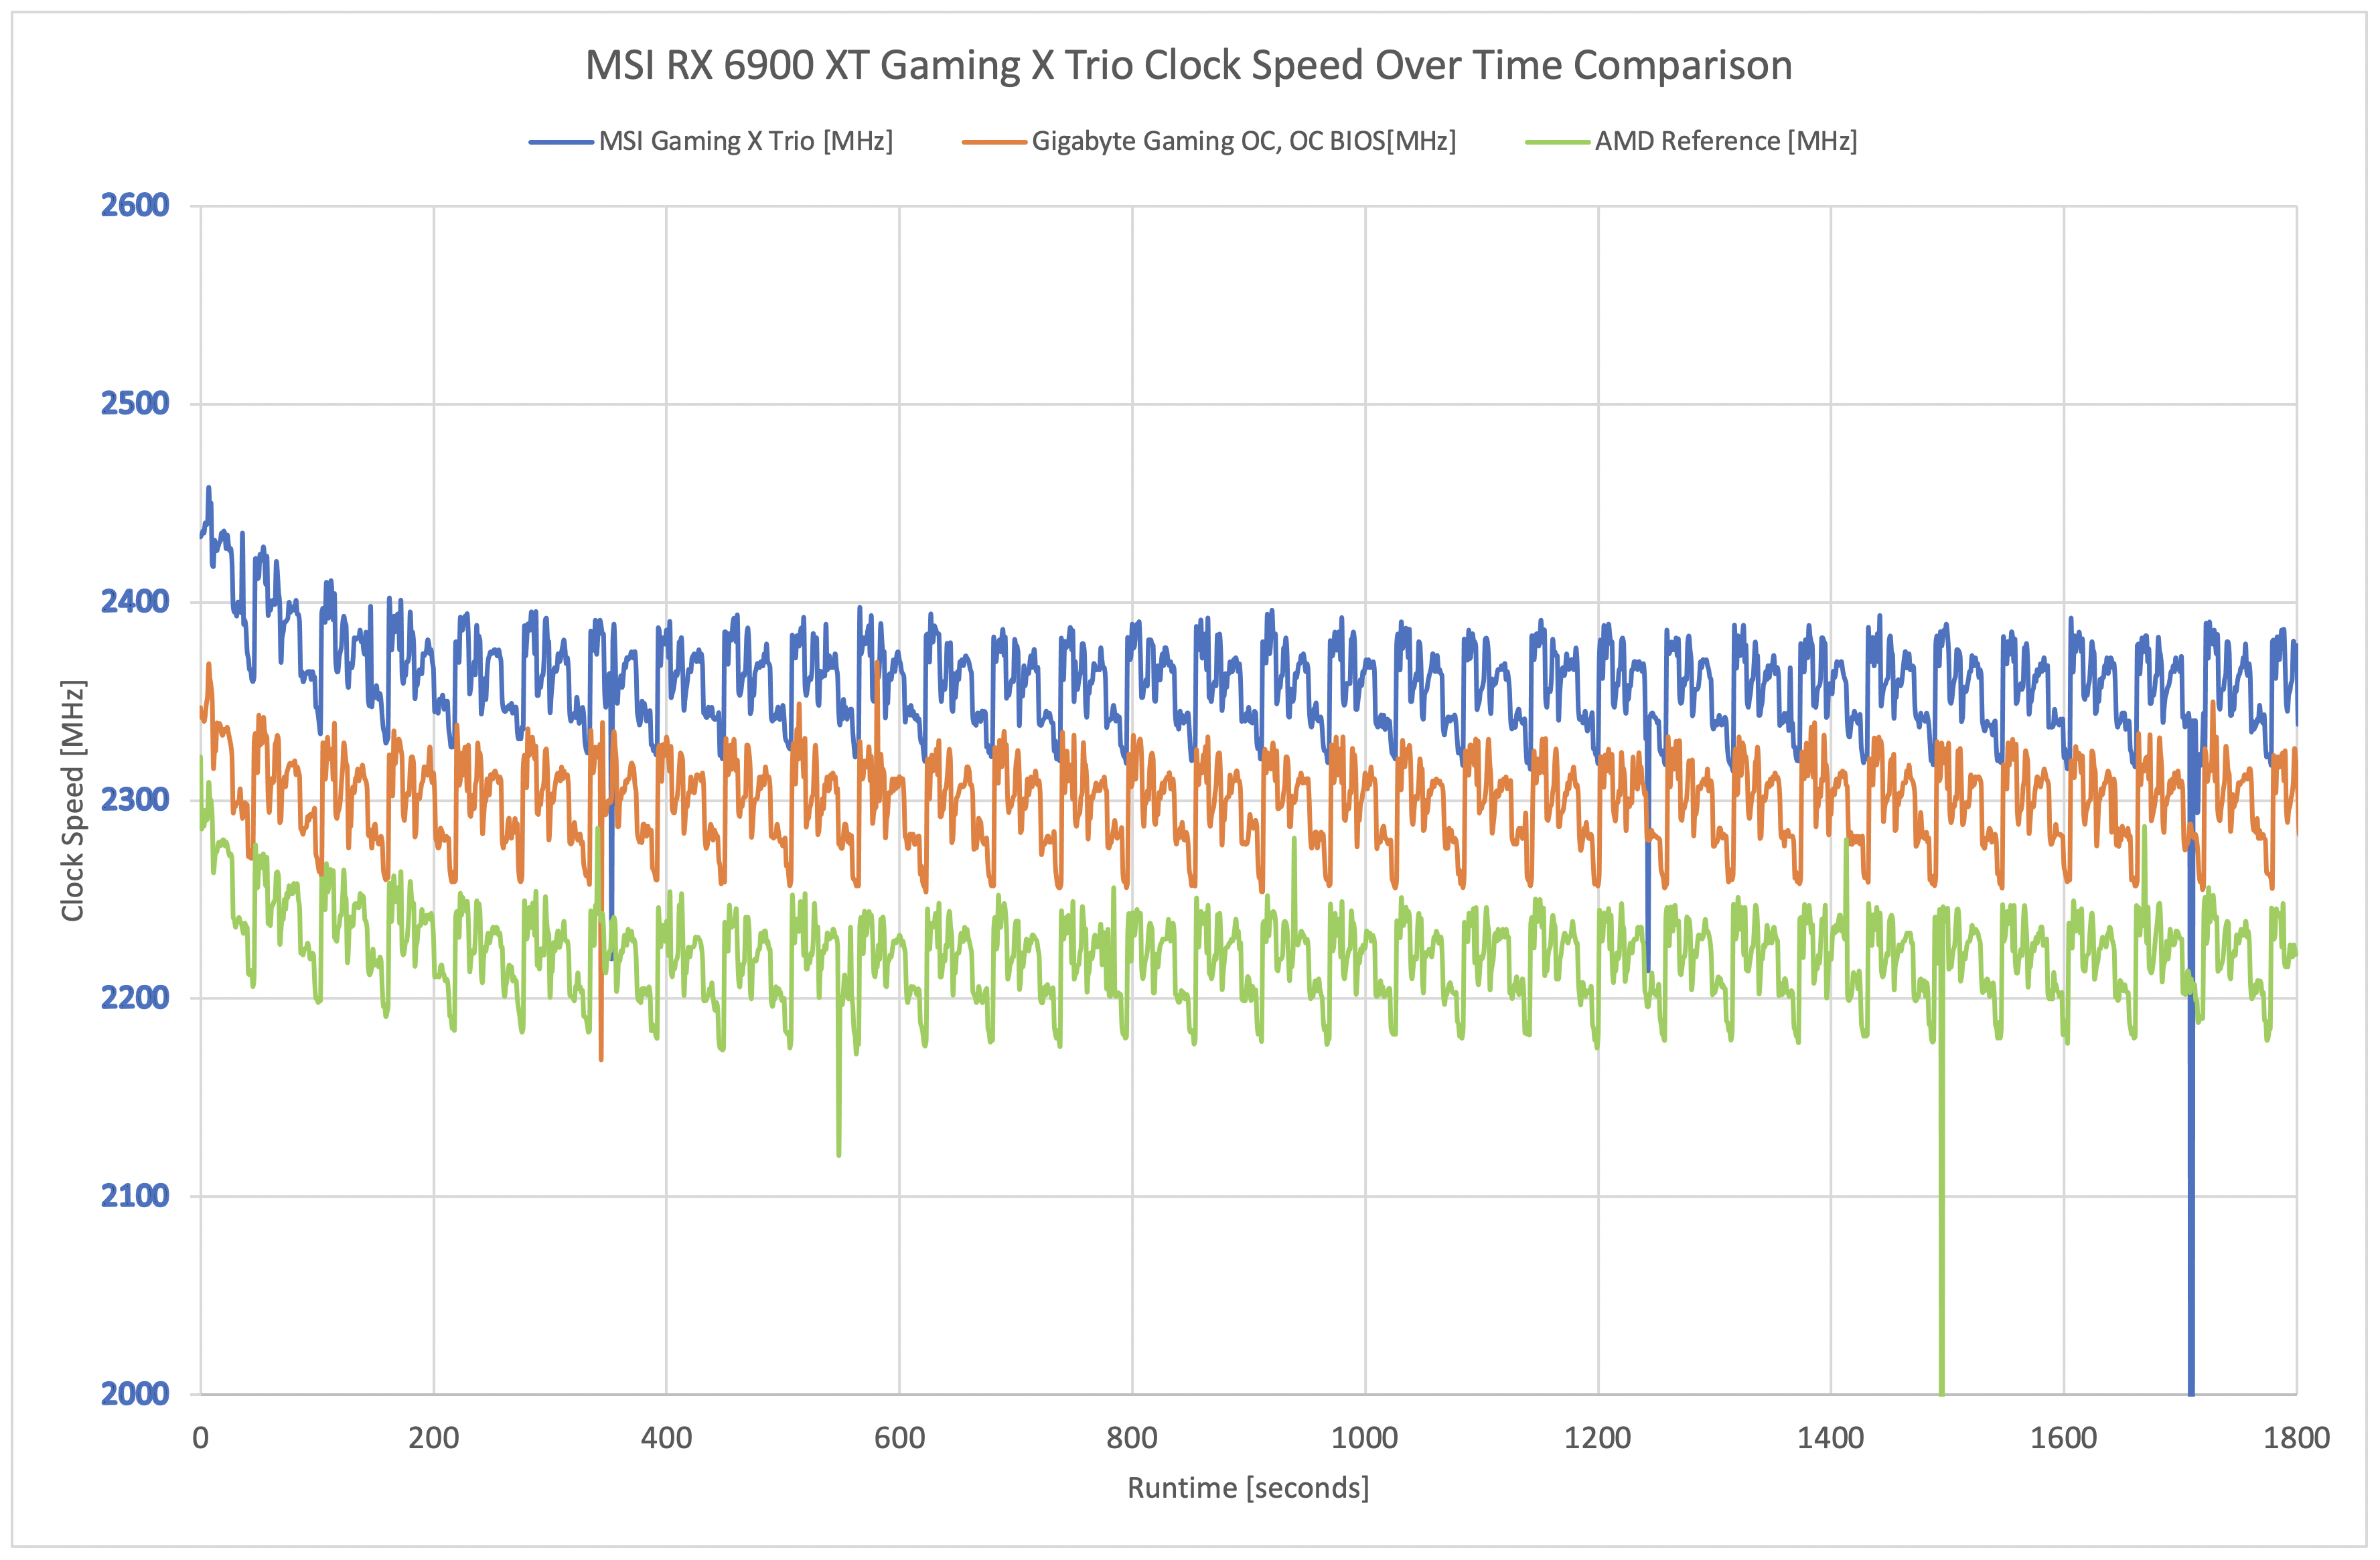
In terms of its clock speed, the Gaming X Trio has the highest rated boost clock of all the air-cooled RX 6900 XTs we have tested so far, so it is not a surprise to see that translate into real-world performance. Over our 30-minute stress test, the GPU averaged 2361MHz, making it 61MHz faster than the Gigabyte Gaming OC, and almost 140MHz faster than the reference card.
For our temperature testing, we measure the peak GPU core temperature under load. A reading under load comes from running the 3DMark Time Spy stress test for 30 minutes.
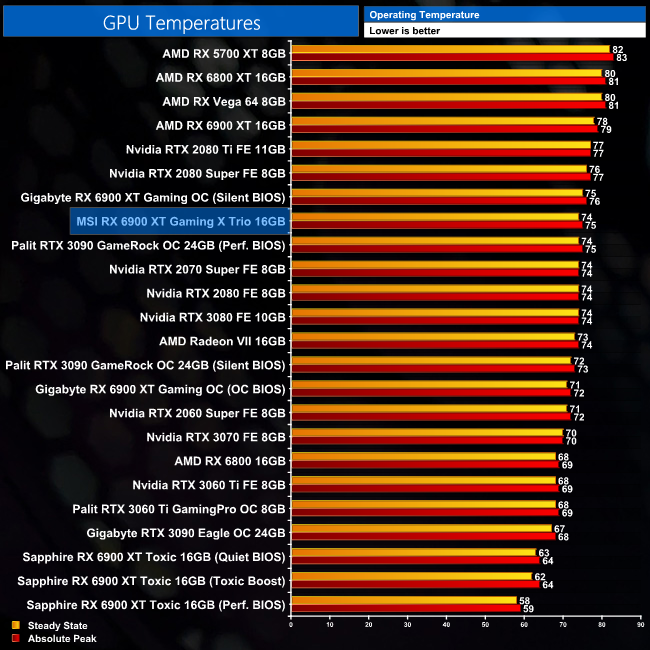
Thermals is where things get interesting. As we will see on the next page, in typical MSI fashion the Gaming X Trio operates with a very conservative fan curve, meaning GPU edge temperatures are a little higher than we would expect for a card of this size, peaking at 75C.
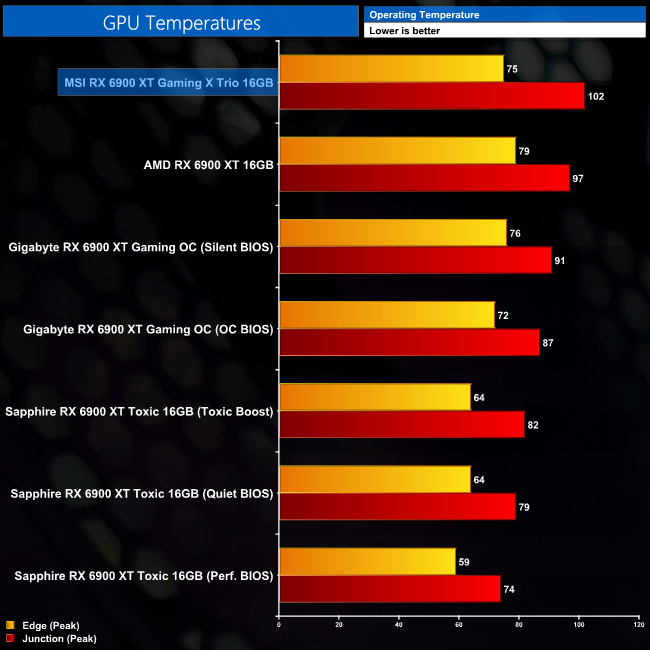
It is the junction temperature which caught my eye, though. Peaking at 102C during my testing, this is 5C hotter than the reference card, and 11C hotter than the Gaming OC when using its Silent BIOS.
We got in touch with MSI to pass on our findings and they sent us a second sample to test, but it still exhibited the exact same behaviour. Bear in mind that 102C is still ‘in spec', as AMD says a junction temperature of up to 110C is safe for the 6900 XT GPU. It is, however, clearly not a very good result compared to the competition and AMD's own reference card.
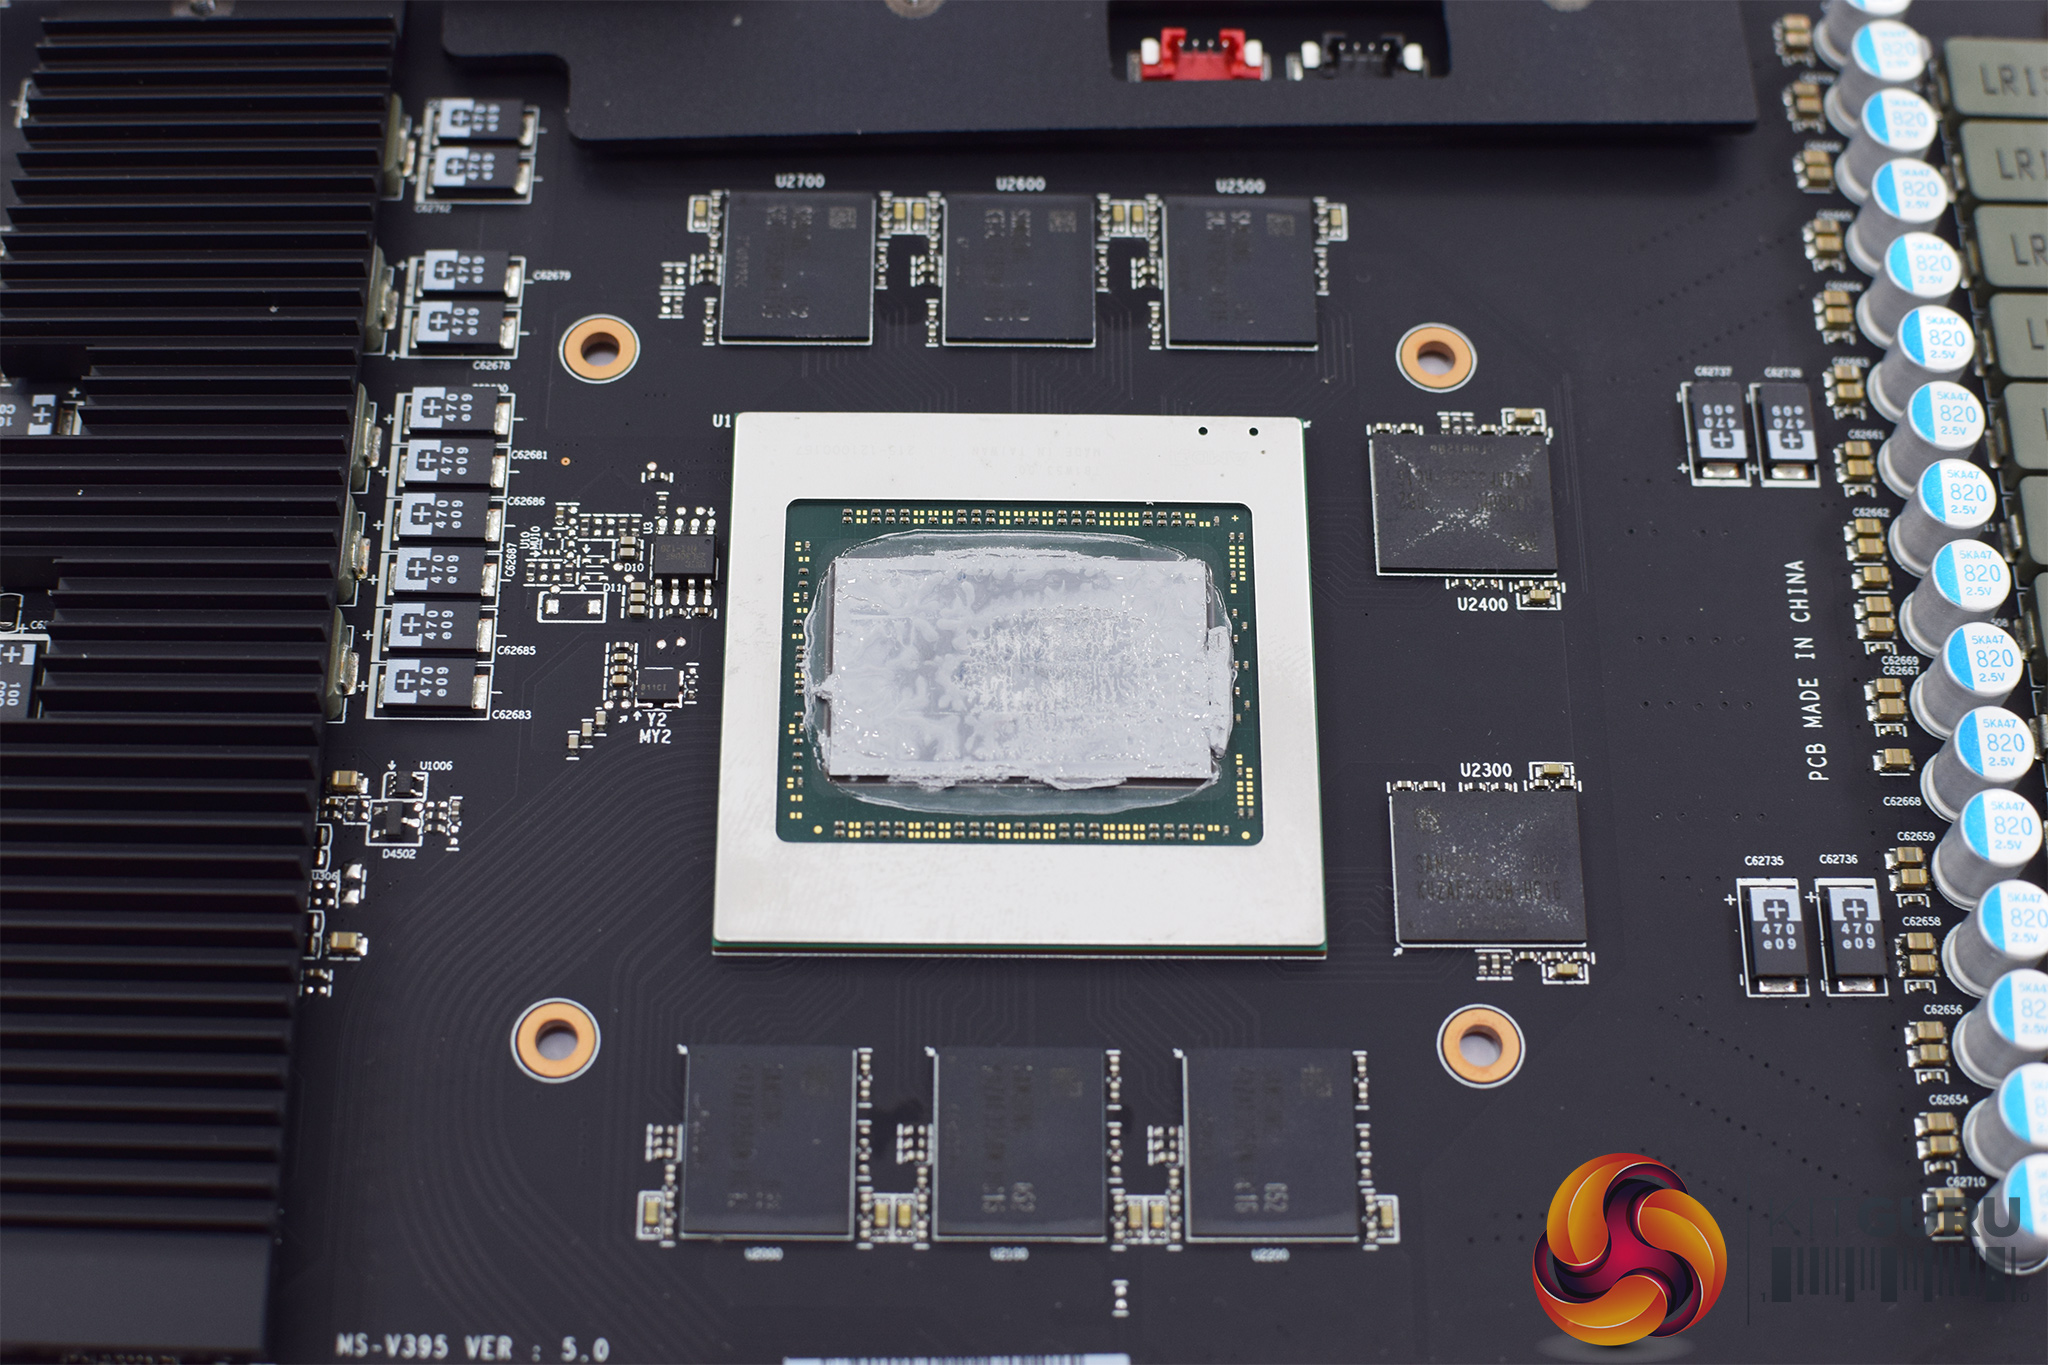
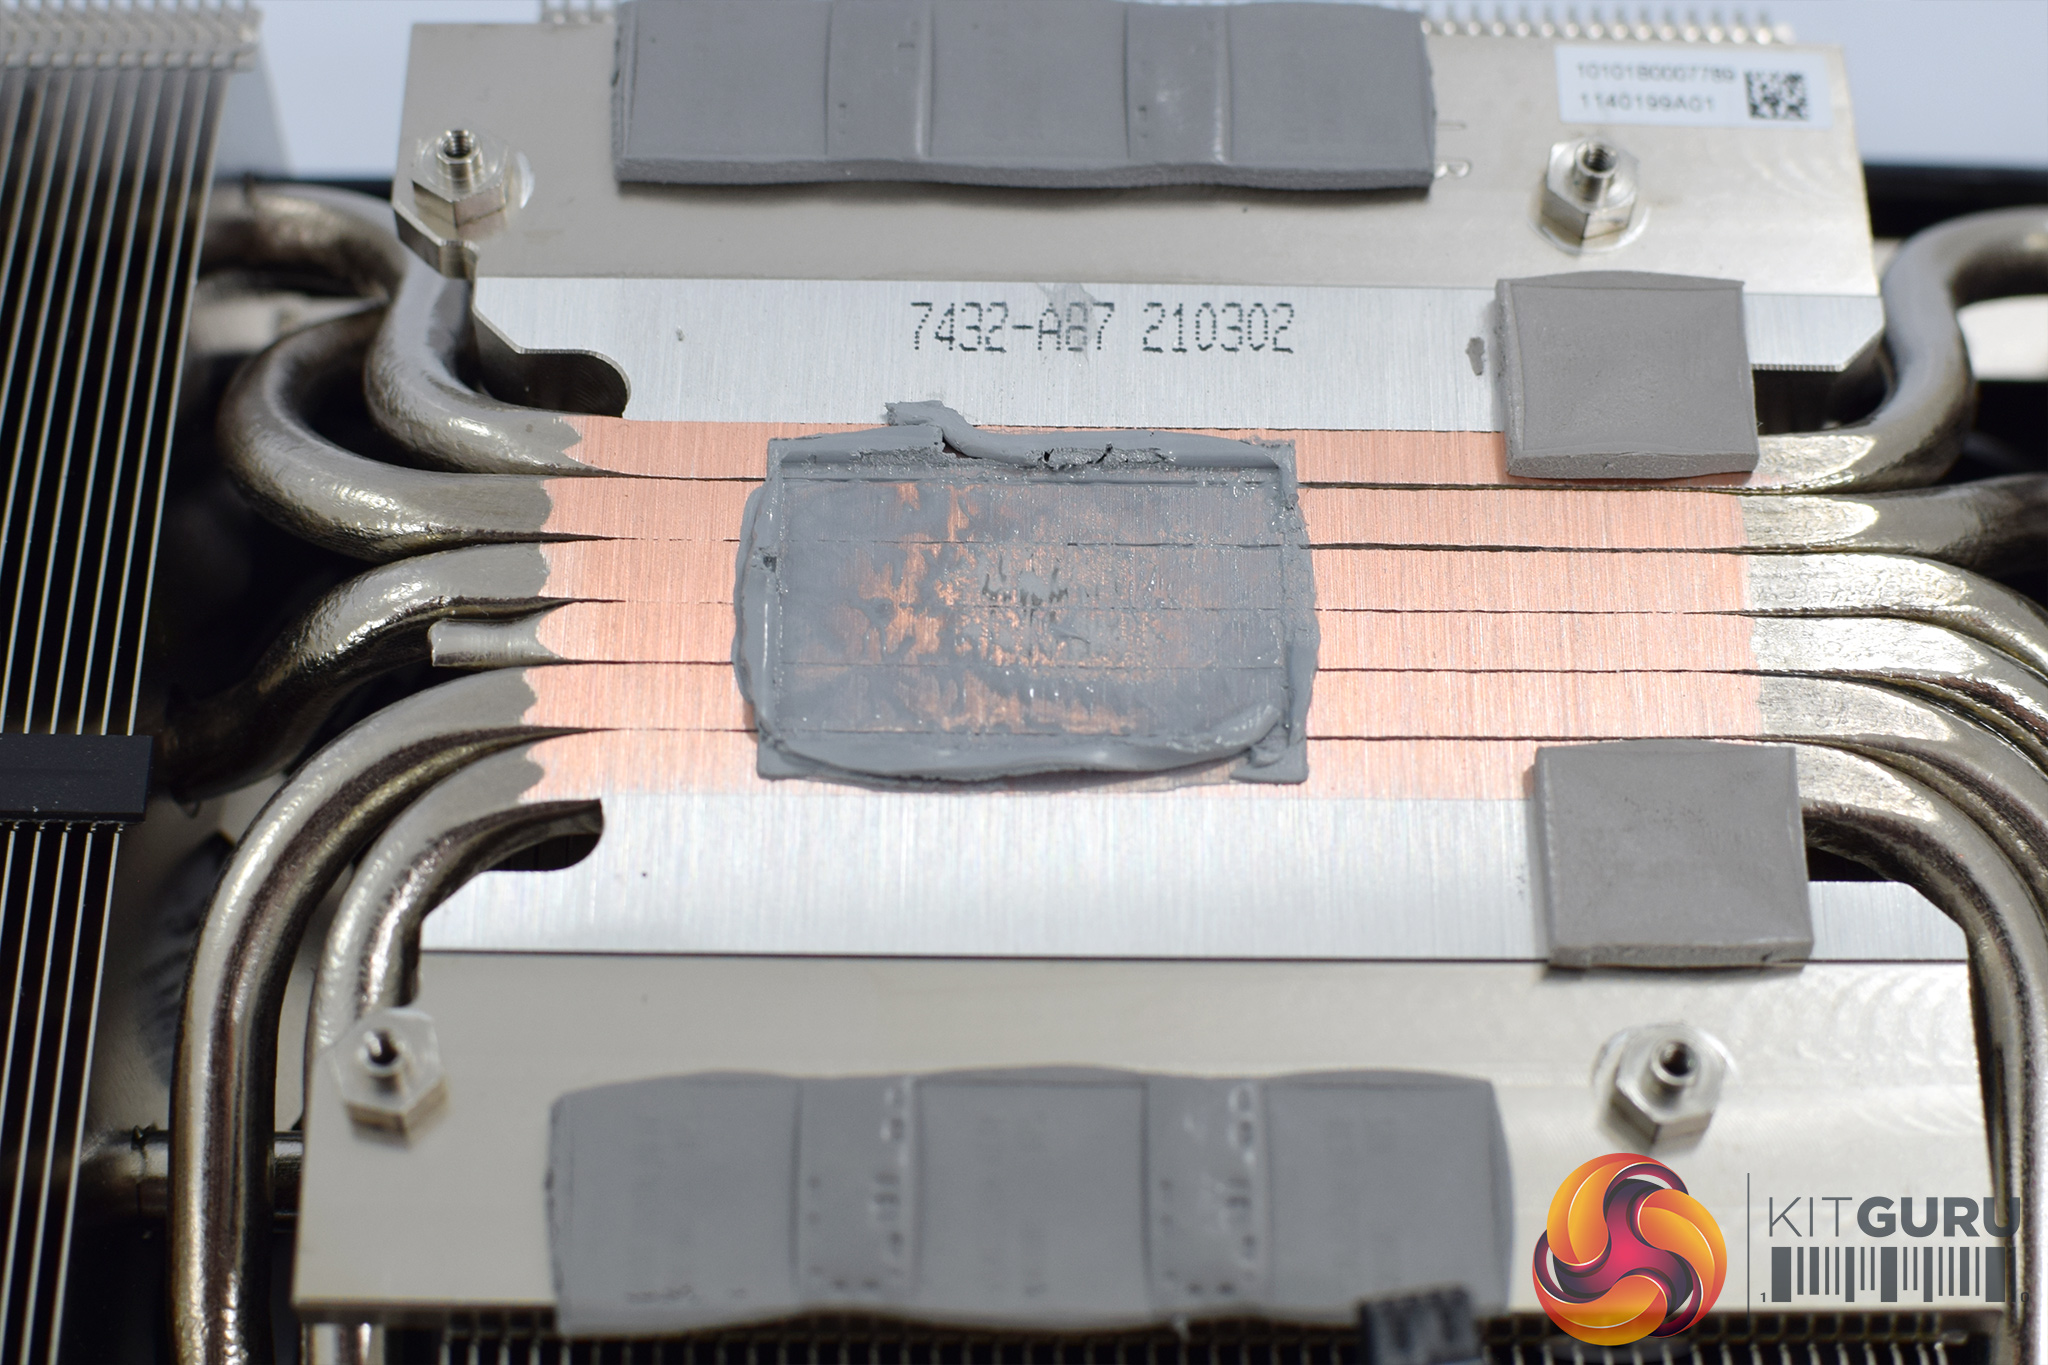
My working theory as to why we are seeing these high junction temperatures (it was 100% repeatable across both cards we tested) comes down to the cooler mounting mechanism, or the heatspreader flatness – perhaps a combination of the two. Upon disassembling the card, I did notice the thermal paste towards the centre of the die seems much thinner and more dried out, potentially indicating less pressure was being applied to the edges of the die.
I re-pasted the GPU and re-mounted the cooler, but my results did not change. I will update this review if we hear anything further from MSI regarding these results.We take our noise measurements with the sound meter positioned 1 foot from the graphics card. I measured the noise floor to be 32 dBA, thus anything above this level can be attributed to the graphics cards. The power supply is passive for the entire power output range we tested all graphics cards in, while all CPU and system fans were disabled. A reading under load comes from running the 3DMark Time Spy stress test for 30 minutes.
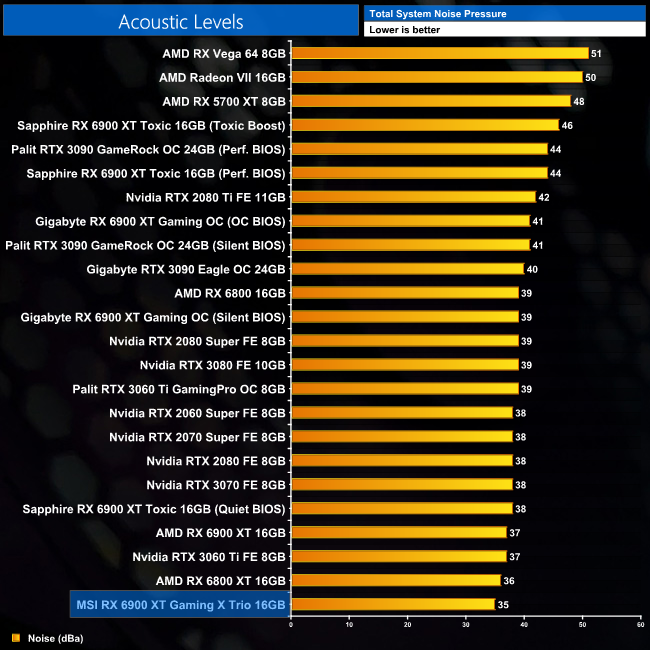
The Gaming X Trio is a whisper-quiet graphics card. Default behaviour sees the three fans spin up to 43%, or 1510rpm, registering just 35dBa on our sound meter. The noise was barely noticeable to the ear, and only when I moved within a few inches of our Meshify S2 chassis.
Following on from our stock thermal and acoustic testing, here we re-test the operating temperature of the GPU, but with noise levels normalised to 40dBa. This allows us to measure the efficiency of the overall cooling solution as varying noise levels as a result of more aggressive fan curves are no longer a factor.
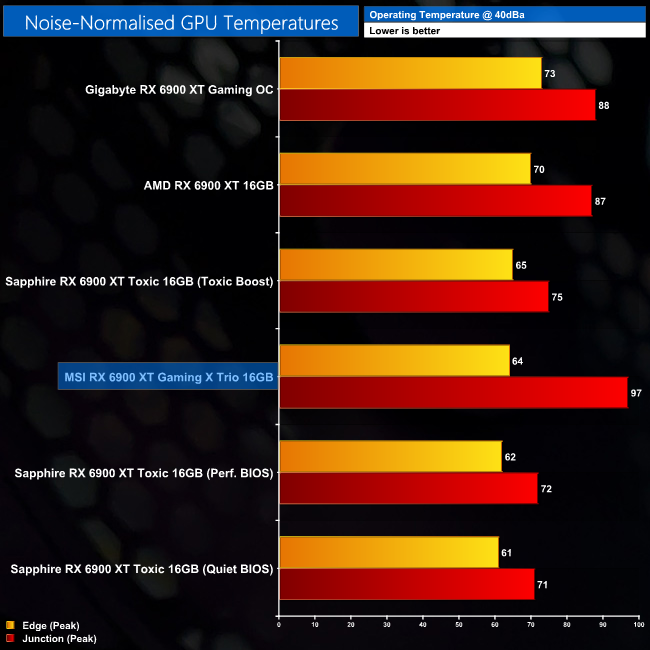
Such a conservative default fan curve leaves a lot of room for thermal improvement when we noise-normalise to 40dBa. For the Gaming X Trio, this meant raising fan speed from 1410rpm up to 2020rpm, or 58%. That helps significantly with edge temperature, dropping from 75C down to 64C. We are, however, still seeing high junction temperatures, and the numbers being reported look even more drastic when noise-normalised, with the junction temperature 33C hotter than the edge. For the other cards we have tested, that delta between the edge and junction temperature is just 10-17C.
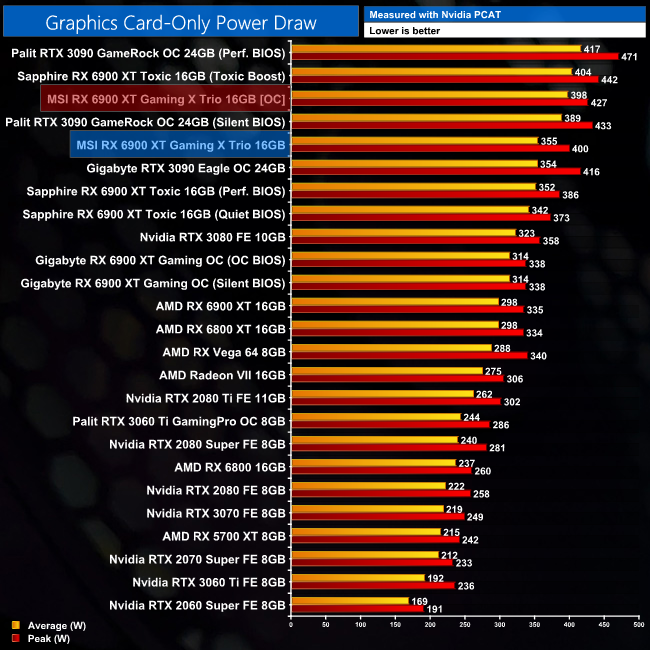
We measure system-wide power draw from the wall while running the 3DMark Time Spy stress test for 30 minutes.
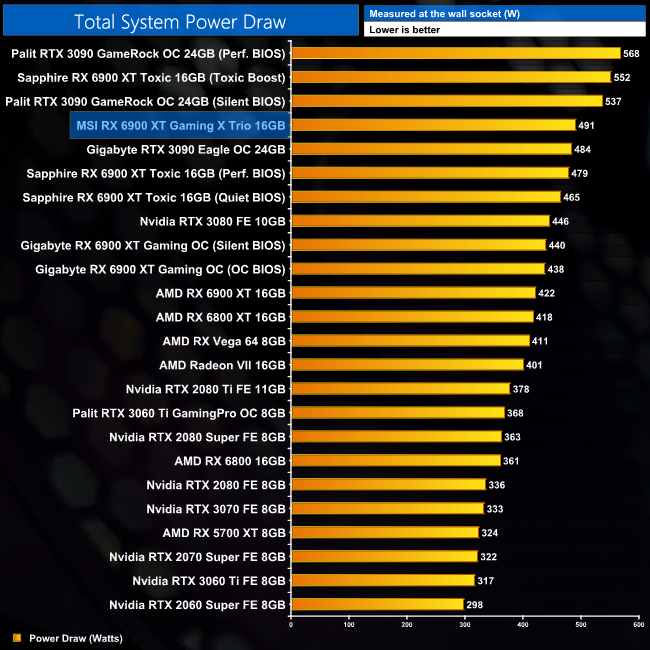
We also use Nvidia PCAT to measure power draw of the graphics card only, with readings from both the PCIe slot and the PCIe power cables combined into a single figure. This provides us with significantly more accurate data to work with as it is measuring only the GPU power, and not total system power which is a fundamentally imprecise measurement.
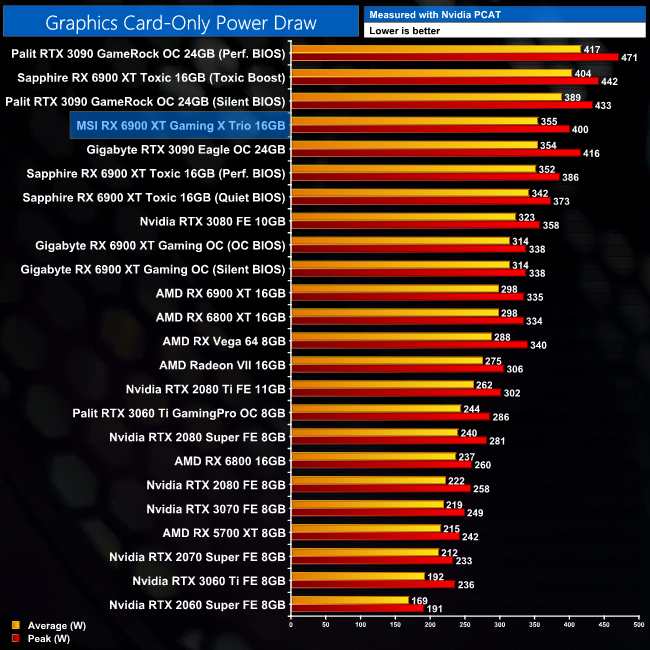
Looking at total board power, MSI has boosted power draw pretty significantly with the Gaming X Trio. My testing shows an average consumption of 355W, almost 60W above the reference card and 40W higher than the Gigabyte Gaming OC.
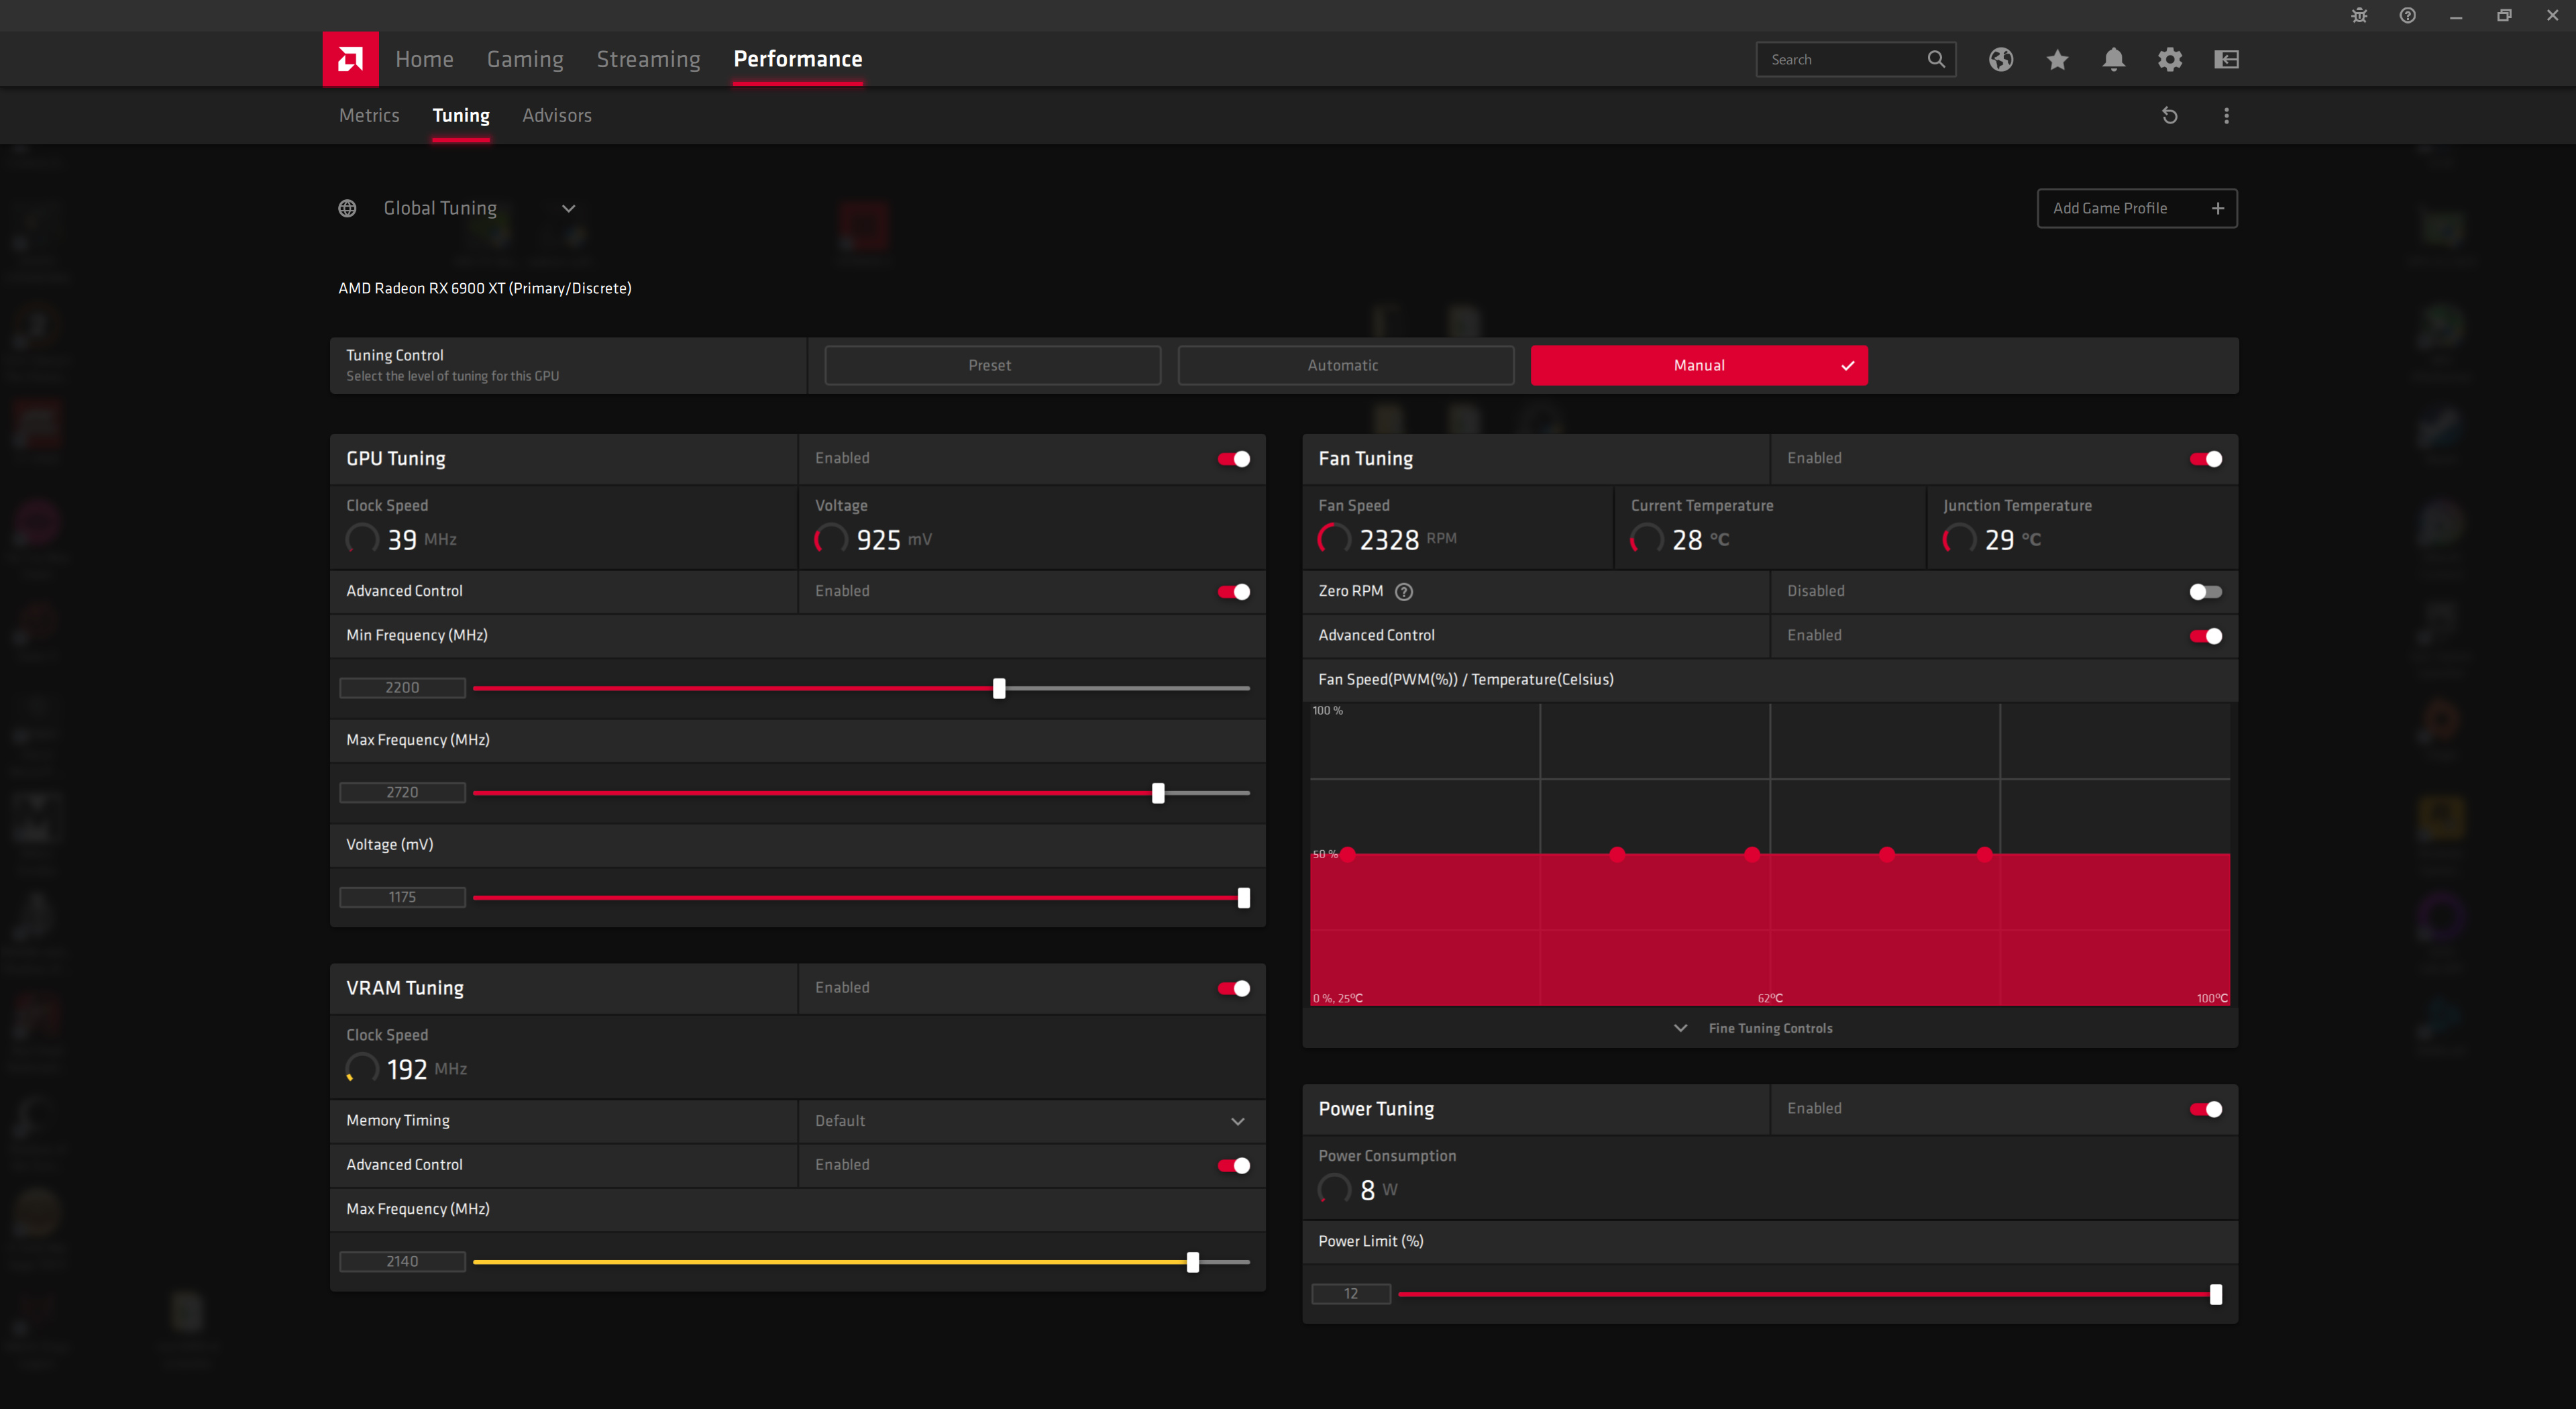
For our manual overclocking, we maximised the power limit (+12%) and set the GPU core to 2720MHz. We set the memory to 2140MHz as any further resulted in performance degradation.
This overclock resulted in gains of between 4-6% in the games we re-tested at 4K.
Power draw, meanwhile, rose to 398W, an increase of 12%.
With the MSI RX 6900 XT Gaming X Trio, we have taken our third look at an air-cooled RX 6900 XT graphics card. Of those three cards, the Gaming X Trio is the biggest, has the highest rated clock speed and also offers the highest power target of around 350W based on our testing.
Unsurprisingly, it is therefore the fastest air-cooled 6900 XT we have tested, coming in on average 3% faster than AMD's reference card at both 1440p and 4K. Compared to the Gigabyte Gaming OC, it is 1% faster across the board, while it is 3% slower than the RTX 3090 at 1440p and 7% slower at 4K.
Those are pretty small performance differences, especially when power draw has increased by 19% compared to the reference design. Thankfully, manually overclocking did net further gains of between 4-6%, but at the cost of even more power, with the card drawing almost 400W when pushed to the limit.
MSI has also continued its tradition of producing ultra low-noise coolers that clearly prioritise noise over thermals. Out of the box, the Gaming X Trio produced just 35dBa of noise, while we saw GPU edge temperature hit 75C. Once we noise-normalised to 40dBa, edge temperature dropped down to 64C, so there is clear scope to run a more aggressive fan curve and be rewarded with lower temperatures if that is your preference.
At least, that is the case for edge temperature. The junction temperature for the Gaming X Trio – that is, the single hottest point on the GPU die – proved more problematic, in that it actually ran hotter than even the reference card. That was true when we tested the stock fan curve and became even more evident once we had noise-normalised. The other 6900 XTs we've tested reported a 10-17C delta between their edge and junction temperatures once noise-normalised. For the Gaming X Trio, we saw a 33C delta.
The only potential explanation I have for this comes down to heatspreader/GPU die flatness, or an uneven distribution of pressure from the mounting system. The latter theory seems to be supported by the thermal paste spread of the GPU, with very little paste found in the centre of the die as it has been pushed to the edges. I did try re-pasting and re-mounting the cooler, but that didn't change the results.
It is also potentially noteworthy that MSI is not using a baseplate to contact with the GPU die, instead the heatpipes contact the GPU directly. Whether or not this is a factor, I really can't say – but all of the other 6800 XTs and 6900 XTs I have tested have used baseplates, and you would think that a baseplate is easier to machine flat than six heatpipes.
We have been in contact with MSI about our findings and were sent a second card to test, but that behaved exactly the same as our first sample. It is worth bearing in mind that the maximum junction temperature we saw was 102C, and AMD says up to 110C is in spec. Of course, that doesn't change the fact that the Gaming X Trio has the highest junction temperature of any 6900 XT we have tested so far.
When we factor that in, as well as the UK MSRP of £1259.99, it becomes very tricky to give this card a solid recommendation, especially as we know real world pricing will be far higher. Even if we go off the MSRP, that's still £180 above the Gigabyte Gaming OC, for not a whole lot of extra performance – and significantly hotter junction temperatures.
For now, my recommendation would be to hold off on the MSI RX 6900 XT Gaming X Trio. I initially thought my sample could have been defective, but having tested two cards with both showing hot spot temperatures exceeding 100C, we can say that is not the case. As good as it is in other areas, the hot spot issue is enough for me to recommend looking at another model if you do want to buy an RX 6900 XT.
We don't yet have a buy link for the Gaming X Trio, but we have been told the UK MSRP is £1259.99.
Discuss on our Facebook page HERE.
Pros
- Colour-neutral aesthetic.
- Very quiet out of the box.
- Overclocked relatively well.
- Power limit can hit 400W.
- 3% faster than reference.
Cons
- Junction temperature is significantly higher than the edge temperature.
- MSRP is very high.
- Just 1% faster than Gigabyte Gaming OC.
KitGuru says: There's potential for a good card here, but seeing two cards hit over 100C junction temperature is far from ideal.