While most of the current crop of NVMe M.2 SSD's are aimed at the higher end of the mainstream and the enthusiast market sectors, Intel want to get a firm foothold at the other end of the market, producing very affordable NVMe drives at the entry level. Their latest drive to assault this market segment is the SSD 760p. At the heart of the SSD760p is a Silicon Motion SM2262 controller and Intel's drive is the first to market using this chip, albeit an Intel customised version of it. It handles Intel's 256Gb 64-layer 3D TLC NAND. Intel's 760p drive range consists of three capacities at the time of writing; 128GB, 256GB, and 512GB but these will joined by 1TB and 2TB models later in Q1. All except the 2TB drive are single sided M.2 2280 format, the flagship 2TB drive is double-sided. Intel quote Sequential performance figures for the 512GB drive as up 3,230MB/s for reads and up to 1,625MB/s for writes. 4K Random reads are quoted as up to 340,000 IOPS (8GB span) while writes come in at up to 275,000 IOPS (8GB span). Endurance for the 512GB drive is rated at 288 TBW and Intel back the drive with a 5 year warranty. Physical Specifications: Usable Capacities: 512GB NAND Components: Intel 256Gb 64-layer 3D TLC NAND NAND Controller: Silicon Motion SM2262 Cache: 512GB Interface: PCIe NVMe 3.1 x4 Form Factor: M.2 2280 Dimensions: 22 x 80mm Firmware Version: 001C The SSD760p comes in a box that will certainly stand out on a crowded shelf, with a rainbow burst of colour along with the SSD series 7 branding. The rear of has a large sticker to the left with all the relevant drive details; capacity, serial number, product code etc. on it. To the right of the label is a diagram showing the format of the drive under which sits a URL for Intel's SSD webpage and the fact that the drive comes with a five year warranty. The only thing in the box besides the drive is an installation/warranty booklet. The 512GB version of the SSD760p has all the components built on one side of the 2280 format M.2 PCB. Along with the Silicon Motion SM2262 controller there are two 256Gb 64-layer 3D TLC NAND packages (labelled 29F02T4AOCTH2) and a pair of Micron DDR4-2400 256MB cache chips (labelled 7JB77). The Silicon Motion SM2262 8-channel controller has a PCIe 3 x4 NVMe 1.3 interface and supports end to end data protection, AES and TCG Opal encryption. Intel Toolbox SSD management utility is a pretty comprehensive tool for looking after your SSD. The home screen displays information about the drive, how the capacity is being used, its health and estimated life remaining. There are seven buttons on the right hand side of the utility main screen. These are for Intel's SSD Optimizer, two drive diagnostic scans, one quick the other full, secure erase, firmware updates, a system tuner and a page for system information. For testing, the drives are all wiped and reset to factory settings by HDDerase V4. We try to use free or easily available programs and some real world testing so you can compare our findings against your own system. This is a good way to measure potential upgrade benefits. We are in the process of updating our testing procedures for NVMe SSD’s adding new tests, refining others and using the latest versions of CrystalDiskMark, ATTO and AS SSD benchmarks. For a time we will show both old and new screenshots of these benchmarks as we transition from the older tests to the newer ones. We will try and re-test as many of the previously reviewed NVMe drives as we can so as to build up new versions of our comparative performance graphs. The test setup's for the new tests are listed below. Each is run five times. 128KB Sequential Read / Write. Transfer Request Size: 128KB Span: 8GB Thread(s): 1 Outstanding I/O: 1-32 Test Run: 20 minutes per test 4K Sustained Random Read / Write. Transfer Request Size: 4KB Span: 80GB Thread(s): 4 Outstanding I/O: 1-32 Test Run: 20 minutes per test 4K Random 70/30 mix Read/Write. Transfer Request Size: 4KB Span: 80GB Reads: 70% Writes: 30% Thread(s): 4 Outstanding I/O: 2 - 32 Test Run: 20 minutes Main system: Intel Core i7-7700K with 16GB of DDR4-3200 RAM, Sapphire R9 390 Nitro and an Asus Prime Z270-A motherboard. Other drives Corsair Force MP500 480GB Corsair Neutron NX500 800GB Intel Optane Memory 32GB Kingston HyperX Predator 480GB Kingston KC1000 960GB OCZ RevoDrive 350 480GB OCZ RevoDrive 3 x2 480GB Patriot Hellfire 240GB Plextor M8PeG 512GB Plextor M6e Black Edition PCIe 256GB PNY CS2030 240GBSamsu ng SSD960 PRO 2TB Samsung SSD960 EVO 1TB Samsung SSD950 PRO 256GB Samsung SM951 256GB Samsung XP941 512GB Toshiba OCZ RD400 512GB Western Digital Black PCIe 512GB Software: Atto Disk Benchmark. CrystalMark 3.0.3. AS SSD. IOMeter. Futuremark PC Mark 8 All our results were achieved by running each test five times with every configuration this ensures that any glitches are removed from the results. Trim is confirmed as running by typing fsutil behavior query disabledeletenotify into the command line. A response of disabledeletenotify =0 confirms TRIM is active. CrystalDiskMark is a useful benchmark to measure theoretical performance levels of hard drives and SSD’s. We are currently using V3.0.3 but will be switching to v6.0 shortly so we have added the two CrystalDiskMark 6 result screenshots. Considering the market segment the drive is aimed at the CrystalDiskMark scores for the 512GB SSD760p are very impressive especially when it comes to 4K writes at shallow queue depths. The ATTO Disk Benchmark performance measurement tool is compatible with Microsoft Windows. Measure your storage systems performance with various transfer sizes and test lengths for reads and writes. Several options are available to customize your performance measurement including queue depth, overlapped I/O and even a comparison mode with the option to run continuously. Use ATTO Disk Benchmark to test any manufacturers RAID controllers, storage controllers, host adapters, hard drives and SSD drives and notice that ATTO products will consistently provide the highest level of performance to your storage. Once again we are upgrading which ATTO version we are using for NVMe drives so have included the result screenshot from the new version. Intel's official Sequential read/write figures for the 512GB SSD760p are up to 3,230MB/s and 1,625MB/s respectively. Using the ATTO benchmark we couldn't quite reach the maximum read figure, the tested drive giving a score of 3,048MB/s. Writes however were bang on the official figure at 1,620 MB/s. AS SSD is a great free tool designed just for benching Solid State Drives. It performs an array of sequential read and write tests, as well as random read and write tests with sequential access times over a portion of the drive. AS SSD includes a sub suite of benchmarks with various file pattern algorithms but this is difficult in trying to judge accurate performance figures. The drive didn't fare so well in the much more stringent AS-SSD benchmark when it came to reads producing a score 1242. Write performance on the other hand was very good, giving a score of 1375, the highest we have seen to date in this benchmark from a M.2 drive. IOMeter is another open source synthetic benchmarking tool which is able to simulate the various loads placed on hard drive and solid state drive technology. We test with both random read and write 4k tests, as shown above. There are many ways to measure the IOPS performance of a Solid State Drive, so our results will sometimes differ from manufacturer’s quoted ratings. We do test all drives in exactly the same way, so the results are directly comparable. We will be updating the way we use to test NVMe drives with IOMeter and for a time we will be using this older comparative performance graph while we try and retest as many of the previously reviewed drives as possible to build new charts. For a drive aimed at the lower end of the mainstream market, the 4K Random read/write performance of the SSD760p is very, very impressive. When testing the 128KB Sequential Read/Write performance, the drive fell a little way short of the maximum figures quoted by Intel for Sequential read performance. The review drive produced a read score of 3,108MB/s, short of the top figure of 3,230MB/s while the tested write score of 1,609MB/s was much closer to the official 1,625MB/s 
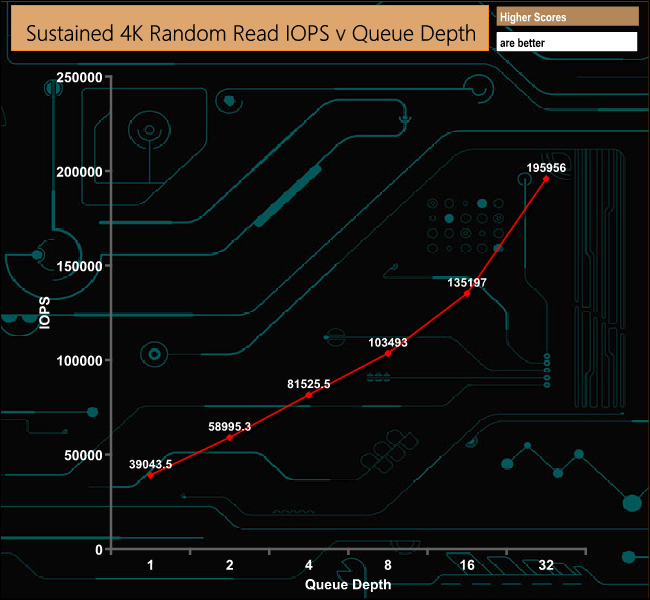
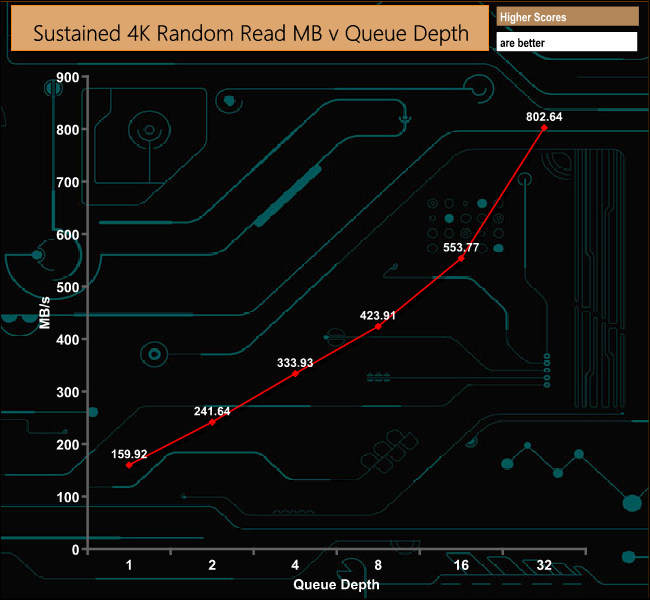
When it comes to 4K Random Reads the performance shows a steady increase as the queue depth deepens with the performance accelerating away from QD16 to QD32. Unlike the Random read performance, there's not much movement in the 4K Random write performance as the queue depth deepens. It's pretty constant between QD1 and QD4 with a slight rise between QD4 and QD8 before it settles down again. The SSD760p delivers pretty good performance in the 70/30 mixed test especially when you consider that it's aimed at the lower end of the market. In our average throughput tests, reads peaked at 2,633.31MB/s at the 2MB block size before falling back, finishing the test at 2,316.32MB/s. Writes peaked at the 256KB block mark at 1,534.69MB/s before dropping way down to 551MB/s at the end of the test run. Futuremark’s PCMark 8 is a very good all round system benchmark but it’s Storage Consistency Test takes it to whole new level when testing SSD drives. It runs through four phases; Preconditioning, Degradation, Steady State, Recovery and finally Clean Up. During the Degradation, Steady State and Recovery phases it runs performance tests using the 10 software programs that form the backbone of PCMark 8; Adobe After Effects, Illustrator, InDesign, Photoshop Heavy and Photoshop Light, Microsoft Excel, PowerPoint, Word, Battlefield 3 and World of Warcraft. With some 18 phases of testing, this test can take many hours to run. Preconditioning The drive is written sequentially through up to the reported capacity with random data, write size of 256 × 512 = 131,072 bytes. This is done twice. Degradation Run writes of random size between 8 × 512 and 2048 × 512 bytes on random offsets for 10 minutes. It then runs a performance test. These two actions are then repeated 8 times and on each pass the duration of random writes is increased by 5 minutes. Steady State Run writes of random size between 8 × 512 and 2048 × 512 bytes on random offsets for final duration achieved in degradation phase. A performance test is then run. These actions are then re-run five times. Recovery The drive is idled for 5 minutes. Then a performance test is run. These actions are then repeated five times. Clean Up The drive is written through sequentially up to the reported capacity with zero data, write size of 256 × 512 = 131,072 bytes. Overall Intel's SSD760p makes a good fist of PCMark8's Consistency test with the drive showing a good level of performance throughout the tough Degradation and Steady State phases of the test. Its performance through the Recovery stages of the test is excellent. PCMark 8’s Consistency test provides a huge amount of performance data, so here we’ve looked a little closer at how the 512GB Intel 760p performs in each of the benchmarks test suites. Adobe Creative Cloud The drive deals with the two toughest aspects of the Adobe CC tests, the Photoshop Light and Heavy traces reasonably well. The recovery performance is very good although there is a real dip in performance with the Photoshop Light trace in the penultimate recovery run. The After Effects CC, InDesign and Illustrator traces are dealt with in an extremely efficient manner. Microsoft Office All three elements of the MS Office test deal with the stresses of the test very well indeed until the 2nd Recovery phase when all three take a hit in performance, the worst effected being the Word test which drops by 271MB/s. The PowerPoint trace drops by 149MB/s while the Excel trace just drops 50MB/s. However all three recover very well from this performance drop. Casual Gaming The drive gets hit pretty hard during the two casual gaming tests but as with the other test suites in this benchmark the recovery of the drive is first rate. Just like the Consistency test, PCMark 8’s standard Storage test also saves a large amount of performance data. The default test runs through the test suite of 10 applications three times. Here we show the total bandwidth performance for each of the individual test suites for the third and final benchmark run. The SSD760p show strong performance dealing with the two toughest Adobe tests, Photoshop Heavy and Light, producing bandwidth results during the third and final run of the benchmark of 1,231.13MB/s for the Photoshop Light test and 1,041.04MB/s for the Photoshop Heavy test. Even the 345.71MB/s result for the slowest result, the Adobe After Effects test is pretty good. For the long term performance stability test, we set the drive up to run a 20-minute 4K random test with a 30% write, 70% read split, at a Queue Depth of 256 over the entire disk. The 512GB Intel 760p averaged 40,997 IOPS for the test with a performance stability of just 24.8% which isn't great to say the least. To test real life performance of a drive we use a mix of folder/file types and by using the FastCopy utility (which gives a time as well as MB/s result) we record the performance of drive reading from & writing to a 256GB Samsung SSD850 PRO. 100GB data file. 60GB iso image. 60GB Steam folder – 29,521 files. 50GB File folder – 28,523 files. 12GB Movie folder – 24 files (mix of Blu-ray and 4K files). 10GB Photo folder – 621 files (mix of .png, raw and .jpeg images). 10GB Audio folder – 1,483 files (mix of mp3 and .flac files). 5GB (1.5bn pixel) photo. The drive deals with transferring larger file sizes much better than it does when dealing with the small bity files contained in the 60GB Steam, 50GB File and 10GB Audio folders. Up until now the vast majority, if not all M.2 NVMe drives have been aimed at the upper mainstream/enthusiast market segments. Intel already has drives for those markets, so they have turned their attention to the other end of the market to try and drive sales of NVMe SSD's that not only deliver in terms of performance but also at very competitive price points. The first Intel NVMe M.2 drive launched at this end of the market, the SSD 600p might have got the price bit right but unfortunately, the general feeling was that it's performance didn't quite hit the mark. Now we have Intel's second NMVe M.2 mainstream drive, the SSD760p, and it's a different animal to the first drive. Where the previous generation 600p used 32-layer 3D TLC NAND and a Silicon Image SM2260 controller, the new SSD760p uses the latest 64-layer 3D TLC NAND and a Silicon Image SM2262 controller. Official Sequential read/write performance figures for the 512GB SSD760p are quoted as up to 3,230MB/s and 1,625MB/s respectively. When tested with the ATTO benchmark, the review drive came up a little short of the maximum read figure at 3,048MB/s. However the tested Sequential write figure was pretty much bang on the money at 1,620MB/s. The quoted official Random 4K performance for the drive is a very impressive up to 340,000 IOPS for reads and 275,000 IOPS for writes. With our test system we couldn't get close to those numbers but reads of 195,956 IOPS at a queue depth of 32 and writes of 148,931 IOPS at the same QD are still pretty impressive given the market sector this drive is aimed at. One neat trick that Intel has pulled off with the SSD760p is that while its a much better performing drive than the 600p it's also more power efficient. The 600p had a typical active power rating of 100mW with an idle rating of 40mW. With the new drive Intel has cut the active power requirement by 50% at 50mW with the idle rating dropping to 25mW which should appeal to people wanting to stick the 760p in a laptop. Intel's SSD Toolbox is a very usual utility allowing maintenance of most aspects of the drive and although it doesn't have any built in drive migration tools, you can download Intel's Data Migration software from their website HERE We found the 512GB version of the SSD760p available to pre-order on Scan.co.uk for £177.98 (inc VAT) HERE Pros Overall performance. Price. Lower power consumption than previous generation drive. Cons Endurance hasn't improved over the previous 600p drive, Kitguru says: Clearly its early days in the entry level NVMe drive market but Intel's pricing of the SSD760p gives them a hefty early advantage in what is sure to become a very competitive segment.