Kingston's DC450R is part of the company's extensive Enterprise SSD range and has been designed for handling read-centric workloads in data centres. We review the 3.84TB model, priced around the £440 mark for UK buyers. The DC450R is available in five capacities at the time of writing: 480GB, 960GB, 1.92TB, 3.84TB (the drive we are looking at here) and the massive 7.68TB flagship drive. At the heart of the drive is a Phison PS3112-S12DC controller which looks after 3D TLC NAND. Sequential read performance is quoted as up to 560MB/s across the range. Sequential write performance varies with capacity. The entry-level 480GB is up to 510MB/s, the 960GB and 1.92TB models are up to 530MB/s, the 3.84TB drive up to 525MB/s with the 7.68TB model the slowest in the line-up at up to 504MB/s. When it comes to 4K random read performance all the range bar one are rated as up to 99,000 IOPS, the exception being the 960GB model which is rated at up to 98,000 IOPS. Random writes are a bit of a mix. The 1.92TB drive has the fastest random write rating at up to 28,000 IOPS, while the slowest is the 480GB model at 17,000 IOPS. The 960GB and 3.84TB drives are both rated as up to 26,000 IOPS with the 7.68TB flagship rated at up to 19,000 IOPS. Power consumption for the 3.84TB is stated as 1.48W for Max/Avr reads, 3.93W for average writes and 5.5W for maximum writes with an idle figure of 1.3W. Endurance for the 3.84TB drive is quoted as 2,823TB which works out at 0.4 DWPD over the length of the 5-year warranty Kingston back the drive with. Physical Specifications: Usable Capacities: 3.84TB. NAND Components: 3D TLC NAND. NAND Controller: Phison PS3112-S12DC. Cache: DDR4-2666. Interface: Serial ATA (SATA) 6Gb/s (SATA III). Form Factor: 2.5in, 7mm. Dimensions: 69.9 x 100 x7mm. Drive Weight: 92.3g Firmware Version: SCEKH3.3. The DC450R ships in a blister pack with the drive’s capacity clearly labelled on the front while the rear has multilingual marketing and warranty notes on it. Built on a standard 2.5in, 7mm format, the DC450R has a metal enclosure, held together with four Torx security screws hidden under the front label. The 3.84TB DC450R uses 16 3D TLC NAND packages split equally between both sides of the PCB. On one side of the board, they are joined by the Phison PS3112-S12DC controller and a pair of Micron DDR4-2666 cache IC's while the other side of PCB holds another pair of cache chips. The one thing that the DC450R doesn't have are power loss protection capacitors although the mounts for them are on the PCB. The eight-channel PS3112-S12DC is built on a 28nm process supporting drives up to 8TB with 3D TLC NAND Flash. It features Phison’s 3rd generation LDPC ECC engine and has AES 256 bit encryption support. Kingston’s SSD management software utility is simply called SSD Manager. With it, you can monitor the health of the drive and how it’s being used, check the drive’s SMART data and update the firmware as well as securely erasing the drive. You can also adjust and manage the over-provisioning of the drive. For testing, the drives are all wiped and reset to factory settings by HDDerase V4. We try to use free or easily available programs and some real-world testing so you can compare our findings against your own system. This is a good way to measure potential upgrade benefits. Main system: Intel Core i7-7700K with 16GB of DDR4-3200 RAM, Sapphire R9 390 Nitro and an Asus Prime Z270-A motherboard. Other drives - 4TB class Integral SVR-PRO 100 SRI 4TB Kingston DC500M 3.84TB Kingston DC500R 3.84TB Samsung SSD860 EVO 4TB Samsung SSD860 QVO 4TB Samsung SSD860 PRO 4TB Samsung SSD870 QVO 4TB Software: Atto Disk Benchmark. CrystalMark 6.0.2 / 7.0.0 AS SSD. IOMeter. PCMark 10 All our results were achieved by running each test five times with every configuration this ensures that any glitches are removed from the results. Trim is confirmed as running by typing fsutil behavior query disabledeletenotify into the command line. A response of disabledeletenotify =0 confirms TRIM is active. CrystalDiskMark is a useful benchmark to measure theoretical performance levels of hard drives and SSD’s. We are using V6.02. There isn't much to split between any of the three Kingston data centre drives (DC500M, DC500R and DC450R) that we've tested when looking at the 4K QD32 T1 test of the CrystalDiskMark benchmark. Comparing the two benchmark result screens it appears that the Phison PS3112-S12DC seems to prefer compressible data when reading 4K data at a QD of 1. The ATTO Disk Benchmark performance measurement tool is compatible with Microsoft Windows. Measure your storage systems performance with various transfer sizes and test lengths for reads and writes. Several options are available to customize your performance measurement including queue depth, overlapped I/O and even a comparison mode with the option to run continuously. Use ATTO Disk Benchmark to test any manufacturers RAID controllers, storage controllers, host adapters, hard drives and SSD drives and notice that ATTO products will consistently provide the highest level of performance to your storage. Officially the Sequential read/write performance for the 3.84TB DC450R is up to 560MB/s and 525MB/s respectively. Using the ATTO benchmark we couldn't quite hit those maximums with the review drive producing read/write figure of 535MB/s and 505MB/s respectively. AS SSD is a great free tool designed just for benching Solid State Drives. It performs an array of sequential read and write tests, as well as random read and write tests with sequential access times over a portion of the drive. AS SSD includes a sub suite of benchmarks with various file pattern algorithms but this is difficult in trying to judge accurate performance figures. Of the three Kingston SATA based data centre drives we've tested to date, the DC450R just has the edge when it comes to the read score in AS-SSD but has the slowest write score of the three drives. Officially the Sequential read/write performance for the 3.84TB DC450R is up to 560MB/s and 525MB/s respectively. We could confirm those figures with our own Sequential tests, the review drive producing a read figure of 562.23MB/s for reads and 529.34MB/s for writes. 4KB Random Read Performance Kingston rates the 3.84TB version of the DC450R as up to 99,000 IOPS for 4K random reads. With our 4-threaded tests, we managed to squeeze a little more out of the drive with a peak figure of 99,733 IOPS at QD of 32. After the initial burst from QDs 1 to 4 the drive's performance remained very consistent across the remainder of tested queue depths. 4KB Random Write Performance The official 4K random write performance figure for the drive is up to 26,000 IOPS. However, with our 4 threads, 8GB span write test, the drive sailed past this figure, peaking at 88,314 IOPS at a QD of 16. We then ran a test using 1 thread at a QD of 1 across the whole drive, which produced a figure of 35,391IOPS, a lot closer to the official figure. Unlike the random read performance, the drive was consistent from the start of our tests. In our 4K 70/30 read/write mix test, the drive produced very consistent performance from QD8 through to QD128, after the initial burst to QD8. 8KB Random Read Performance A high degree of data centre work is done with 8K data so we tested the drive at this data level (8 threads, 16GB span) to see how it would perform. The read performance peaks at 59,063 IOPS (483.85MB/s) at a QD of 64. Once again after the initial burst to QD2, it remained very consistent across the tested queue depths. 8KB Random Write Performance In the 8K random write test, the drive peaked at 53,856 IOPS (441.19MB/s) right at the start of the test run at QD1. Once again the drive's performance remained very consistent throughout the test run, which is what you should expect from a drive aimed at being used in a data centre environment. 8K Random 70/30 Mix Read/Write As with the 4K 70/30 read/write mixed test, the drive produced a very consistent level of performance after the initial burst during the 8K version of the test. 
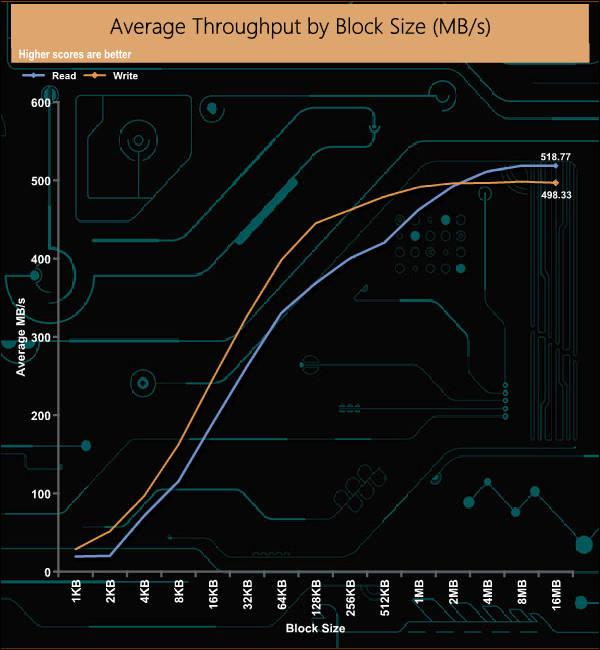
Peak throughout performance came at the end of the test for both reads, 518.77MB/s and writes 498.33MB/s, both bandwidth figures were shy of the official maximum figures of 560MB/s and 525MB/s for reads and writes respectively. For the long term performance stability test, we set the drive up to run a 20-minute 4K random test with a 30% write, 70% read split, at a Queue Depth of 256 over the entire disk. The Kingston DC450R averaged 86,956 IOPS for the test, with a performance stability of 97%, which is the sort of figure you should expect to see for a drive aimed at data centre usage. We also tested the drive in a number of workload scenarios that it might face in real life. The IOMeter settings we used to test with are listed below:- Database 8K 8Threads QD64 Transfer Size: 8K Reads: 67% Writes: 33% Random: 100% Boundary: 4K Outstanding IO: 64 Threads/Workers: 8 Decision Support DB Transfer Size: 1MB Reads: 100% Writes: 0% Random: 100% Boundary: 4K Outstanding IO: 64 Threads/Workers: 8 Digital Video Surveillance Transfer Size: 512K Reads: 90% Writes: 10% Sequential: 100% Boundary: 512K Outstanding IO: 64 Threads/Workers:8 Exchange Server 2007 Transfer Size: 8K Reads: 67% Writes: 33% Random: 100% Boundary: 8K Outstanding IO: 60 Threads/Workers: 1 Mail Server Transfer Size: 32K Reads: 58% Writes: 42% Random: 95% Boundary: 4K Outstanding IO: 64 Threads/Workers: 8 Microsoft VM Transfer Size: 4K Reads: 100% Writes: 0% Random: 80% Boundary: 2K Outstanding IO: 64 Threads/Workers: 1 OS Paging Transfer Size: 64K Reads: 90% Writes: 10% Sequential: 100% Boundary: 4K Outstanding IO: 64 Threads/Workers:1 Video On Demand Transfer Size: 128K Reads: 100% Writes: 0% Random: 100% Boundary: 4K Outstanding IO: 512 Threads/Workers: 8 Web File Server 64KB Transfer Size: 64K Reads: 95% Writes: 5% Random: 75% Boundary: 4K Outstanding IO: 64 Threads/Workers: 8 Web File Server 8KB Transfer Size: 8K Reads: 95% Writes: 5% Random: 75% Boundary: 4K Outstanding IO: 64 Threads/Workers: 8 Web File Server 4KB Transfer Size: 4K Reads: 95% Writes: 5% Random: 75% Boundary: 4K Outstanding IO: 64 Threads/Workers: 8 Workstation Transfer Size: 8K Reads: 80% Writes: 20% Random: 80% Boundary: 8K Outstanding IO: 64 Threads/Workers: 4 VDI Light Transfer Size:10K Reads: 15% Writes: 85% Random: 100% Boundary: 2K Outstanding IO: 4 Threads/Workers: 1 VDI Medium Transfer Size:10K Reads: 15% Writes: 85% Random: 100% Boundary: 2K Outstanding IO: 8 Threads/Workers: 1 VDI Heavy Transfer Size:10K Reads: 15% Writes: 85% Random: 100% Boundary: 2K Outstanding IO:12 Threads/Workers: 1 Overall the DC450R performs well when dealing with these scenarios with six of the tests producing over 500MB/s bandwidth with a further six over 400MB/s. The best bandwidth figure was the 563.55MB/s achieved with the Video On Demand test. The PCMark 10 Full System Drive Benchmark uses a wide-ranging set of real-world traces from popular applications and common tasks to fully test the performance of the fastest modern drives. The benchmark is designed to measure the performance of fast system drives using the SATA bus at the low end and devices connected via PCI Express at the high end. The goal of the benchmark is to show meaningful real-world performance differences between fast storage technologies such as SATA, NVMe, and Intel’s Optane. The Full System Drive Benchmark uses 23 traces, running 3 passes with each trace. It typically takes an hour to run. Traces used: Booting Windows 10. Adobe Acrobat – starting the application until usable. Adobe Illustrator – starting the application until usable Adobe Premiere Pro – starting the application until usable. Adobe Photoshop – starting the application until usable. Battlefield V – starting the game until the main menu. Call of Duty Black Ops 4 – starting the game until the main menu. Overwatch – starting the game until the main menu. Using Adobe After Effects. Using Microsoft Excel. Using Adobe Illustrator. Using Adobe InDesign. Using Microsoft PowerPoint. Using Adobe Photoshop (heavy use). Using Adobe Photoshop (light use). cp1 Copying 4 ISO image files, 20 GB in total, from a secondary drive to the target drive (write test). cp2 Making a copy of the ISO files (read-write test). cp3 Copying the ISO to a secondary drive (read test). cps1Copying 339 JPEG files, 2.37 GB in total, to the target drive (write test). cps2 Making a copy of the JPEG files (read-write test). cps3 Copying the JPEG files to another drive (read test). The best performance in the creative group of tests was the 261MB/s from the Adobe Photoshop heavy use test trace. The DC450R also produced pretty strong bandwidth figures in the cp1 write test (486MB/s), cp3 read test (478MB/s) and 468MB/s for the cp2 read-write test. To test real life performance of a drive we use a mix of folder/file types and by using the FastCopy utility (which gives a time as well as MB/s result) we record the performance of drive reading from & writing to a 256GB Samsung SSD850 PRO. We use the following folder/file types: 100GB data file. 60GB iso image. 60GB Steam folder – 29,521 files. 50GB File folder – 28,523 files. 12GB Movie folder – (15 files - 8 @ .MKV, 4 @ .MOV, 3 @ MP4). 10GB Photo folder – (304 files - 171 @ .RAW, 105 @ JPG, 21 @ .CR2, 5 @ .DNG). 10GB Audio folder – (1,483 files - 1479 @ MP3, 4 @ .FLAC files). 5GB (1.5bn pixel) photo. BluRay Movie - 42GB. 21GB 8K Movie demos - (11 demos) 16GB 4K Raw Movie Clips - (9 MP4V files). 4.25GB 3D Printer File Folder - (166 files - 105 @ .STL, 38 @ .FBX, 11 @ .blend, 5 @ .lwo, 4 @ .OBJ, 3@ .3ds). 1.5GB AutoCAD File Folder (80 files - 60 @ .DWG and 20 @.DXF). Our real-life file transfer tests posed little problem for the DC450R as it handled most of them very efficiently. As always it’s the 50GB file folder transfer that slows down the drive. Kingston’s DC450R, (where the DC stands for Data Centre) has been designed as a highly optimised SSD for read-centric (hence the 'R' in the name) workloads in data centres such as Edge computing, High-speed databases, SQL server reporting services (SSRS) and Content Delivery Networks (CDN). The drive implements Kingston’s QoS (Quality of Service) requirements to ensure predictable random I/O performance and low latencies over a wide range of read and write workloads. The drive also supports AES 256-bit encryption. At the heart of the DC450R is a Phison PS3112-S12DC 8-channel controller which looks after, in the case of the 3.84TB drive, 16 256GB packages of 3D TLC NAND. The 3.84TB drive also comes with four Micron 1GB DDR4 DRAM ICs for caching duties. Kingston quotes Sequential read/write figures for the 3.84TB DC450R as up to 560MB/s and 525MB/s respectively. We couldn't quite hit those maximum figures when the review drive was tested with the ATTO benchmark, recording 535MB/s read and 505MB/s writes. However, when we switched to our own Sequential tests we could indeed confirm those maximums with the drive producing figures of 562MB/s and 529MB/s for reads and writes respectively. Random 4K performance for the drive is quoted as 99,000 IOPS for reads and 26,000 IOPS for writes. With our 4-threaded read tests we managed to squeeze a wee bit more out of the drive at 99,733 IOPS. When we tested random writes with our usual 4 threads, 8GB span test we got a result of 88,309 IOPS (QD64), far, far exceeding the official 26,000 IOPS. However, when we re-tested the drive across the whole capacity with a single thread at a QD of 1 the resulting score of 35,391 IOPS (144.97MB/s) was a lot closer to that official figure. The ability via the SSD Manager utility to manually adjust the Over Positioning segment, above the factory default (approx 7%) allows data centre managers to better tune the drive depending on what workload or application that it’s being used with. This ability gives the drive more flexibility as to which environments it can be used in. Although it's aimed at the data centre environment, the DC450R doesn't have power loss protection capacitors although the mounts for them are on the PCB. Power consumption for the 3.84TB DC450R is stated as 1.48W for Max/Avr reads, 3.93W for average writes and 5.5W for maximum writes with an idle figure of 1.3W. Endurance wise the TBW figure for the drive is 2823TB which works out at 0.4 DWPD over the length of the 5-year warranty Kingston backs the drive with. We found the 3.84TB version of the DC450R on Span.com for £436.80 (inc VAT) HERE. Discuss on our Facebook page HERE. Pros Performance stability. Overall performance. Endurance. Cons Lack of hardware power protection. High latencies when under some test loads. KitGuru says: Kingston’s DC450R joins the company's stable of enterprise SSD drives offering a wide range of capacities, good overall performance, and the enterprise-grade performance stability IT managers demand from this class of drive.