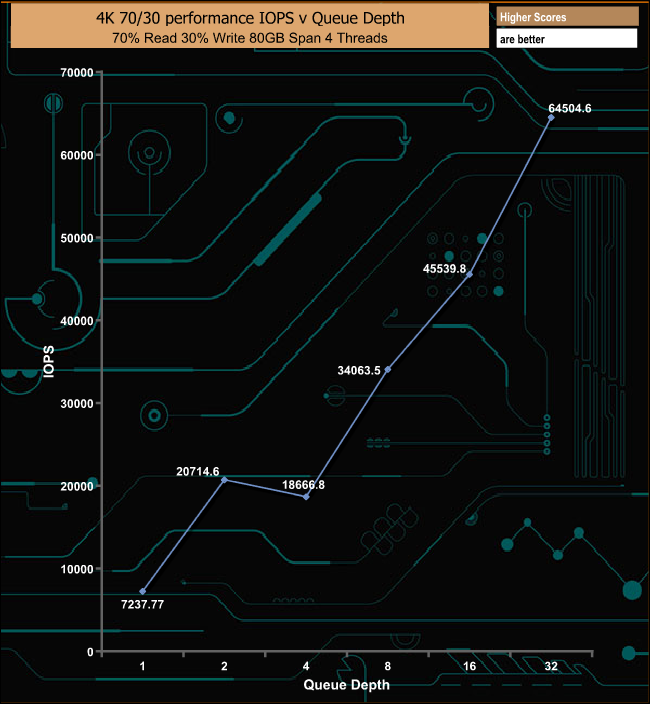
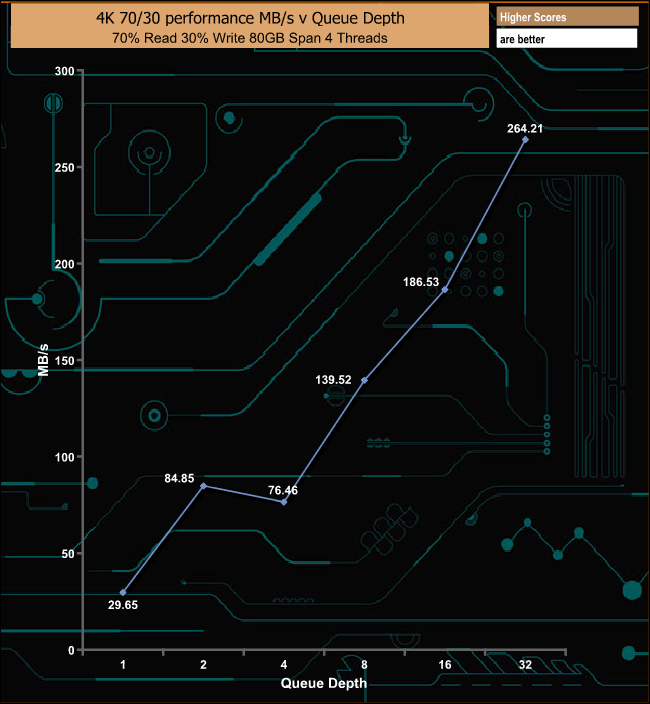
In our 4K 70/30 mixed read/write test the drive stumbled at the QD4 mark but quickly recovered to finish the test run at 264.21MB/s (64,504 IOPS).

Tags M.2 2280 NVMe patriot Review Silicon Motion SM2263XT
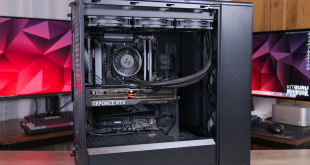
Sick of RGB lighting? This could be the prebuilt for you