
We are gradually seeing more and more SSDs, both SATA and NVMe based, being launched into the market using the latest 4-bit or QLC NAND flash technology. The latest drive to hit the market is the 4TB flagship drive of Samsung's SSD 860 QVO range – the company's first drive family to use 4-bit NAND.
The QLC equipped 860 QVO is the latest member of Samsung's SSD 860 product line, joining the 860 PRO (MLC NAND) and 860 EVO (TLC NAND). It uses a combination of 64-layer 1Tb 4-bit (QLC) V-NAND (Samsung call it 4-bit MLC V-NAND), a Samsung MJX controller and LPDDR4 cache, which in the case of the 4TB drive is 4GB in size.
The 4TB 860 QVO is rated at up to 550MB/s and 520MB/s for Sequential read/writes respectively (these figures are the same for all the drives in the SSD 860 QVO line-up). Random 4K reads are quoted as 97,000 IOPS with writes at 89,000.
The endurance for the 4TB SSD 860 QVO is very good for a QLC drive at 1,440TB TBW over the 3-year warranty Samsung backs the drive with.
Physical Specifications:
- Usable Capacities: 4TB.
- NAND Components: Samsung 64-layer 4-Bit (QLC) V-VAND.
- NAND Controller: Samsung MJX.
- Cache: 4GB LPDDR4
- Interface: Serial ATA (SATA) 6Gb/s (SATA III)
- Form Factor: 2.5in, 7mm
- Dimensions: 100 x 69.85 x 7mm
Firmware Version: RVQ01B6Q
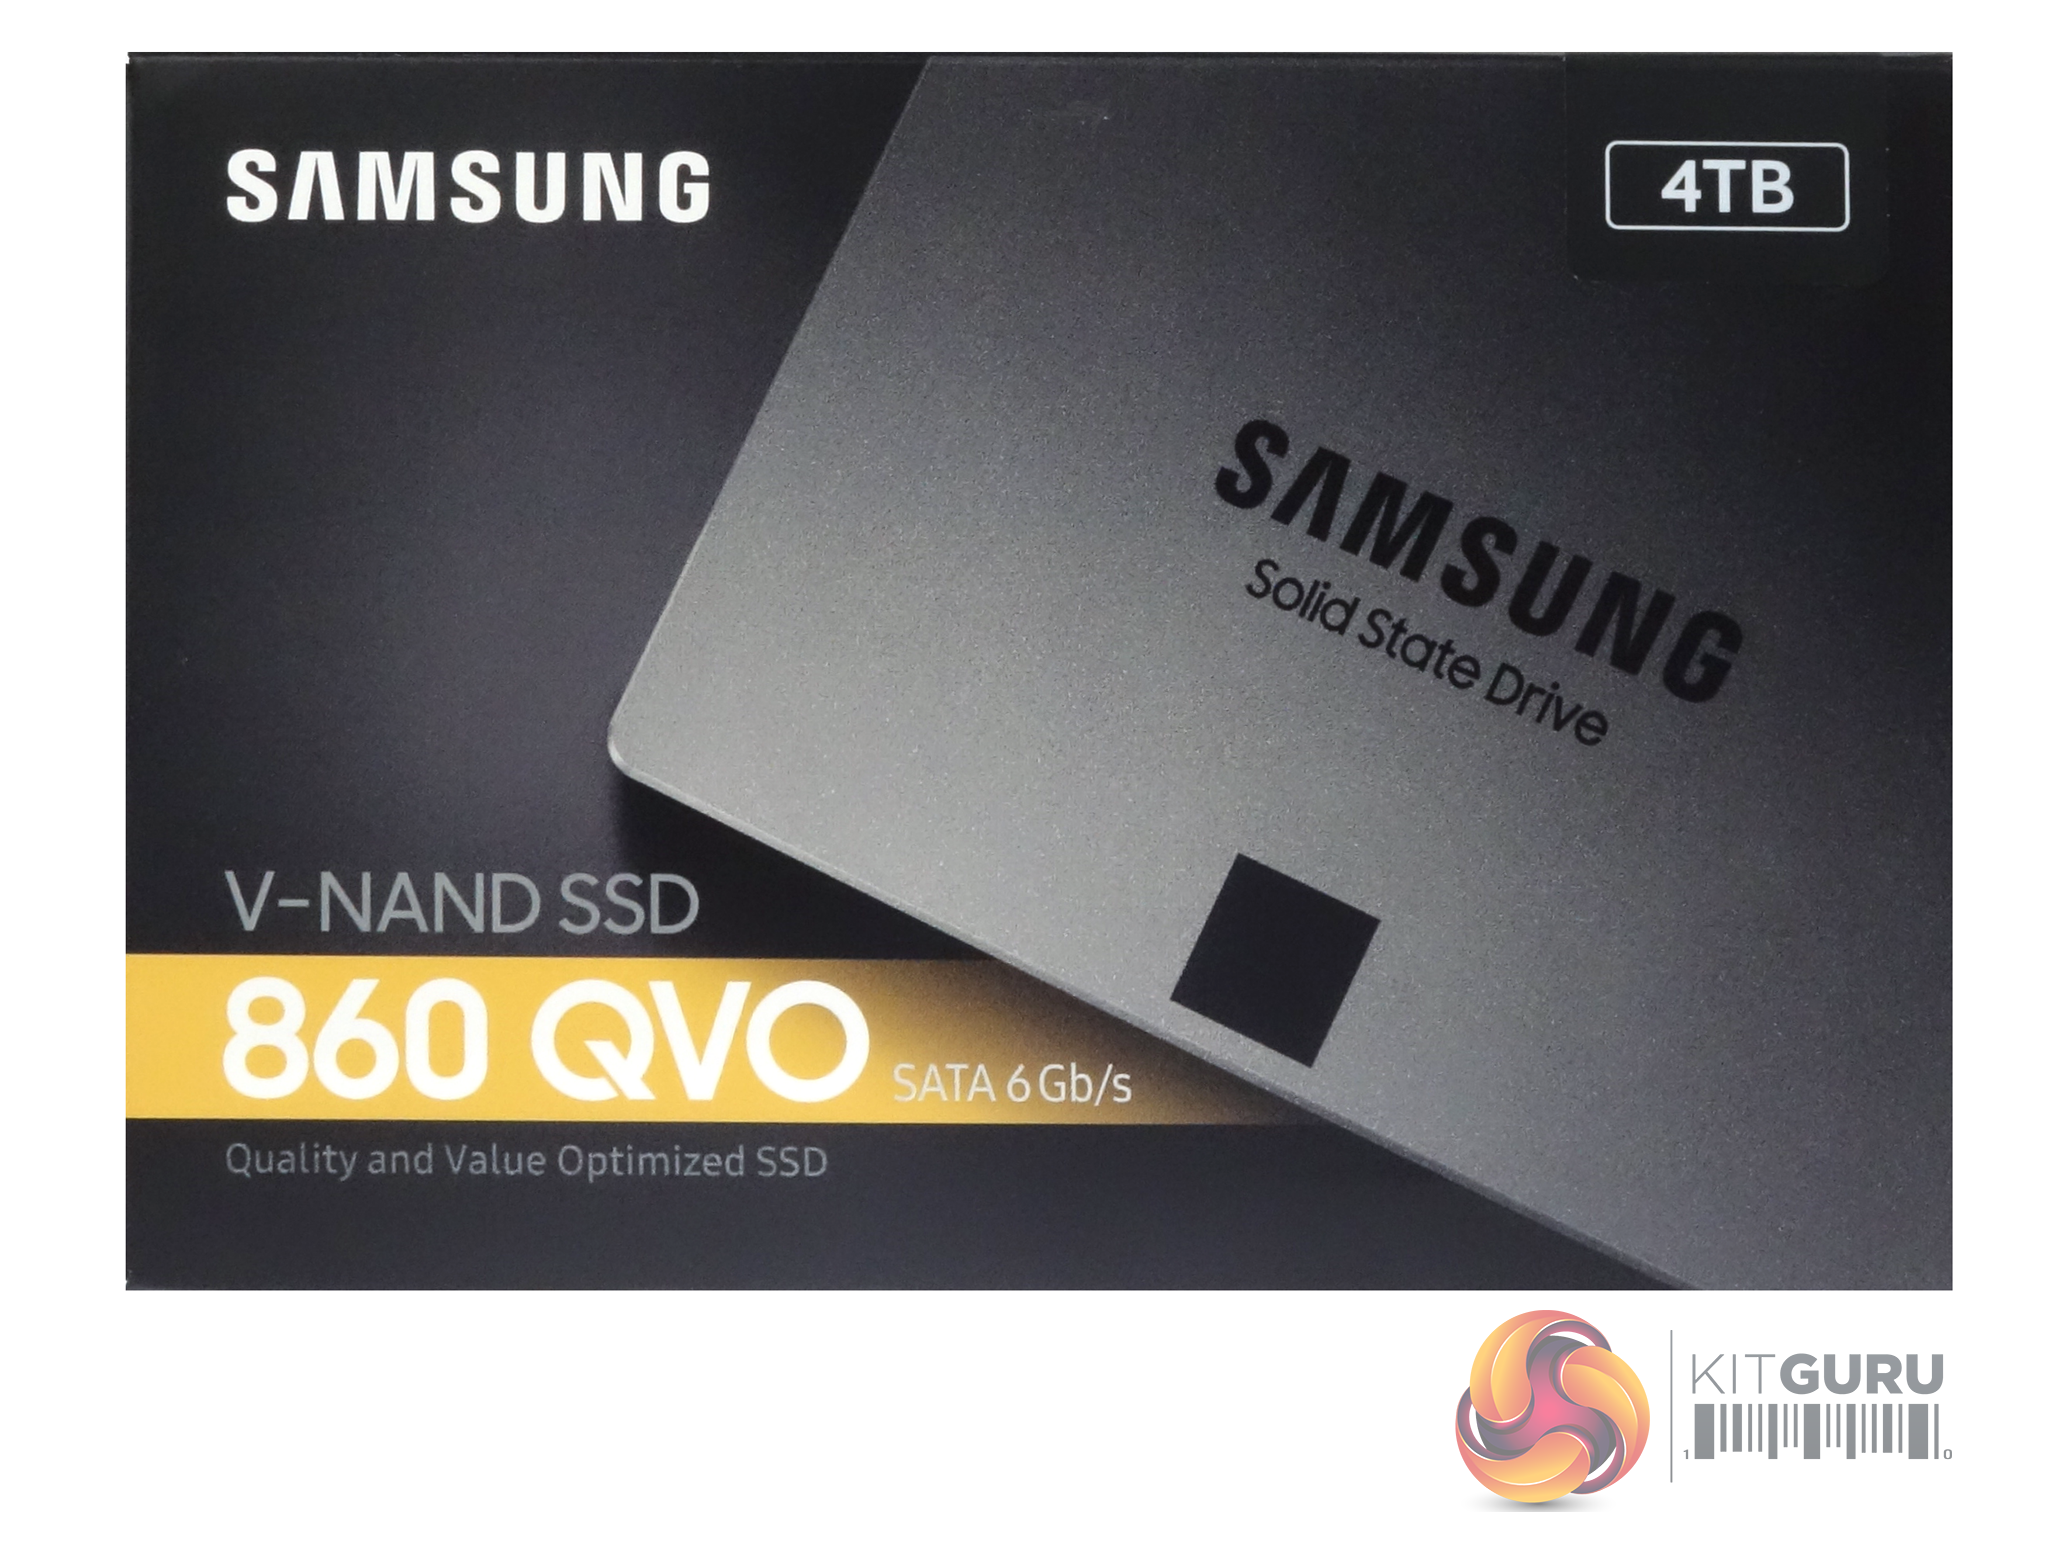
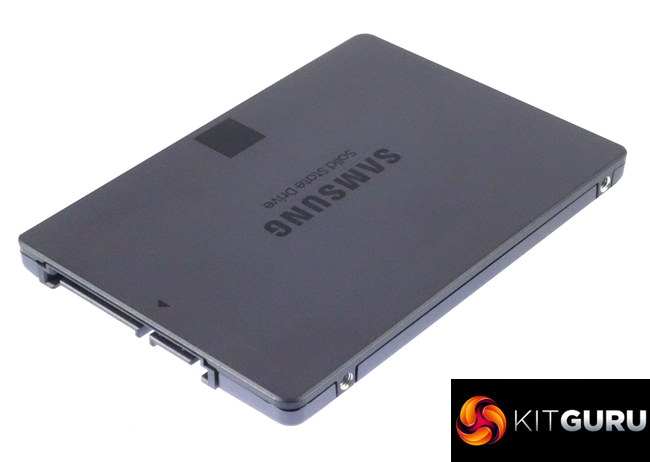
The Samsung SSD 860 QVO 4TB ships in a compact black box with an image of the drive on the front, along with information about the drive – including the fact that it uses V-NAND and has a SATA 6Gb/s interface. There is also sticker on the top left of the box which indicates the capacity of the drive.
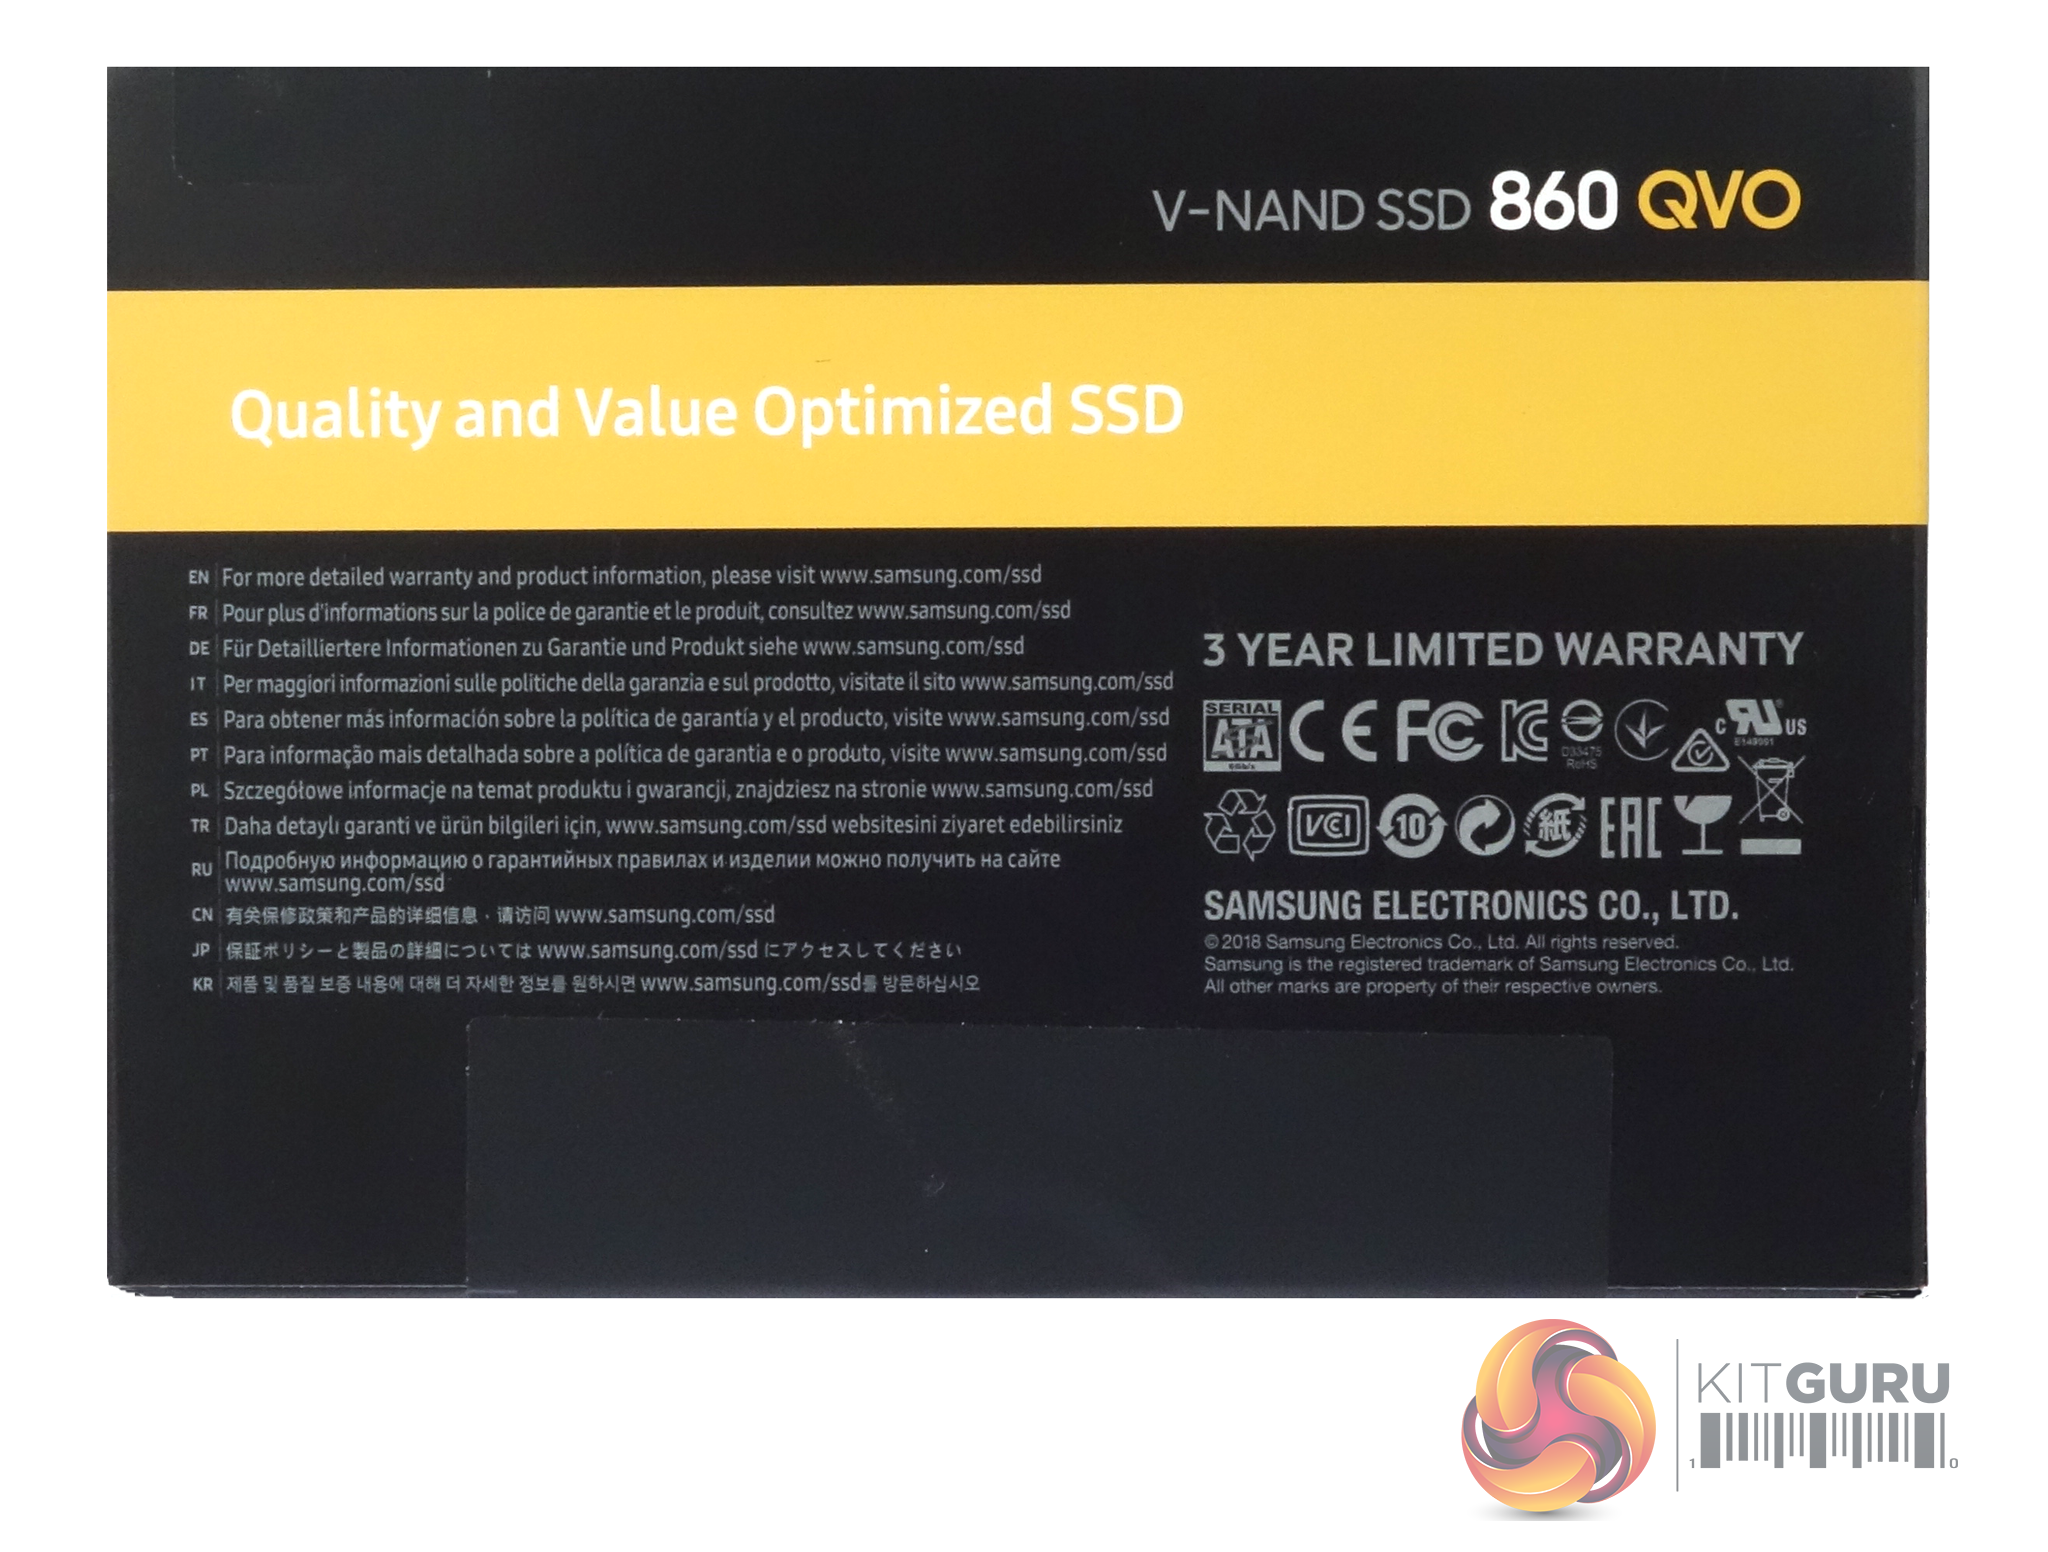
The rear of the box has multilingual marketing notes and points out the fact the drive has a 3 year limited warranty.
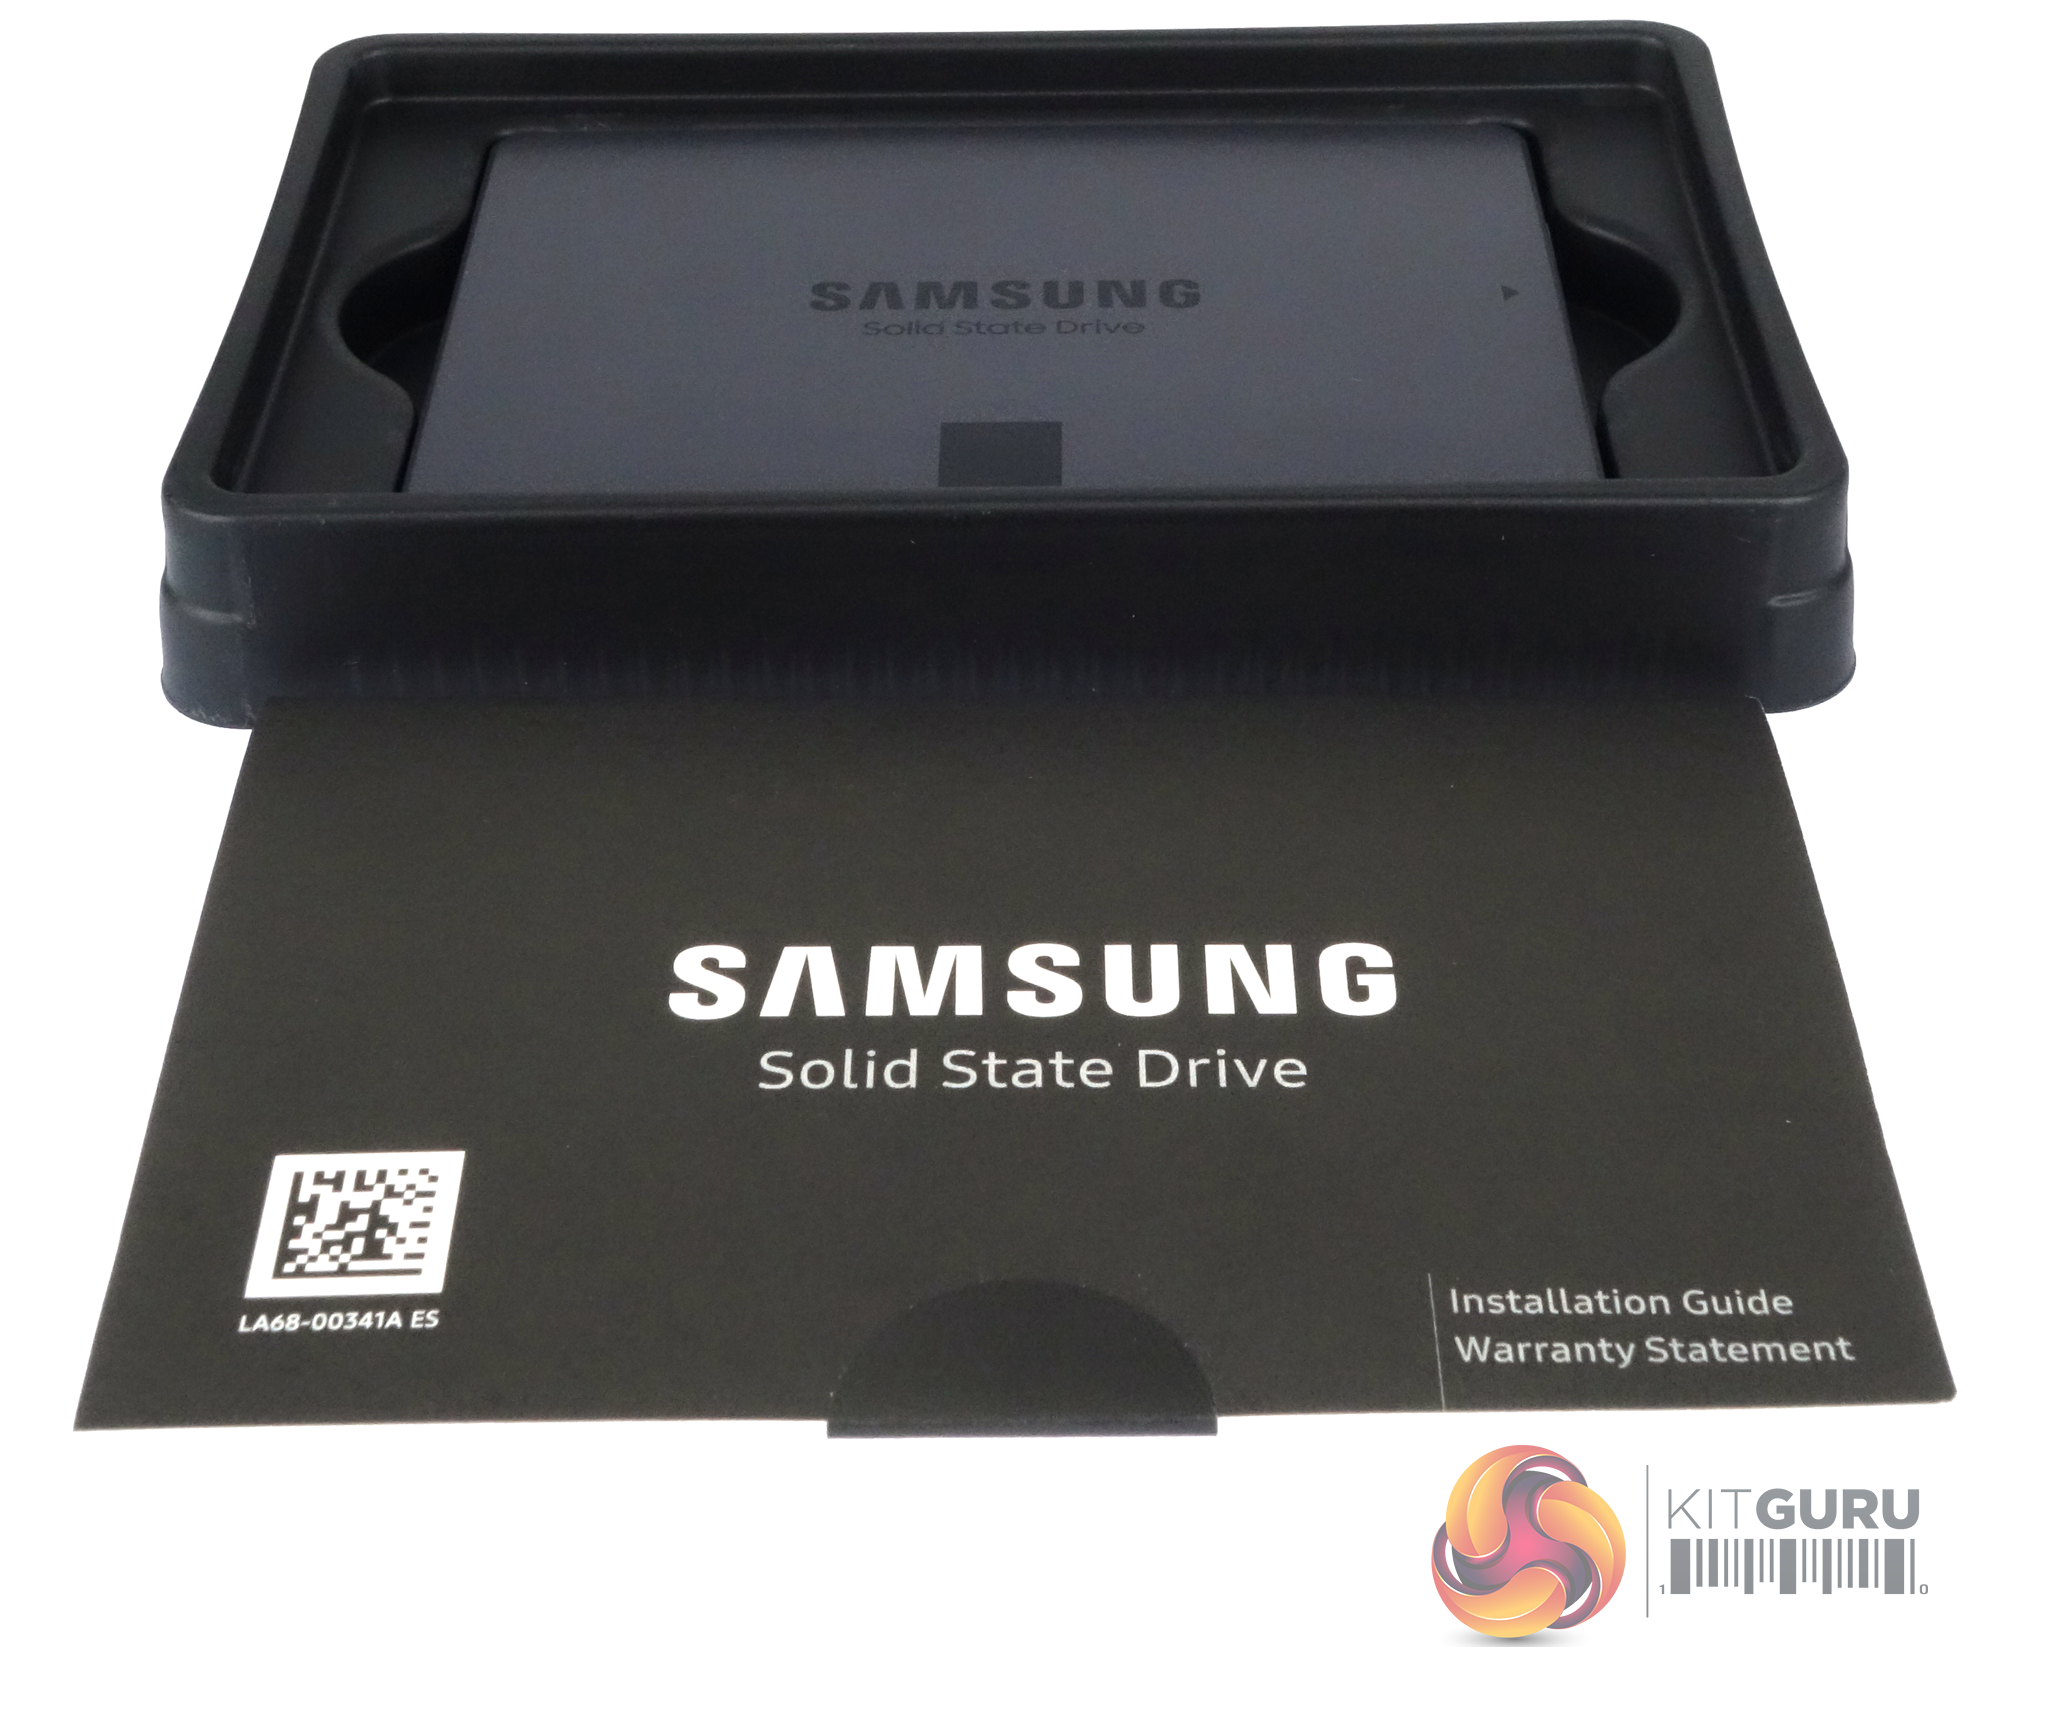
The drive sits in a tray to keep it secure during transit, and the only other thing in the box is an installation/warranty guide that sits on top of it.
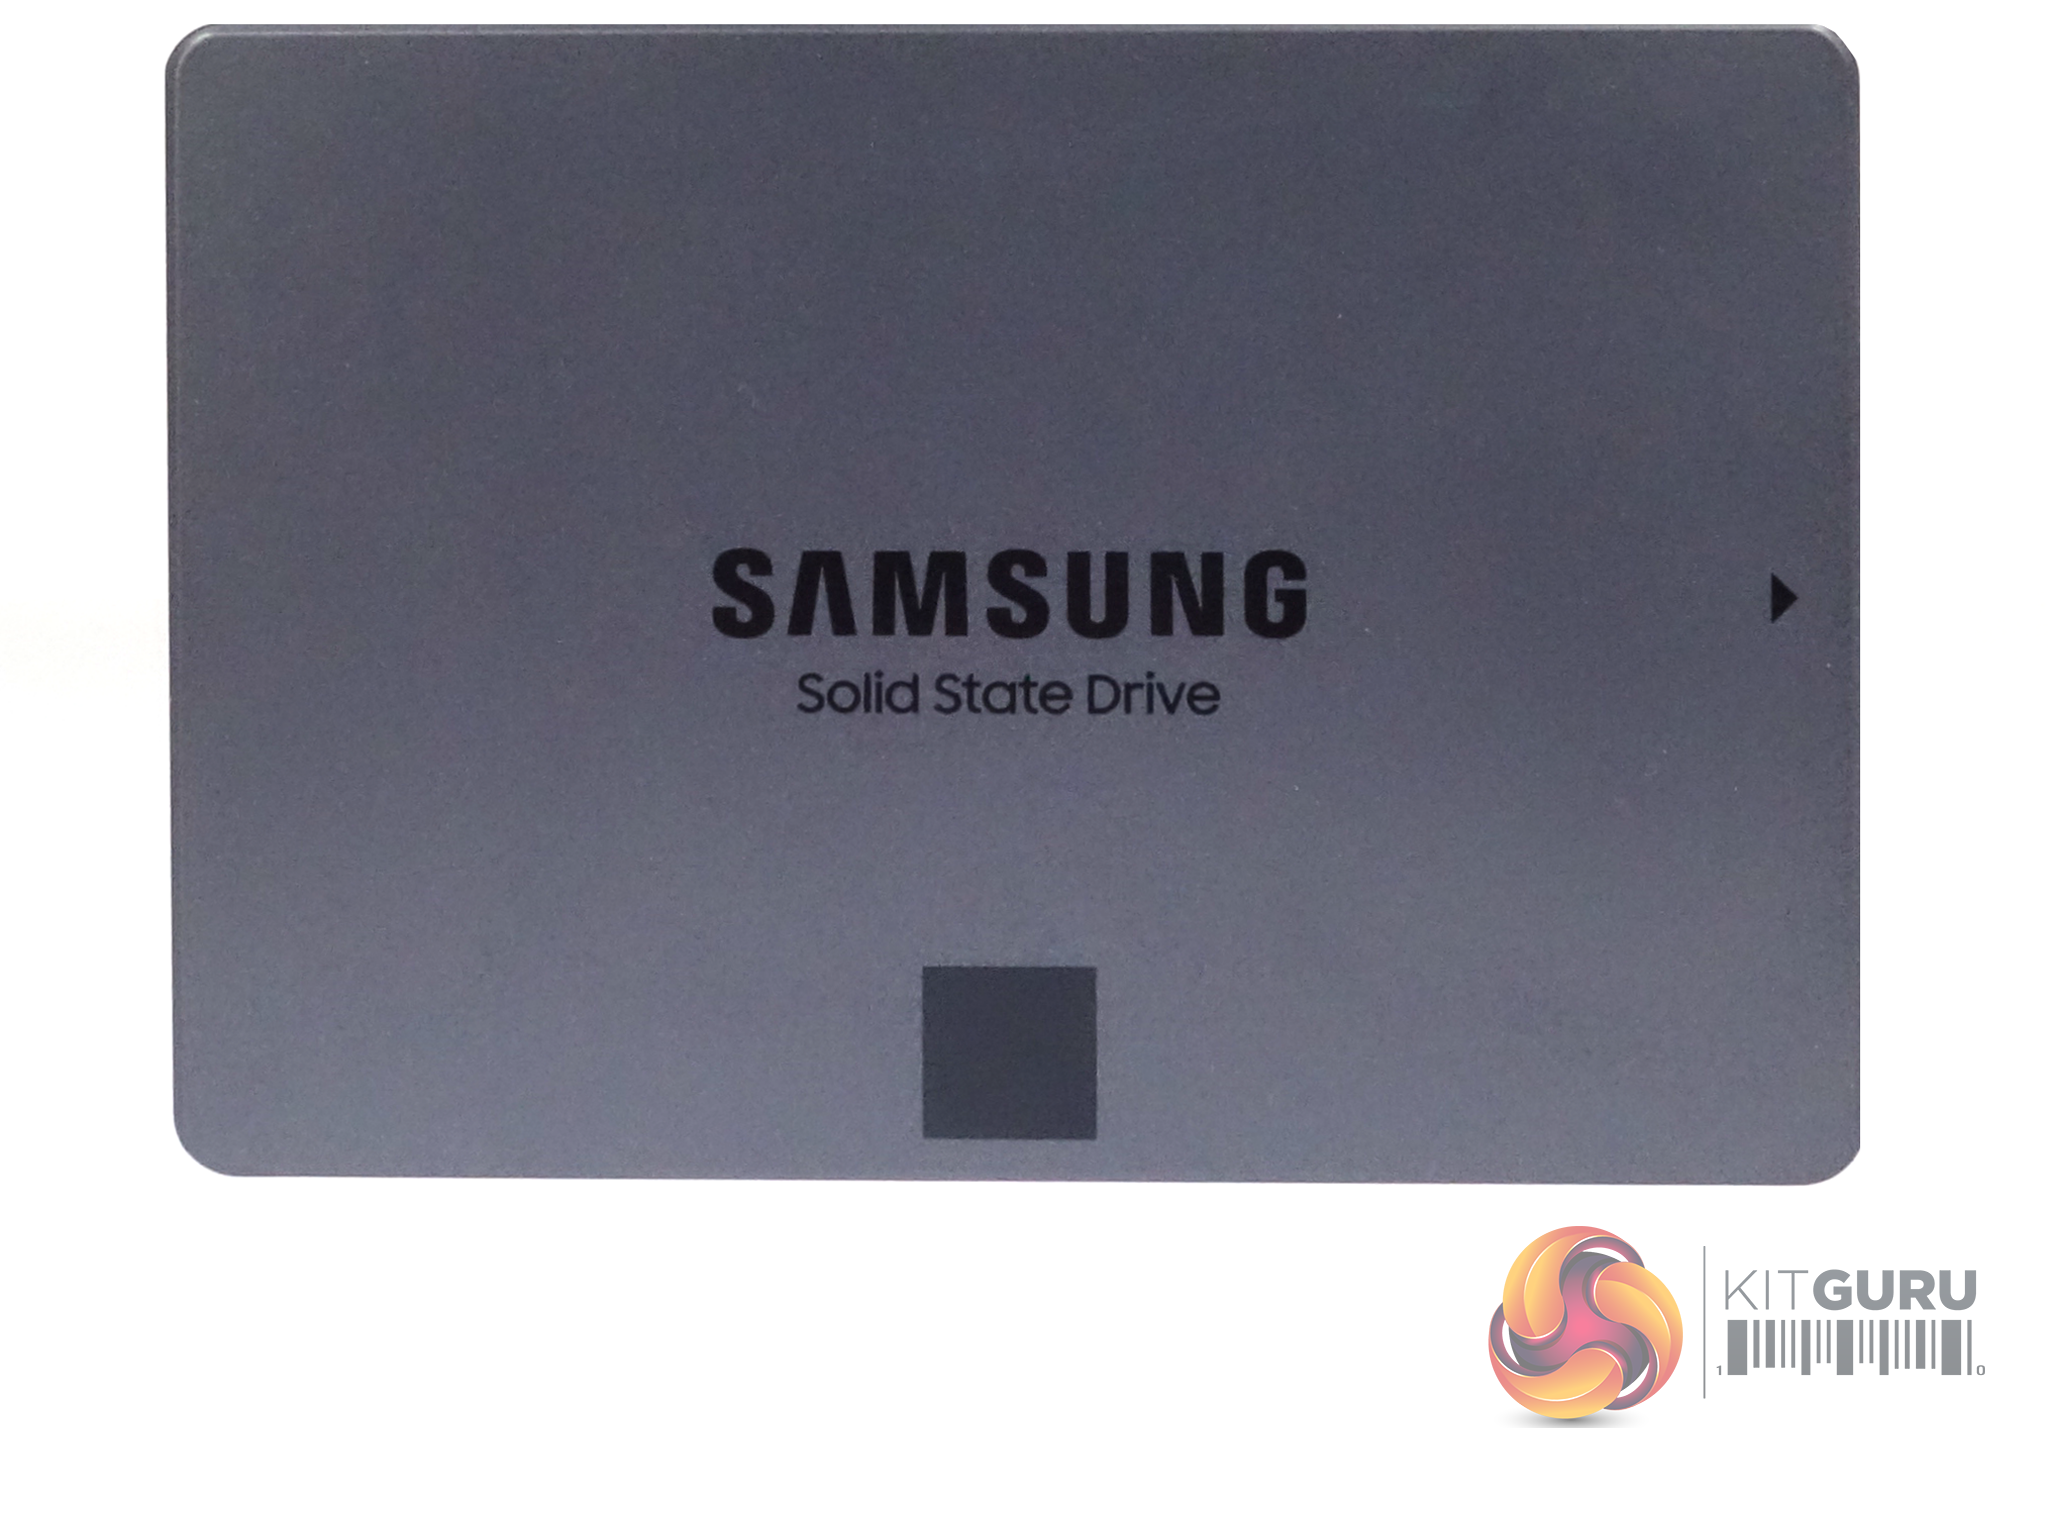
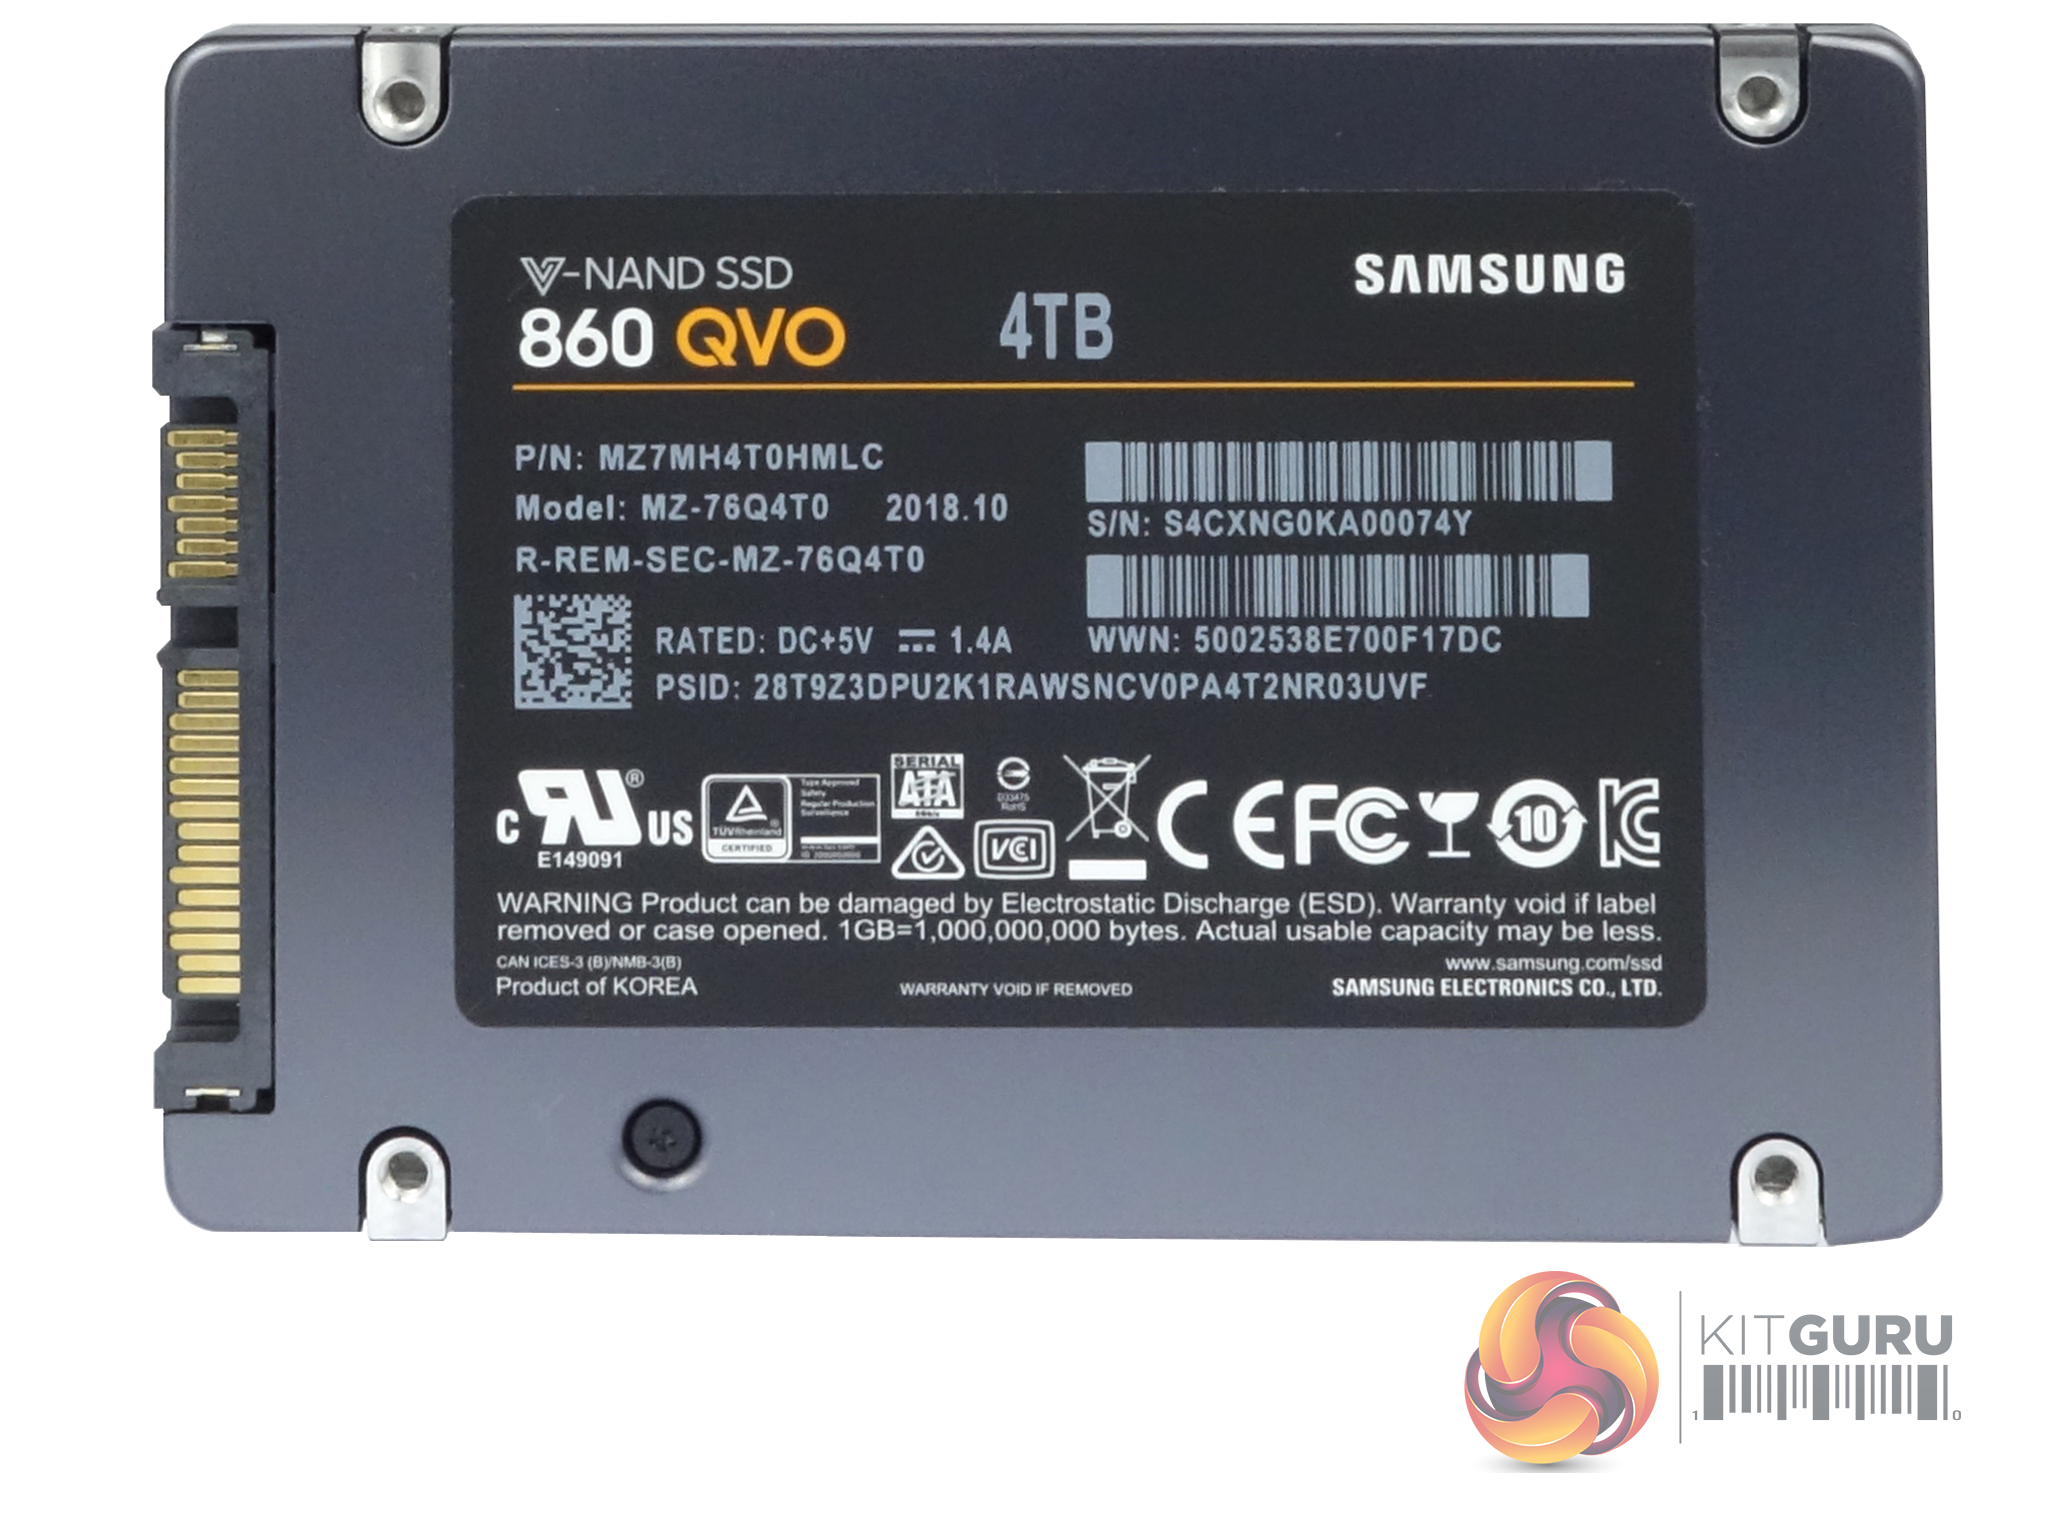
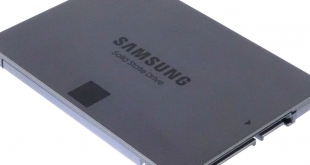
The drive is built on the standard 2.5in format and has a metal enclosure held in place by three pentalobe screws, two of which are hidden under the label on the rear of the drive. Be warned, ripping off the label to get at the screws will void the drive's warranty.
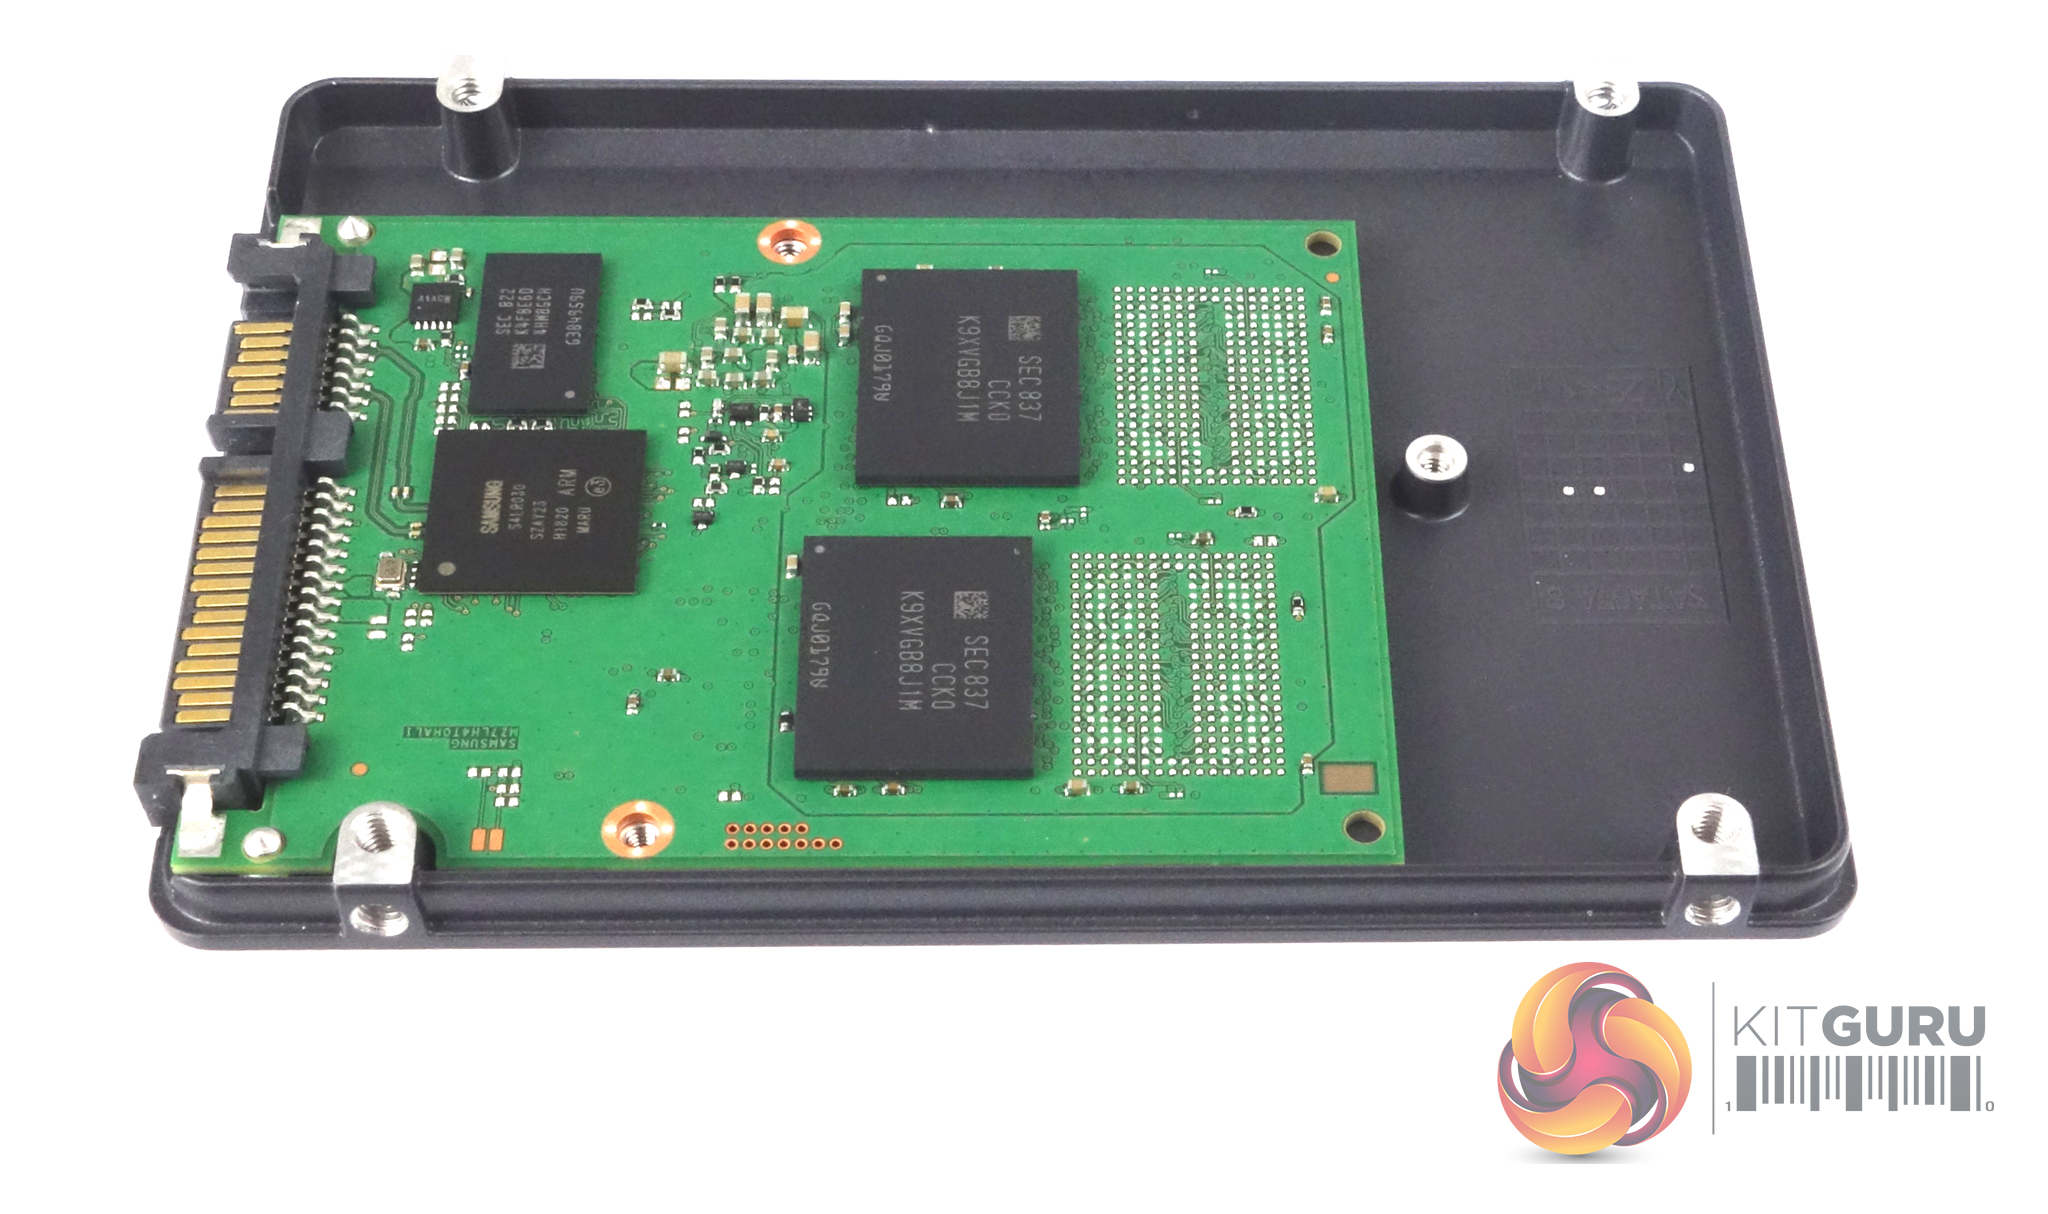
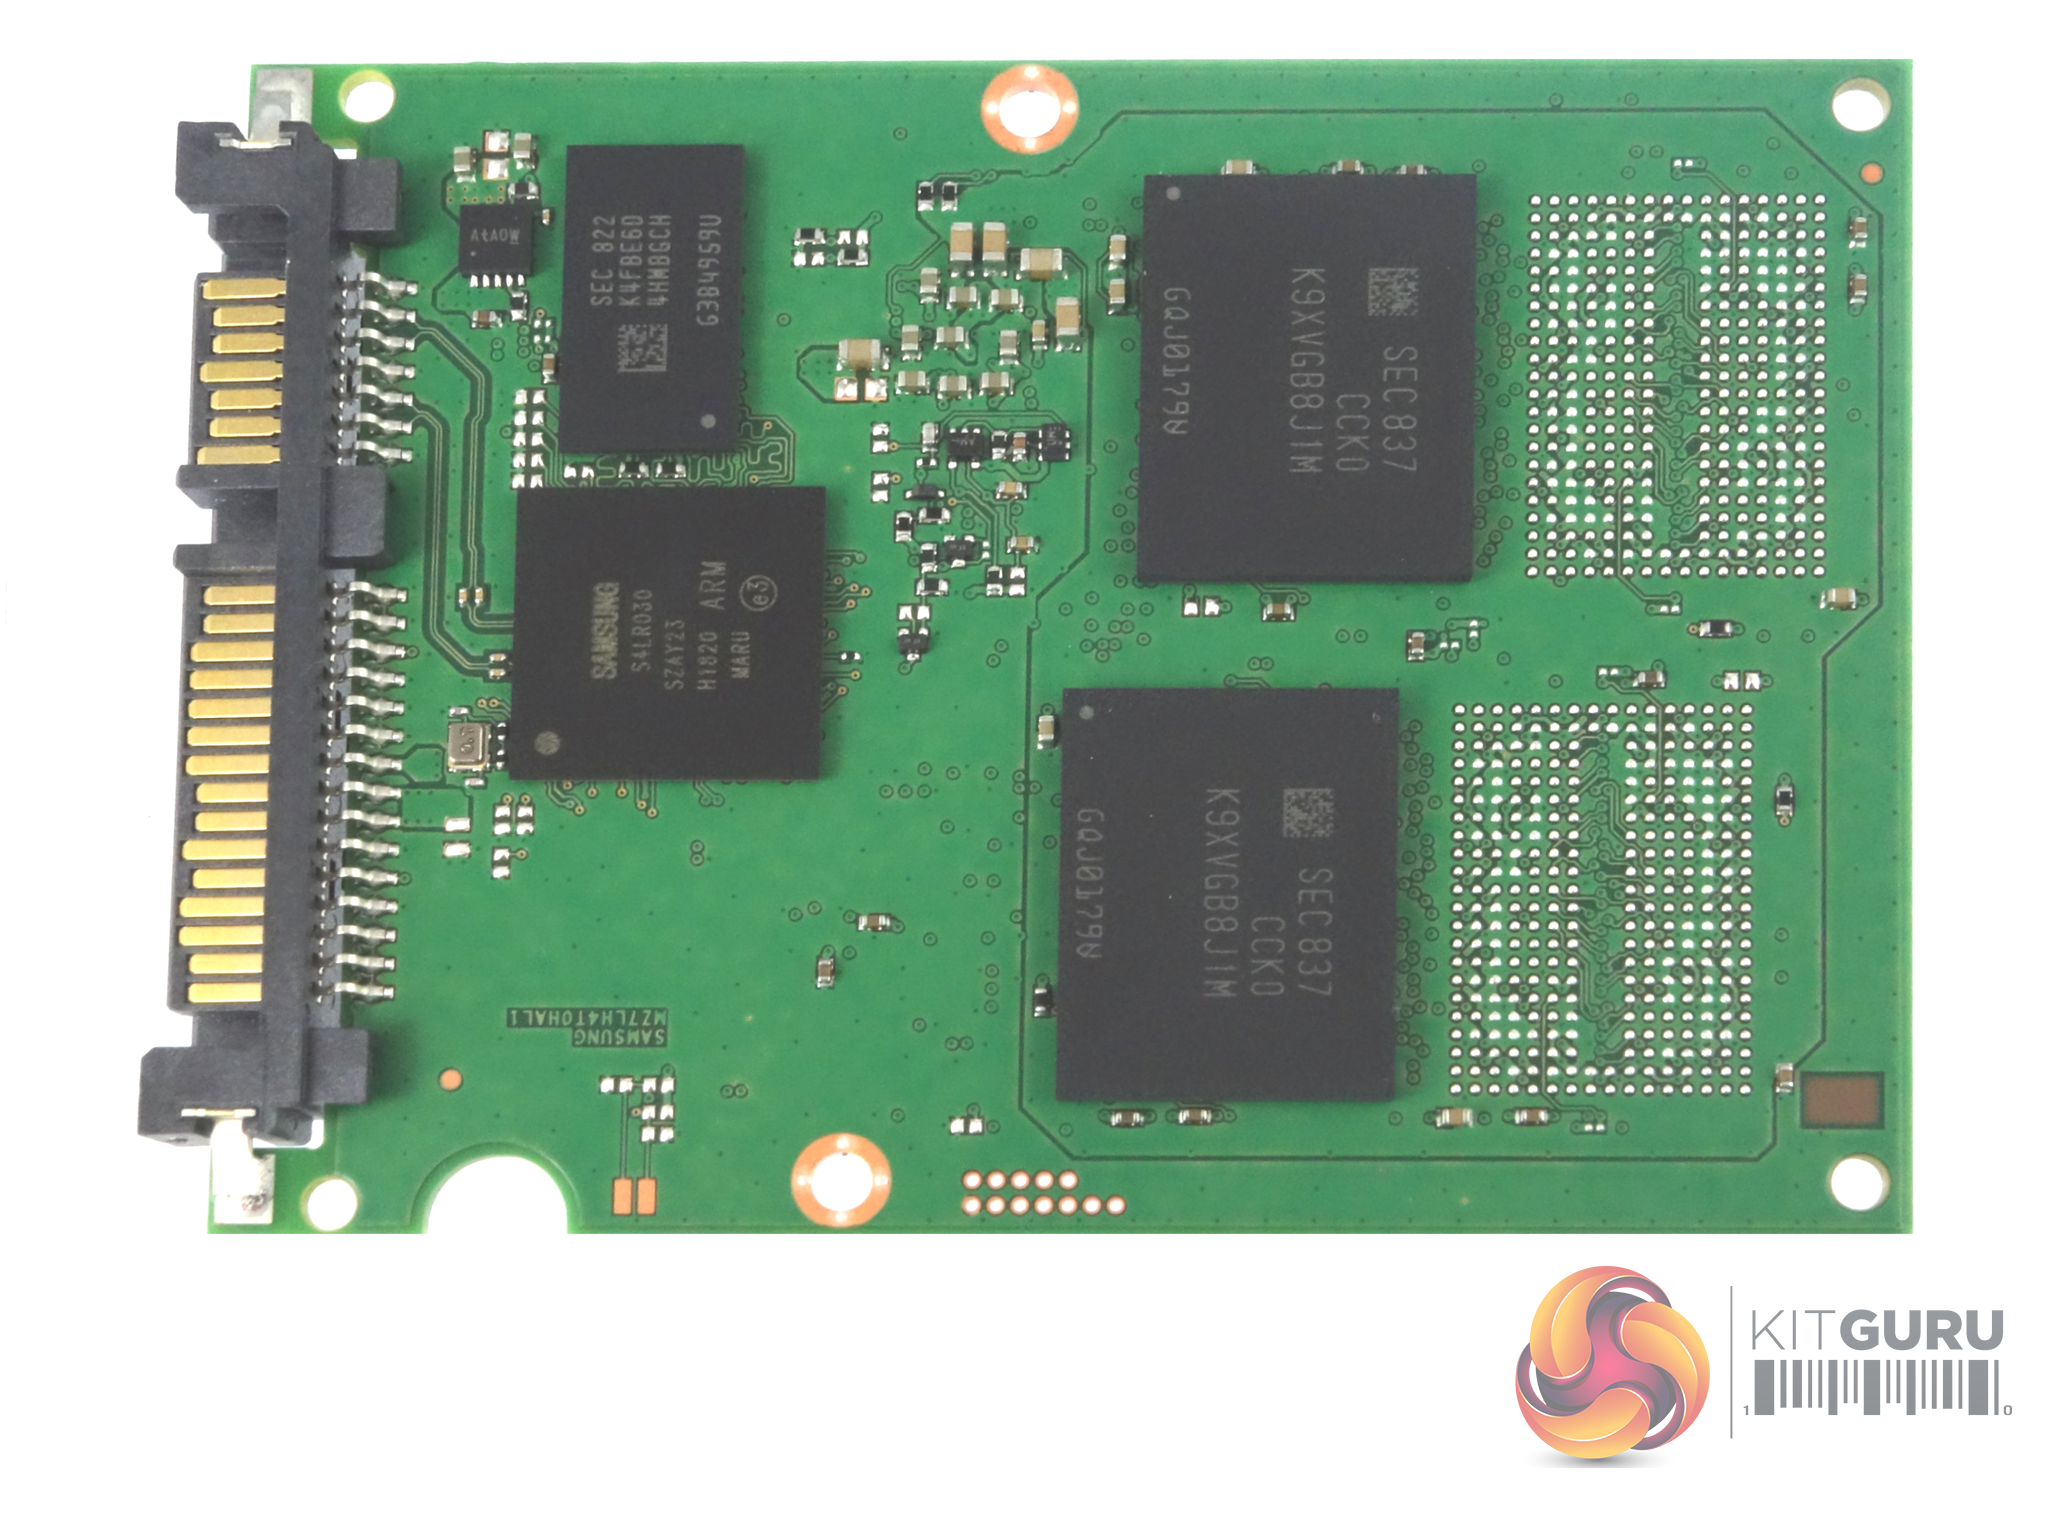
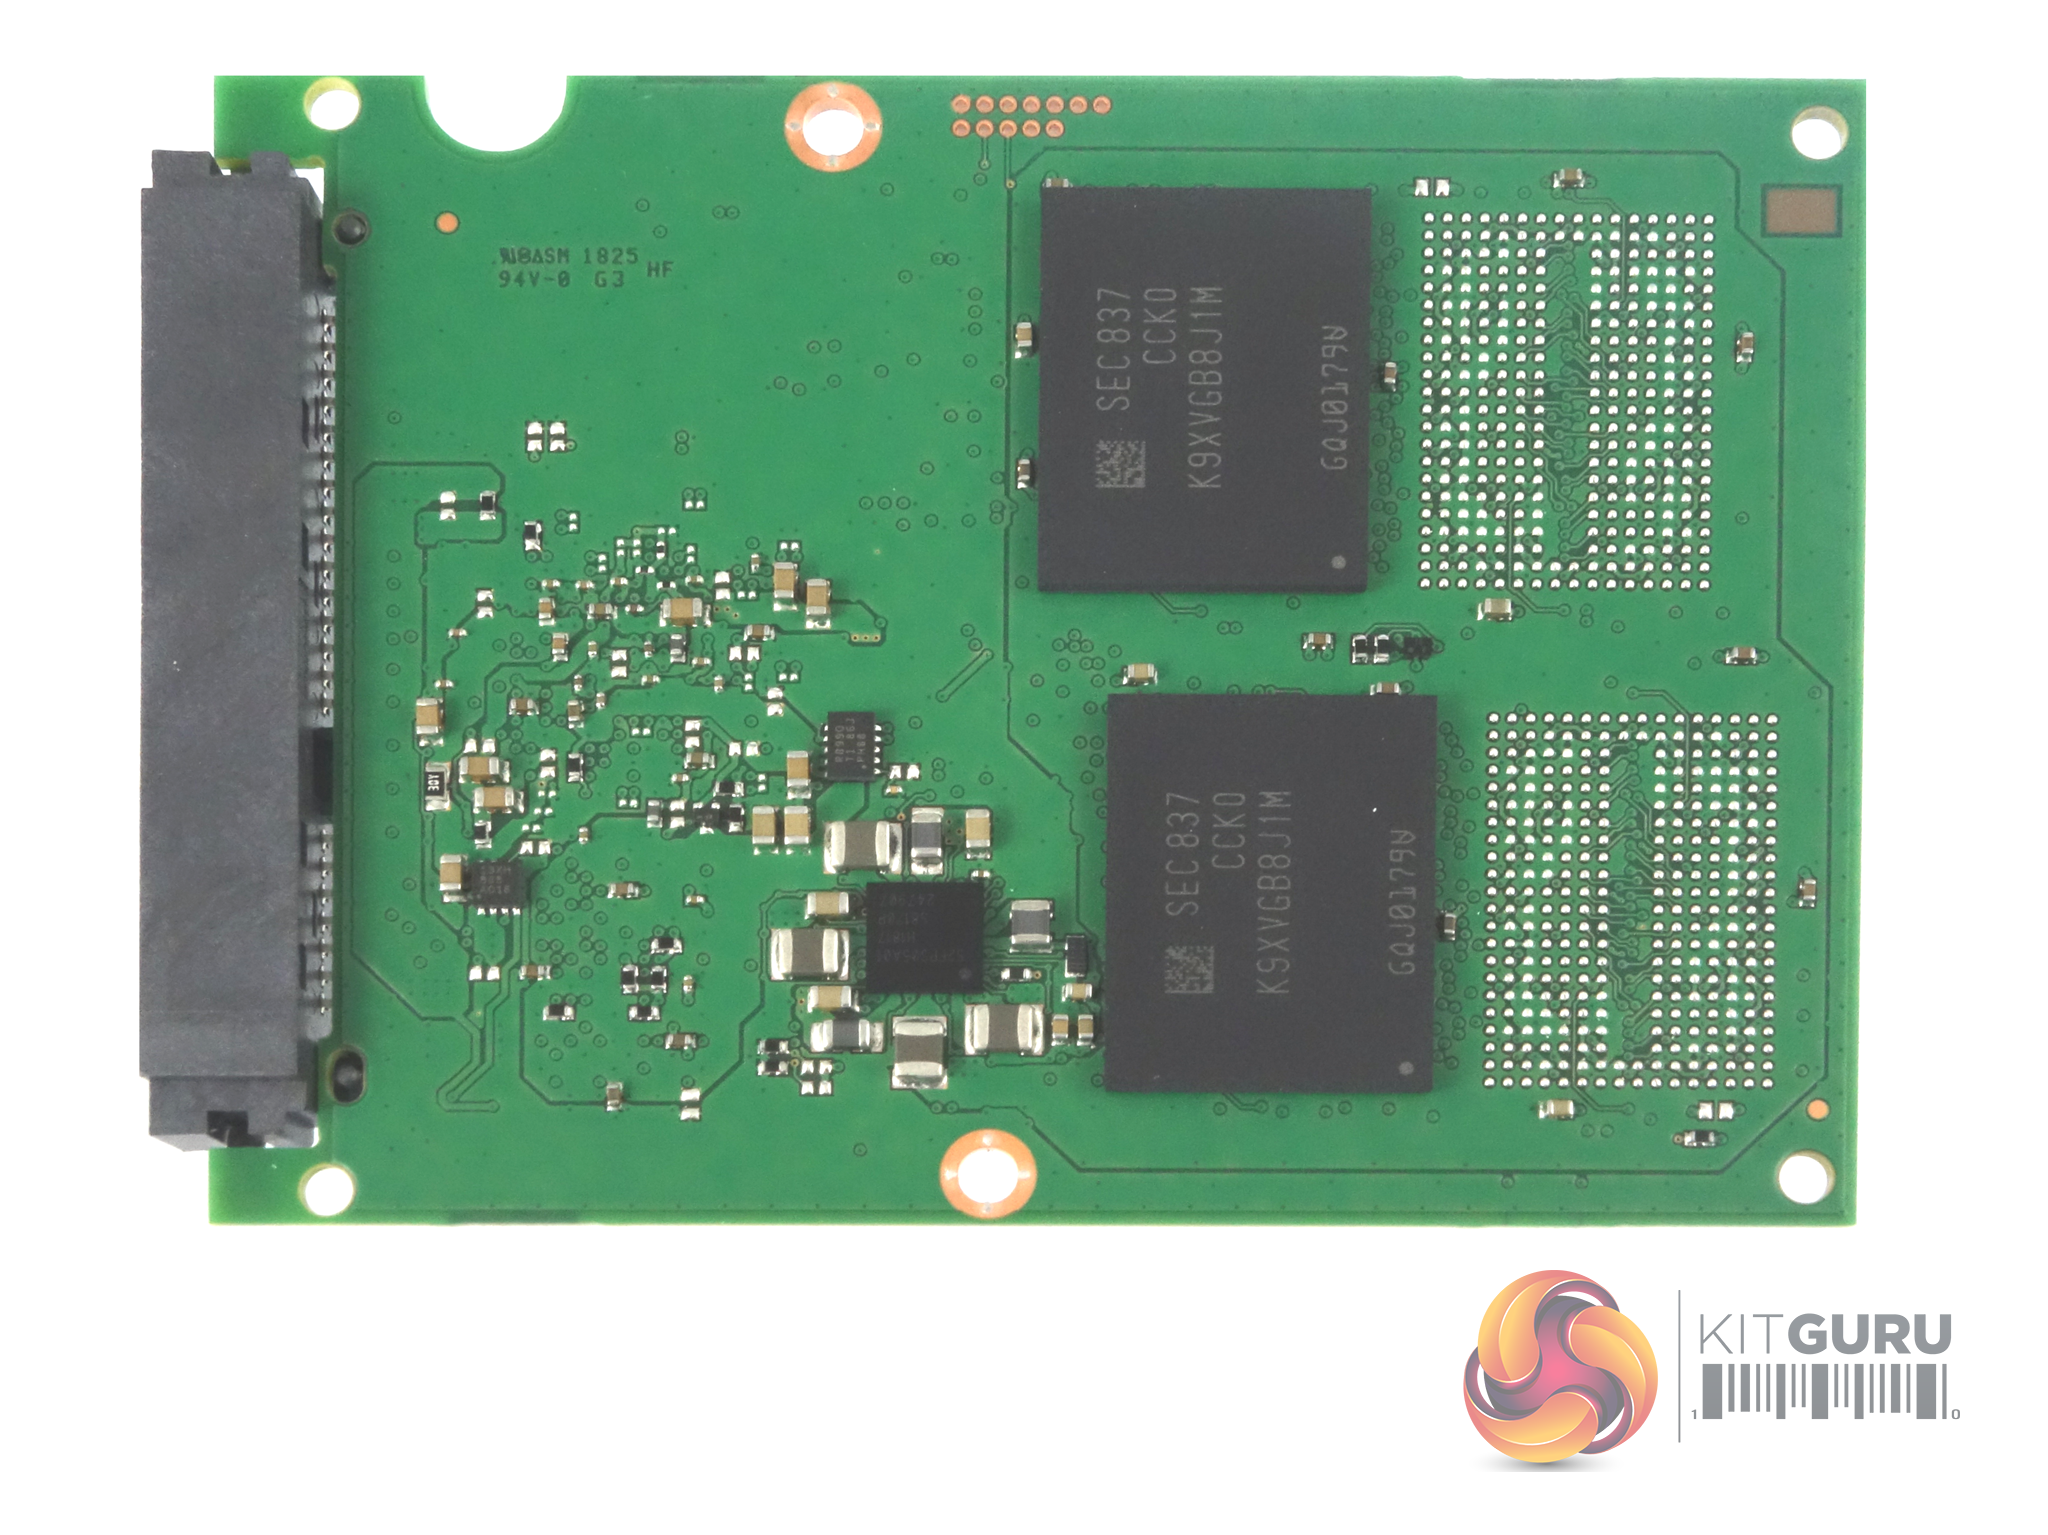
Two 1TB NAND packages (coded K9XVGB8J1M) occupy one side of the PCB along with the Samsung MJX (S4LR030) 8-channel controller and the 4GB LPDDR4 cache IC. On the other side of the PCB we find another two NAND packages.
For testing, the drives are all wiped and reset to factory settings by HDDerase V4. We try to use free or easily available programs and some real world testing so you can compare our findings against your own system. This is a good way to measure potential upgrade benefits.
Main system:
Intel Core i7-7700K with 16GB of DDR4-3200 RAM, Sapphire R9 390 Nitro and an Asus Prime Z270-A motherboard.
Other drives
Crucial BX100 1TB
Crucial BX200 960GB
Crucial M550 1TB
Crucial MX200 1TB
Crucial MX300 2TB
Crucial MX300 Limited Edition 750GB
Integral SVR-PRO 100 4TB
Kingston SSDNow V310 960GB
Kingston UV500 960GB
Samsung 840 EVO 1TB
Samsung 850 EVO 1TB
Samsung 860 EVO 4TB
Samsung 860 PRO 4TB
SK hynix SE3010 960GB
Toshiba TR200 960GB
Ultima Pro X 960GB
Software:
Atto Disk Benchmark.
CrystalMark 3.0.3.
AS SSD.
IOMeter.
Futuremark PC Mark 8
All our results were achieved by running each test five times with every configuration this ensures that any glitches are removed from the results. Trim is confirmed as running by typing fsutil behaviour query disabledeletenotify into the command line. A response of disabledeletenotify =0 confirms TRIM is active.
CrystalDiskMark is a useful benchmark to measure theoretical performance levels of hard drives and SSDs. We are using V3.0.3.
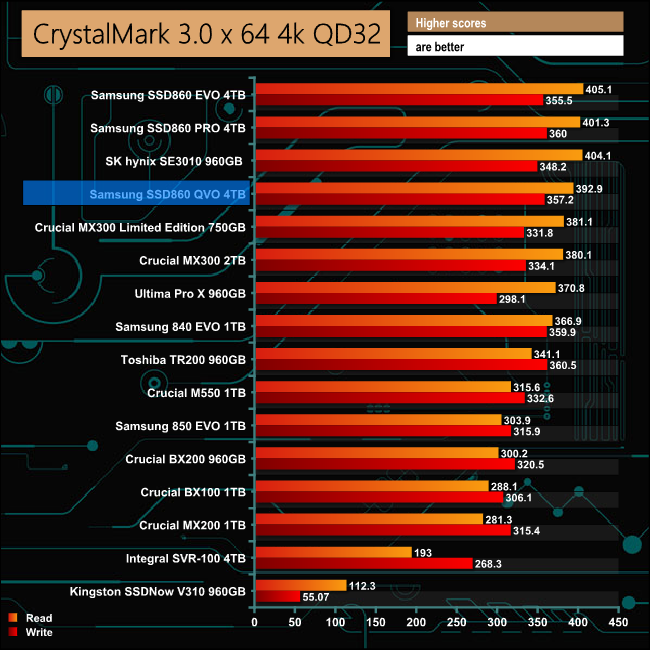
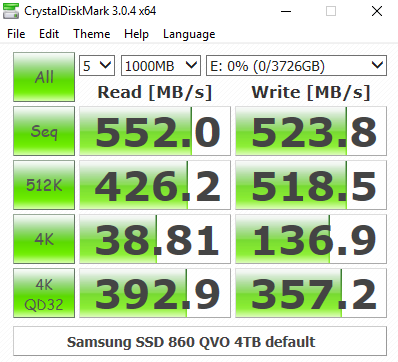
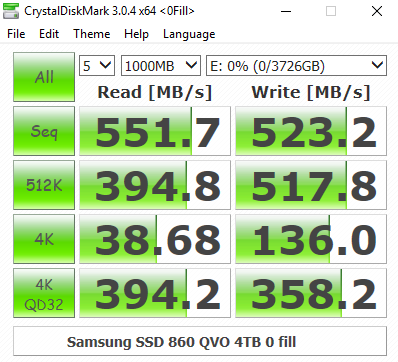
Testing the SSD 860 QVO with CrystalDiskMark, we see that the drive falls just short of the other two 4TB SSD 860 drives we have tested when it comes to reads. When it comes to writes it sits between the 860 EVO and the 860 PRO.
The ATTO Disk Benchmark performance measurement tool is compatible with Microsoft Windows. Measure your storage systems performance with various transfer sizes and test lengths for reads and writes. Several options are available to customize your performance measurement including queue depth, overlapped I/O and even a comparison mode with the option to run continuously.
Use ATTO Disk Benchmark to test any manufacturers RAID controllers, storage controllers, host adapters, hard drives and SSD drives and notice that ATTO products will consistently provide the highest level of performance to your storage.
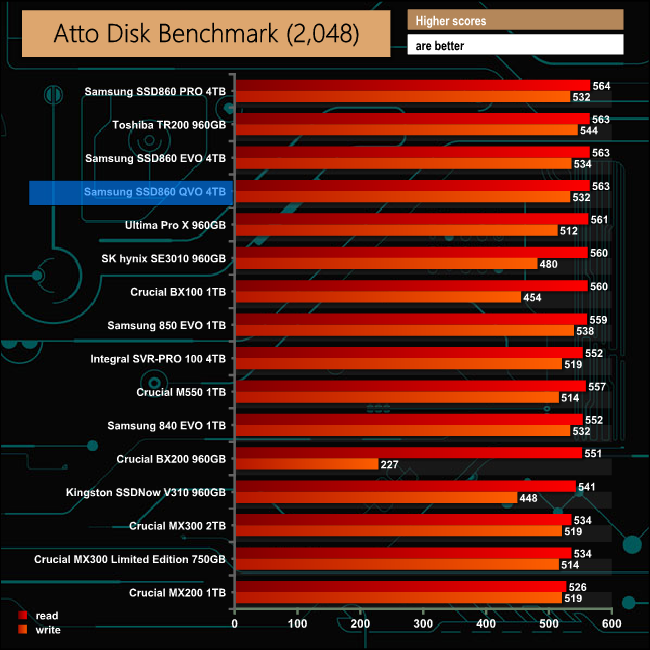
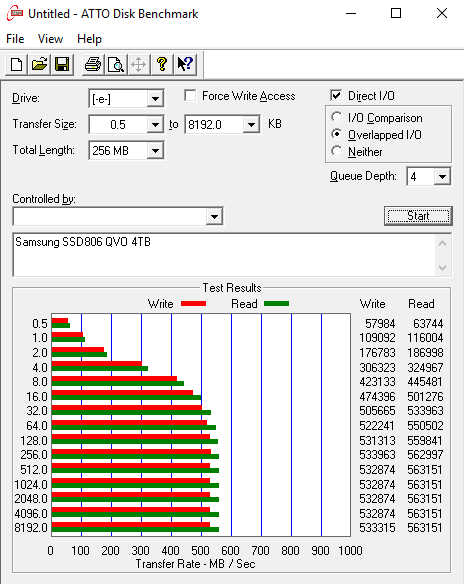
Samsung quotes Sequential speed figures for the 4TB 850 QVO at 550MB/s for reads and 520MB/s for writes. Using the ATTO benchmark we managed to squeeze a little more out of the drive under testing, with reads of 563MB/s and writes of 532MB/s.
AS SSD is a great free tool designed just for benching Solid State Drives. It performs an array of sequential read and write tests, as well as random read and write tests with sequential access times over a portion of the drive. AS SSD includes a sub suite of benchmarks with various file pattern algorithms but this is difficult in trying to judge accurate performance figures.
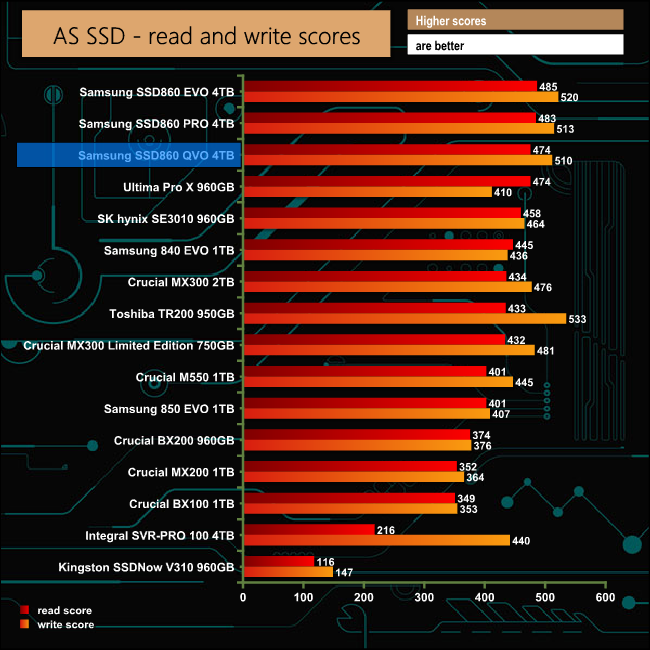
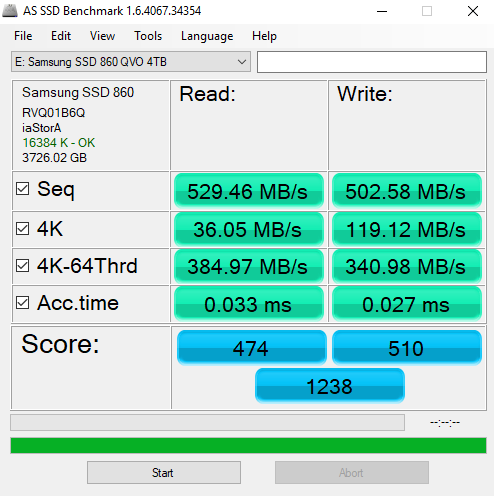
As with the CrystalDiskMark results, the drive sits just below the other two SSD 860 models in our AS SSD results chart.
IOMeter is another open source synthetic benchmarking tool which is able to simulate the various loads placed on hard drive and solid state drive technology.
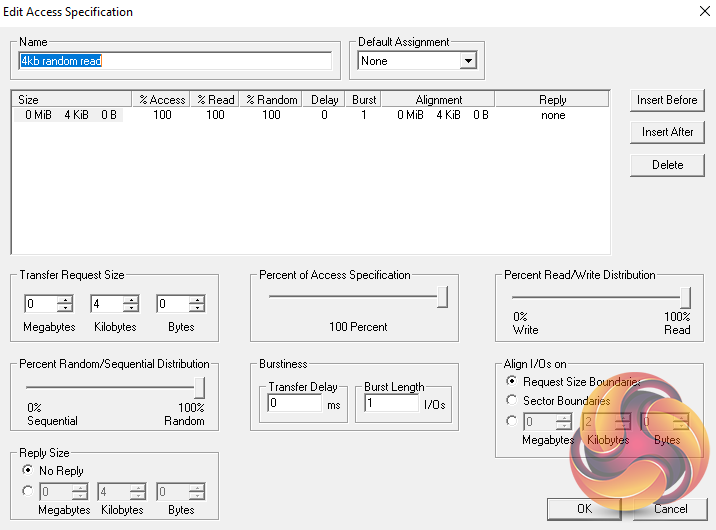
We test with both random read and write 4K tests, as shown above. There are many ways to measure the IOPS performance of a Solid State Drive, so our results will sometimes differ from manufacturer’s quoted ratings. We do test all drives in exactly the same way, so the results are directly comparable.
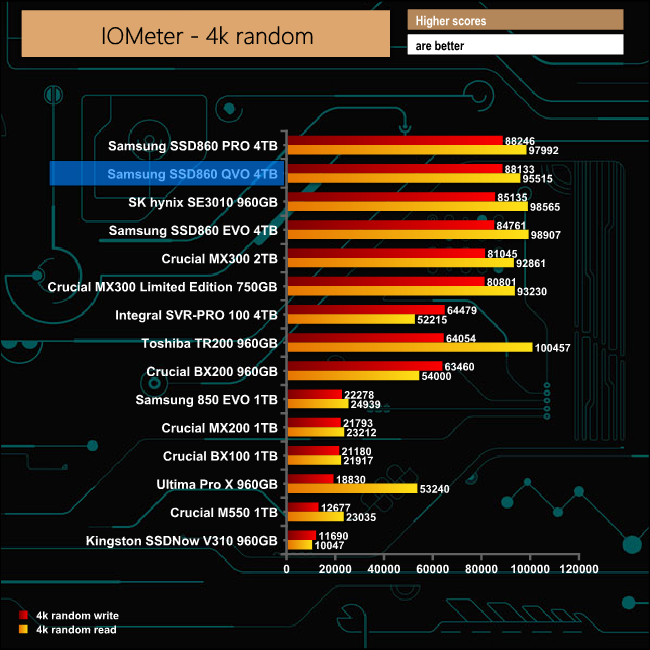
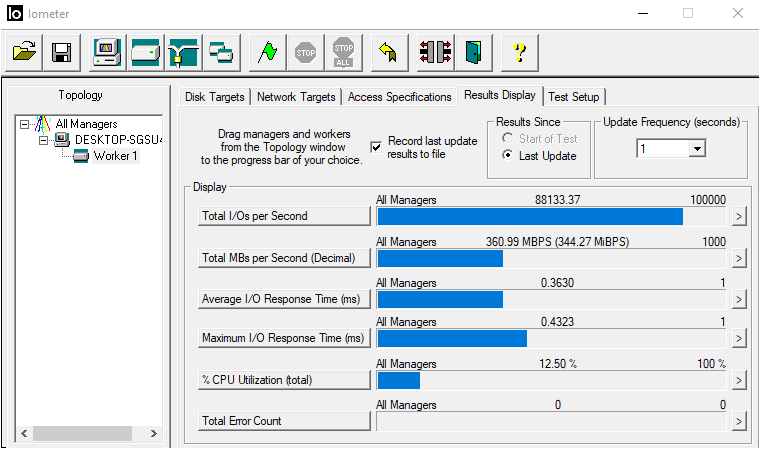
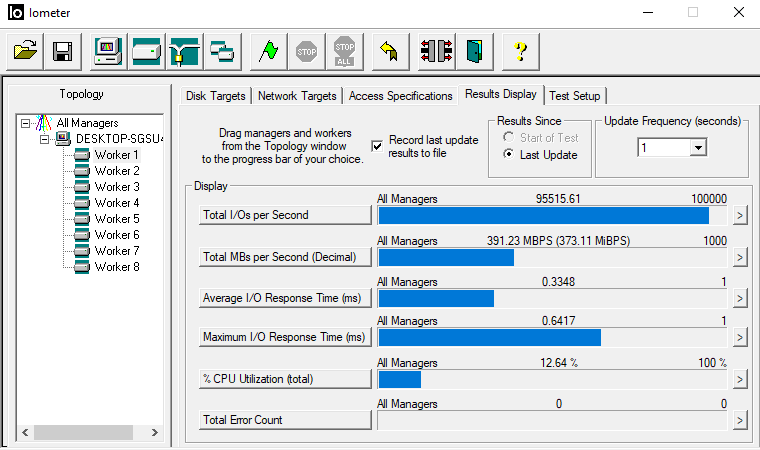
The SSD 860 QVO has better 4K random write performance than the 860 EVO, but it is not quite as quick as the 860 PRO. However, when it comes to 4K reads it's faster than both of them. Our tested figures for reads and writes of 95,515 IOPS and 88,133 IOPS respectively are a little behind the official maximum figures of 97,000 IOPS reads with writes at 89,000.
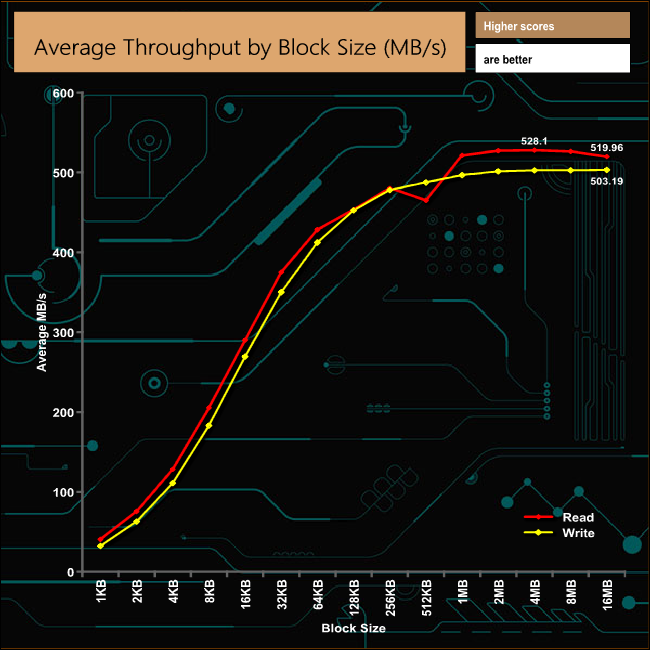
In our throughput tests the peak read figure came at the 4MB block mark, at 528MB/s, while peak writes came at the end of the test at 503MB/s. Both of these results are a little short of the maximum figures quoted by Samsung; 550MB/s for reads and 520MB/s for writes.
Futuremark’s PCMark 8 is a very good all round system benchmark but it’s Storage Consistency Test takes it to whole new level when testing SSD drives. It runs through four phases; Preconditioning, Degradation, Steady State, Recovery and finally Clean Up. During the Degradation, Steady State and Recovery phases it runs performance tests using the 10 software programs that form the backbone of PCMark 8; Adobe After Effects, Illustrator, InDesign, Photoshop Heavy and Photoshop Light, Microsoft Excel, PowerPoint, Word, Battlefield 3 and World of Warcraft. With some 18 phases of testing, this test can take many hours to run.
Preconditioning
The drive is written sequentially through up to the reported capacity with random data, write size of 256 × 512 = 131,072 bytes. This is done twice.
Degradation
Run writes of random size between 8 × 512 and 2048 × 512 bytes on random offsets for 10 minutes. It then runs a performance test. These two actions are then repeated 8 times and on each pass the duration of random writes is increased by 5 minutes.
Steady State
Run writes of random size between 8 × 512 and 2048 × 512 bytes on random offsets for final duration achieved in degradation phase. A performance test is then run. These actions are then re-run five times.
Recovery
The drive is idled for 5 minutes. Then a performance test is run. These actions are then repeated five times.
Clean Up
The drive is written through sequentially up to the reported capacity with zero data, write size of 256 × 512 = 131,072 bytes.
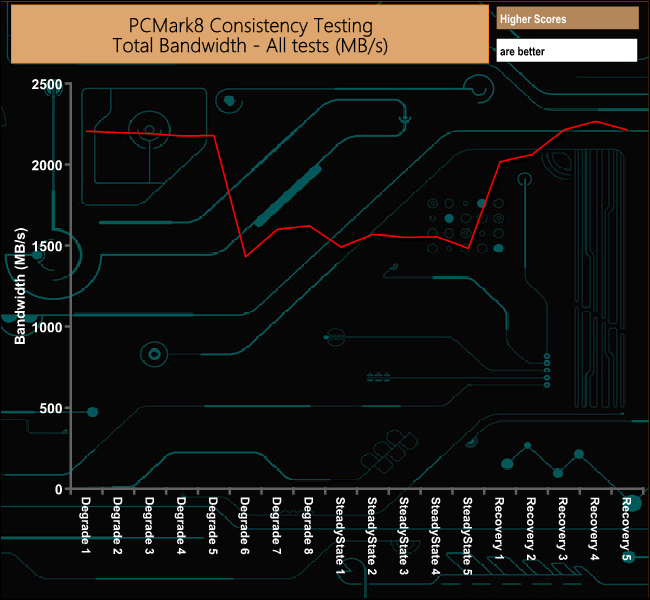

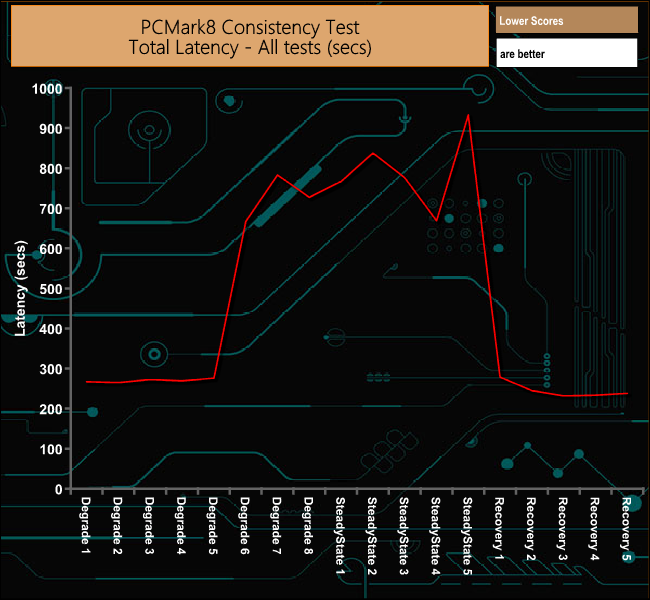
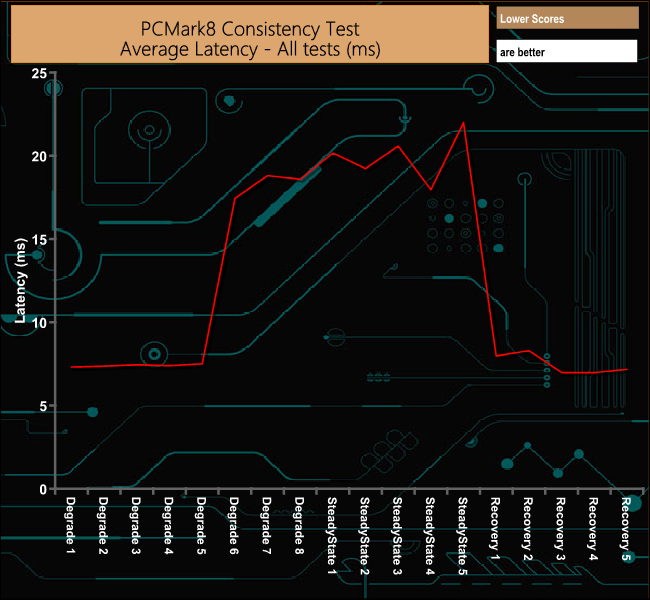
The drive gets hit quite hard during latter stages of the Degradation test and for the whole of the Steady State test. It recovers well from the ordeal, albeit a little erratically.
PCMark 8’s Consistency test provides a huge amount of performance data, so here we’ve looked a little closer at how the 4GB SSD860 QVO performs in each of the benchmarks test suites.
Adobe Creative Cloud
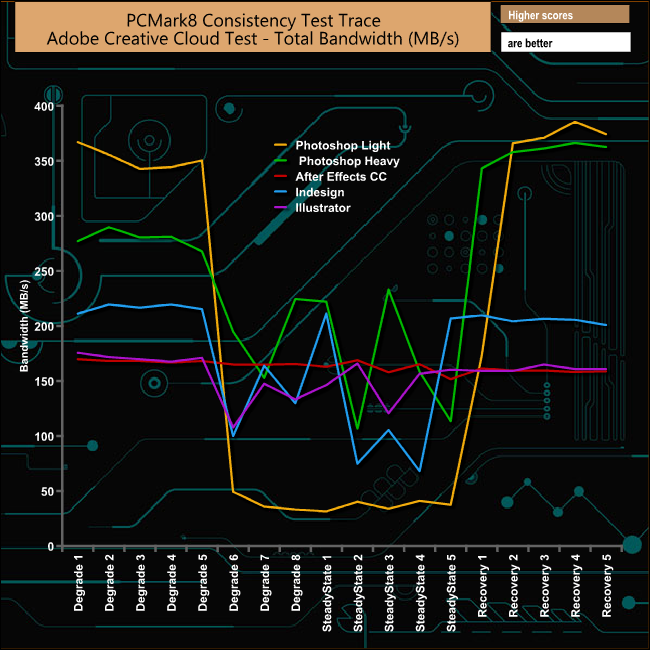
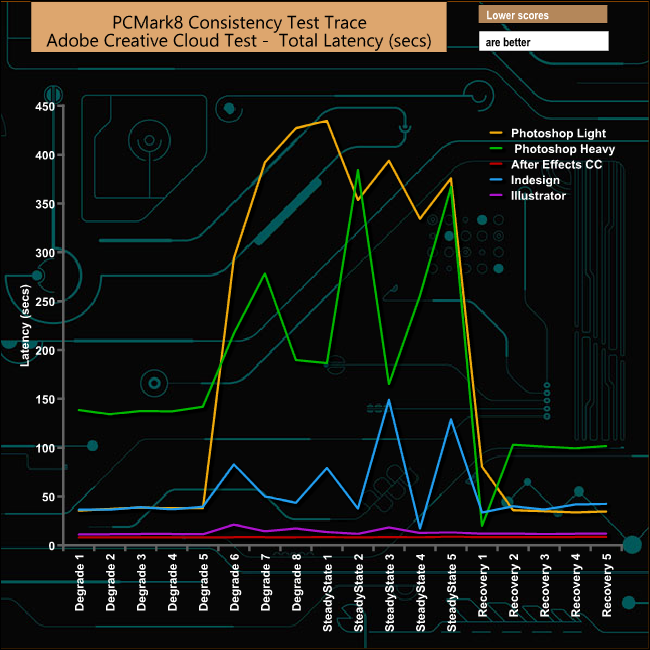
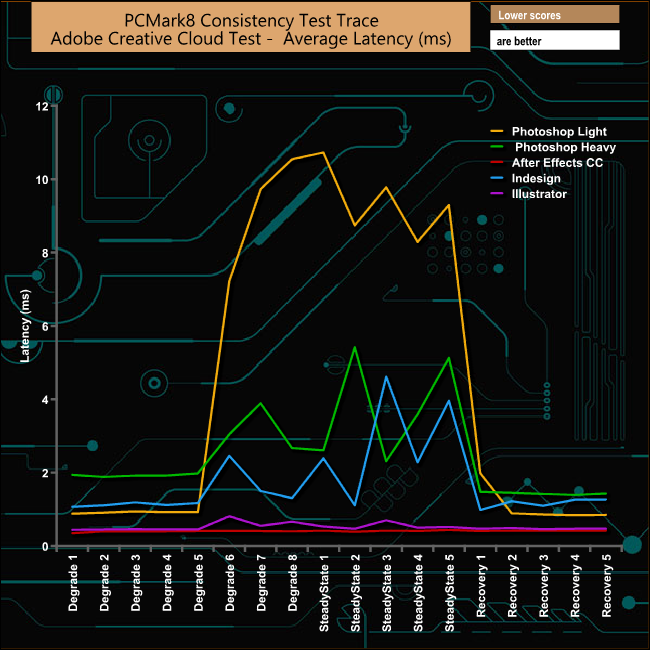
Unusually it's the Adobe Photoshop Light trace tests rather than the Photoshop Heavy tests that causes the drive the most problems, with a huge drop in bandwidth towards the end of the Degradation stages and on through the Steady State test phases, but it does recover very quickly.
Microsoft Office
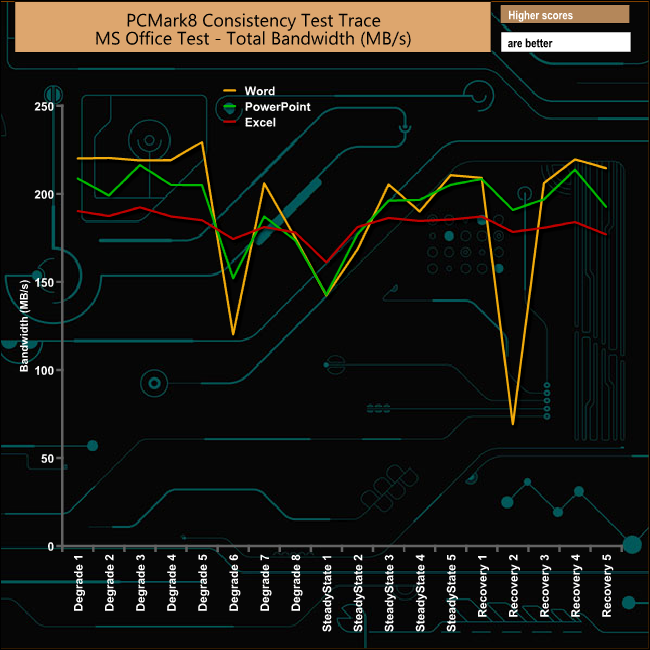
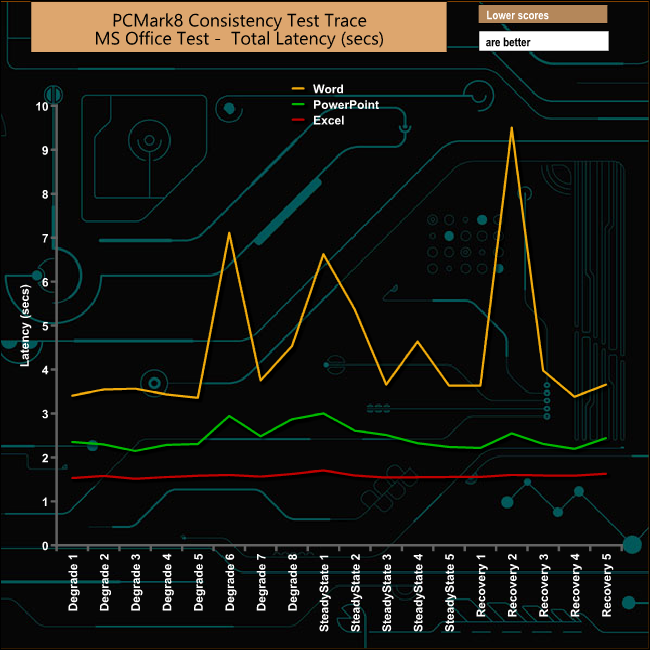
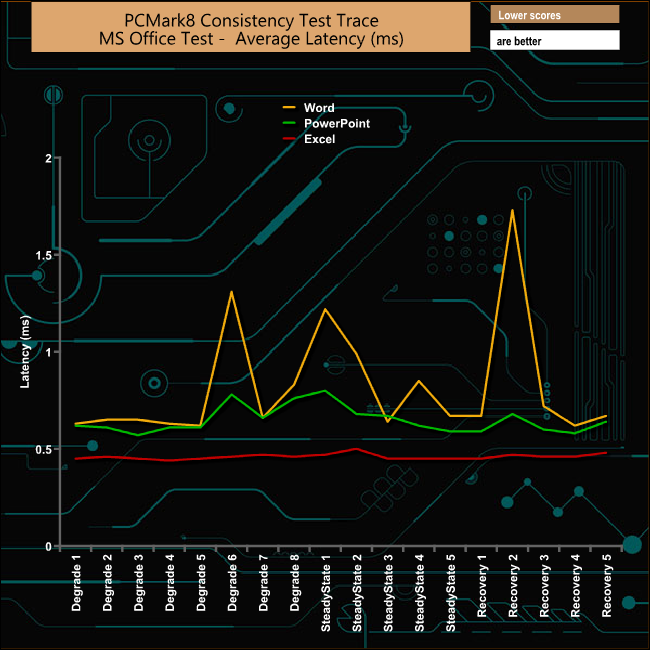
As usual it's the Word trace that gets hit hardest during the test. Oddly, though, it suffers the most during the second stage of its recovery run.
Casual Gaming
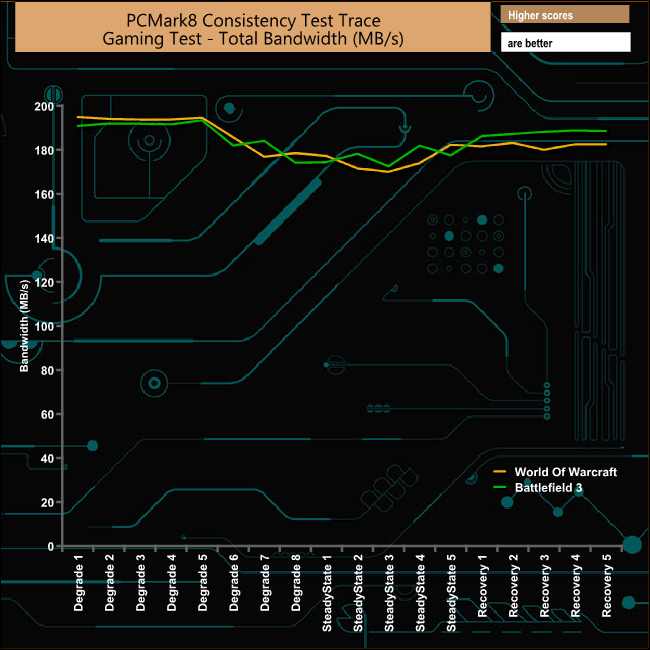
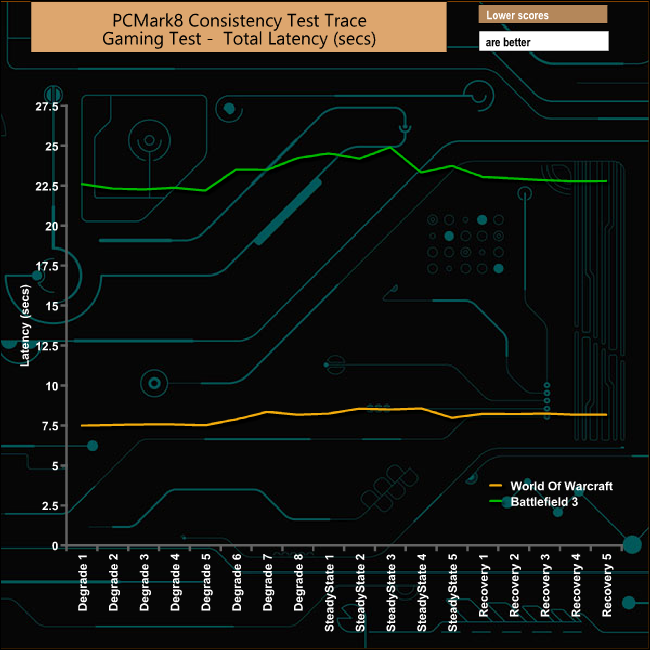
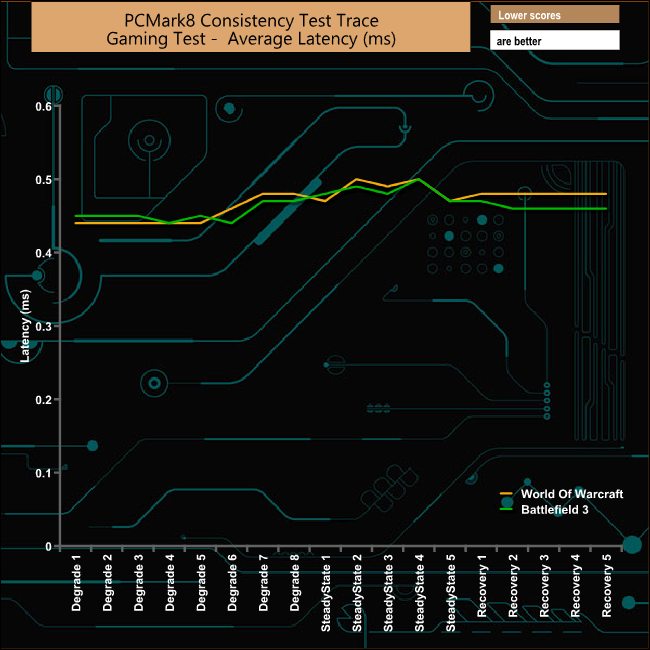
Both casual game tests get through the benchmark run without too many problems.
Just like the Consistency test, PCMark 8’s Standard Storage test also saves a large amount of performance data. The default test runs through the test suite of 10 applications three times. Here we show the total bandwidth performance for each of the individual test suites for the third and final benchmark run.

The drive produces strong bandwidth figures for both Adobe Photoshop test traces in the final benchmark run.
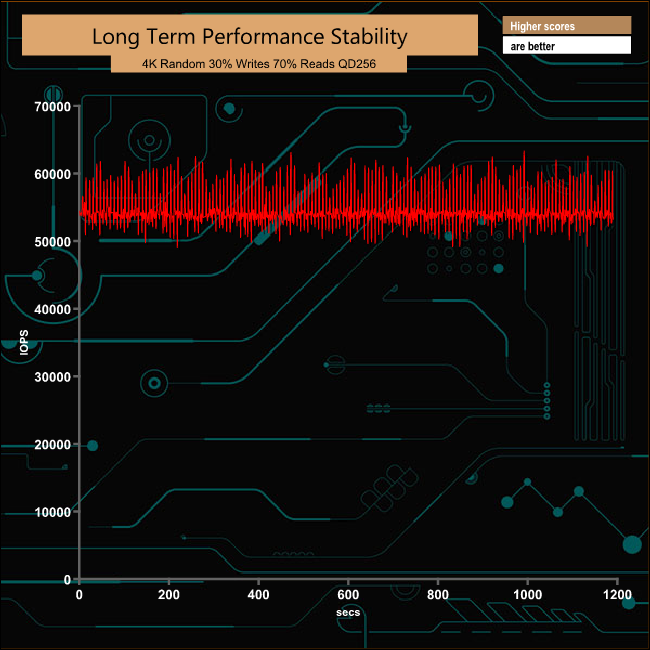
For the long term performance stability test, we set the drive up to run a 20-minute 4K random test with a 30% write, 70% read split, at a Queue Depth of 256 over the entire disk. The 4TB Samsung SSD 860 QVO averaged 54,415 IOPS for the test with an impressive performance stability of 88.8%.
To test real life performance of a drive we use a mix of folder/file types and by using the FastCopy utility (which gives a time as well as MB/s result) we record the performance of drive reading from & writing to a 256GB Samsung SSD850 PRO.
We use the following folder/file types:
- 100GB data file.
- 60GB ISO image.
- 60GB Steam folder – 29,521 files.
- 50GB File folder – 28,523 files.
- 12GB Movie folder – 24 files (mix of Blu-ray and 4K files).
- 10GB Photo folder – 621 files (mix of .png, raw and .jpeg images).
- 10GB Audio folder – 1,483 files (mix of mp3 and .flac files).
- 5GB (1.5bn pixel) photo.
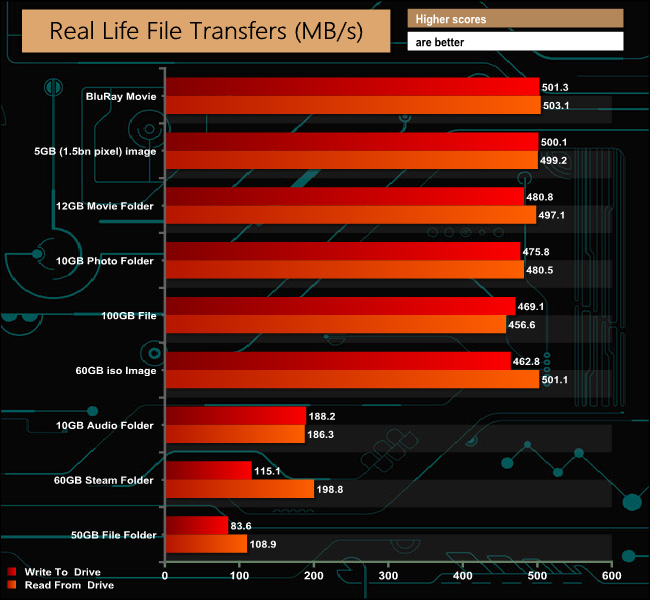
The drive had no real problems in our real life file transfer tests, although it handled larger file sizes much more efficiently than the small files contained in the 60GB Steam, 50GB File and 10GB audio folders.
When QLC NAND was first being touted it was all about capacity rather than performance, with the promise of large capacity SSDs at reasonable cost for the consumer market. So then, it was a little surprising to see that the first two consumer drives out of the block (Intel's 660p and Crucial's P1) were NVMe based drives.
Samsung's SSD 860 QVO is the first SATA based SSD to hit the market and rather than reinventing the wheel, they have based the drive on the highly successful SSD 860 format.
The drive uses Samsung’s 1TB die size, 64-layer QLC V-NAND looked after by the same Samsung MJX controller used in both the other SSD 860 drives, the 860 EVO and PRO.
In terms of performance, the Sequential read/write performance is pretty much what you would expect from a SATA 6Gb/s drive these days, with a tested read figure of 563MB/s and writes of 532MB/s – both of which are a little better than the official 550MB/s and 520MB/s for reads and writes respectively.
To boost the write performance of the drive Samsung has turned to its tried and tested Intelligent TurboWrite technology that's found in the rest of the SSD 860 family, as well as in other drives. TurboWrite assigns a chunk of the NAND to run in SLC mode to act as a fast cache. The technology uses two types of cache, one static the other dynamic. In the case of the 860 QVO, the static cache is 6GB with the dynamic part of the cache being up to 72GB in size.
Samsung has also given the drive strong encryption features as it supports AES 256-bit, TCG/Opal V2.0 and IEEE1667 technologies.
The drive is not yet available but we will update you when we can.
Pros
- Overall performance.
- Good endurance.
- Strong built in encryption.
Cons
- Only a 3-year warranty.
KitGuru says: QLC NAND flash technology points the way forward for bringing larger capacity SSD drives to the consumer space at a reasonable cost. In fact, Samsung's 4TB SSD 860 QVO is the largest capacity consumer drive we have seen to date using the technology.