


We reviewed the vanilla version of Samsung's 980 Pro back in 2020. The original version of the drive didn't have a heatsink fitted, but recently Samsung has released a heatsink-equipped version of the same SSD. We put it to the test, comparing it to a wide range of other M.2 SSDs, and also test thermal performance versus the non-heatsink model.
As with the original SSD 980 Pro, the drive uses a combination of a Samsung Elpis controller and Samsung 6th generation 1xx layer TLC V-NAND.
There are just two capacities currently available; 1TB and 2TB. Official Sequential performance ratings for the heatsink version of the 980 Pro are the same as the standard version; up to 7,000MB/s reads for both, with writes at up to 5,000MB/s (1TB) and up to 5,100MB/s for the 2TB model. Random 4K performance is listed on the spec sheet as up to 1,000,000 IOPS for both reads and writes for both capacities.
The quoted TBW endurance figures for the heatsink versions of the drive are 600TB for the 1TB model and 1,200TBW for the 2TB model. Samsung backs the drive with a 5-year warranty.
Physical Specifications:
- Usable Capacities: 1TB.
- NAND Components: Samsung 1** layer 3bit MLC V-NAND.
- NAND Controller: Samsung Elpis.
- Cache: 1GB LPDDR4.
- Interface: PCIe Gen 4.0 x4, NVMe 1.3c.
- Form Factor: M.2 2280.
- Dimensions: 80 x 24 x 8.6mm.
- Weight 30.5g.
- Firmware Version: 3B2QGXA7.
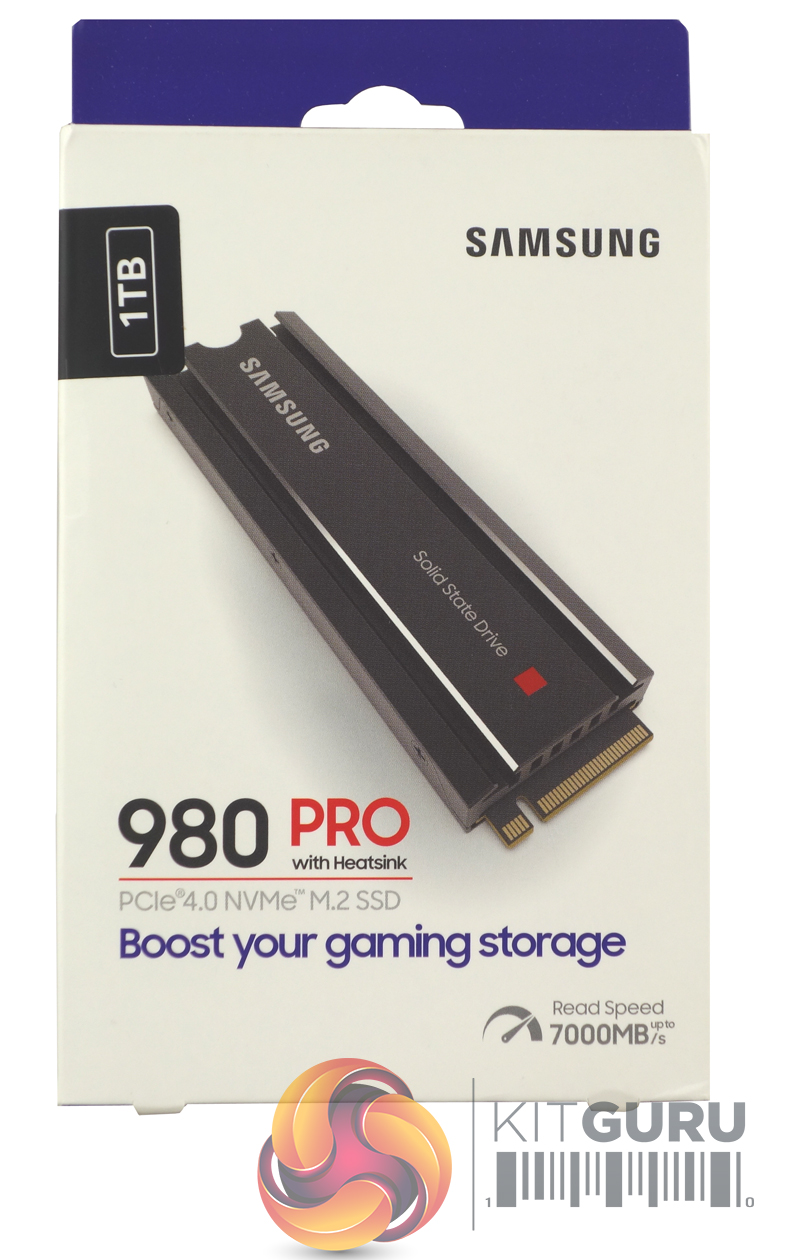
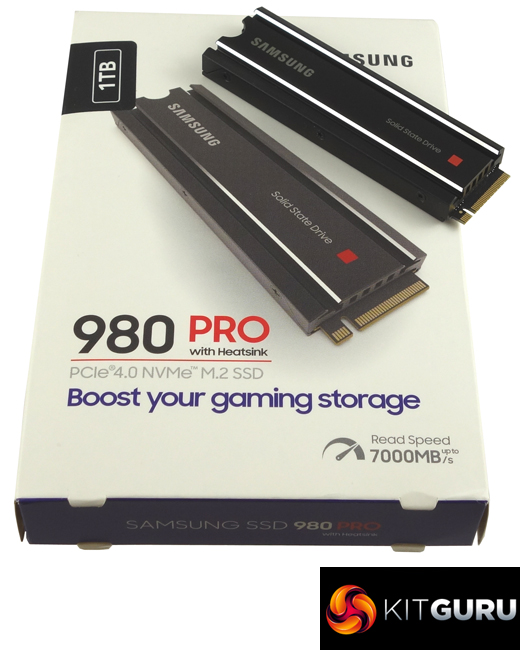
The Samsung 980 Pro with Heatsink comes in a stout box with an image of the drive on the front, above which is a sticker showing the drive's capacity. Under the image, there is a note of the drive's maximum sequential read speed – 7,000MB/s.
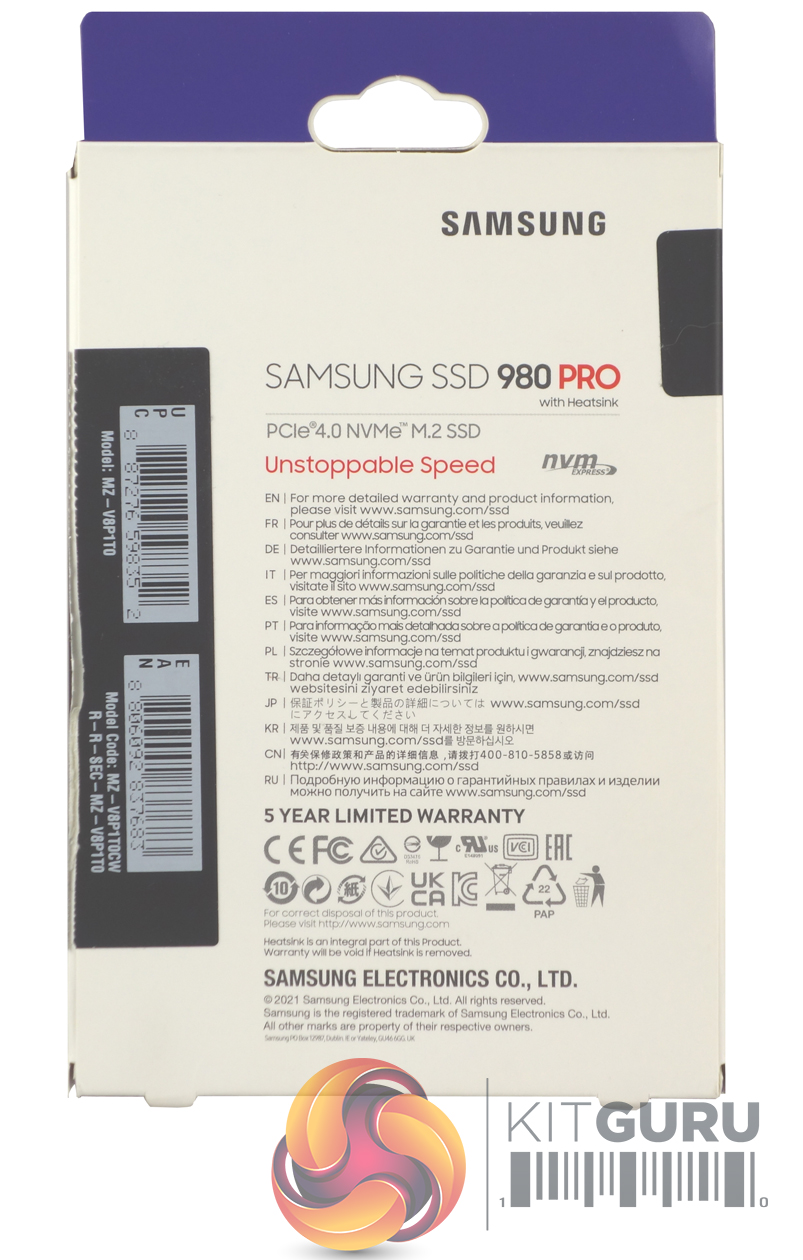
The rear of the box has a multilingual list of where to find additional warranty and Product information.
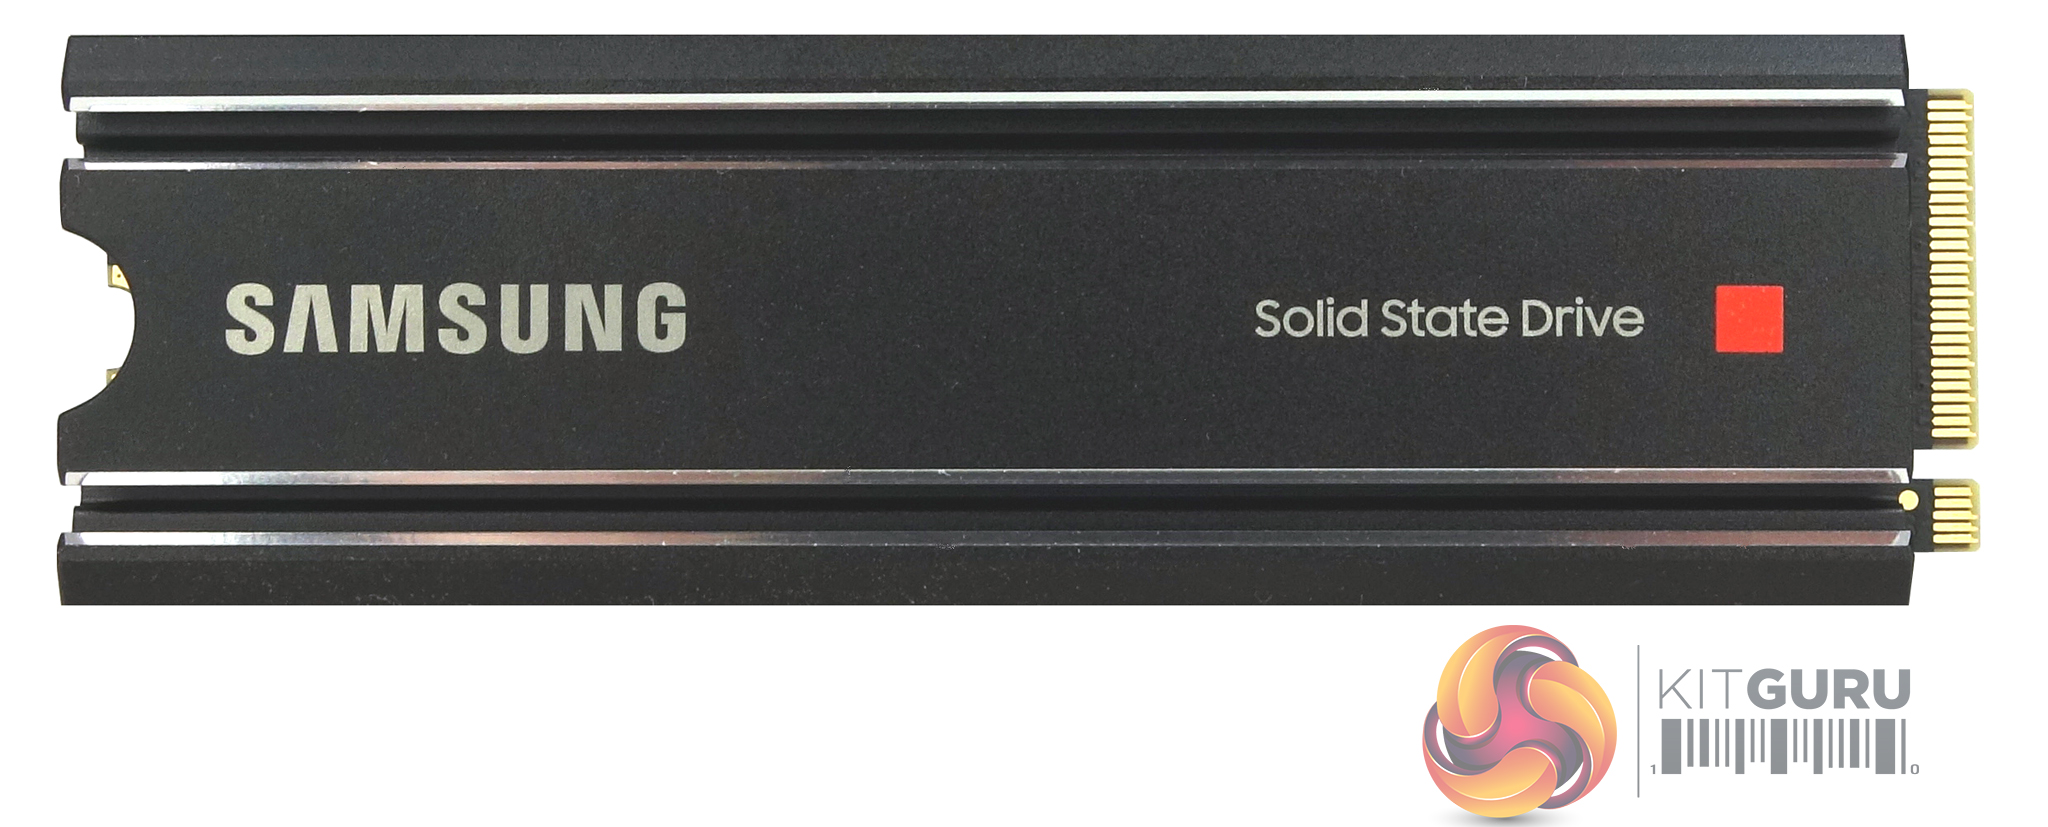
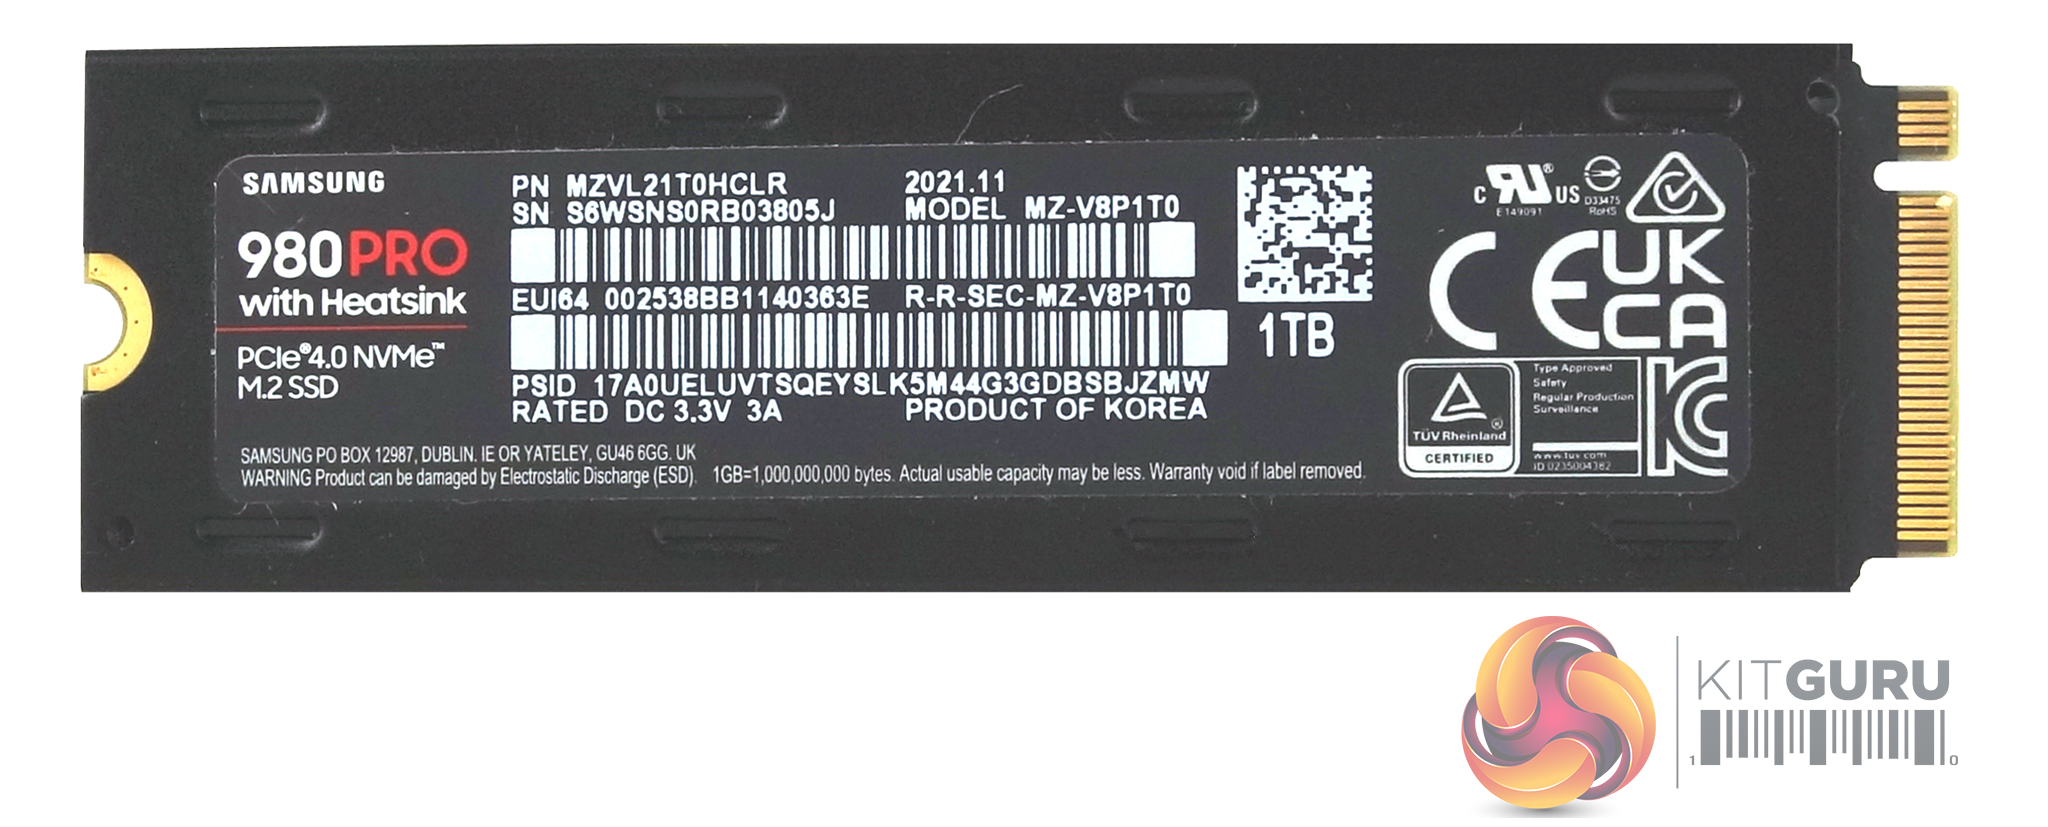
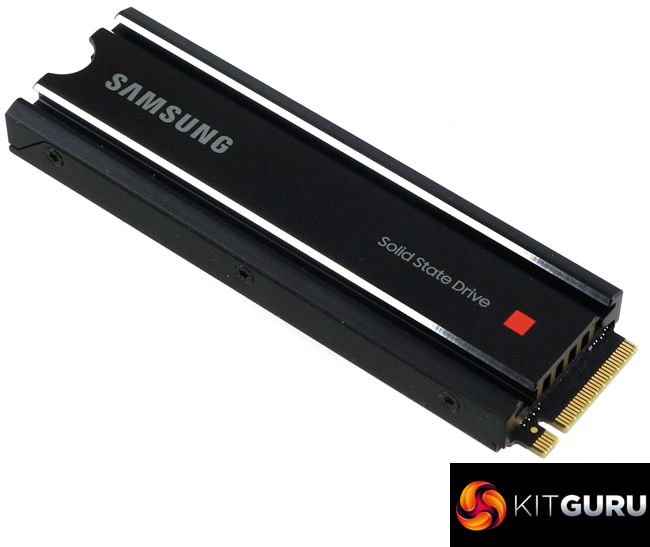
The 1TB 980 Pro is built on a single-sided M.2 2280 format PCB. Under the heatsink sits a Samsung Elpis controller, two packages of Samsung's 6th generation 1xx layer 3-bit MLC (TLC) V-NAND and a 1GB LPDDR4 cache IC.
The heatsink is a 2 piece design being held together with 6 tiny screws. The drive sits in between two layers of TIM (Thermal Interface Material). The Samsung controller also plays a part in heat dissipation as it has been coated in nickel.
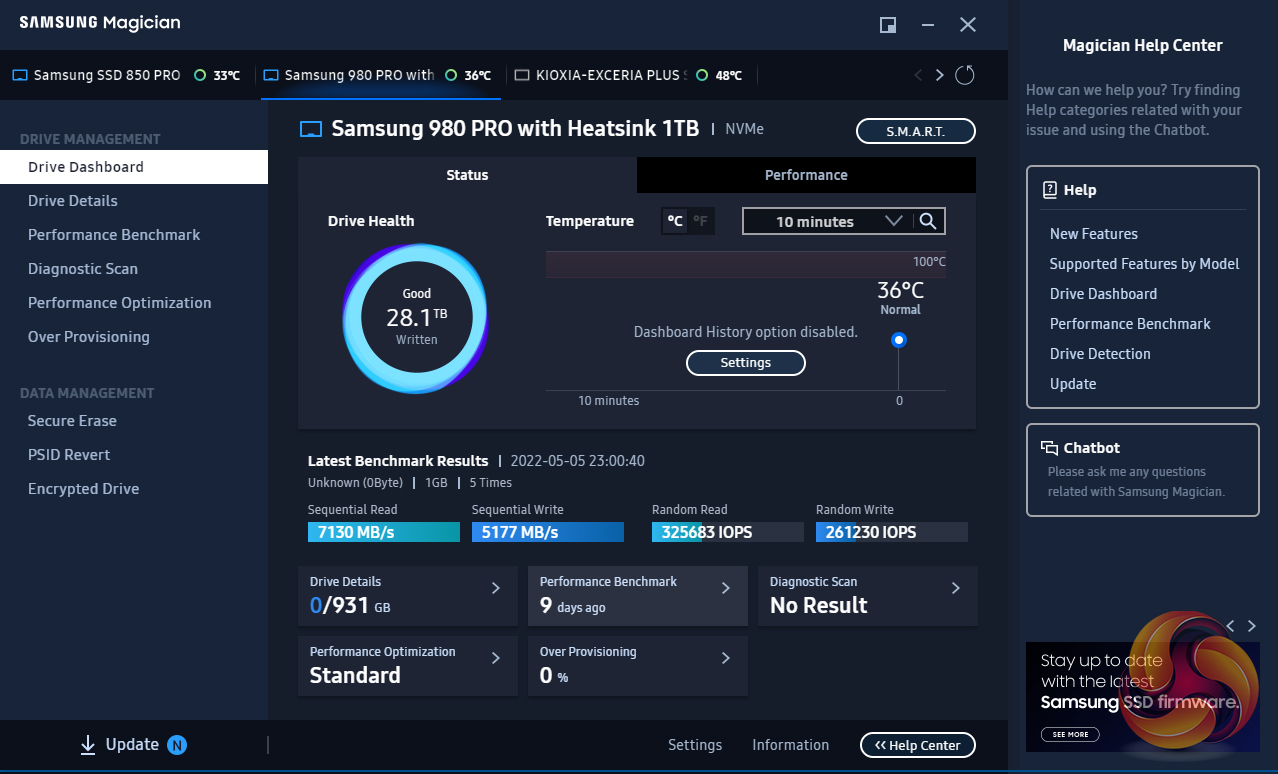
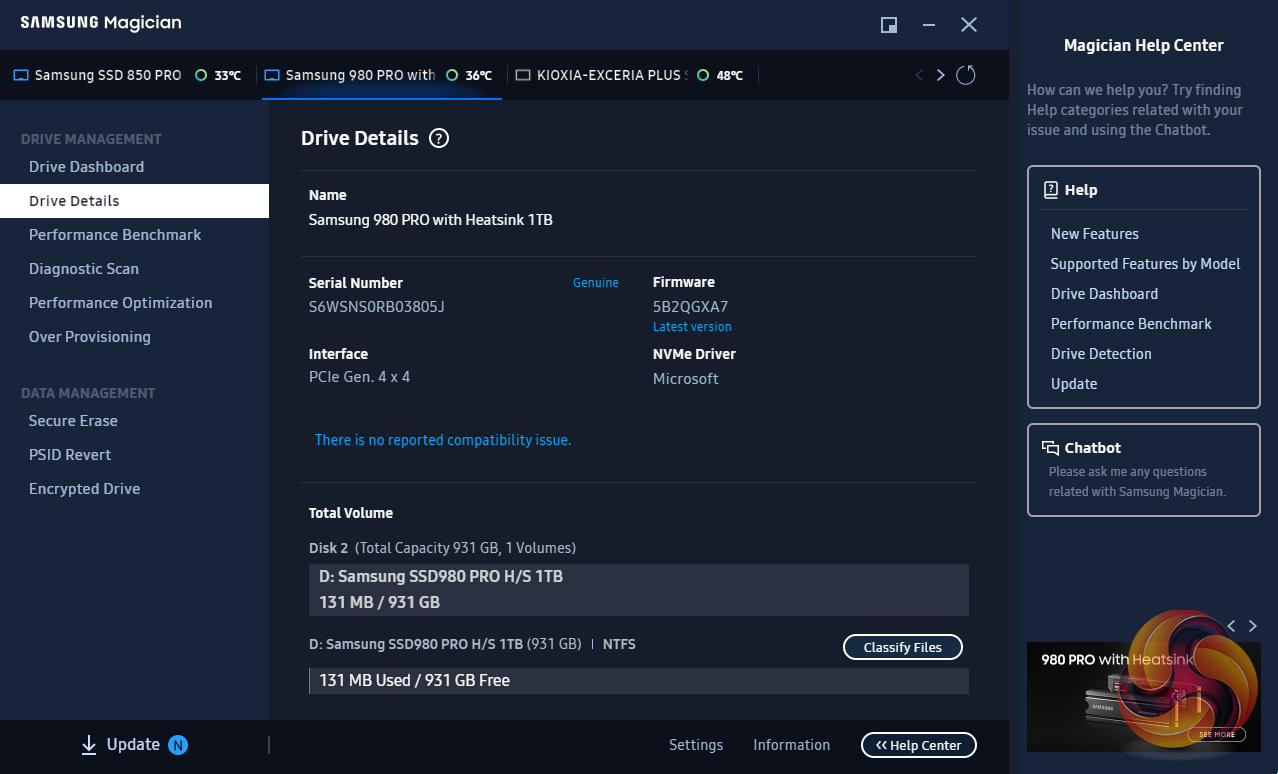
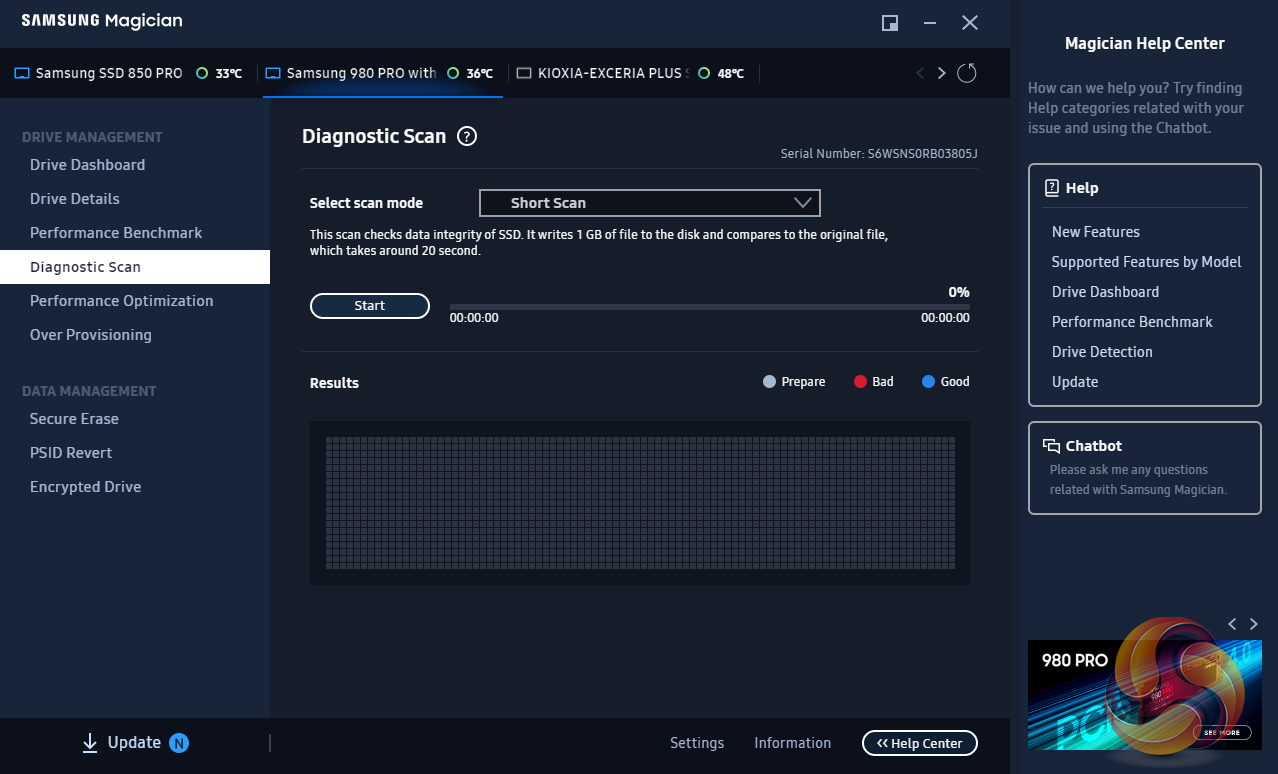
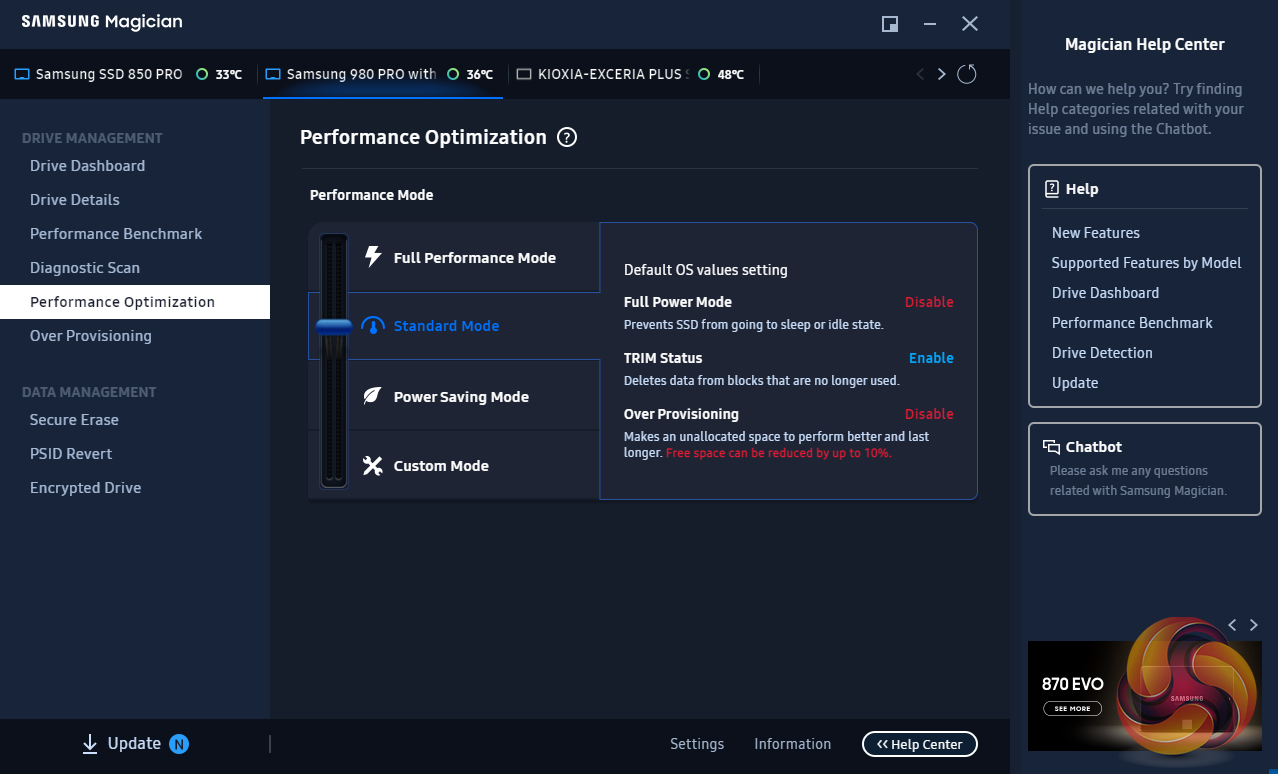
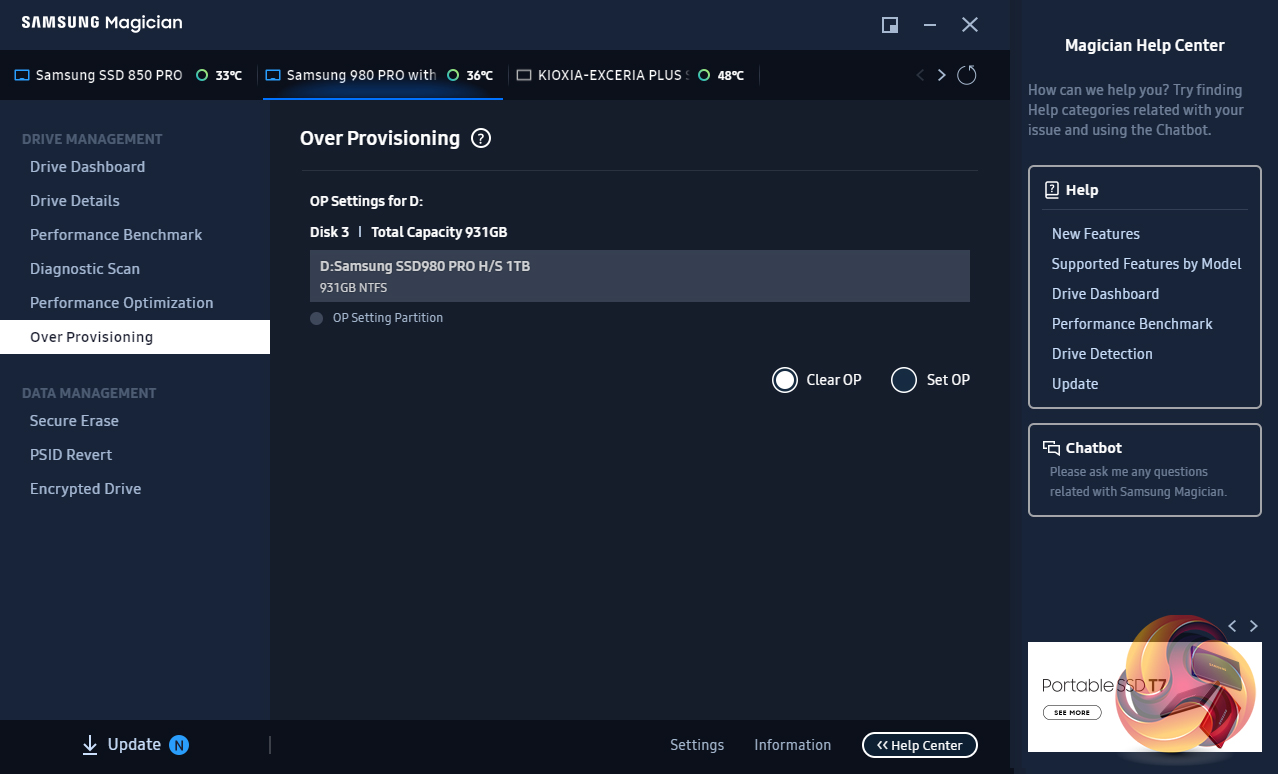
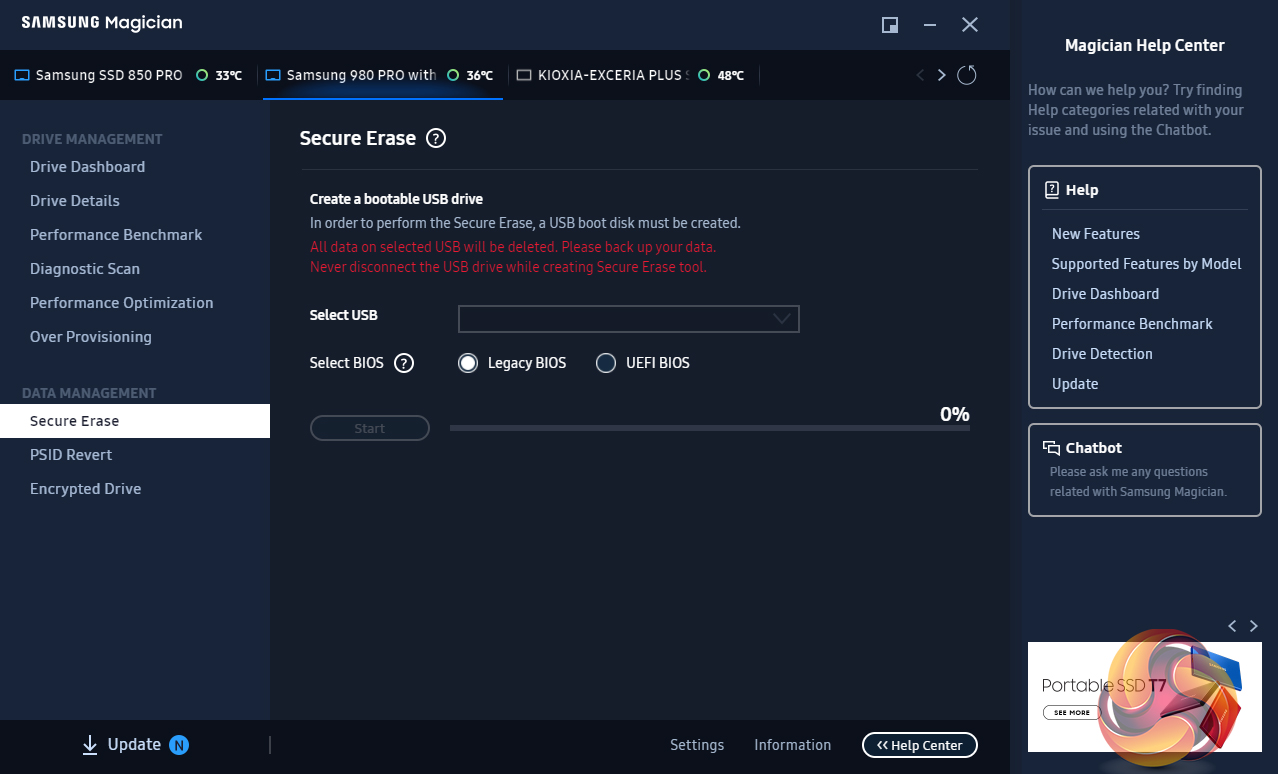
Samsung’s SSD management utility goes by the name of Magician and can be downloaded from Samsung’s website. We used version v7.0.1 with the SSD 980 Pro Heatsink. The software is constantly updated and graphically refreshed and it has come a long way in usability since its first versions.
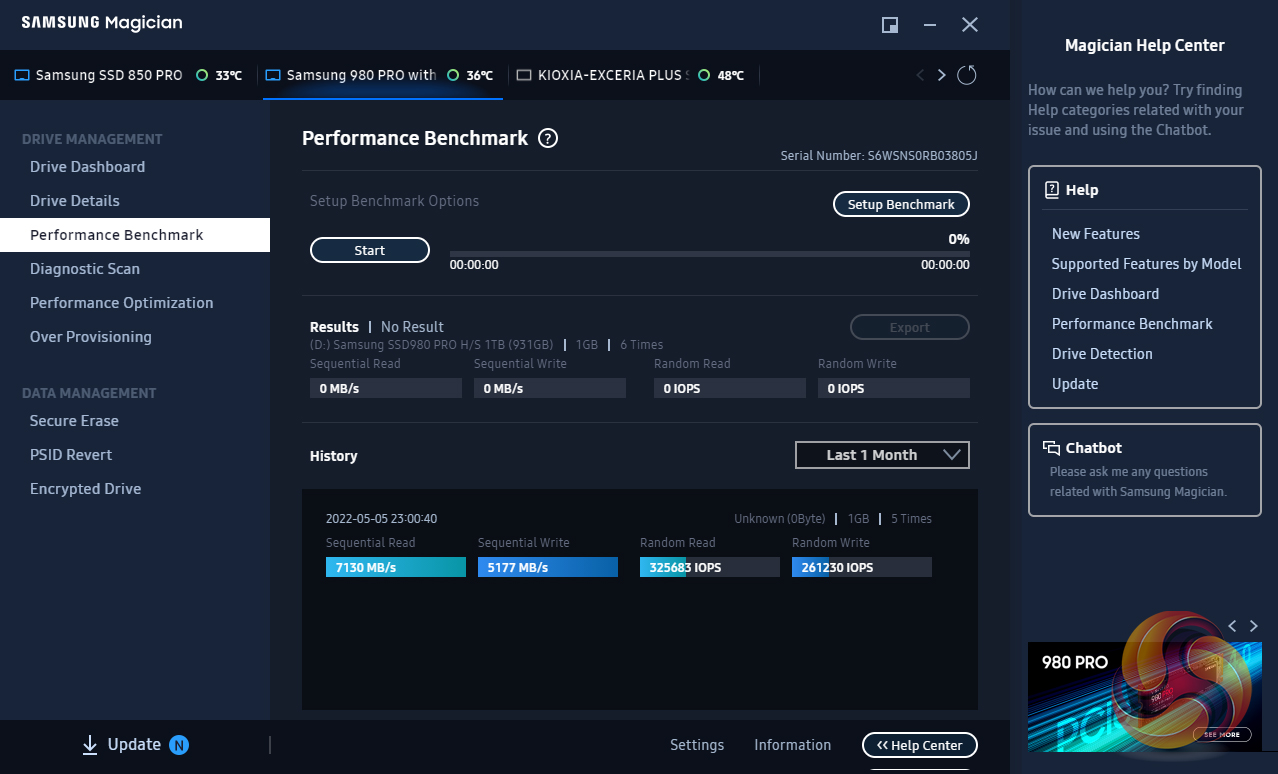
Magician allows you to do most maintenance jobs you may need to do with an SSD; updating firmware, optimise performance, adjust the Over Provisioning, enabling data security (the drive supports AES 256-bit full-disk encryption, TCG/Opal V2.0, and Encrypted Drive -IEEE1667 (MS eDrive ) ) and securely erase the drive. Magician also features a built-in benchmark tool.
The one thing still missing from Magician is any form of integrated data migration tool, but you can download a separate migration tool from Samsung’s website, but it would be nice if Samsung would see fit to build it into Magician one day.
For testing, the drives are all wiped and reset to factory settings by HDDerase V4. We try to use free or easily available Programs and some real-world testing so you can compare our findings against your own system. This is a good way to measure potential upgrade benefits.
Main system:
AMD Ryzen 5 3600X, 16GB DDR4-2400, Sapphire R9 390 Nitro and an MSI MPG X570 Gaming Edge Wifi motherboard.
Other drives
Corsair MP600 Pro 2TB
Corsair Force MP600 1TB
Corsair MP600 Pro XT 2TB
Crucial P5 Plus 1TB
Gigabyte AORUS 7000e 2TB
HP FX900 Pro 2TB
Kingston KC3000 2TB
MSI Spatium M480 2TB
Patriot Viper VP4300 2TB
Patriot Viper VPN4100 1TB
PNY XLR8 CS3040 1TB
PNY XLR8 CS3140 1TB
Sabrent Rocket 4 Plus 1TB
Sabrent Rocket 4 Plus 2TB
Sabrent Rocket 4 Plus 4TB
Samsung 980 Pro 1TB
Seagate FireCuda 520 1TB
Seagate FireCuda 530 2TB
Teamgroup T-Force Cardea Zero Z440 1TB
Teamgroup T-Force Cardea A440 Pro Special Series 1TB
WD Black SN770 1TB
WD Black SN850 1TB
Software:
Atto Disk Benchmark 4.
CrystalMark 8.0.0.
AS SSD 2.0.
IOMeter.
Futuremark PC Mark 10.
Futuremark 3DMark Storage Benchmark.
All our results were achieved by running each test five times with every configuration this ensures that any glitches are removed from the results. Trim is confirmed as running by typing fsutil behavior query disabledeletenotify into the command line. A response of disabledeletenotify =0 confirms TRIM is active.
CrystalDiskMark is a useful benchmark to measure theoretical performance levels of hard drives and SSDs. We are using v8.0.
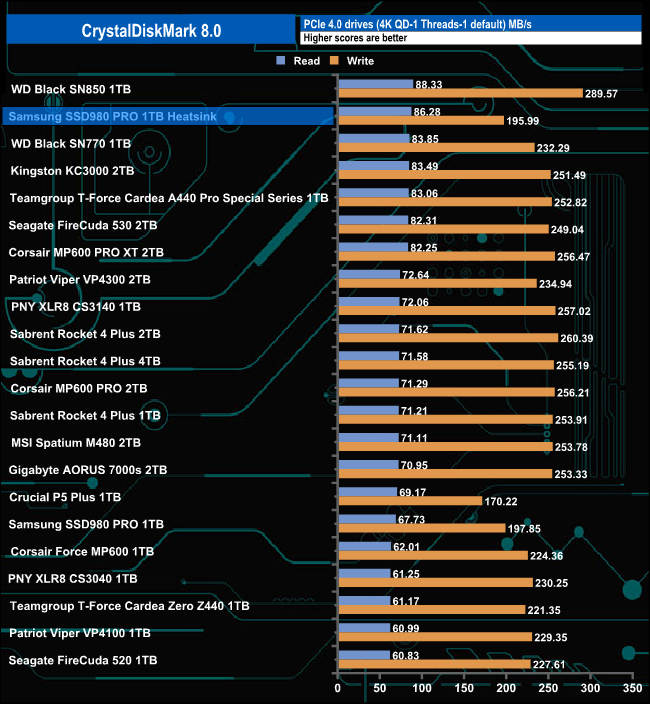
The later firmware revision in the Heatsink version of the SSD980 Pro seems to have given the drive a healthy kick in read performance over the standard drive while the write performance stays essentially the same.
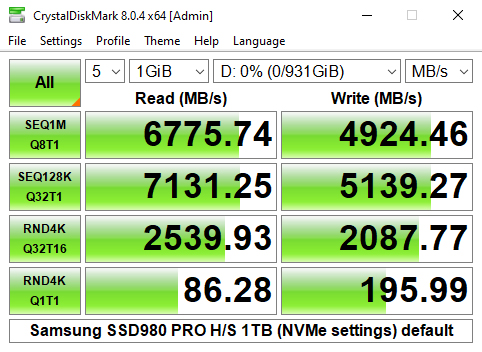
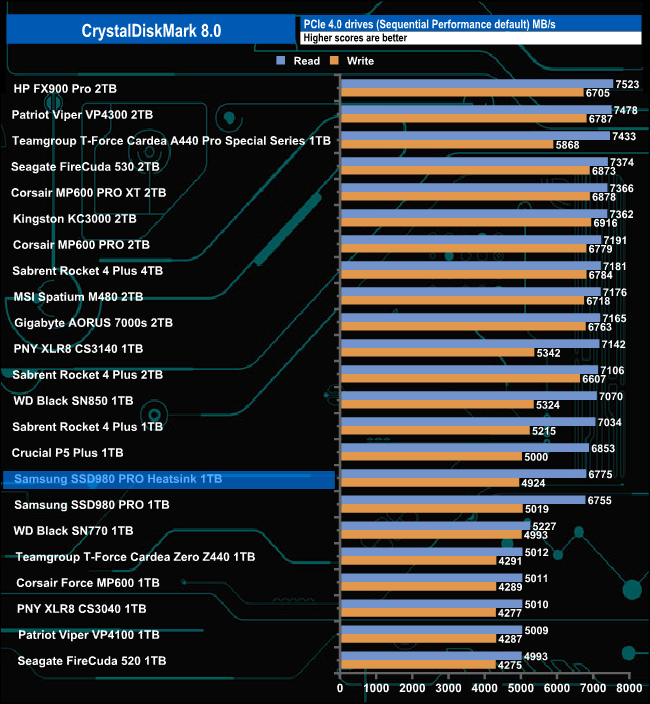
Unlike the CrystalDiskMark 4K QD1 result, the Sequential read result of 6,775MB/s of the Heatsink version of the drive is a little faster while the write result is fractionally slower.
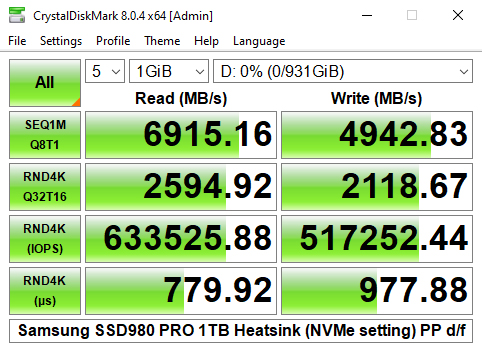
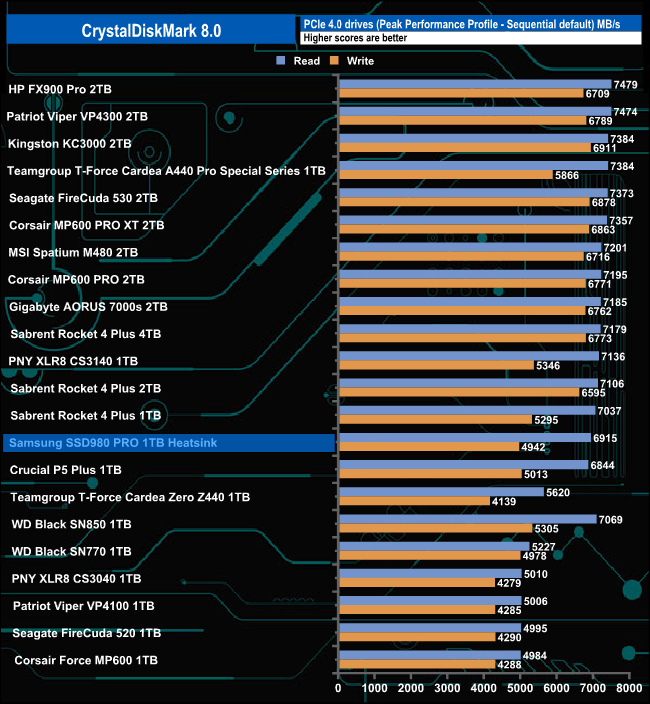
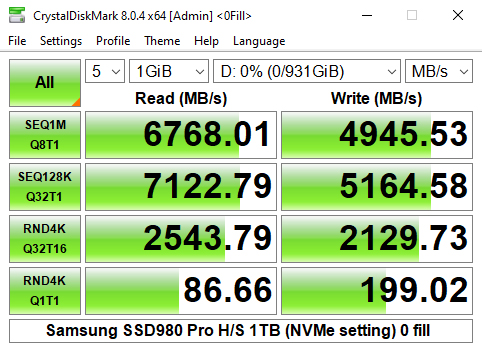
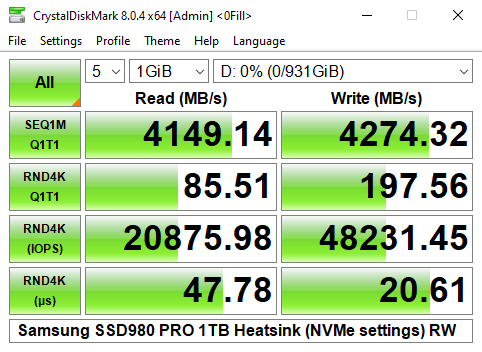
Samsung rate the Sequential performance of the drive as up to 7,000MB/s for reads and up to 5,000MB/s for writes. Using the Peak Performance Profile of CrystalDiskMark 8 we couldn't quite hit those maximums with a read result of 6,915MB/s with writes at 4,942MB/s.
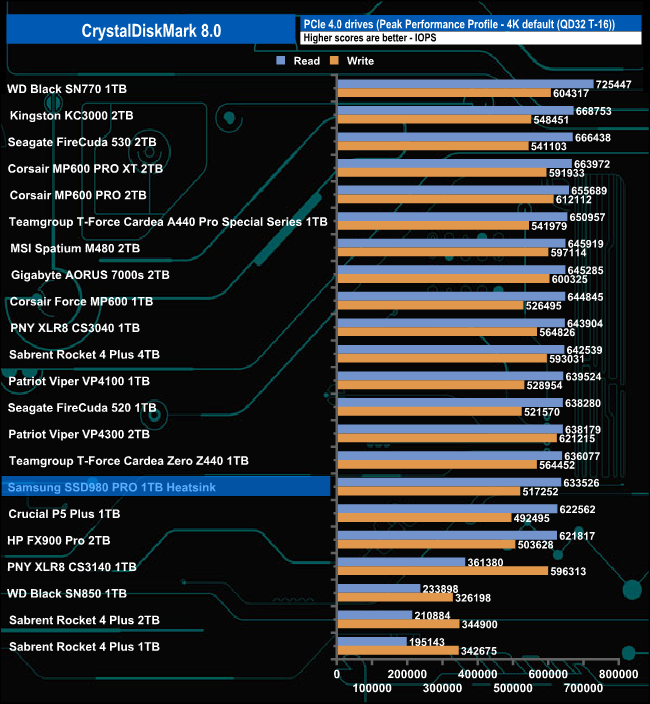
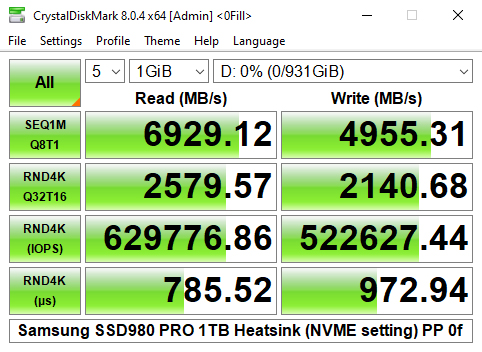
The 4K performance is quoted as up to 1,000,000 IOPS for both reads and writes. We couldn't get close to those figures, the best read result we saw was 633,525 IOPS using the default Peak Performance Profile, while the best write figure was 522,627 IOPS from the 0 fill option.
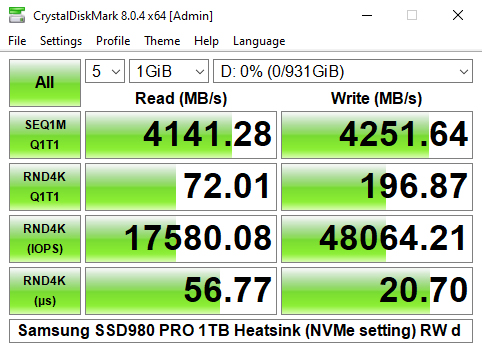
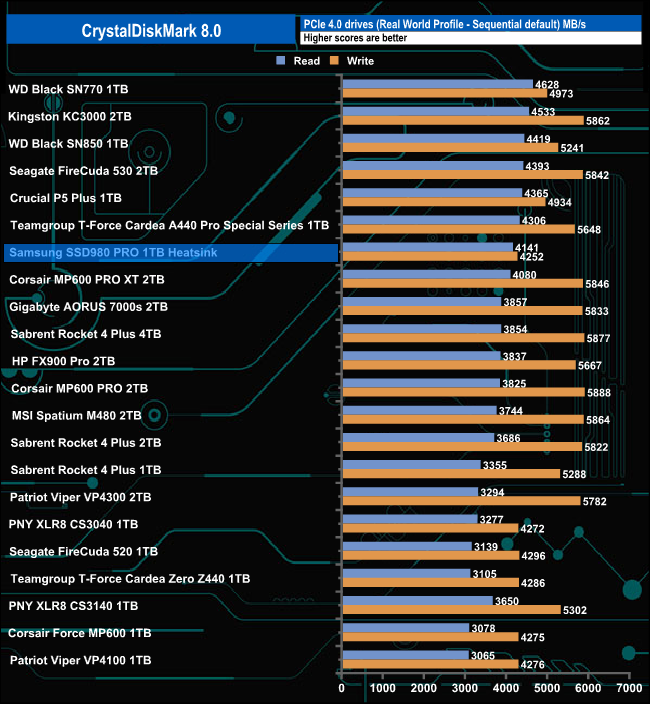
Using the Real World Profile sees the drive sitting in the top half of the table with a Sequential read result of 4,141MB/s, with writes slightly faster at 4,252MB/s.
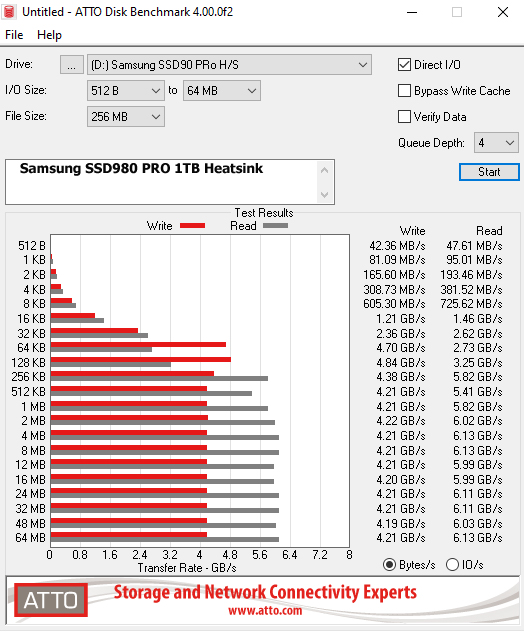
The ATTO Disk Benchmark performance measurement tool is compatible with Microsoft Windows. Measure your storage systems' performance with various transfer sizes and test lengths for reads and writes. Several options are available to customize your performance measurement including queue depth, overlapped I/O and even a comparison mode with the option to run continuously. Use ATTO Disk Benchmark to test any manufacturer's RAID controllers, storage controllers, host adapters, hard drives and SSD drives and notice that ATTO Products will consistently Provide the highest level of performance to your storage.
We are using version 4.0 for our NVMe disk tests.
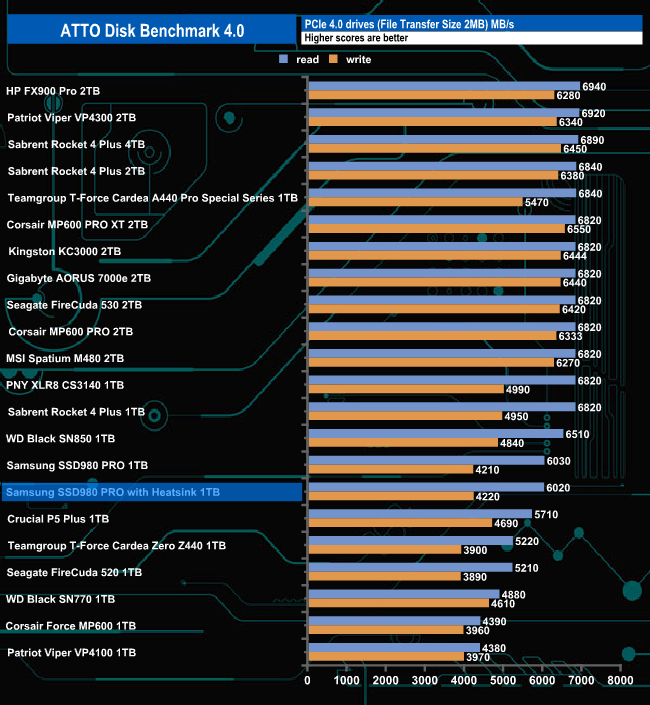
Using the ATTO benchmark we couldn't quite hit the top Sequential figures of 7,000MB/s and 5,000MB/s read and write respectively with test results of 6,020MB/s for reads and 4,220MB/s for writes, pretty much the same figures as the standard 980 Pro.
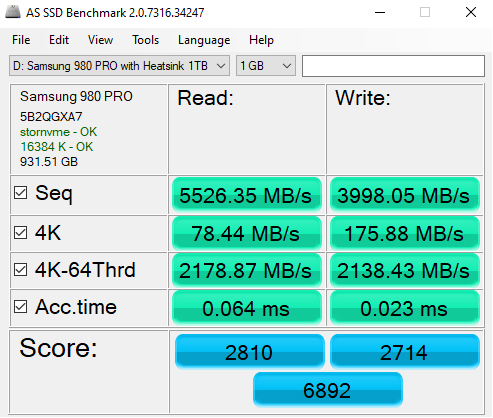
AS SSD is a great free tool designed just for benching Solid State Drives. It performs an array of sequential read and write tests, as well as random read and write tests with sequential access times over a portion of the drive. AS SSD includes a sub suite of benchmarks with various file pattern algorithms but this is difficult in trying to judge accurate performance figures.
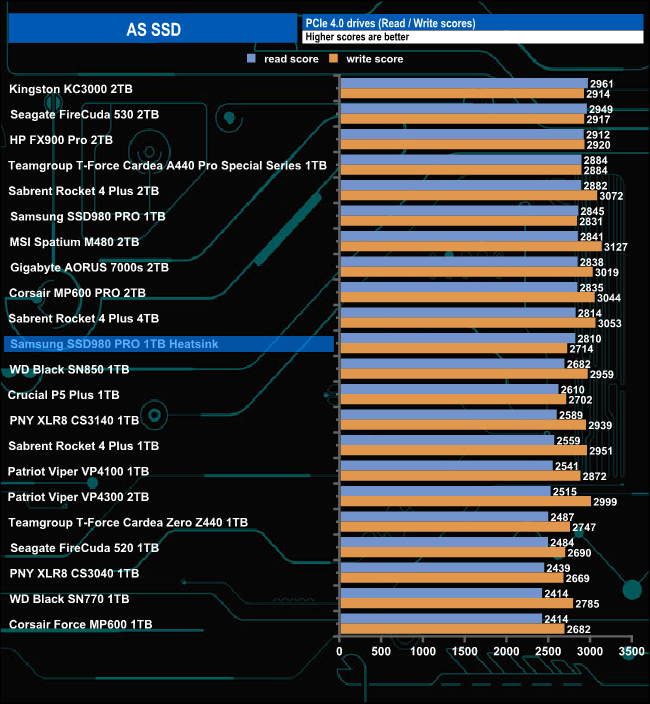
The read and write scores of 2810 and 2714 from the 980 Pro Heatsink version are lower than the scores from the standard 980 Pro. The Heatsink-equipped drive has different firmware installed than the standard model which may account for the lower scores of the later drive.
We used CrystalDiskMark 8‘s custom settings to test the Sequential read and write performance of the drive through a range of queue depths. The setup for the tests is listed below.
128KB Sequential Read / Write.
Transfer Request Size: 128KB, Thread(s): 1, Outstanding I/O: 1-32.
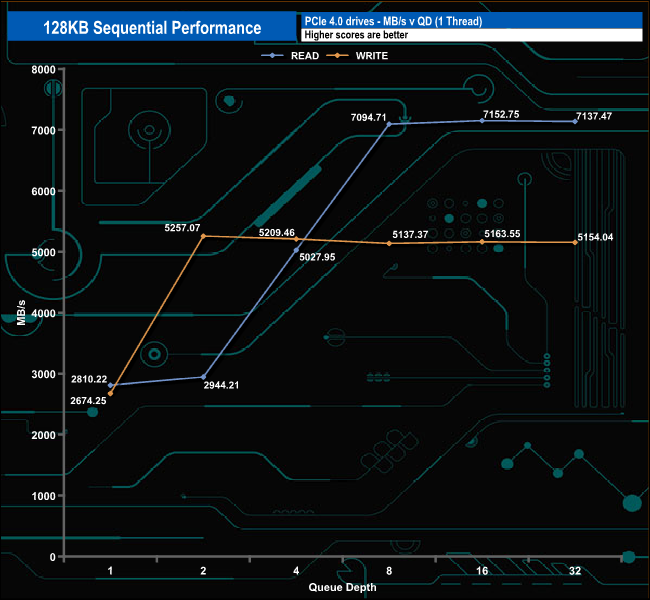
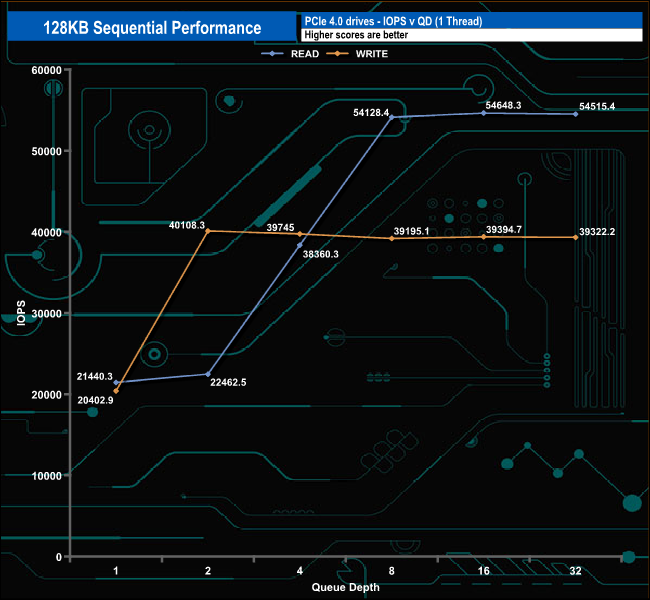
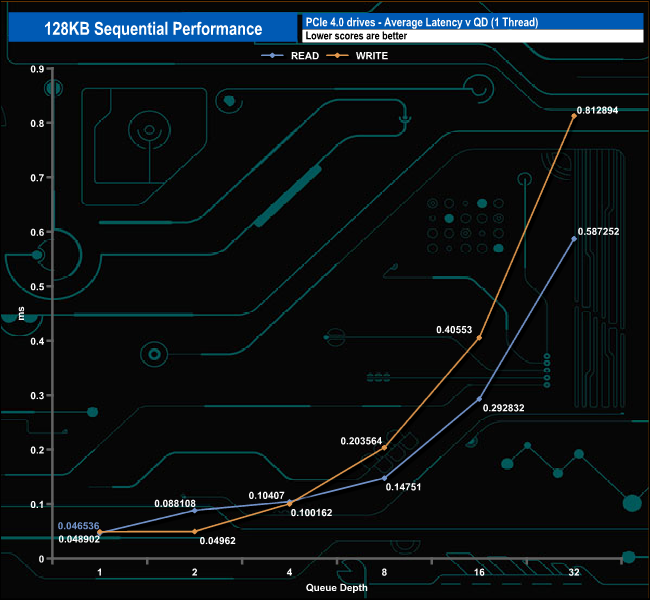
With these Sequential tests, we could confirm the official up to 7,000MB/s read and 5,000MB/s write figures. with the drive producing a peak read figure of 7,152.75MB/s (QD16) with writes peaking at 5,257.07MB/s (QD2).
128KB Sequential Read v QD performance comparison
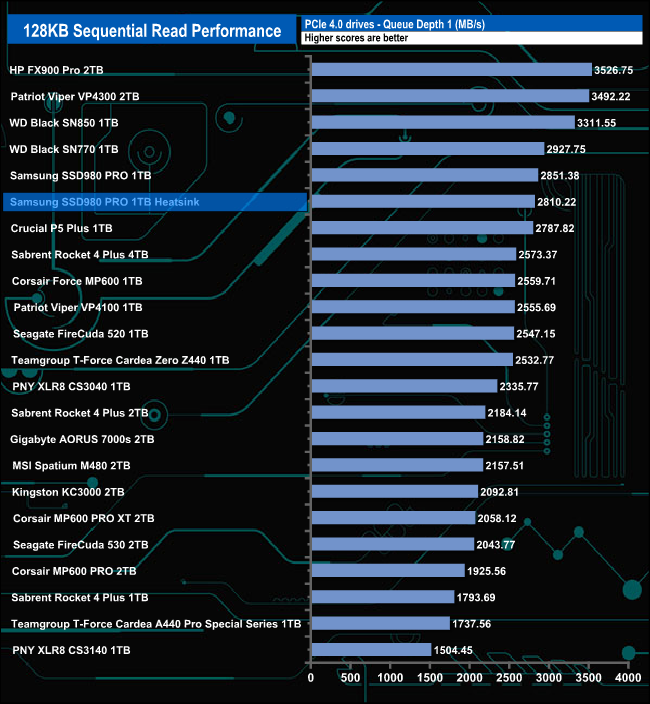
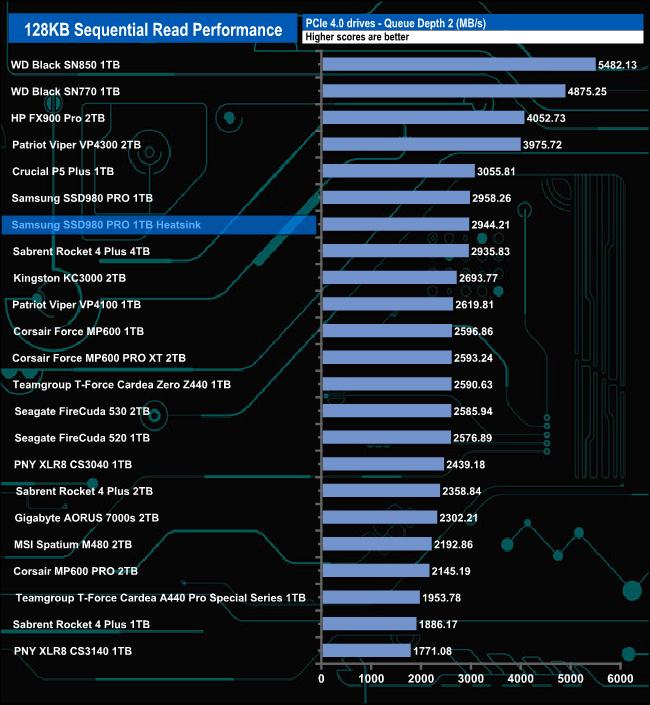
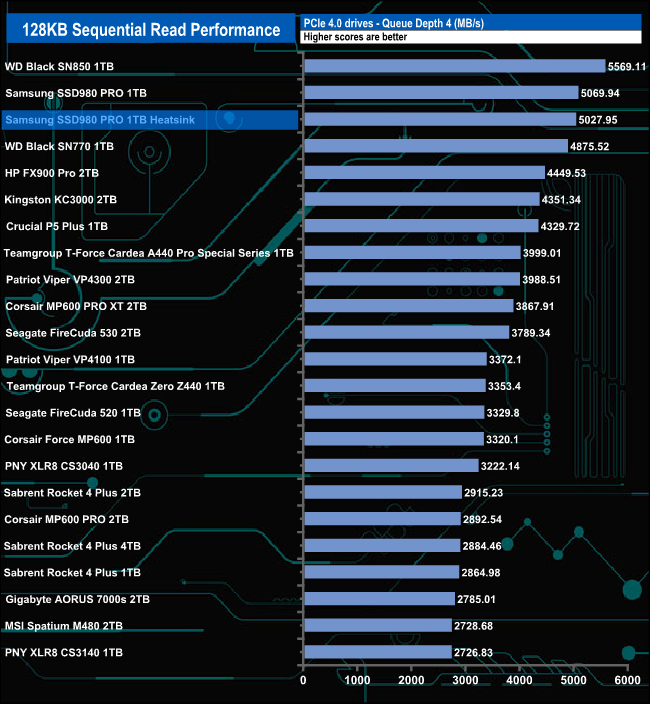
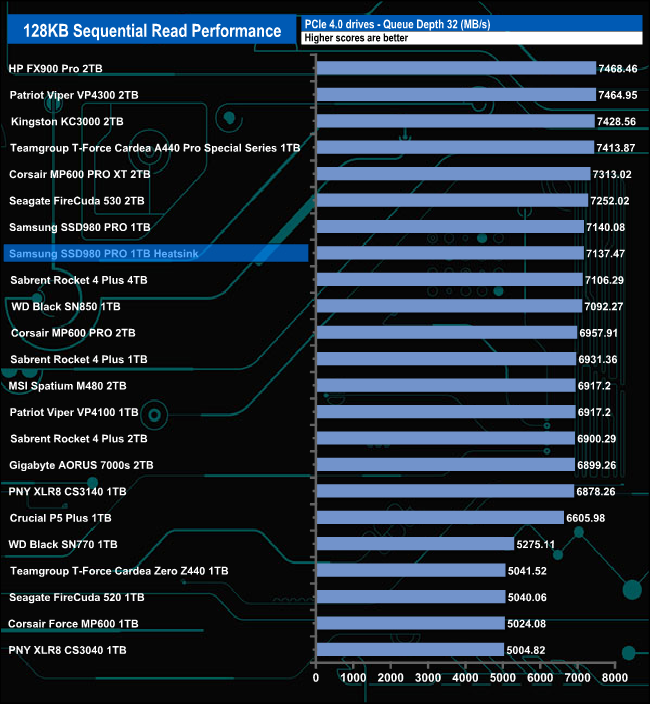
The 980 Pro Heatsink version shadows the standard 980 Pro throughout our Sequential read QD testing.
128KB Sequential Write v QD performance comparison.
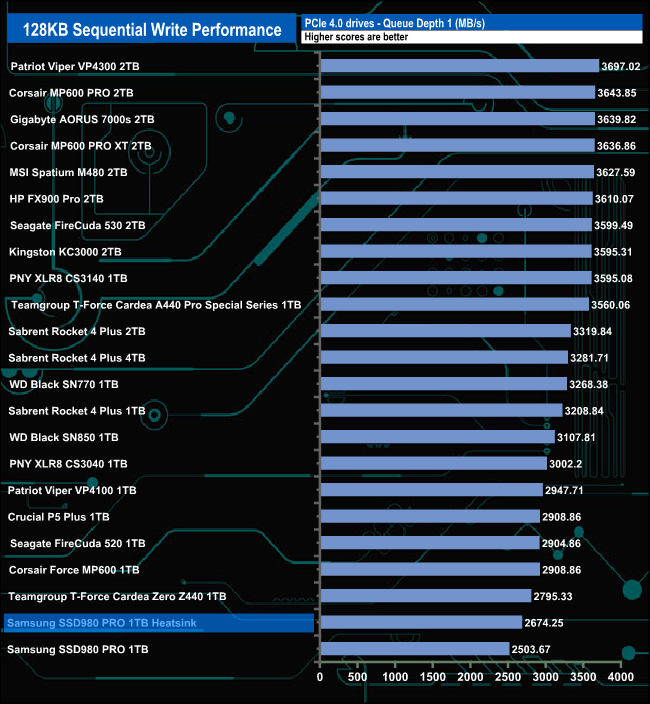
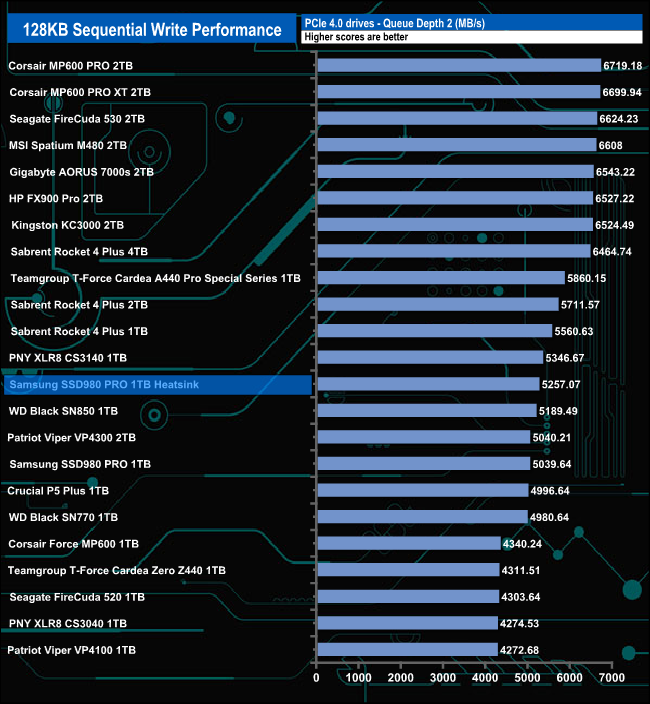
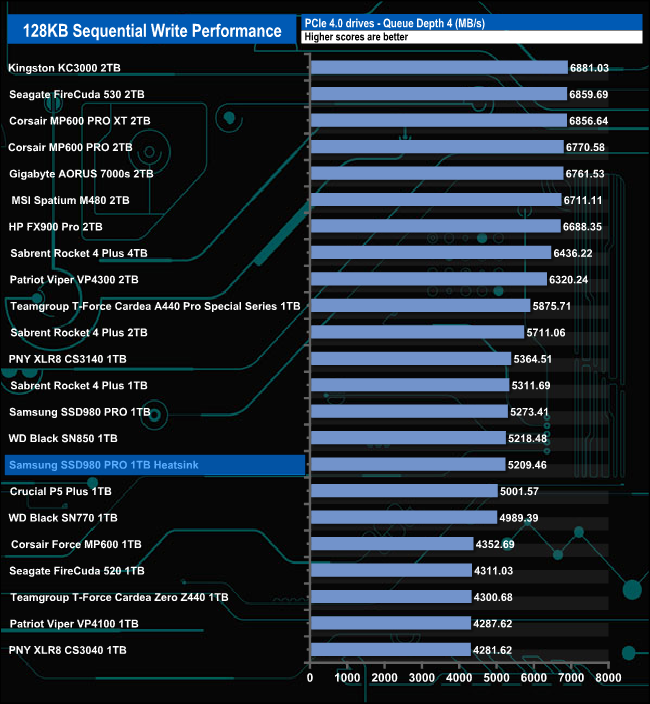
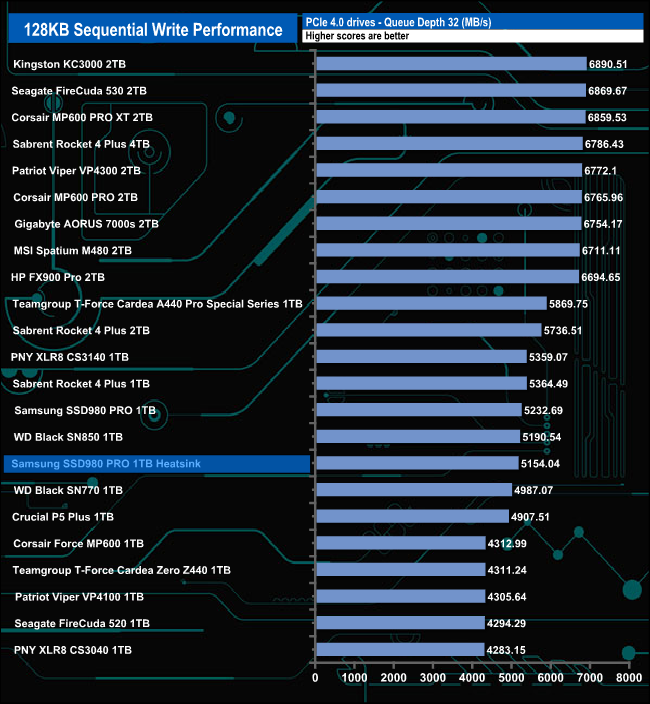
In our Sequential write tests, the Heatsink version of the drive leads the standard drive in QDs 1 and 2, but as the queue depth deepens the drives swap around with the standard 980 leading the way.
We used CrystalDiskMark 8‘s custom settings to test the drive's 4K random read performance through a range of queue depths. The setup for the tests is listed below.
Transfer Request Size: 4KB, Outstanding I/O: 1-32.
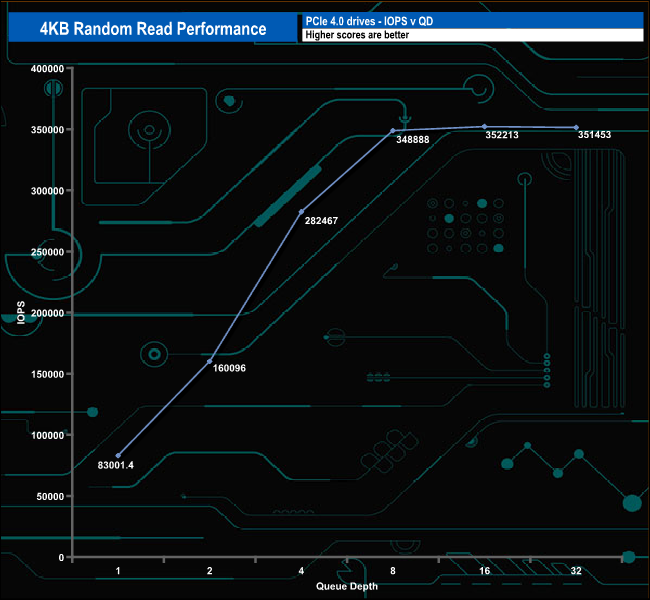

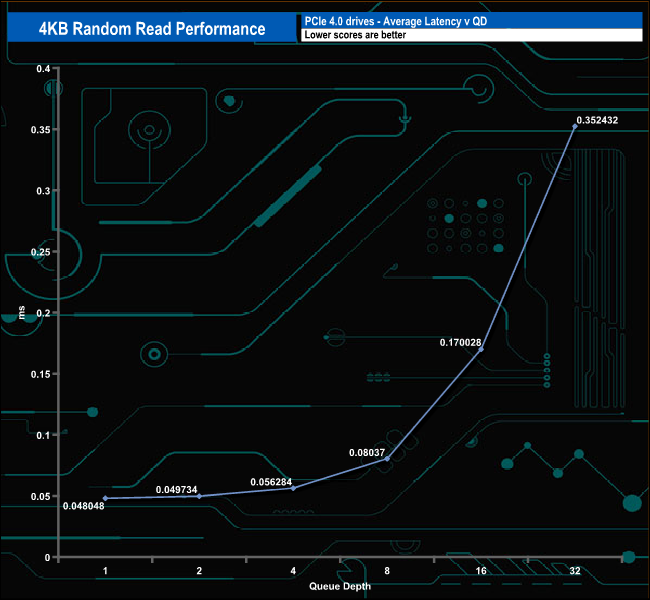
Samsung quotes a random 4K read figure of up to 1m IOPS for the 1TB 980 Pro Heatsink, the same as the standard drive. Needless to say with our 4-threaded tests we couldn't get anywhere close to that figure with a peak figure of 352,213 IOPS (1,442.66MB/s) at QD16.
4K Random Read v QD Performance compared.
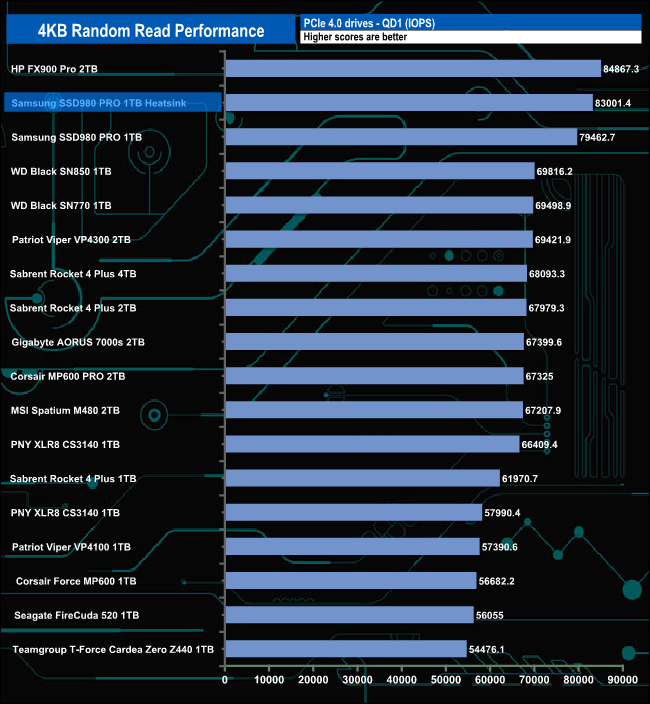
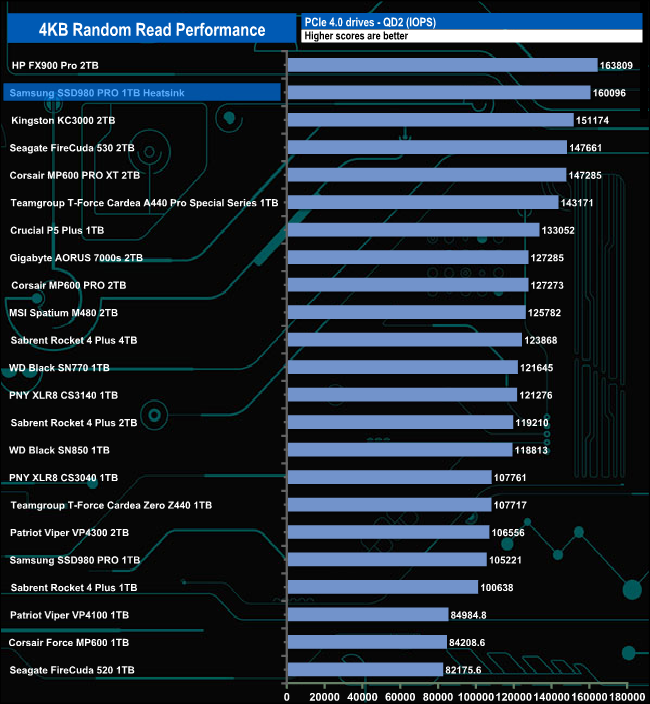
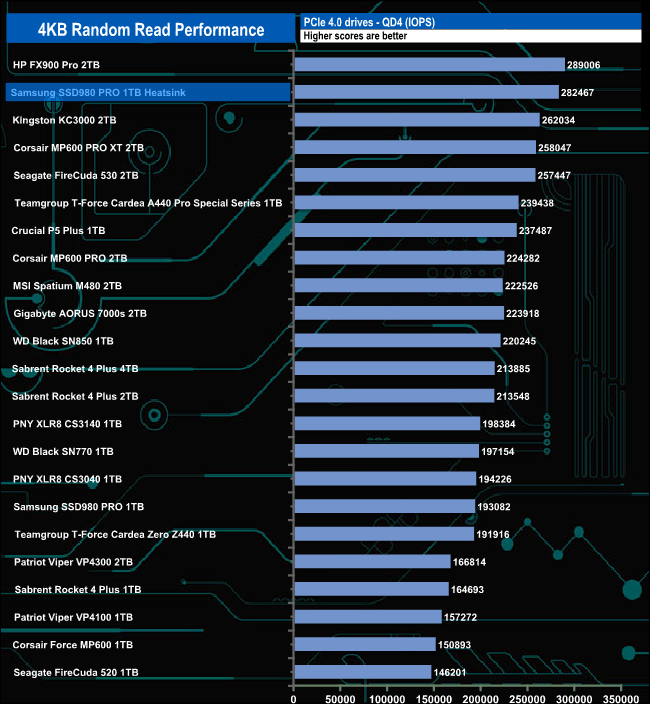
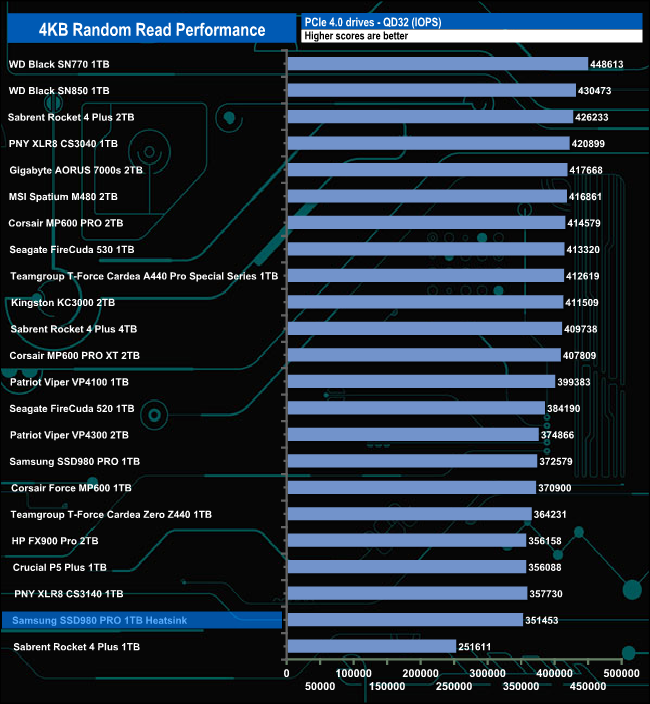
At QDs 1 to 4, the Heatsink version of the drive shows much better performance than the standard drive due in no small part to the later firmware that the newer drive uses. However, at QD32 the situation changes around with the original drive giving better performance.
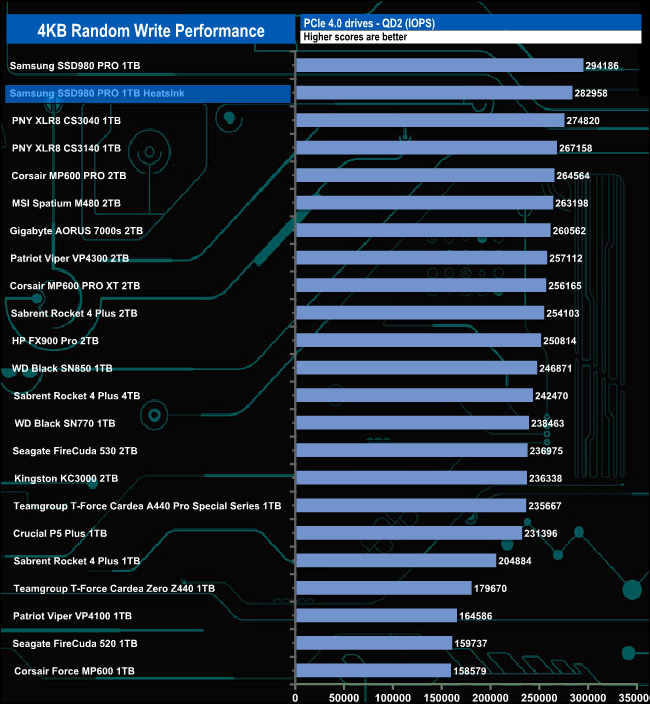
We used CrystalDiskMark 8‘s custom settings to test the 4K random write performance of the drive through a range of queue depths. The setup for the tests is listed below.
Transfer Request Size: 4KB, Outstanding I/O: 1-32.
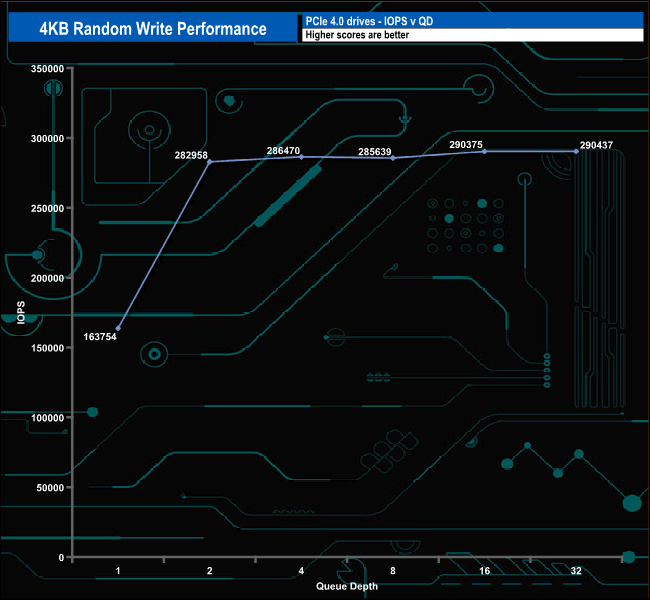
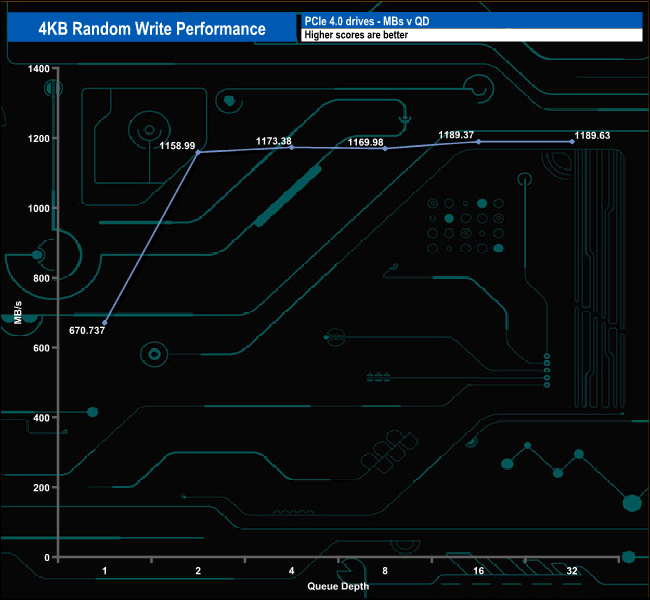
As with the random read performance, the best write performance figure we saw was 290,437 IOPS was nowhere near the official maximum of 1,000,000 IOPS.
4K Random Write v QD Performance compared.
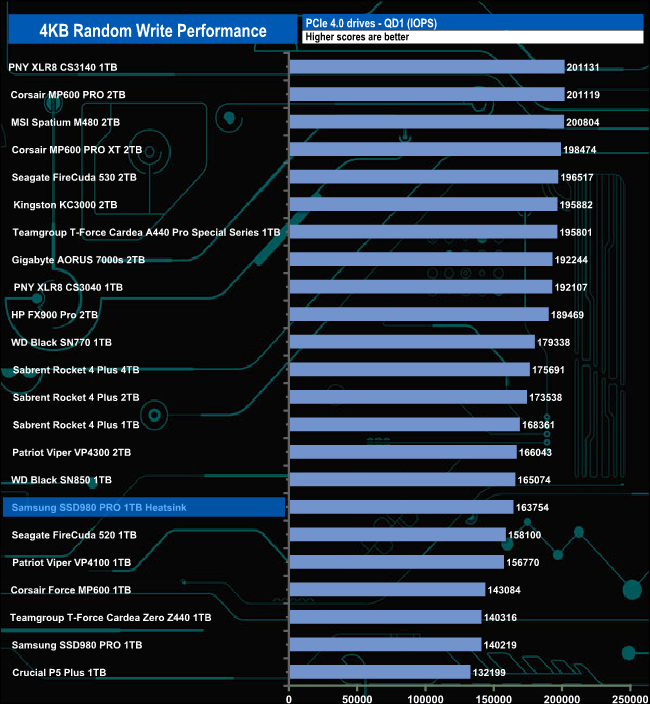
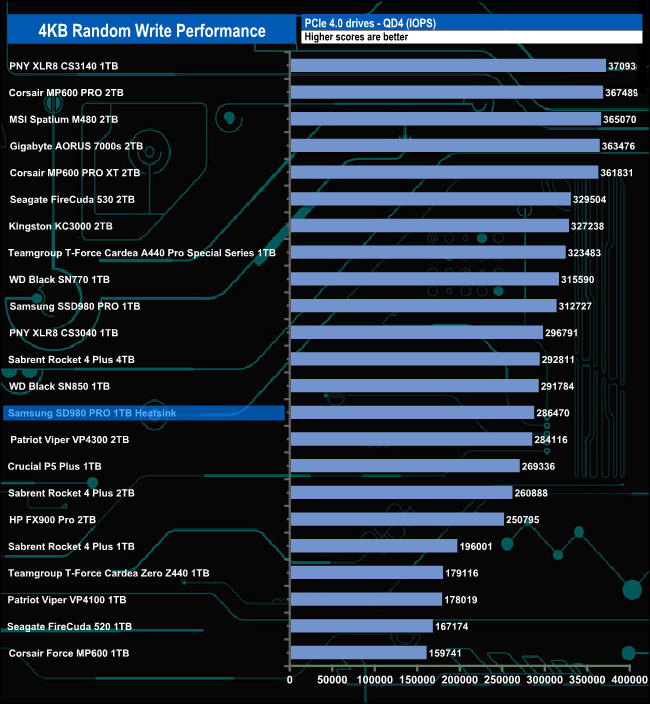
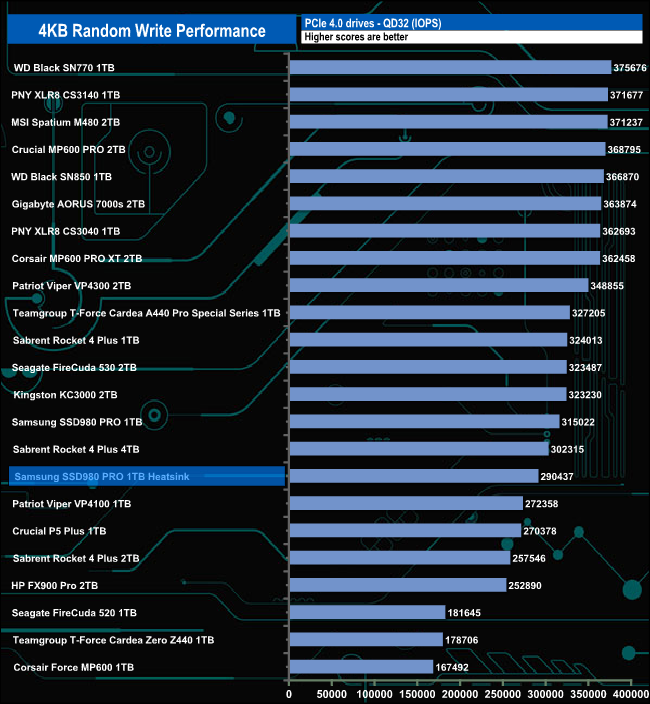
At QD1 the Heatsink version of the drive performs better than the original drive, but as the queue depth deepens this trend reverses.
We used CrystalDiskMark 8’s custom settings to test the drive's 4K 70/30 mixed read/write performance through a range of queue depths using a single thread and four threads.
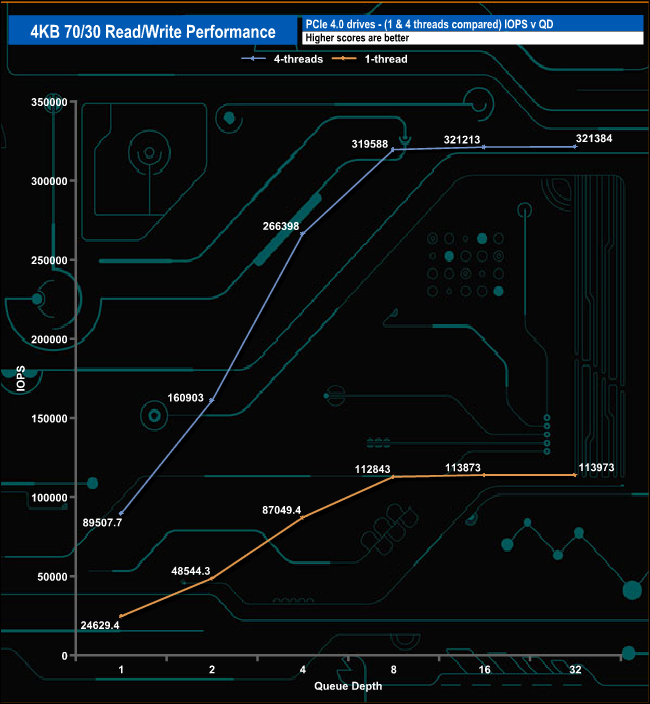
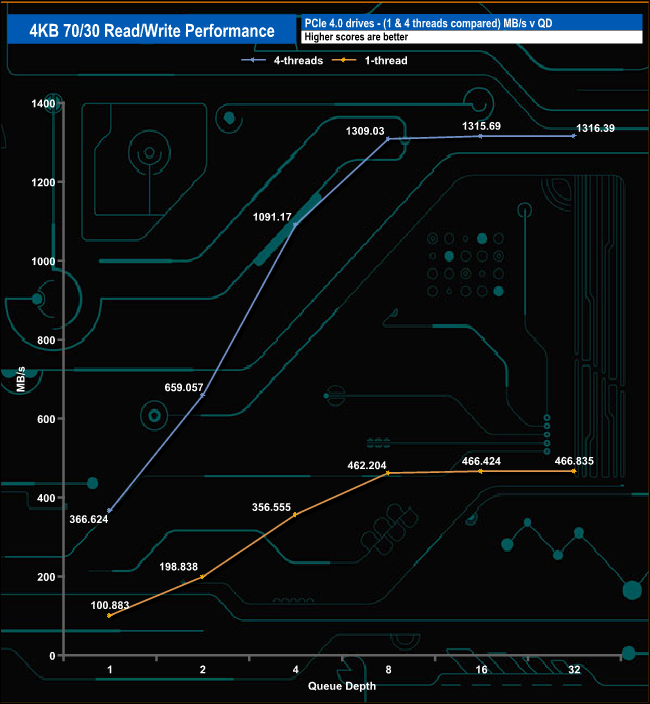
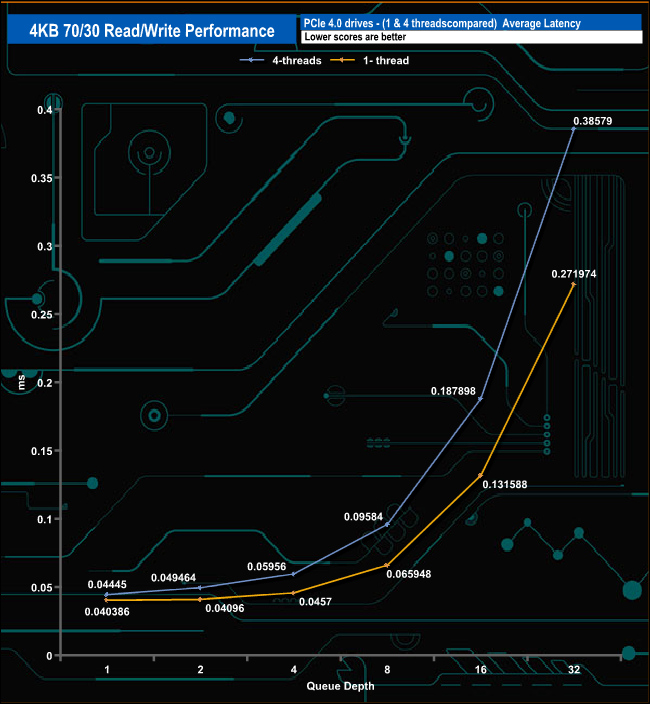
The Samsung 980 Pro Heatsink has no Problem dealing with our 70/30 read/write tests either with a single thread or four threads. With a single thread, the drive climbs from 24,629.4 IOPS (100.88MB/s) at QD1 up to 113,973 IOPS (466.83MB/s) at QD32.
With four threads the drive goes from 89,507 IOPS (366.62MB/s) at QD1 up to 321,384 IOPS (1,316.39MB/s) at QD32 but the rate of increase slows from QD8 onwards.
We used CrystalDiskMark 8 to test the random performance of the drive at lower queue depths (QD1 – QD8 where most of the everyday workloads occur) using 1 to 4 threads.
Random Reads.
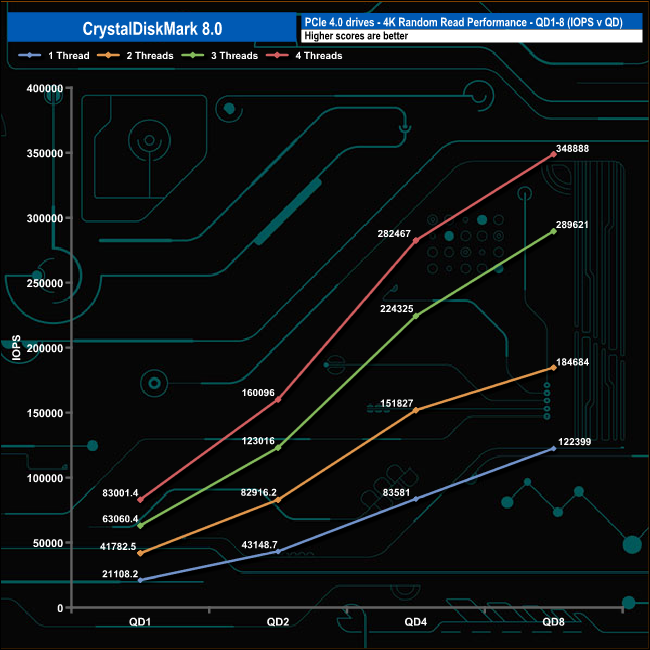
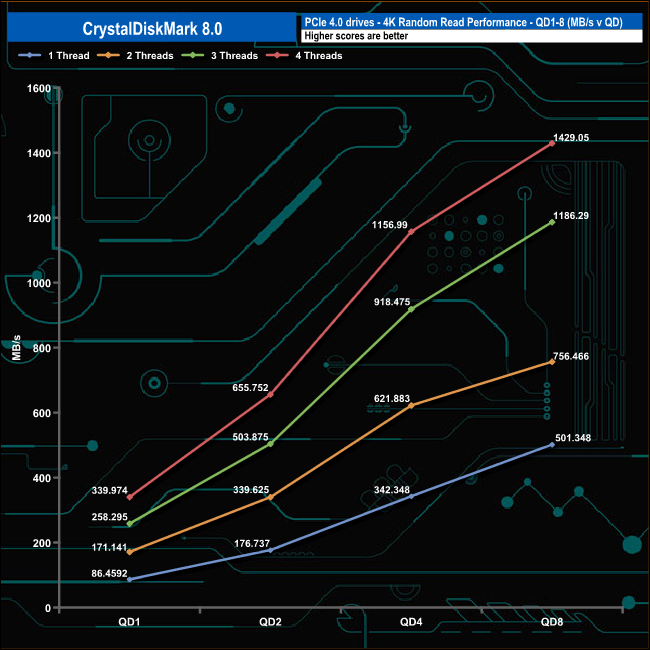
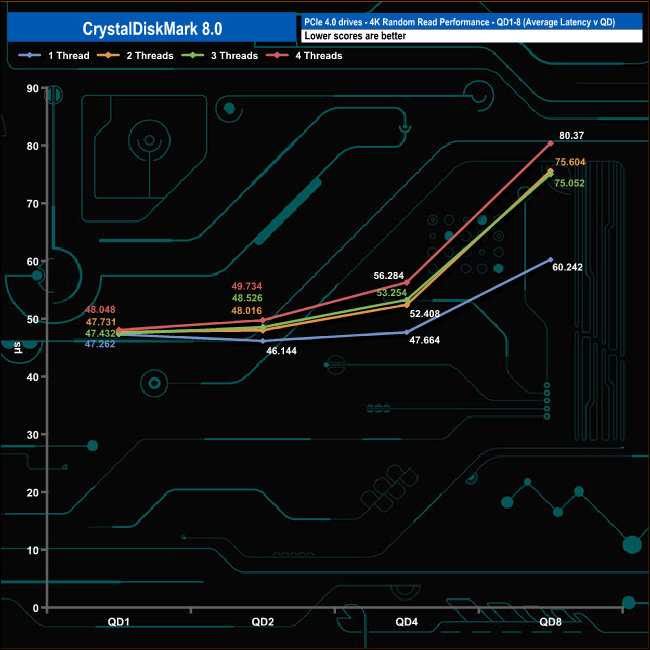
In our lower queue depth, 4K random read tests, the performance increases steadily as the queue depth deepens for each thread. At QD1 the performance ranged from a low point of 21,108 IOPS for a single thread up to 83,001 IOPS for four threads.
At QD8 a single thread Produced 122,399 IOPS (501MB/s), two threads 184,684 IOPS (756MB/s), three threads 289,621 IOPs (1,186MB/s) and finally with four threads, 348,888 IOPS (1,429MB/s).
Random Writes
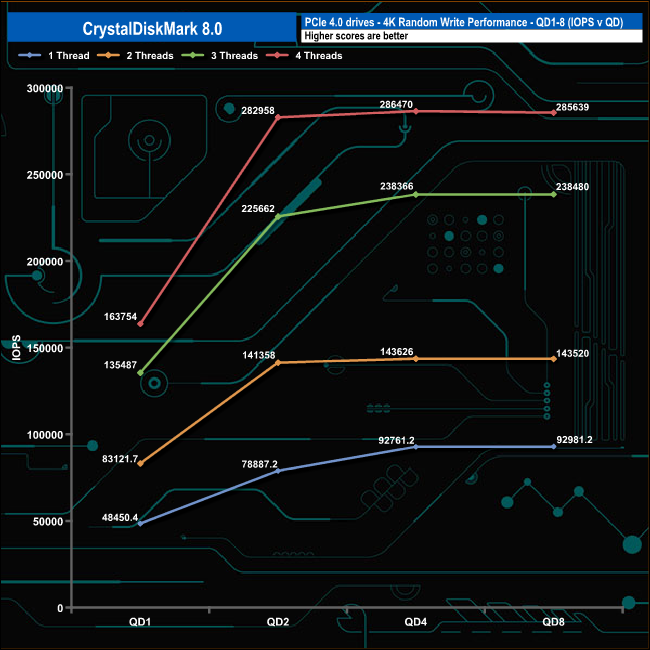
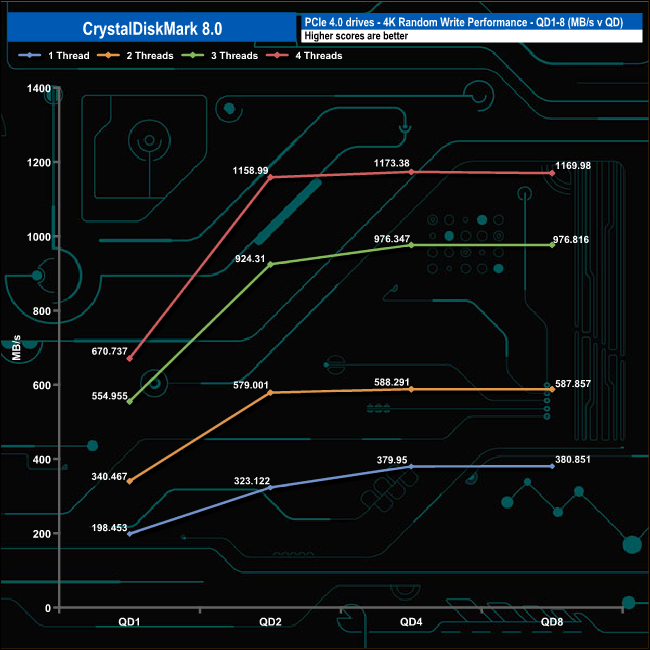
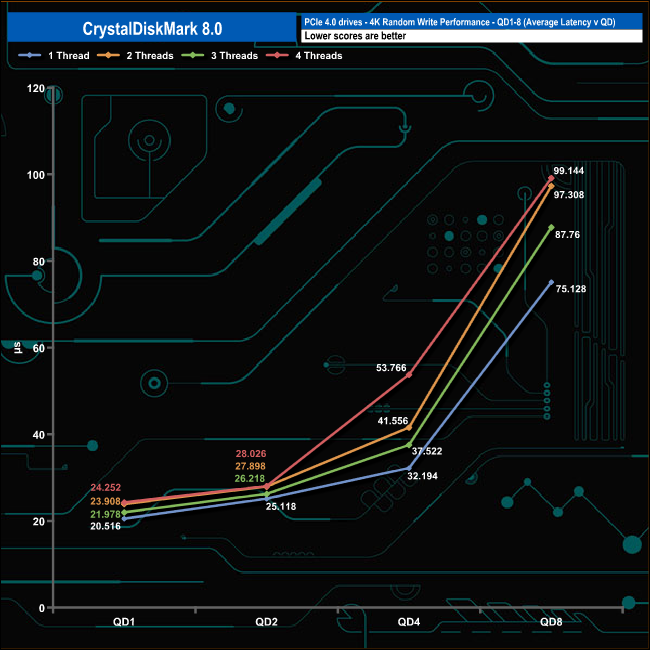
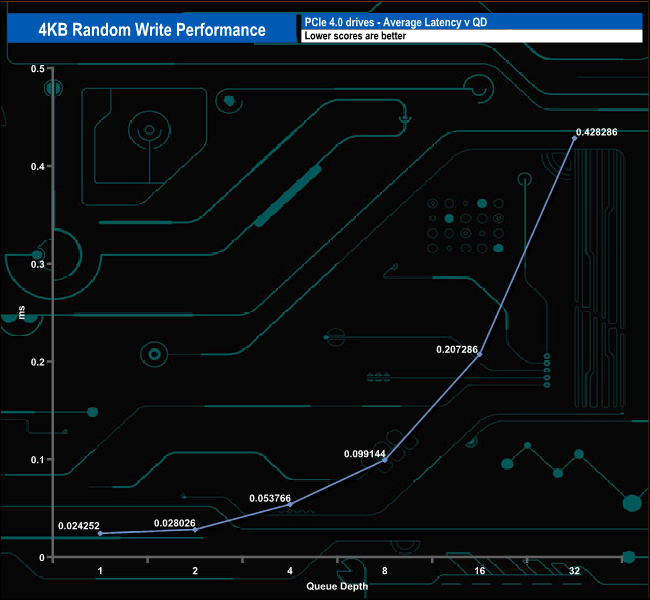
The write performance climbs smoothly from QD1 to QD2 before levelling off for the rest of the tested queue depths.
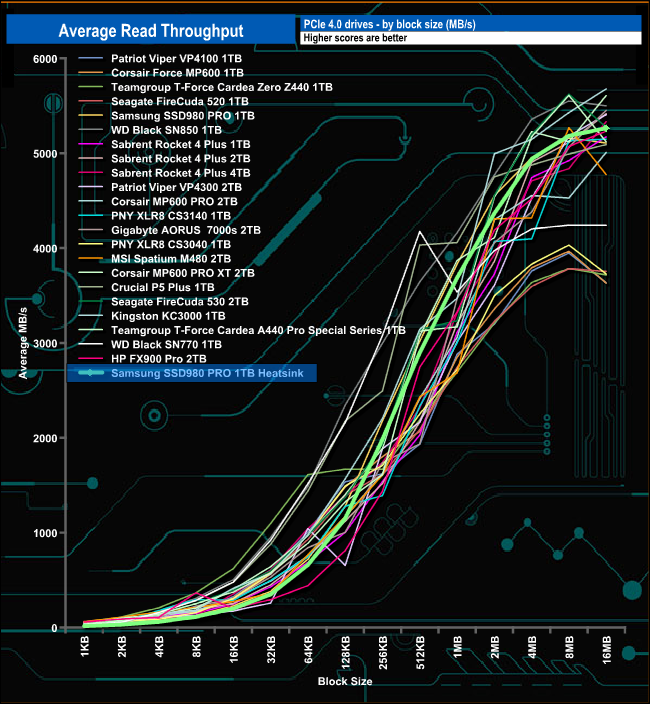
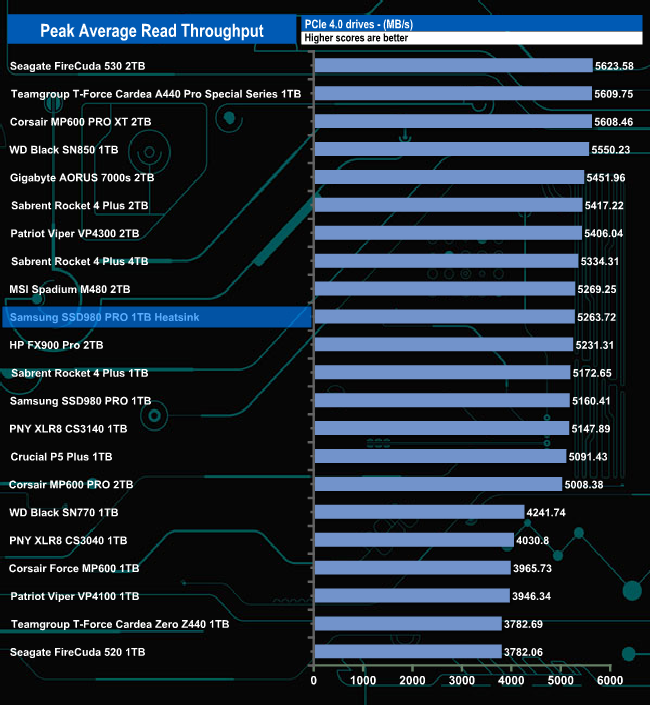
In our read throughput test, the drive peaked at 5,263.72MB/s at the 16MB block mark which is some way short of the official maximum of 7,000MB/s.
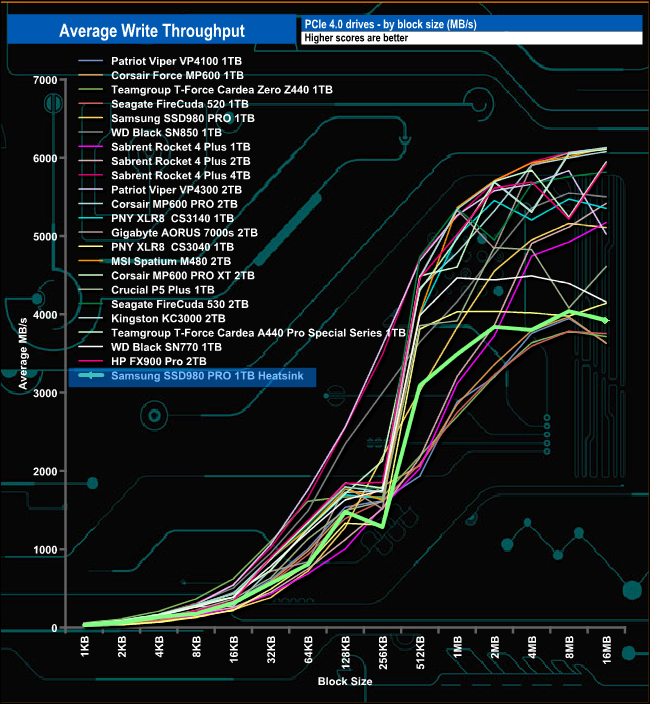
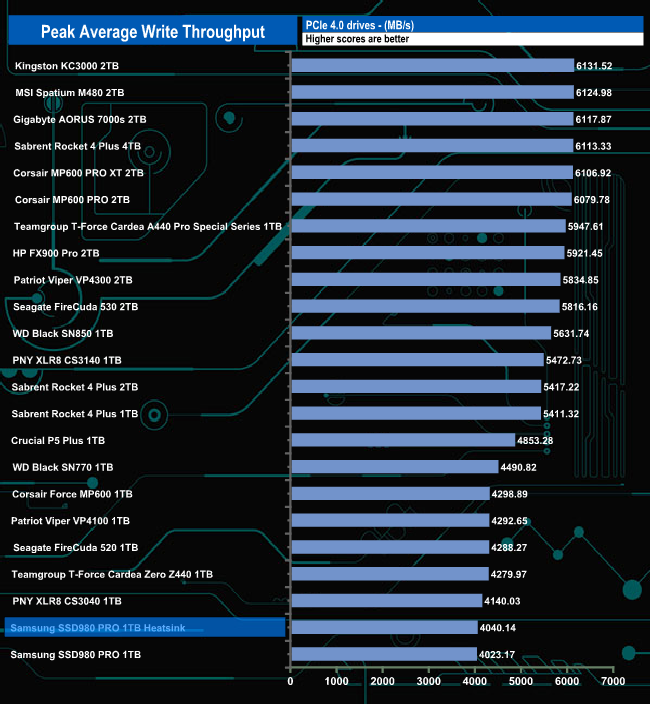
Peak write throughput came at the 8MB block mark at 4,040MB/s, again slower than the official maximum figure of 5,000MB/s. The performance of the drive seems to plateau out between the 128KB and 256KB block marks but it recovers very well.
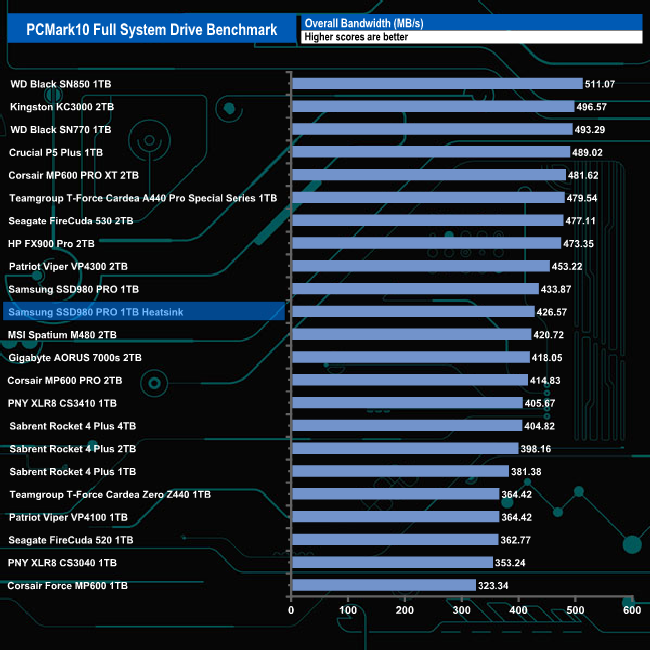
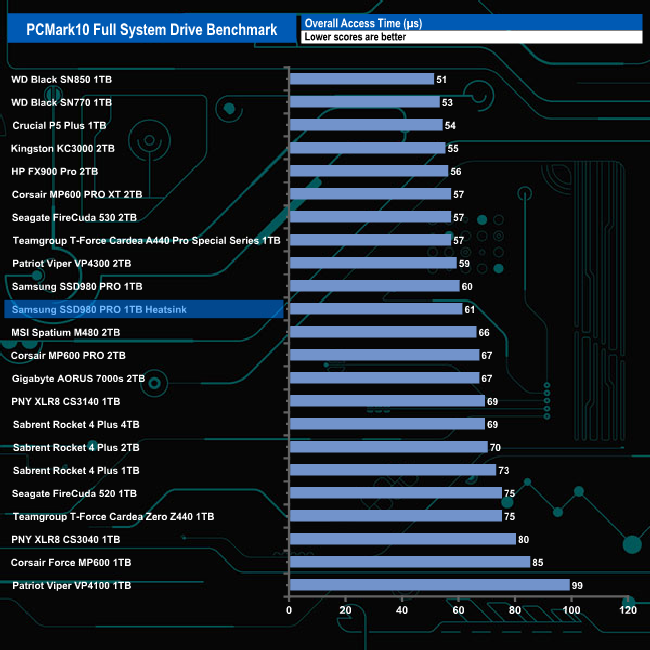
The PCMark 10 Full System Drive Benchmark uses a wide-ranging set of real-world traces from popular applications and common tasks to fully test the performance of the fastest modern drives. The benchmark is designed to measure the performance of fast system drives using the SATA bus at the low end and devices connected via PCI Express at the high end.
The goal of the benchmark is to show meaningful real-world performance differences between fast storage technologies such as SATA, NVMe, and Intel’s Optane. The Full System Drive Benchmark uses 23 traces, running 3 passes with each trace. It typically takes an hour to run.
Traces used:
Booting Windows 10.
Adobe Acrobat – starting the application until usable.
Adobe Illustrator – starting the application until usable Adobe Premiere Pro – starting the application until usable.
Adobe Photoshop – starting the application until usable.
Battlefield V – starting the game until the main menu.
Call of Duty Black Ops 4 – starting the game until the main menu.
Overwatch – starting the game until main menu.
Using Adobe After Effects.
Using Microsoft Excel.
Using Adobe Illustrator.
Using Adobe InDesign.
Using Microsoft PowerPoint.
Using Adobe Photoshop (heavy use).
Using Adobe Photoshop (light use).
cp1 Copying 4 ISO image files, 20 GB in total, from a secondary drive to the target drive (write test).
cp2 Making a copy of the ISO files (read-write test).
cp3 Copying the ISO to a secondary drive (read test).
cps1Copying 339 JPEG files, 2.37 GB in total, to the target drive (write test).
cps2 Making a copy of the JPEG files (read-write test).
cps3 Copying the JPEG files to another drive (read test).

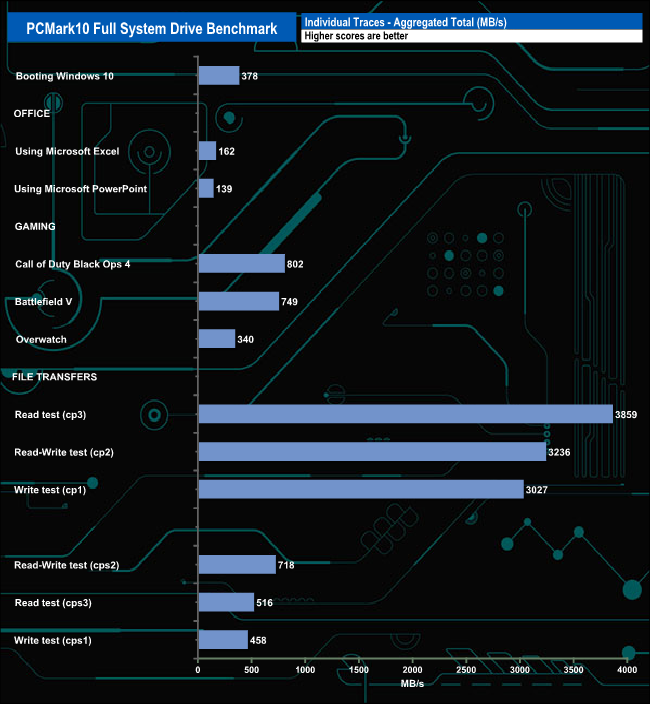

The best result from the Samsung 980 Pro Heatsink in PCMark10’s Full System Drive Benchmark was the 784MB/s for the Heavy Use Adobe Photoshop trace. The file transfer tests also produced a good cp1 (write test) figure of 3,027MB/s backed up by the 3,859MB/s for the cp3 (read test) and 3,236MB/s for the cp2 read/write test traces.
The 3DMark Storage Benchmark uses traces recorded from popular games and gaming-related activities to measure real-world gaming performance.
Traces used –
Battlefield V
Loading Battlefield™ V from launch to the main menu.
Call of Duty Black Ops 4
Loading Call of Duty®: Black Ops 4 from launch to the main menu.
Overwatch
Loading Overwatch® from launch to the main menu.
Game Move
Copying the Steam folder for Counter-Strike®: Global Offensive from an external SSD to the system drive.
Game Recording
Recording a 1080p gameplay video at 60 FPS with OBS (Open Broadcaster Software) while playing Overwatch®.
Installing Game
Installing The Outer Worlds® from the Epic Games Launcher.
Game Saving
Saving Progress in The Outer Worlds game.
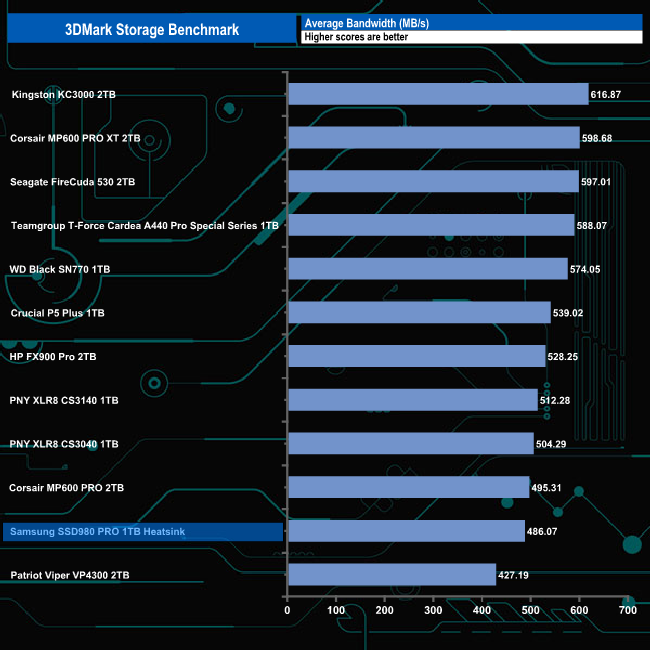
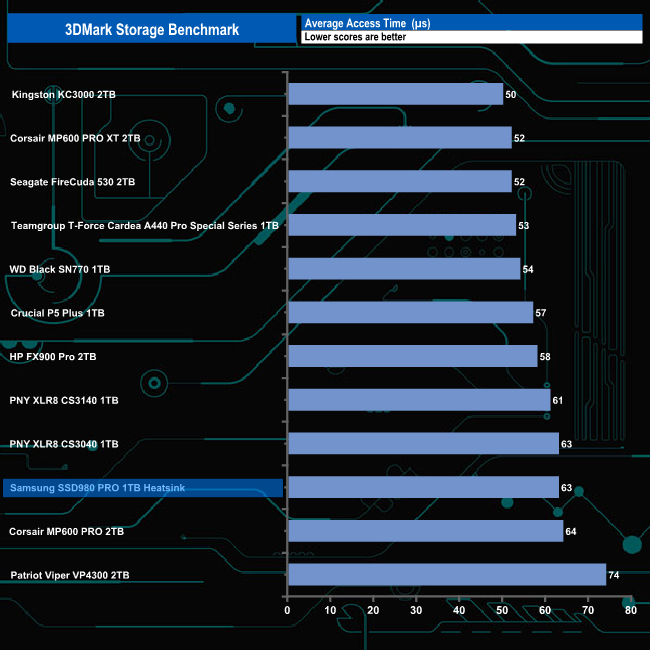
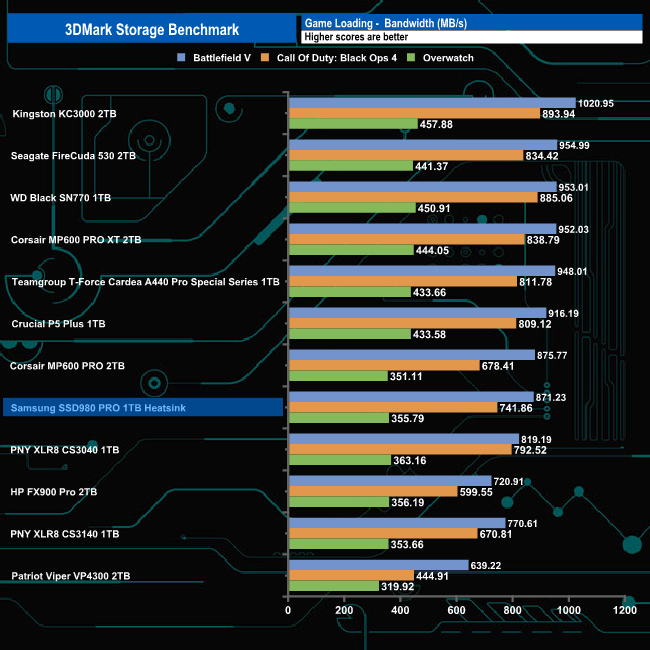
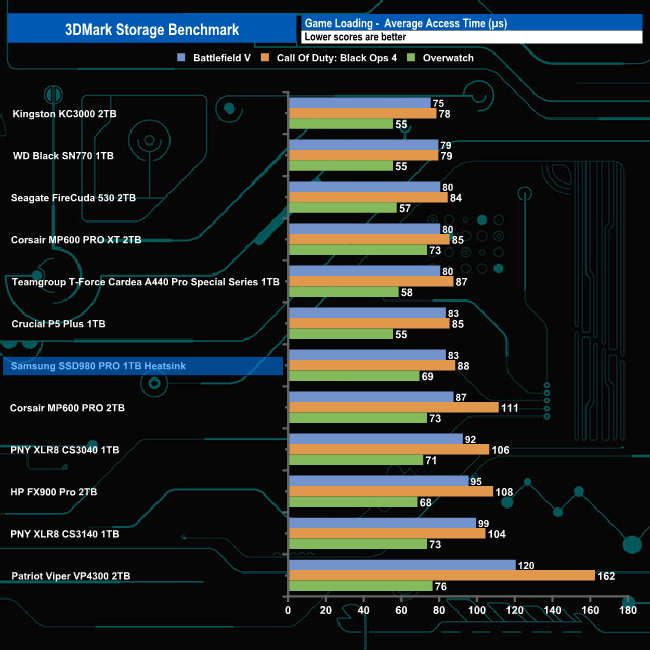
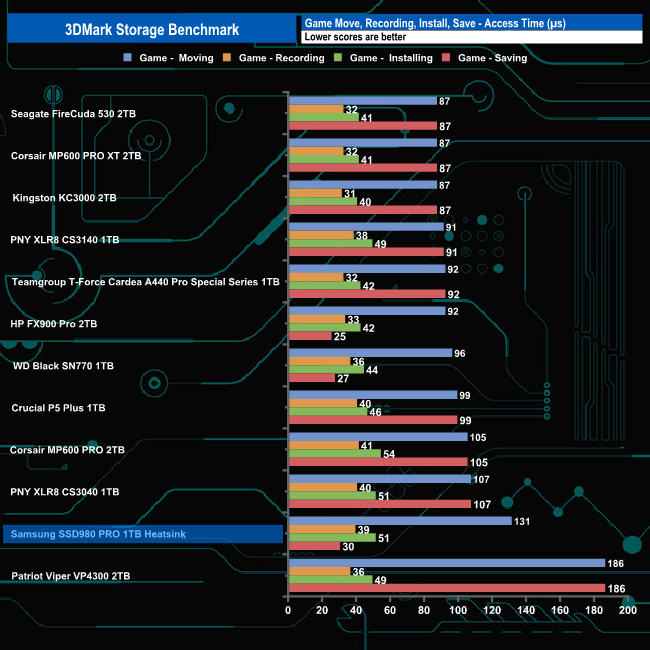
In 3DMark’s Storage Test, the drive had an average bandwidth figure of 656.29MB/s for the three game load tests (Battlefield V, Call of Duty: Black Ops 4 and Overwatch) with an average access time of 70.01µs for the same three games.
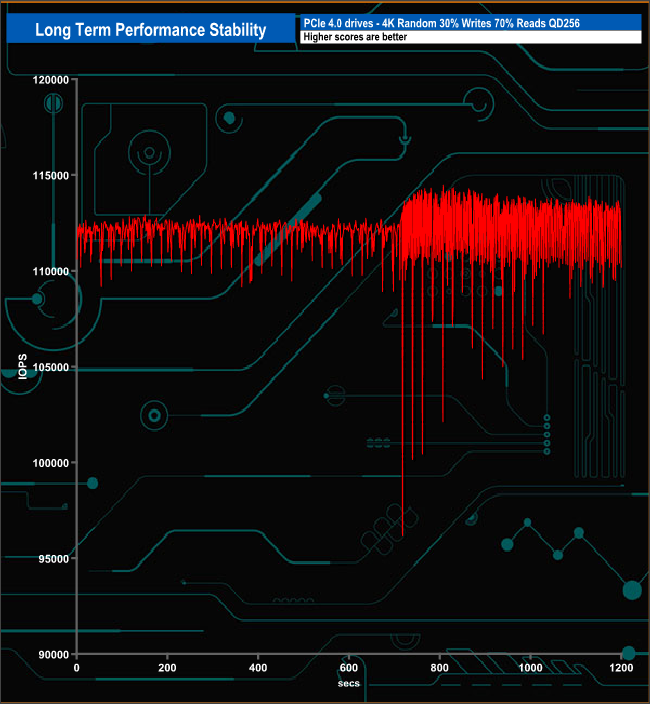
For the long term performance stability test, we set the drive up to run a 20-minute 4K random test with a 30% write, 70% read split, at a Queue Depth of 256 over the entire disk. The 1TB Samsung 980 Pro Heatsink averaged 112,146 IOPS for the test with an excellent performance stability of 98%.
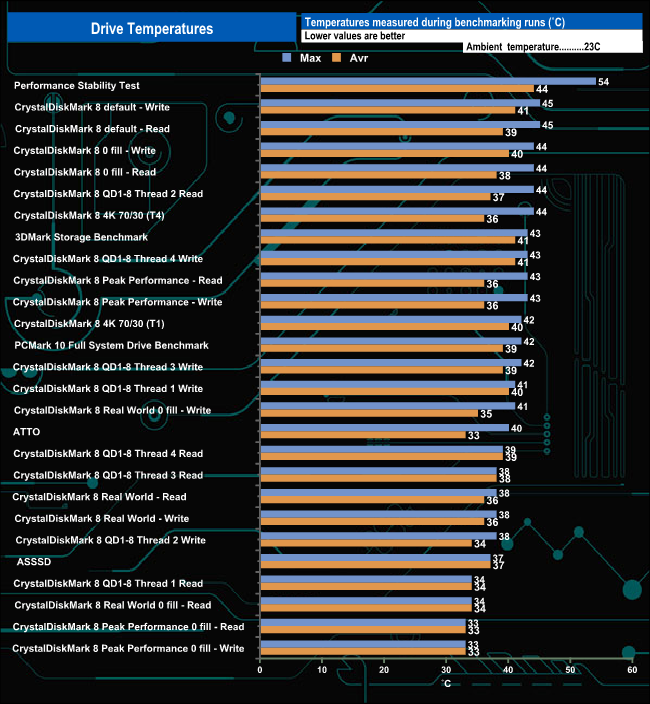
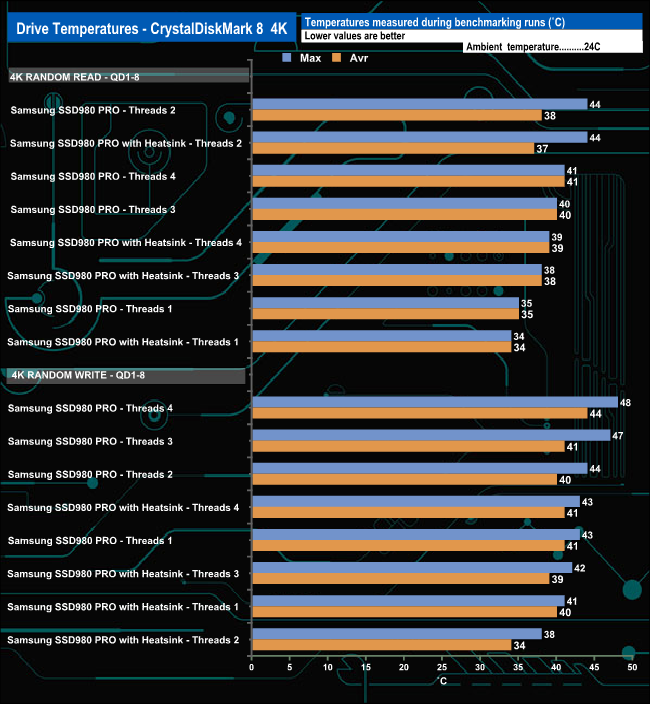
We took note of the drive’s temperature during some of our benchmarking runs. The heatsink works well enough as the hottest the drive got was 54° C when being pushed very hard during the Performance Stability test. For the bulk of our testing the temperature averaged around 40° C, comfortably below the maximum operating temperature of 70C.
Heatsink vs non-heatsink 980 Pro
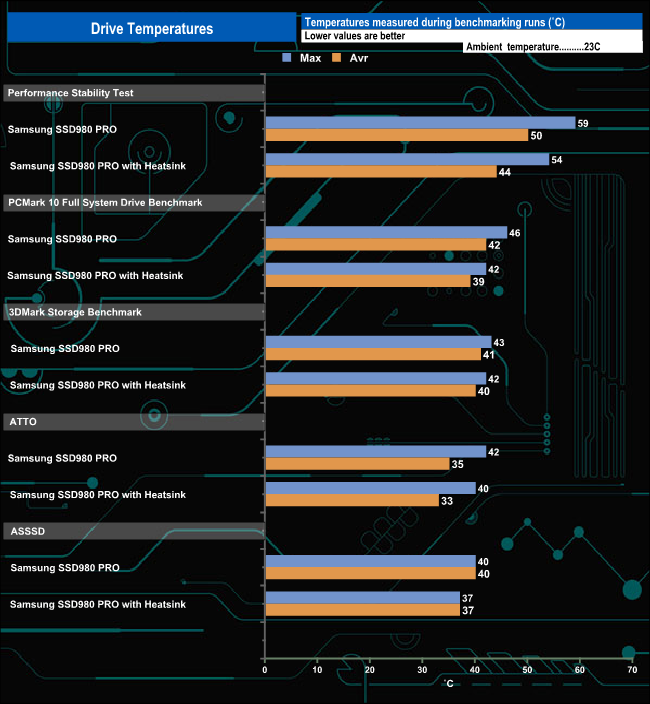
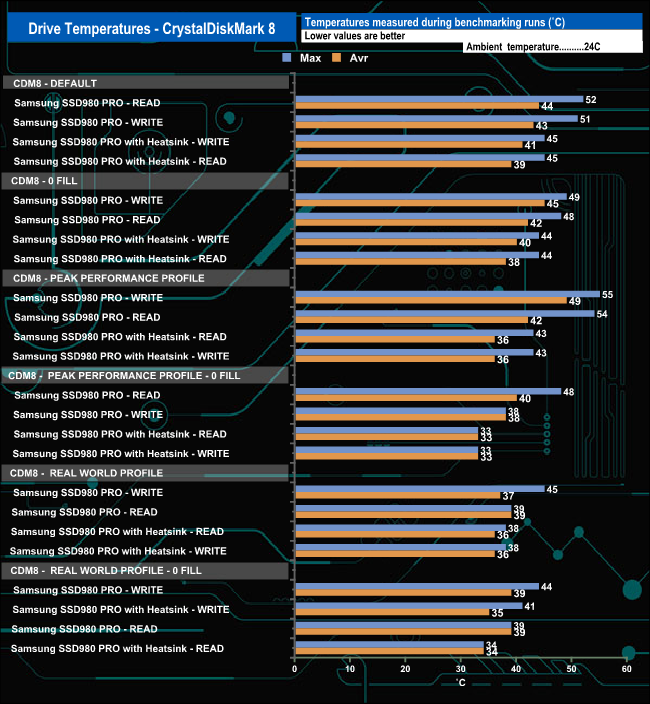
We also compared the Heatsink version of the SSD 980 PRO against the standard drive. The heatsink version did keep the drive cooler in our tests to varying degrees, especially when it was being pushed. For example, the heatsink version was 12 degrees cooler during the read tests in CrystalDisKMark 8's Peak Performance Profile benchmark and 11 degrees cooler during the writes tests. These are useful reductions if you are installing the drive in a compact PC or PS5.
To test the real-life performance of a drive we use a mix of folder/file types and by using the FastCopy utility (which gives a time as well as MB/s result) we record the performance of the drive reading from & writing to a 256GB Samsung SSD 850 Pro.
We use the following files/folders:
- 100GB data file.
- 60GB iso image.
- 60GB Steam folder – 29,521 files.
- 50GB File folder – 28,523 files.
- 12GB Movie folder – (15 files – 8 @ .MKV, 4 @ .MOV, 3 @ MP4).
- 10GB Photo folder – (304 files – 171 @ .RAW, 105 @ JPG, 21 @ .CR2, 5 @ .DNG).
- 10GB Audio folder – (1,483 files – 1479 @ MP3, 4 @ .FLAC files).
- 5GB (1.5bn pixel) photo.
- BluRay Movie – 42GB.
- 21GB 8K Movie demos – (11 demos)
- 16GB 4K Raw Movie Clips – (9 MP4V files).
- 4.25GB 3D Printer File Folder – (166 files – 105 @ .STL, 38 @ .FBX, 11 @ .blend, 5 @ .lwo, 4 @ .OBJ, 3@ .3ds).
- 1.5GB AutoCAD File Folder (80 files – 60 @ .DWG and 20 @.DXF).
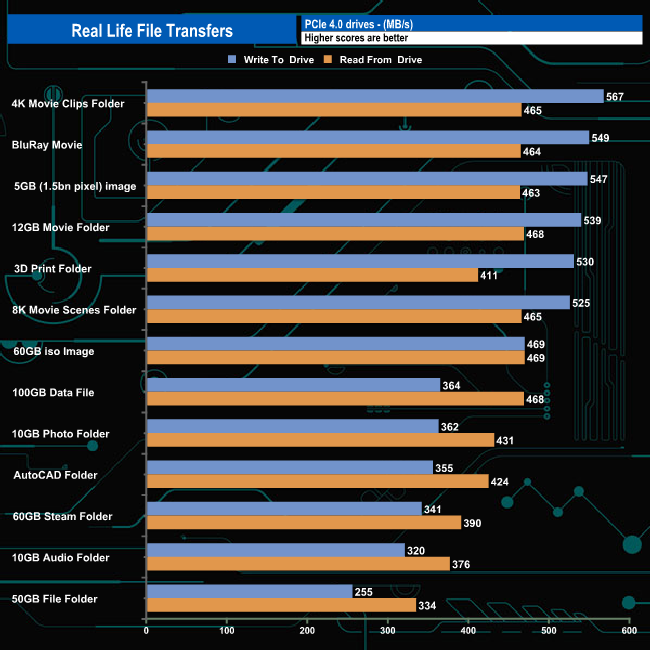
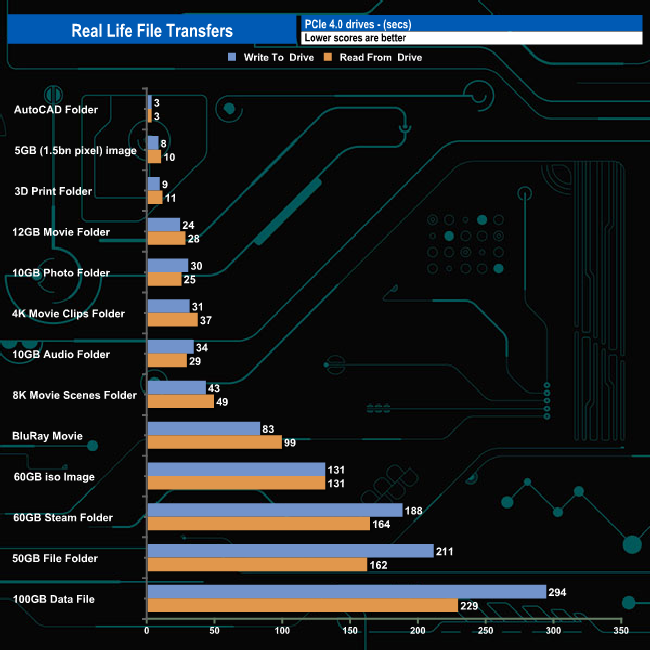
The 980 Pro Heatsink handled our real-life file transfers without any problems, particularly when dealing with the larger file size transfers, averaging 543MB/s for writes and 456MB/s for reads when dealing with these file types.
To get a measure of how much faster PCIe NVMe drives are than standard SATA SSD we use the same files but transfer to and from a 2TB Kioxia Exceria Plus drive:
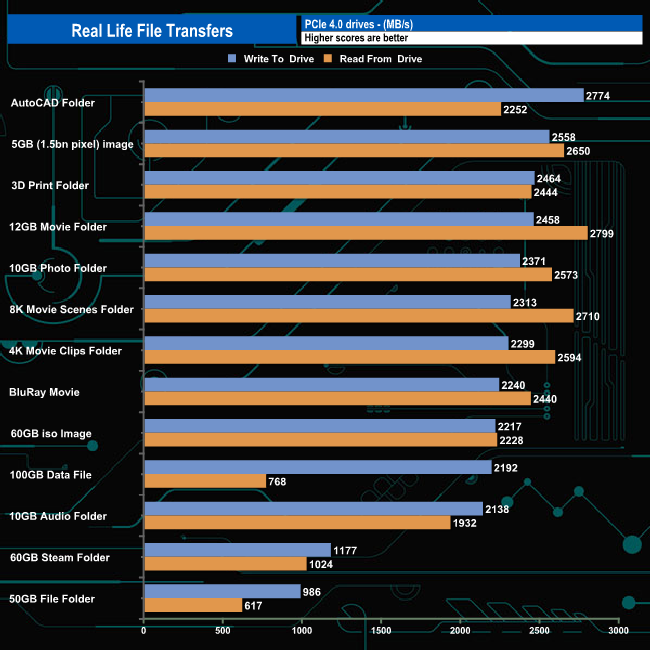
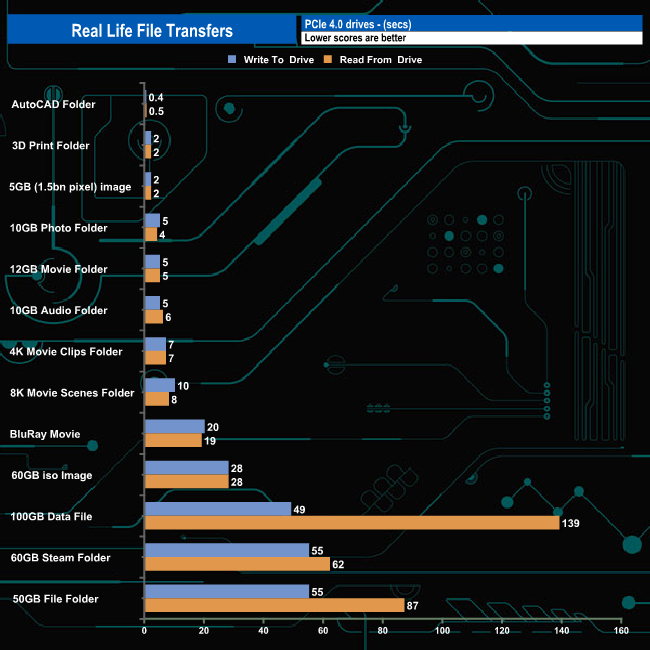
This saw transfer speeds rocket and overall transfer times dropped dramatically. Eleven of the transfers topped well over 2GB/s when writing to the drive, while the remaining two transfers topped 1GB/s. The drive did seem to have a bit of a struggle when reading the 100GB data file however.
Until recently, if you fancied sticking a Samsung 980 Pro into your Sony PS5 you had the hassle of searching around for a third party heatsink to keep the thing cool. Not any longer, as Samsung has introduced a new version of the drive that comes factory fitted with a well-designed heatsink. The heatsink adds around 6mm to the height and 20g of weight compared to a standard 980 Pro.
The drive uses a combination of Samsung Elpis controller and in the case of the 1TB drive, two packages of Samsung's 6th generation 1xx layer 3-bit MLC (TLC) V-NAND together with a 1GB LPDDR4 cache IC.
Performance-wise the drive is rated the same as the standard 980 Pro. Samsung quote Sequential read/write performance figures for the 1TB drive of up to 7,000MB/s read and 5,000MB/s respectively, while 4K random performance is rated as up to 1,000,000 IOPS for both reads and writes.
Using CrystalDiskMark 8 we could confirm those Sequential read/write figures with best test results of 7,152.75MB/s for reads and 5,257.07MB/s for writes. When it came to 4K performance, we couldn't get close to the official maximum figures. The best we saw from the drive was when tested with CrystalDisMark 8's Peak Performance Profile, which produced a peak read figure of 633,525 IOPS when using the default profile, while the best write figure of 522,627 IOPS came using the 0 fill option.
The drive features Samsung's Intelligent TurboWrite 2.0 technology to improve write performance. The default TurboWrite region of the 1TB drive is 6GB, but if more is needed, up to 108GB can be used as a dynamic SLC buffer, for a total buffer size of 114GB. In the case of the 1TB drive, if the drive has less than 324GB of free capacity, the Intelligent TurboWrite will not operate fully.
If you are wondering which version of the SSD 980 PRO to go for, prices do fluctuate but the better thermal protection of the Heatsink version is rarely more than £10 more expensive than the non-heatsink model, which seems a bit of a no-brainer.
We found the 1TB Samsung 980 Pro Heatsink on offer from Curry's at for £99 HERE. Regular retail pricing that we have observed varies from £120-170.
Discuss on our Facebook page HERE.
Pros
- Heatsink reduces temperatures.
- Overall Performance.
- Magician software.
Cons
- Couldn't match the official 4K figures during testing.
KitGuru says: Samsung bringing out the Heatsink version of the 980 Pro at least means you use the drive in a PlayStation 5 out of the box without resorting to a 3rd-party cooling solution.