The latest drive to join Samsung's 2.5in SSD series is the SSD 870 EVO, which uses the lastest in-house sixth-generation V-NAND. We review the 1TB model, with a UK MSRP of £135.49 – is it worth the cash?
At launch the SSD 870 line-up comprises of five capacities; 250GB, 500GB, 1TB (the drive we are reviewing here), 2TB and the flagship 4TB model. The drives use the latest 6th generation Samsung 1xx layer V-NAND in combination with an MKX controller and LP-DDR4 cache.
The official Sequential performance figures for all the new drives are up to 560MB/s for reads and up to 530MB/s for writes. Random performance is quoted as up to 13,000 IOPS for reads and up to 36,000 IOPS at a QD1 and up to 98,000 IOPS and 88,000 IOPS for read and writes respectively at QD32.
Data security is provided by AES-256 full disk encryption and the drive supports TCG/Opal v2.0 and IEEE1667.
Samsung quote an endurance figure for the 1TB drive of 600TB TBW and back the drive with a 5-year warranty.
Physical Specifications:
- Usable Capacities: 1TB
- NAND Components: Samsung 1xx layer V-NAND 3bit MLC (TLC).
- NAND Controller: Samsung MKX.
- Cache: 1GB LPDDR4.
- Interface: Serial ATA (SATA) 6Gb/s (SATA III).
- Form Factor: 2.5in, 7mm.
- Dimensions: 100x 69.85x 6.8mm.
Firmware Version: SVT01B6Q.
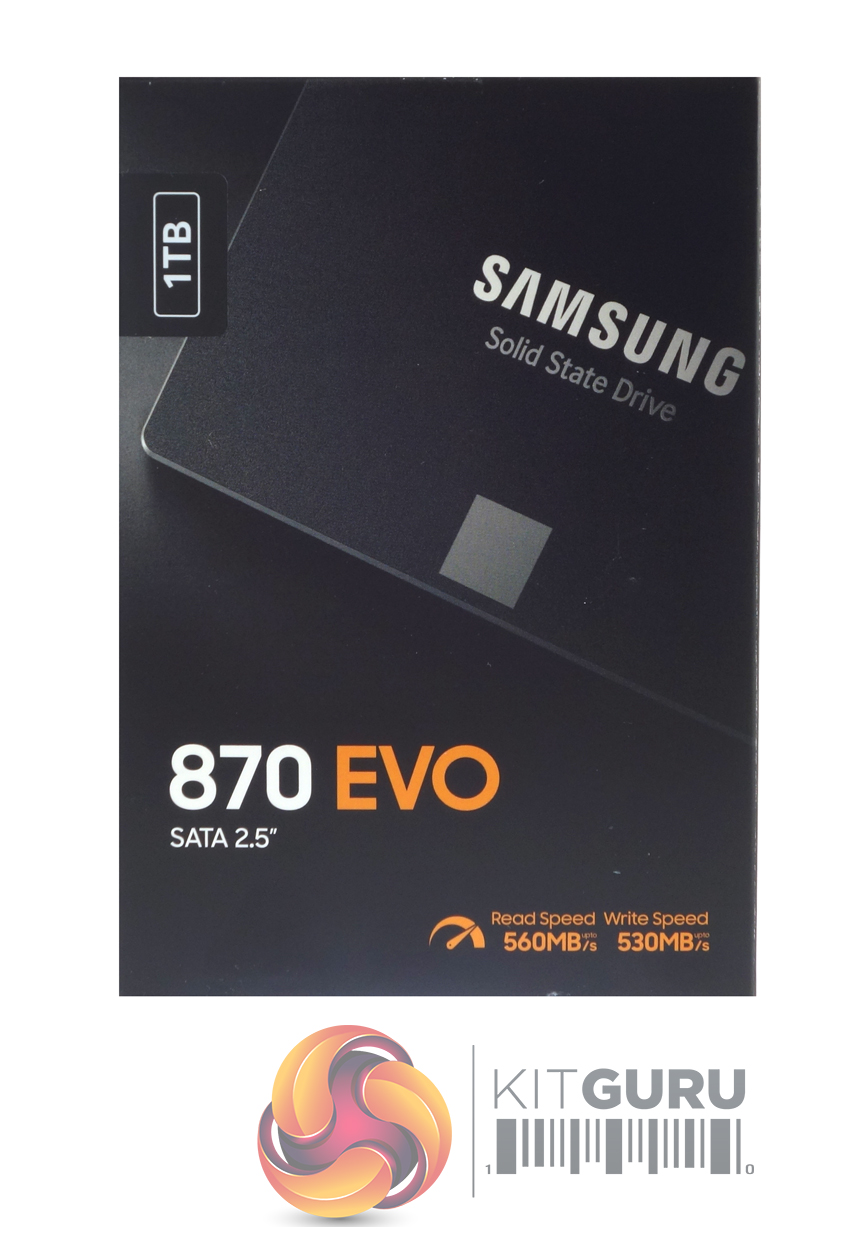
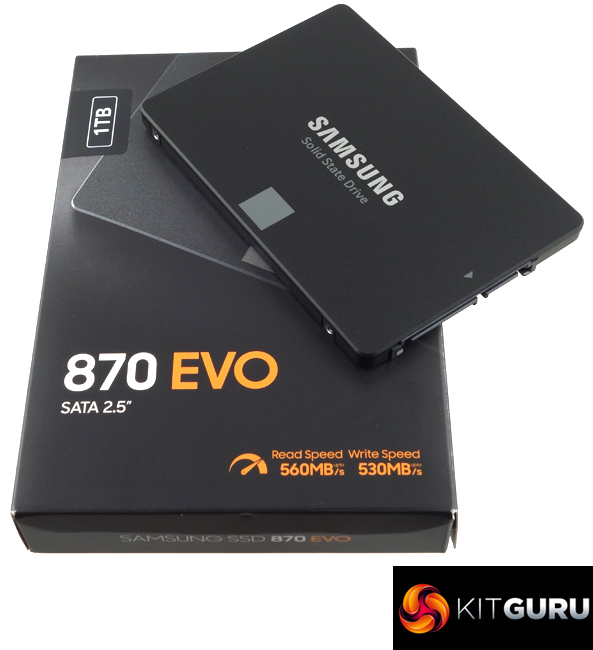
The Samsung SSD 870 EVO ships in a compact black box with an image of the drive on the front, with the Sequential read/write performance figures displayed on the bottom right-hand side. There is also a sticker on the top left of the box which indicates the capacity of the drive.
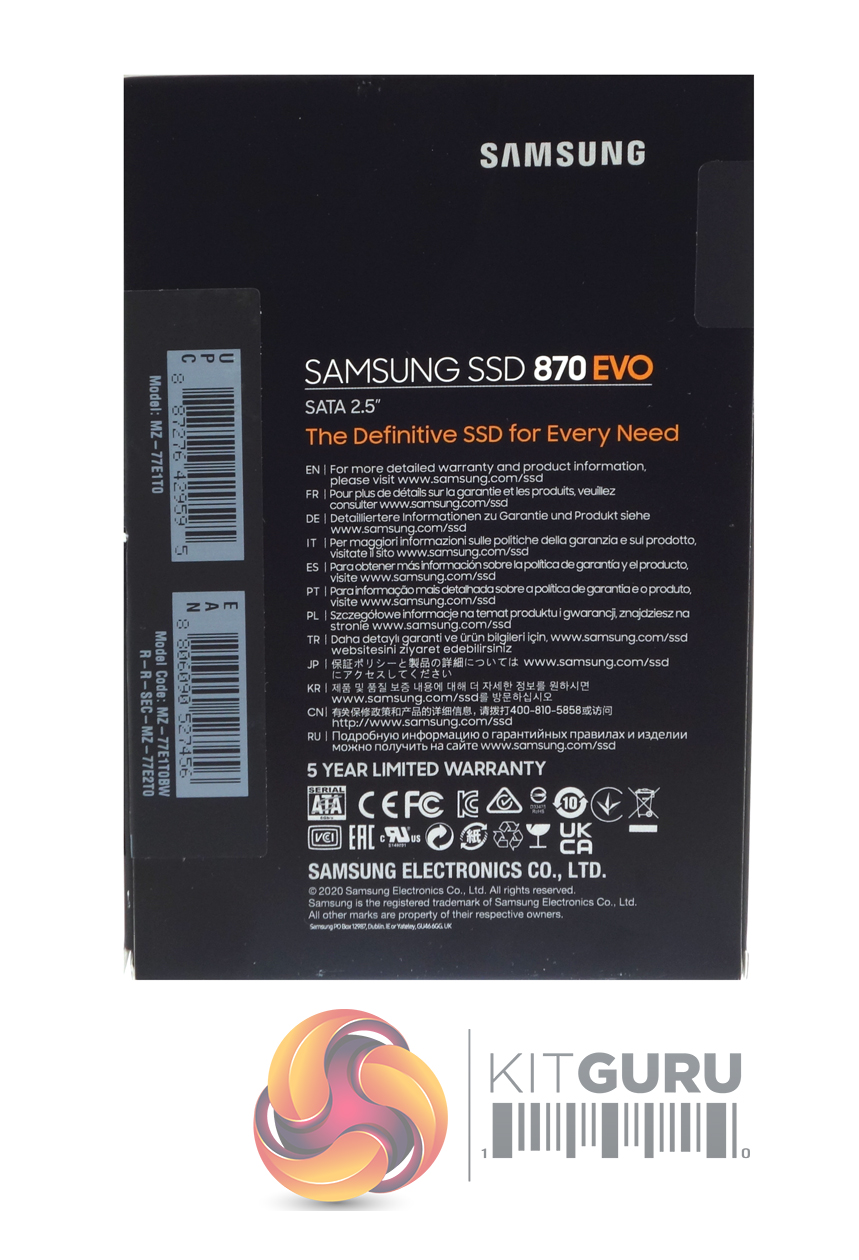
The rear of the box points out the fact the drive comes with a 5-year limited warranty and has a multilingual list with links to find more warranty information.
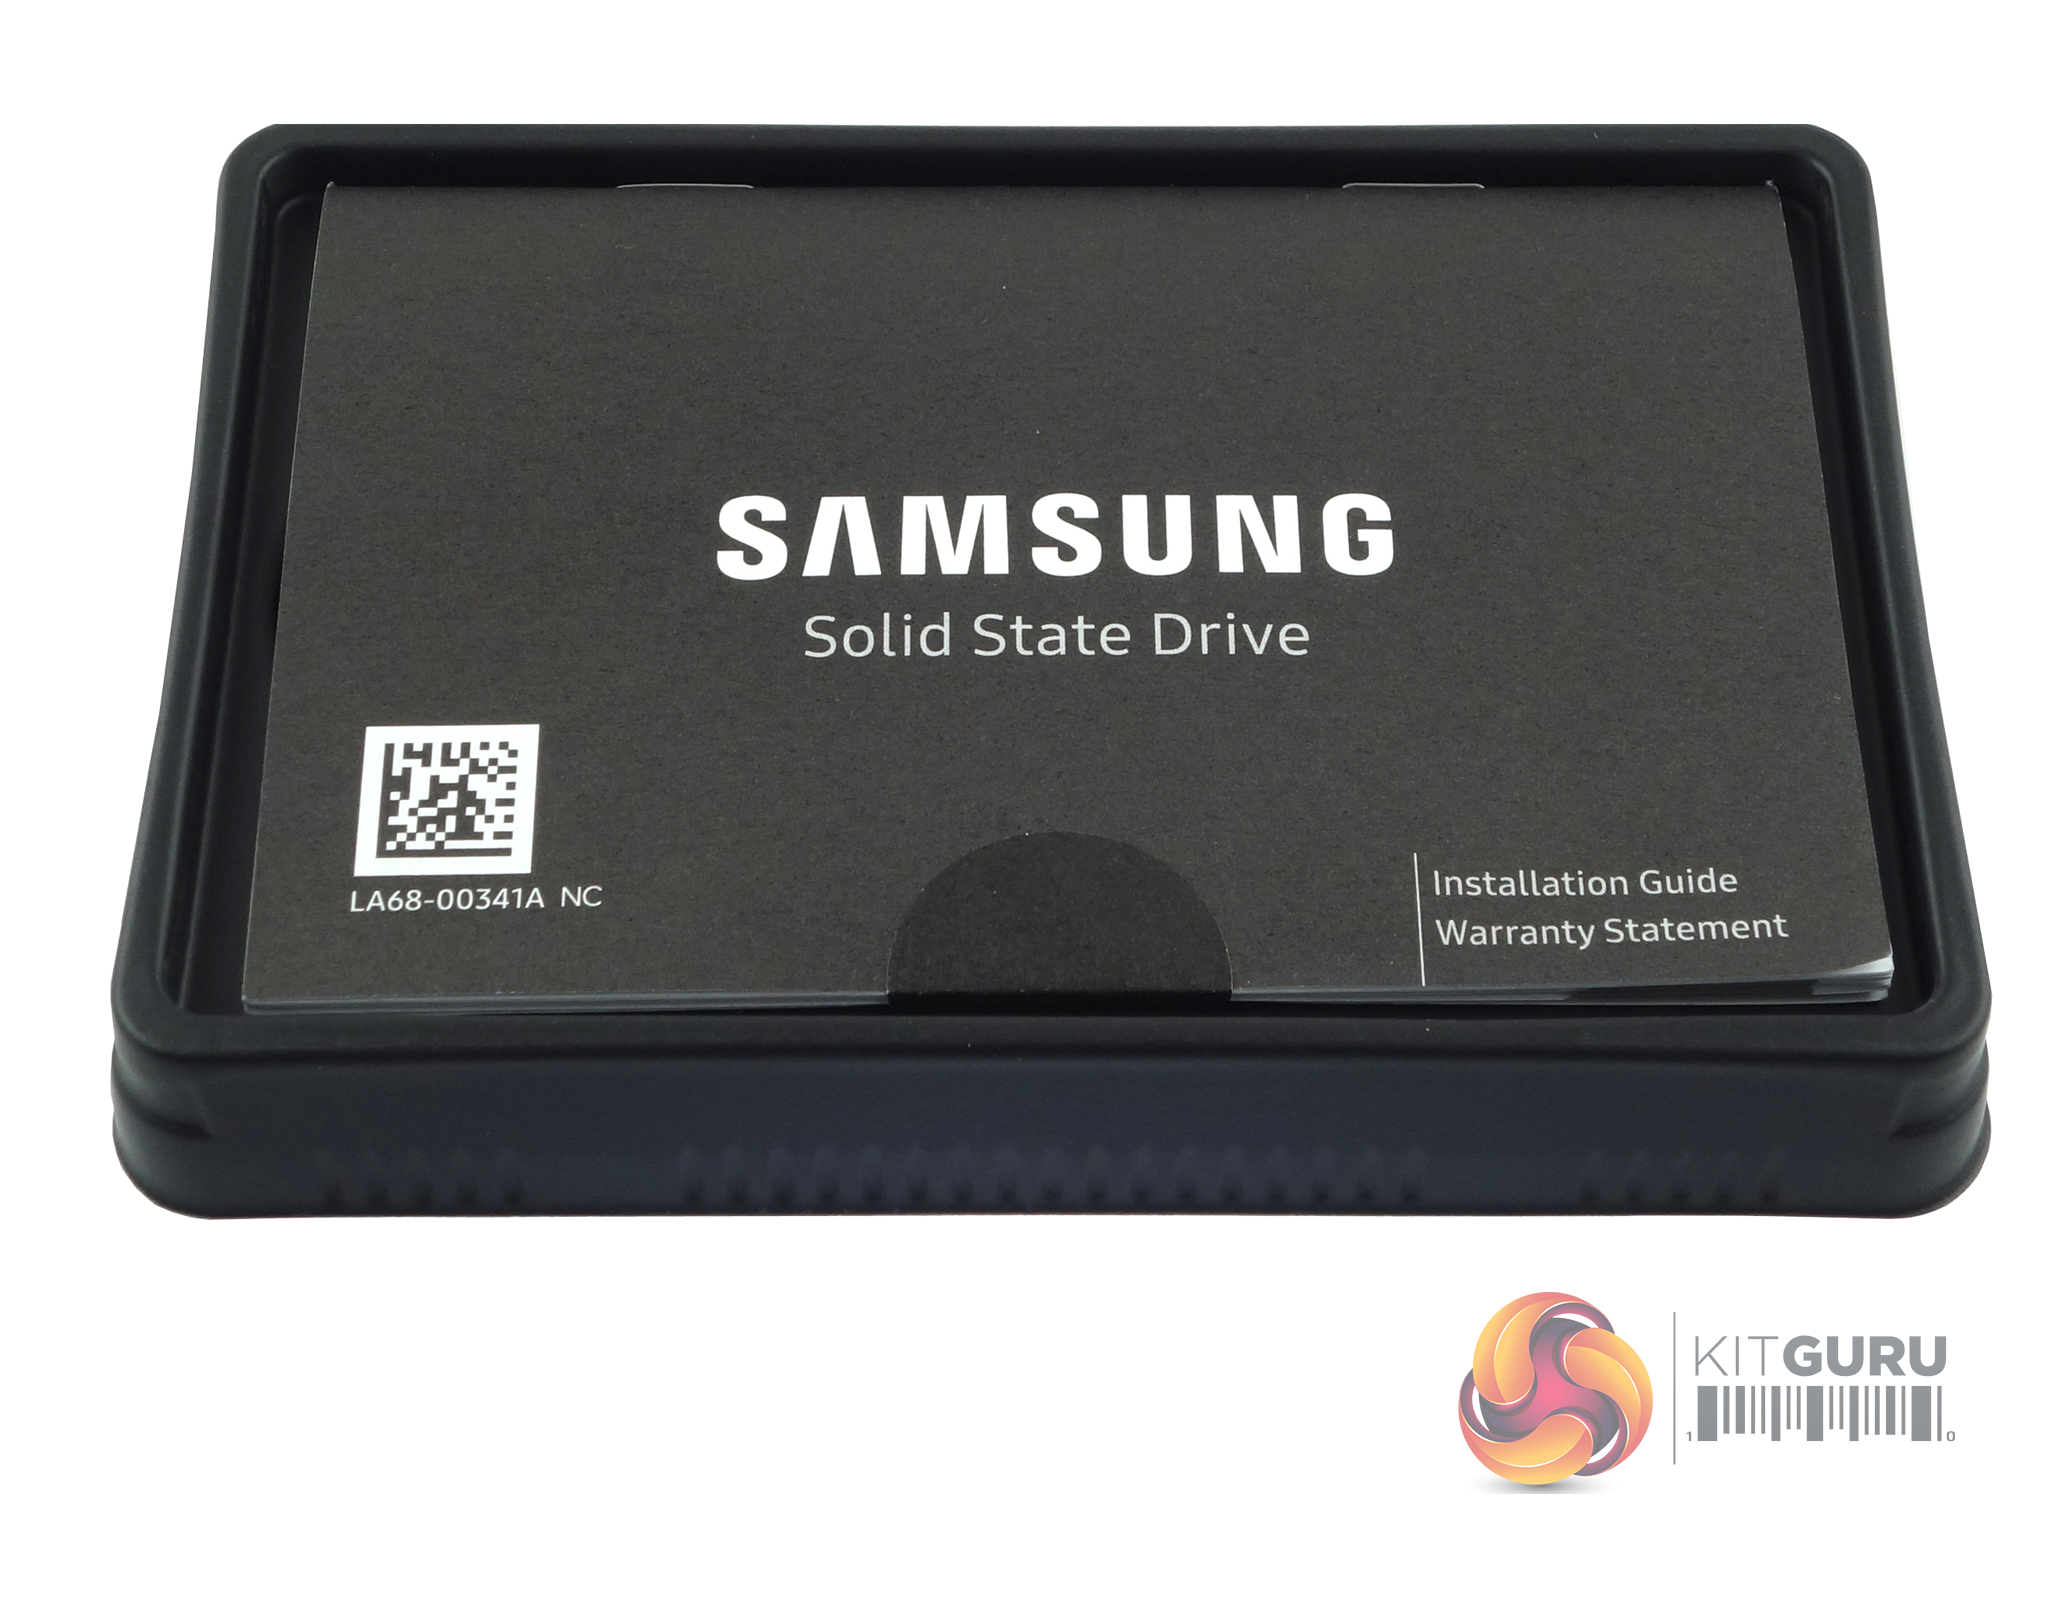
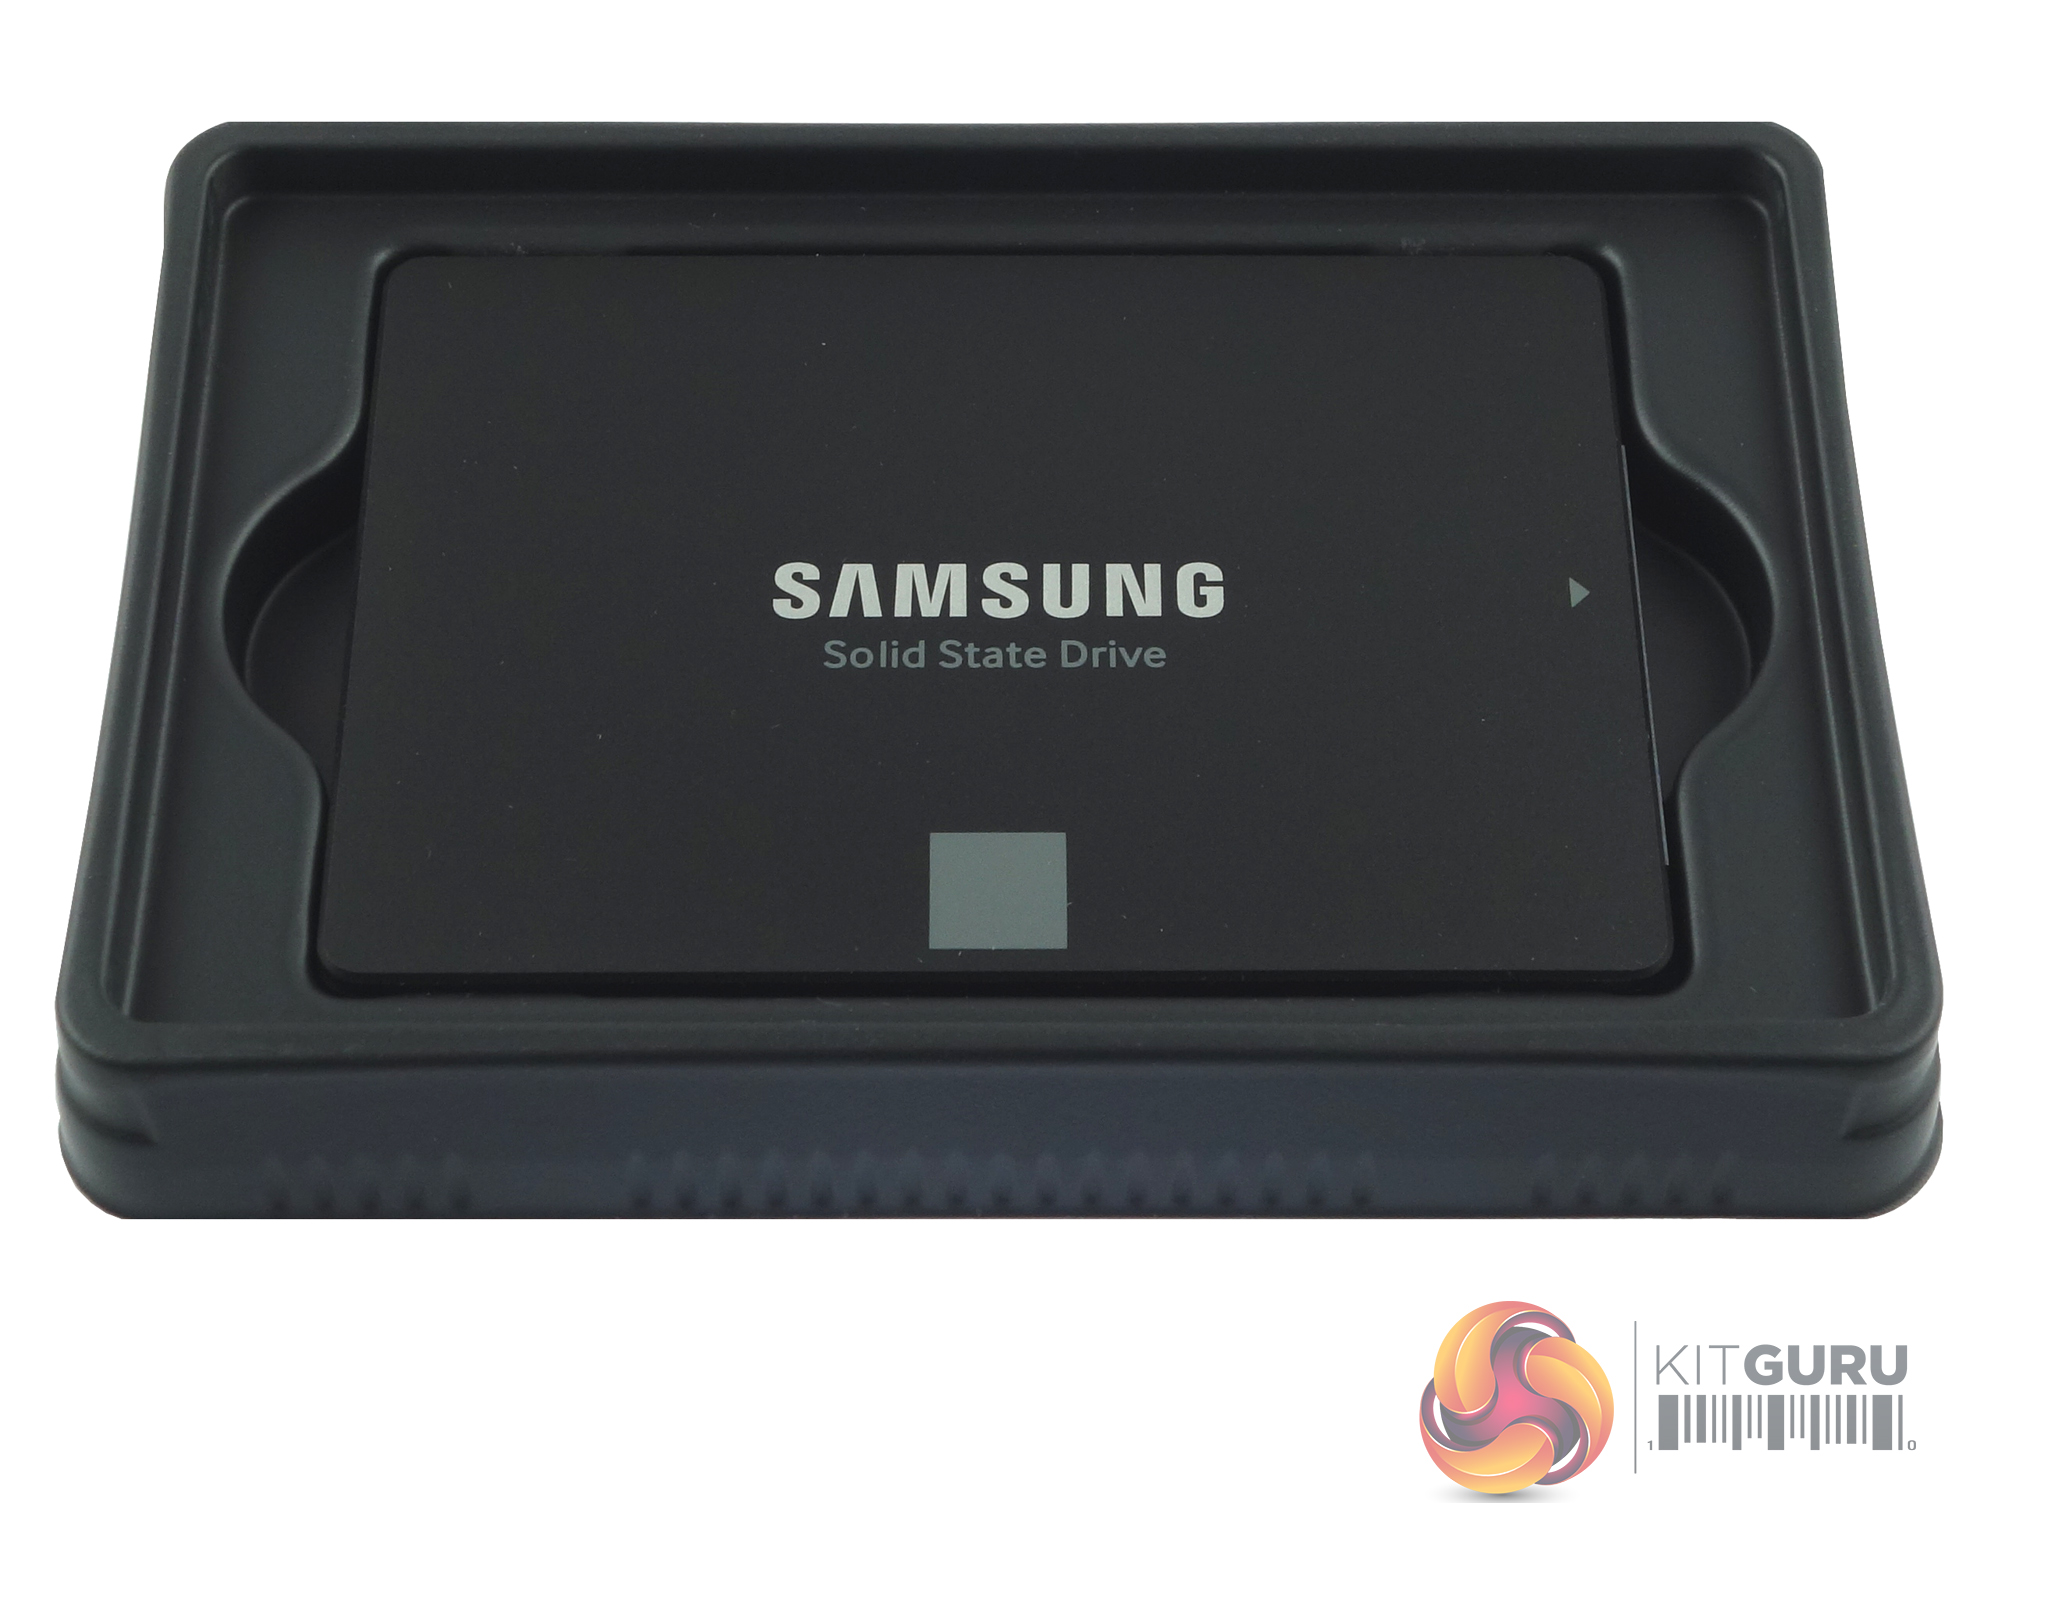
The drive sits in a tray to keep it secure during transit, and the only other thing in the box is an installation/warranty guide that sits on top of it.
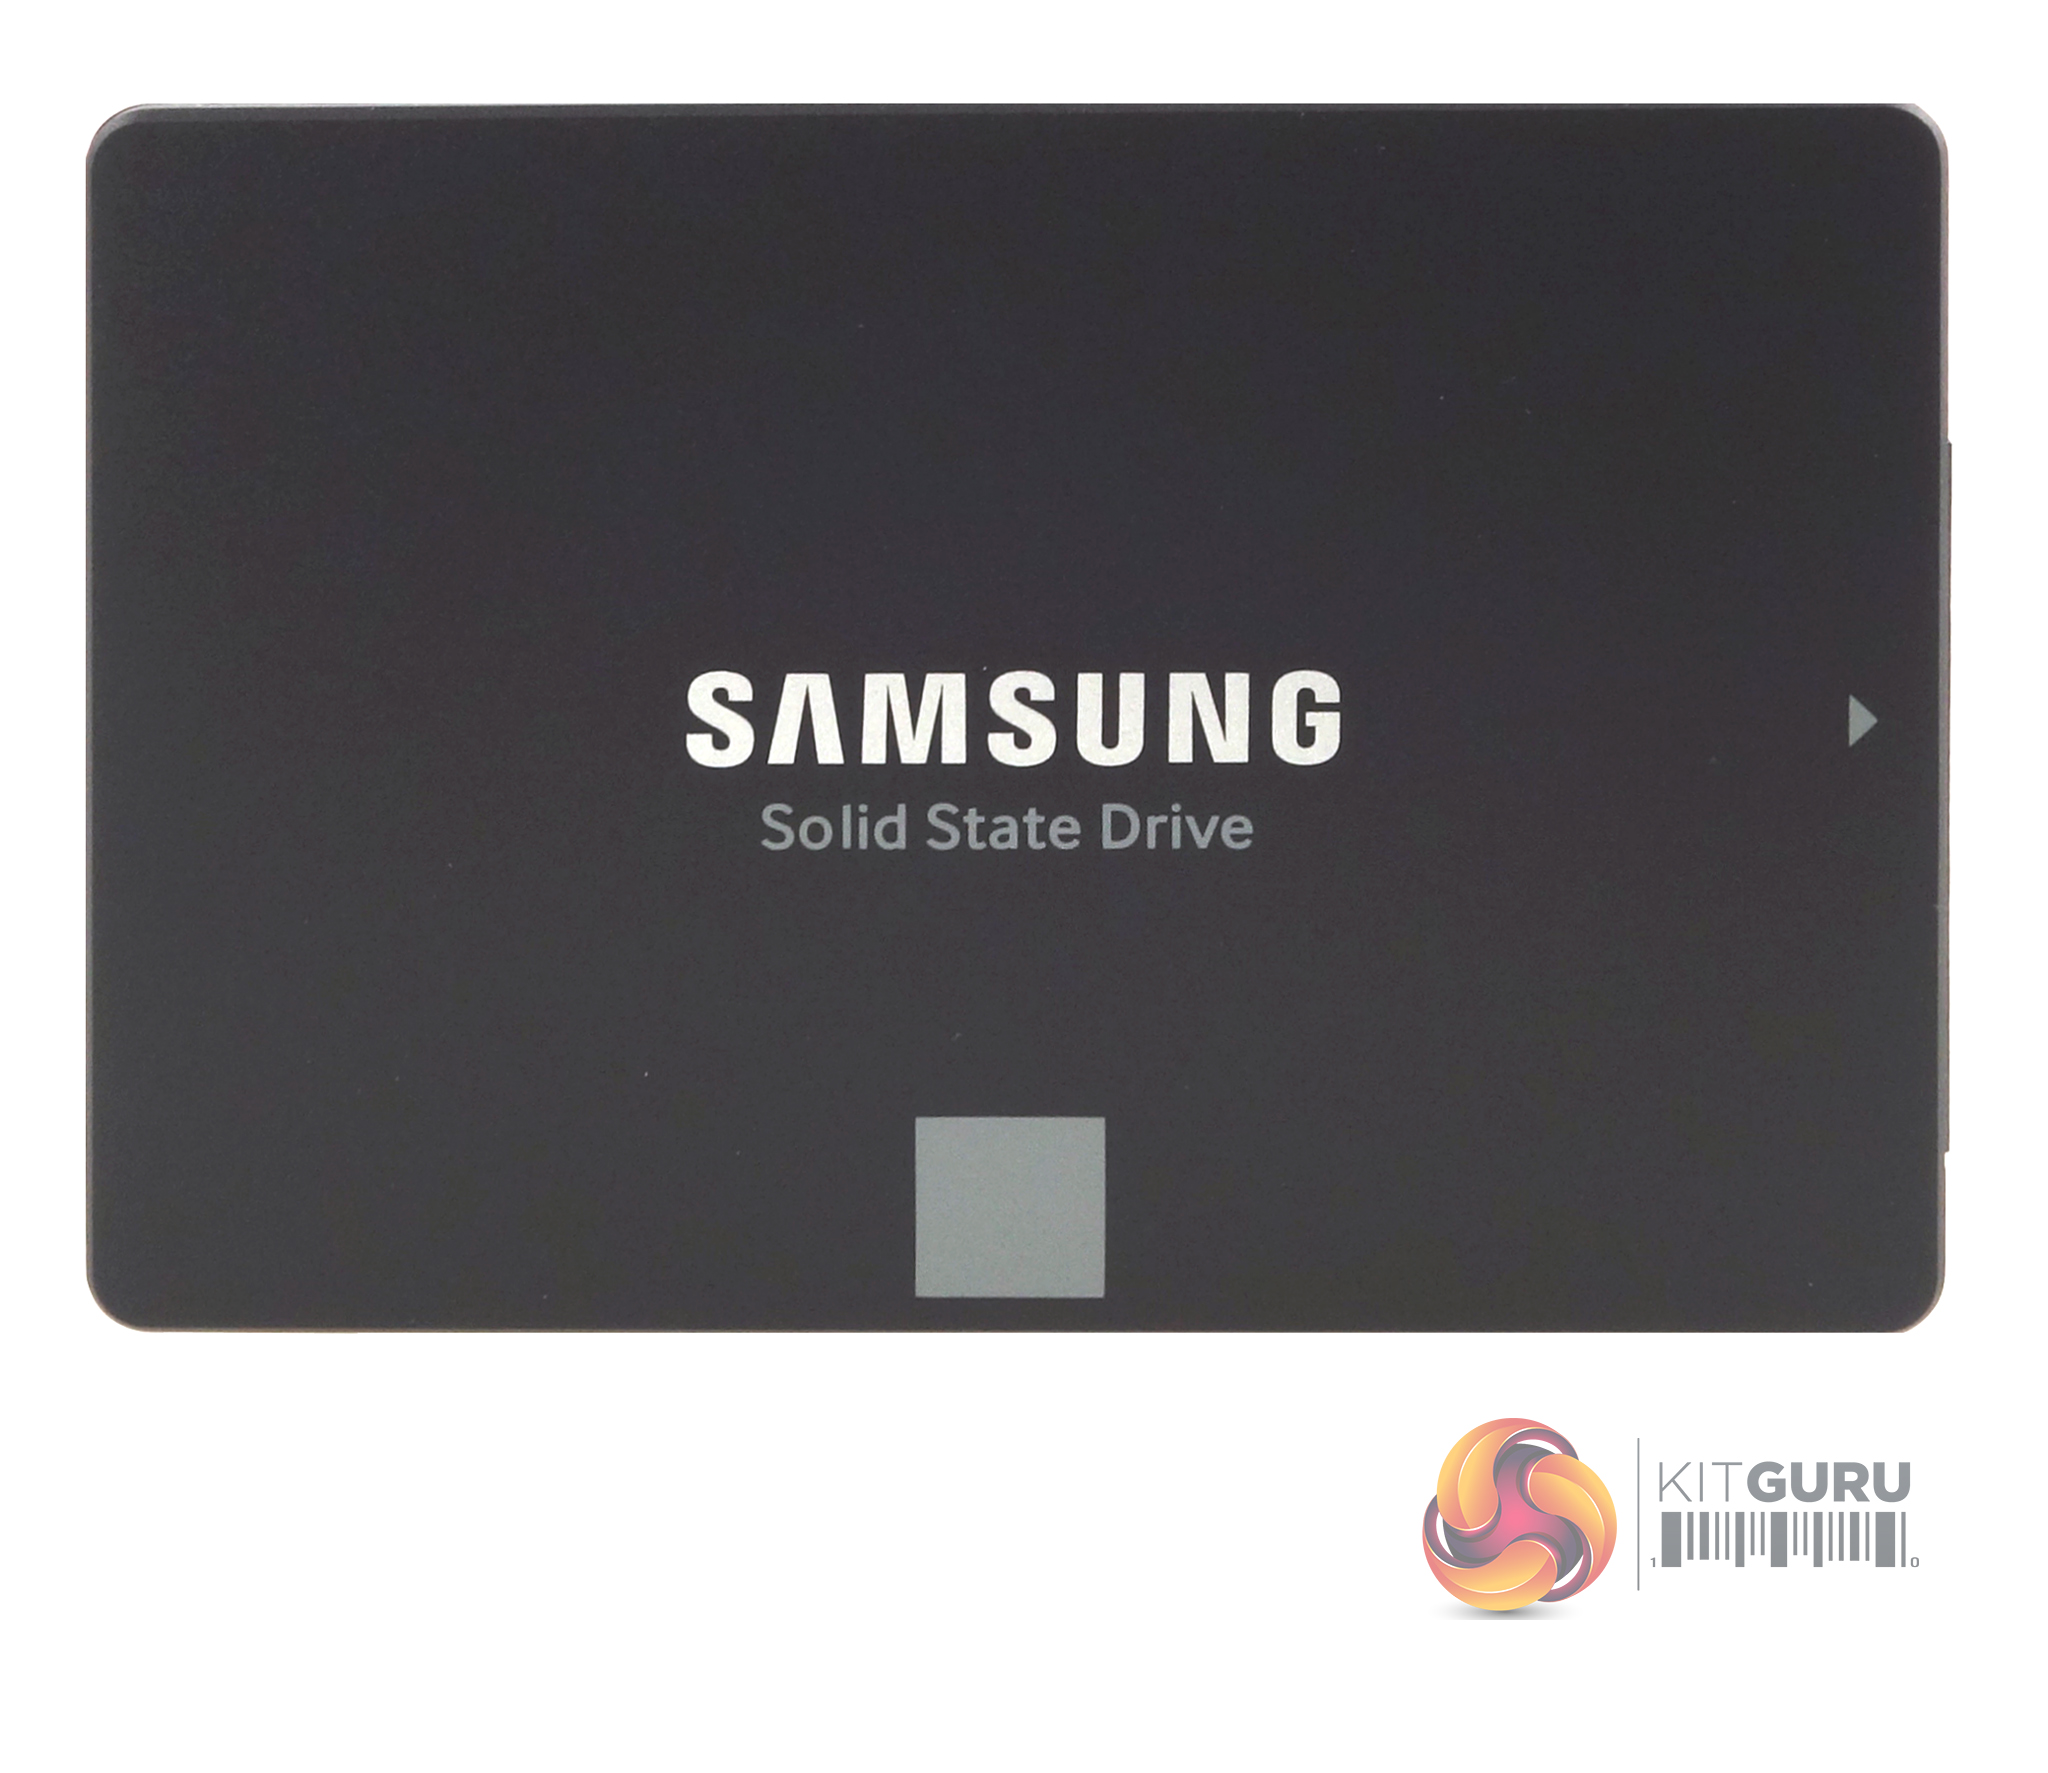
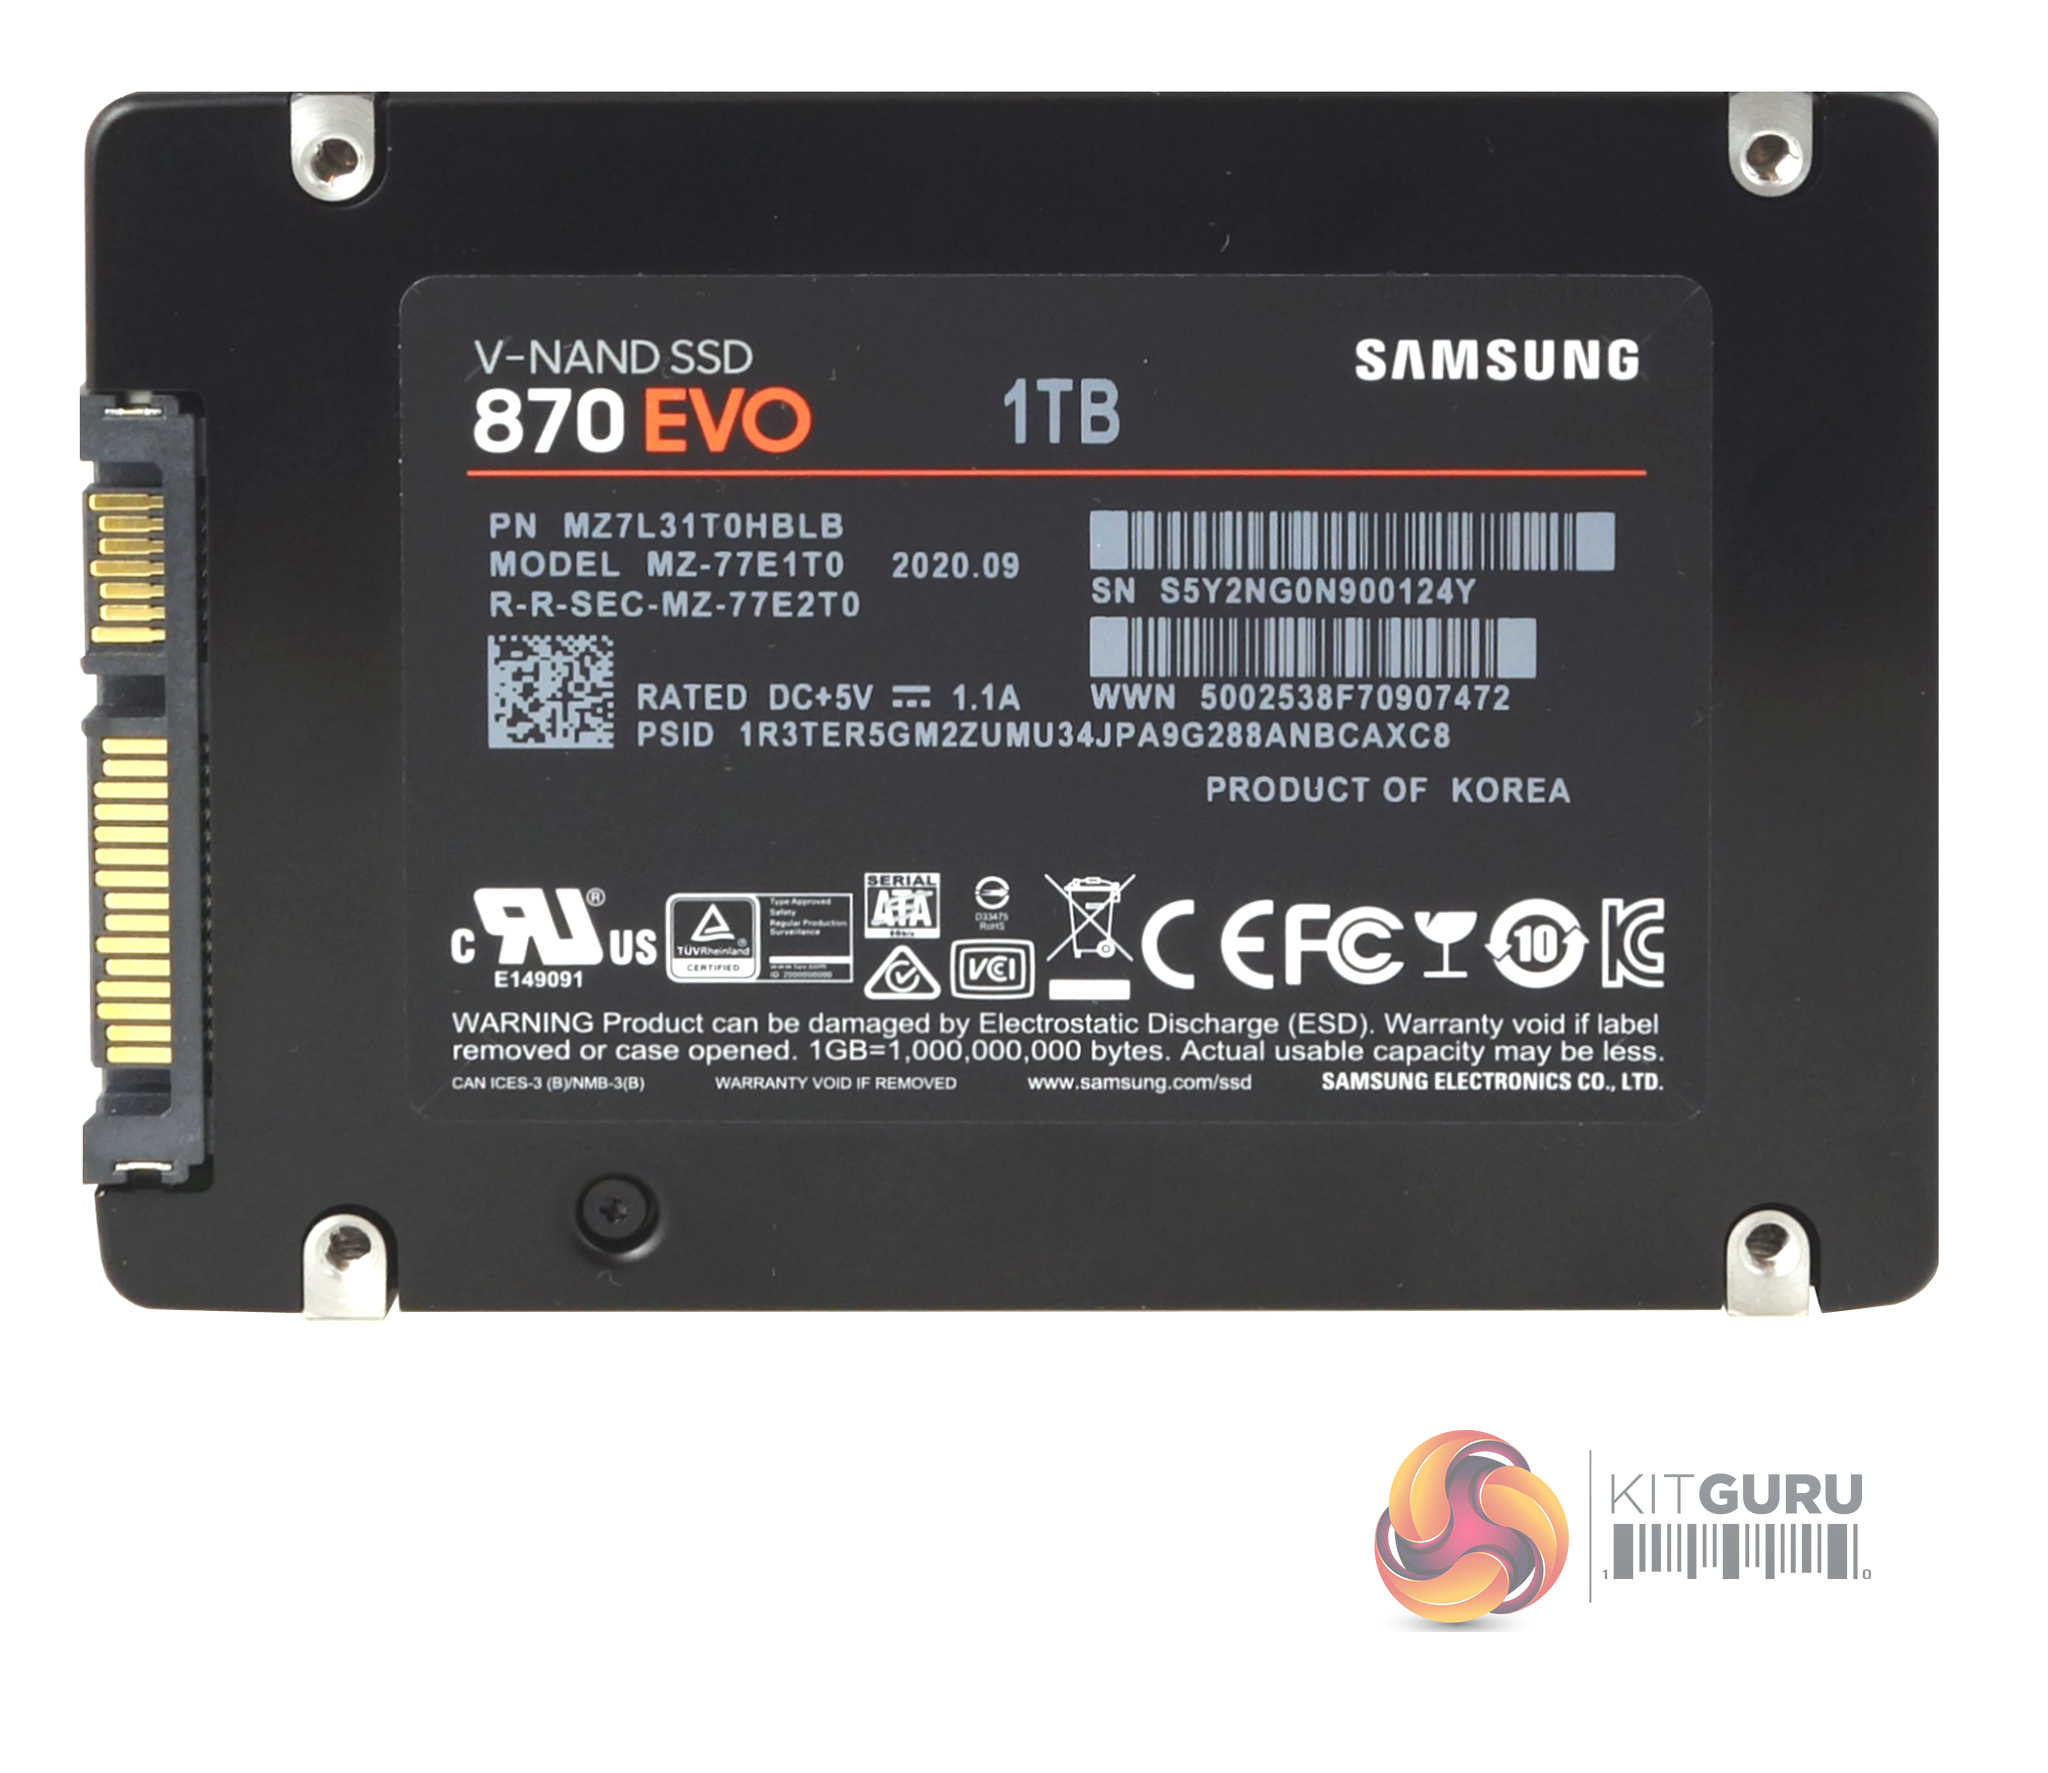
The drive is built on the standard 2.5in format and has a metal enclosure held in place by three pentalobe screws, two of which are hidden under the label on the rear of the drive. Be warned, ripping off the label to get at the screws will void the drive’s warranty.
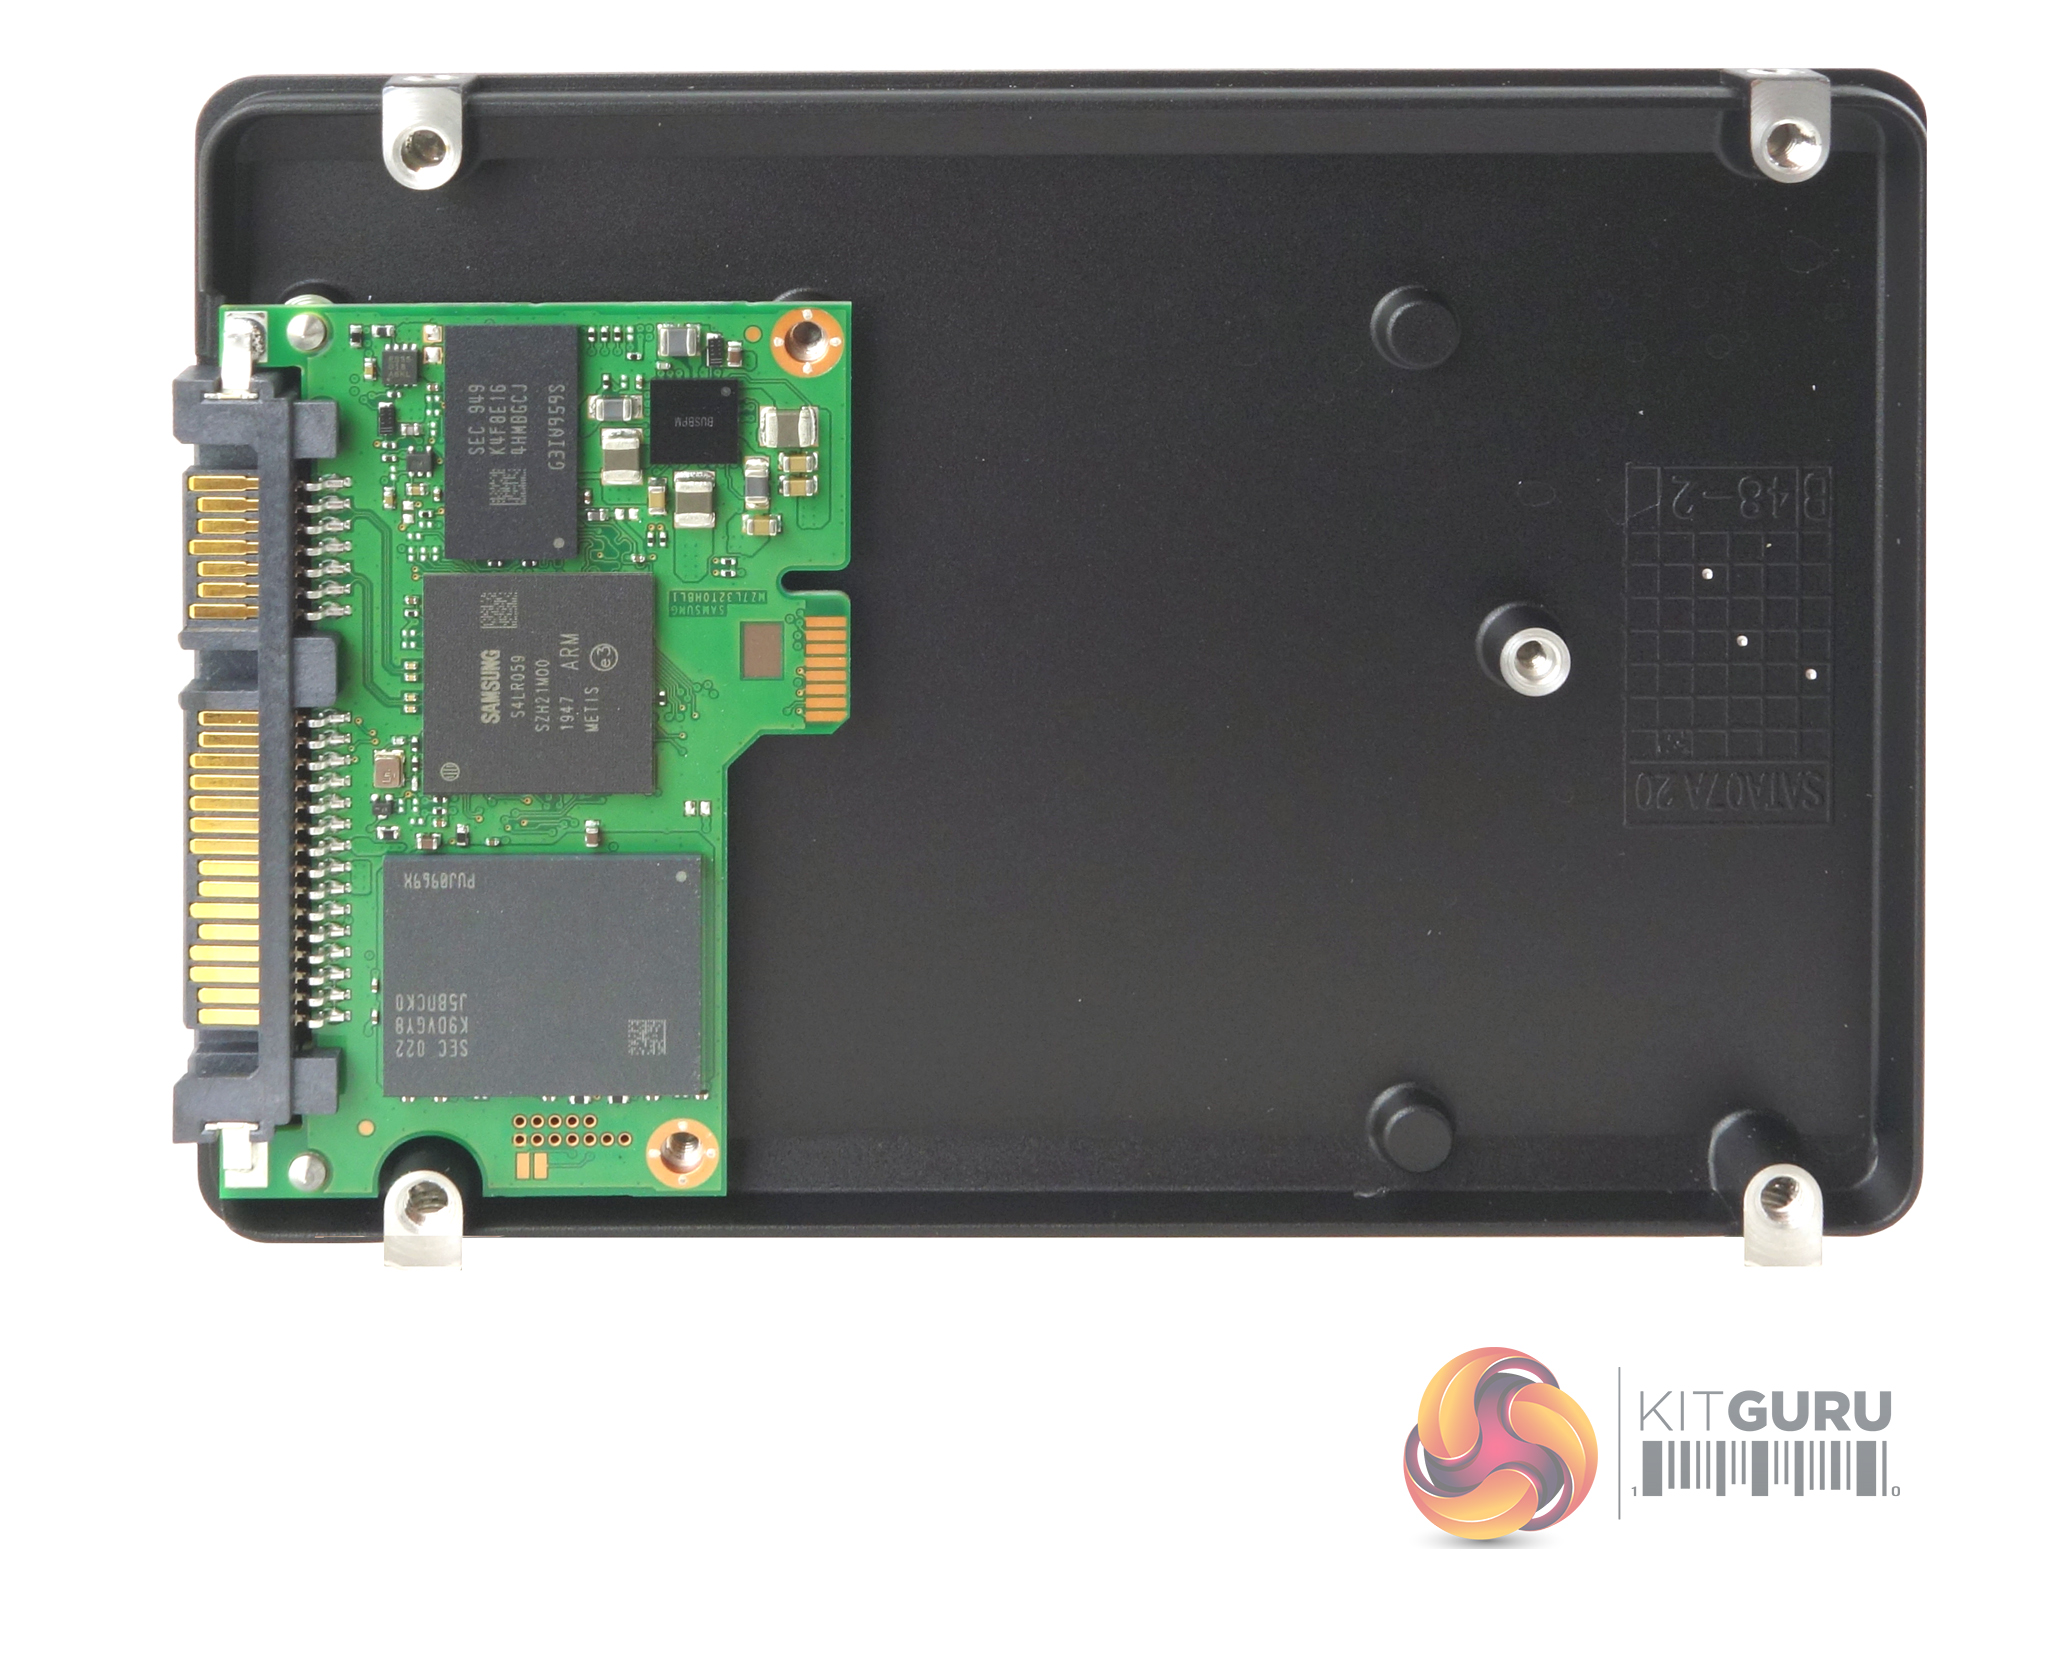
Remember the days when a 1TB drive meant a full-length PCB crammed with NAND chips. Not so the SSD 870 EVO, it has a tiny PCB, with just three major components on it; the 8-channel MKX controller (labelled S4LR059), a single 1xx layer V-NAND package (K90VGY8) and a 1GB LP-DDR4-1866 DRAM cache IC.
For testing, the drives are all wiped and reset to factory settings by HDDerase V4. We try to use free or easily available programs and some real-world testing so you can compare our findings against your own system.
This is a good way to measure potential upgrade benefits.
Main system:
Intel Core i7-7700K with 16GB of DDR4-3200 RAM, Sapphire R9 390 Nitro and an Asus Prime Z270-A motherboard.
Other drives:
Crucial BX100 1TB
Crucial BX200 960GB
Crucial M550 1TB
Crucial MX200 1TB
Crucial MX300 2TB
Crucial MX300 Limited Edition 750GB
Integral SVR-PRO 100 4TB
Kingston SSDNow V310 960GB
Kingston UV500 960GB
Kioxia Exceria 960GB
Kioxia TR200 960GB
Samsung SSD840 EVO 1TB
Samsung SSD850 EVO 1TB
Samsung SSD860 EVO 4TB
Samsung SSD860 QVO 4TB
Samsung SSD860 PRO 4TB
Samsung SSD 870 QVO 4TB
Seagate FireCuda 120 2TB
SK hynix SE3010 960GB
Ultima Pro X 960GB
Software:
Atto Disk Benchmark.
CrystalMark 6.0.2 / 7.0.0
AS SSD.
IOMeter.
PCMark 10
All our results were achieved by running each test five times with every configuration this ensures that any glitches are removed from the results. Trim is confirmed as running by typing fsutil behavior query disabledeletenotify into the command line. A response of disabledeletenotify =0 confirms TRIM is active.
CrystalDiskMark is a useful benchmark to measure theoretical performance levels of hard drives and SSD’s. We are using V5.0.3.
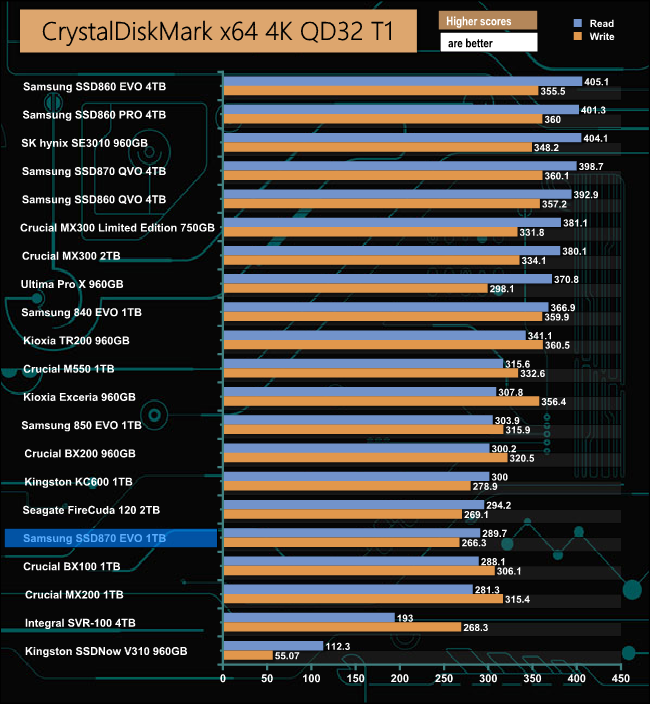
Samsung's SSD 870 EVO didn't seem to handle CrystalDiskMark’s deeper queue depth 4K test too well as sits in the bottom third of our results chart. But the Sequential performance results confirm the official read and write maximum figures of 560MB/s and 530MB/s respectively.
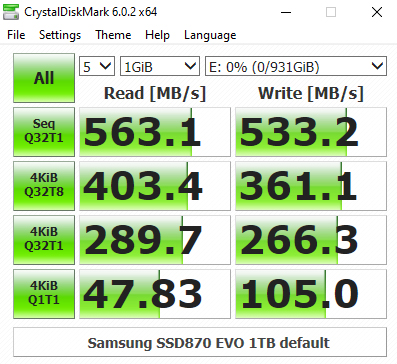
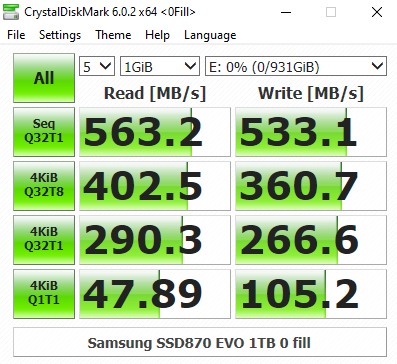
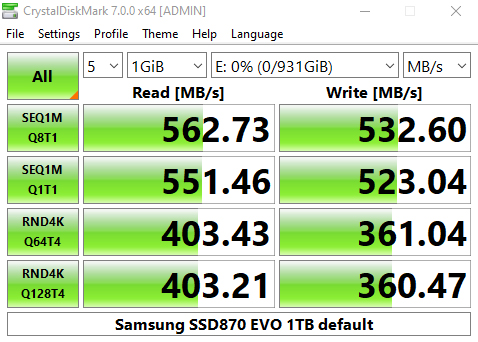
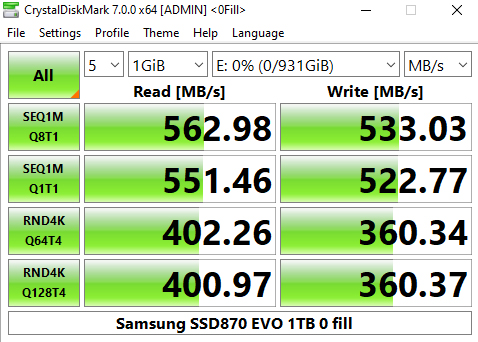
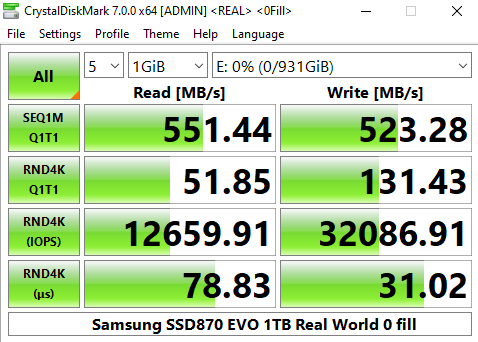
Once again we could confirm those official Sequential figures with CrystalDiskMark 7. Looking at the two benchmark result screens it appears that the controller in the SSD 870 EVO doesn't have a preference in the type of data it is being asked to work with.
CrystalDiskMark 7 includes a couple of profiles that can be used for testing – Peak Performance and Real World. The result screens for these two profiles not only display MB/s results but also IOPS and latency.
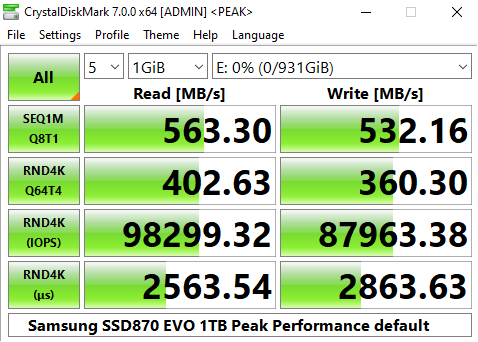
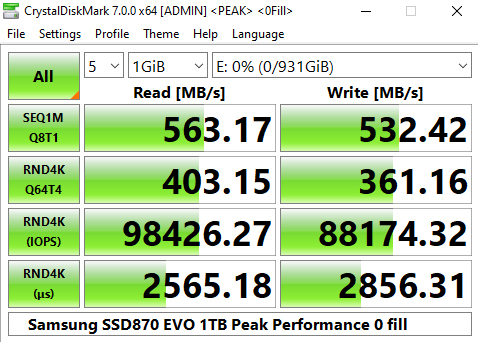
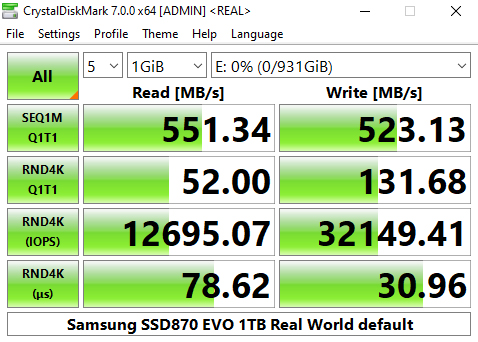
Looking at the Peak Performance results for Sequential read/write performance we could again, confirm both official Sequential performance figures. The drive is rated up to 560MB/s for reads and up to 530MB/s for writes. Under testing the 1TB Samsung SSD 870 EVO produced read/write figures of 563MB/s and 532MB/s respectively.
Samsung quote 4K random performance for the drive as up to 98,000 IOPS for reads and up to 88,000 IOPS for writes at a QD of 32. In the default Peak Performance profile, the best read figure produced by the drive was 98,299 IOPS with writes at 87,963 IOPS, confirming the official figures.
We also used CrystalDiskMark 7 to test the random performance of the drive at lower queue depths (QD1 – QD8 where most of the everyday workloads occur) using 1 to 4 threads.
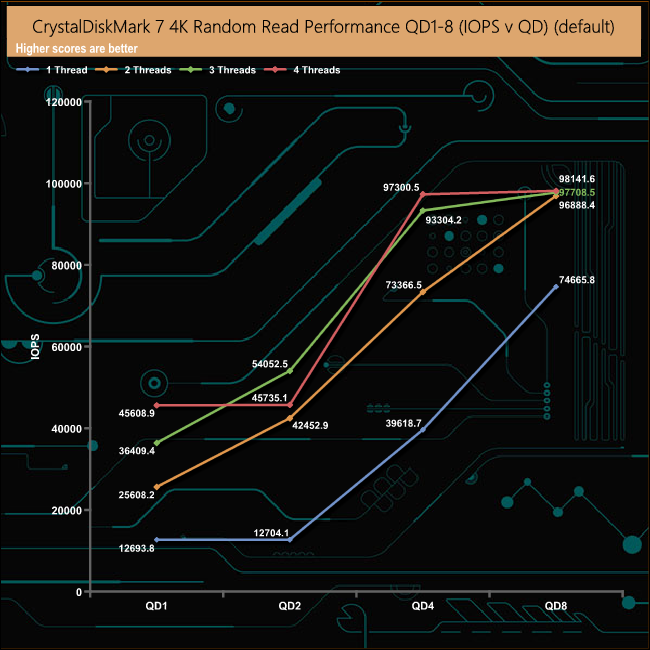
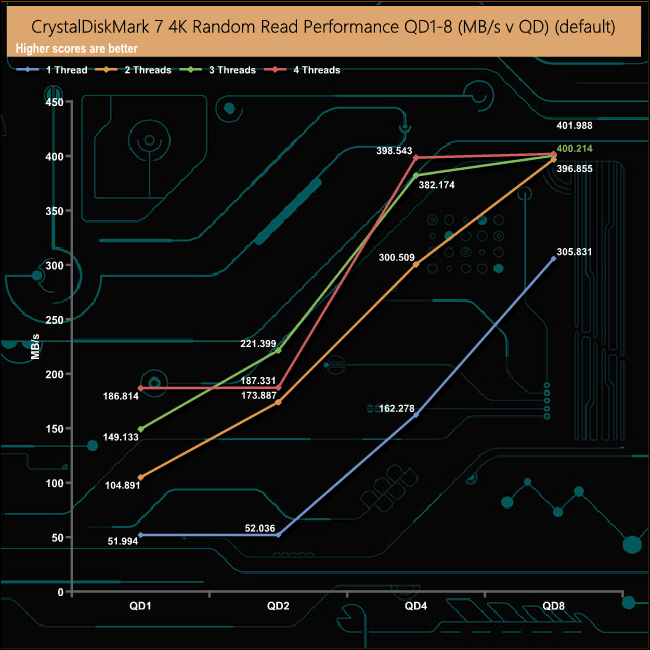
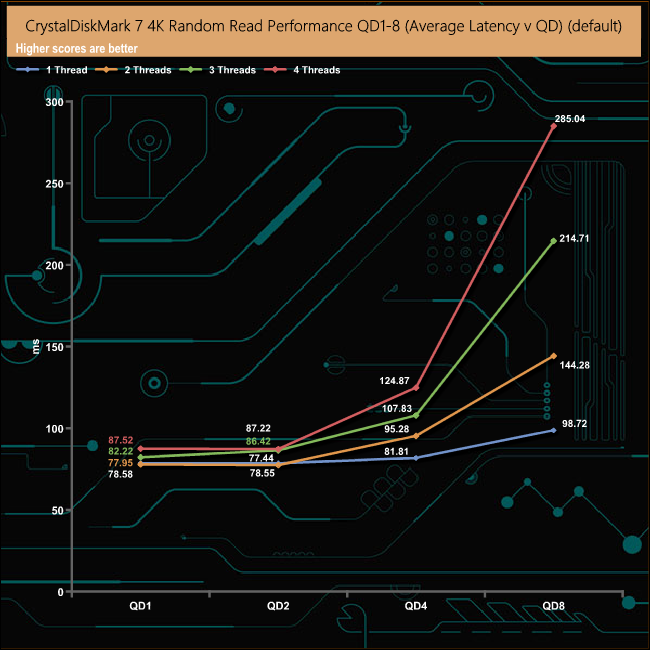
Using a single thread the drive produced a read figure of 74,665 IOPS (305MB/s) at the QD8 mark, but between QDs 1and 2 the performance plateaus out at just over 50MB/s before climbing pretty rapidly to reach the QD8 figure. It does much the same thing with 4-threads between QD's 1 and 2 but this time the performance also levels off between QDs 4 and 8.
Using 2, 3 and 4 threads the drive produced figures of 96,888 IOPS (396MB/s), 97,708 IOPS (400MB/s) and 98,141 IOPS (401MB/s) respectively at a QD of 8.
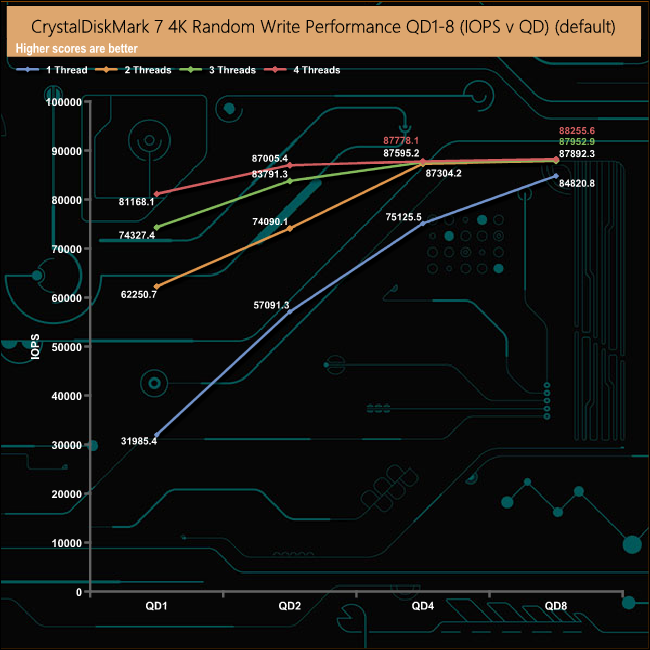
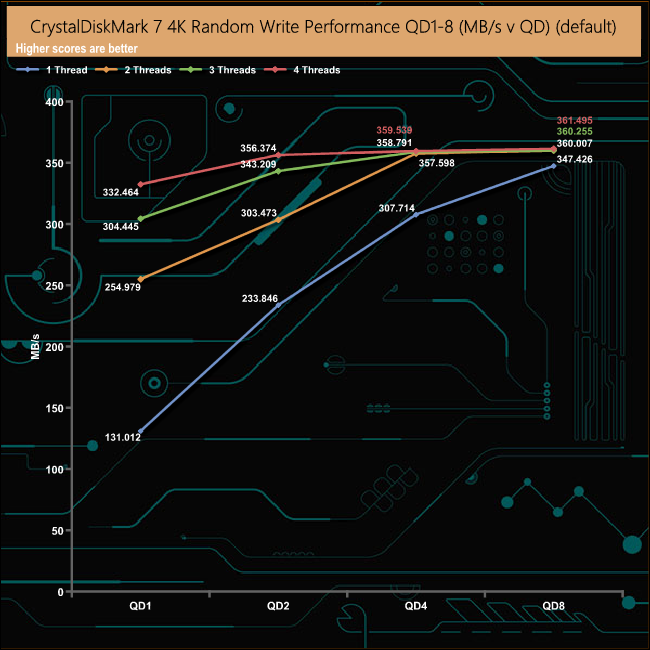
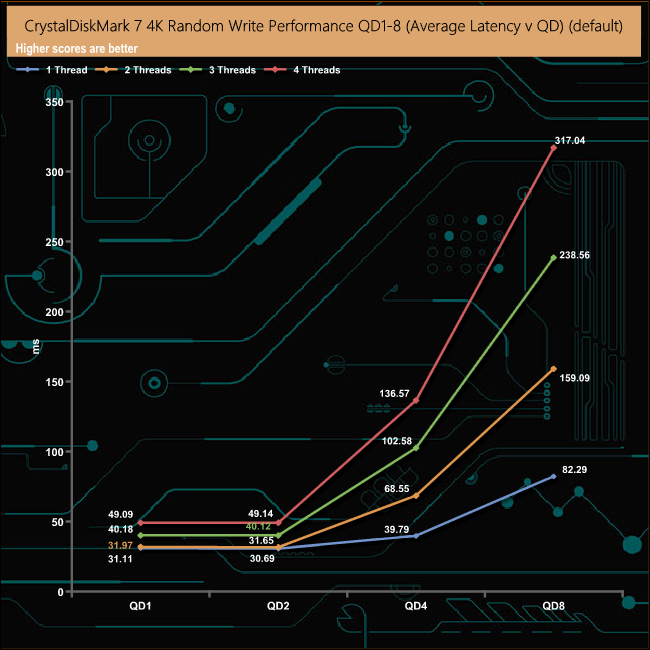
In the write tests, the drive produces the smoothest performance curve using just a single thread, with the drive moving from 31,985 IOPS at QD1 through to 84,820 IOPS at QD8. When tested using 2, 3 and 4-threads, the drive peaked at the QD4 mark for all of them, with the performance levelling off from QD4 to QD8.
The ATTO Disk Benchmark performance measurement tool is compatible with Microsoft Windows. Measure your storage systems performance with various transfer sizes and test lengths for reads and writes. Several options are available to customize your performance measurement including queue depth, overlapped I/O and even a comparison mode with the option to run continuously.
Use ATTO Disk Benchmark to test any manufacturers RAID controllers, storage controllers, host adapters, hard drives and SSD drives and notice that ATTO products will consistently provide the highest level of performance to your storage.
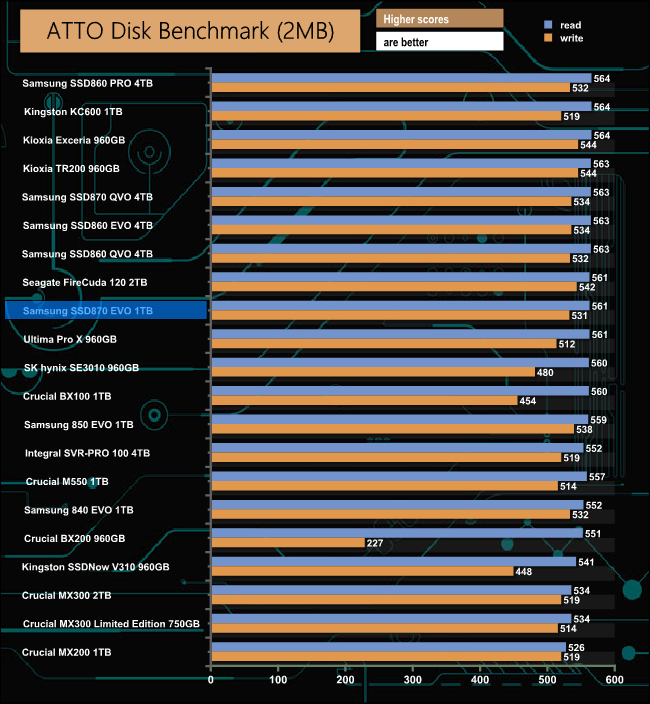
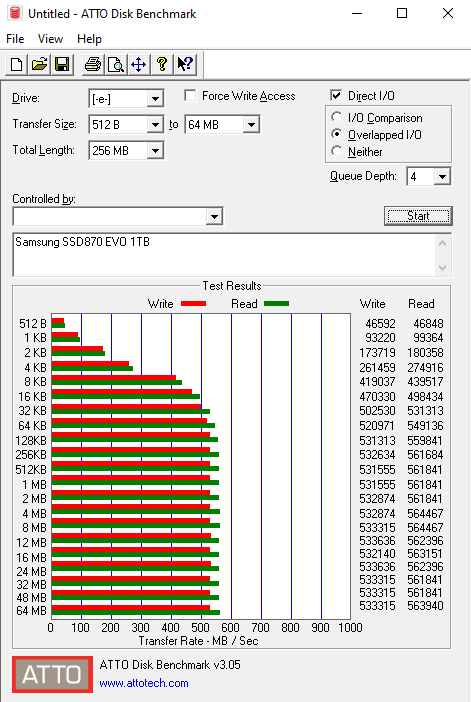
The official Sequential ratings for the SSD 870 EVO are up to 560MB/s for reads and up to 530MB/s for writes, which is par for the course with a modern SATA 6Gb/s drive. Testing with the ATTO benchmark confirmed these figures, with the drive producing a read figure of 561MB/s with writes at 531MB/s.
AS SSD is a great free tool designed just for benching Solid State Drives. It performs an array of sequential read and write tests, as well as random read and write tests with sequential access times over a portion of the drive. AS SSD includes a sub suite of benchmarks with various file pattern algorithms but this is difficult in trying to judge accurate performance figures.
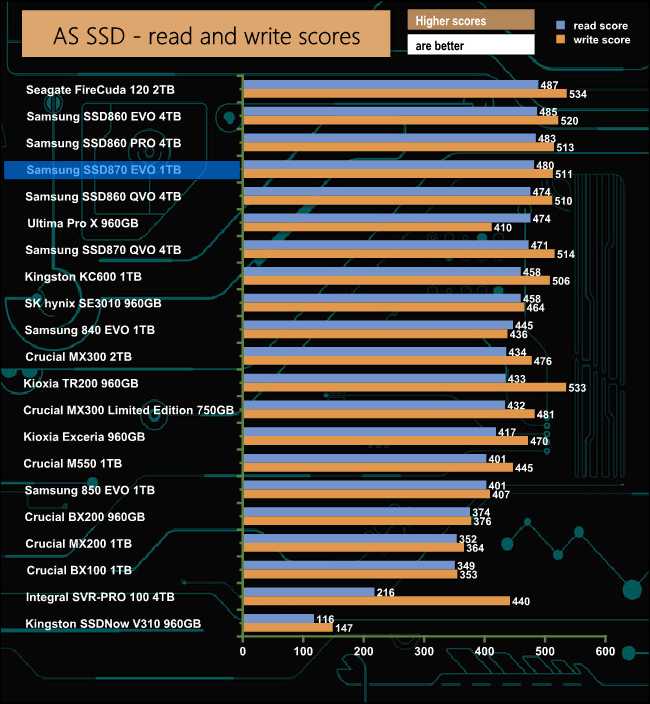
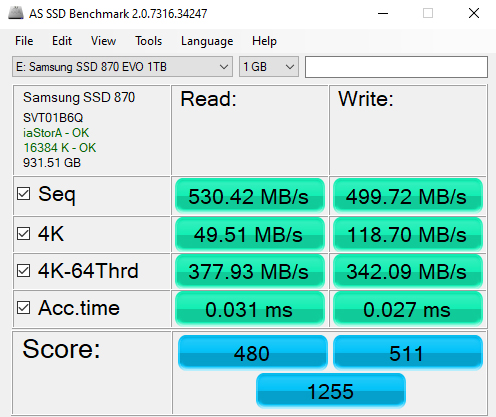
In the AS SSD benchmark, the SSD 870 EVO produced strong read and write scores of 480 and 511 respectively, good enough to put the 1TB model into the top five of drives we've tested to date.
IOMeter is another open-source synthetic benchmarking tool which is able to simulate the various loads placed on the hard drive and solid-state drive technology.
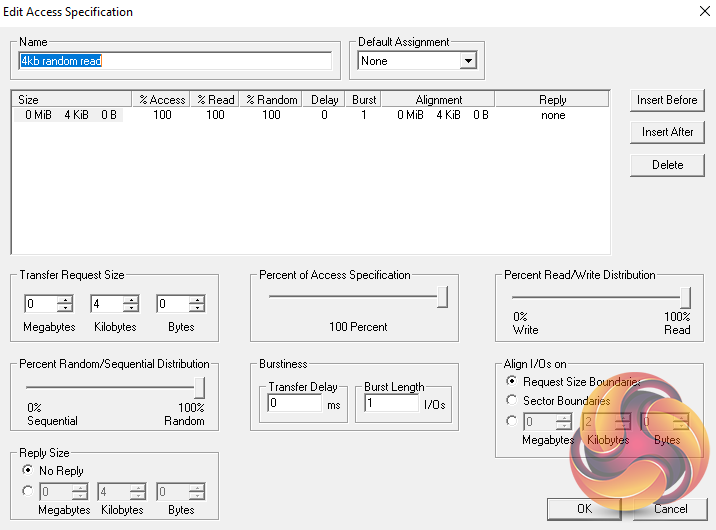
We test with both random read and write 4k tests, as shown above. There are many ways to measure the IOPS performance of a Solid State Drive, so our results will sometimes differ from the manufacturer’s quoted ratings. We do test all drives in exactly the same way, so the results are directly comparable.
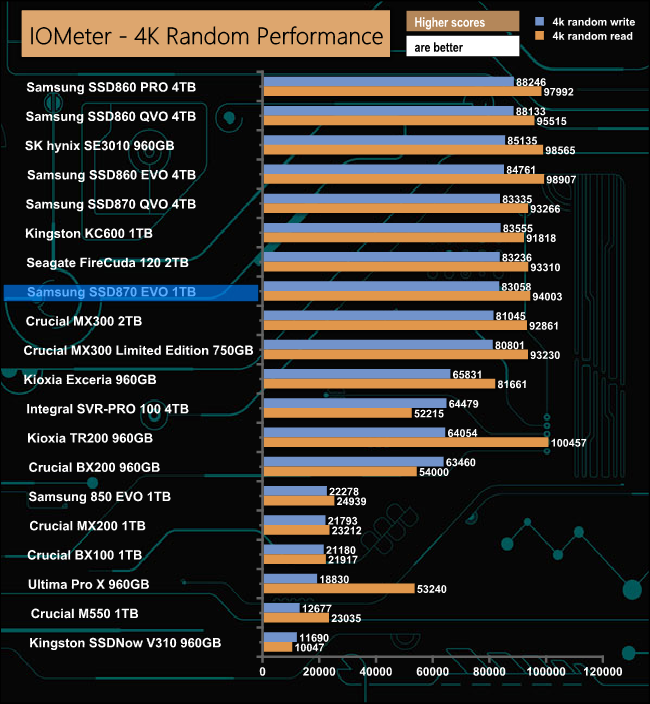
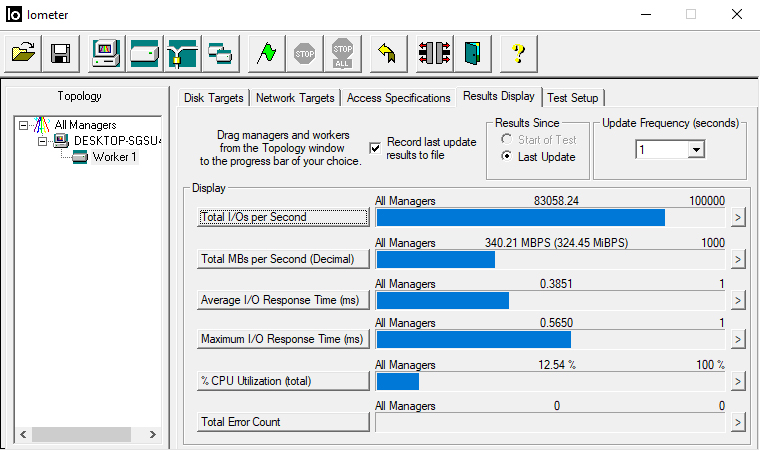
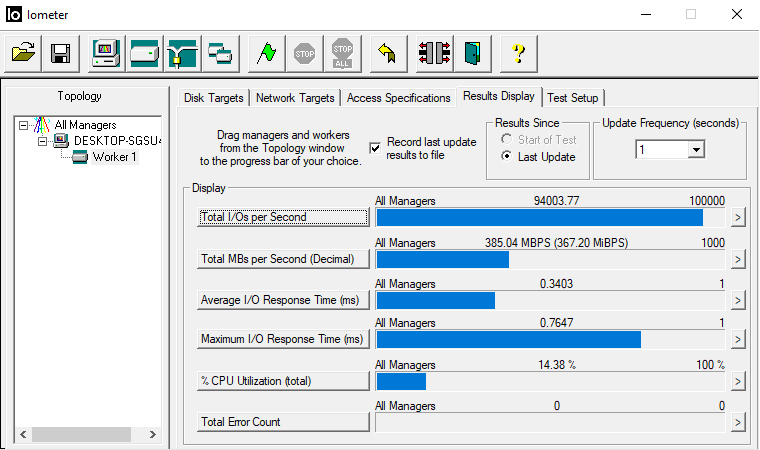
Random performance is quoted as up to 98,000 IOPS and 88,000 IOPS for read and writes respectively at QD32. We couldn't quite get to the maximum figures with the review drive producing figures of 94,003 IOPS and 83,058 IOPS for read and writes respectively at a QD of 32.
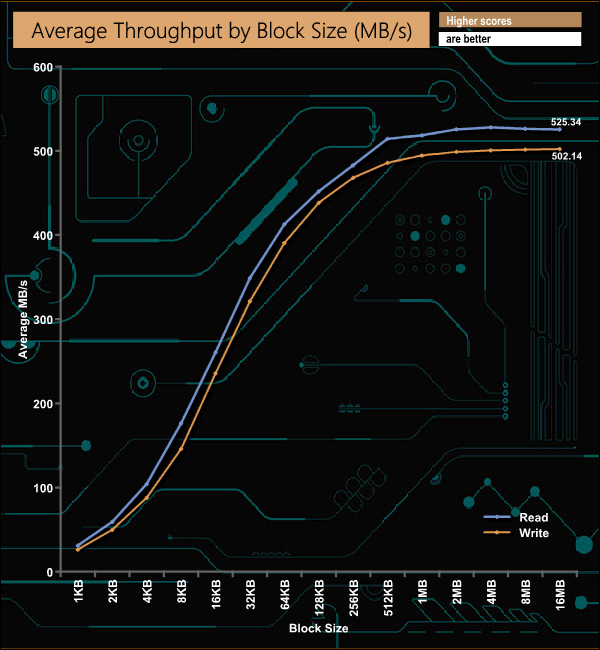
In our throughput tests, peak reads came at the 4K block mark at 527MB/s before dropping slightly finish the test run at 525.34MB/s. Writes peaked at the end of the test at 502.14MB/s, both these peak figures are a bit shy of the official 560MB/s for reads and up to 530MB/s for writes.
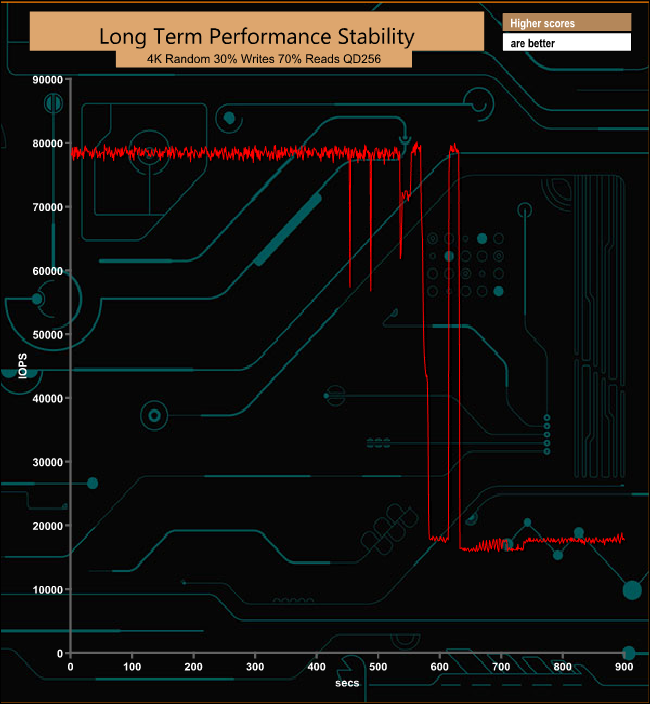
For the long term performance stability test, we set the drive up to run a 15-minute 4K random test with a 30% write, 70% read split, at a Queue Depth of 256 over the entire disk. The 1TB Samsung SSD 870 EVO averaged 54,414 IOPS for the test with a performance stability of a very useful 72%.
The PCMark 10 Full System Drive Benchmark uses a wide-ranging set of real-world traces from popular applications and common tasks to fully test the performance of the fastest modern drives. The benchmark is designed to measure the performance of fast system drives using the SATA bus at the low end and devices connected via PCI Express at the high end.
The goal of the benchmark is to show meaningful real-world performance differences between fast storage technologies such as SATA, NVMe, and Intel’s Optane. The Full System Drive Benchmark uses 23 traces, running 3 passes with each trace. It typically takes an hour to run.
Traces used:
Booting Windows 10.
Adobe Acrobat – starting the application until usable.
Adobe Illustrator – starting the application until usable Adobe Premiere Pro – starting the application until usable.
Adobe Photoshop – starting the application until usable.
Battlefield V – starting the game until the main menu.
Call of Duty Black Ops 4 – starting the game until the main menu.
Overwatch – starting the game until main menu.
Using Adobe After Effects.
Using Microsoft Excel.
Using Adobe Illustrator.
Using Adobe InDesign.
Using Microsoft PowerPoint.
Using Adobe Photoshop (heavy use).
Using Adobe Photoshop (light use).
cp1 Copying 4 ISO image files, 20 GB in total, from a secondary drive to the target drive (write test).
cp2 Making a copy of the ISO files (read-write test).
cp3 Copying the ISO to a secondary drive (read test).
cps1Copying 339 JPEG files, 2.37 GB in total, to the target drive (write test).
cps2 Making a copy of the JPEG files (read-write test).
cps3 Copying the JPEG files to another drive (read test).

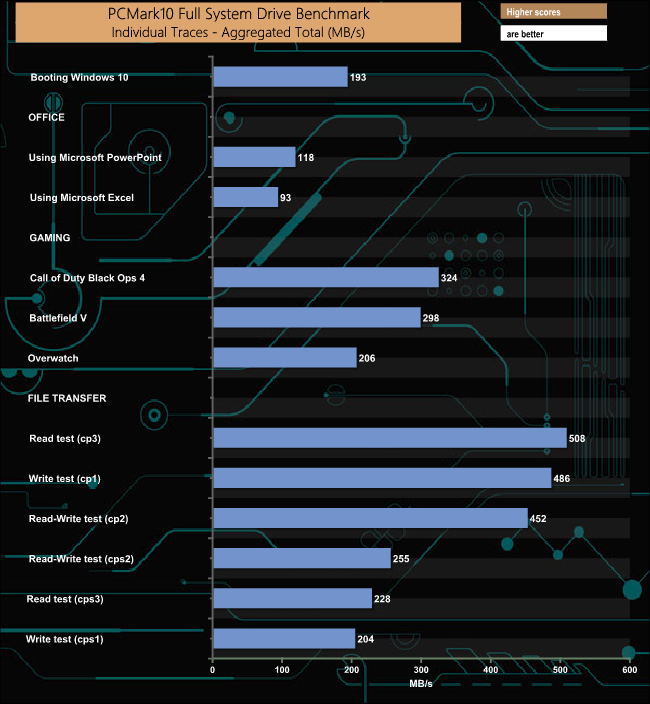
The best performance in the creative group of tests was the 339MB/s from the Adobe Photoshop heavy use test trace, while the SSD 870 EVO also showed fairly decent performance in the Call Of Duty Black Ops 4 (324MB/s) game test, as well as the cp3 read (508MB/s) the cp1 write (486MB/s) file transfer tests.
To test real-life performance of a drive we use a mix of folder/file types and by using the FastCopy utility (which gives a time as well as MB/s result) we record the performance of drive reading from & writing to a 256GB Samsung SSD850 PRO.
We use the following folder/file types:
- 100GB data file.
- 60GB iso image.
- 60GB Steam folder – 29,521 files.
- 50GB File folder – 28,523 files.
- 12GB Movie folder – (15 files – 8 @ .MKV, 4 @ .MOV, 3 @ MP4).
- 10GB Photo folder – (304 files – 171 @ .RAW, 105 @ JPG, 21 @ .CR2, 5 @ .DNG).
- 10GB Audio folder – (1,483 files – 1479 @ MP3, 4 @ .FLAC files).
- 5GB (1.5bn pixel) photo.
- BluRay Movie – 42GB.
- 21GB 8K Movie demos – (11 demos)
- 16GB 4K Raw Movie Clips – (9 MP4V files).
- 4.25GB 3D Printer File Folder – (166 files – 105 @ .STL, 38 @ .FBX, 11 @ .blend, 5 @ .lwo, 4 @ .OBJ, 3@ .3ds).
- 1.5GB AutoCAD File Folder (80 files – 60 @ .DWG and 20 @.DXF).
![]()
![]()
The Samsung SSD 870 EVO handled our life file transfer tests without any real problems, with most of the larger file size write transfers nudging 500MB/s mark. As is usually the case, the small files in the 60GB Steam, 50GB file and 10GB audio folders caused the performance to drop quite considerably.
We first saw Samsung's six-generation 1xx layer 3-bit MLC (TLC to you and me) V-NAND when we reviewed the PCIe Gen 4 SSD9 80 PRO drive (HERE), but now it features in a model series further down the food chain in the shape of the 2.5in SATA 6Gb/s SSD 870 EVO series. The SSD 870 EVO models pair up the new V-NAND with an in-house MKX eight-channel controller.
At 1xx layers, Samsung's 6th generation V-NAND has 40 per cent more cells than the previous 9x layered 5th generation Flash. Although Samsung doesn't actually state how many layers the new NAND is using when it was launched, they stated “This is achieved by building an electrically conductive mold stack comprised of 136 layers, then vertically piercing cylindrical holes from top to bottom, creating uniform 3D charge trap flash (CTF) cells.”, so there's 136 physical layers but no mention of how many memory layers.
In terms of performance, the Sequential read/write performance for the SSD 870 EVO is pretty much what you would expect from a SATA 6Gb/s drive these days. Samsung quote read & writes figures of up to 560MB/s and up to 530MB/s respectively. We could confirm those figures with the ATTO benchmark, our review sample producing 561MB/s for reads and 531MB/s for writes.
Random performance is quoted as up to 13,000 IOPS for reads and up to 36,000 IOPS at a QD1 and up to 98,000 IOPS and 88,000 IOPS for read and writes respectively at QD32. We couldn't quite match those QD32 figures with our tests but got pretty close at 94,003 IOPS for reads and 84,058 IOPS for writes.
To boost the write performance of the SSD 870 EVO, Samsung has turned to its tried and tested Intelligent TurboWrite technology, a technology which was first introduced in the SSD 960 EVO. Intelligent TurboWrite assigns a chunk of the NAND to run in SLC mode to act as a fast cache. The technology uses two types of cache, one pre-allocated (similar to the static TurboWrite of previous versions) and the other, dynamic or Intelligent TurboWrite. The pre-allocated cache in the 1TB SSD 870 EVO is 6GB in size with an Intelligent TurboWrite region of 36GB for a total of 42GB.
As with previous generations of EVO drives, Samsung has given the SSD 870 EVO strong encryption features as it supports AES 256-bit, TCG/Opal V2.0 and IEEE1667 technologies.
We don't yet have a buy link for the drive, but the UK MSRP for the 1TB SSD 870 EVO is £135.49.
Discuss on our Facebook page HERE.
Pros
- 5-year warranty.
- Strong built-in encryption.
- Overall performance.
Cons
- Price could do with a bit of tweaking.
KitGuru says: After the launch of the SSD 980 PRO, it hasn't taken Samsung very long to update the EVO series of SATA drives with their latest 6th generation of V-NAND. The introduction of 1xx layer NAND to the 2.5in drive format could open the way to some very large capacity drives in the not too distant future.