
Samsung has been very quiet on the SSD front lately, but all that has changed with the launch of the SSD860 series of drives aimed at the consumer market space – the successor to the popular SSD850 series.
The SSD860 EVO uses Samsung's latest 64-layer 3-bit MLC (that's TLC to you and me), V-NAND along with a new controller, the MJX. Technical details on the new controller are pretty sketchy to say the least at the time of writing this review.
The 860 EVO is available in five capacities; 250GB, 500GB, 1TB, 2TB and the flagship 4TB – the model we have for review today. It ships in three formats, the standard 2.5in, M.2 and mSATA which basically covers all the bases. The 4TB drive is equipped with 4GB of LPDDR4 cache (the 2TB drive has 2GB, the 1TB model 1GB and both the 512GB and 250GB drives have to make do with 512MB.)
Quoted performance across the range for the 860EVO is 550MB/s for Sequential reads and 520MB/s for writes. 4K random read performance is stated as up to 98,000 IOPS with writes at up to 90,000 IOPS.
The most striking aspect of the 4TB SSD860 EVO is the rated endurance. At 2,400TB TBW it's an 8 times improvement over the previous SSD850 EVO. To further add peace of mind Samsung stand behind the drive with a 5 year warranty.
Physical Specifications:
Usable Capacities: 4TB
NAND Components: Samsung 64-layer TLC V-NAND
NAND Controller: Samsung MJX
Cache: 4GB LPDDR4
Interface: Serial ATA (SATA) 6Gb/s (SATA III): SATA 6Gb/s
Form Factor: 7mm, 2.5in
Dimensions: 100 x 69.85 x 6.8mm
Firmware Version: RVT01B6Q
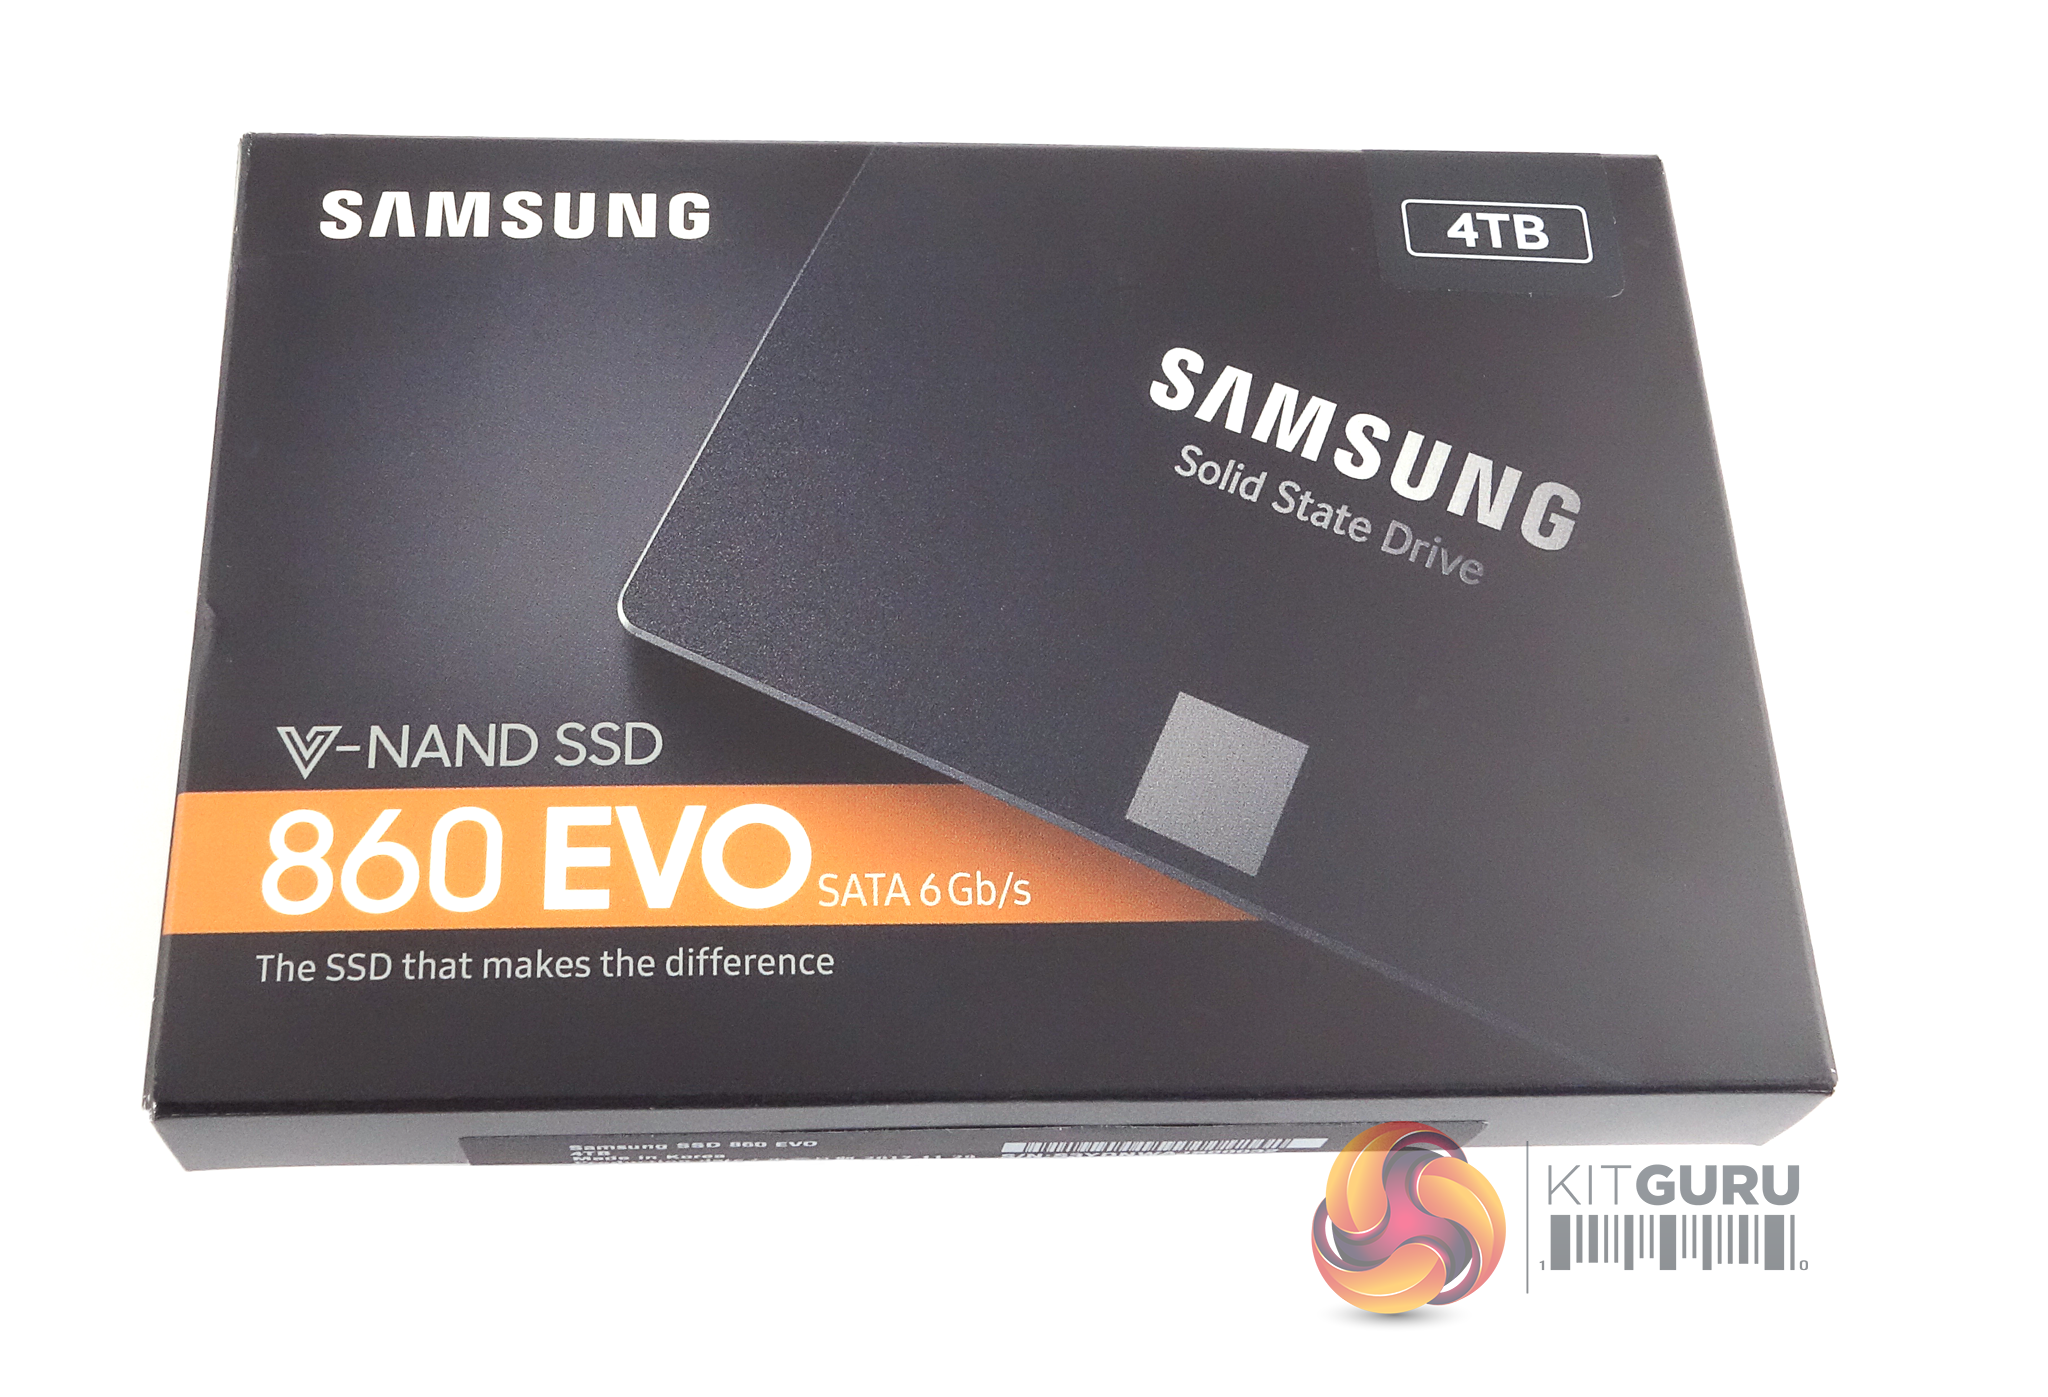
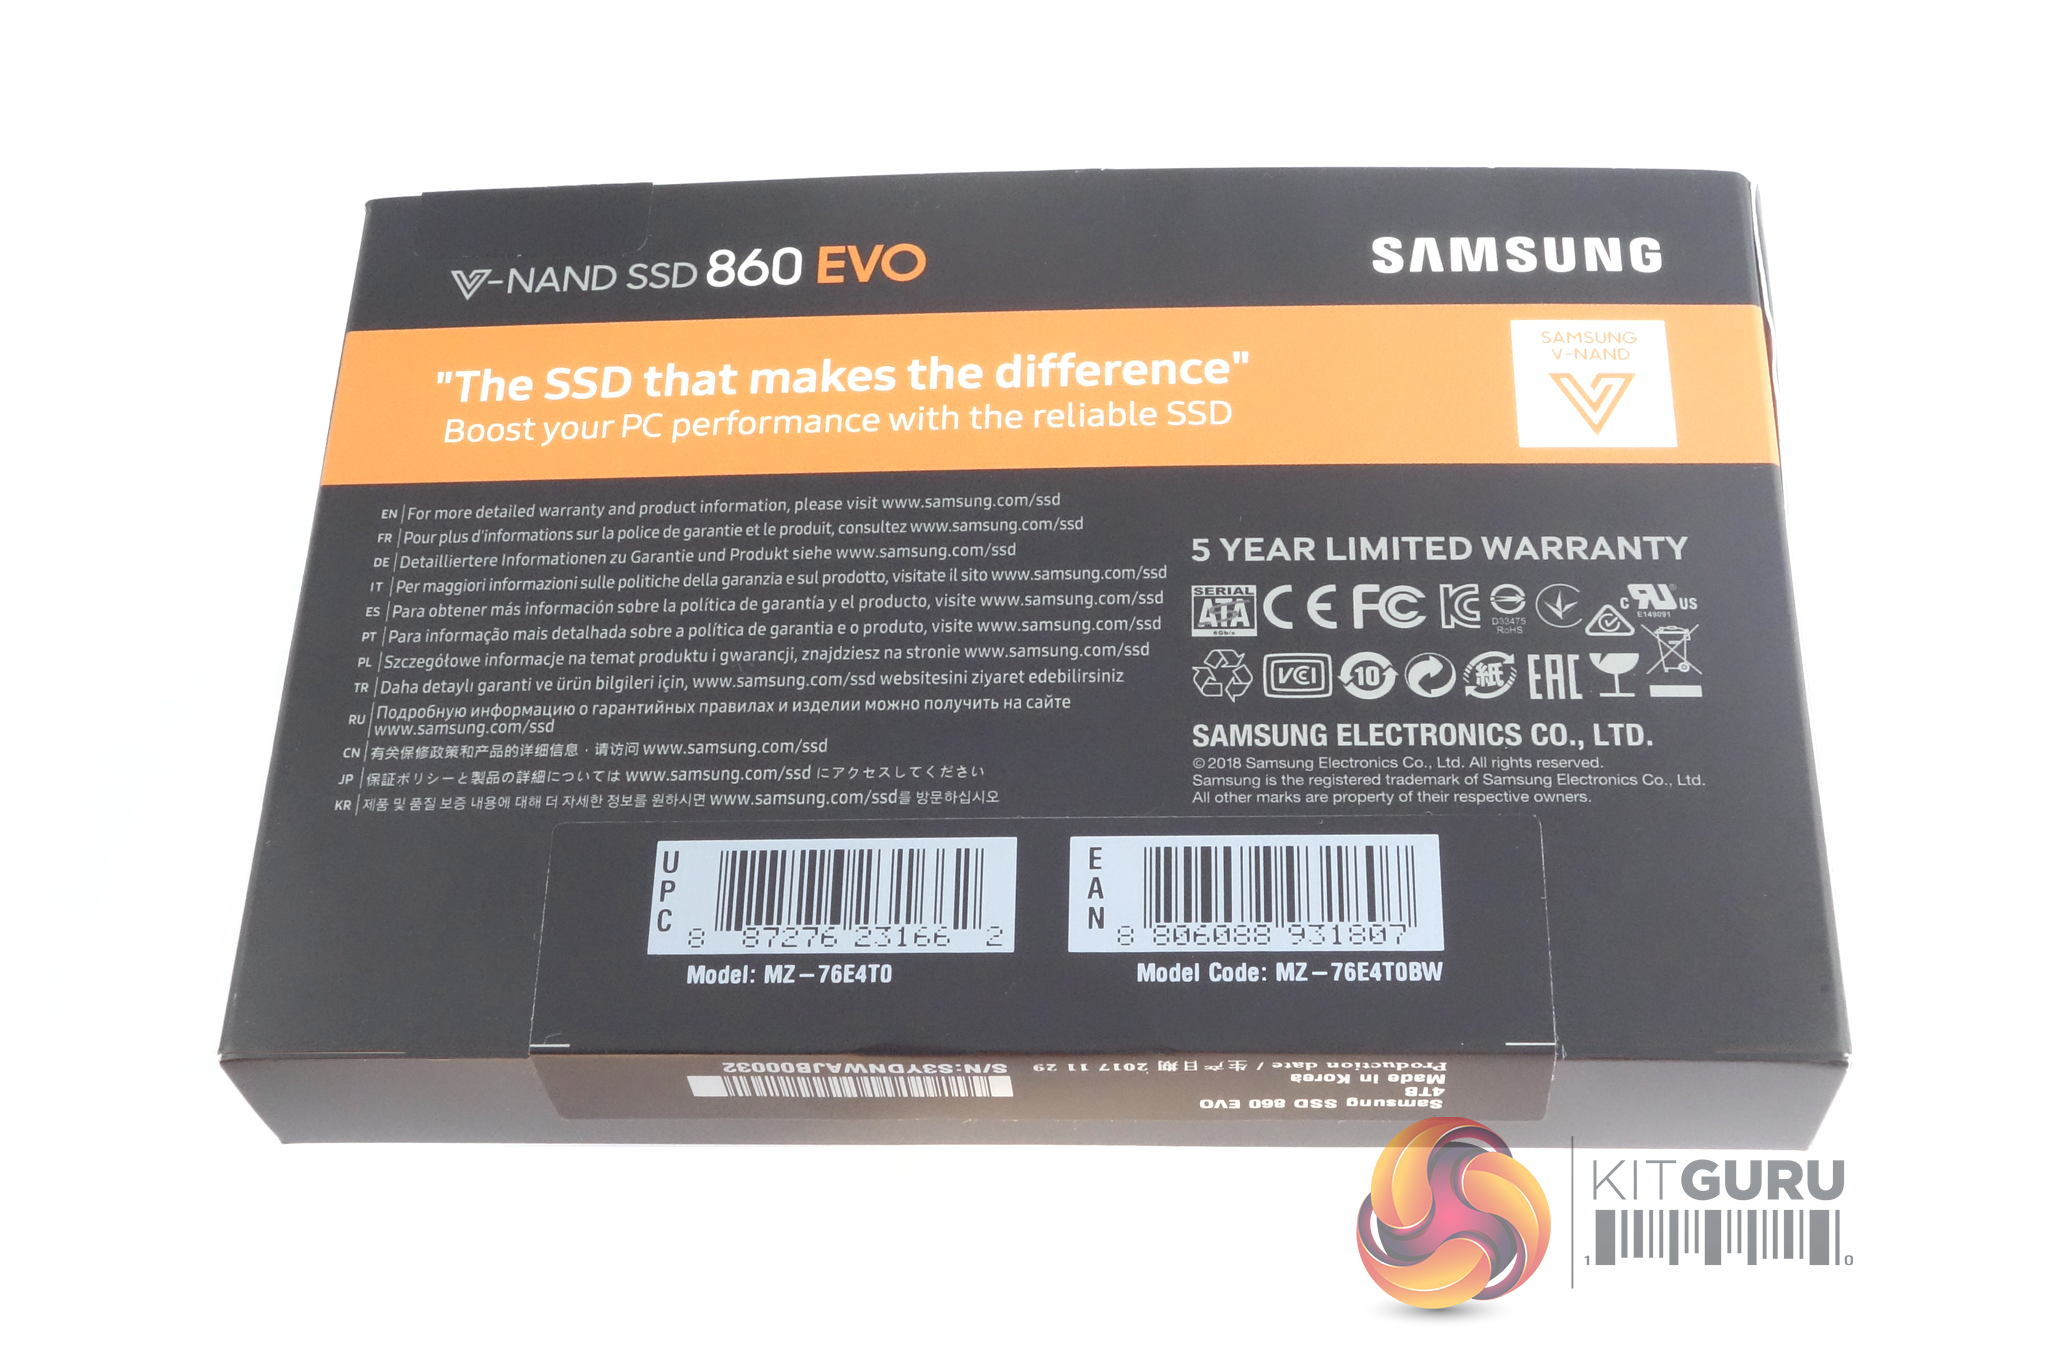
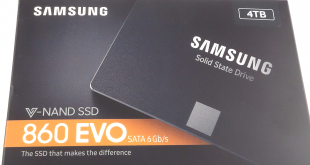
The Samsung SSD860 EVO 4TB comes in a compact black box with an image of the drive on the front along with information about the drive. It uses V-NAND and has a SATA 6Gb/s interface.
There is a sticker on the top left of the box which indicates the capacity of the drive. The rear of the box has multilingual marketing notes and the fact the drive has a 5 year warranty.
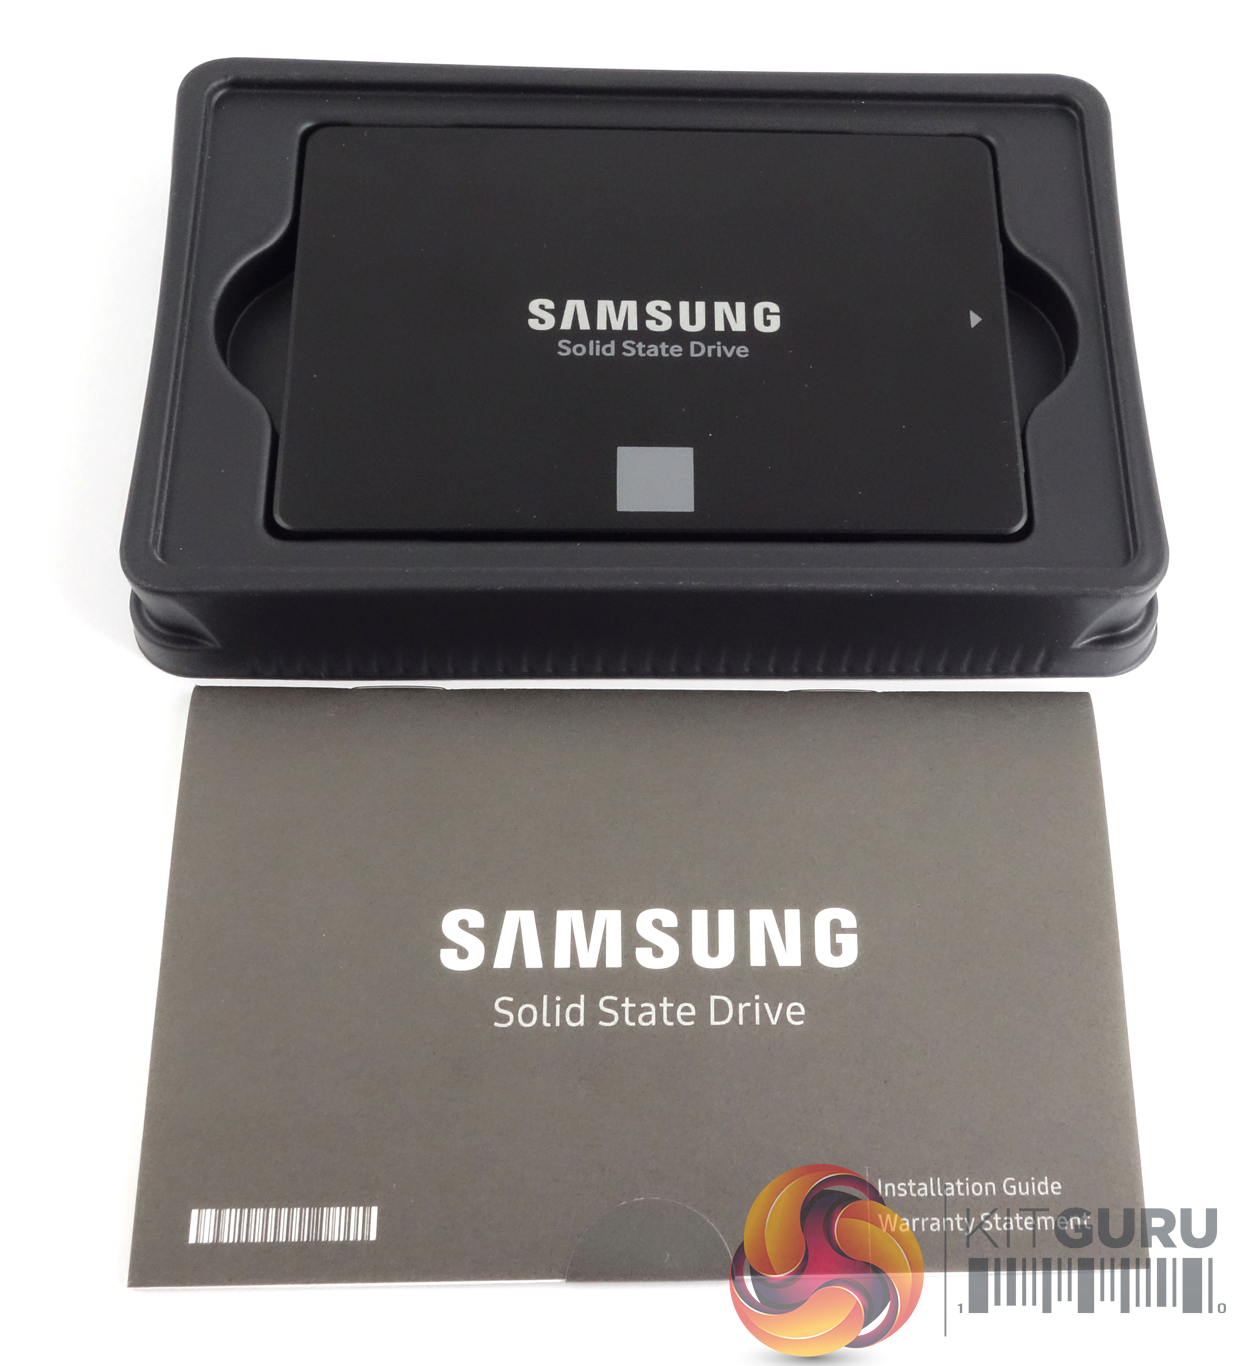
The drive sits in a tray to keep it secure during transit and the only other thing in the box is an installation/ warranty guide.
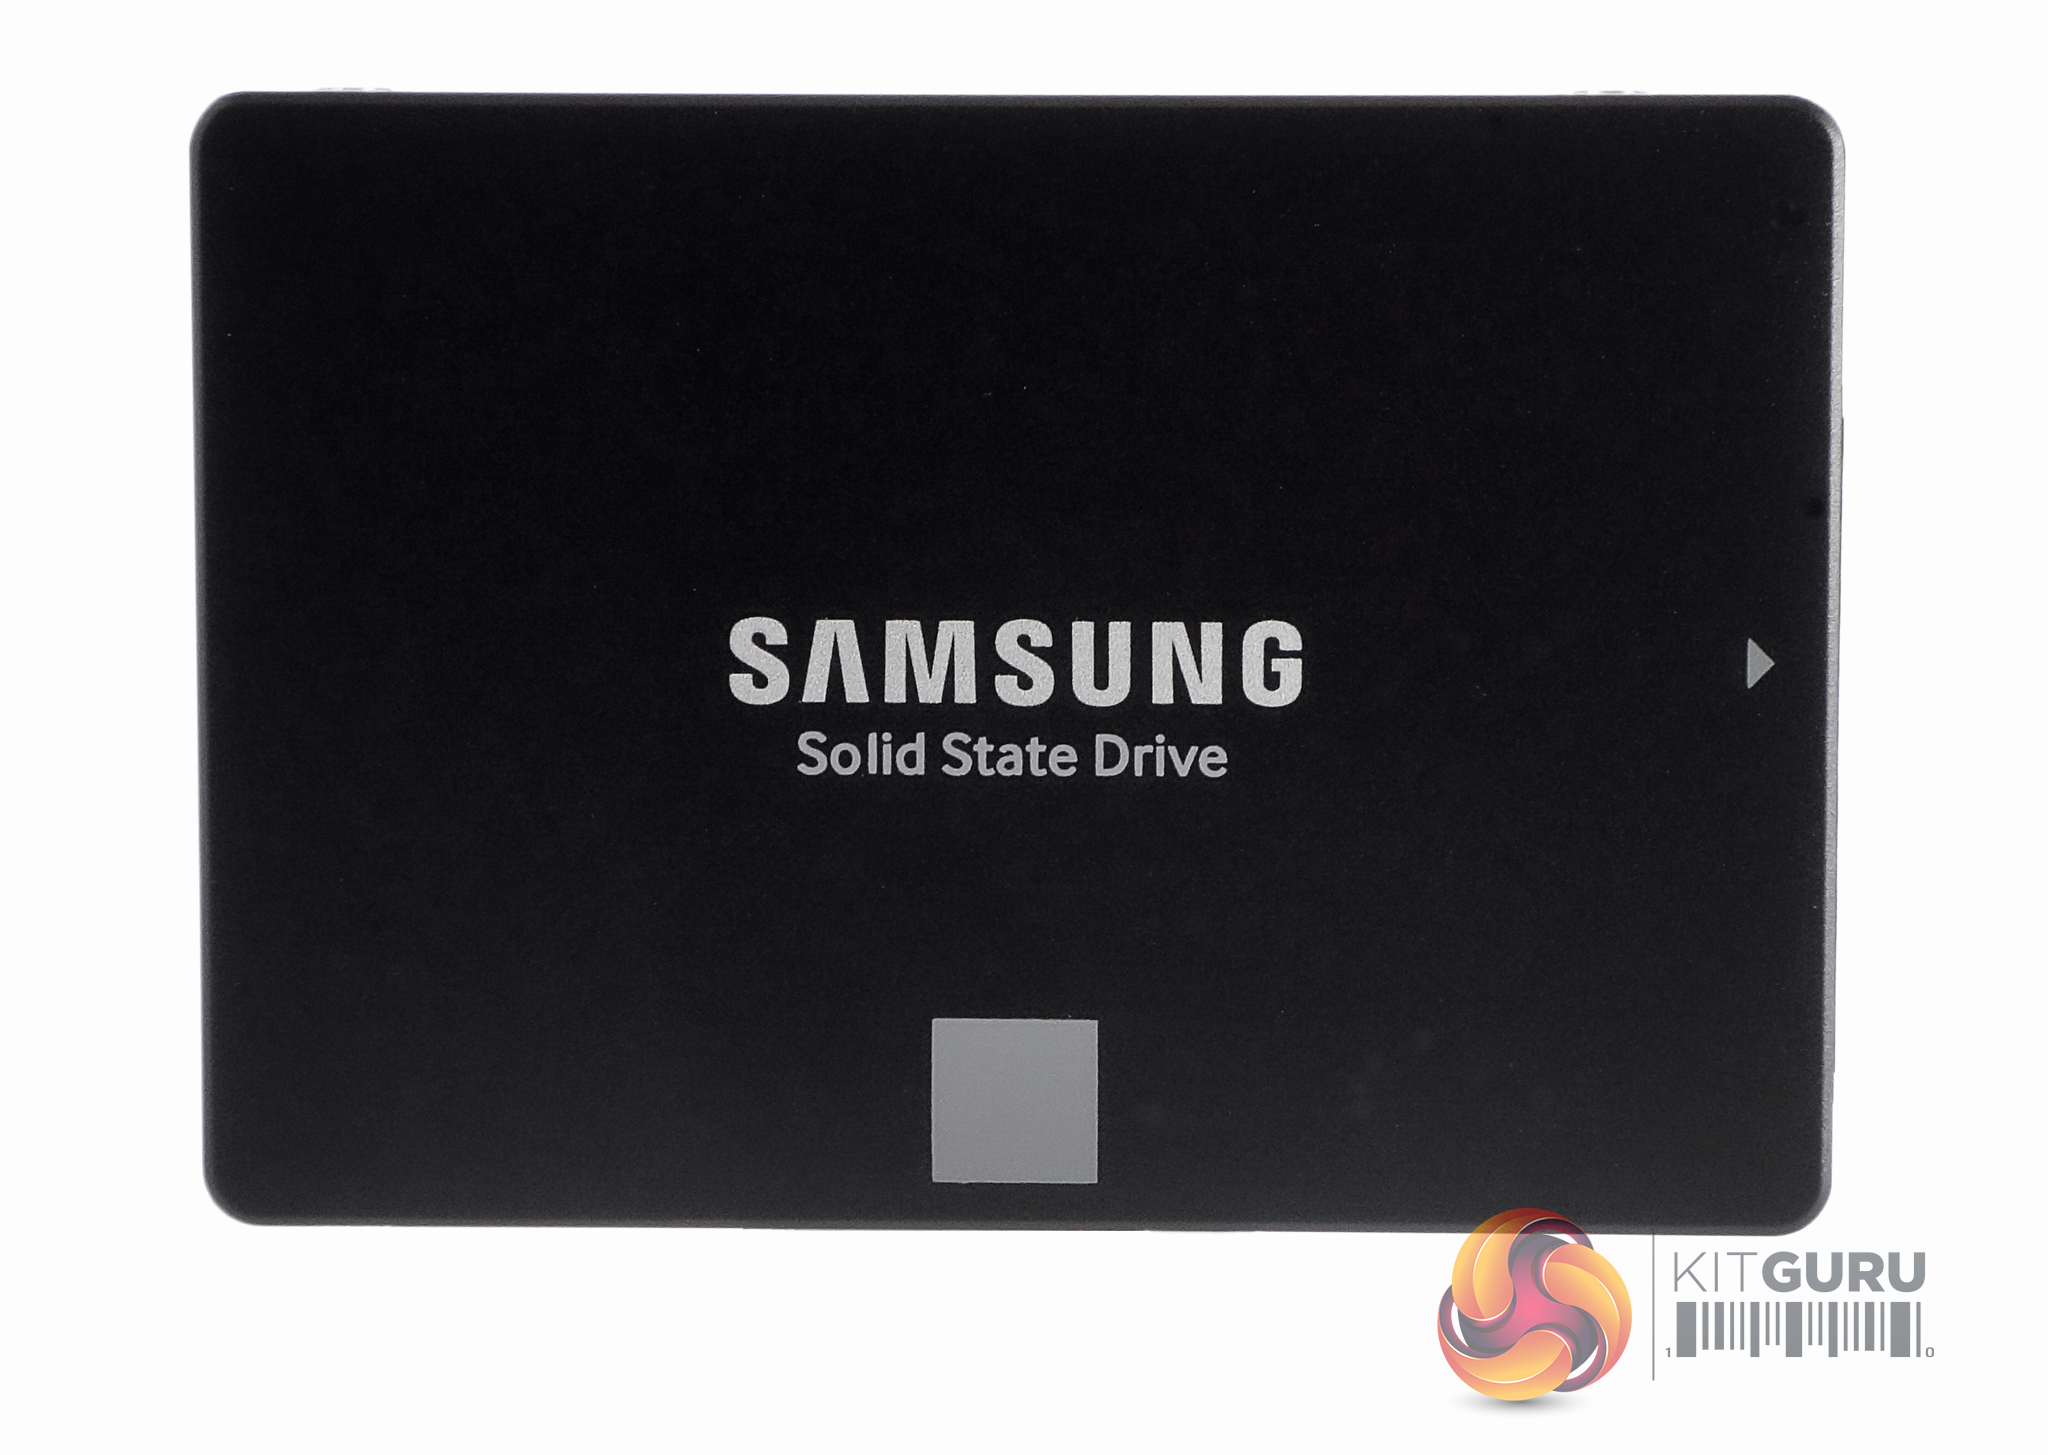
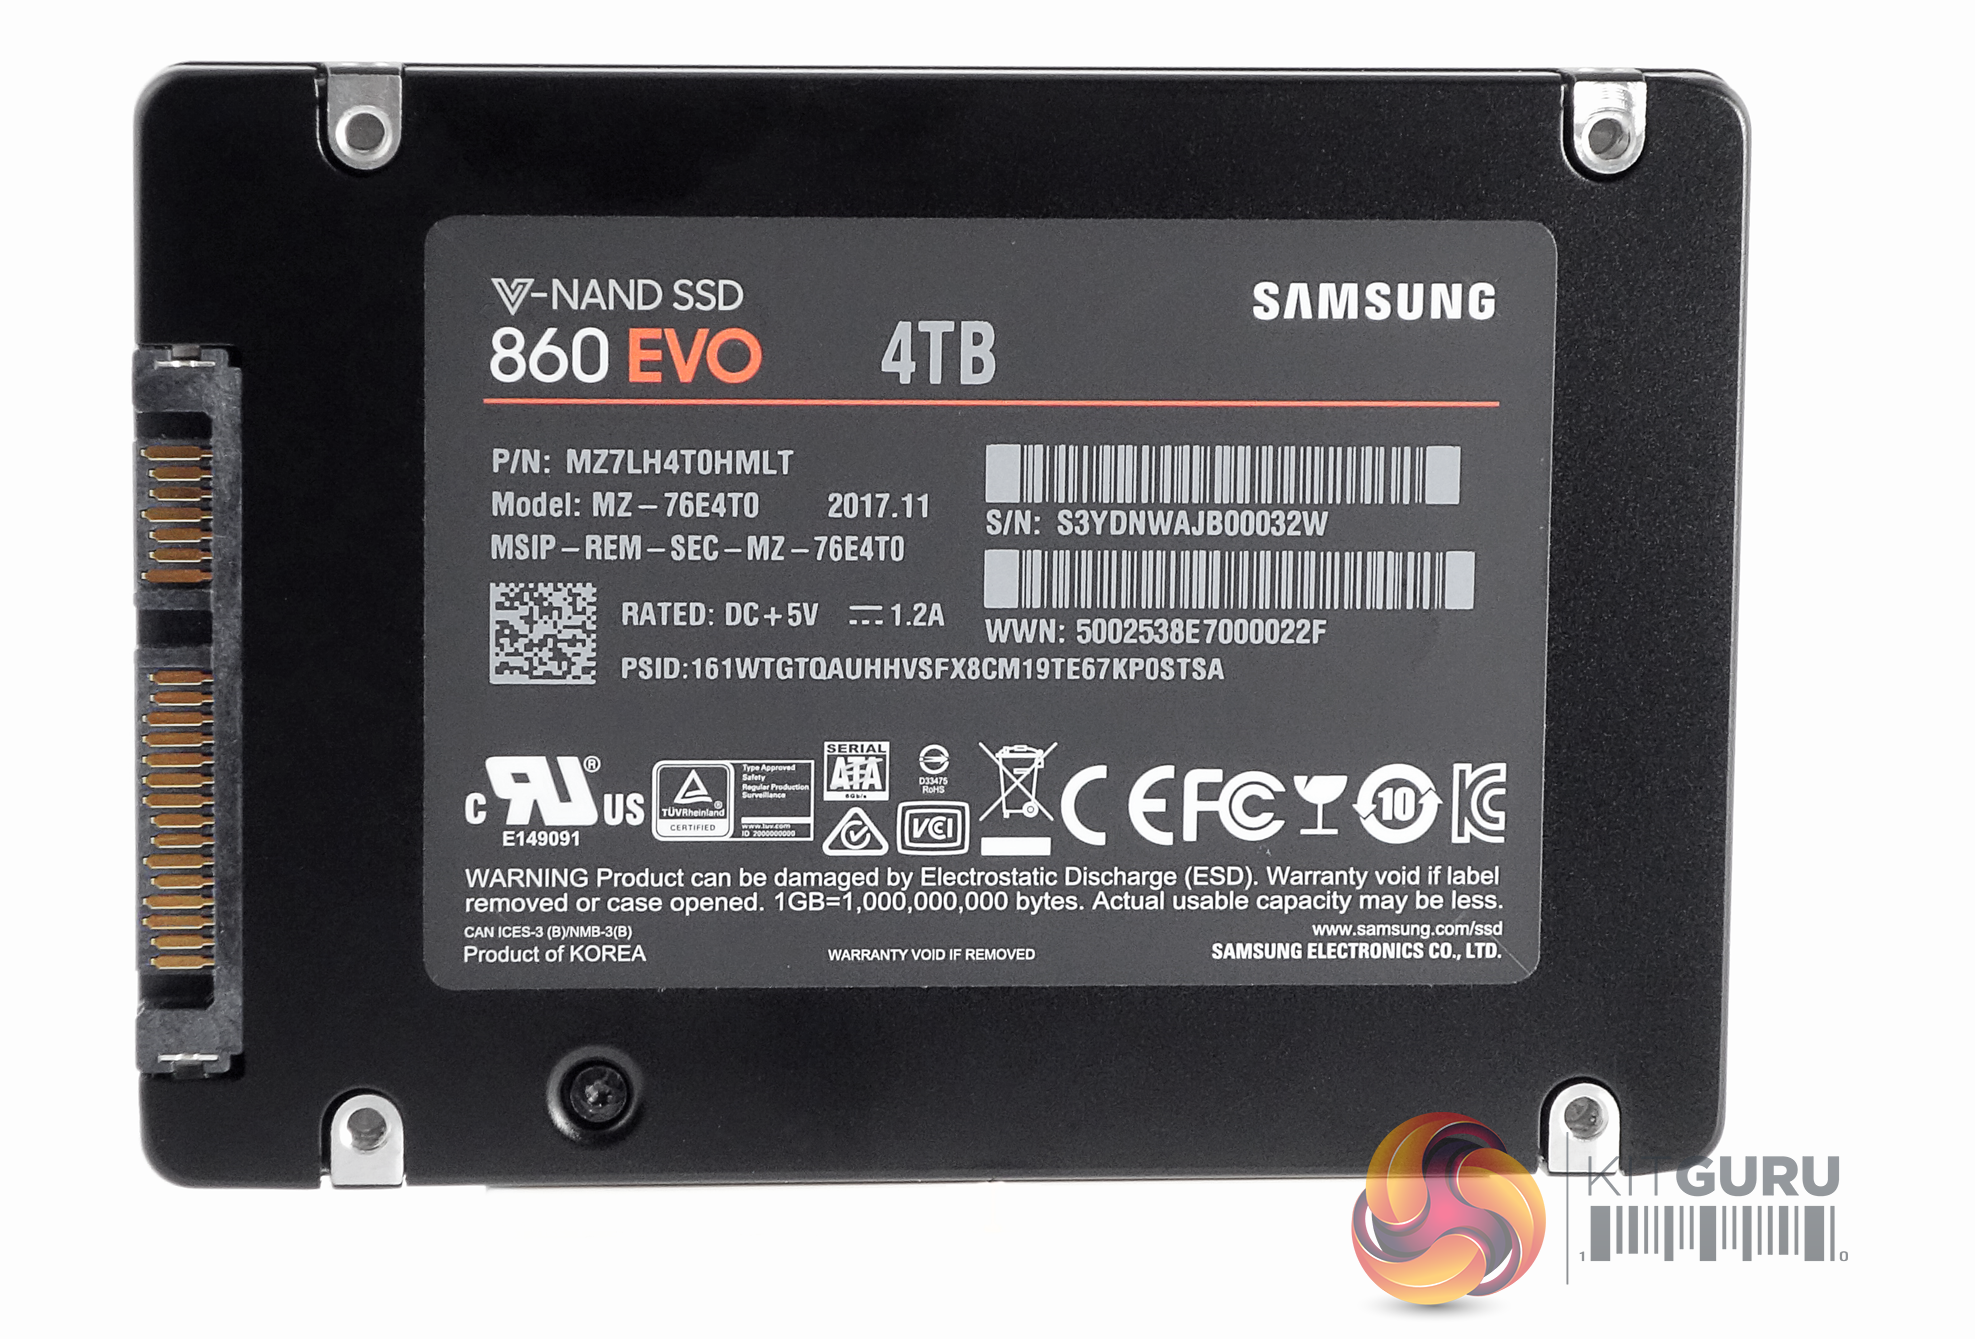
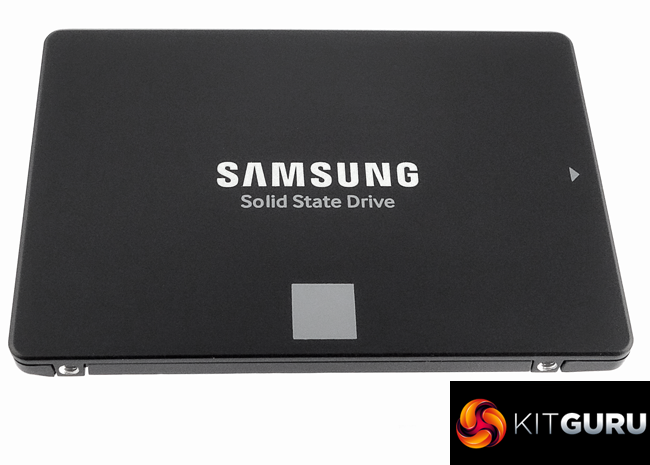
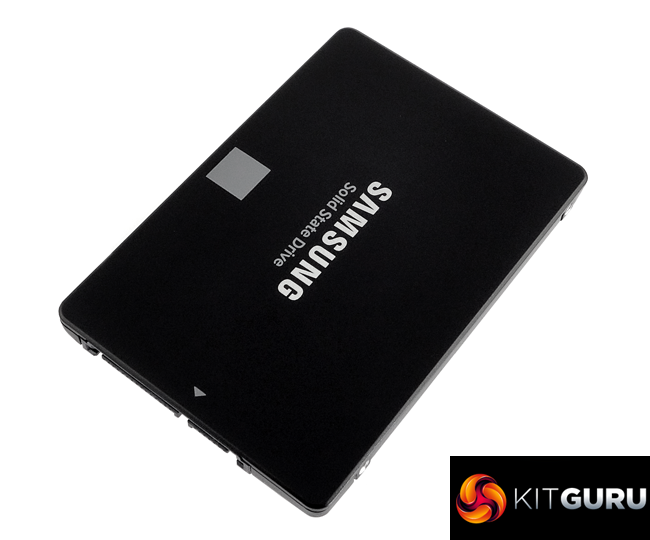
The drive is built on a standard 2.5in, 7mm format. Unfortunately we couldn't open the enclosure to show you the internals as the screws on our sample seemed to have glue over them. As the sample had to be returned intact, we moved on.
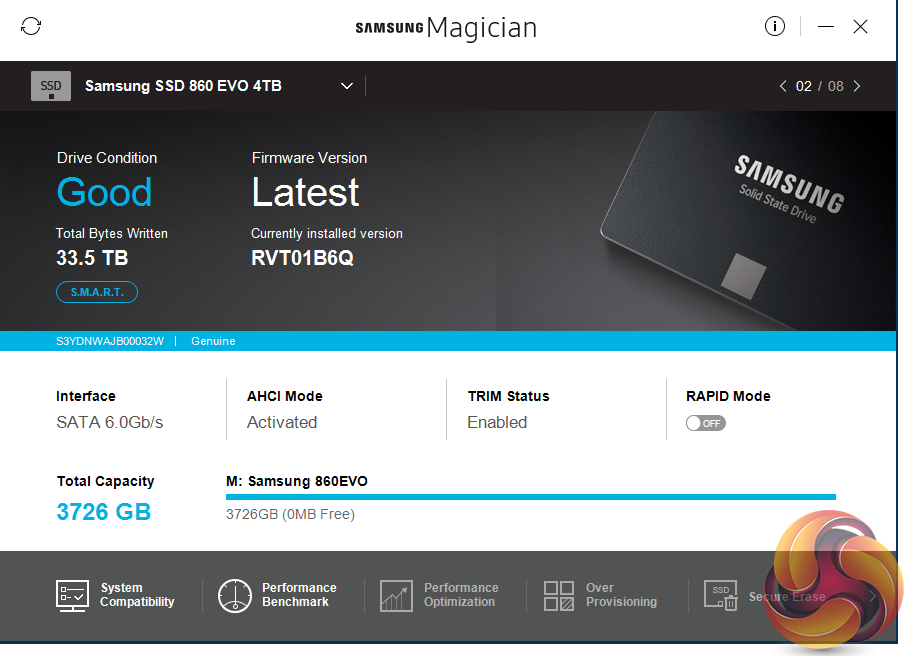
Samsung Magician
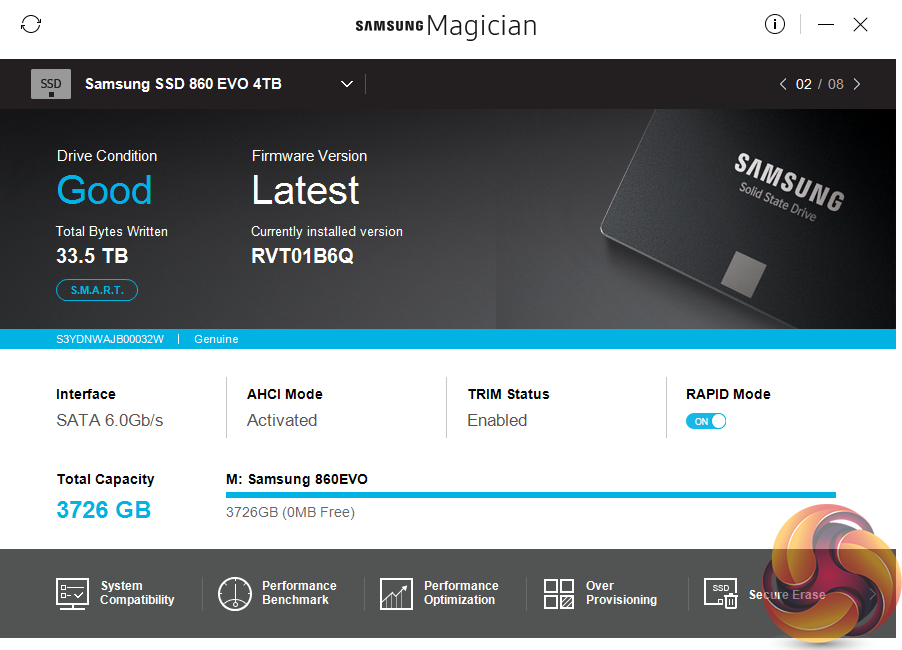
Samsung's SSD management utility is called Magician which you can download from the Samsung website. The latest version of the software, 5.2, is the one that supports the new SSD 860 drives.
 ~
~
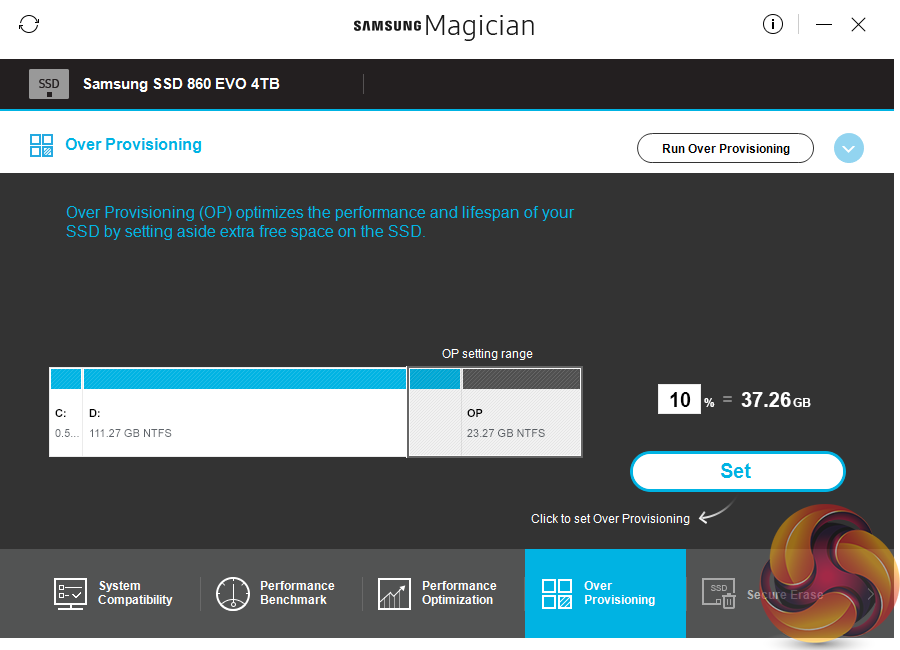
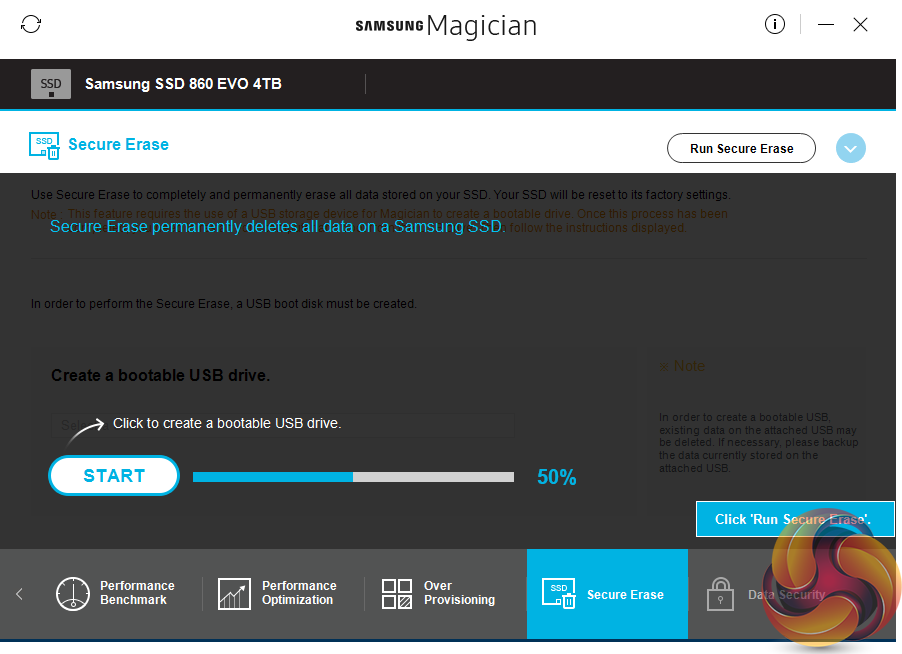
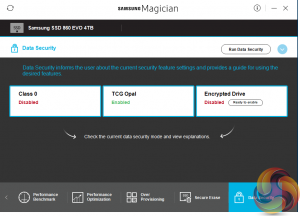
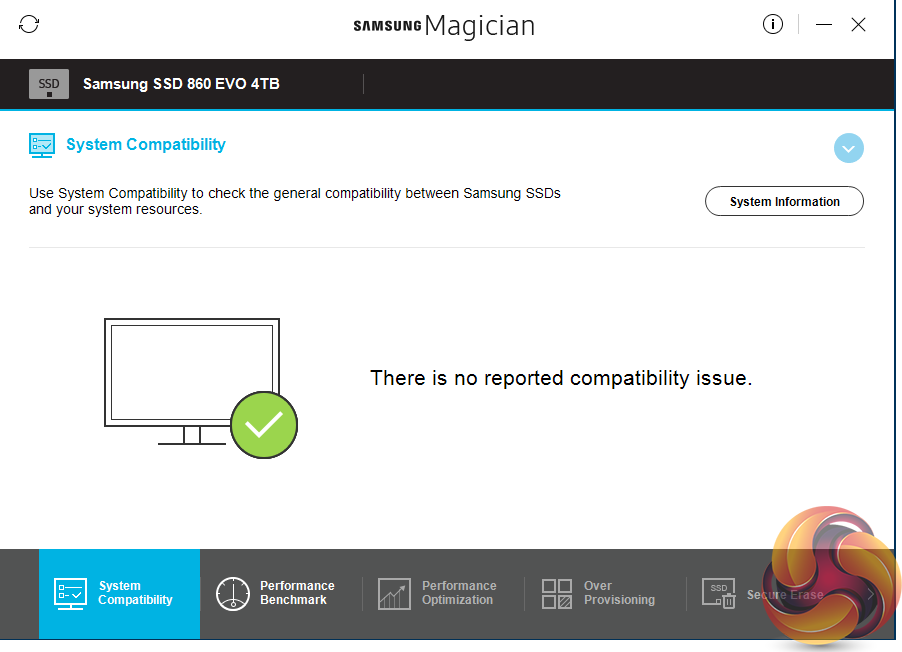
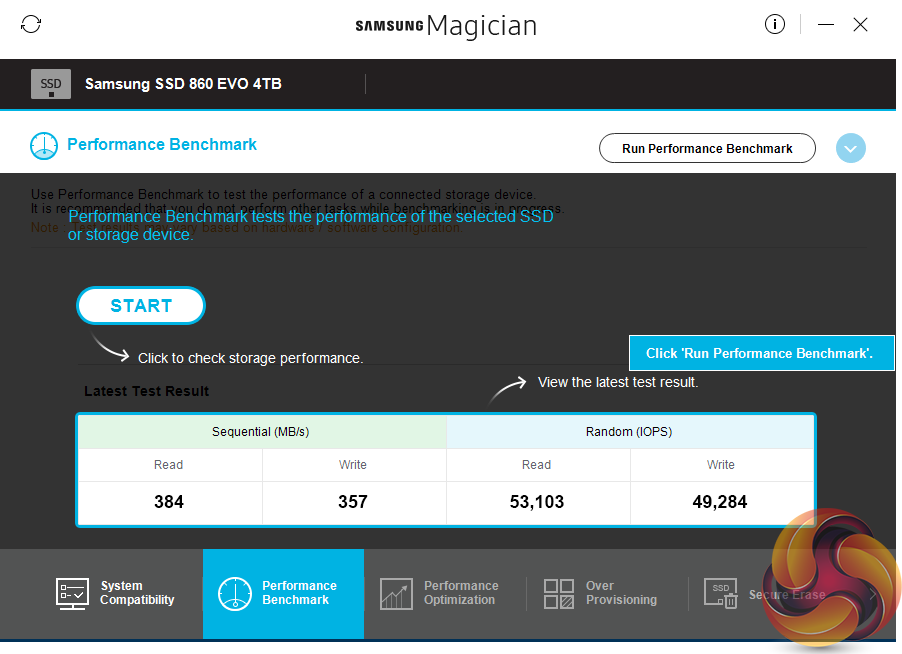
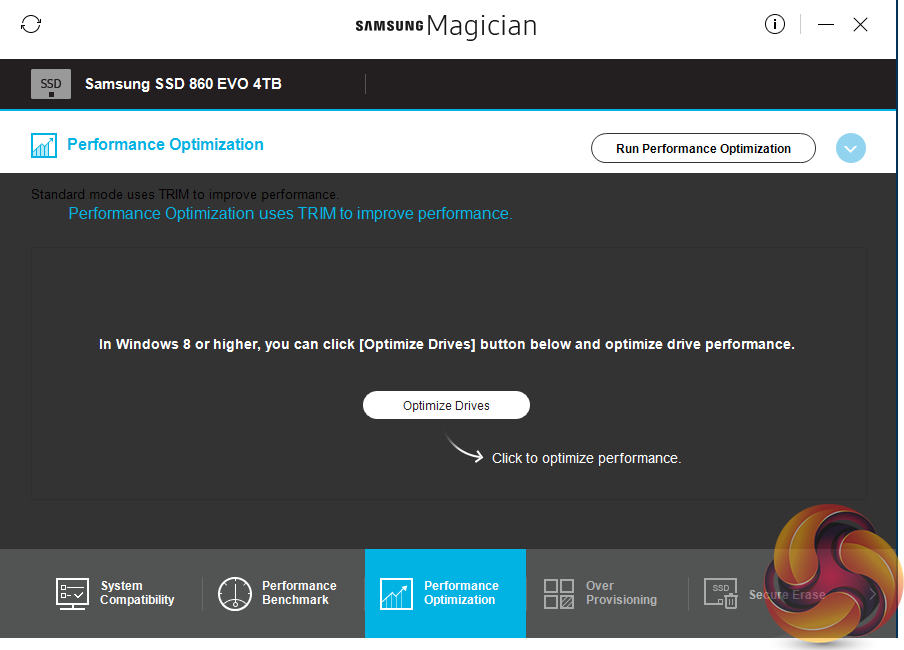
Magician is a pretty comprehensive suite of tools to allow you to check the drive compatibility with the system it's being installed into, optimise its performance, set the Over Provisioning and perform a secure erase of the drive.
The one tool noticeable by its absence is a data migration tool, but not to worry the Data Migration software is available as a separate download from Samsung's website.
For testing, the drives are all wiped and reset to factory settings by HDDerase V4. We try to use free or easily available programs and some real world testing so you can compare our findings against your own system. This is a good way to measure potential upgrade benefits.
Main system:
Intel Core i7-7700K with 16GB of DDR4-3200 RAM, Sapphire R9 390 Nitro and an Asus Prime Z270-A motherboard.
Other drives
Crucial BX100 1TB
Crucial BX200 960GB
Crucial M550 1TB
Crucial MX200 1TB
Crucial MX300 2TB
Crucial MX300 Limited Edition 750GB
Integral SVR-PRO 100 4TB
Kingston SSDNow V310 960GB
Samsung 840 EVO 1TB
Samsung 850 EVO 1TB
SK hynix SE3010 960GB
Toshiba TR200 960GB
Ultima Pro X 960GB
Software:
Atto Disk Benchmark.
CrystalMark 3.0.3.
AS SSD.
IOMeter
All our results were achieved by running each test five times with every configuration this ensures that any glitches are removed from the results. Trim is confirmed as running by typing fsutil behavior query disabledeletenotify into the command line. A response of disabledeletenotify =0 confirms TRIM is active.
CrystalDiskMark is a useful benchmark to measure theoretical performance levels of hard drives and SSD’s. We are using V3.0.3.
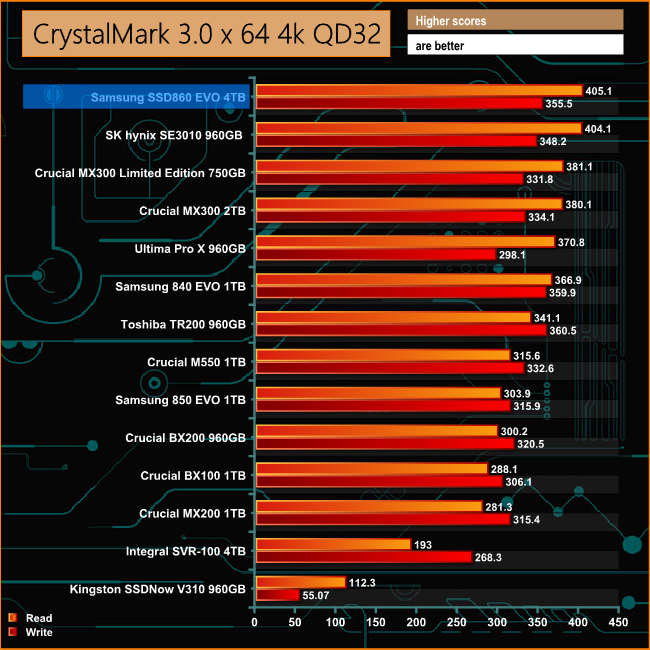
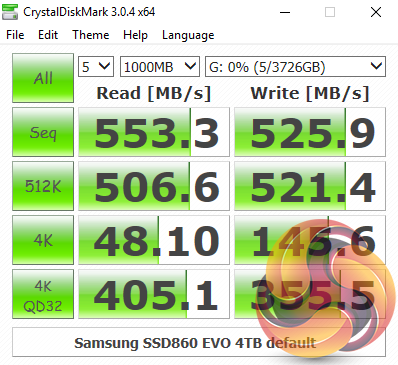
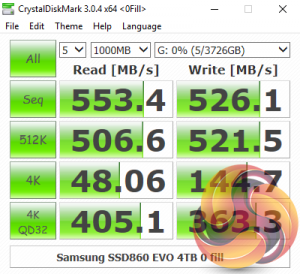
The drive shows solid performance in the CrystalDiskMark tests, just hitting top spot in the result graph, being a little bit faster for reads and writes than the 960GB version of the SK hynix SE310. Looking at both benchmark result screens it appears that the new Samsung MJX controller has no preference in what type of data it's being asked to handle.
The ATTO Disk Benchmark performance measurement tool is compatible with Microsoft Windows. Measure your storage systems performance with various transfer sizes and test lengths for reads and writes. Several options are available to customize your performance measurement including queue depth, overlapped I/O and even a comparison mode with the option to run continuously.
Use ATTO Disk Benchmark to test any manufacturers RAID controllers, storage controllers, host adapters, hard drives and SSD drives and notice that ATTO products will consistently provide the highest level of performance to your storage.
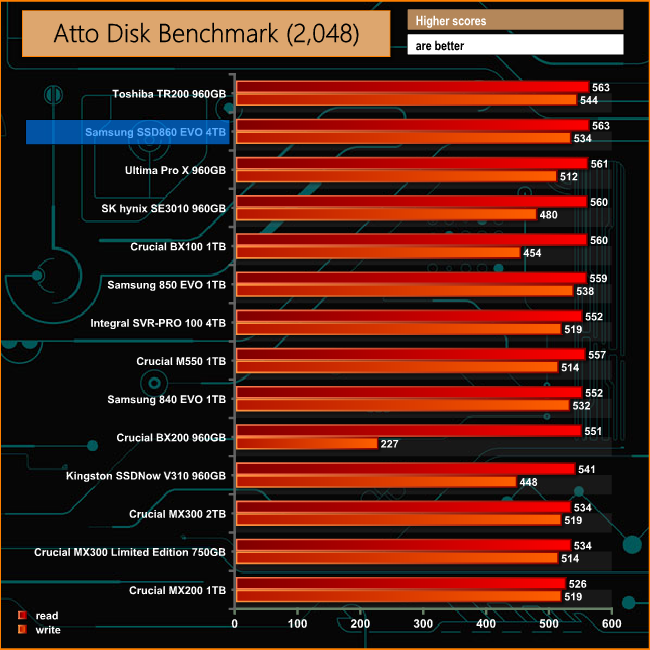
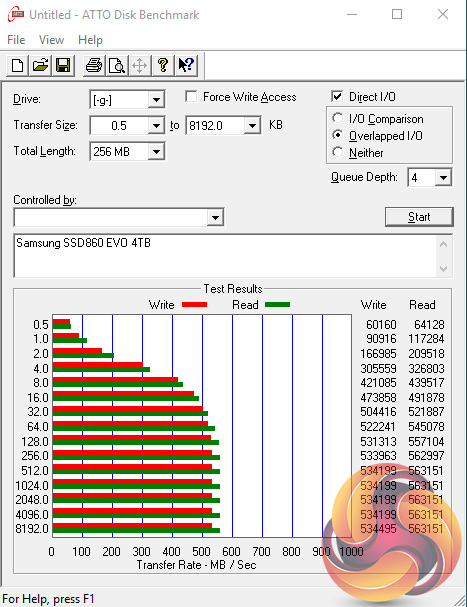
Samsung's official Sequential read/write figures for the 860EVO are 550MB/s and 520MB/s respectively. Using the ATTO benchmark we could confirm these figures and even get a little better, the tested drive producing a read score of 563MB/s with writes at 534MB/s.
AS SSD is a great free tool designed just for benching Solid State Drives. It performs an array of sequential read and write tests, as well as random read and write tests with sequential access times over a portion of the drive. AS SSD includes a sub suite of benchmarks with various file pattern algorithms but this is difficult in trying to judge accurate performance figures.
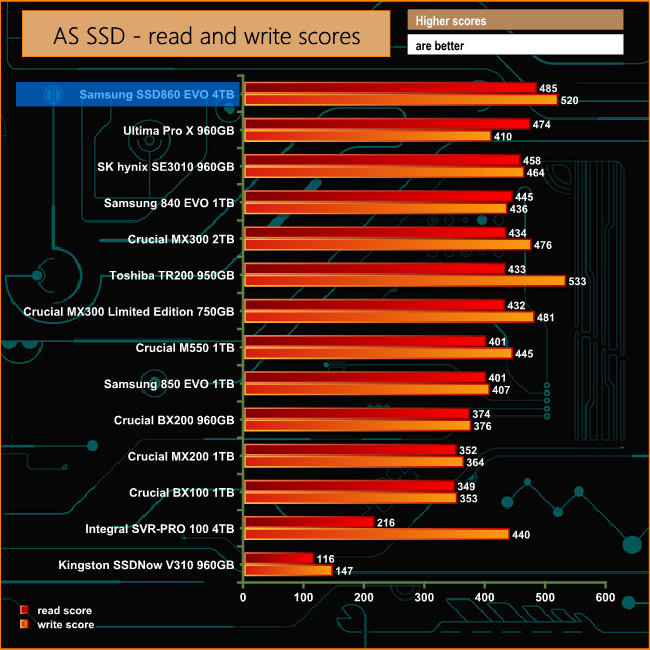
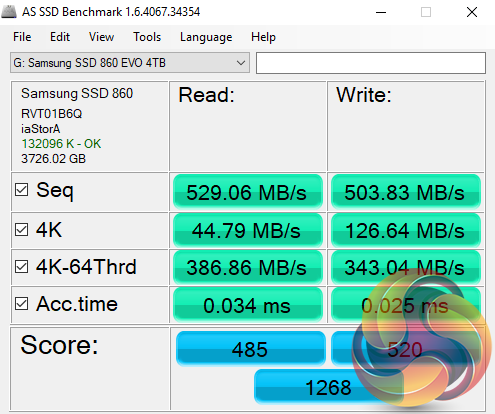
The 4TB 860EVO performs very well in the AS SSD test producing the fastest read score for any drive we have tested in the 2.5in 1TB+ class with the second best write performance.
IOMeter is another open source synthetic benchmarking tool which is able to simulate the various loads placed on hard drive and solid state drive technology.
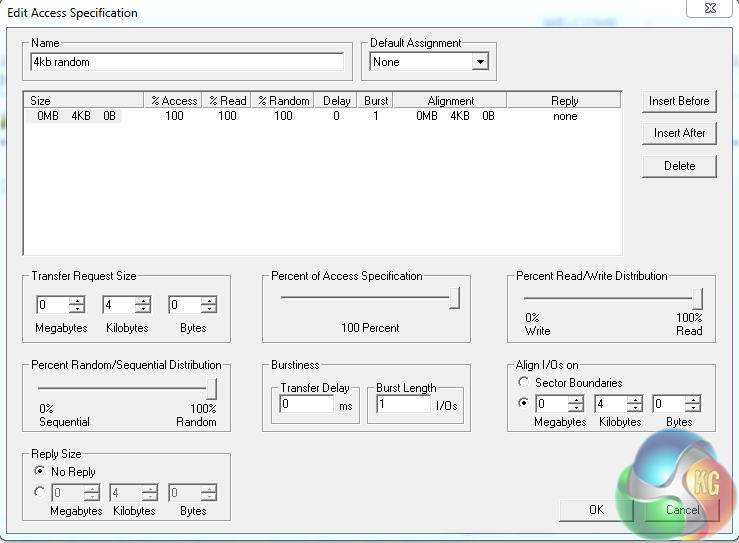
We test with both random read and write 4k tests, as shown above. There are many ways to measure the IOPS performance of a Solid State Drive, so our results will sometimes differ from manufacturer’s quoted ratings. We do test all drives in exactly the same way, so the results are directly comparable.
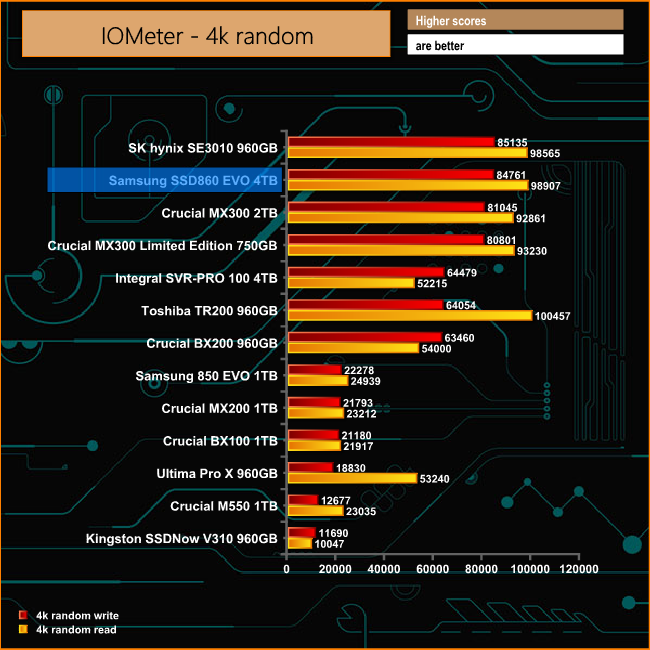
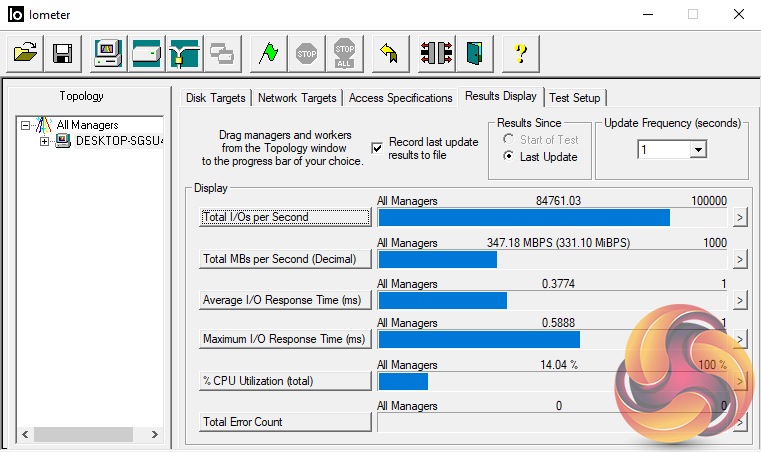
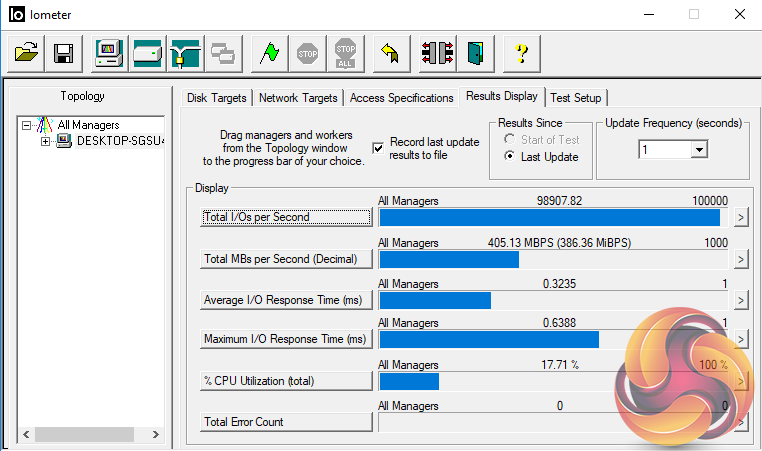
Samsung's random read figure for the 860EVO is up to 98,000 IOPS with write performance quoted as up to 90,000 IOPS. The review drive hit the read figure on the nail with a score of 98,907 IOPS. The tested write performance fell a little short of the maximum official figure at 84,761 IOPS.
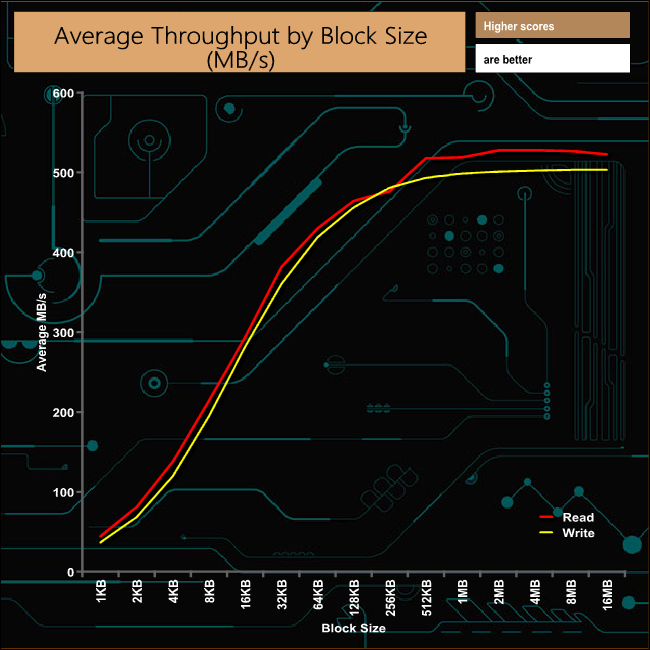
In our throughput test, the read performance dipped at the 256KB block size but recovered very quickly before peaking 527.93MB/s at the 4MB block level before finishing the test at 522.78MB/s. The throughput graph for writes is a much smoother affair, peaking at the end of the test at 503.39MB/s
Futuremark’s PCMark 8 is a very good all round system benchmark but it’s Storage Consistency Test takes it to whole new level when testing SSD drives. It runs through four phases; Preconditioning, Degradation, Steady State, Recovery and finally Clean Up. During the Degradation, Steady State and Recovery phases it runs performance tests using the 10 software programs that form the backbone of PCMark 8; Adobe After Effects, Illustrator, InDesign, Photoshop Heavy and Photoshop Light, Microsoft Excel, PowerPoint, Word, Battlefield 3 and World of Warcraft. With some 18 phases of testing, this test can take many hours to run.
Preconditioning
The drive is written sequentially through up to the reported capacity with random data, write size of 256 × 512 = 131,072 bytes. This is done twice.
Degradation
Run writes of random size between 8 × 512 and 2048 × 512 bytes on random offsets for 10 minutes. It then runs a performance test. These two actions are then repeated 8 times and on each pass the duration of random writes is increased by 5 minutes.
Steady State
Run writes of random size between 8 × 512 and 2048 × 512 bytes on random offsets for final duration achieved in degradation phase. A performance test is then run. These actions are then re-run five times.
Recovery
The drive is idled for 5 minutes. Then a performance test is run. These actions are then repeated five times.
Clean Up
The drive is written through sequentially up to the reported capacity with zero data, write size of 256 × 512 = 131,072 bytes.
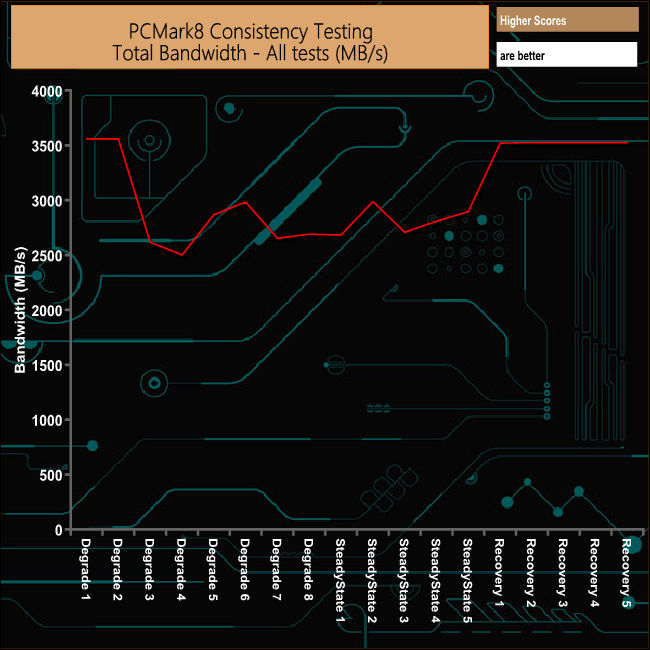
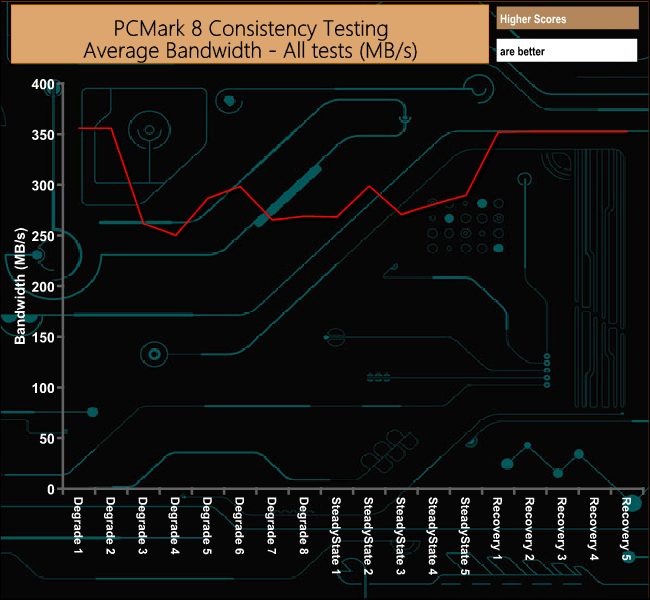
The drive takes quite a hit during the latter stages of the degradation and first part of the steady state phases, dropping as low as 250MB/s at one point, but it recovers from the ordeal very well. During the final five recovery stages it averages 352MB/s, pretty much the same figure as for the first run of the degradation phase.
PCMark 8’s Consistency test provides a huge amount of performance data, so here we’ve looked a little closer at how the 860EVO performs in each of the benchmarks test suites.
Adobe Creative Cloud

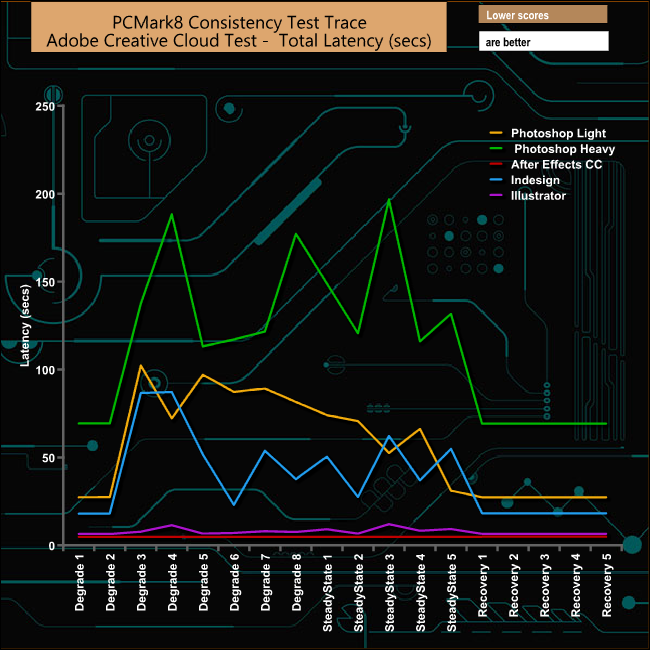
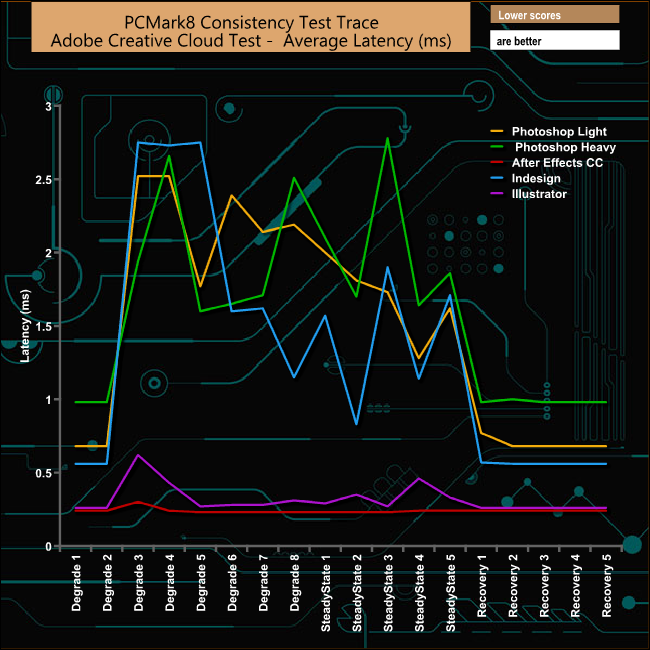
During the test runs of the Photoshop Light, Photshop Heavy and Indesign traces, the drives performance takes a real hit. However throughout the recovery phases, the performance returns to around the level it was before the tests started.
Microsoft Office
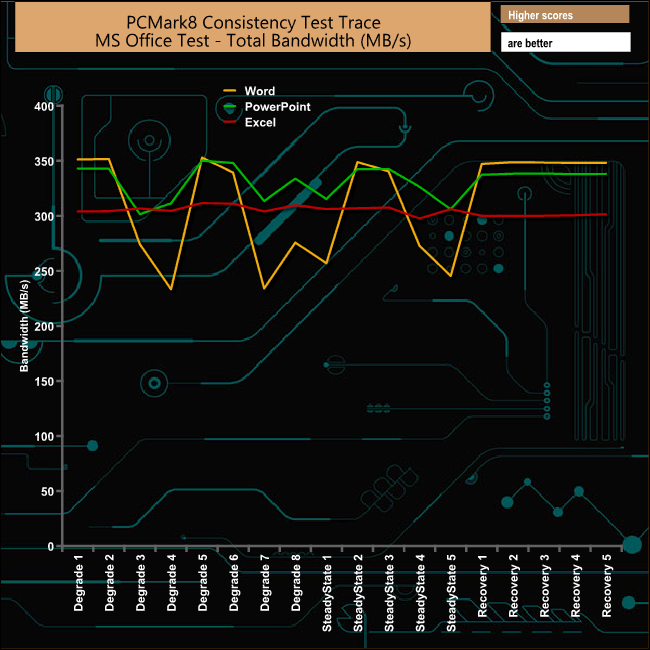
Of all the office tests, it's the Microsoft Word trace that suffers the biggest drop by far in the degradation and steady state phases of the test, dropping as low at 233MB/s at one point. But as before the performance recovers very well indeed to reach 348MB/s at the end of the recovery stage of the test.
Casual Gaming
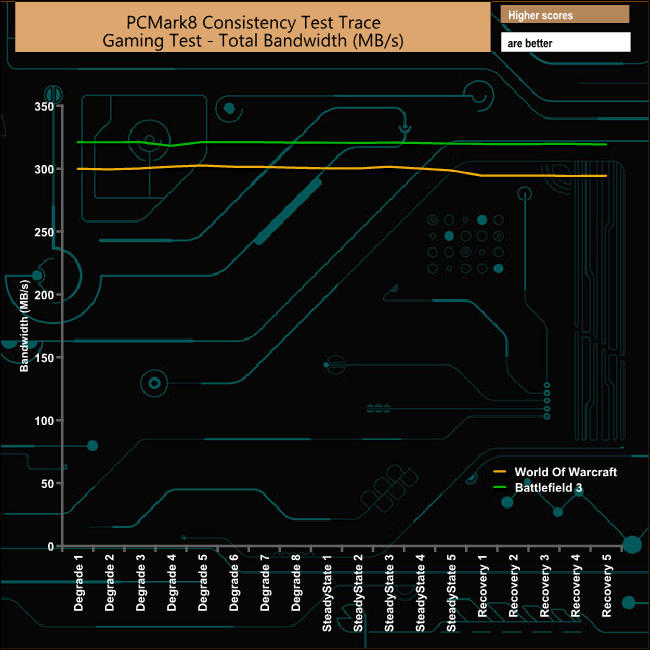
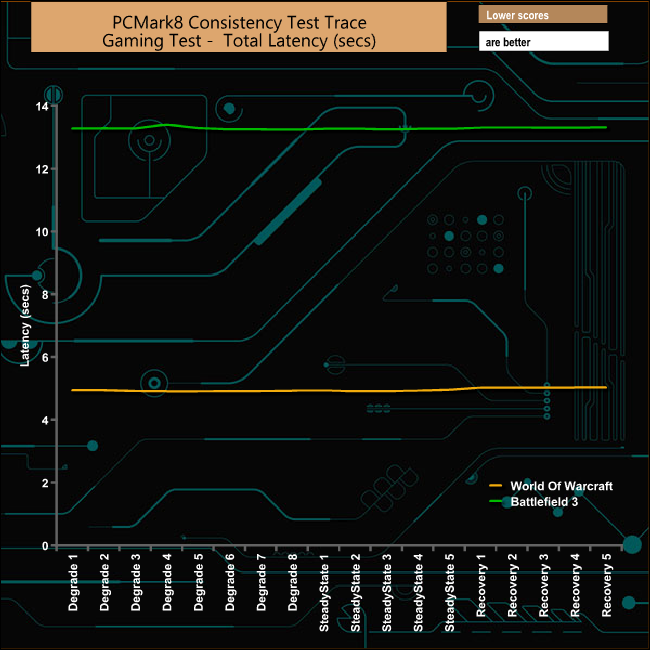
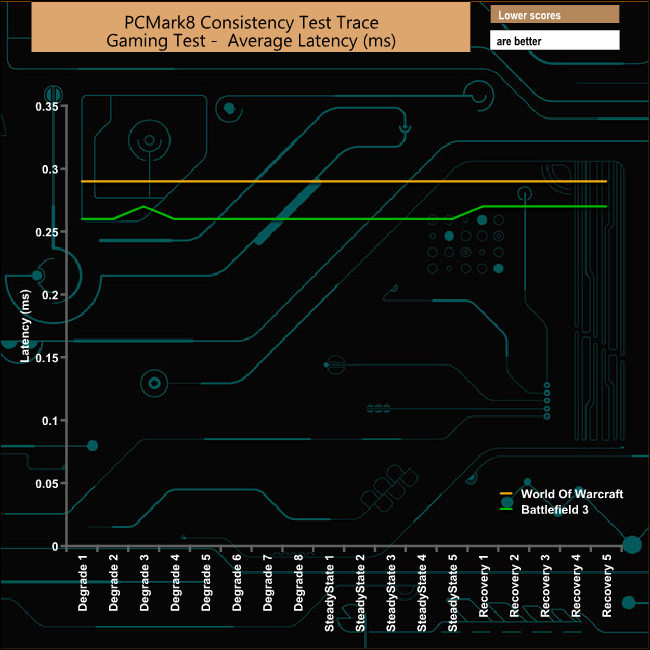
The drive handles the two gaming traces very well throughout the whole test with hardly any real performance loss.
Just like the Consistency test, PCMark 8’s standard Storage test also saves a large amount of performance data. The default test runs through the test suite of 10 applications three times. Here we show the total bandwidth performance for each of the individual test suites for the third and final benchmark run.

The SSD860 EVO 4TB drive handles the demands of the PCM8 Storage test very well, with strong performance for all the test suites particularly the Adobe Photoshop Light and Heavy traces.
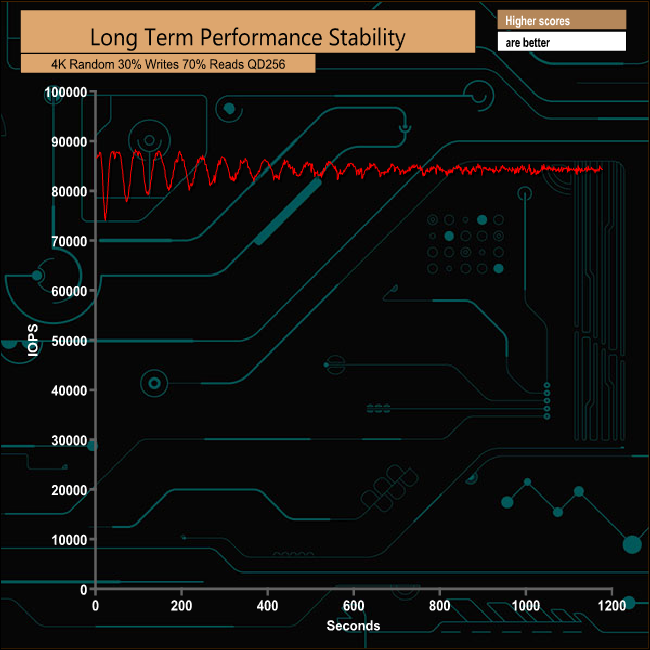
For the long term performance stability test, we set the drive up to run a 20-minute 4K random test with a 30% write, 70% read split, at a Queue Depth of 256 over the entire disk. The Samsung SSD860 EVO averaged 84,279 IOPS for the test with a performance stability of 97% which, for a drive aimed at the consumer market is superb.
To test real life performance of a drive we use a mix of folder/file types and by using the FastCopy utility (which gives a time as well as MB/s result) we record the performance of drive reading from & writing to a 256GB Samsung SSD850 PRO.
100GB data file.
60GB iso image.
60GB Steam folder – 29,521 files.
50GB File folder – 28,523 files.
12GB Movie folder – 24 files (mix of Blu-ray and 4K files).
10GB Photo folder – 621 files (mix of .png, raw and .jpeg images).
10GB Audio folder – 1,483 files (mix of mp3 and .flac files).
5GB (1.5bn pixel) photo.

The 860 EVO handled our real life file transfers without any sign of distress, never dropping below the 400MB/s transfer rate mark for any of them.
The SSD860 EVO supports Samsung's RAPID technology. RAPID stands for Real-time Accelerated Processing of I/O Data and works by using a portion of the system's memory as a fast cache for the drive. It's accessed via the Magician management tool.
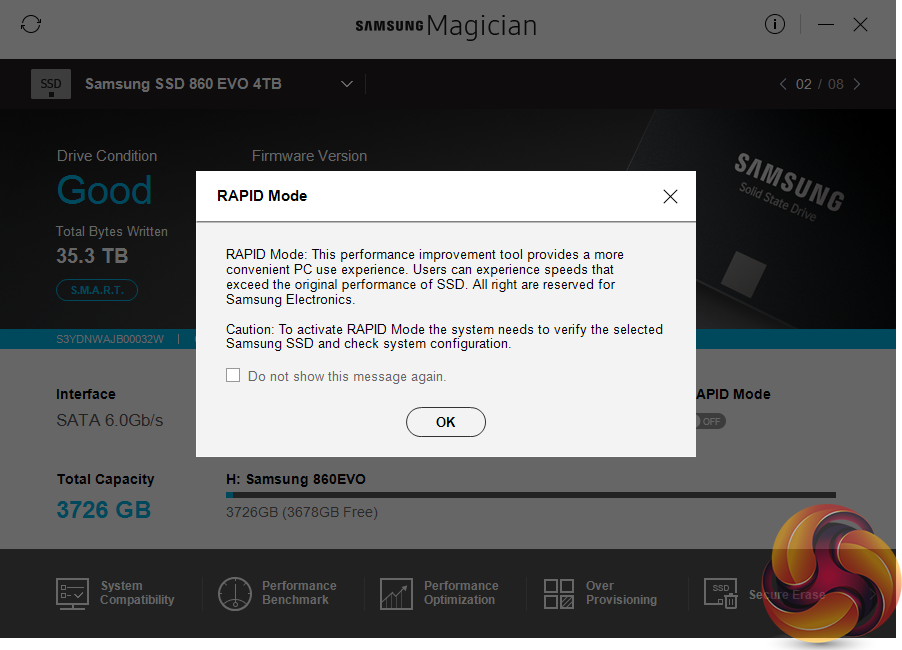 ‘
‘
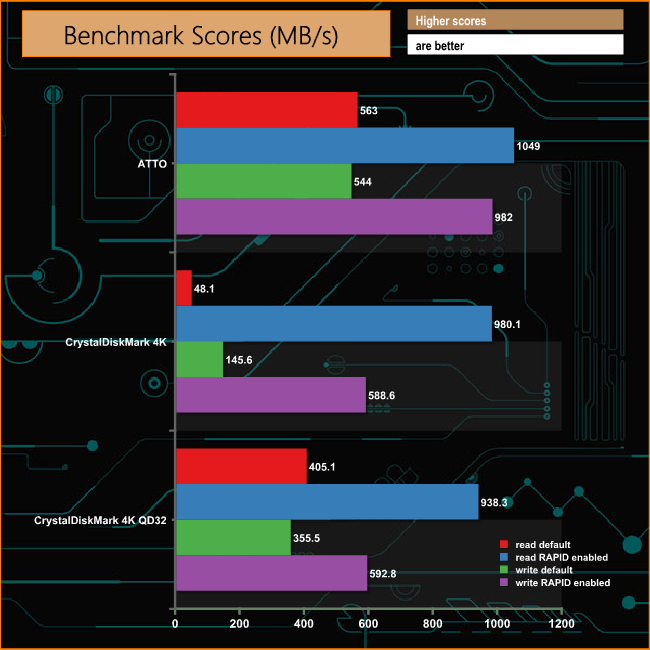
With RAPID mode turned on the Sequential read score in ATTO rockets up from the 563MB/s up to a 1049MB/s. The rise in the write score isn’t quite so dramatic, rising from 544MB/s to 982MB/s.
RAPID has a much more profound effect on read performance than writes as can be seen in the CrystalDiskMark results at both shallow and deep queue depths. Although the write performance gets a healthy boost, it's nowhere near the levels of the read improvement.
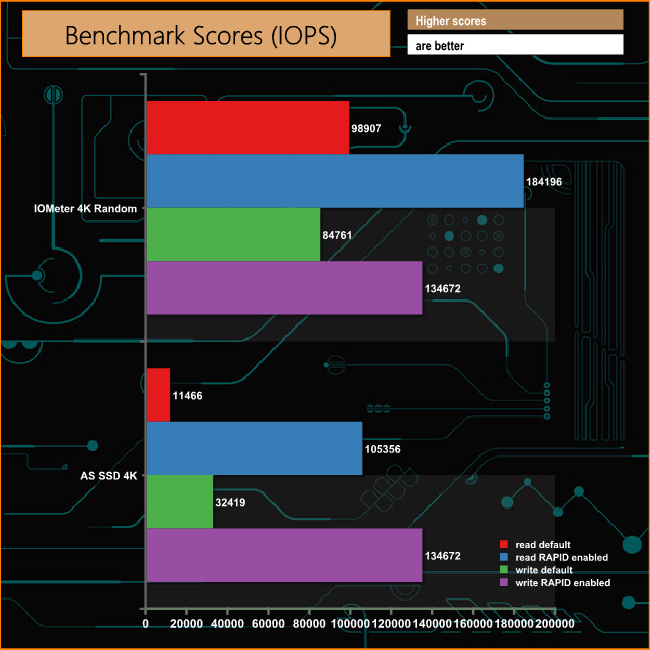
Both the IOMeter and the AS SSD 4K tests show massive improvements with RAPID enabled but interesting in the AS SSD benchmark it's the write performance that gets the biggest boost.
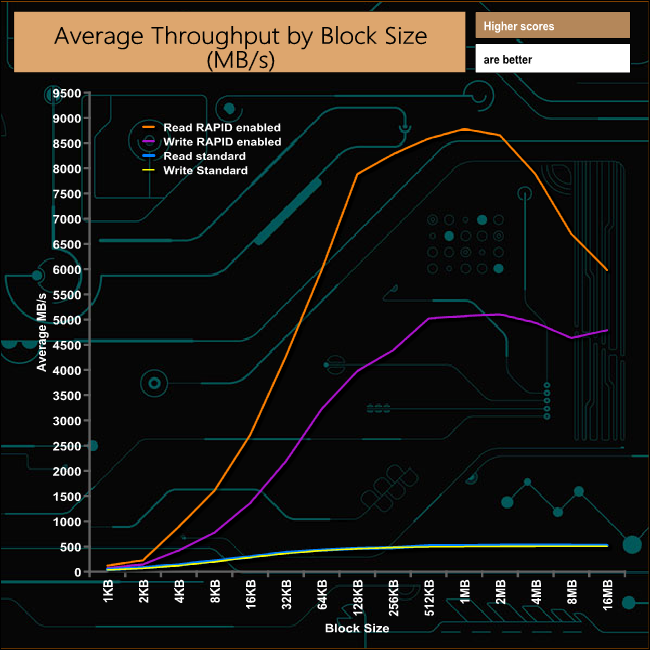
Samsung says RAPID mode is used primarily to accelerate read performance but in the throughput test it showed it can have a dramatic effect on write performance as well.
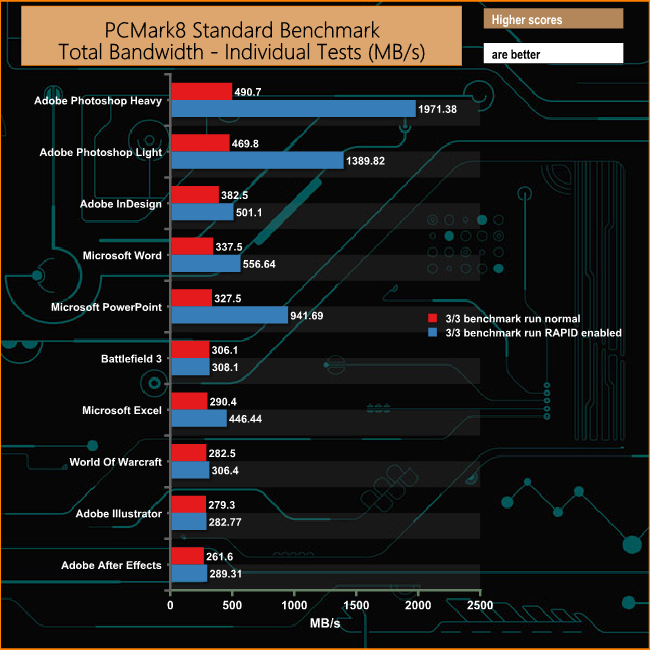
In the PCMark 8 Storage test the effects of enabling the RAPID technology vary considerably. When testing the Adobe Photoshop Heavy, Photoshop Light and the Microsoft PowerPoint traces RAPID makes a huge difference and there's a healthy rise in the Abobe Indesign, Microsoft Word and Excel performance figures as well. The rest of the test suites show not much improvement at all.
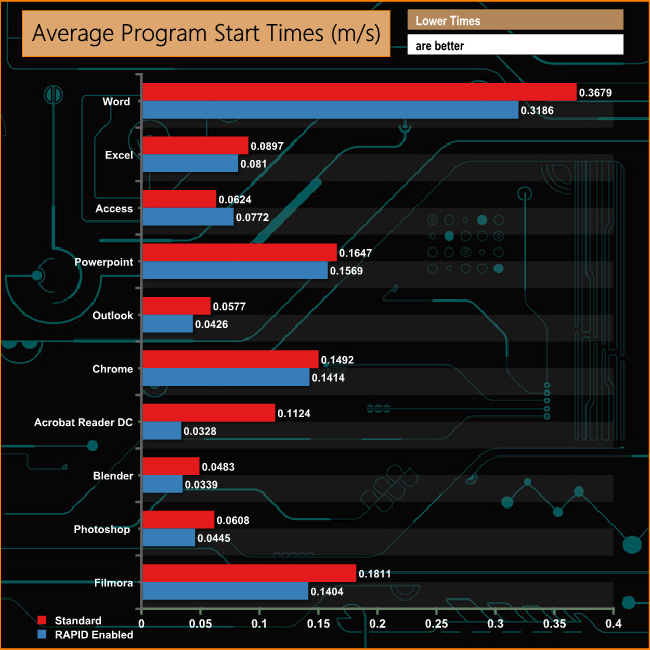
So the RAPID technology gives a really nice healthy boost to benchmark scores so it must improve things in real life … right?
Well for starters, the RAPID mode cache uses software that loads after the OS – so it has no effect on boot up times. As for program loading times, yes it makes a difference, saving some time (with the exception of Microsoft Access, where the time was slower with RAPID enabled) but we are talking milliseconds, so it is actually not noticeable at all.
It has been a while since we've seen a new 2.5in drive from Samsung. In fact, the last one we looked at was the SSD750EVO aimed at the value end of the market. The company has been blazing a trail in the M.2 NVMe market segment of late.
The new SSD860 range is the logical successor old SSD850 range using Samsung's latest 64-layer V-NAND in place of the 48-layer V-NAND used in the 850 EVO. The new range also sees the launch of a new Samsung controller, the MJX.
In regards to performance, Samsung quote Sequential read/write figures for the 4TB SSD 860 EVO as up to 550MB/s and 520MB/s respectively. We verified these figures with the ATTO benchmark – the review drive producing a read score of 563MB/s with writes at 534MB/s.
The random read/write figures for the 860EVO are up to 98,000 IOPS for reads and 90,000 IOPS for writes. The review drive hit the read figure on the nail with a score of 98,907 IOPS while the tested write performance fell a little short of the maximum official figure at 84,761 IOPS.
The drive also supports intelligent TurboWrite, a feature which was introduced in the 960 EVO back in 2016 and a refinement of the original TurboWrite feature of the 840 EVO. Intelligent TurboWrite identifies user workloads, then defines the appropriate SLC buffer to handle the workload.
For the 4TB drive, the default TurboWrite region size is 6GB but if the workload is greater than 6GB, the additional 72GB Intelligent TurboWrite region comes into play. The Intelligent Turbo Write function takes advantage of idle capacity; if the drive doesn't have enough free space, it will not function.
The endurance figures for the new drives is very impressive. The 4TB drive has a rating of 2,400TBW, a figure which is a whopping 8 times better than the 300TBW of the previous generation 4TB 850 EVO.
![]()
We found the 4TB Samsung SSD860 EVO available to pre-order for £1,399.99 (inc VAT) on Overclockers UK HERE
Pros.
- Performance.
- Endurance rating.
- 5 year warranty.
Cons.
- Price tag is hefty.
Kitguru says: It's been a while since we've seen a new Samsung SATA based drive. The SSD860 EVO uses the latest Samsung 64-layer V-NAND which helps give the 4TB drive a huge endurance rating increase over the previous generation 850 EVO.

Be sure to check out our sponsors store EKWB here