
Seagate's lastest NVMe SSD is the FireCuda 530, the company's 2nd generation PCIe Gen4 drive – following on from the FireCuda 520. This time around, Seagate is using a faster controller and the latest 176-layer NAND technology. We review the 2TB model, priced at £320.
The FireCuda 530 uses a combination of Micron's B47R 176-layer 3D TLC NAND and Phison’s PS5018-E18 NVMe controller and is available in two versions, one with a heatsink, designed in partnership with EKWB, and one without and in four capacities; 500GB, 1TB, 2TB (the drive we are reviewing) and the flagship 4TB model.
Seagate quote Sequential performance figures for the FireCuda 530 as up to 7,000MB/s reads for the 500GB model with the other three drives up to 7,300MB/s. The 500GB drive gets a 3,000MB/s Sequential write rating, the 1TB drive 6,000MB/s and both the 2TB and 4TB models are listed as up to 6,900MB/s.
Random performance (4KB QD32, 8 threads) is stated as up to 400,000 IOPS and 3,000 IOPS for reads and writes respectively for the 500GB drive, the 1TB drive is up to 800,000 IOPS for reads and 1,000,000 IOPS for writes while both the 2TB and 4TB drives are rated as up to 1,000,000 IOPS for both reads and writes.
The 2TB drive being reviewed has an official TBW endurance rating of 2,550TB with Seagate backing the drive with a 5-year warranty.
Physical Specifications:
- Usable Capacities: 2TB.
- NAND Components: Micron B47R 176-layer 3D TLC NAND.
- NAND Controller: Phison PS5018-E18.
- Cache: DDR4-2666.
- Interface: PCIe Gen4 x4, NVMe 1.4.
- Form Factor: M.2, 2280.
- Dimensions: 80.15 x 22.15 x 3.58mm.
- Drive Weight: 10g.
Firmware Version: SU6SM001.
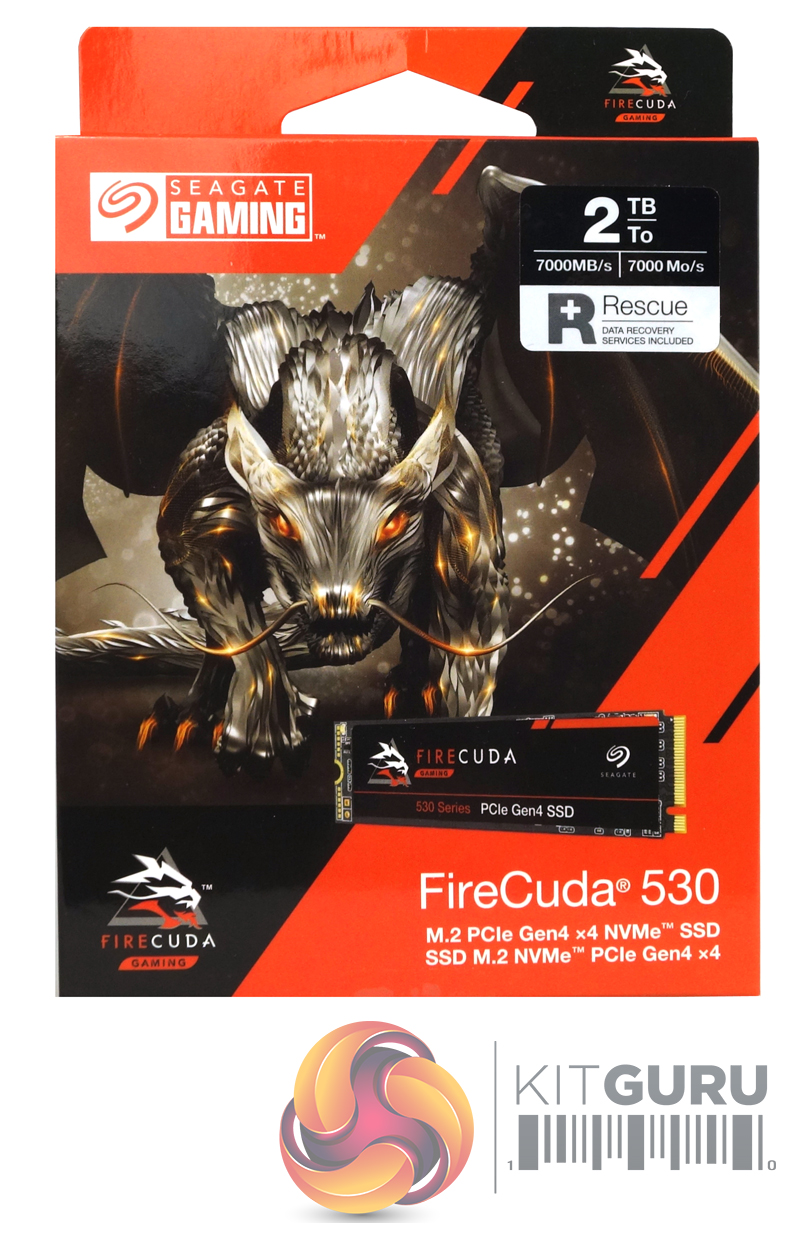
Seagate’s FireCuda 530 comes in a striking orange and white box with Seagate’s FireCuda dragon mascot prominently displayed along with a small image of the drive. At the top of the box is a sticker that displays the drive’s capacity and the Sequential read speed of the drive. Towards the bottom of the box is some text displaying the interface of the drive.
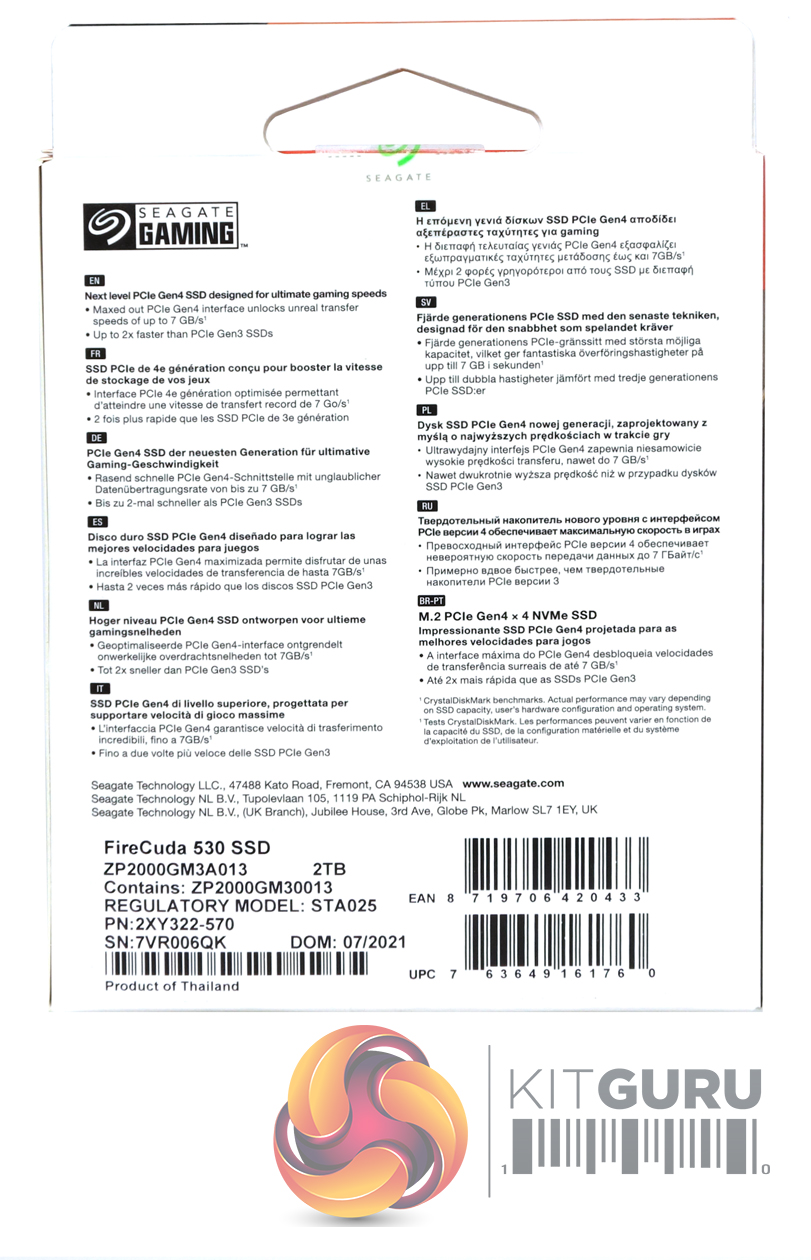
The rear of the box is covered by multilingual bullet points about the interface speed and the cache. Inside the box are a couple of sets of FireCuda branded stickers and a warranty info booklet.
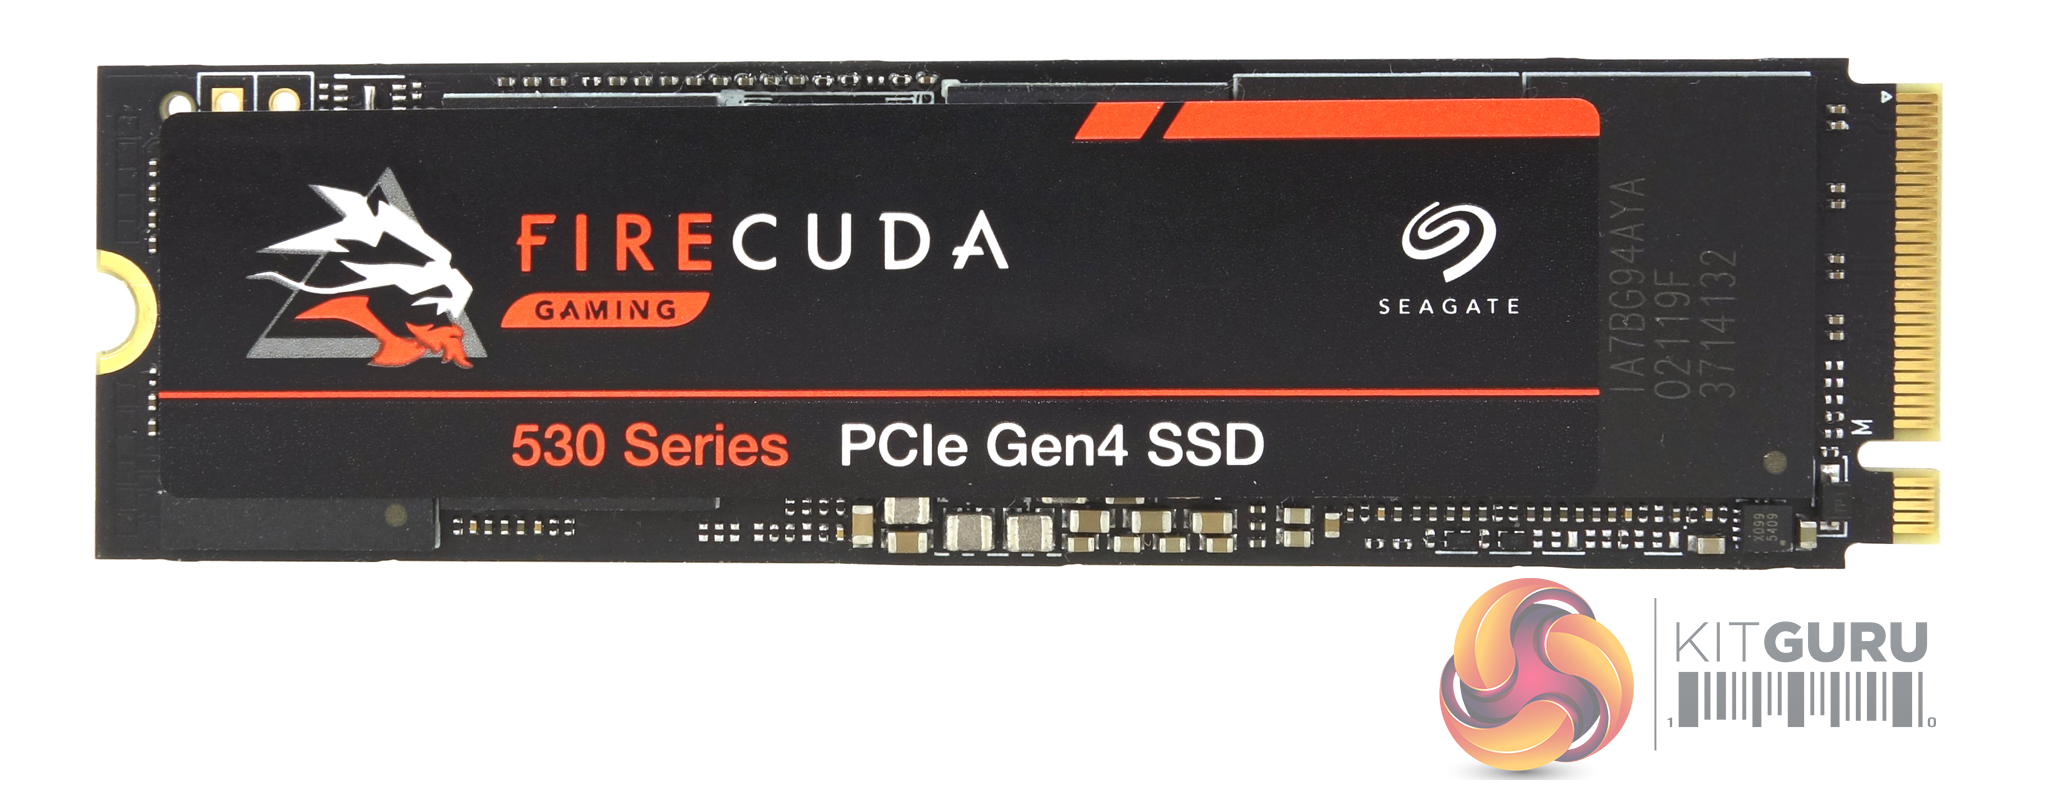
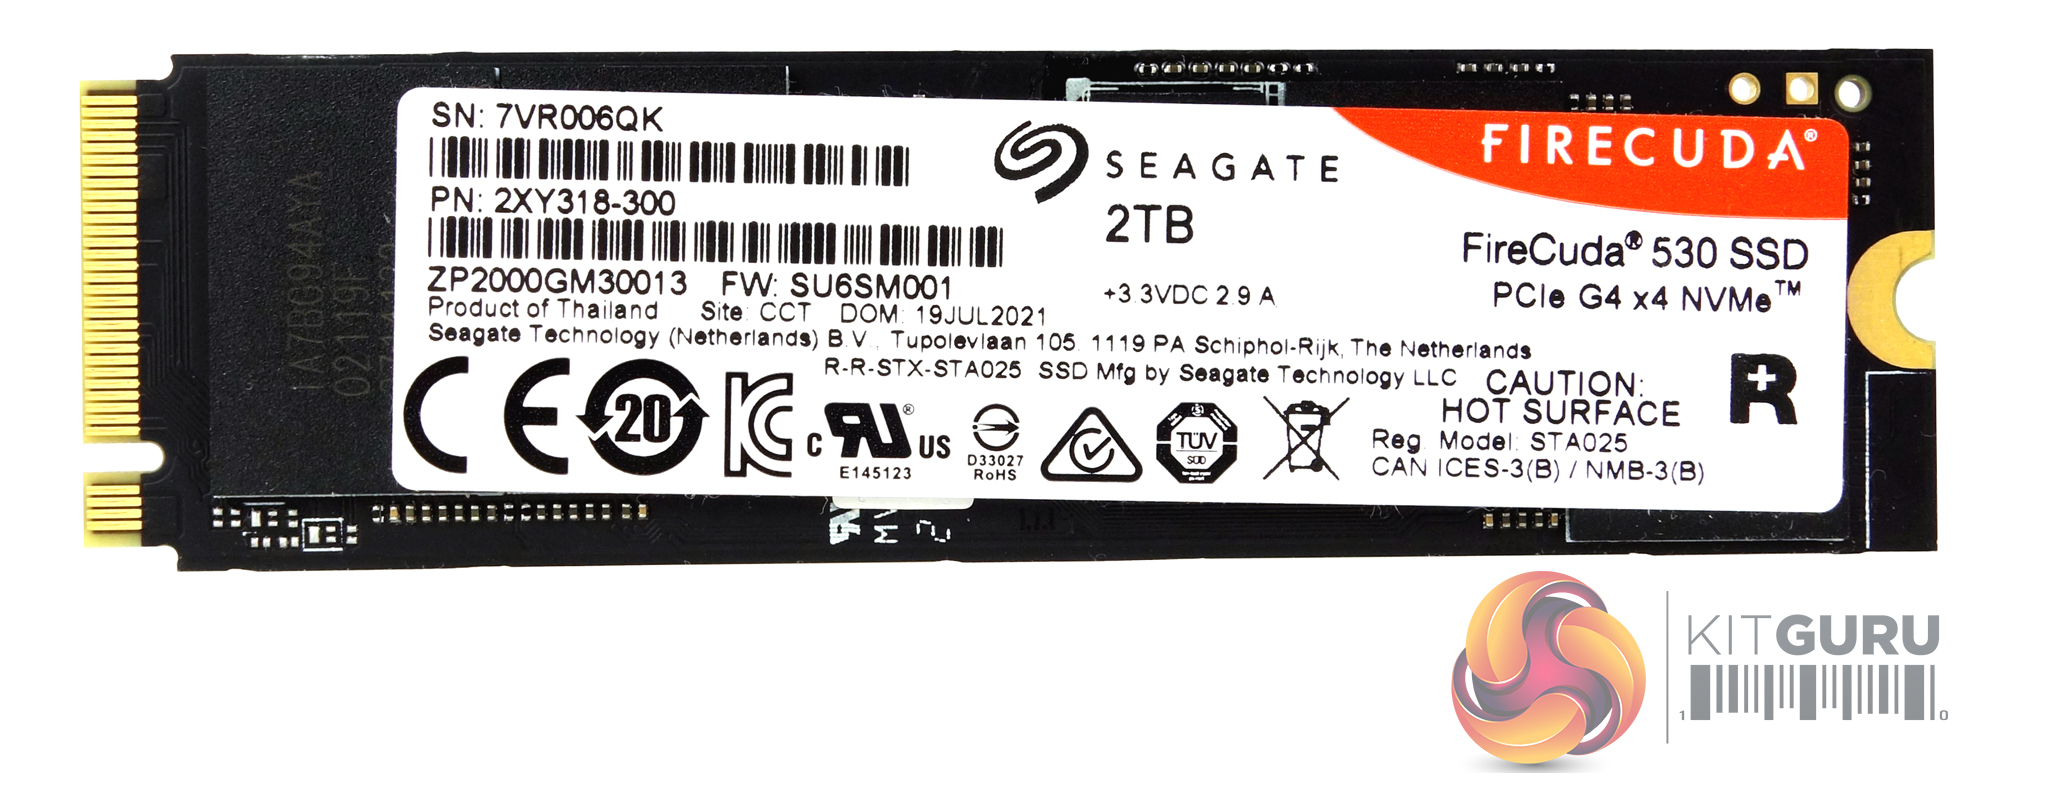
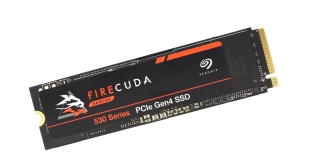
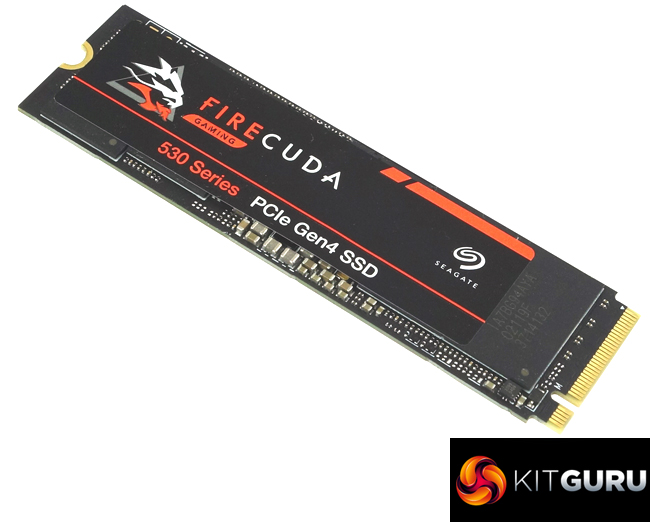
The FireCuda 530 is built on a double-sided M.2 2280 format.
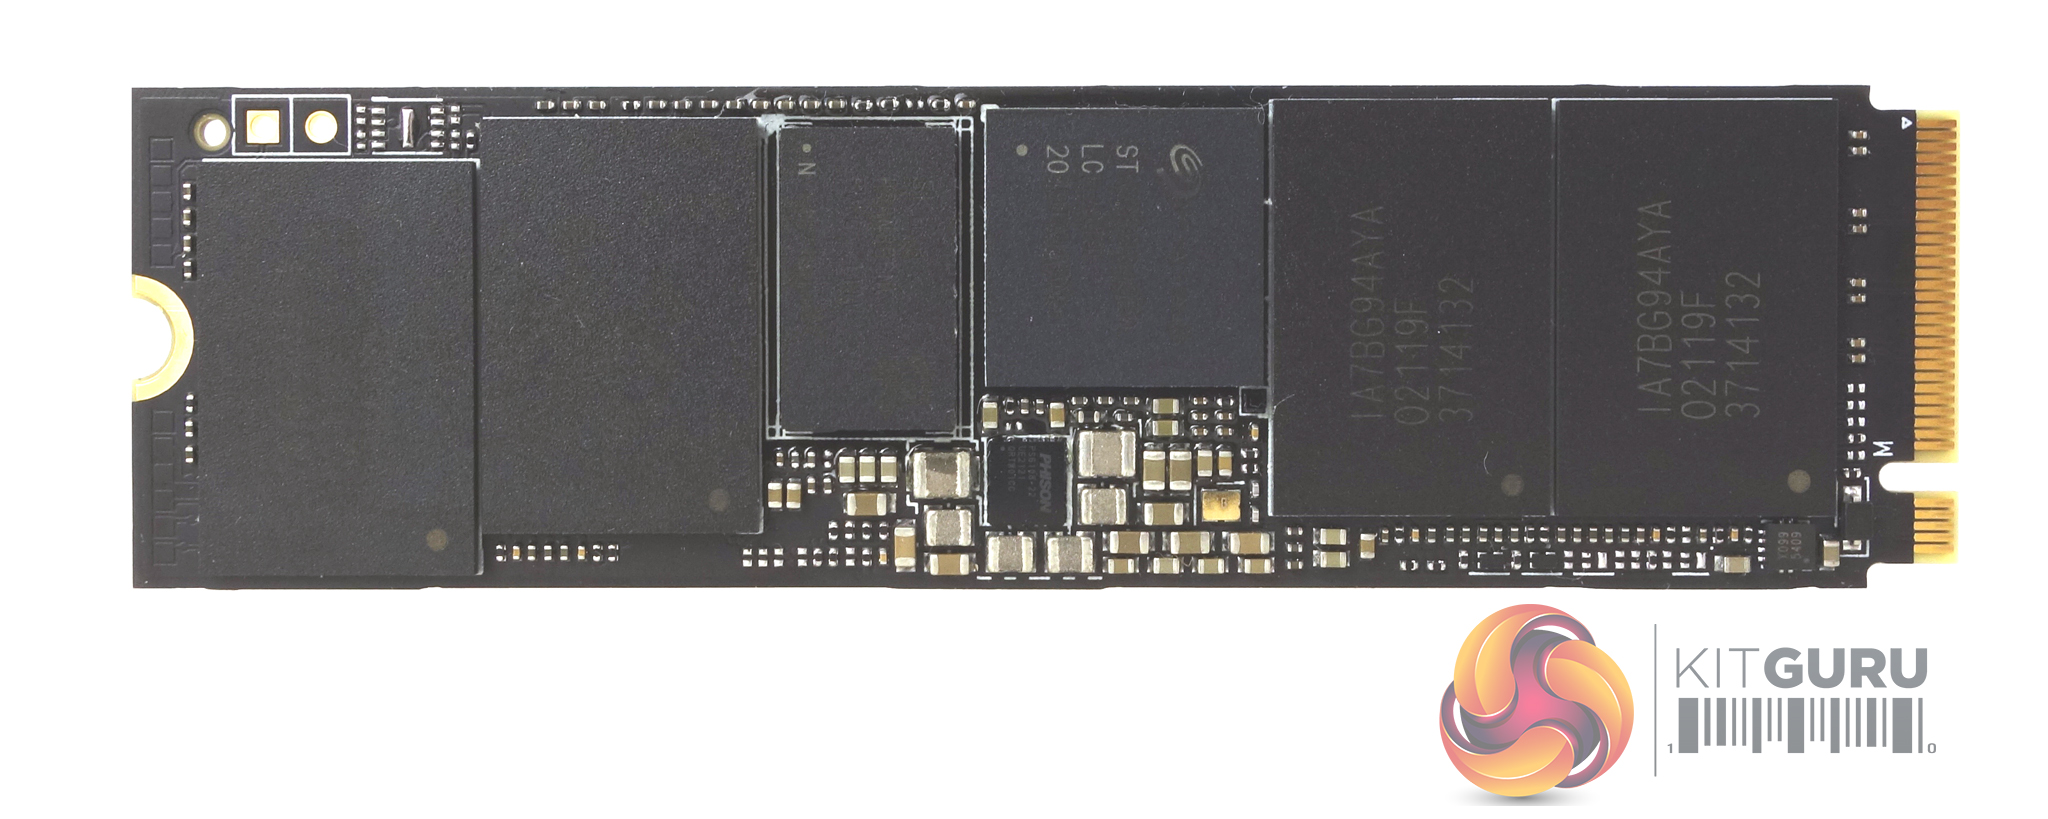
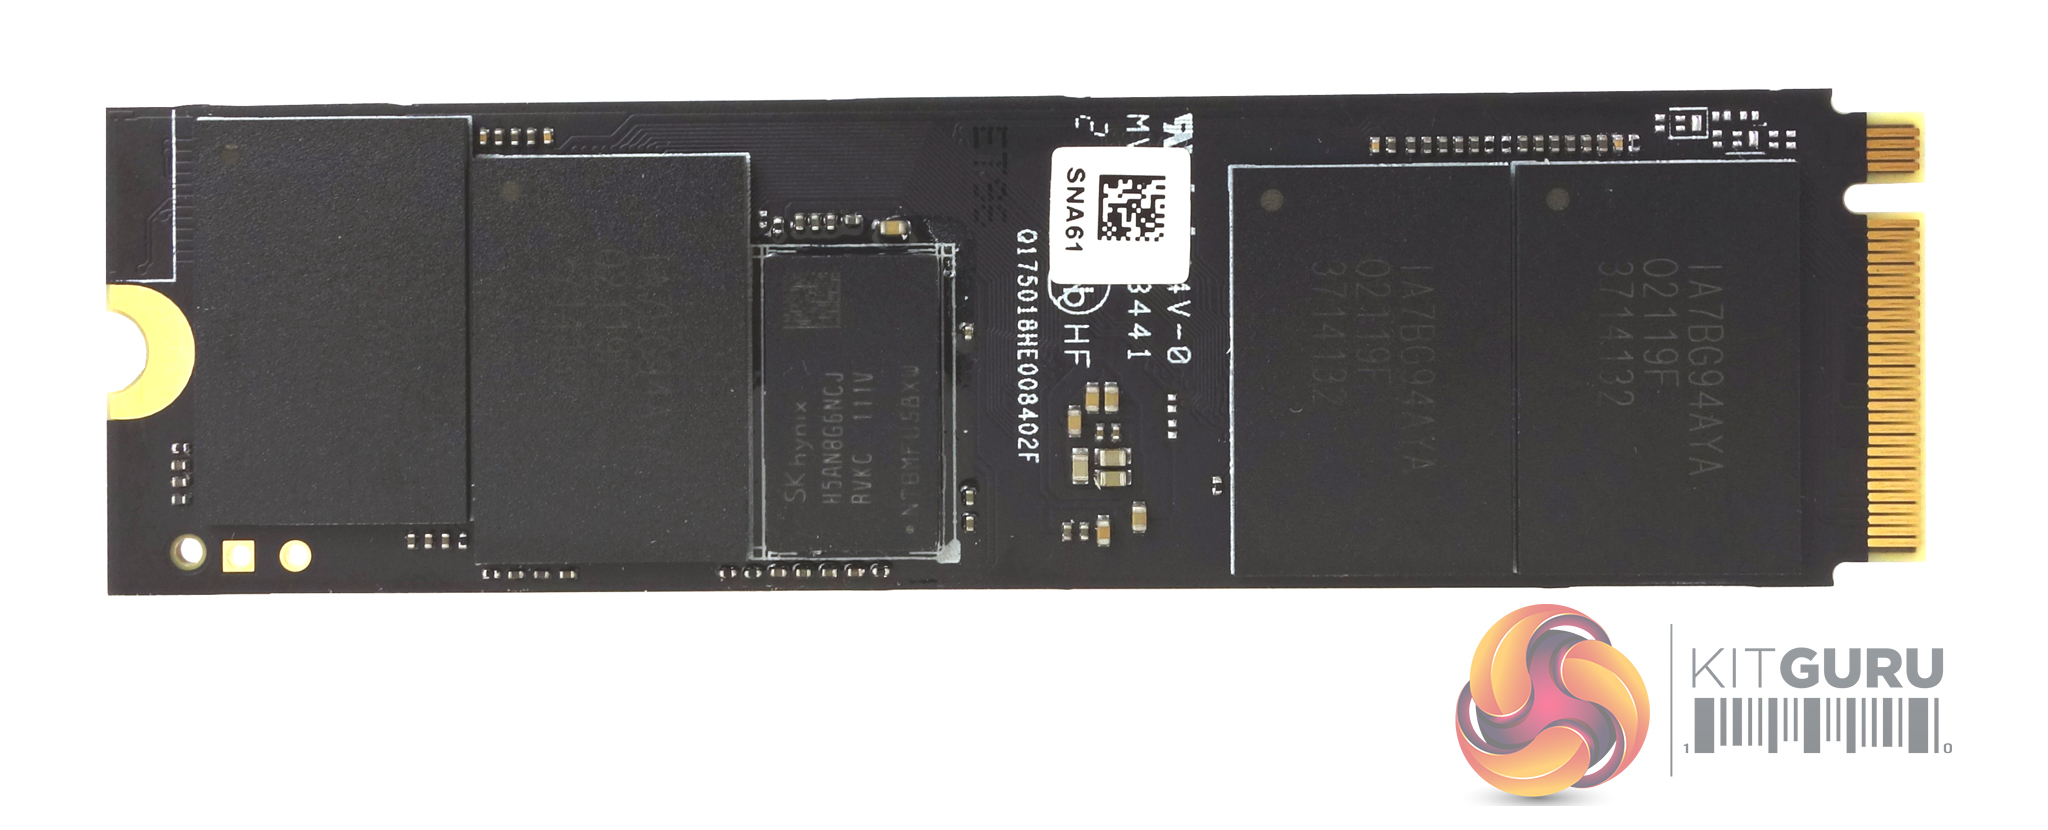
Sitting under the FireCuda branded label on the front of the drive are four packages of Micron's latest 176-layer replacement gate B47R 3D TLC NAND along with the Phison PS5018-E18 controller (branded as Seagate) and an SK hynix DDR4 (H5AN8G6NCJ, DDR4-2666) cache chip. The other side of the PCB has four more NAND packages and another DDR4 cache IC.
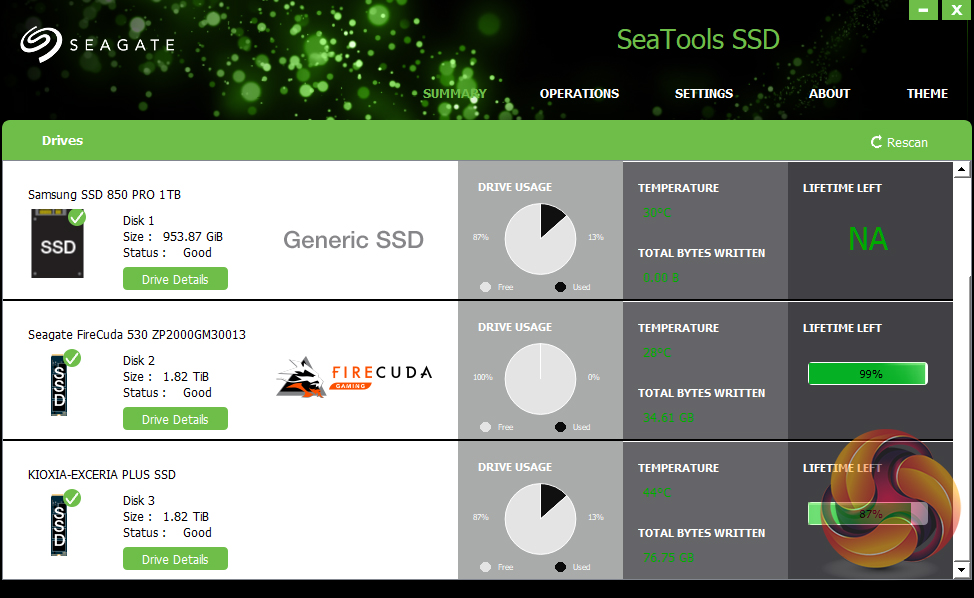
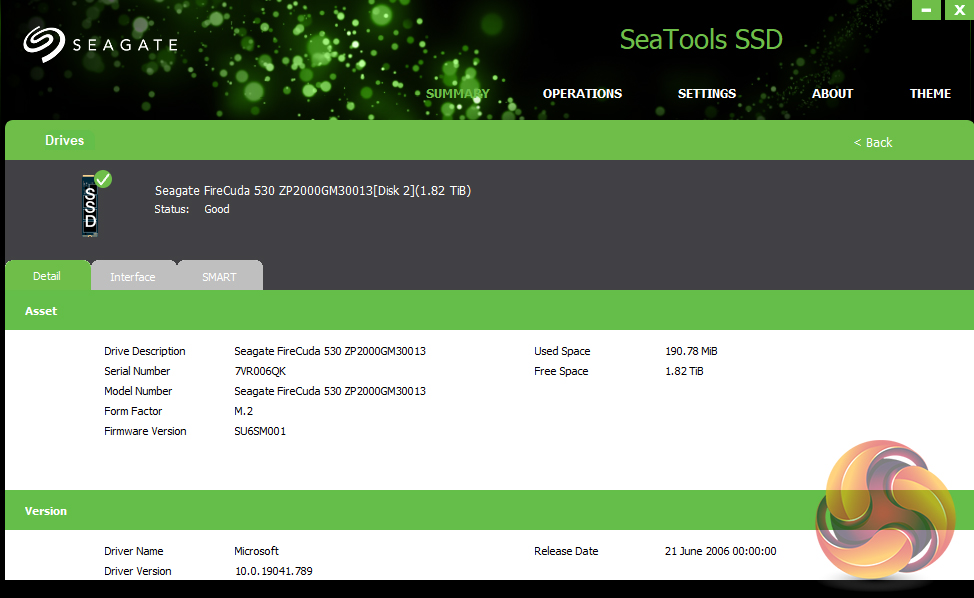
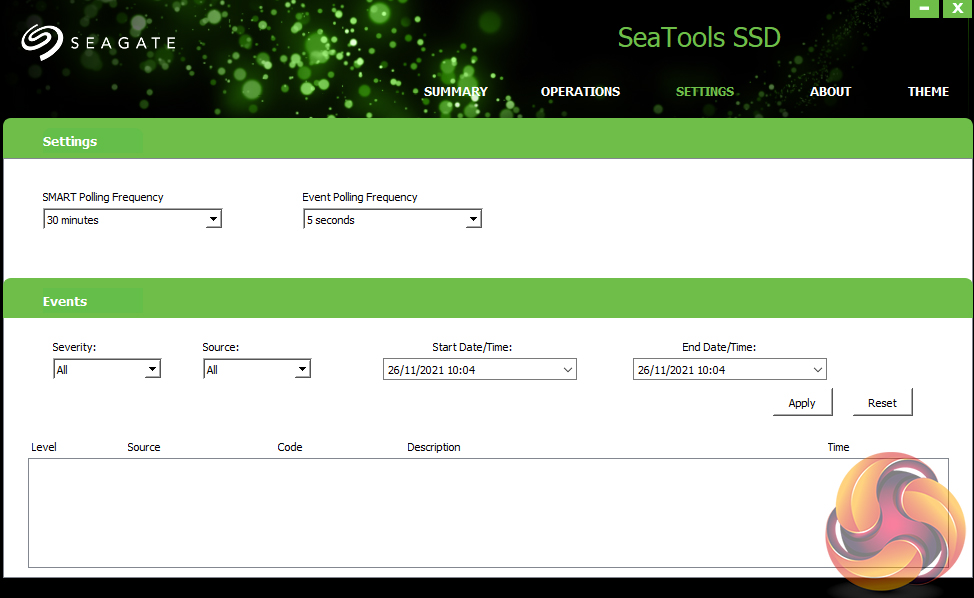
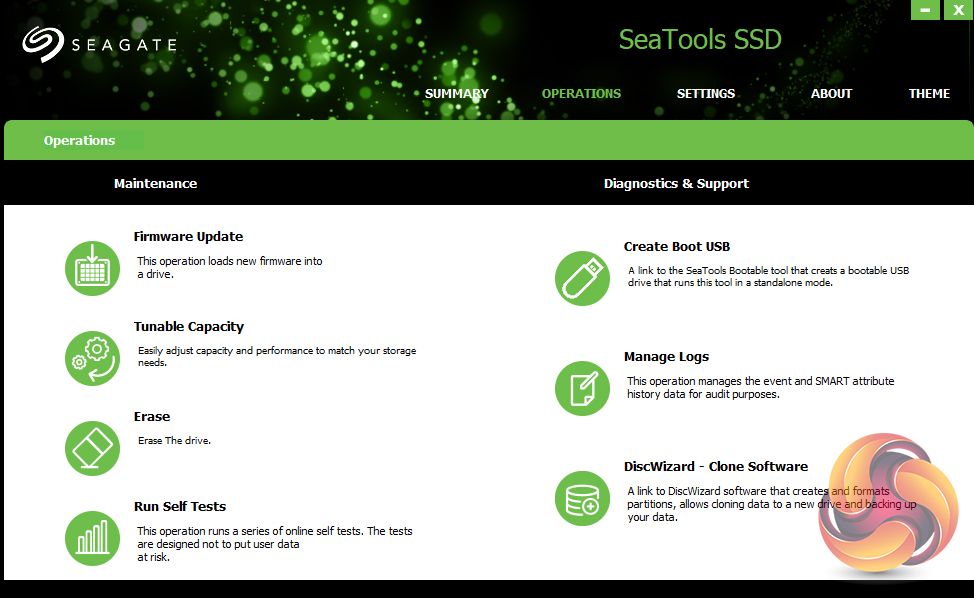
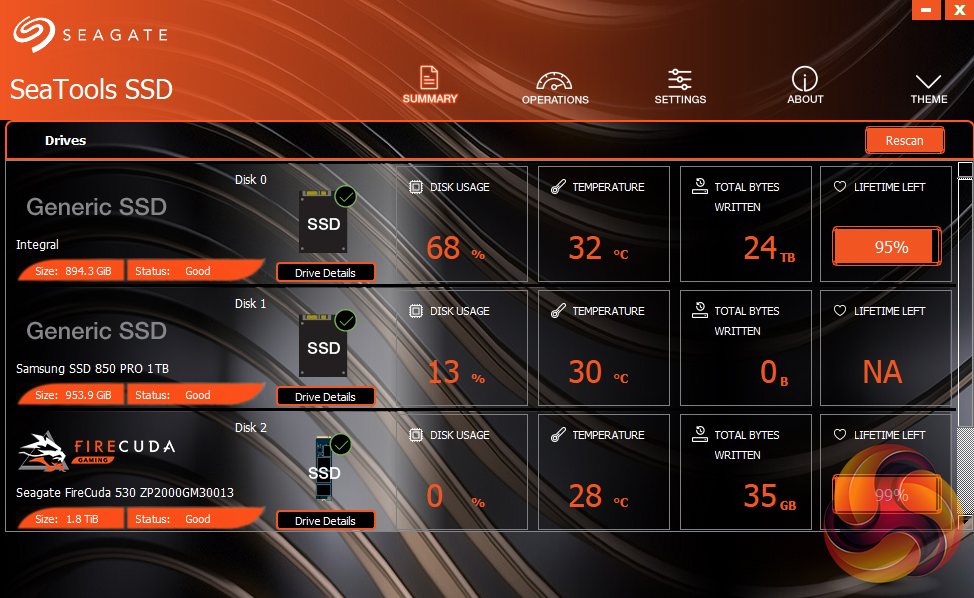
Seagate’s management software for the FireCuda is the SSD version of their SeaTools software. SeaTools SSD displays the drive’s health and supports firmware upgrading and secure erase. Although SeaTools SSD doesn’t come with any drive cloning utility built-in per se it does provide a link to download Seagate’s DiscWizard cloning software. It even gives you a choice of two themes, the standard one or one more suited to the drives gaming role.
For testing, the drives are all wiped and reset to factory settings by HDDerase V4. We try to use free or easily available programs and some real-world testing so you can compare our findings against your own system.
This is a good way to measure potential upgrade benefits.
Main system:
AMD Ryzen 5 3600X, 16GB DDR4-2400, Sapphire R9 390 Nitro and an MSI MPG X570 Gaming Edge Wifi motherboard
Other drives
Corsair MP600 PRO 2TB
Corsair Force MP600 1TB
Corsair MP600 PRO XT 2TB
Crucial P5 Plus 1TB
Gigabyte AORUS 7000e 2TB
MSI Spatium M480 2TB
Patriot Viper VP4300 2TB
Patriot Viper VPN4100 1TB
PNY XLR8 CS3040 1TB
PNY XLR8 CS3140 1TB
Sabrent Rocket 4 Plus 1TB
Sabrent Rocket 4 Plus 2TB
Sabrent Rocket 4 Plus 4TB
Samsung SSD980 PRO 1TB
Seagate FireCuda 520 1TB
Teamgroup T-Force Cardea Zero Z440 1TB
WD Black SN850 1TB
Software:
Atto Disk Benchmark 4.
CrystalMark 6.0 & 8.0.0.
AS SSD 2.0.
IOMeter.
PC Mark 10.
All our results were achieved by running each test five times with every configuration this ensures that any glitches are removed from the results. Trim is confirmed as running by typing fsutil behavior query disabledeletenotify into the command line. A response of disabledeletenotify =0 confirms TRIM is active.
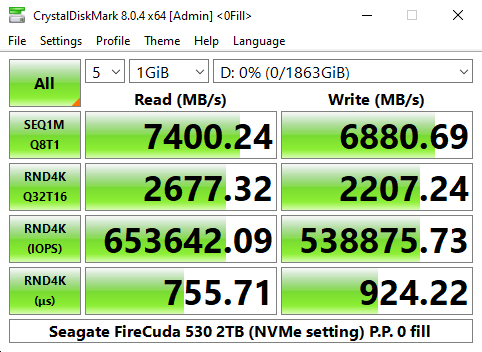
CrystalDiskMark is a useful benchmark to measure theoretical performance levels of hard drives and SSDs. We are using v6.0 and v8.0.
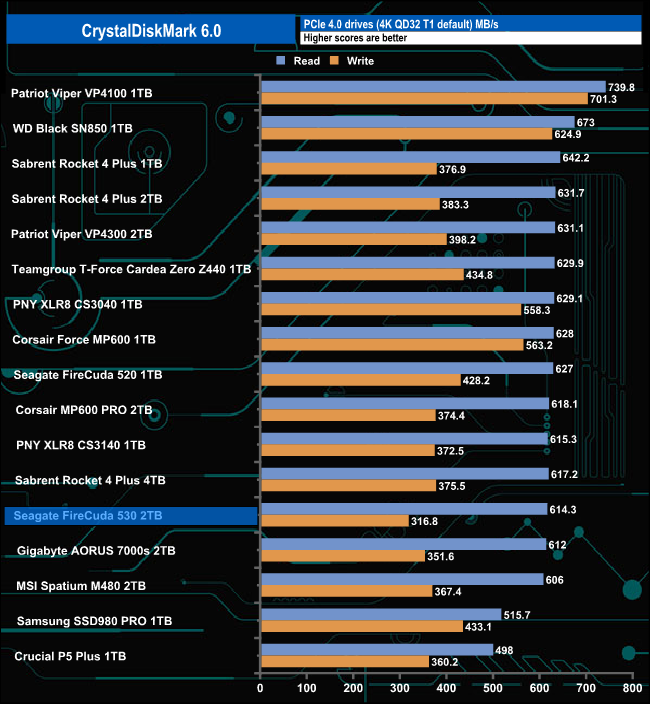
The FireCuda 530 seems to struggle with CrystalDiskMark's QD32 1 Thread test as it sits in the bottom half of our result chart.
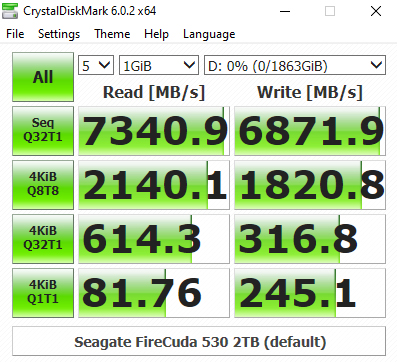
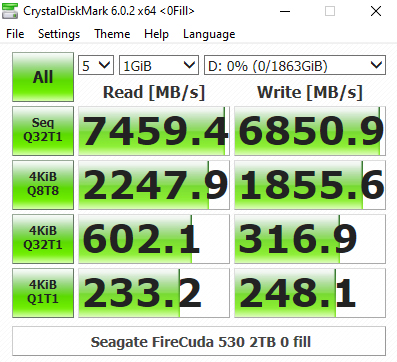
With CrystalDiskMark could also confirm the official Sequential maximum performance read figure for the drive of 7,300MB/s with a test result of 7,400MB/s. The best-tested write figure of 6,880MB/s also confirms the official best of 6,900MB/s. Looking at all the CrystalDiskMark results screens we can see that the Phison E18 controller that powers the FireCuda 530 is much more efficient when reading compressible sequential and 4K data at certain queue depths.
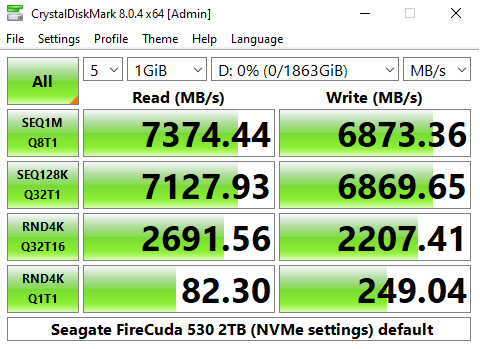
CrystalDiskMark 8 default
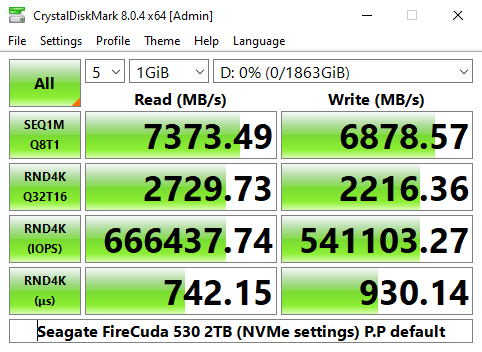
CrystalDiskMark 8 Peak Performance
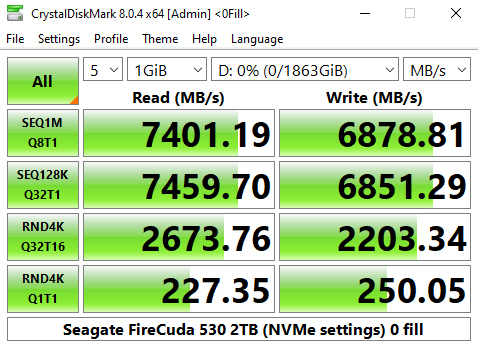
CrystalDiskMark 8 Real World
Using the more advanced CrystalDiskMark 8 in its default setting as well as the Peak Performance and Real World profiles saw the Sequential test results confirm the official 7,300MB/s reads and 6,900MB/s writes with the best test results of 7,401MB/s and 6,880MB/s for reads and writes respectively.
Seagate rate the 4K performance of the drive as up to 1,000,000 IOPS for read and writes. Using the Peak Performance profile we couldn't get close to those figures with a best read figure of 666,437.74 IOPS and 541,103 IOPS for writes, both from the default setting.
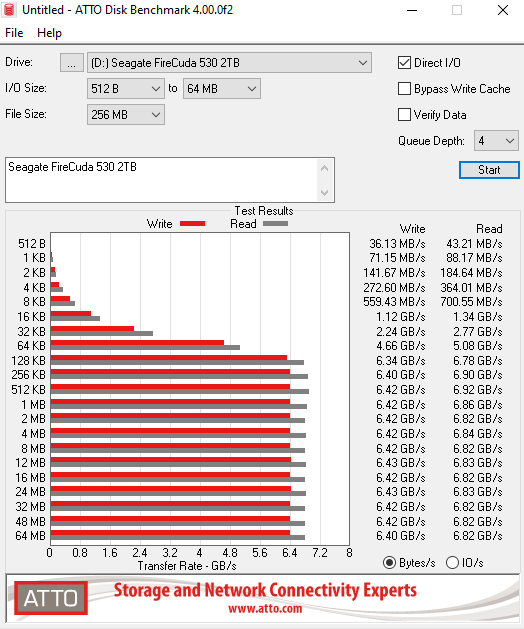
The ATTO Disk Benchmark performance measurement tool is compatible with Microsoft Windows. Measure your storage systems performance with various transfer sizes and test lengths for reads and writes. Several options are available to customize your performance measurement including queue depth, overlapped I/O and even a comparison mode with the option to run continuously. Use ATTO Disk Benchmark to test any manufacturers RAID controllers, storage controllers, host adapters, hard drives and SSD drives and notice that ATTO products will consistently provide the highest level of performance to your storage.
We are using version 4.0 for our NVMe disk tests.
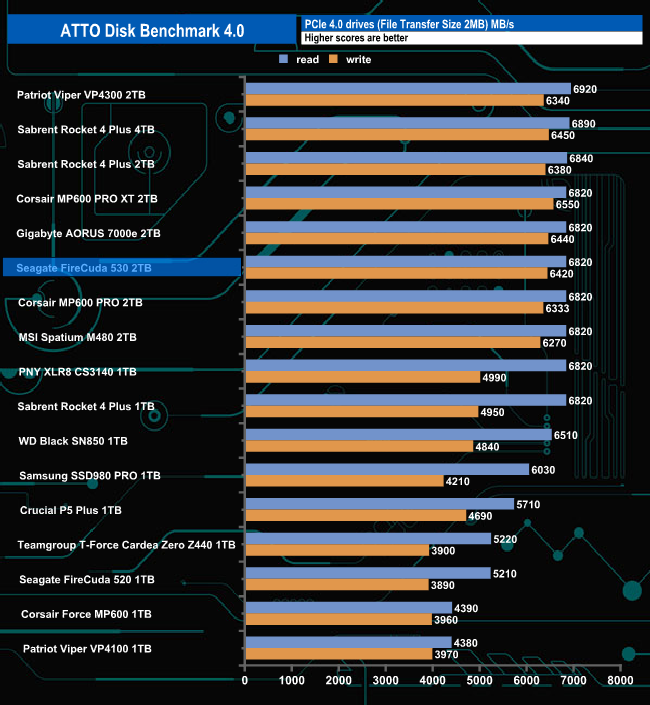
Seagate rate the Sequential performance of the 2TB version of the FireCuda 530 as up to 7,300MB/s for reads and up to 6,900MB/s for writes. Using the ATTO benchmark we couldn't quite hit the maximums for the drive with tested read and writes figures of 6,820MB/s and 6,420MB/s respectively.
Both tested figures are a large improvement over the previous Gen.4 drive, the FireCuda 520 which produced figures of 5.210MB/s for reads and 3,890MB/s for writes.
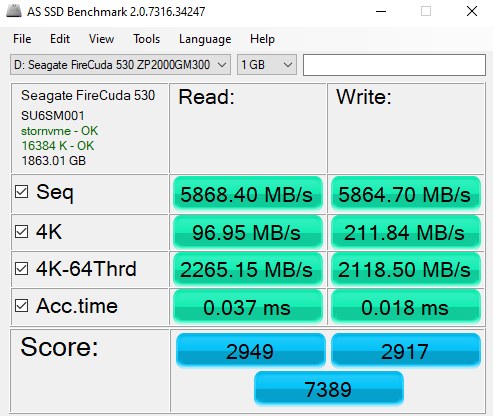
AS SSD is a great free tool designed just for benching Solid State Drives. It performs an array of sequential read and write tests, as well as random read and write tests with sequential access times over a portion of the drive. AS SSD includes a sub suite of benchmarks with various file pattern algorithms but this is difficult in trying to judge accurate performance figures.
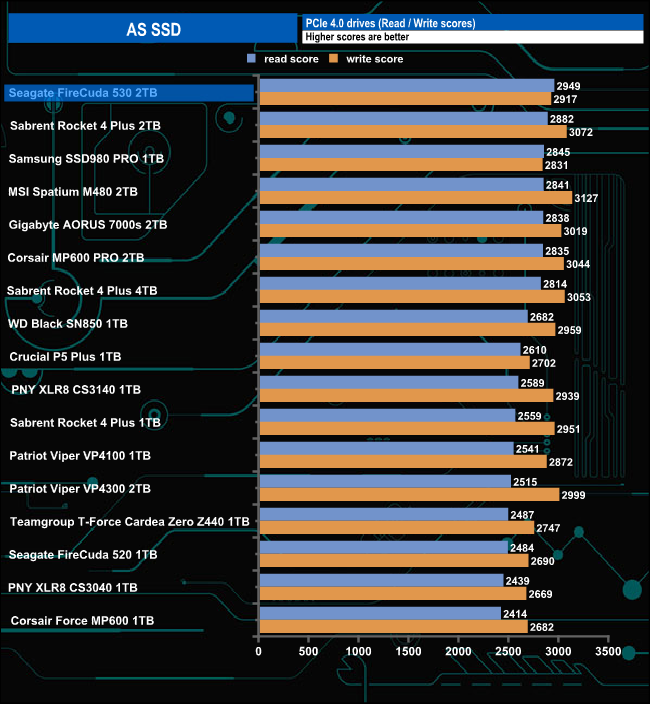
With a read score of 2949, the Seagate FireCuda 530 sits firmly on the top of the results chart although its write score of 2917 is less impressive. The FireCuda 530's scores show significant improvements over the previous generation FireCuda 520 scores of 2484 and 2690 for reads and writes respectively.
We used CrystalDiskMark 8‘s custom settings to test the Sequential read and write performance of the drive through a range of queue depths. The setup for the tests is listed below.
128KB Sequential Read / Write.
Transfer Request Size: 128KB, Thread(s): 1, Outstanding I/O: 1-32.
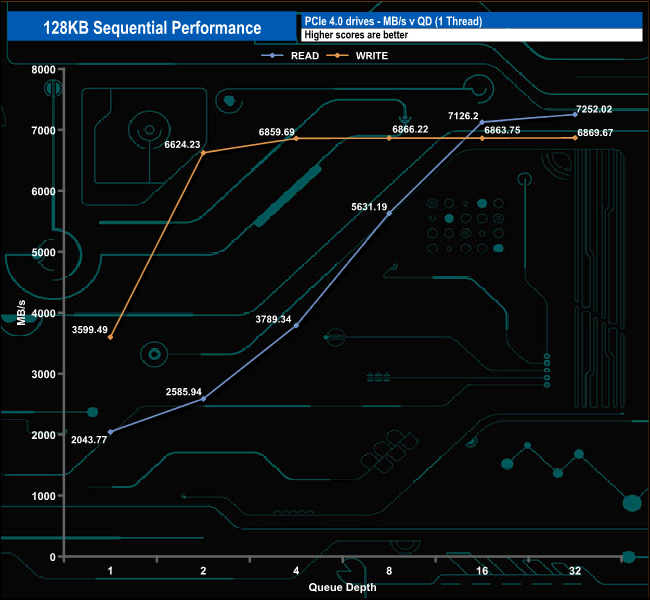
The best Sequential read figure we saw in this test of 7,252.02MB/s is a little short of the official maximum of 7,300MB/s. The best write test figure of 6,869.67MB/s is closer to the official best of 6,900MB/s.
128KB Sequential Read Performance v QD compared
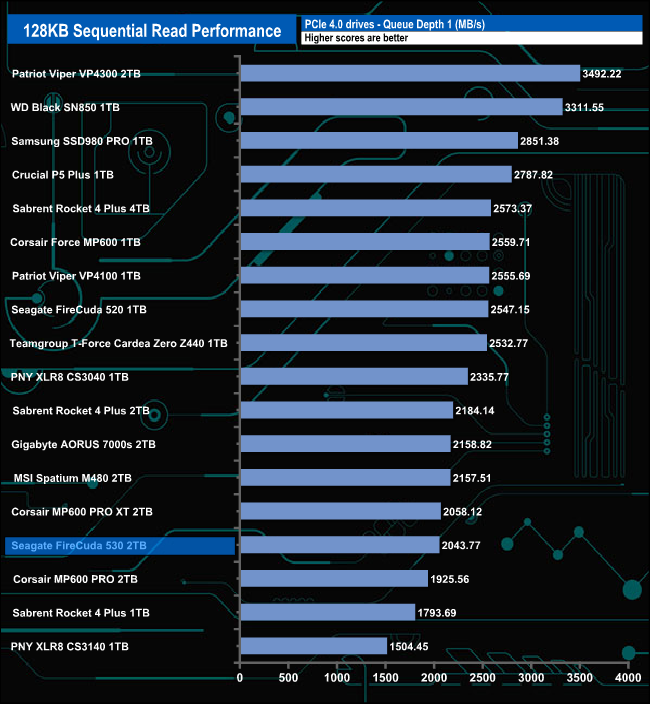
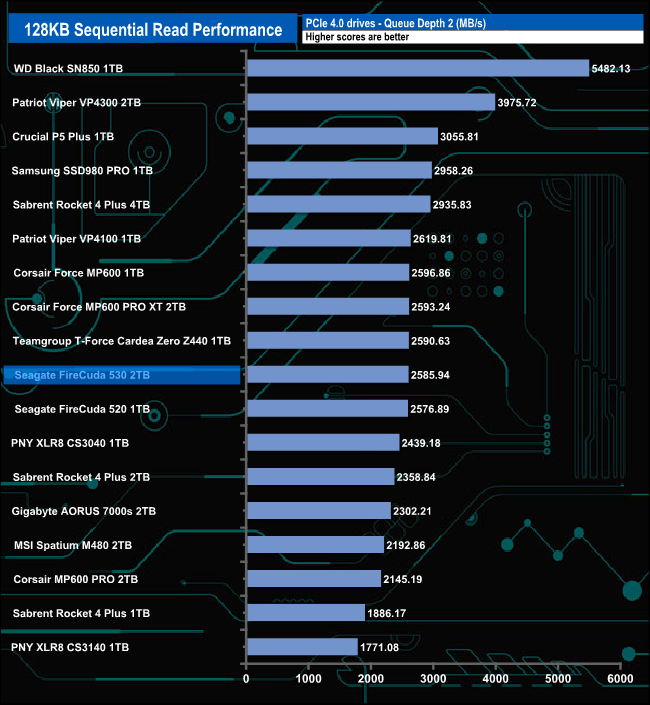
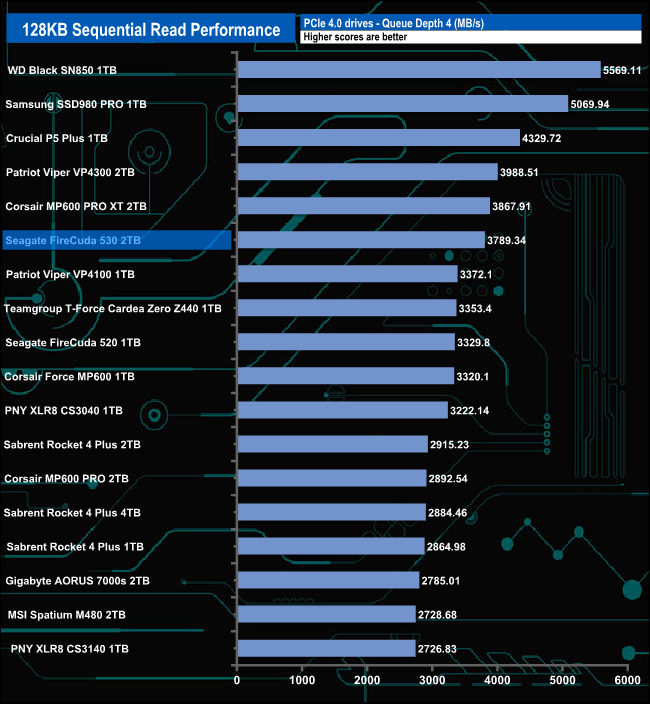
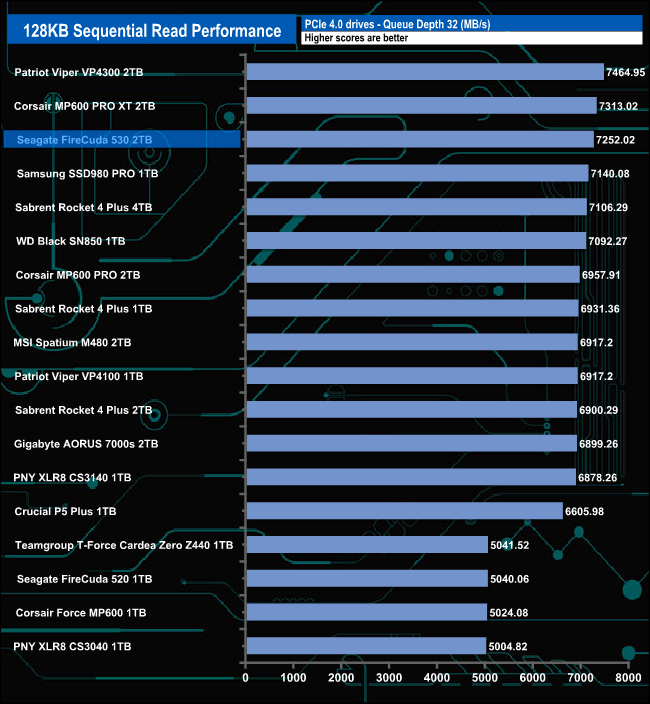
At QD1, the FireCuda 530 sits near the bottom of the results chart, some way behind the previous generation FireCuda 520. However, as the queue depth deepens the FireCuda 530 starts to pull away from the older drive. At QD32 the FireCuda 530 is the third-fastest consumer drive we've seen to date in this test and is some 2,321MB/s faster than the 1TB FireCuda 520.
128KB Sequential Write Performance v QD compared
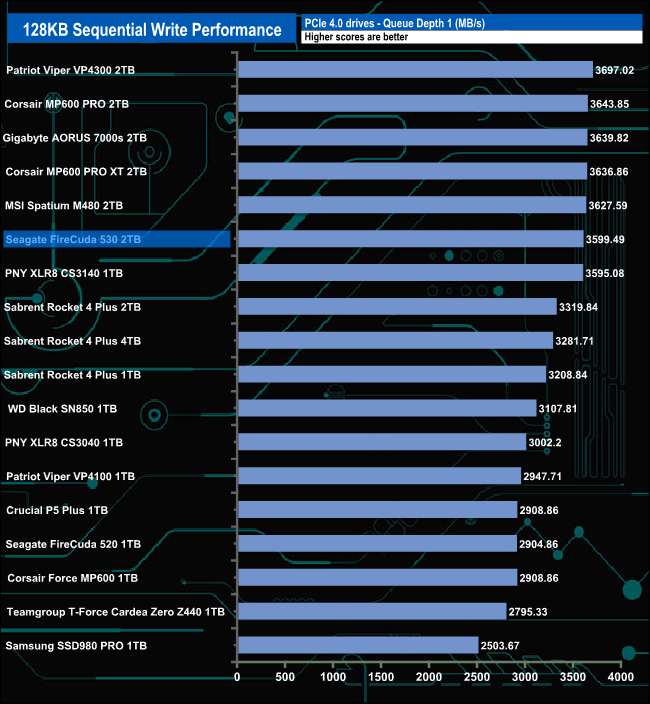
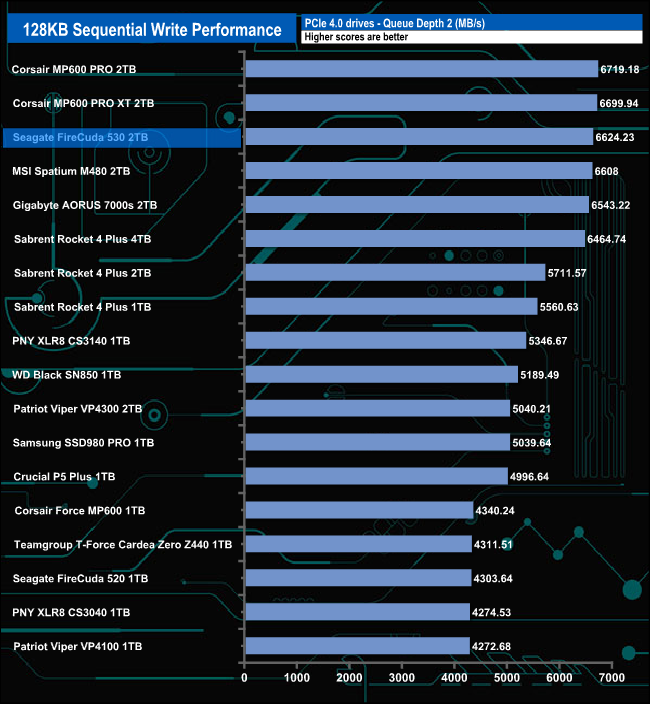
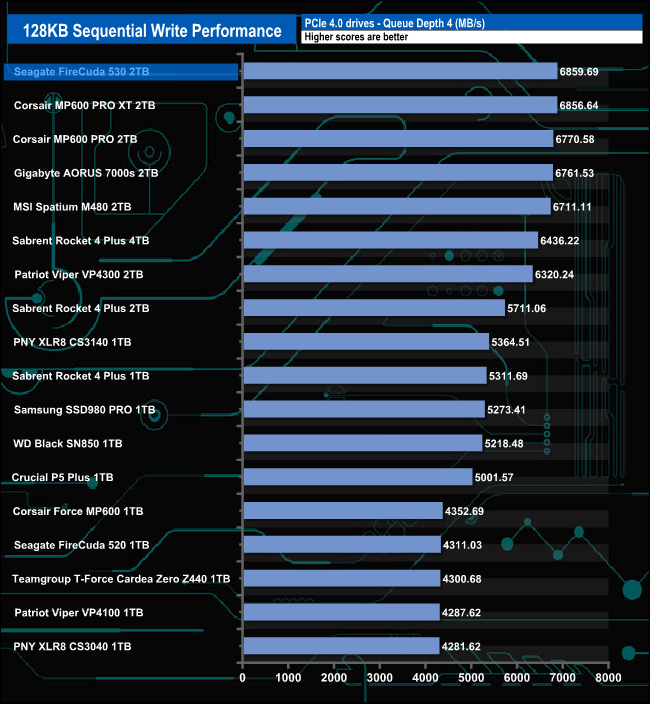
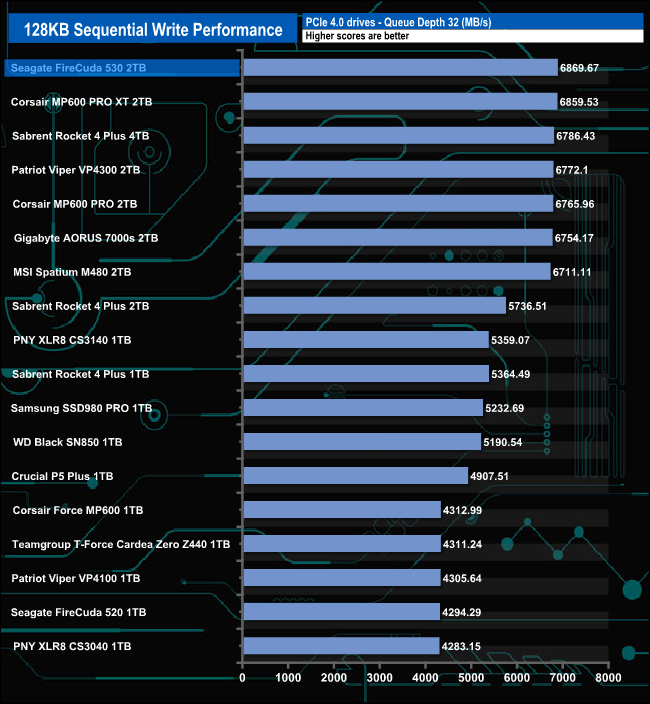
When it comes to Sequential write performance, the FireCuda 530 sits in sixth position in the results chart at QD1, moving up to third at QD2. At both QD4 and QD32, the drive sits on top of the pile. At all the tested queue depths the new drive is much faster than the previous generation FireCuda 520 when it comes to Sequential writes.
We used CrystalDiskMark 8‘s custom settings to test the 4K random read performance of the drive through a range of queue depths. The setup for the tests is listed below.
Transfer Request Size: 4KB, Outstanding I/O: 1-32.
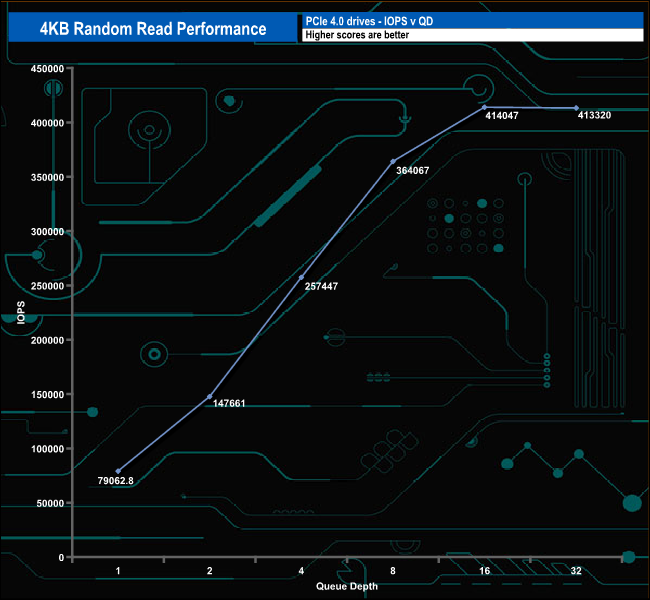
The official maximum 4K random read figure for the 2TB Seagate FireCuda 530 is up to 1,000,000 IOPS. With our 4-threaded testing, we couldn't get close to this maximum figure with a best test result of 414,047 IOPS at a queue depth of 16.
4K Random Read v QD comparison
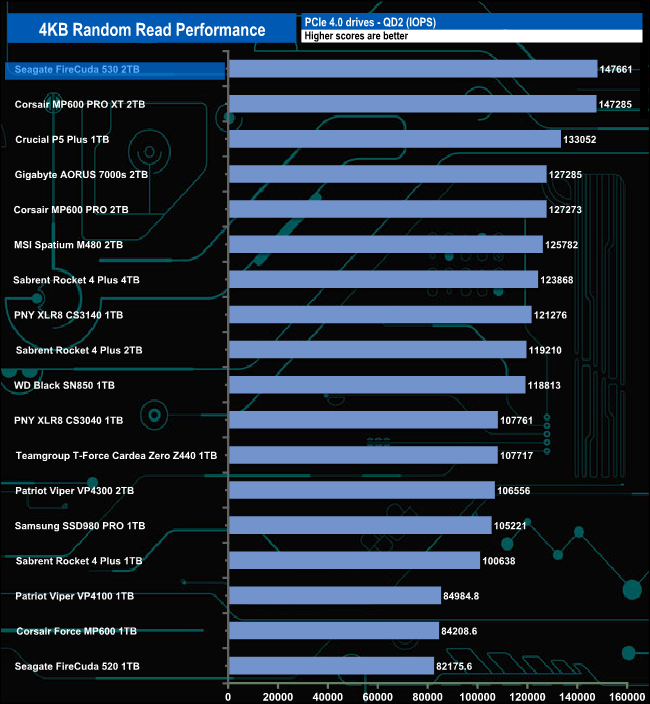
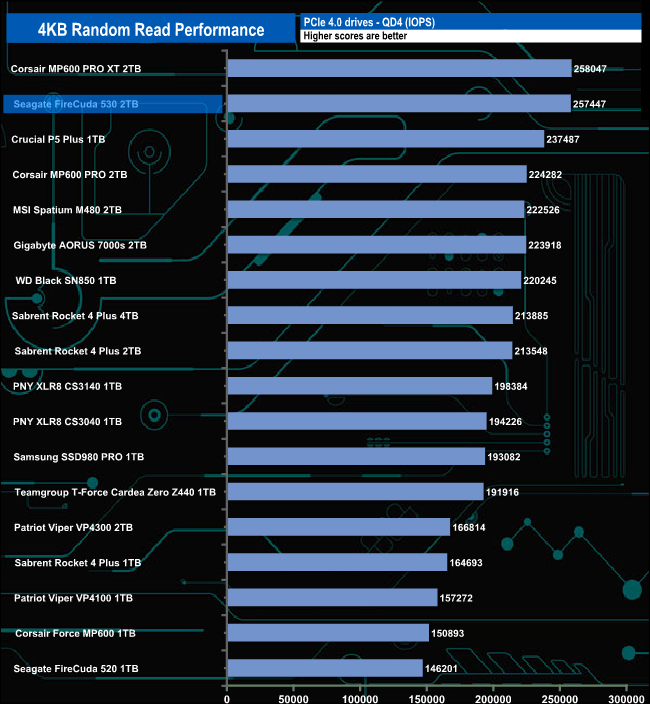
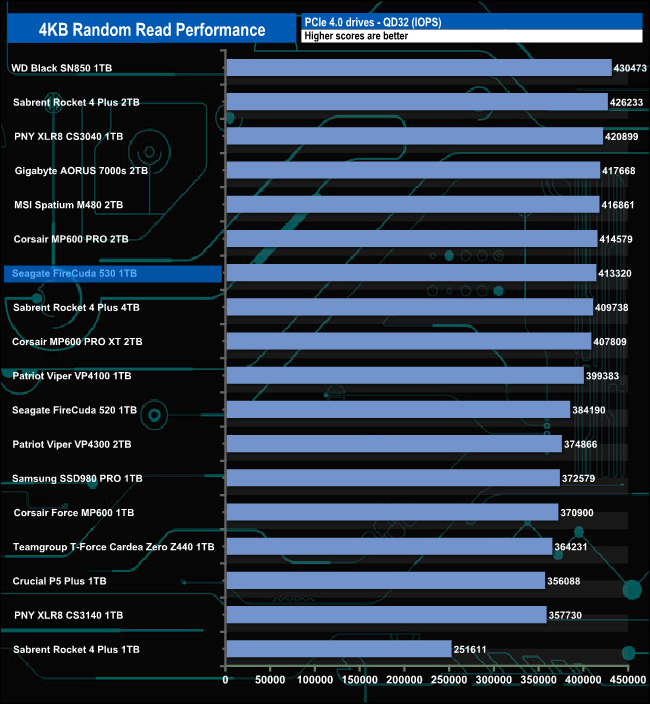
At QD2, the Seagate FireCuda 530 is the fastest consumer drive we've seen to date for random reads. However, as the queue depth deepens the drive slips further down the chart until at QD32 it's sitting just inside the top ten drives tested.
We used CrystalDiskMark 8‘s custom settings to test the 4K random Write performance of the drive through a range of queue depths. The setup for the tests is listed below.
Transfer Request Size: 4KB, Outstanding I/O: 1-32.
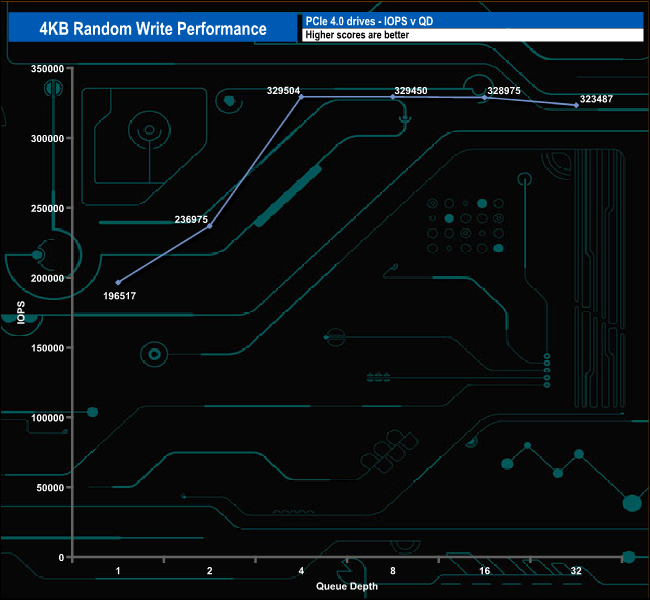
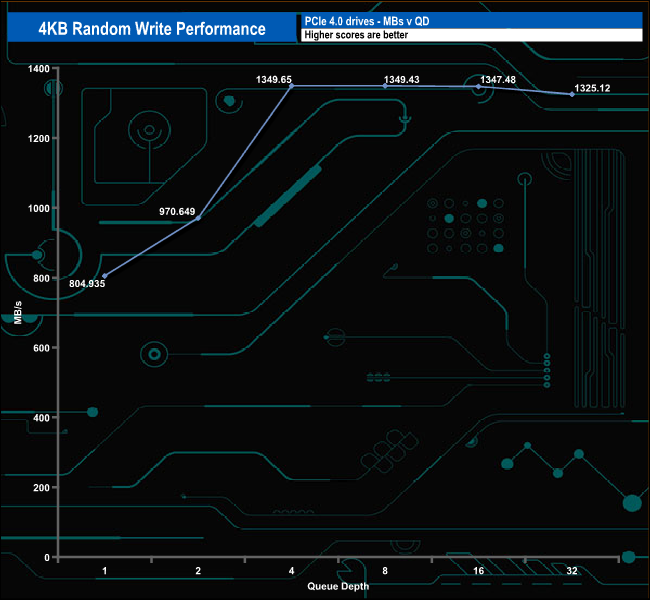
As with 4K random reads, Seagate rates the random write performance of the FireCuda 530 as up to 1,000,000 IOPS. As with the random reads we couldn't get close to this figure with our four-threaded testing with the drive peaking at 329,504 IOPS at QD4.
4K Random Write v QD comparison
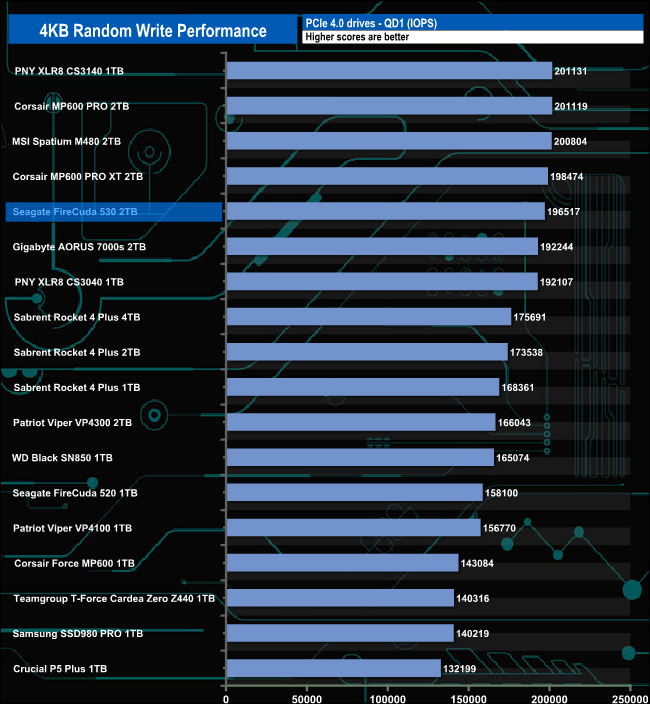
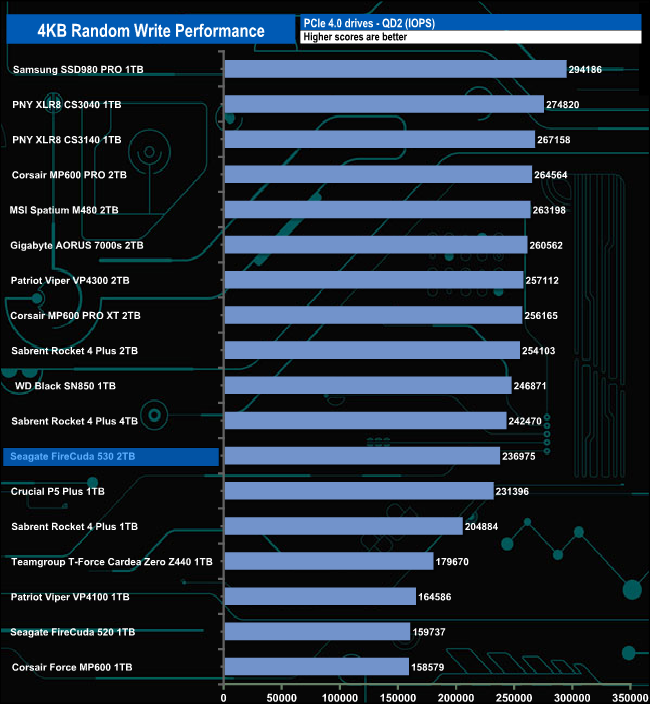
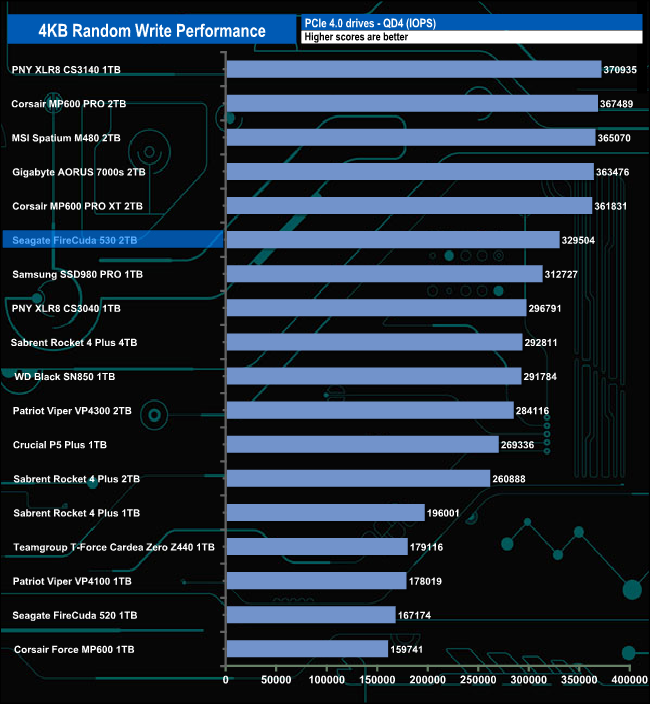
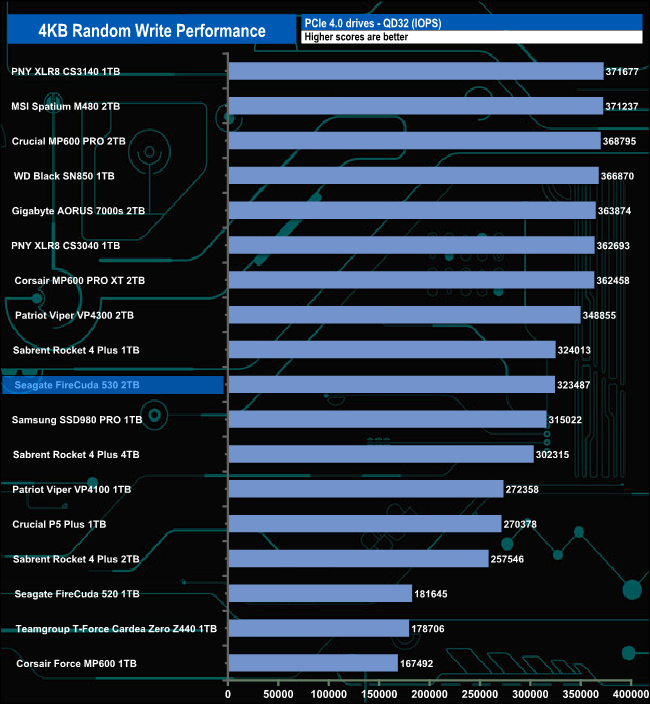
In our testing, the drives best performance in relation to the other drives around it comes at QD1. At all the tested queue depths the FireCuda 530 shows a leap in performance over the previous generation FireCuda 520.
We used CrystalDiskMark 8’s custom settings to test the 4K 70/30 mixed read/write performance of the drive through a range of queue depths.
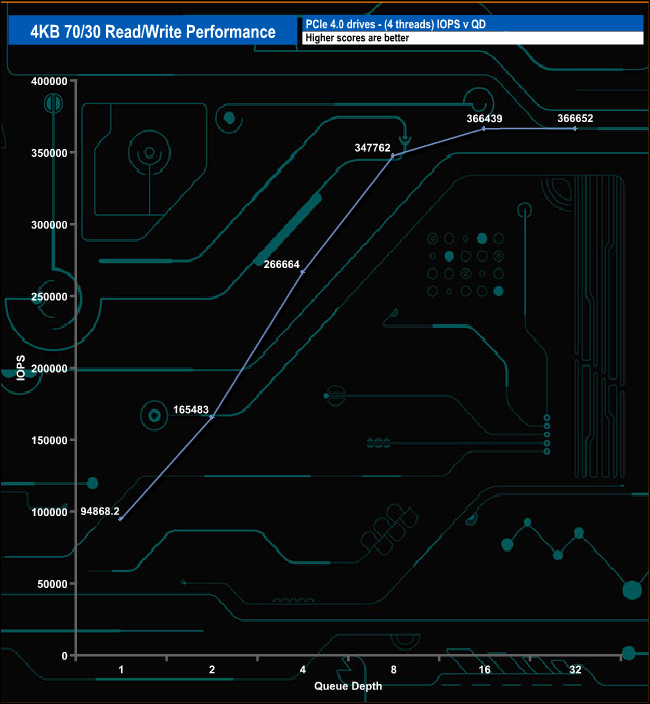
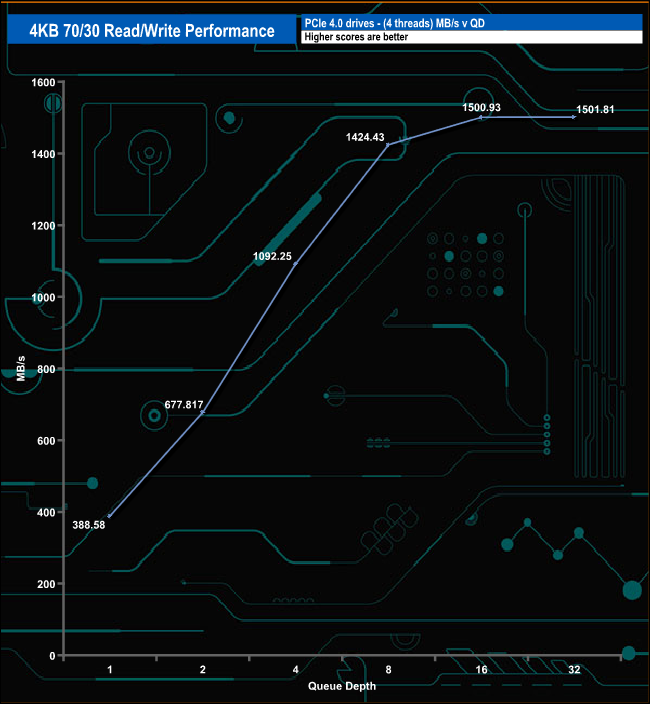
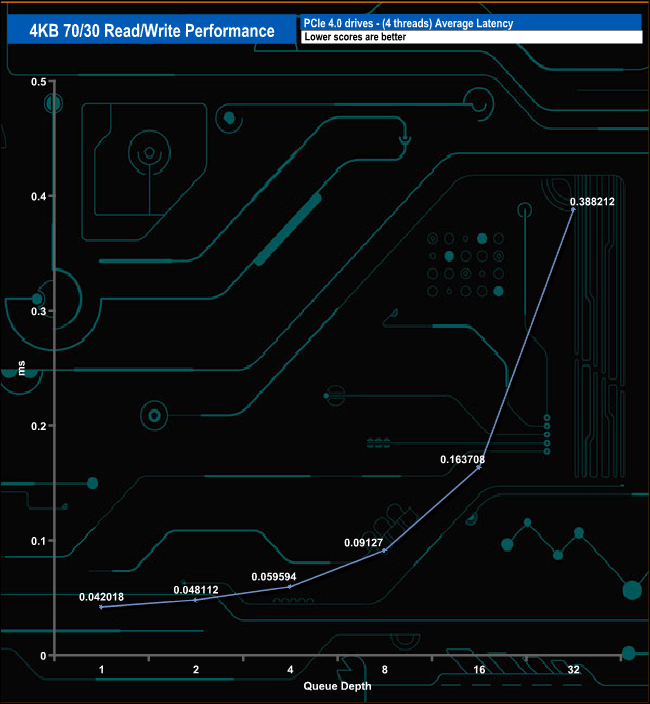
In the 4K 70/30 read/write mixed test the FireCuda 530’s performance climbs smoothly through the queue depths until QD16, where the performance begins to level off.
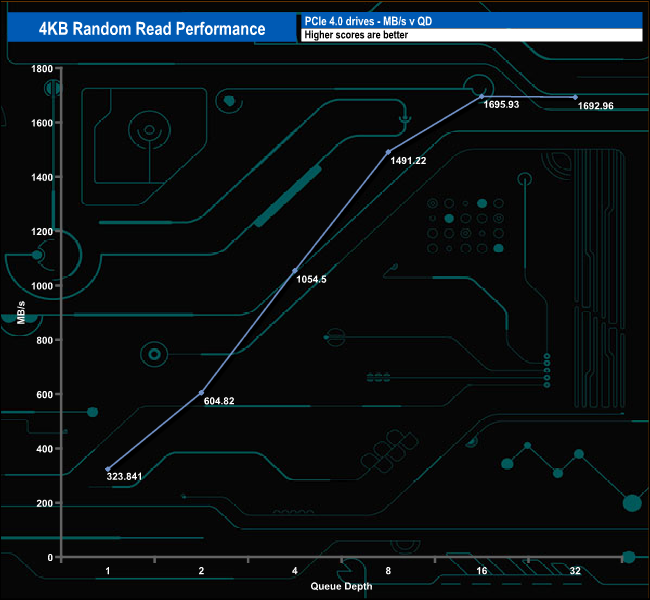
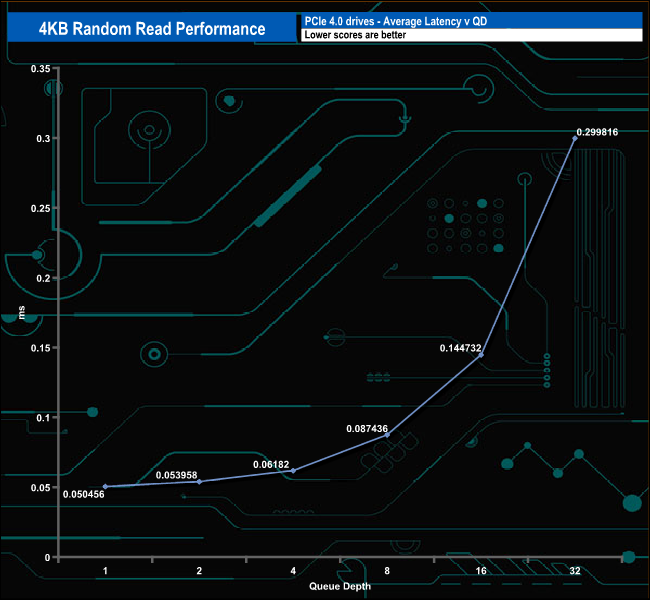
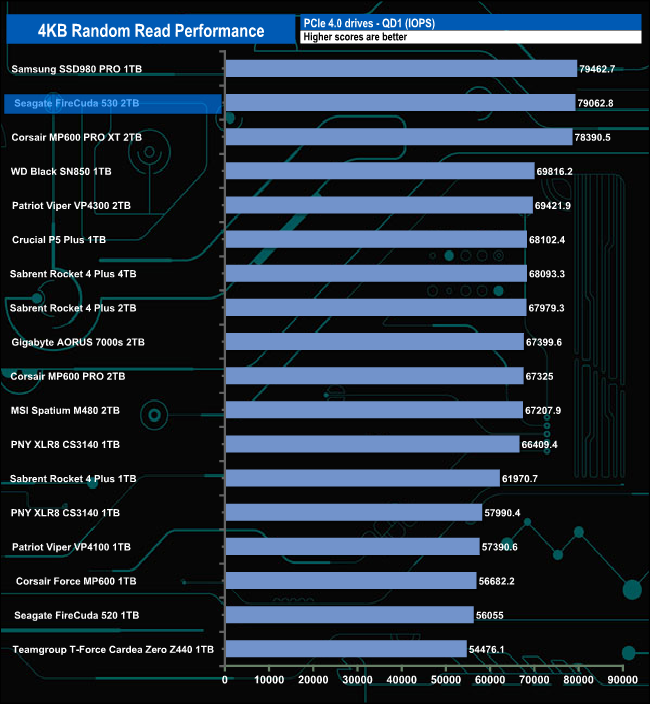
We used CrystalDiskMark 8 to test the random performance of the drive at lower queue depths (QD1 – QD8 where most of the everyday workloads occur) using 1 to 4 threads.
4K Random Reads v QD
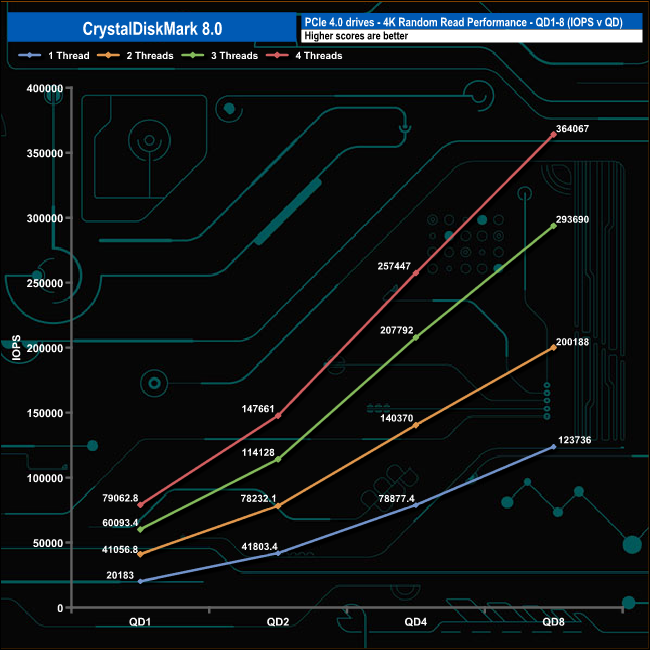
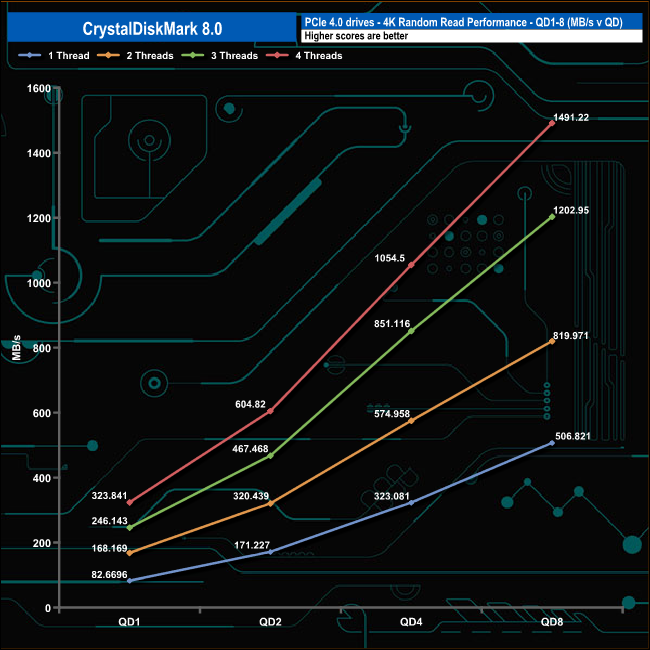
At QD1 the performance of the 2TB Seagate FireCuda 530 ranges from 20,183 IOPS (82.6MB/s) using a single thread up to 79,062 IOPS (323.8MB/s) using four threads. The drive's performance increases smoothly as the queue depth deepens for each thread count.
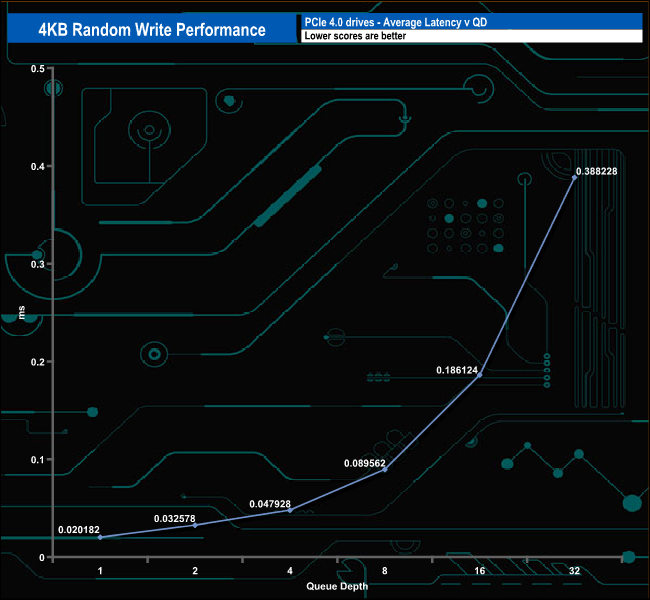
4K Random Writes v QD
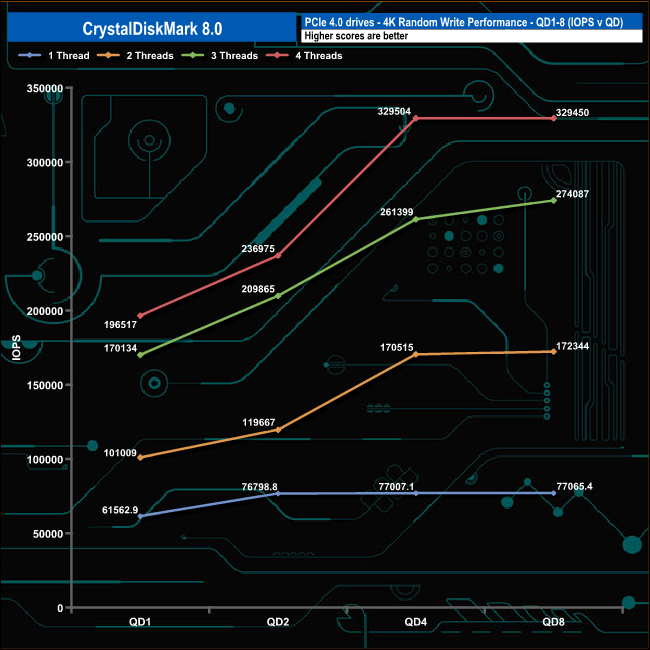
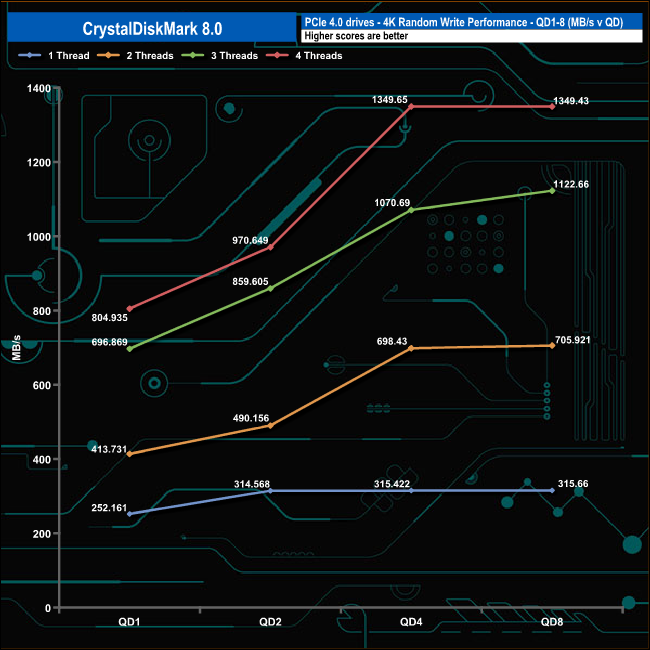
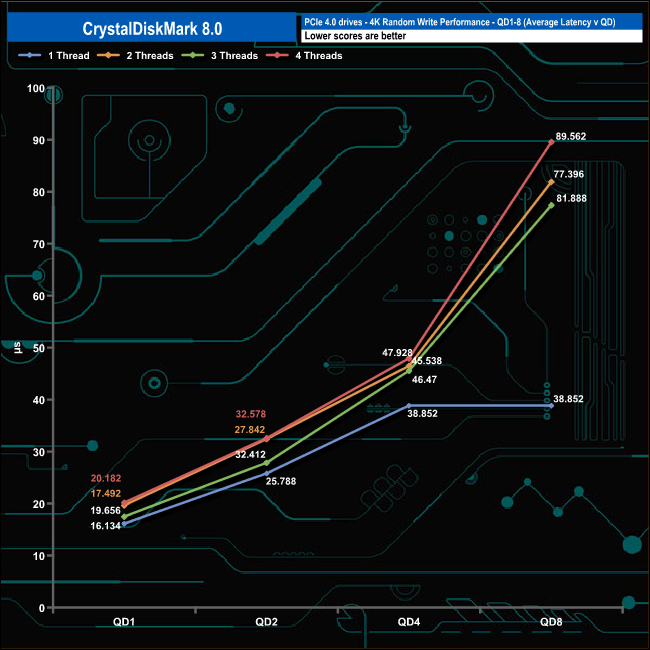
Using a single thread the random write performance slowly increases from QD1 to QD2 before beginning to plateau out. Using two and four threads the drive accelerates sharply from QD2 to QD4 before they too start levelling off. The only time the performance doesn't seem to be levelling off to any extent is when it's being tested using three threads.
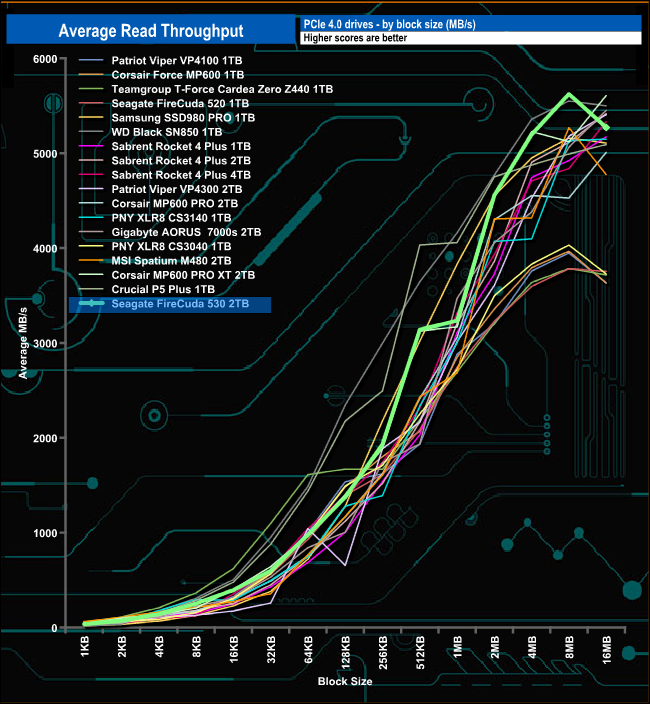
In our read throughput test the FireCuda 530 peaks at 5,623.58MB/s (8MB block) which is some distance from the official maximum of 7,300MB/s.
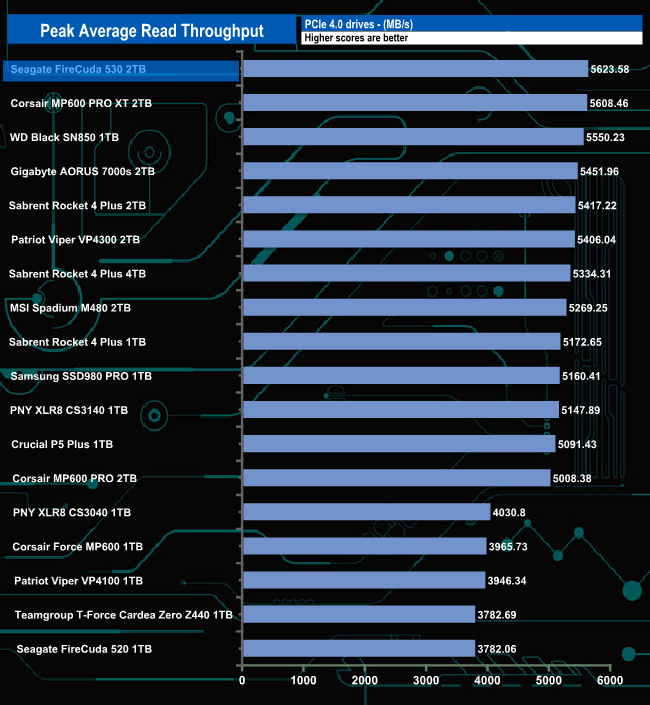
Although the test result of 5,623.58MB/s is well short of the official maximum for the drive, it's good enough to plant the FireCuda 530 on top of our results chart. This is in marked contrast to the previous generation FireCuda 520 which sits in the last position in the chart.

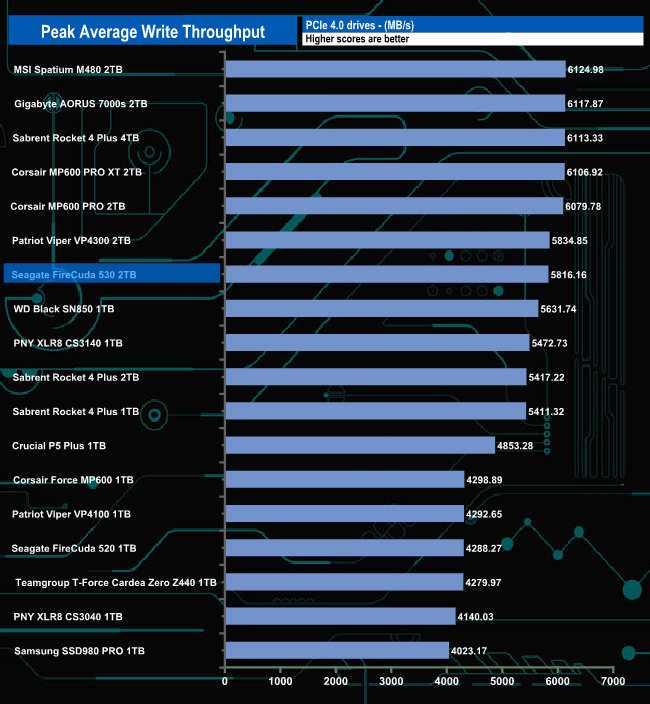
In our write throughput test, the FireCuda 530 peaked at 5,816.156MB/s (16MB block), some way short of the official maximum of 6,900MB/s. Unlike the read result, this is only good enough to put the drive into seventh place on our list.
The PCMark 10 Full System Drive Benchmark uses a wide-ranging set of real-world traces from popular applications and common tasks to fully test the performance of the fastest modern drives. The benchmark is designed to measure the performance of fast system drives using the SATA bus at the low end and devices connected via PCI Express at the high end.
The goal of the benchmark is to show meaningful real-world performance differences between fast storage technologies such as SATA, NVMe, and Intel’s Optane. The Full System Drive Benchmark uses 23 traces, running 3 passes with each trace. It typically takes an hour to run.
Traces used:
Booting Windows 10.
Adobe Acrobat – starting the application until usable.
Adobe Illustrator – starting the application until usable Adobe Premiere Pro – starting the application until usable.
Adobe Photoshop – starting the application until usable.
Battlefield V – starting the game until the main menu.
Call of Duty Black Ops 4 – starting the game until the main menu.
Overwatch – starting the game until main menu.
Using Adobe After Effects.
Using Microsoft Excel.
Using Adobe Illustrator.
Using Adobe InDesign.
Using Microsoft PowerPoint.
Using Adobe Photoshop (heavy use).
Using Adobe Photoshop (light use).
cp1 Copying 4 ISO image files, 20 GB in total, from a secondary drive to the target drive (write test).
cp2 Making a copy of the ISO files (read-write test).
cp3 Copying the ISO to a secondary drive (read test).
cps1Copying 339 JPEG files, 2.37 GB in total, to the target drive (write test).
cps2 Making a copy of the JPEG files (read-write test).
cps3 Copying the JPEG files to another drive (read test).
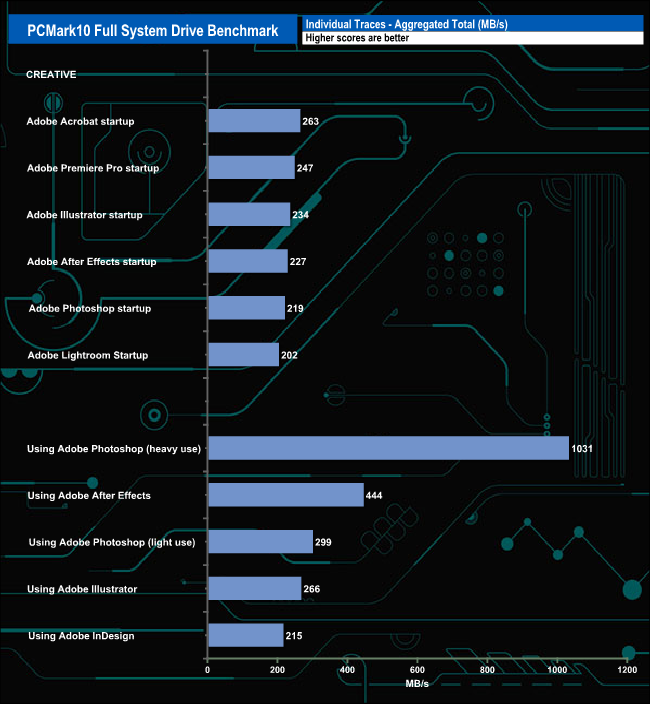
Seagate's FireCuda 530 handled the PCMark10 Full System Drive benchmark without any real problems. It was pretty consistent in the Adobe startup tests, averaging 232MB/s for the six tests. The 1,031MB/s result for the Adobe Photoshop (heavy use) trace was very good as was the 444MB/s for the Adobe After Effects usage trace.
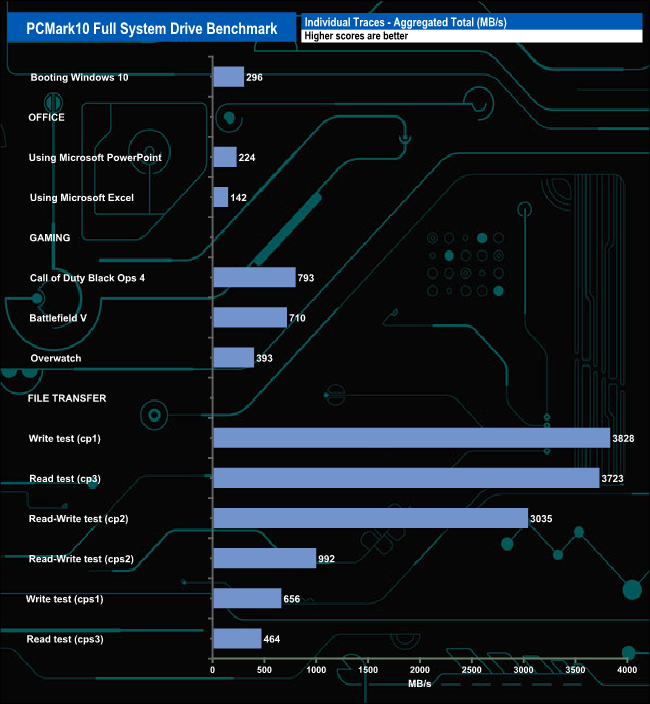
It also scored well in the three iso read/write (cp1, cp2 and cp3) test traces.
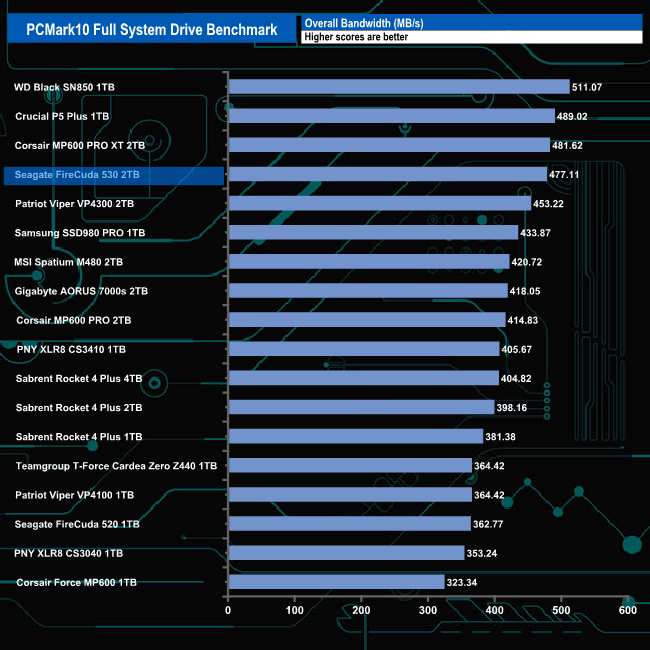
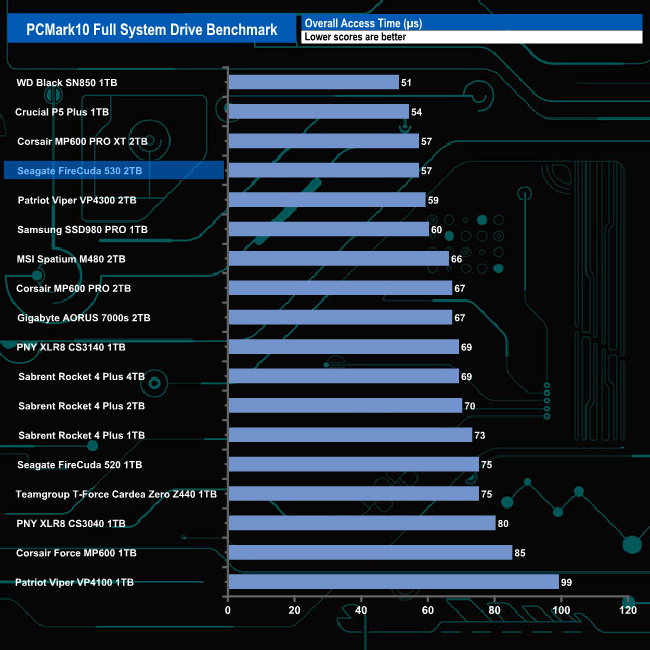
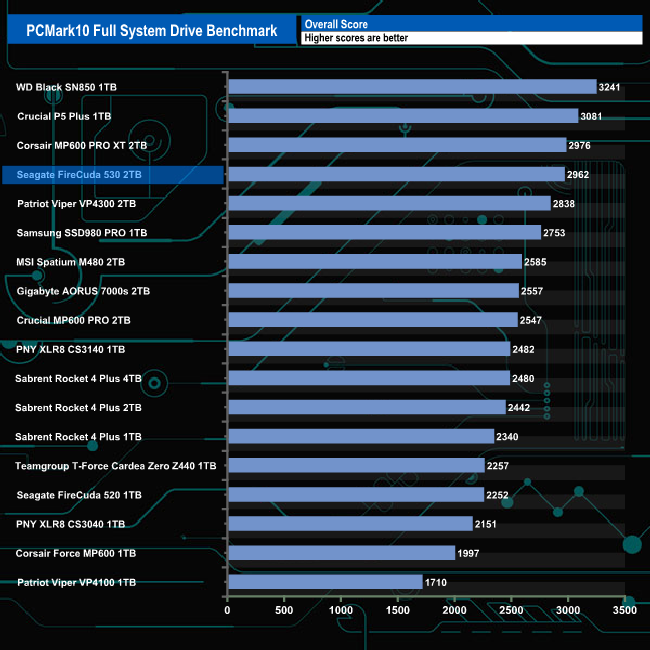
The overall bandwidth figure for the benchmark of 477.11MB/s that the FireCuda 530 produced is 114.34MB/s faster than the score of the FireCuda 520 and its access time is some 18μs faster than the older drive.
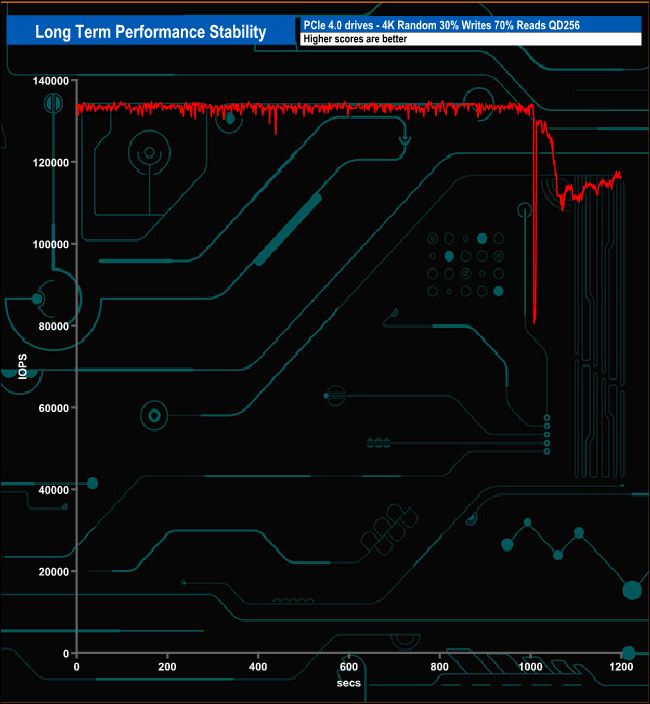
For the long term performance stability test, we set the drive up to run a 20-minute 4K random test with a 30% write, 70% read split, at a Queue Depth of 256 over the entire disk. The Seagate FireCuda 530 averaged 130,598 IOPS for the test with an enterprise segment worthy performance stability of 97%.
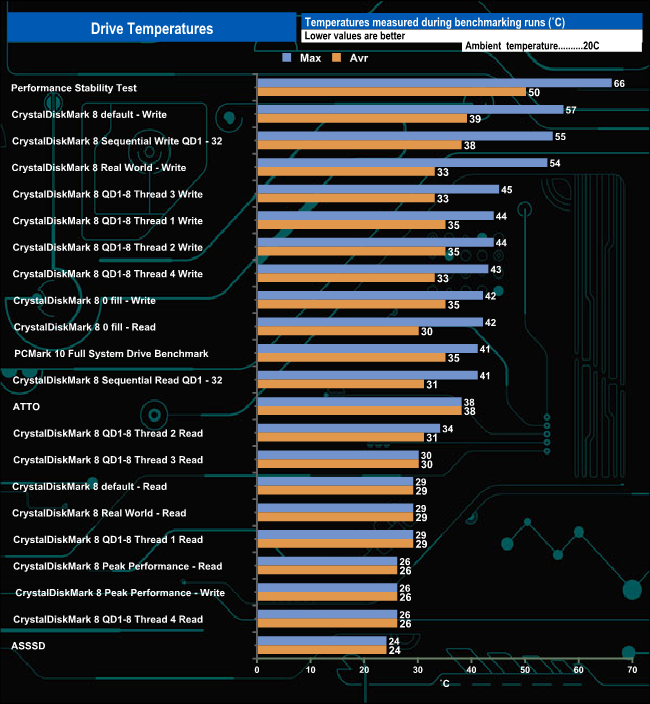
We took note of the drive’s temperature during some of our benchmarking runs. The drive we are looking at here is the plain, non-heatsink equipped drive and it does get pretty hot when pushed hard. The drive reached 66° C (with a 20° C ambient temperature) during the Performance Stability test, but it must be said there didn't appear to be any throttling issues during any of the test runs.
To test real-life performance of a drive we use a mix of folder/file types and by using the FastCopy utility (which gives a time as well as MB/s result) we record the performance of drive reading from & writing to a 256GB Samsung SSD850 PRO.
We use the following folder/file types:
- 100GB data file.
- 60GB iso image.
- 60GB Steam folder – 29,521 files.
- 50GB File folder – 28,523 files.
- 12GB Movie folder – (15 files – 8 @ .MKV, 4 @ .MOV, 3 @ MP4).
- 10GB Photo folder – (304 files – 171 @ .RAW, 105 @ JPG, 21 @ .CR2, 5 @ .DNG).
- 10GB Audio folder – (1,483 files – 1479 @ MP3, 4 @ .FLAC files).
- 5GB (1.5bn pixel) photo.
- BluRay Movie – 42GB.
- 21GB 8K Movie demos – (11 demos)
- 16GB 4K Raw Movie Clips – (9 MP4V files).
- 4.25GB 3D Printer File Folder – (166 files – 105 @ .STL, 38 @ .FBX, 11 @ .blend, 5 @ .lwo, 4 @ .OBJ, 3@ .3ds).
- 1.5GB AutoCAD File Folder (80 files – 60 @ .DWG and 20 @.DXF).
![]()
![]()
The Seagate FireCuda 530 handled our real-life file testing without displaying any real problems averaging 521MB/s writing the larger test files to the drive and 445MB/s when reading the data back again. The two slowest transfers were the 60GB Steam Folder (332MB/s write, 376MB/s read) and the 50GB file folder (234MB/s write, 314MB/s read).
To get a measure of how much faster PCIe NVMe drives are than standard SATA SSD's we use the same files but transfer to and from a 2TB Kioxia Exceria Plus drive:
![]()
![]()
Switching over to an all NVMe storage environment we see write speeds of over 2GB/s for ten out of the thirteen tests, averaging 2,875MB/s for the ten with the fastest being the 2,954MB/s for the 60GB iso transfer. Reading the data back, the same ten tests averaged 2,313MB/s, the fastest being the 2,644MB/s for the 8K Movie Scenes transfer test.
Seagate's first venture into the PCIe Gen4 SSD market was the FireCuda 520, but now we have the 2nd generation Seagate Gen4 drive in the shape of the FireCuda 530, a much more capable SSD that is using a faster controller and the latest in consumer NAND technology.
The Seagate FireCuda 520 used a combination of a Phison PS5016-E16 controller and BiCS4 96-Layer 3D TLC NAND. The company have upped the ante with the FireCuda 530 as it uses the more advanced Phison PS5018-E18 controller linked to Micron's B47R 176-layer 3D TLC NAND. The FireCuda 530 line is made up of four capacities (one more than the FireCuda 520); 500GB. 1TB, 2TB and the new 4TB flagship drive.
The new NAND technology plus the more modern and efficient controller sees the FireCuda 530 offering much more in the way of performance than the previous drive. The 2TB FireCuda 520 topped out at 5,000MB/s and 4,400MB/s for Sequential read and writes respectively. The FireCuda 530 raises these to up to 7,300MB/s for reads and 6,900MB/s for writes. As for 4K random performance, the FireCuda 520 is rated at up to 750,000 IOPS for reads and up to 700,000 IOPS for writes. Both are taken up to 1,000,000 IOPS for the 2TB FireCuda 530.
Using CrystalDiskMark 8 we could confirm the official Sequential read figure of 7,300MB/s with a best test figure of 7459MB/s (default 0 fill) while the best write test figure of 6,880MB/s (Peak Performance Profile) is just under the 6,900MB/s official maximum.
When it comes to 4K random performance, we couldn't get close to the official maximums of 1,000,000 IOPS for read and writes, the best we saw during testing was 666,437 IOPS for reads and 541,103 IOPS for writes, both coming via testing with the default CrystalDiskMark Peak Performance Profile.
The 2TB FireCuda 530 gets a TBW rating of 2,550TB and as well as backing the drive with a five-year warranty, while Seagate also provides three years of their Rescue Data Recovery Services.
![]()
We found the 2TB Seagate FireCuda 530 on Overclockers UK for £319.99 (inc VAT) HERE.
Discuss on our Facebook page HERE.
Pros
- Overall Performance.
- Endurance.
- 5-year warranty.
Cons
- Couldn't get close to the official 4K figures under testing.
KitGuru says: Using a combination of a fast efficient controller and the latest 3D NAND technology, the FireCuda 530 takes the accolade as the fastest Seagate consumer drive to date.