We recently took a look at the first Solidigm-branded SSD, the P41 Plus, and now we have the second one in our hands, the P44 Pro. This is a much more capable drive and the company's current flagship Gen 4 client SSD, with the 1TB model on sale in the UK for around £120.
Like the P41 Plus, the P44 Pro comes in three capacities; an entry-level 512GB, 1TB (the drive we are reviewing here) and a flagship 2TB model but there the similarity ends as the P44 Pro is a completely different beast to the P41 Plus. The P41 Plus uses a DRAMless design 4-channel controller paired with 144-layer 3D QLC NAND, the P44 on the other hand uses a full-blown eight-channel controller paired with 176-layer 3D TLC NAND.
Performance-wise, Solidigm rates the Sequential read/write of the 1TB version of the P44 Pro as up to 7,000MB/s and 6,5000MB/s respectively. That 7,000MB/s read figure covers the whole range. Write speeds for the other two drives are up to 4,700MB/s for the 512GB entry-level model and up to 6,500MB/s for the 2TB drive, the same as the 1TB drive.
When it comes to 4K random performance the 1TB and 2TB drives get the same ratings for reads and writes; 1,400,000 IOPS and 1,300,000 IOPS respectively. The 512GB model is rated at up to 960,000 IOPS for reads and 1,000,000 IOPS for writes.
The endurance of the 1TB drive is rated at 750TBW, incidentally, the 512GB drive is rated at 500TBW and the 2TB 1,200TBW. Solidigm back the P44 with a 5-year warranty.
Physical Specifications:
- Usable Capacities: 1TB.
- NAND Components: SK hynix 176-layer 3D TLC.
- NAND Controller: SK hynix ACNS075 8-channel.
- Cache: SK hynix LPDDR4.
- Interface: PCIe 4.0 x4, NVMe 1.4.
- Form Factor: M.2 2280.
- Dimensions: 80 x 22mm.
- Drive Weight: 7g.
Firmware Version: 001C.
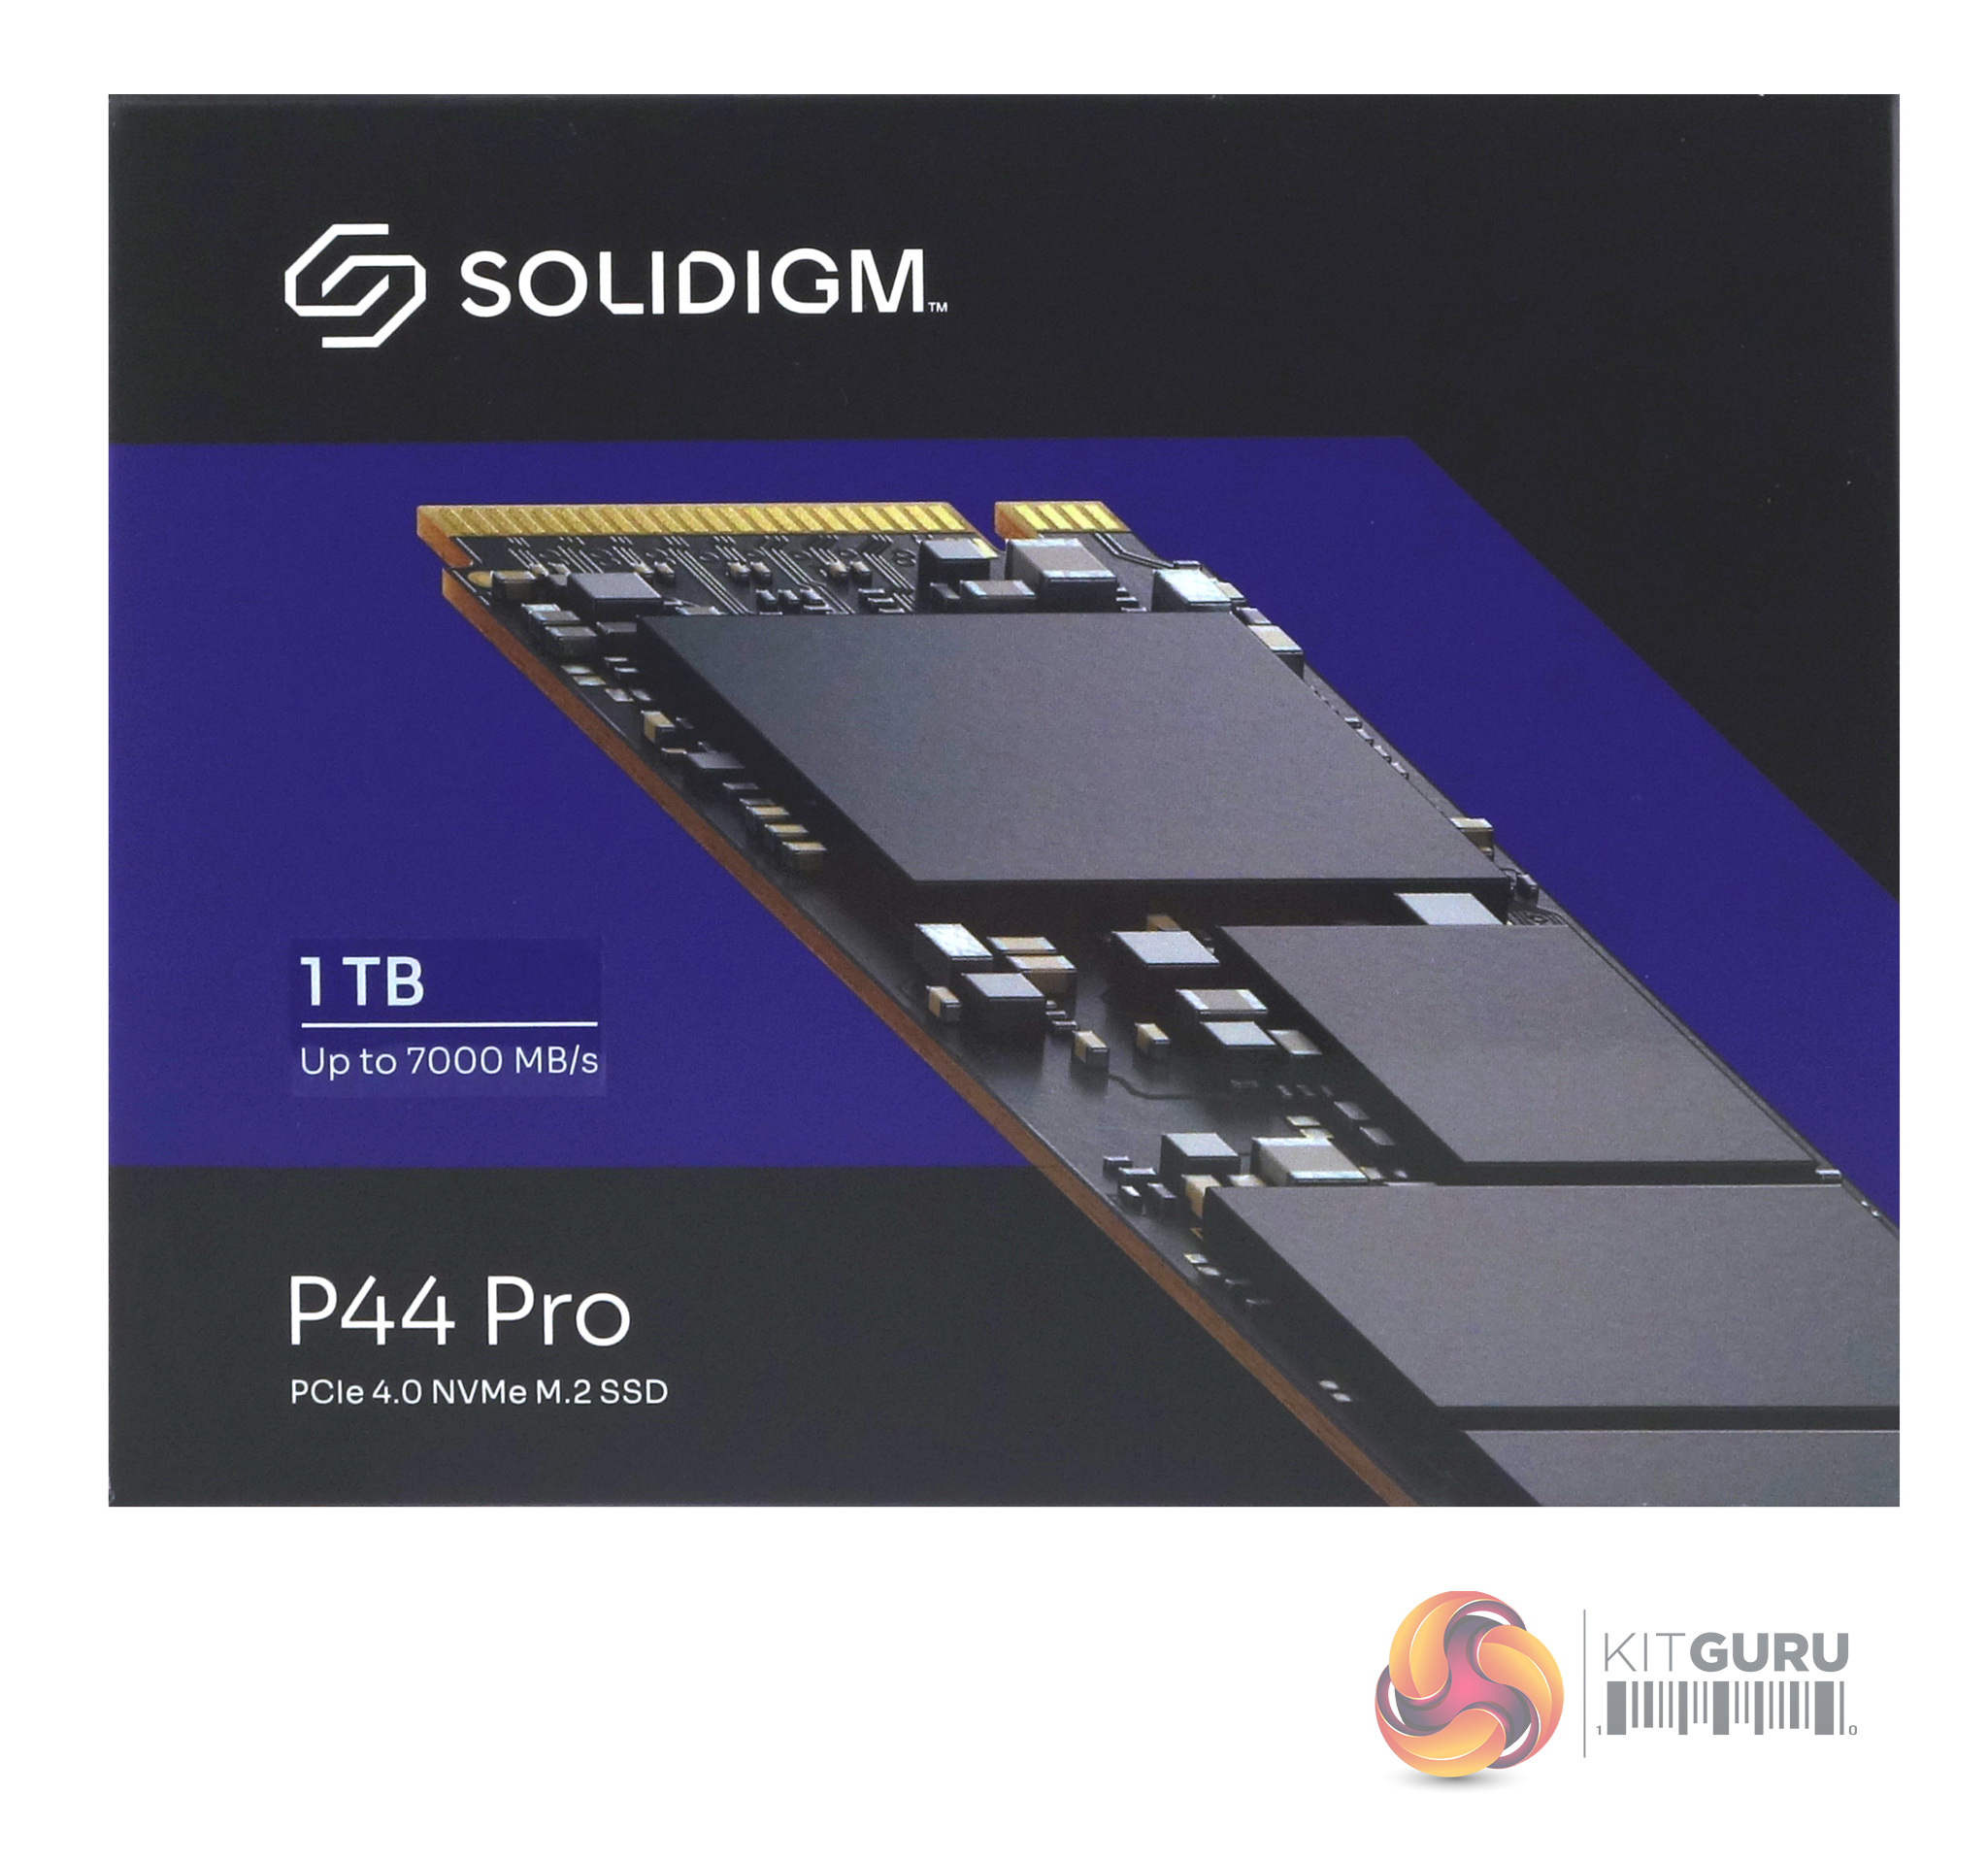
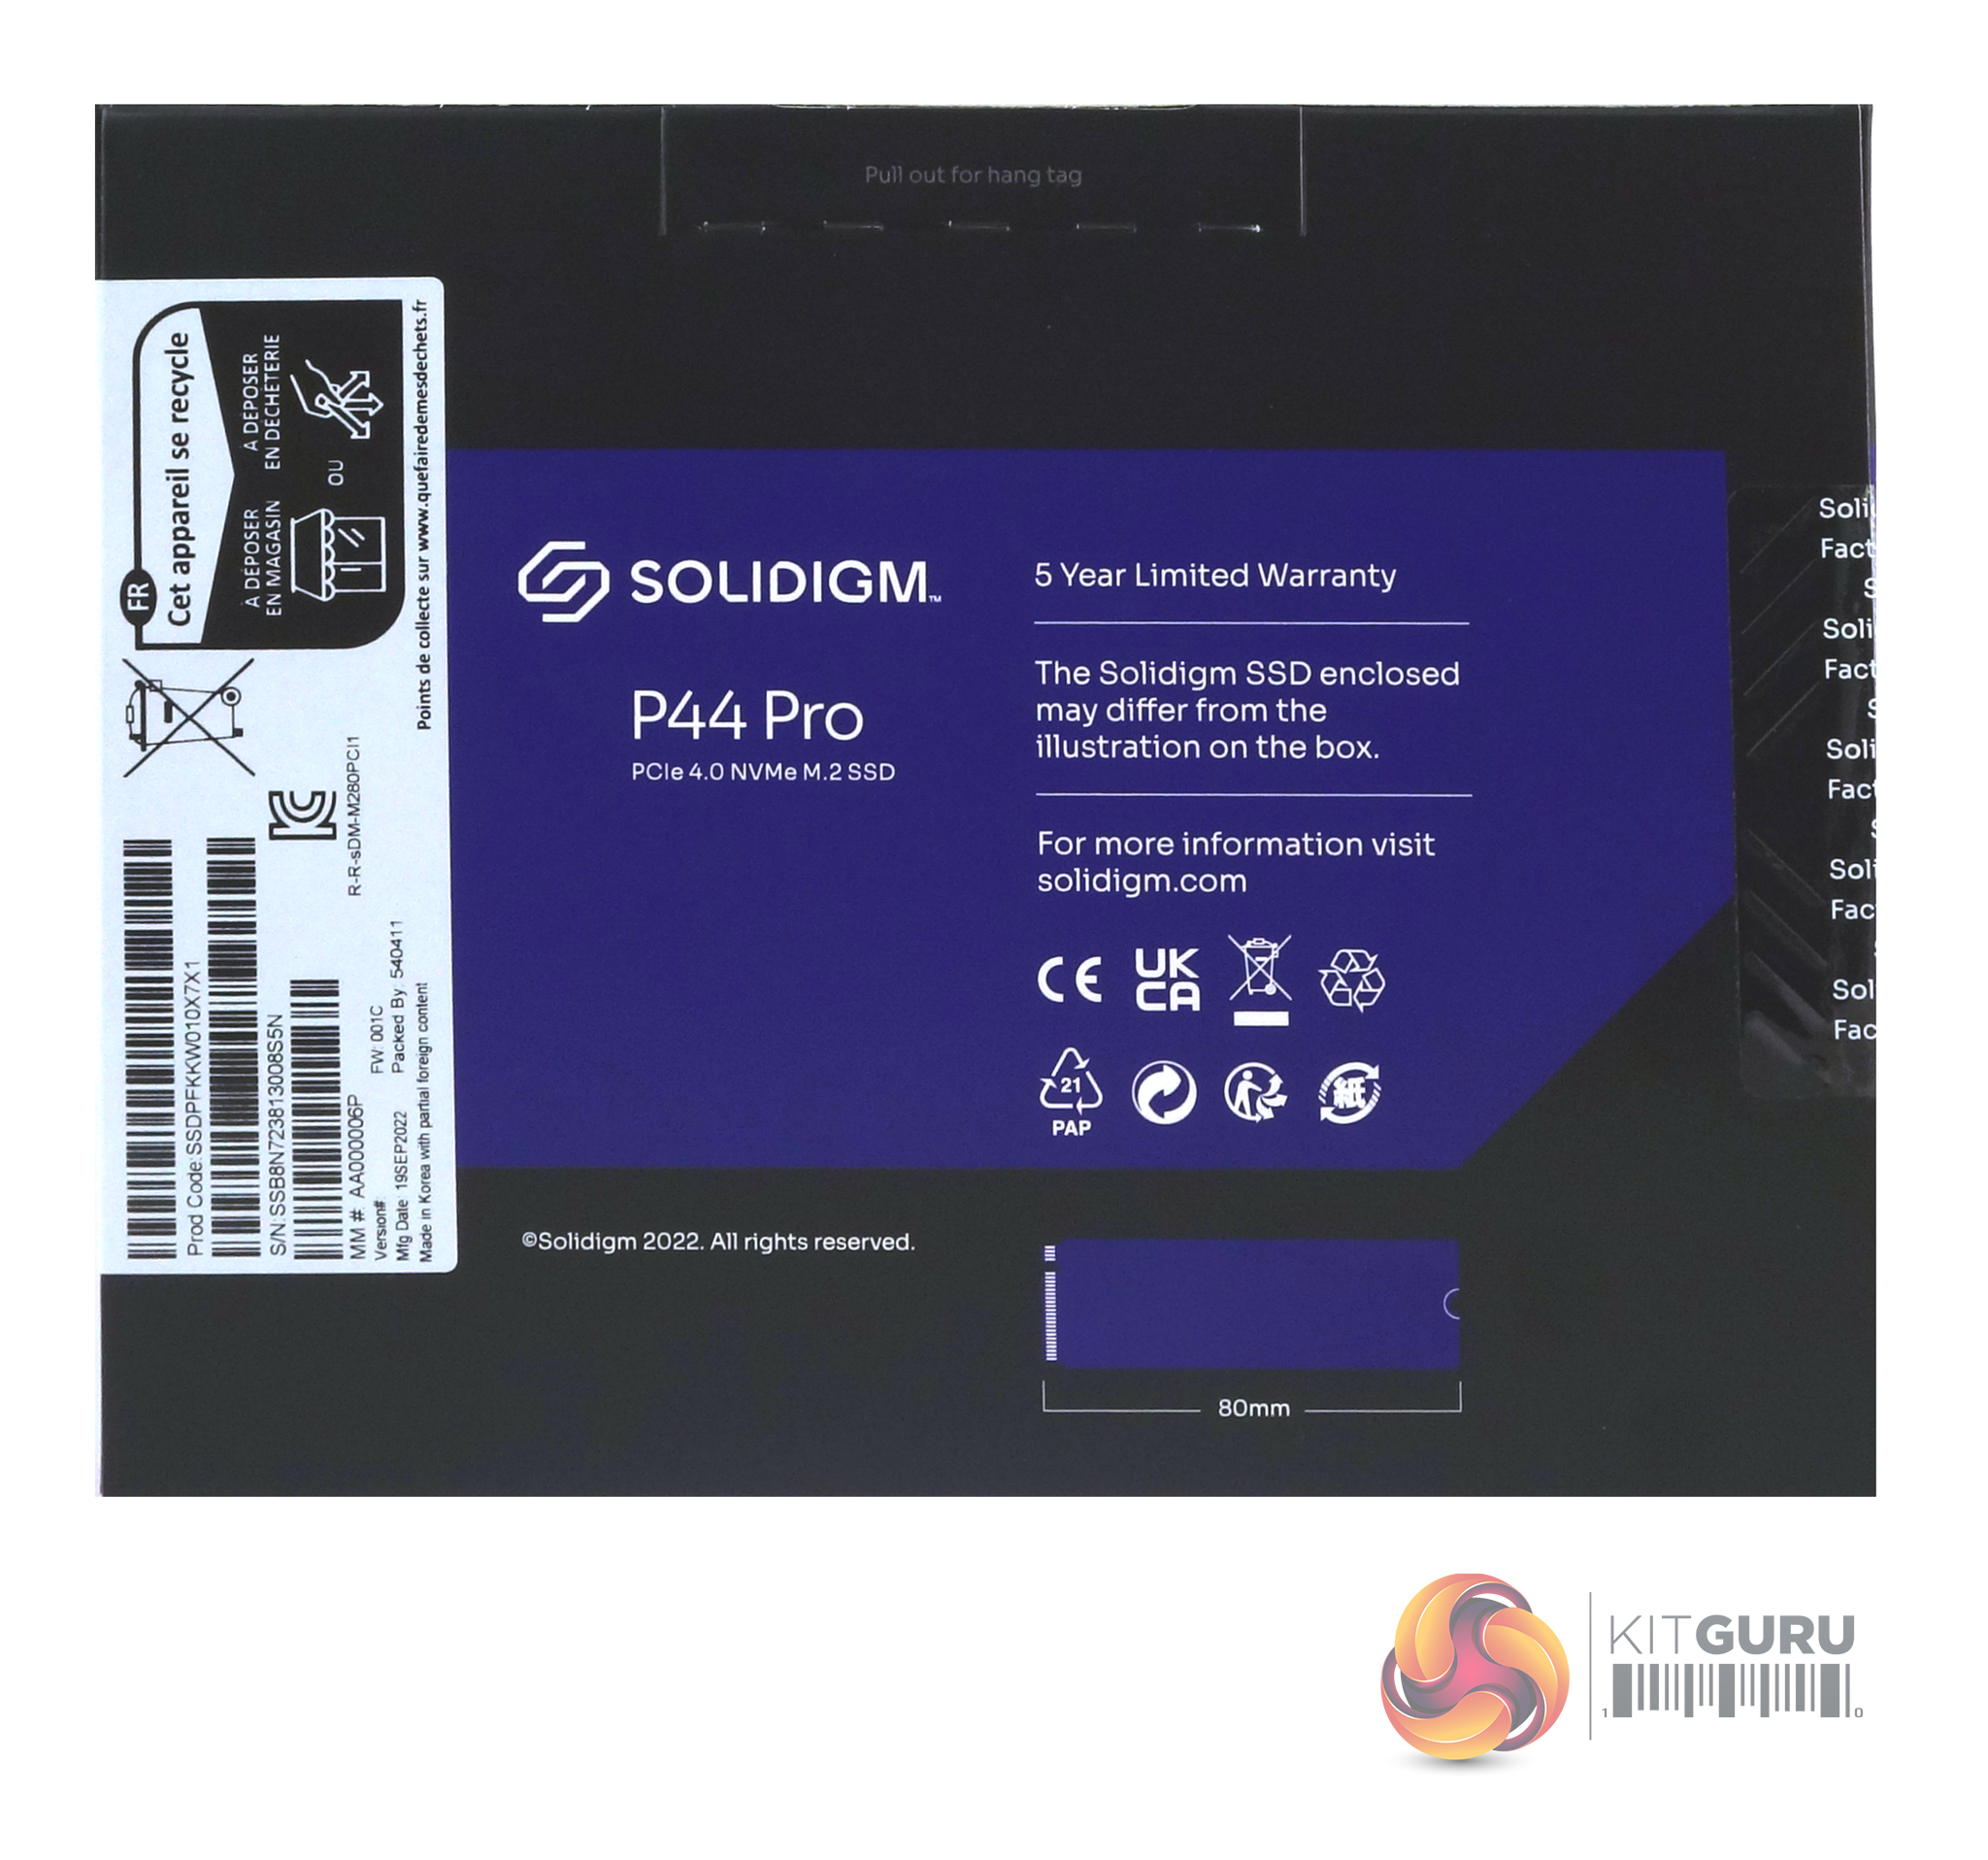
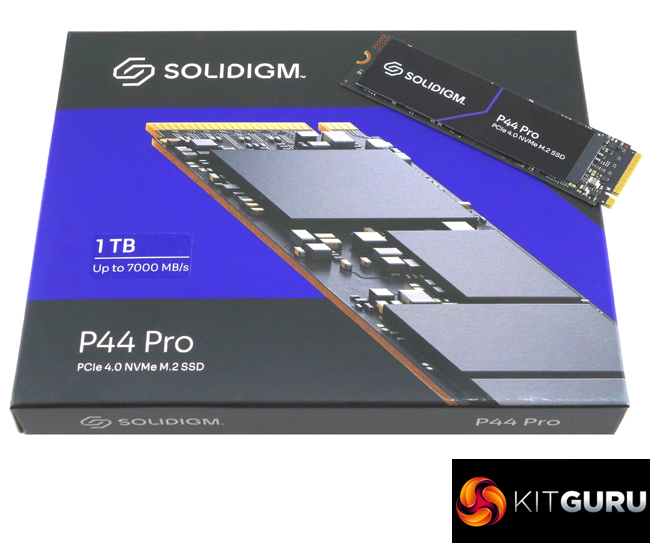
The Solidigm P41 Plus comes in a small but sturdy box with a close-up image of the part drive on the front. To the left of the image is a sticker carrying the drive's size and its Sequential read speed rating (up to 7,000MB/s). Under the product name is a line stating that the drive uses a PCIe 4.0 interface. This is repeated on the back of the box, along with a statement that the drive has a 5-year warranty. Towards the bottom edge of the box, there is a diagram showing the drive's length.
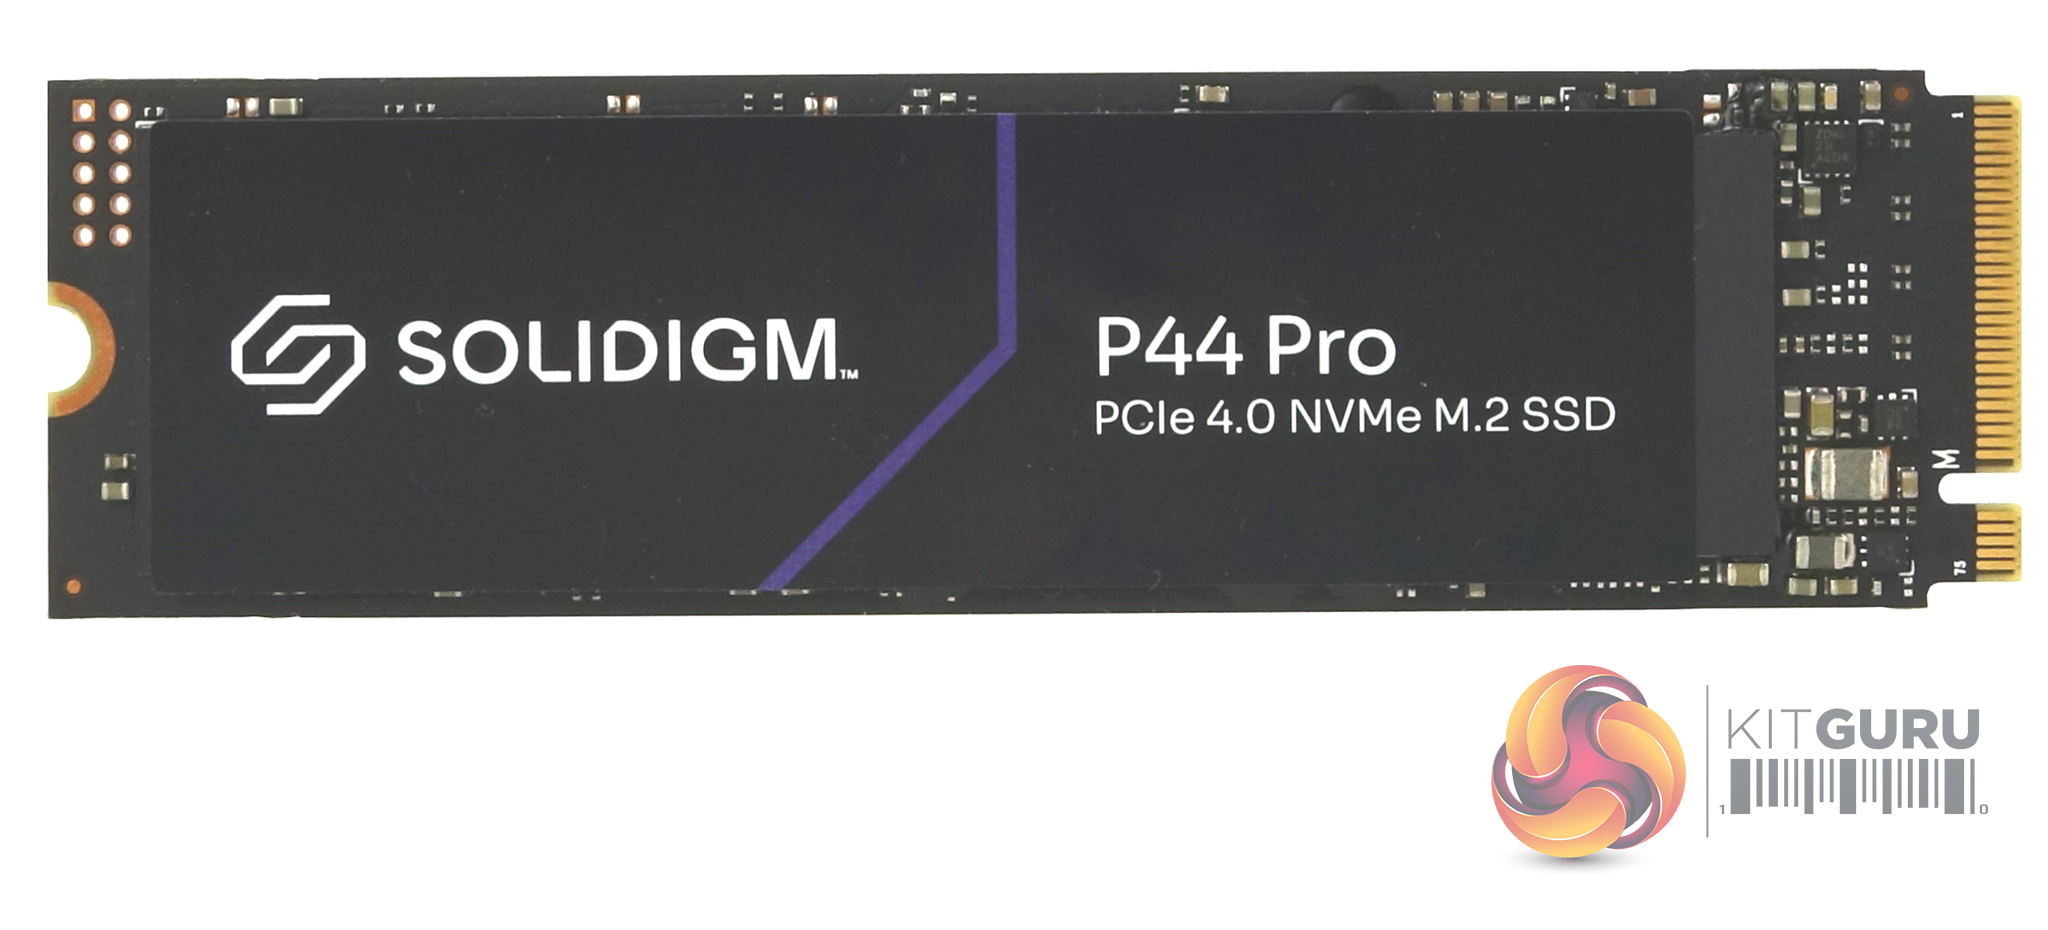
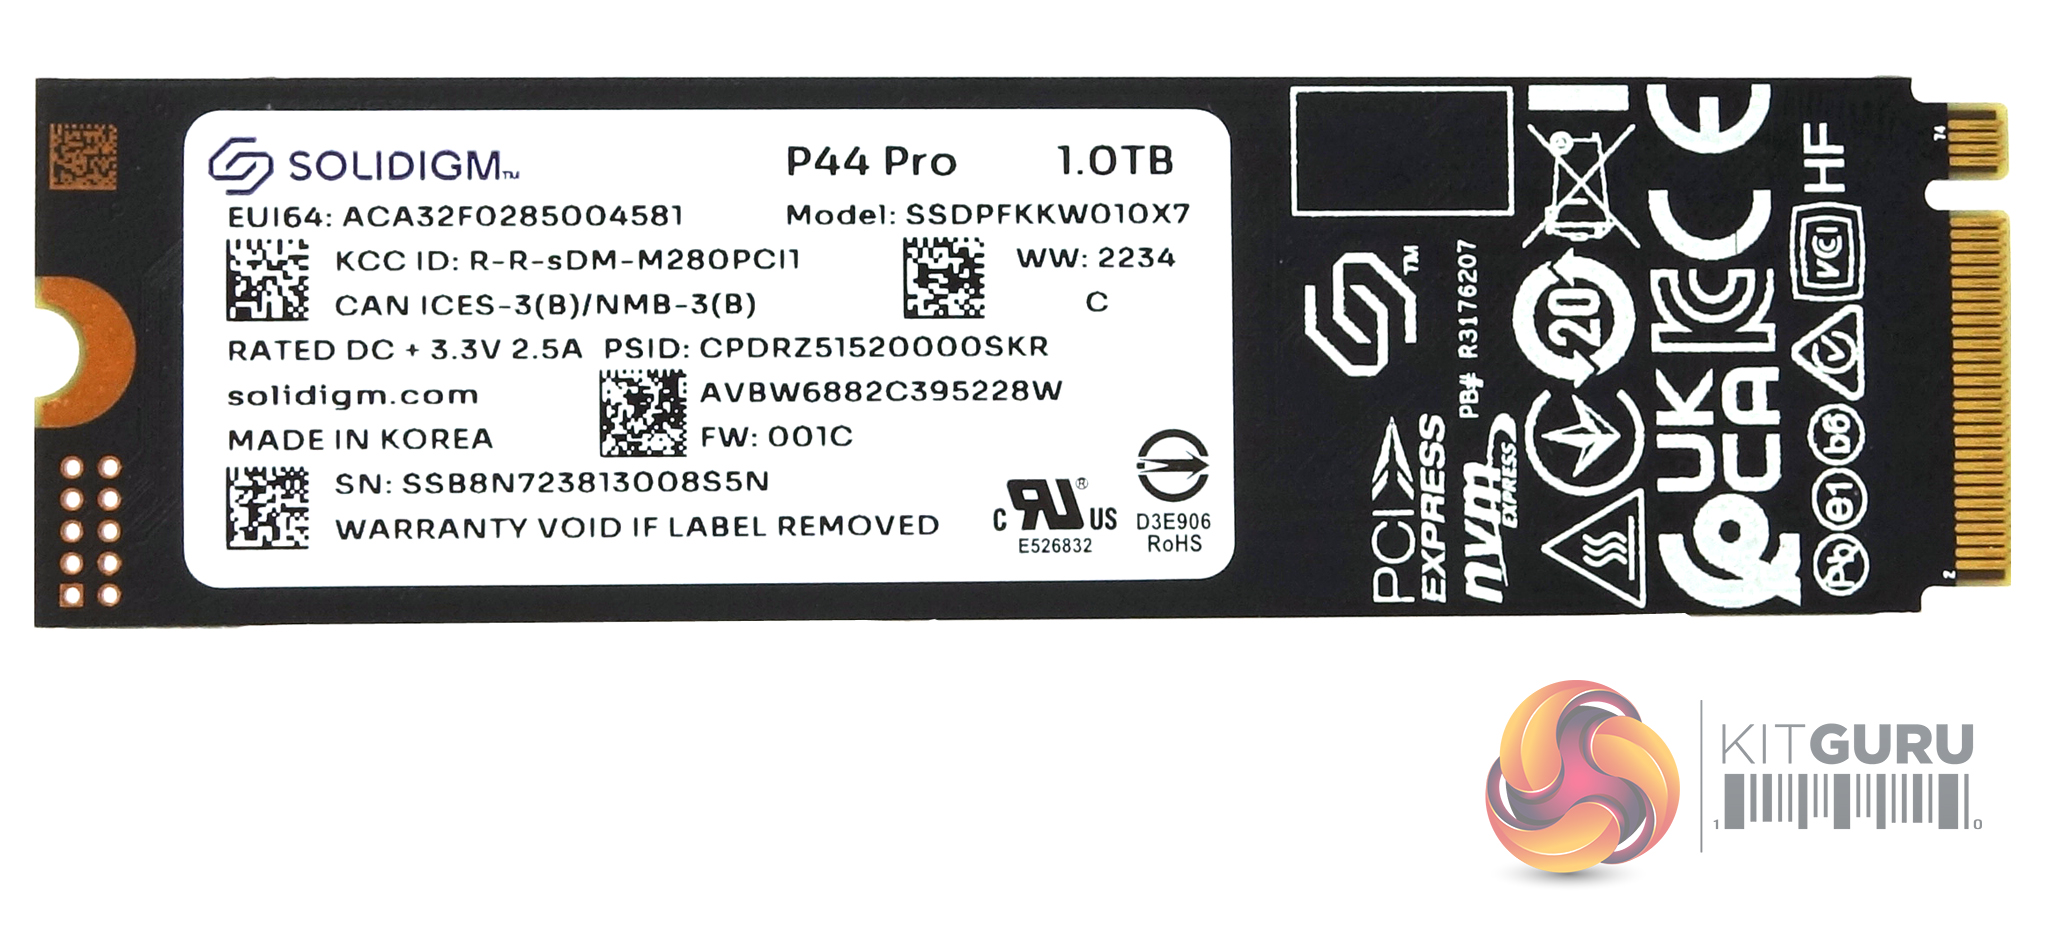
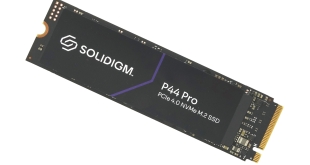
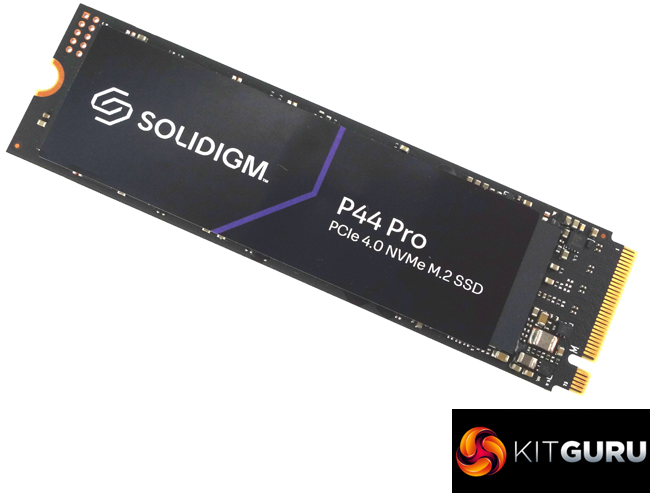
The 1TB Solidigm P44 Pro is built on a single-sided M.2 2280 format and comes without any form of a heatsink.
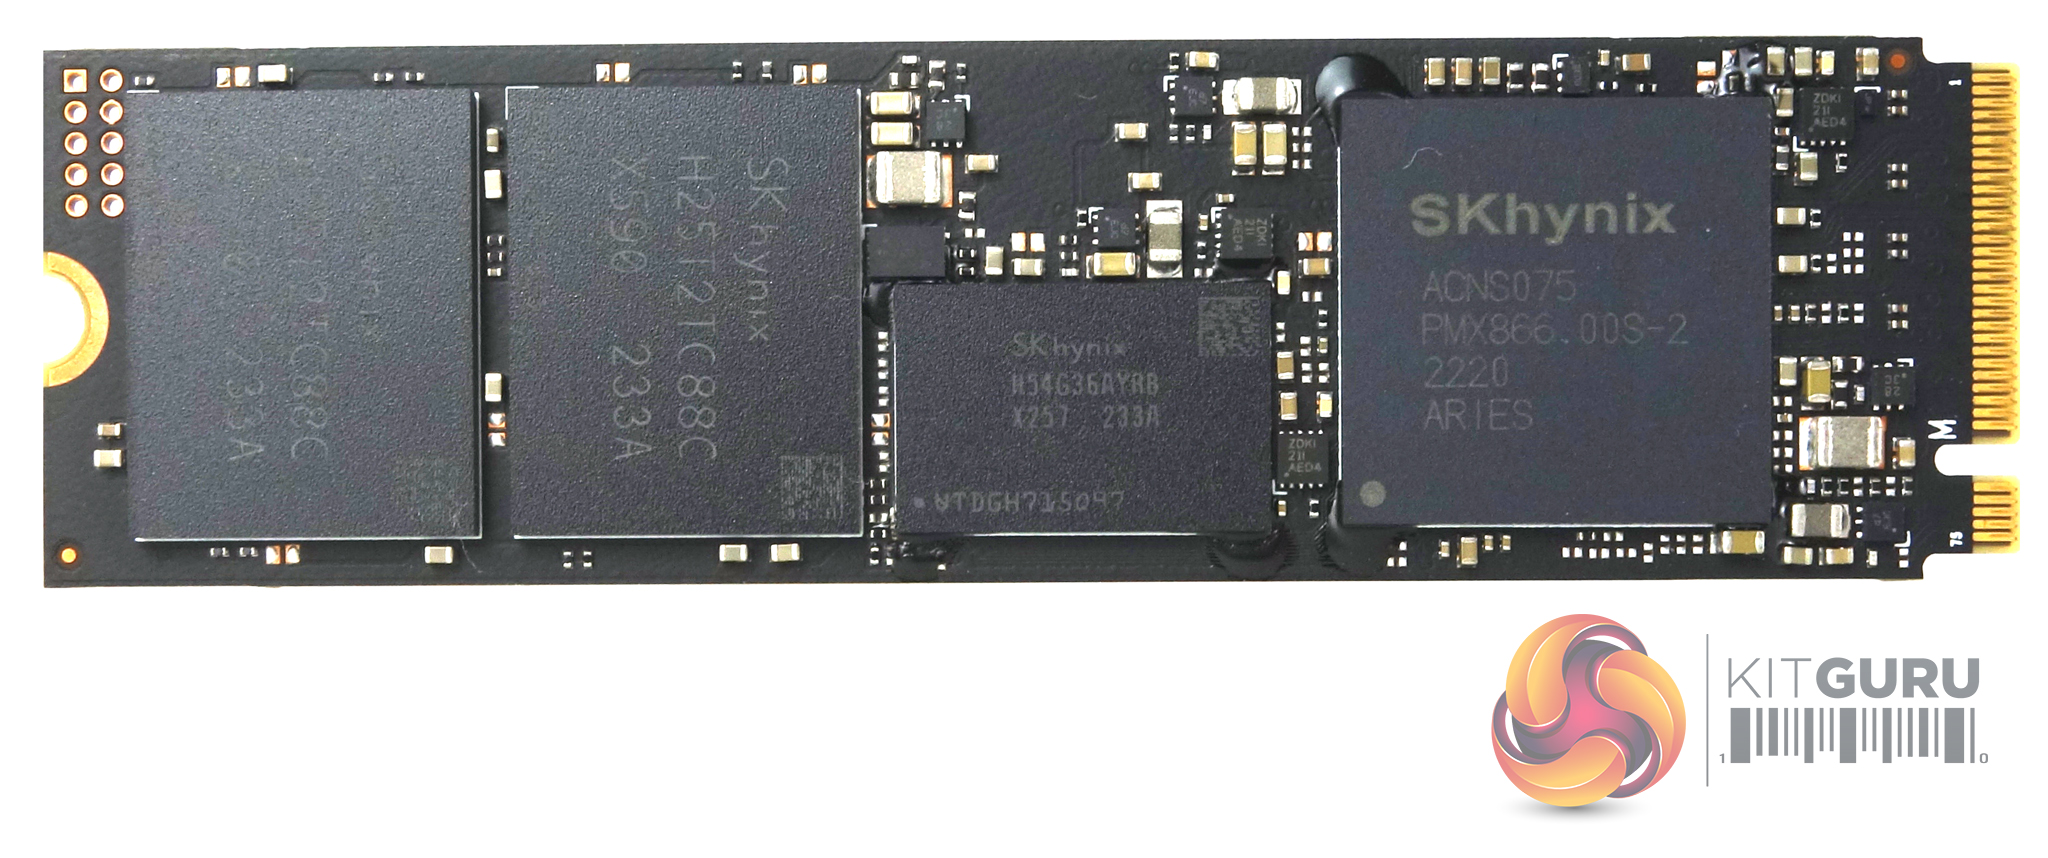
Underneath the product label sits an SK hynix Aries controller, two 512GB SK hynix 176-Layer 3D TLC packages (coded H25T2TC88C) and a 1GB SK hynix LPDDR4-4266MHz DRAM chip (H54G36AYRB).
The SK hynix ACNS075 (codename Aries) is an 8-channel controller (each channel has a maximum transfer rate of 1600MT/s). Manufactured on a 12nm process it uses quad-core Cortex-R5 architecture. It also provides support for AES 256-bit Encryption and TCG Pyrite.
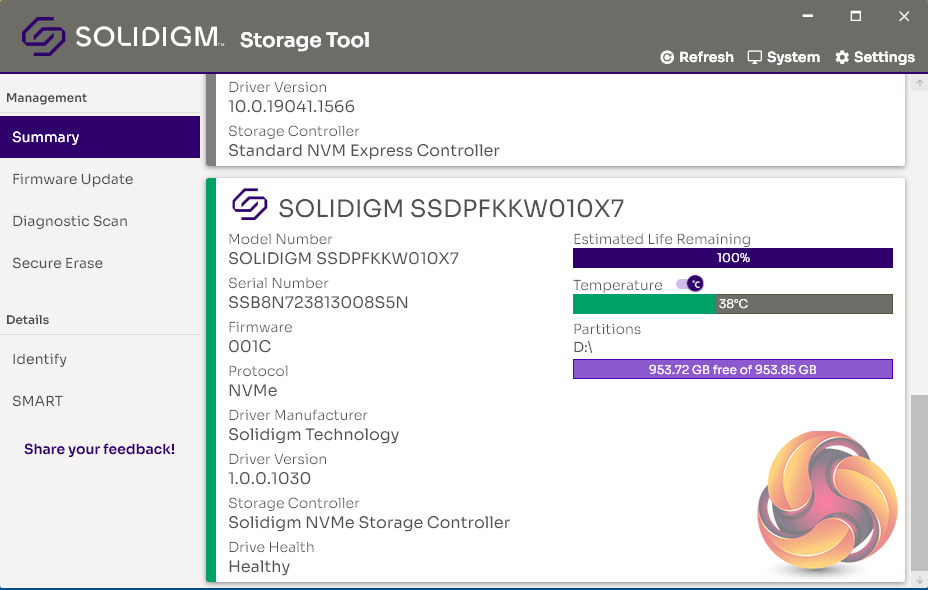
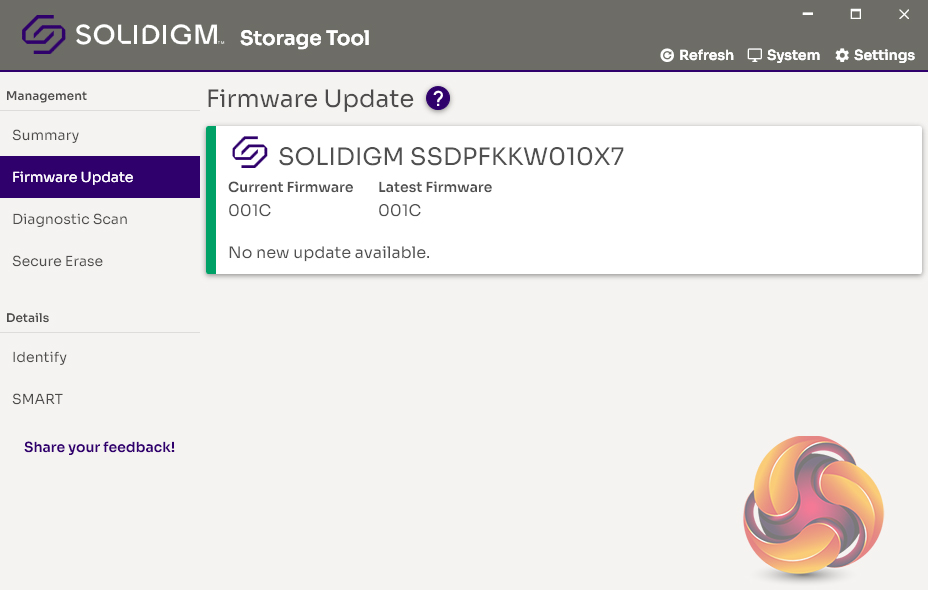
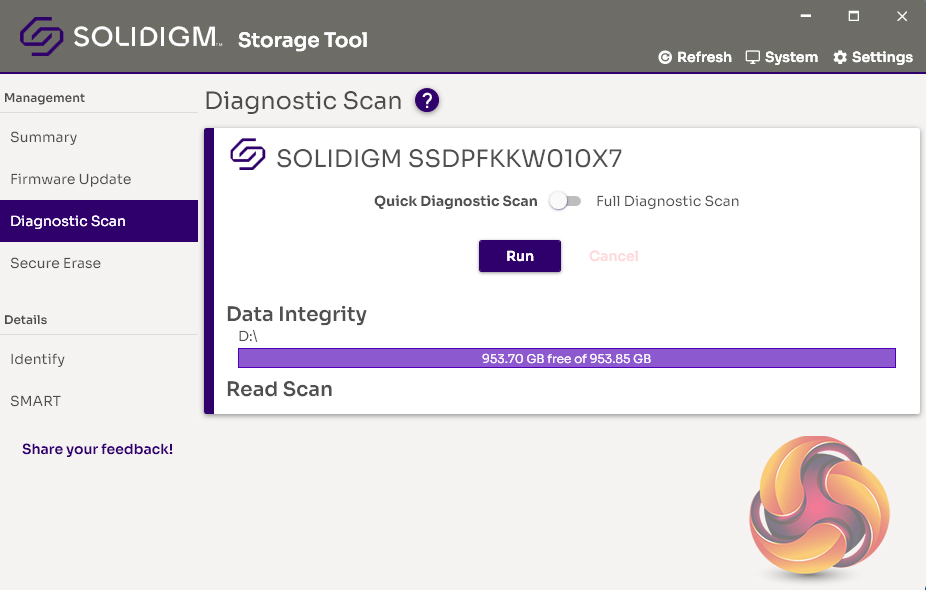
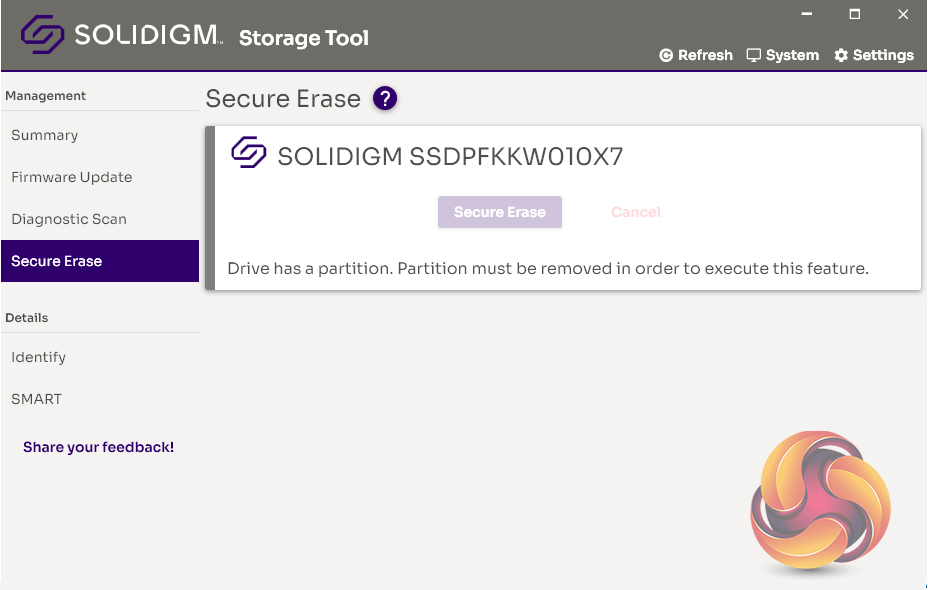
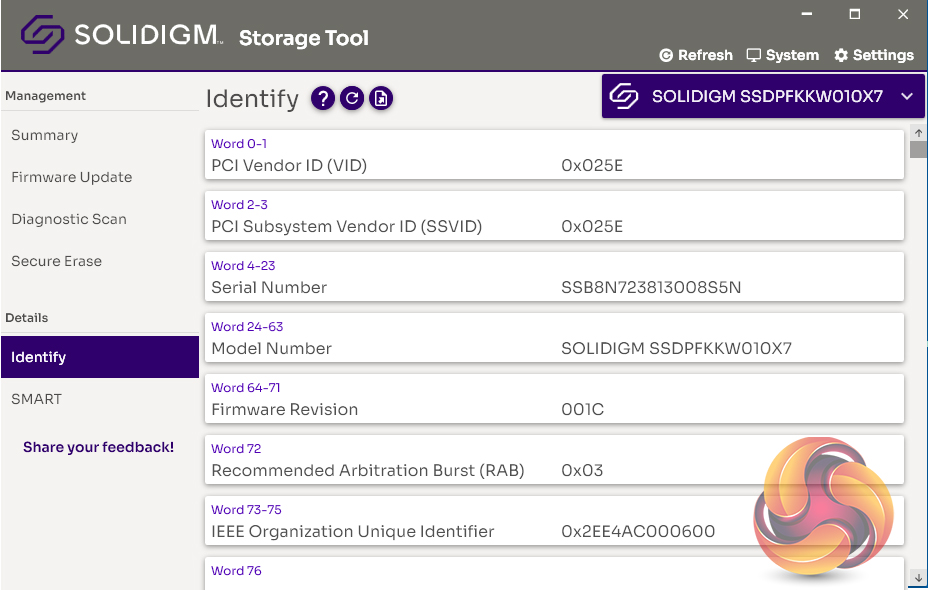
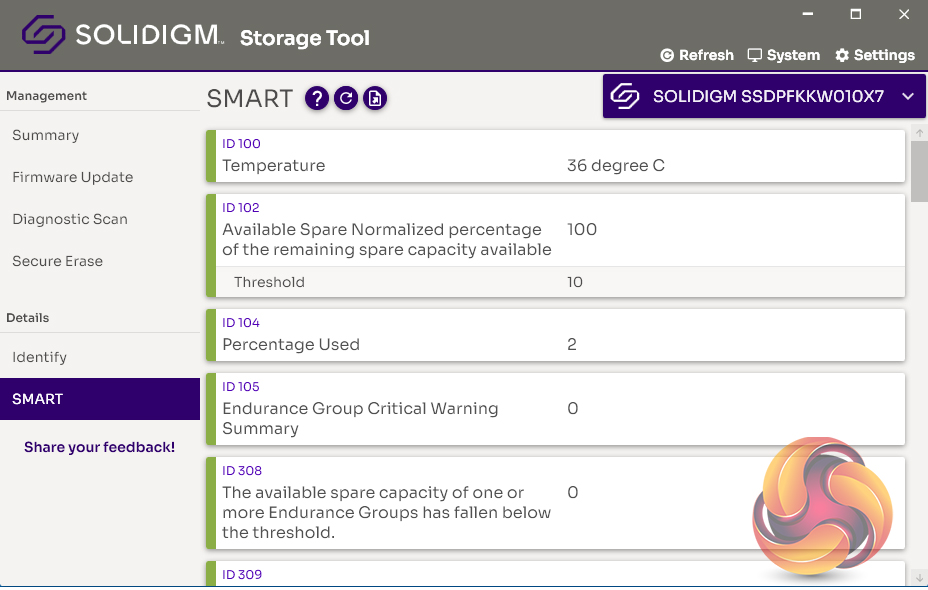
Solidigm's software utility goes by the name of the Solidigm Storage Tool. It doesn't have the flashy GUI of some of its competitors, but most of what you need to keep a drive in shape is there including; drive information, drive health, diagnostic scans, firmware updates and secure erase.
For testing, the drives are all wiped and reset to factory settings by HDDerase V4. We try to use free or easily available programs and some real world testing so you can compare our findings against your own system.
This is a good way to measure potential upgrade benefits.
Main system:
AMD Ryzen 5 3600X, 16GB DDR4-2400, Sapphire R9 390 Nitro and an MSI MPG X570 Gaming Edge Wifi motherboard
Other drives – 1TB Class
Corsair Force MP600 1TB
Crucial P5 Plus 1TB
Kioxia BG5 1TB
Patriot Viper VPN4100 1TB
PNY XLR8 CS3040 1TB
PNY XLR8 CS3140 1TB
Sabrent Rocket 4 Plus 1TB
Samsung SSD980 PRO 1TB
Samsung SSD980 PRO Heatsink 1TB
Seagate FireCuda 520 1TB
Solidigm P41 Plus 1TB
Teamgroup T-Force Cardea Zero Z440 1TB
Teamgroup T-Force Cardea A440 Pro Special Series 1TB
WD Black SN770 1TB
WD Black SN850 1TB
Software:
Atto Disk Benchmark 4.
CrystalMark 8.0.0.
AS SSD 2.0.
IOMeter.
UL Solutions PC Mark 10.
UL Solutions 3DMark Storage Benchmark.
Final Fantasy XIV Endwalker Official Benchmark.
All our results were achieved by running each test five times with every configuration this ensures that any glitches are removed from the results. Trim is confirmed as running by typing fsutil behavior query disabledeletenotify into the command line. A response of disabledeletenotify =0 confirms TRIM is active.
CrystalDiskMark is a useful benchmark to measure the theoretical performance levels of hard drives and SSDs. We are using v8.0.
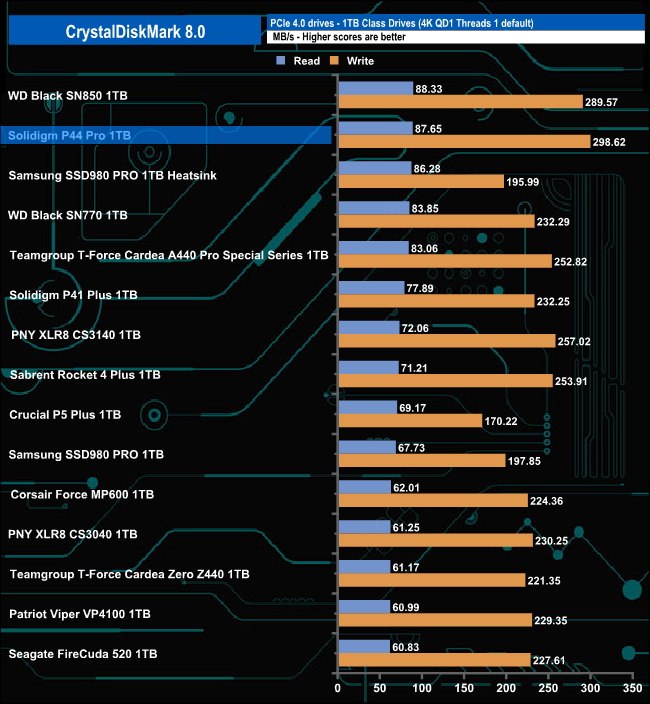
The P44 Pro performs well in CrystalDiskMark's 4K QD1 (single thread) test. With a read score of 87.65MB/s, it sits just behind WD's Black SN850 at the top of the results chart, but with a better write result than the WD drive.
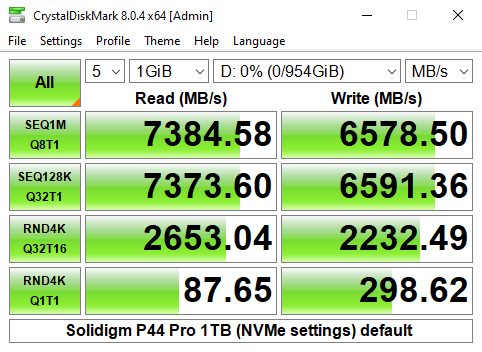
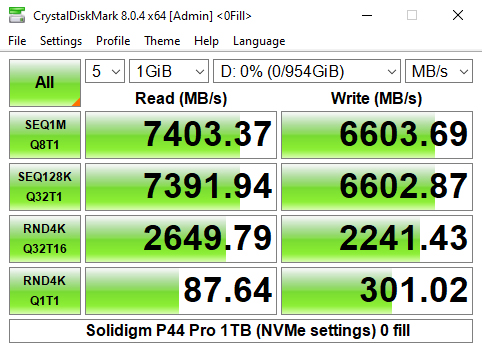
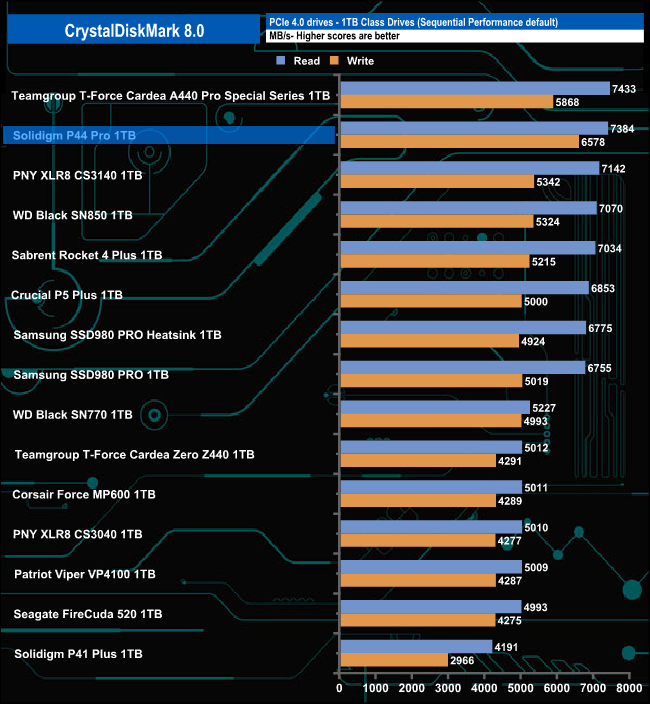
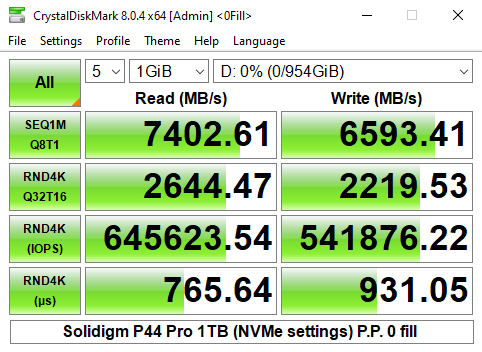
Looking at the benchmark result screens we can confirm the official Sequential figures for the drive of 7,000MB/s and 6,500MB/s for reads and writes respectively with a best-read result of 7,403MB/s (0 fill) while the fastest write speed we saw was 6,603MB/s (0 fill).
Peak Performance Profile

Switching over to the Performance Profile we could once again confirm the official Sequential read/write figures with test results of 7,385MB/s for reads and 6,570MB/s for writes which are good enough to put the drive at the head of our results chart.
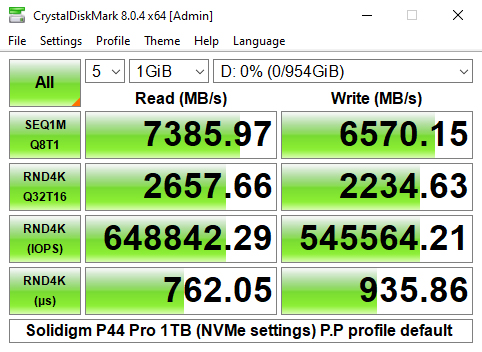
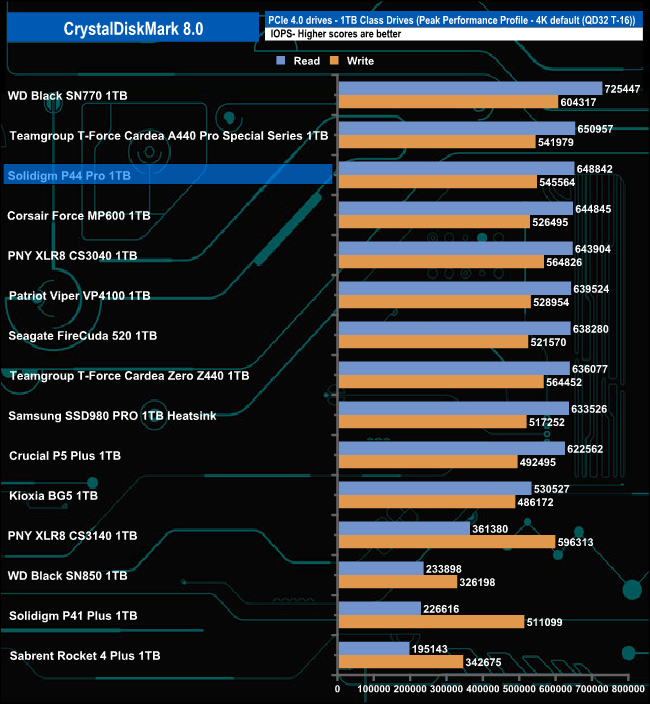
The Performance Profile result screen also includes a 4K IOPS score. The Solidigm P44 Pro produced test results of 648,842.29 IOPS for reads and 545,564.21 IOPS, way off of the official 1,400,000 IOPS / 1,300,000 IOPS (reads/writes) but still good enough to put the drive into third place in our results chart.
Real World Profile
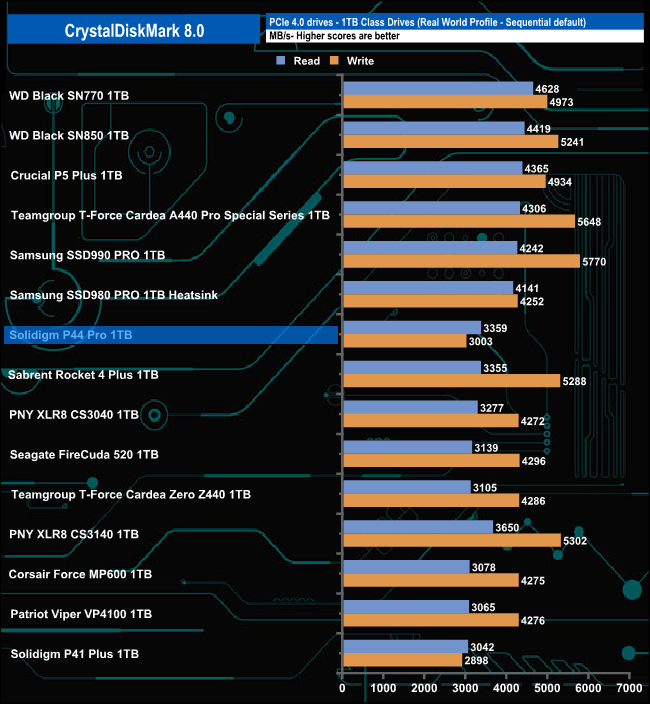
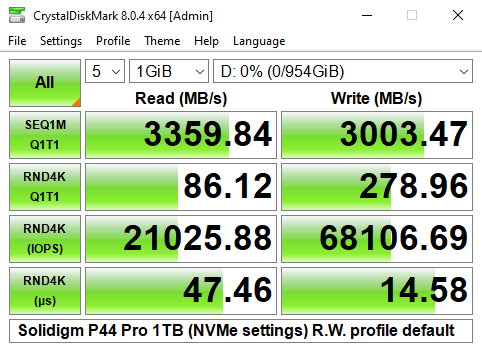
The drive doesn't perform quite so well in the Real World profile. Test results of 3,359MB/s and for reads 3.0003MB/s and writes respectively were only good enough to see the drive in a mid-table position.
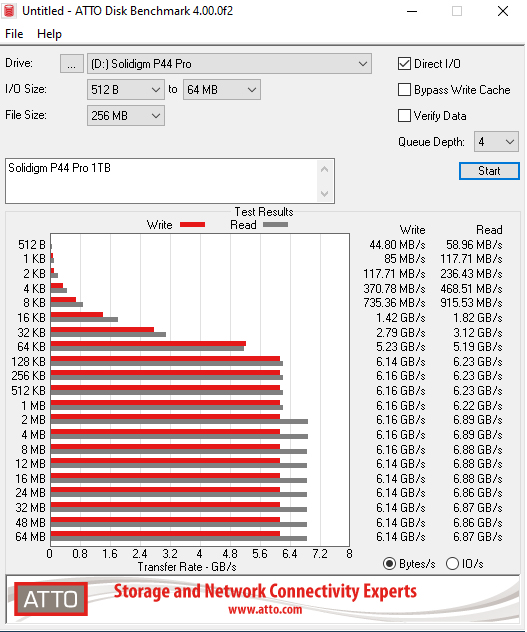
The ATTO Disk Benchmark performance measurement tool is compatible with Microsoft Windows. Measure your storage systems performance with various transfer sizes and test lengths for reads and writes. Several options are available to customize your performance measurement including queue depth, overlapped I/O and even a comparison mode with the option to run continuously. Use ATTO Disk Benchmark to test any manufacturer's RAID controllers, storage controllers, host adapters, hard drives and SSD drives and notice that ATTO products will consistently provide the highest level of performance to your storage.
We are using version 4.1 for our NVMe disk tests.
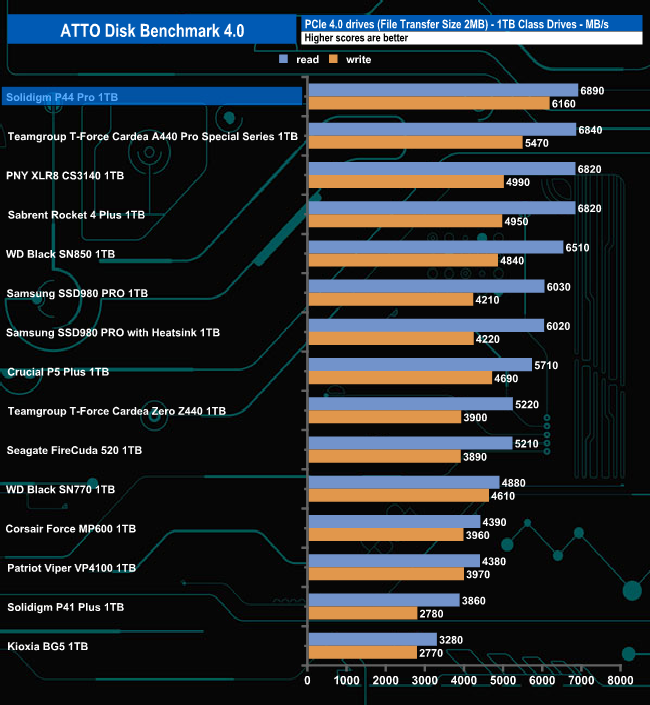
Using the ATTO benchmark we couldn't quite hit the official maximums of 7,000MB/s and 6,5000MB/s for reads and writes respectively. However, both the read result of 6,890MB/s and the 6,160MB/s for writes are the fastest we've seen to date for a consumer 1TB class drive.
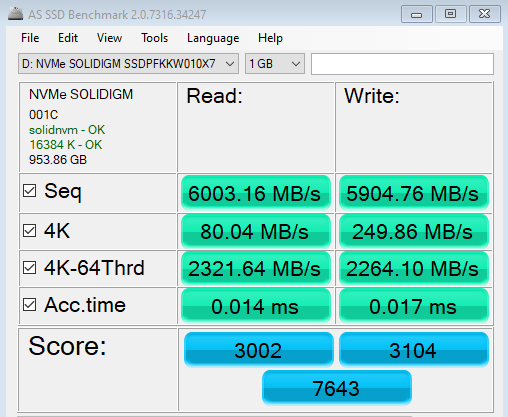
AS SSD is a great free tool designed just for benching Solid State Drives. It performs an array of sequential read-and-write tests, as well as random read-and-write tests with sequential access times over a portion of the drive. It uses incompressible data samples which many drives struggle with, so results can be viewed as the worst-case scenarios.
AS SSD includes a sub suite of benchmarks with various file pattern algorithms but this is difficult in trying to judge accurate performance figures.
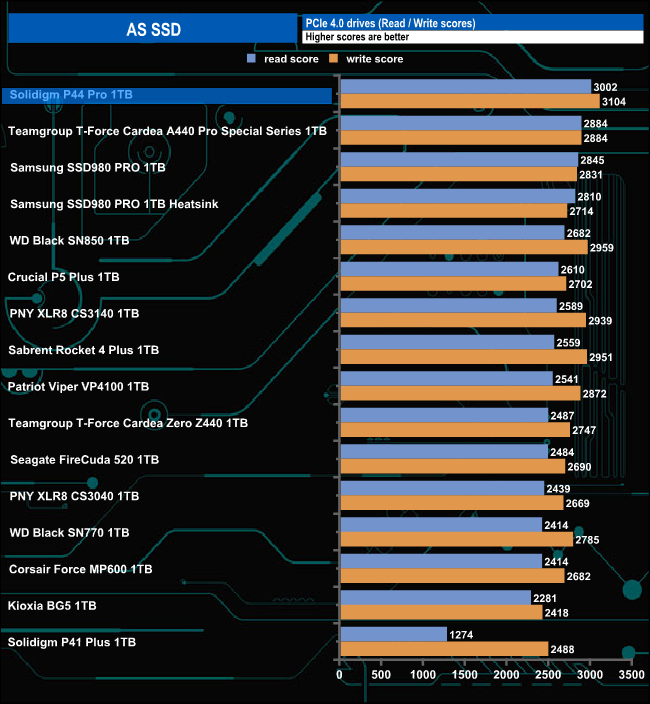
The P44 Pro's read and write scores of 3002 and 3104 respectively from the AS SSD benchmark are the fastest we've seen to date for a 1TB class consumer drive.
We used CrystalDiskMark 8‘s custom settings to test the Sequential read and write performance of the drive through a range of queue depths. The setup for the tests is listed below.
128KB Sequential Read / Write.
Transfer Request Size: 128KB, Thread(s): 1, Outstanding I/O: 1-32.
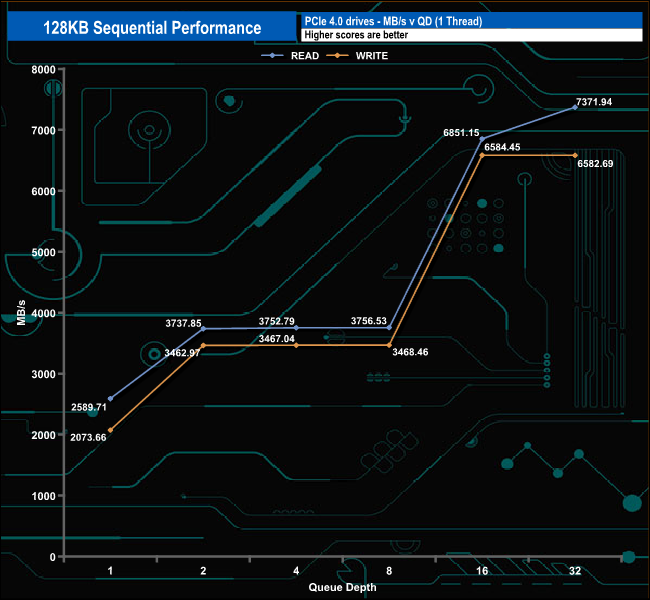

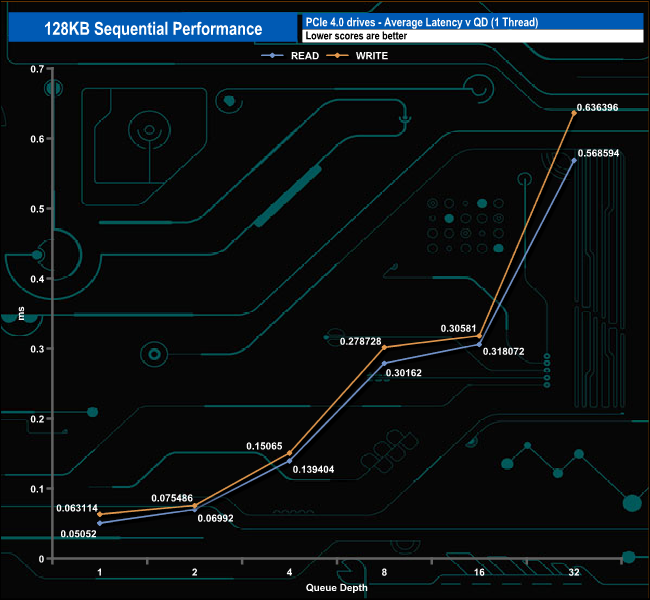
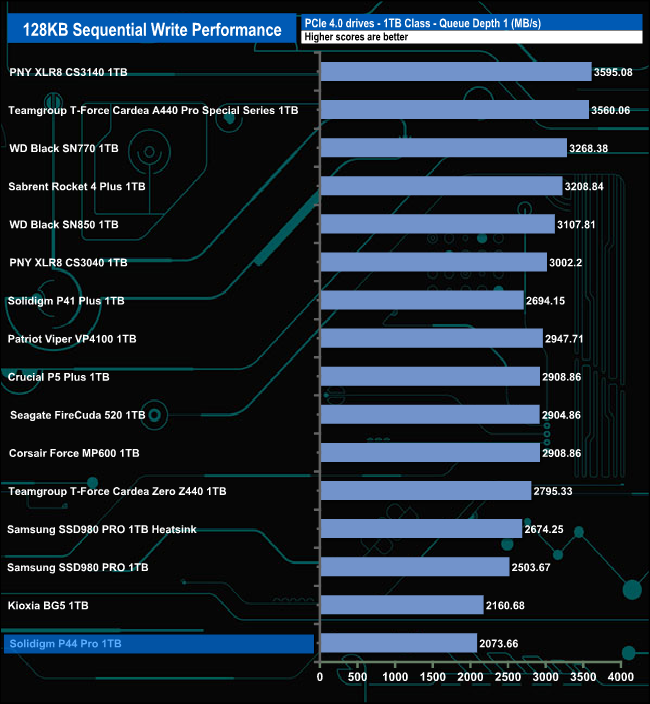
The P44 Pro performance in our 128KB Sequential tests seems to plateau out from QD's 2-8 for both reads and writes. The performance for both then rockets away, the reads climbing as the queue depth deepens to finish the test run at 7,371,94MB/s, 371MB/s faster than the official figure. The write performance rises in a similar manner but plateau's out again between QD's 16 and 32. Peak writes come at QD16 at 6,584MB/s, 84MB/s faster than the official maximum.
128KB Sequential Read v QD comparison

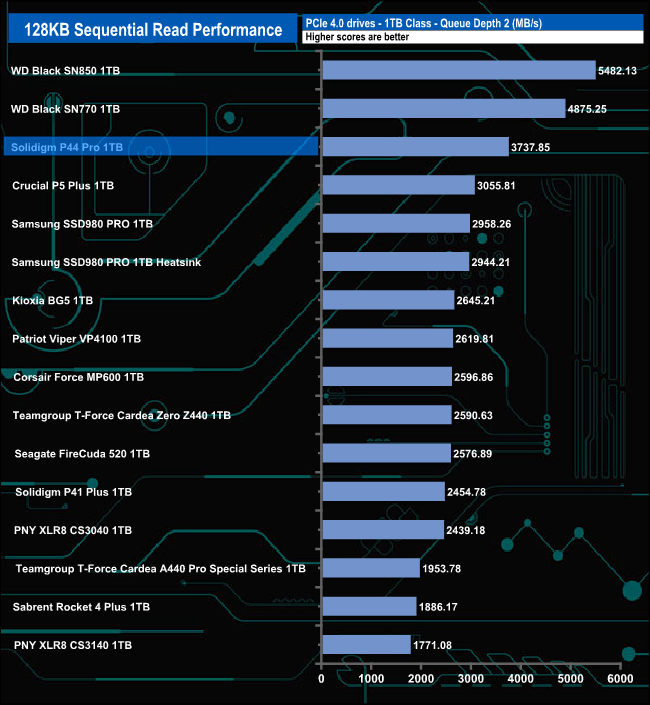
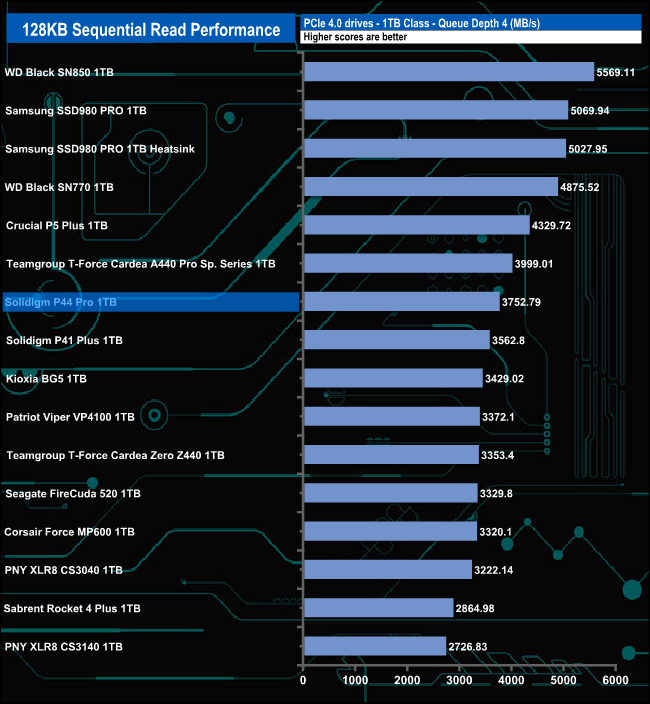
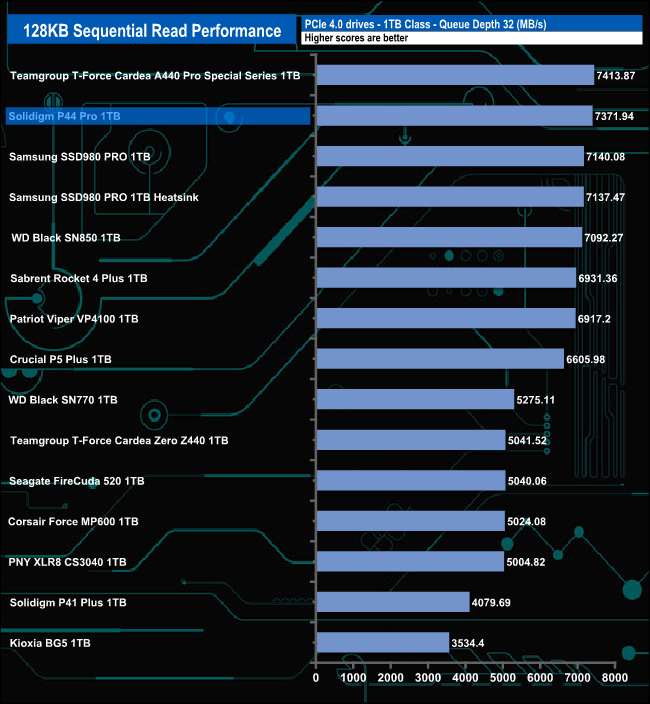
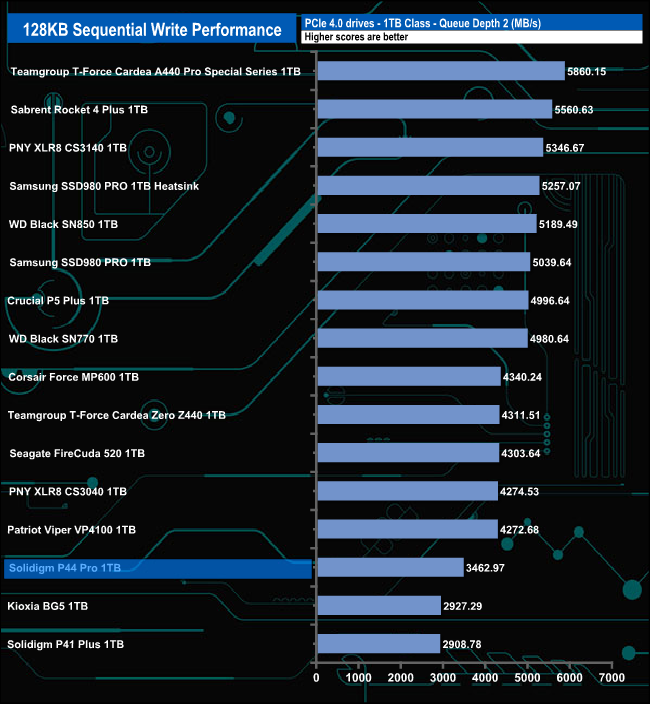
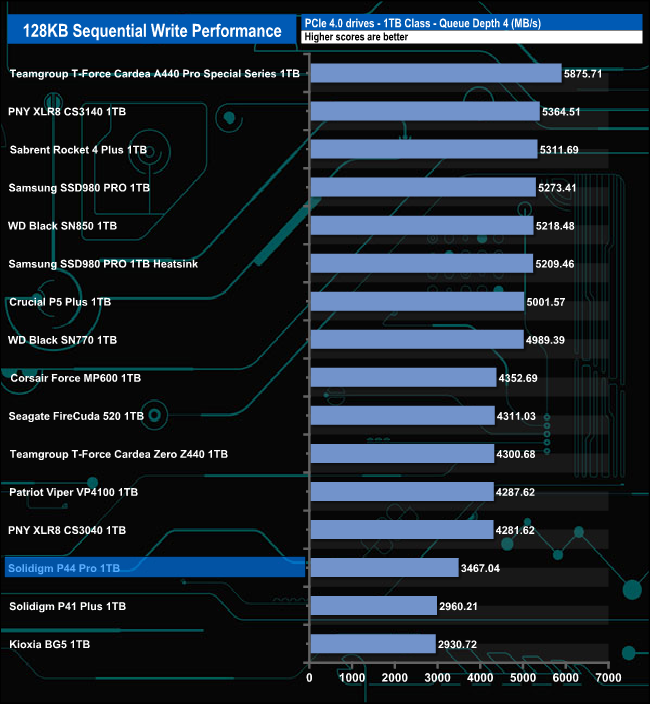
The drive's best performance in relation to the drives around it comes at QD2 (where it sits third in the results chart) and QD32 (second spot in the chart). At QDs 1 and 4 it still performs well, good enough to retain a top 10 spot at these two queue depths.
128KB Sequential Write v QD comparison
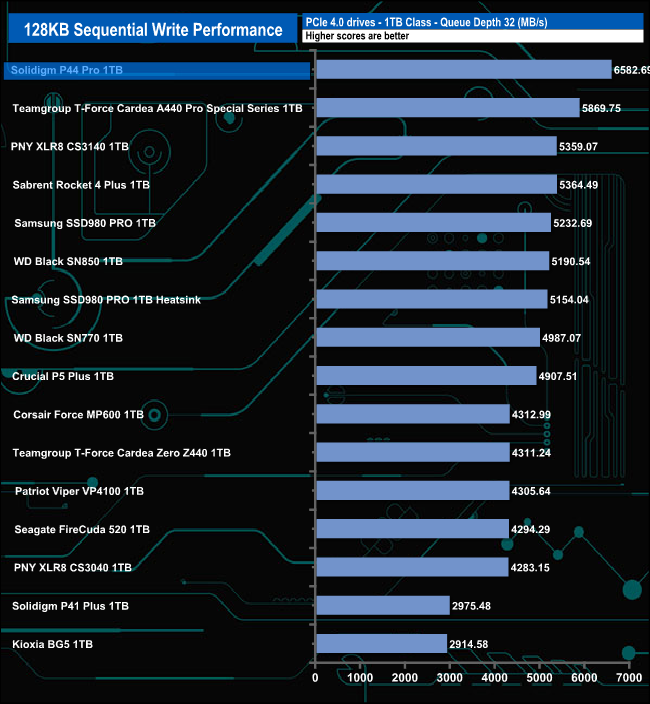
When it comes to our Sequential write tests, the drive's performance at lower queue depths is nothing to write home about but at QD32 the drive seems to come alive, its test result of 6,582.69MB/s not only confirms the official maximum of 6,5000MB/s, it is also the fastest Sequential write performance for a 1TB class consumer drive we've seen to date.
We used CrystalDiskMark 8‘s custom settings to test the 4K random read performance of the drive through a range of queue depths. The setup for the tests is listed below.
Transfer Request Size: 4KB, Outstanding I/O: 1-32.
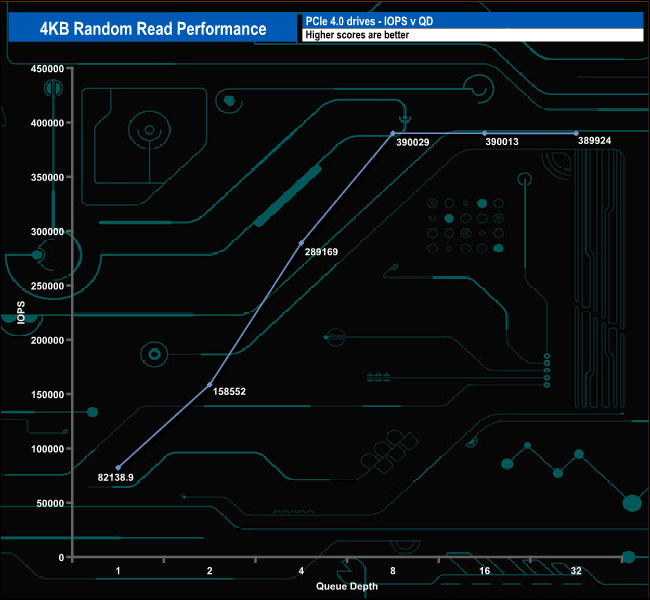

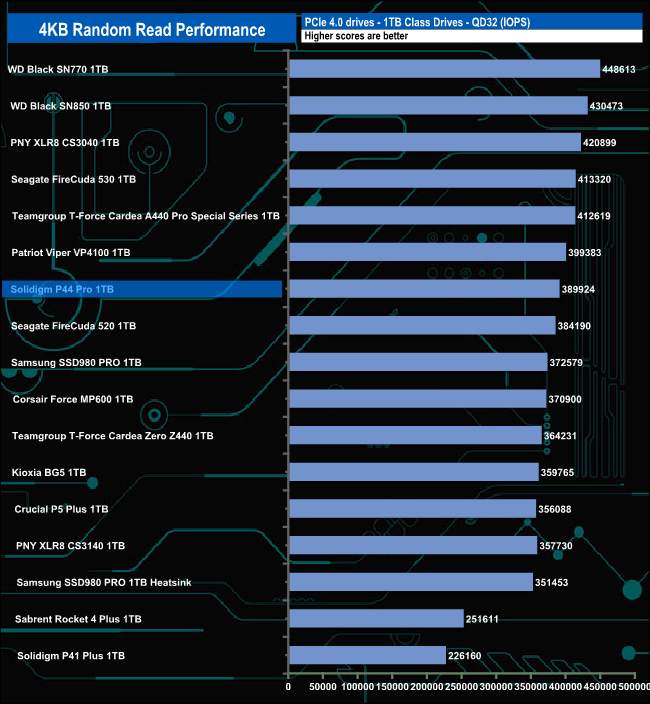
Officially the Solidigm is rated as up 1,400,000 IOPS for 4K random reads. With our four-threaded testing, we couldn't get close to this figure, the best we saw was 390,029 IOPS at a QD of 8.
4K Random Read v QD Performance Comparison.
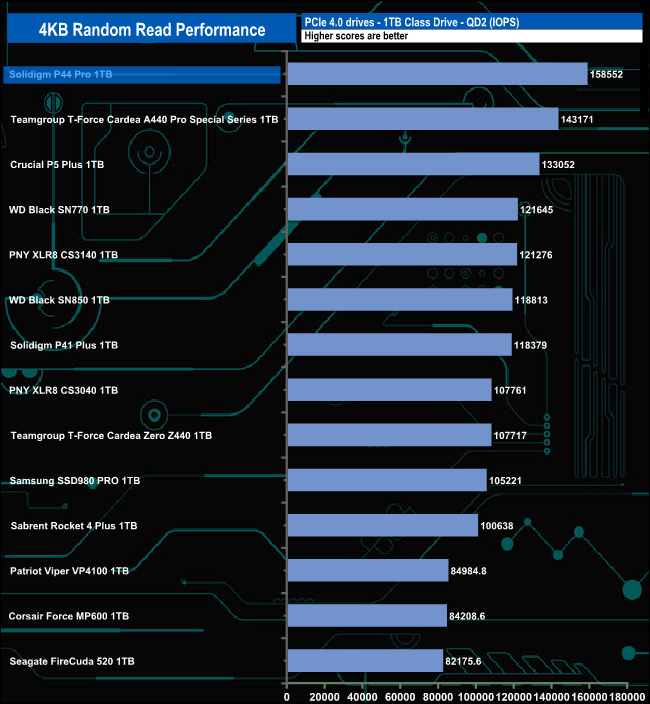
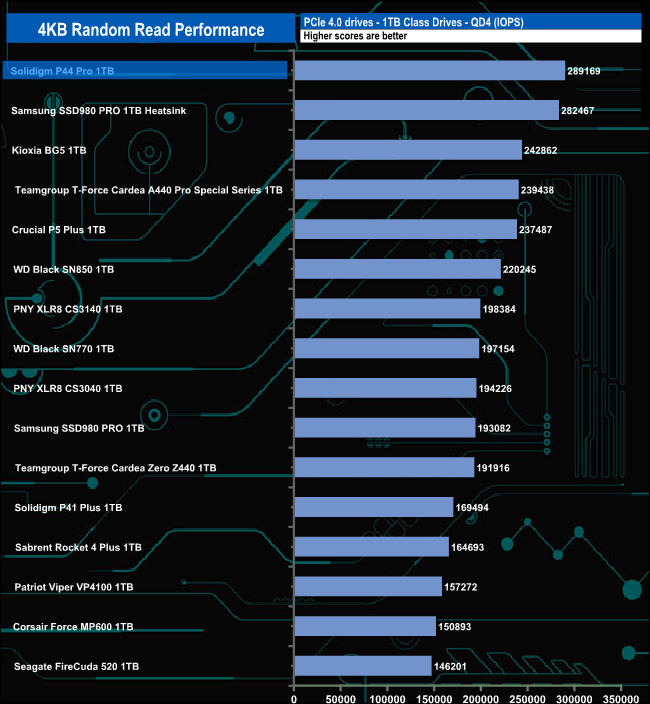
At QDs 2 and 4, the P44 Pro is the fastest 1TB class drive we've seen to date with test results of 158,552 IOPS and 289,169 IOPS respectively. To give an idea of how much faster the P44 Pro is over the P41 Plus, the latter produced a figure of 118,813 IOPS at QD2 and 169,494 IOPS at OD4.
We used CrystalDiskMark 8‘s custom settings to test the 4K random write performance of the drive through a range of queue depths. The setup for the tests is listed below.
Transfer Request Size: 4KB, Outstanding I/O: 1-32.
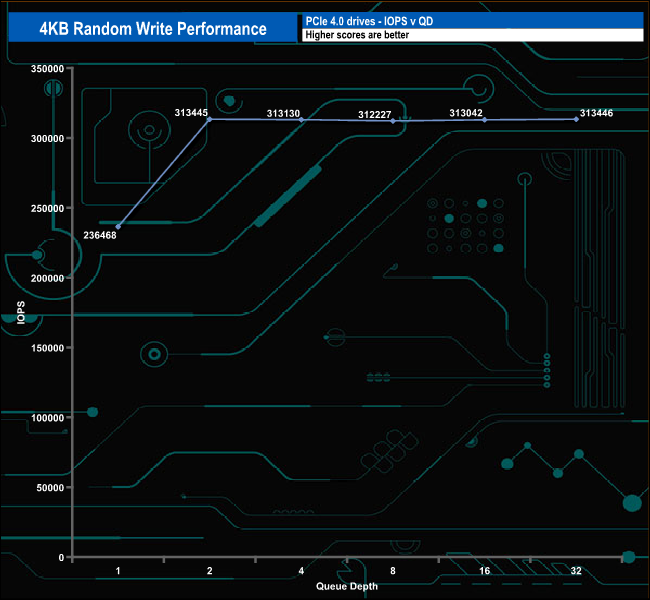
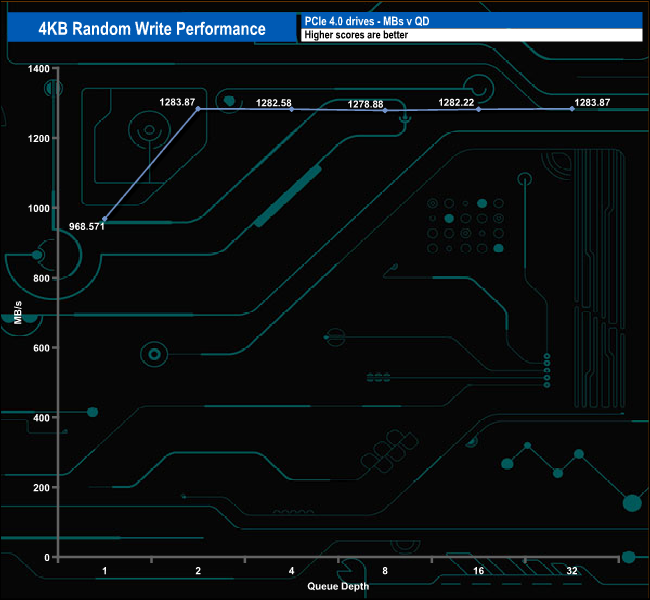
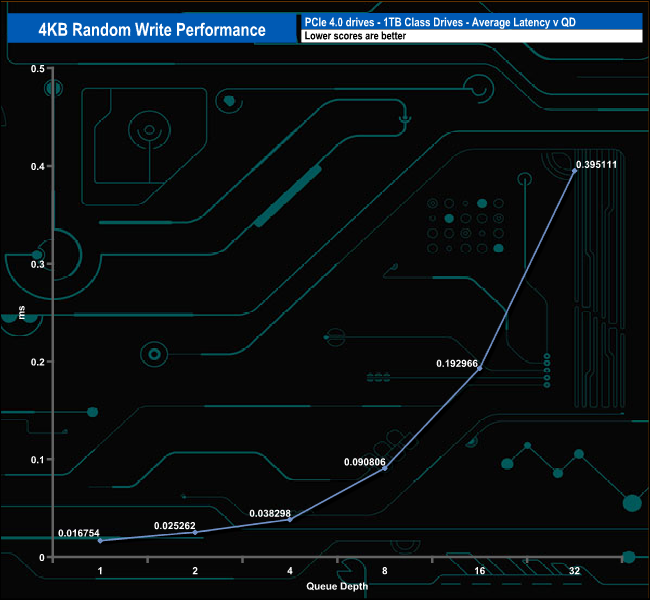
From QD2 up to QD32 the performance of the drive levels out, with a peak of 313,446 IOPS at QD32. As with the random read results, this is nowhere near the official 1,300,000 IOPS maximum write figure.
4K Random Write v QD Performance
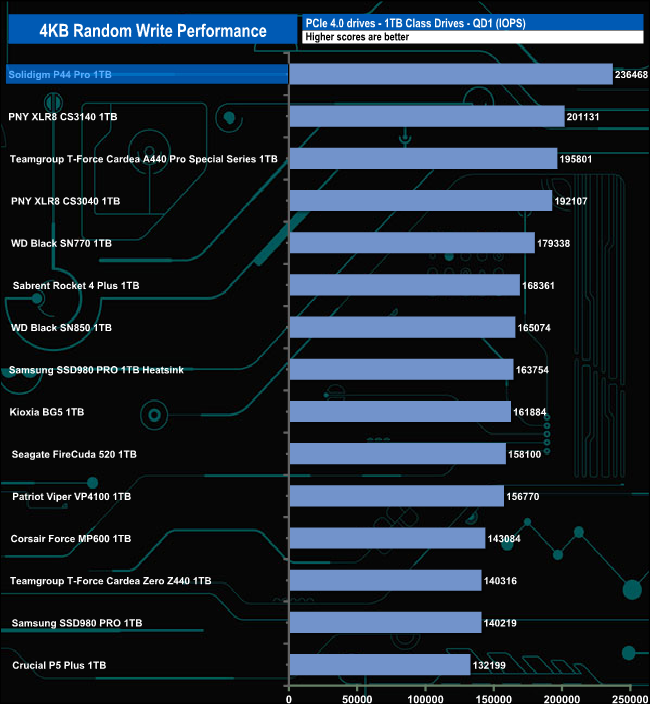
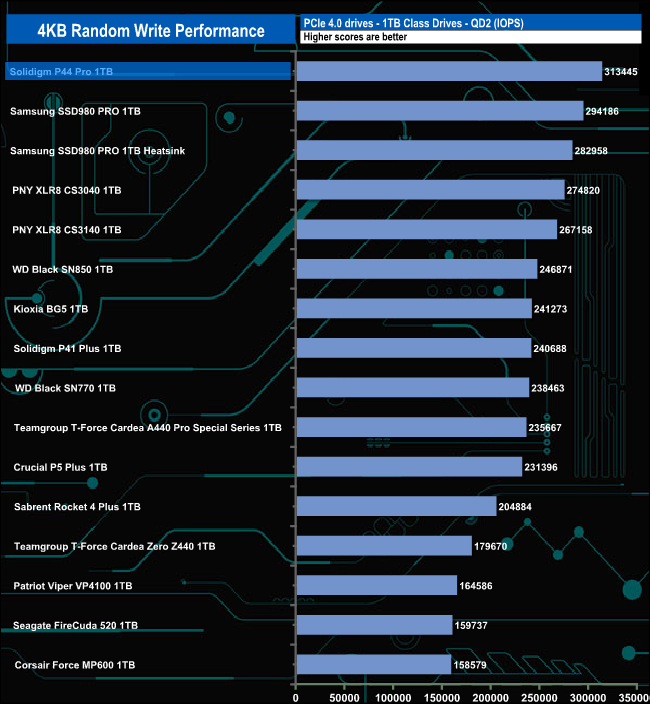
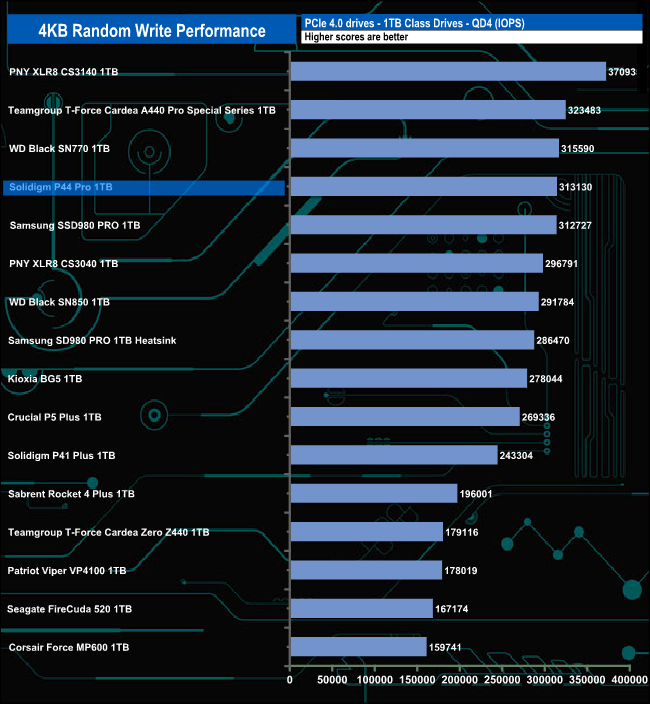
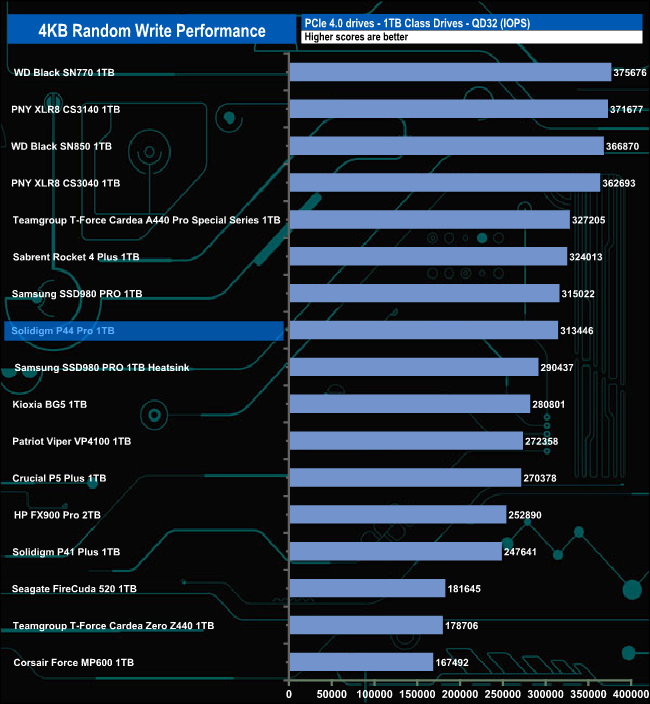
At QD 1 & 2, the P44 Pro is the fastest-performing 1TB class consumer drive we have seen to date when it comes to random writes. However as the queue depth deepens the performance does drop off so when it comes to the QD32 result, the drive is sitting in the middle of the results chart.
We used CrystalDiskMark 8’s custom settings to test the 4K 70/30 mixed read/write performance of the drive through a range of queue depths using a single thread and four threads.
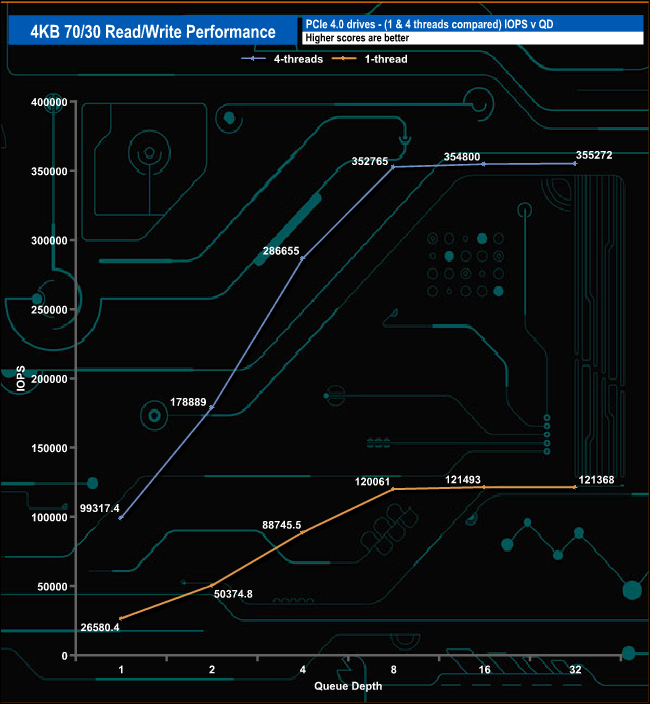
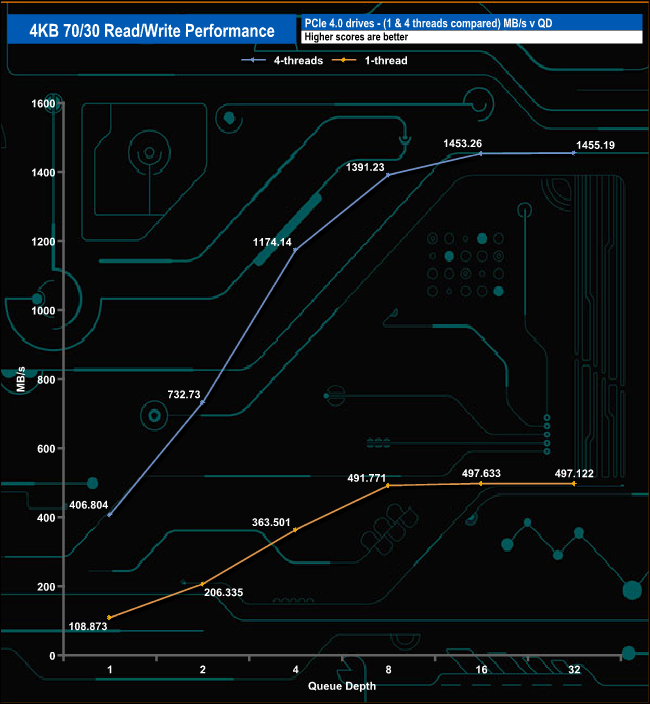

In our 4K 70/30 read/write tests, the 1TB P44 Pro performance climbs smoothly through the tested queue depths until QD8 where the performance seems to plateau out to the end of the test run at QD32. This happens when tested with both a single thread and four threads.
We used CrystalDiskMark 8 to test the random performance of the drive at lower queue depths (QD1 – QD8 where most of the everyday workloads occur) using 1 to 4 threads.
Random Reads
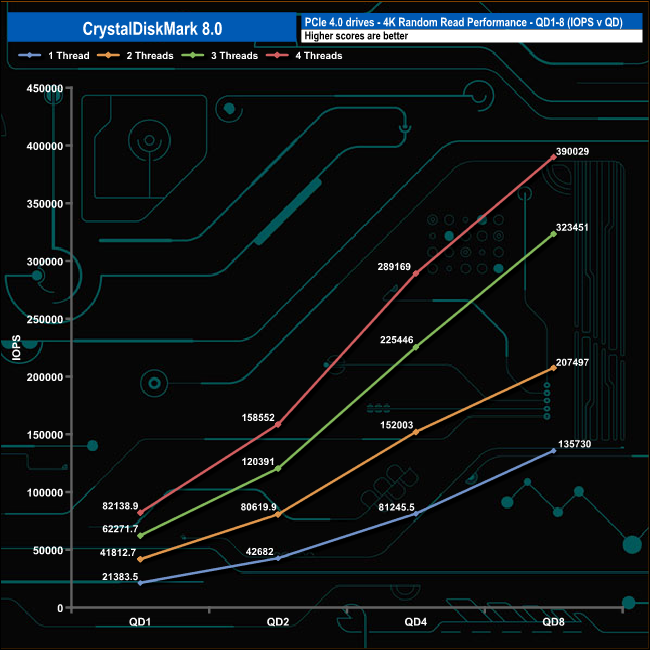

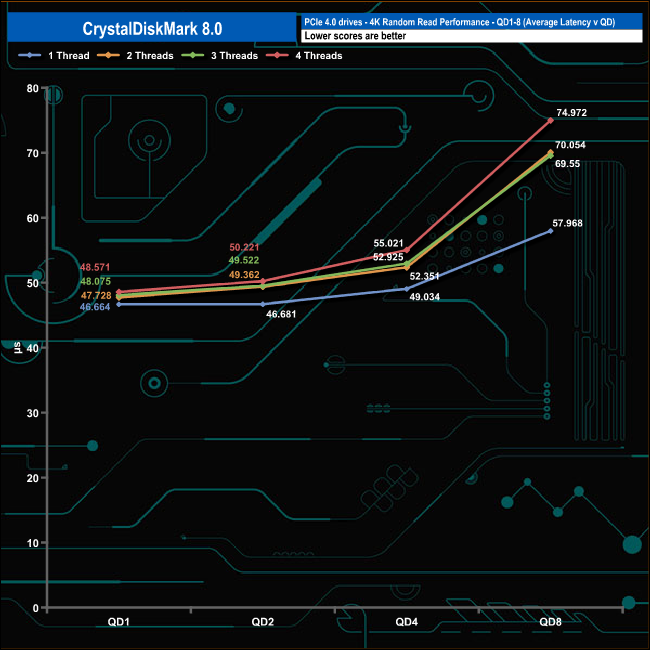
In the 4K Random Read QD1 – QD8 series of tests the performance of the 1TB P44 climbs smoothly through the queue depths with all the tested threads.
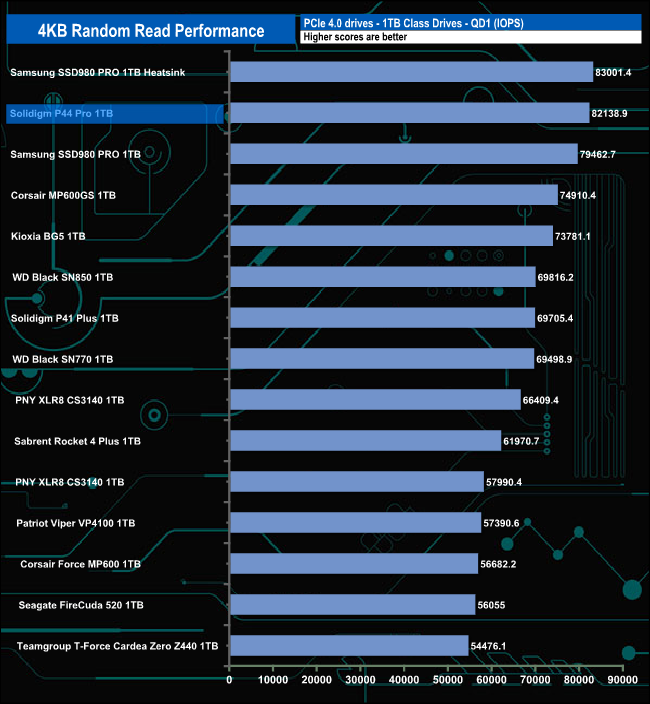
Using a single thread the performance ranges from 21,383 IOPS (87MB/s) at QD1 up to 135,730 IOPS (555MB/s) at QD8. Using four threads the QD1 performance rises to 82,138 IOPS (336MB/s) and while the QD8 performance rices to 390,029 IOPS (1,515MB/s)
Random Writes
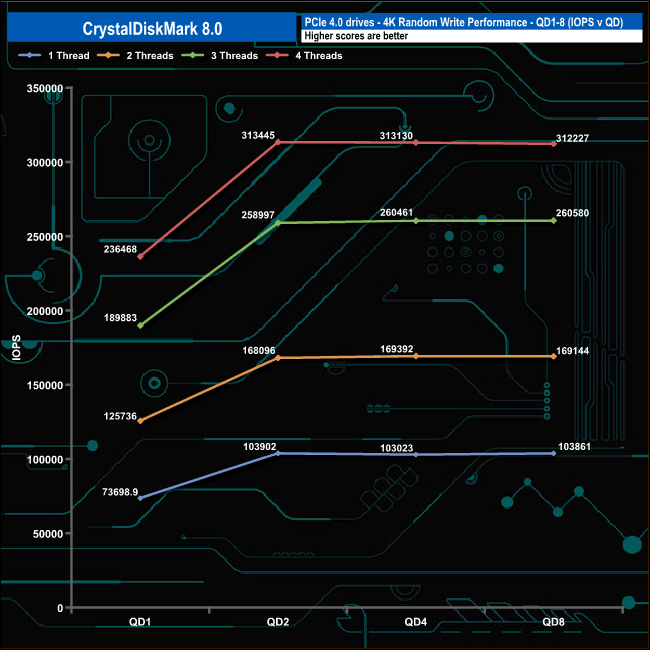
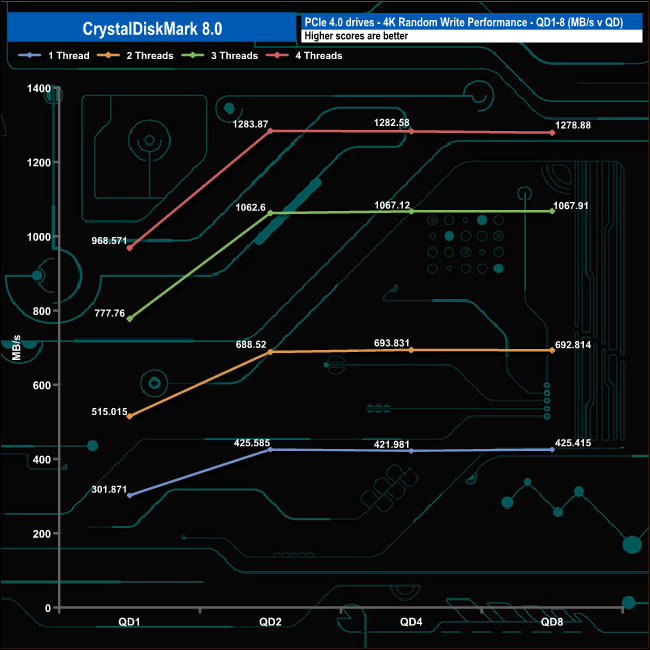
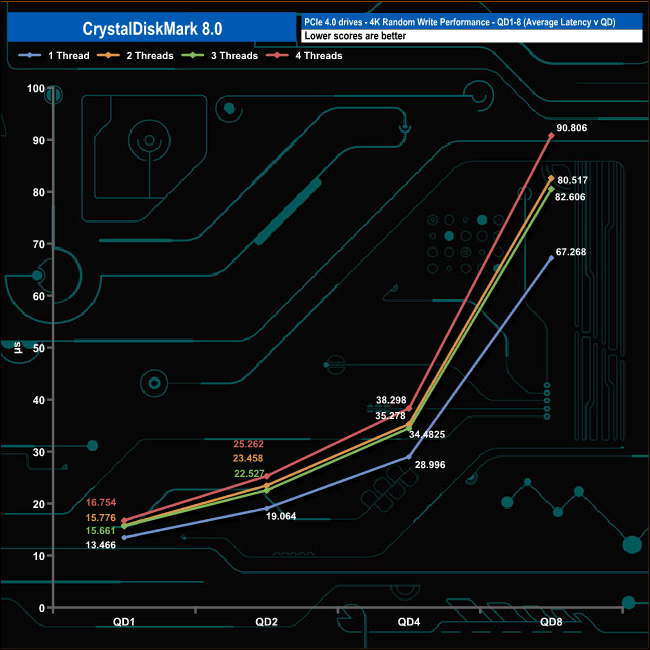
When it comes to 4K random writes, each thread tested peaked at QD2 before the performance seemed to plateau out.
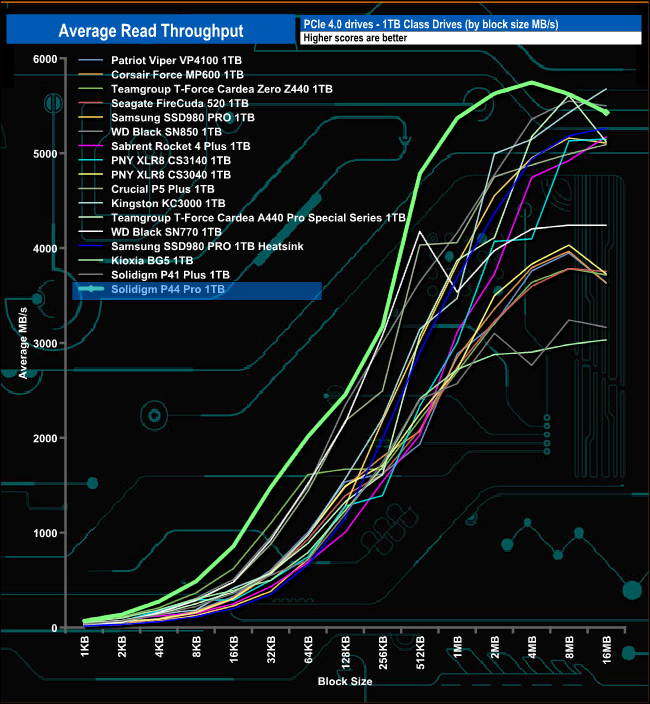
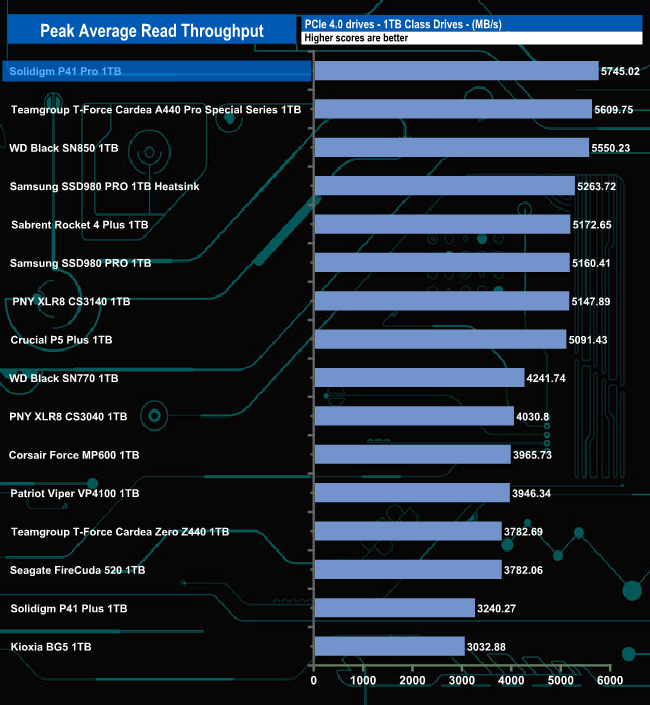
In our read-throughput test, the 1TB P44 Pro peaked at the 4MB block mark at 5,745,02MB/s before falling back to finish the test run at 5,429.76MB/s. Although the peak read figure falls well short of the official maximum of 7,000MB/s, it is still the fastest we have seen to date for a 1TB class consumer NVMe SSD.
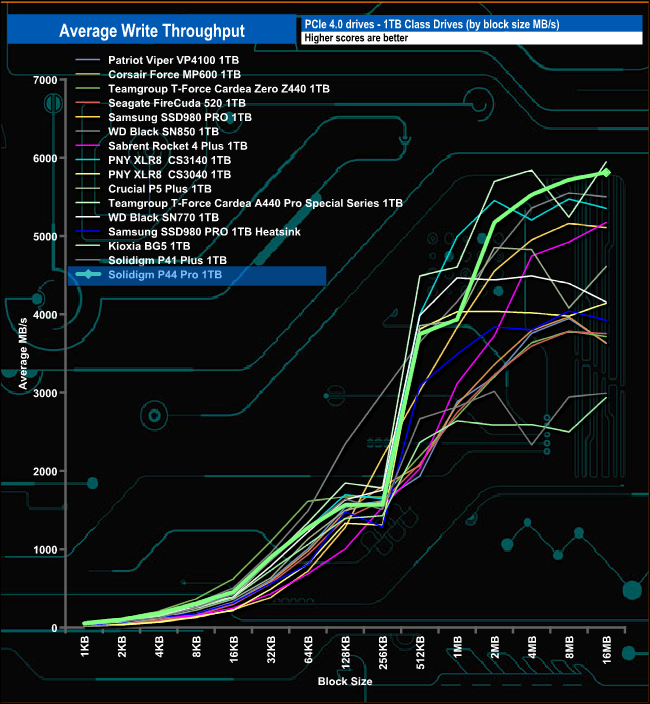
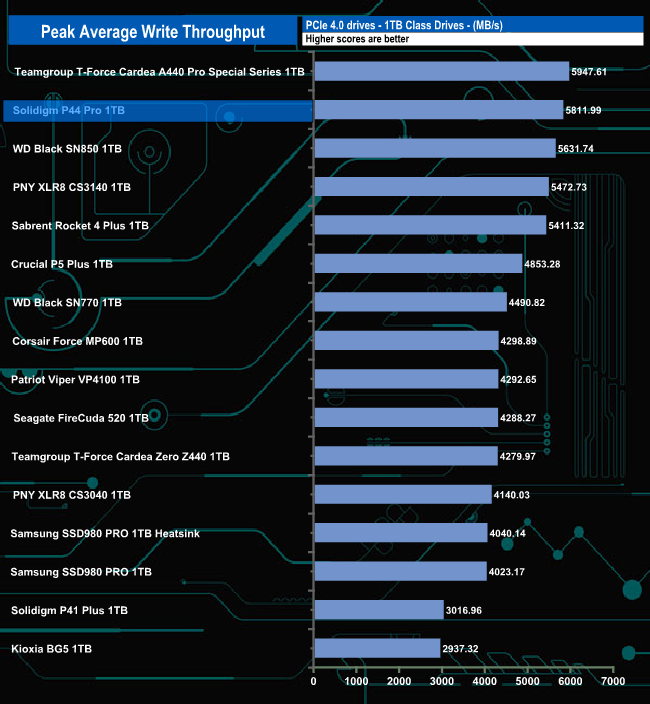
When it comes to write throughput test, the P44 Pro peaked at 5,811MB/s (16MB block) which is short of the official write figure of 6,5000MB/s, but still good enough for second place in our results chart.
The PCMark 10 Full System Drive Benchmark uses a wide-ranging set of real-world traces from popular applications and common tasks to fully test the performance of the fastest modern drives. The benchmark is designed to measure the performance of fast system drives using the SATA bus at the low end and devices connected via PCI Express at the high end.
The goal of the benchmark is to show meaningful real-world performance differences between fast storage technologies such as SATA, NVMe, and Intel’s Optane. The Full System Drive Benchmark uses 23 traces, running 3 passes with each trace. It typically takes an hour to run.
Traces used:
Booting Windows 10.
Adobe Acrobat – starting the application until usable.
Adobe Illustrator – starting the application until usable Adobe Premiere Pro – starting the application until usable.
Adobe Photoshop – starting the application until usable.
Battlefield V – starting the game until the main menu.
Call of Duty Black Ops 4 – starting the game until the main menu.
Overwatch – starting the game until main menu.
Using Adobe After Effects.
Using Microsoft Excel.
Using Adobe Illustrator.
Using Adobe InDesign.
Using Microsoft PowerPoint.
Using Adobe Photoshop (heavy use).
Using Adobe Photoshop (light use).
cp1 Copying 4 ISO image files, 20 GB in total, from a secondary drive to the target drive (write test).
cp2 Making a copy of the ISO files (read-write test).
cp3 Copying the ISO to a secondary drive (read test).
cps1Copying 339 JPEG files, 2.37 GB in total, to the target drive (write test).
cps2 Making a copy of the JPEG files (read-write test).
cps3 Copying the JPEG files to another drive (read test).
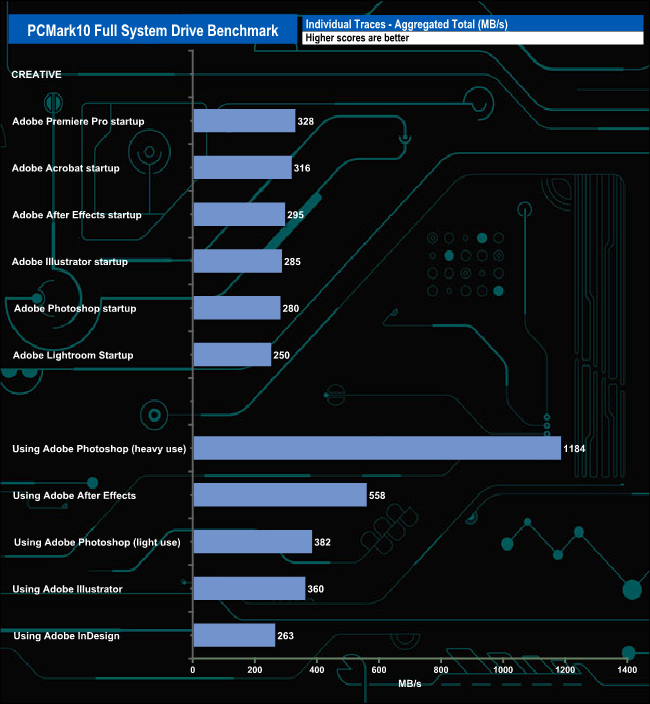
The 1TB P44 Pro sailed through PCMark 10's Full System Drive Benchmark without any problems. It averaged 292MB/s for the six Adobe start-up test traces, with the Premier Pro setup trace fastest at 328MB/s. The average for the five usage traces was 549MB/s, helped in no small part by the 1,184MB/s result for the Adobe Photoshop heavy usage trace.
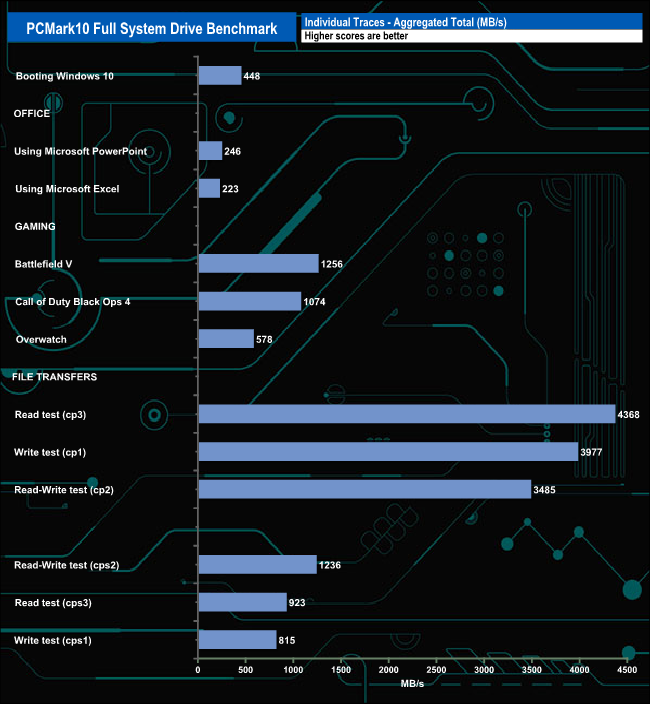
The drive produced very good figures for the cp1, cp2 and cp3 tests. Fastest was the cp3 read test at 4,368MB/s, next was the cp1 Write test at 3,977MB/s and finally the cp2 Read-Write test at 3,485MB/s.
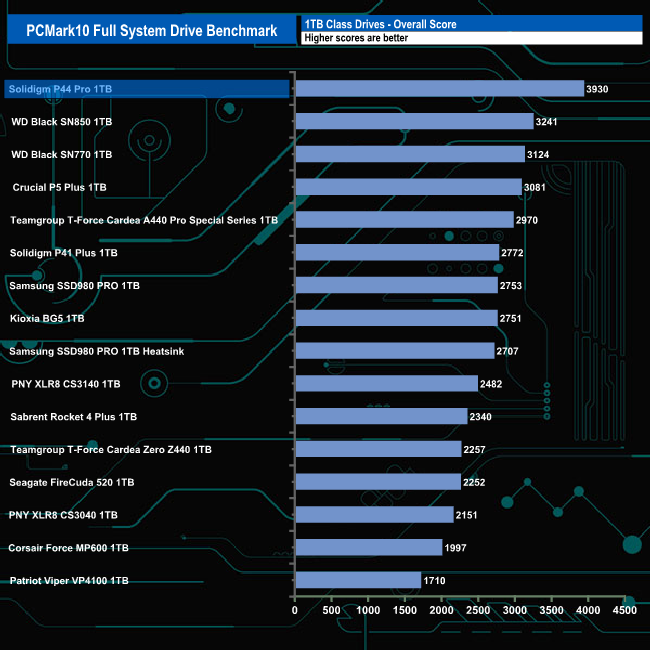
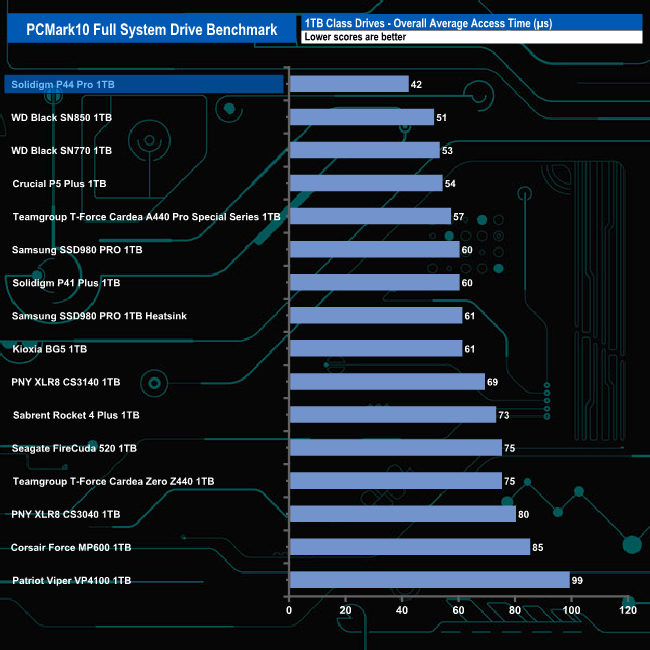
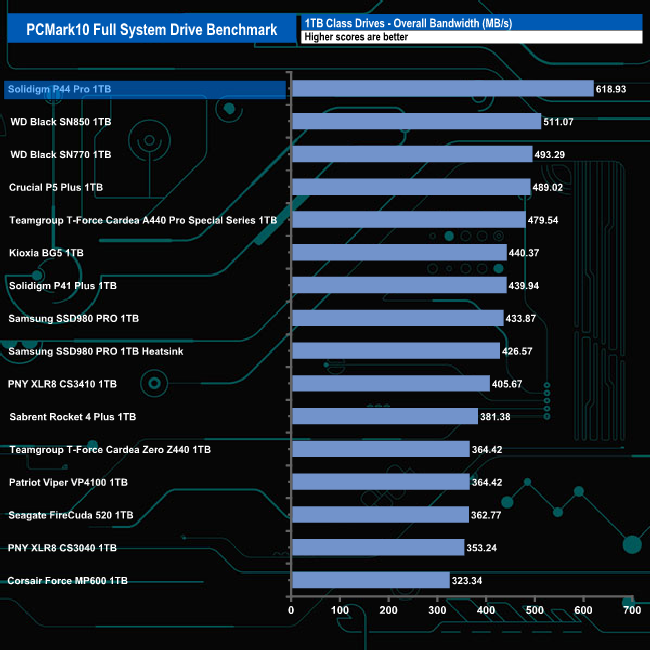
The overall bandwidth figure of 618.93MB/s sees the drive heading the table by quite a margin. The drive also heads the overall score (3930) and has an impressively low average access time of 42 µs.
The 3DMark Storage Benchmark uses traces recorded from popular games and gaming-related activities to measure real-world gaming performance.
Traces used –
Battlefield V
Loading Battlefield™ V from launch to the main menu.
Call of Duty Black Ops 4
Loading Call of Duty®: Black Ops 4 from launch to the main menu.
Overwatch
Loading Overwatch® from launch to the main menu.
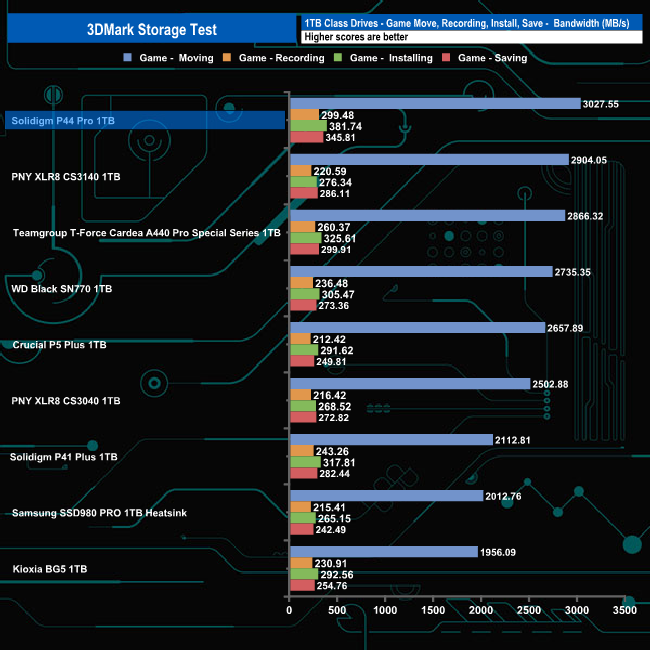
Game Move
Copying the Steam folder for Counter-Strike®: Global Offensive from an external SSD to the system drive.
Game Recording
Recording a 1080p gameplay video at 60 FPS with OBS (Open Broadcaster Software) while playing Overwatch®.
Installing Game
Installing The Outer Worlds® from the Epic Games Launcher.
Game Saving
Saving progress in The Outer Worlds game.
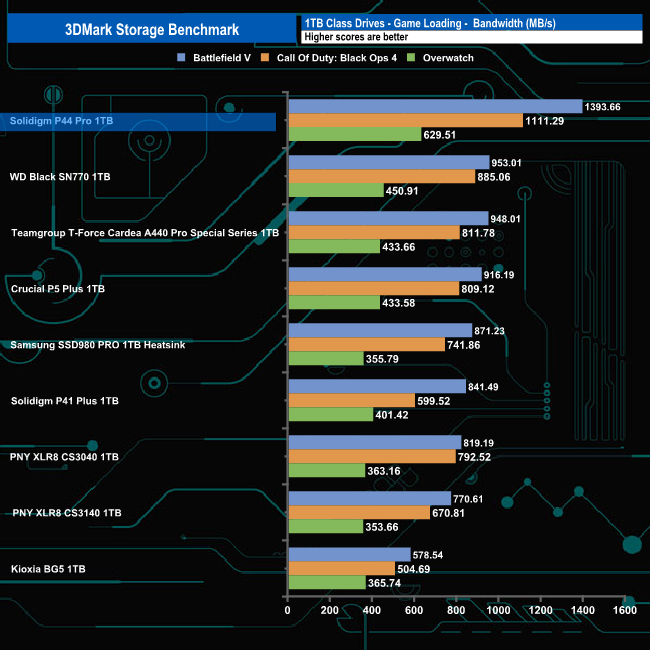
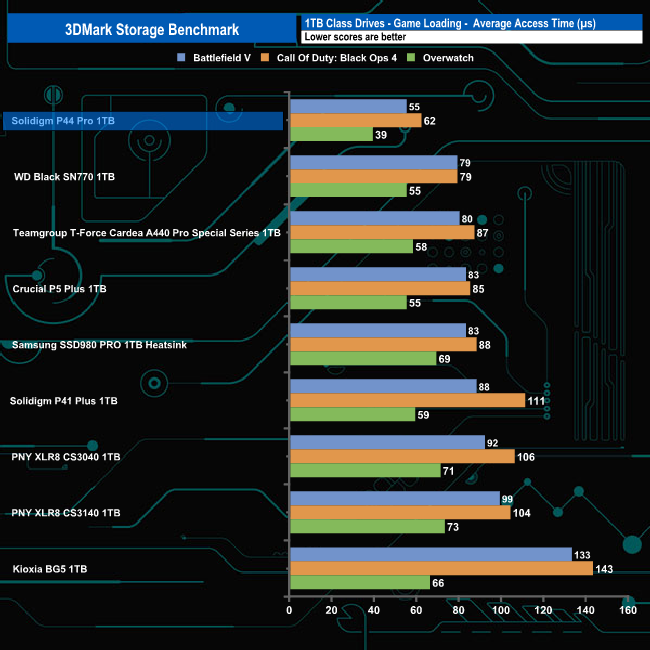
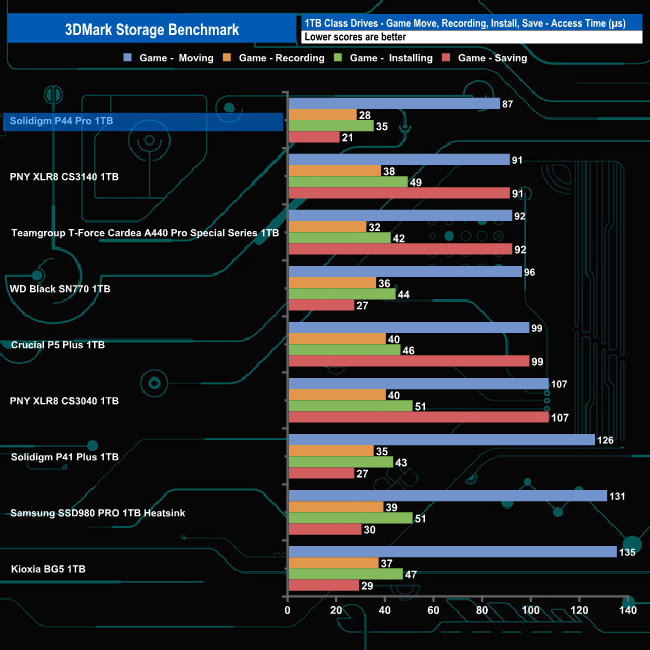
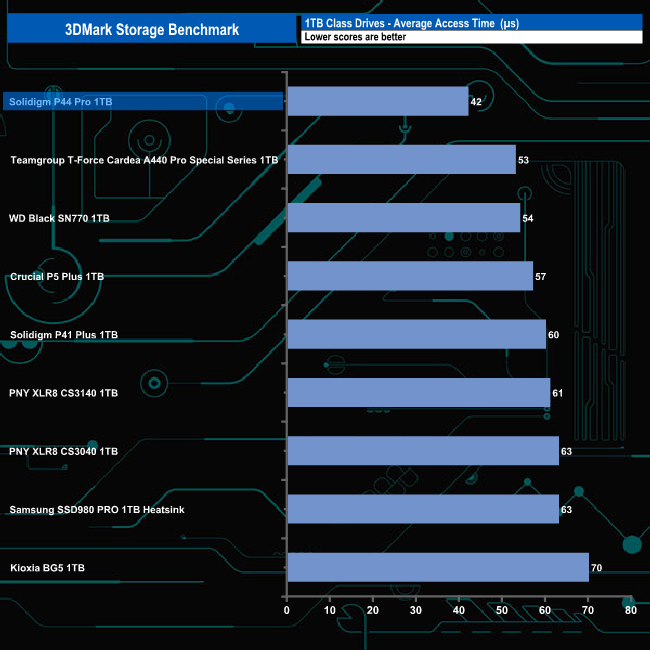
In 3DMark’s Storage Test, the 1TB P44 Pro tops all the results charts. It has an average game loading bandwidth of 1,044.82MB/s for the three games (Battlefield V, Call of Duty: Black Ops 4 and Overwatch) the benchmark uses. Average access time for loading the three games is 52µs.
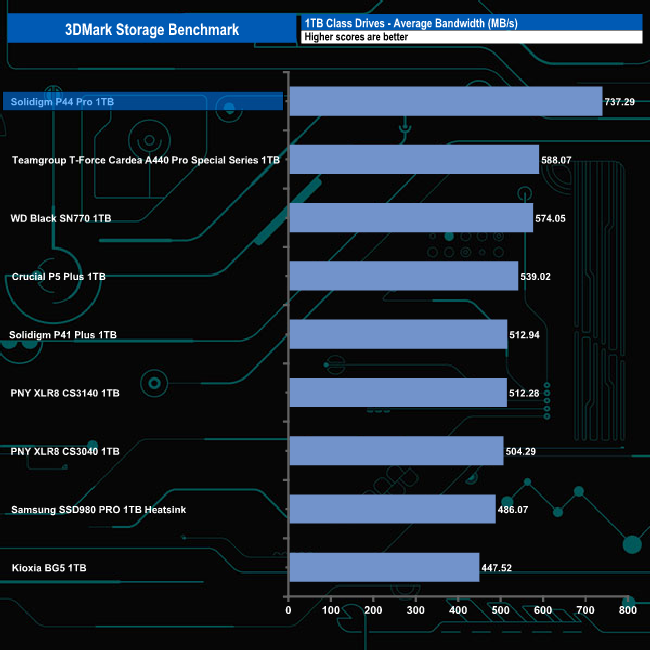
The overall average bandwidth figure of 737.29MB/s for the complete test run is the fastest we've seen to date, by quite some margin, for a 1TB class consumer drive. It's 224MB/s more than the previous Solidigm drive we've tested, the 1TB P41 Plus.
The Final Fantasy XIV Endwalker Official Benchmark uses actual maps and playable characters to assign a score to your PC and rate its performance including scene loading times.
The benchmark gives an overall load time as well as loading times by scene.
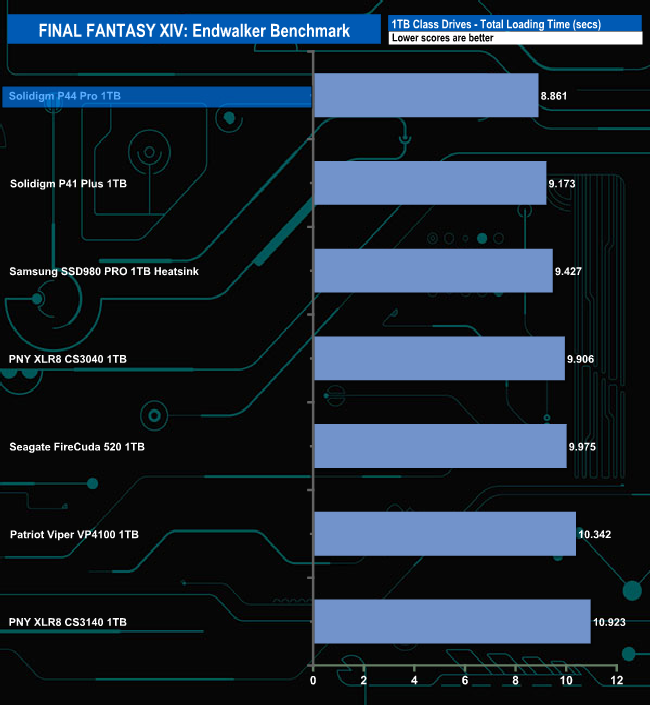
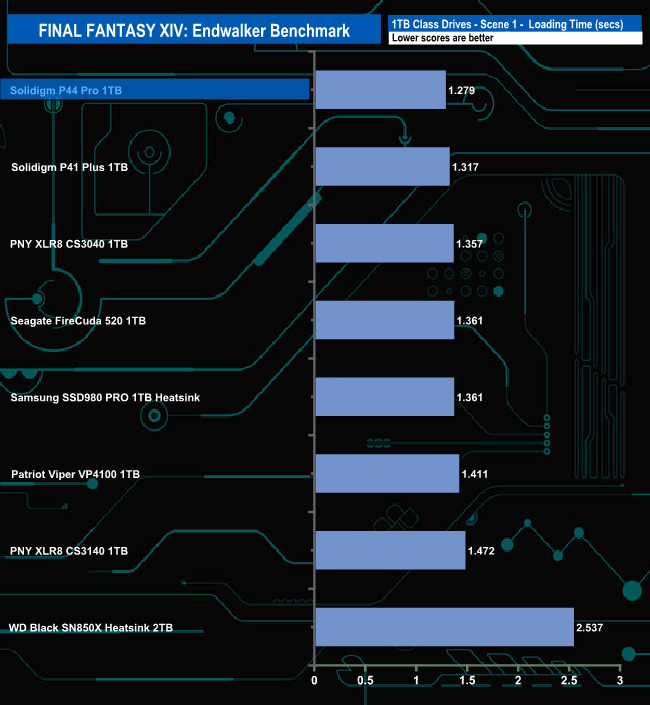
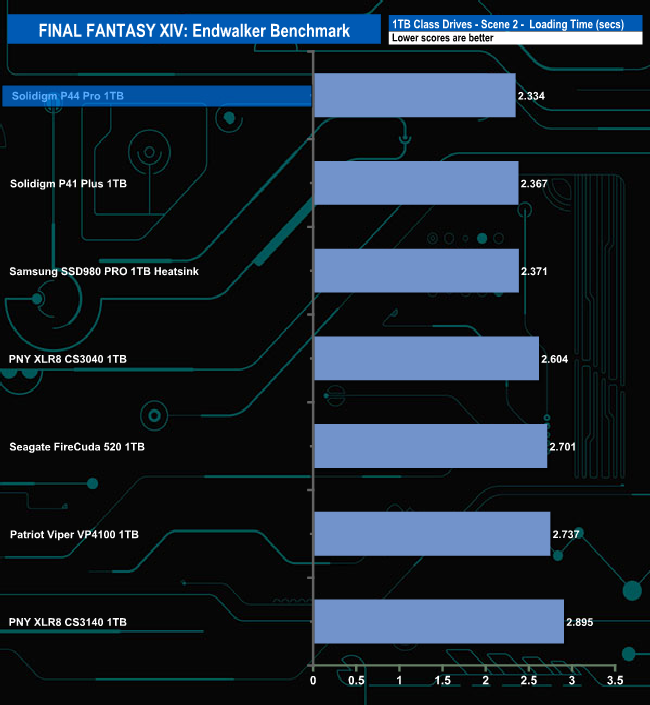
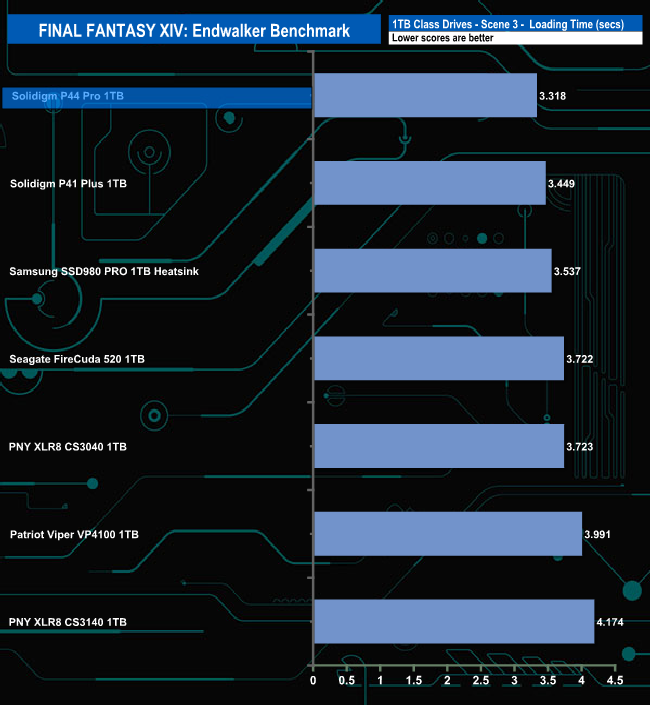
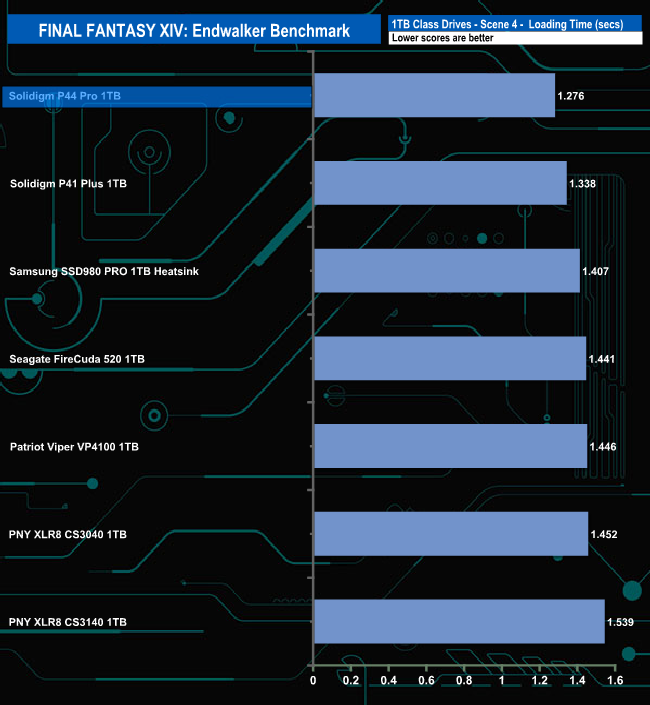
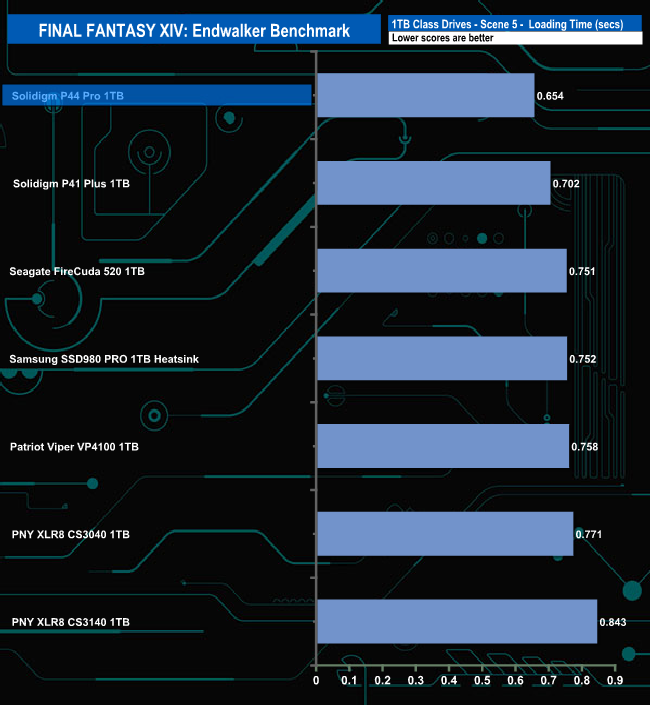
The Solidigm P44 Pro total load time of 8.861 seconds is the fastest we've seen to date for this test.
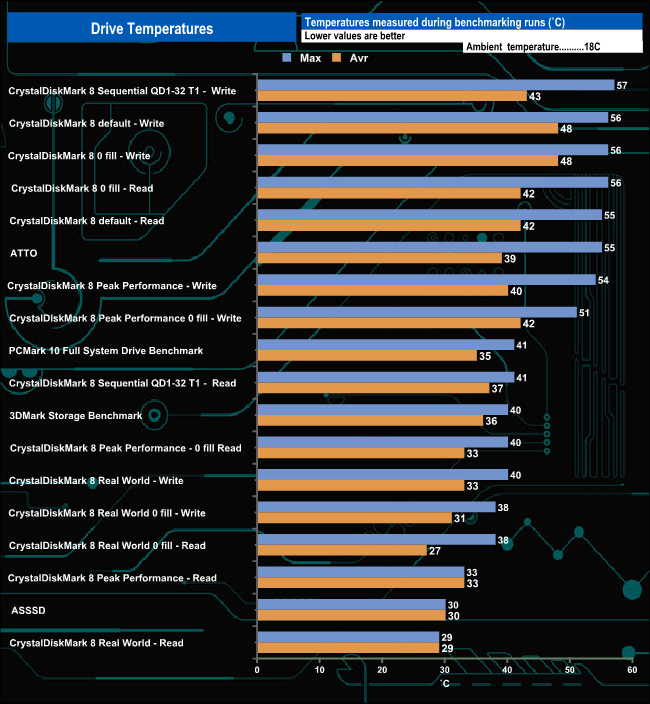
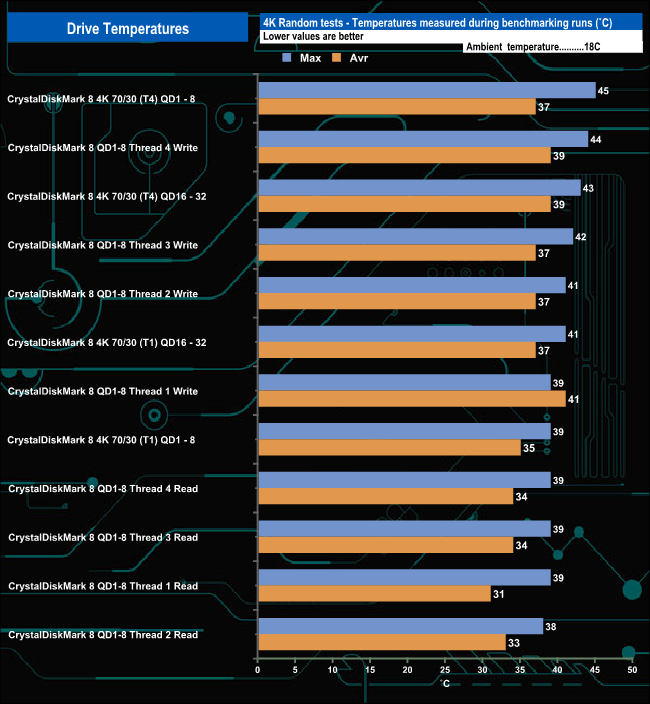
We took note of the drive’s temperature during some of our benchmarking runs. The Solidigm P44 Pro doesn't come with any form of a physical heat sink and Solidigm claim it has been optimised for thermal efficiency and minimal throttling which seems to be confirmed by our test results.
The hottest the drive got was when being pushed extremely hard during repeated runs of the CrystalDiskMark 8 Sequential write tests where it reached 57° C, 13° C below the stated maximum of 70° C which is a bit close for comfort, but there didn't appear to be any throttling issues.
For the bulk of our testing, the temperature averaged around 36° C, well below that 70° C maximum operating temperature.
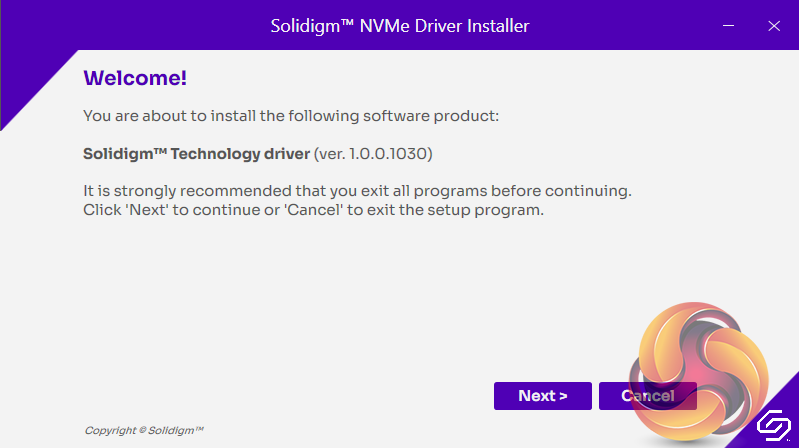
Available as a download from the Solidigm website is the Solidigm Synergy Storage Driver. Solidigm claims that by using this driver instead of the default Windows one can deliver read and write speeds up to 21% higher than the standard version. We tested the drive using this driver but not before we ran some selected tests with the standard Windows drive to see if we could spot any changes.
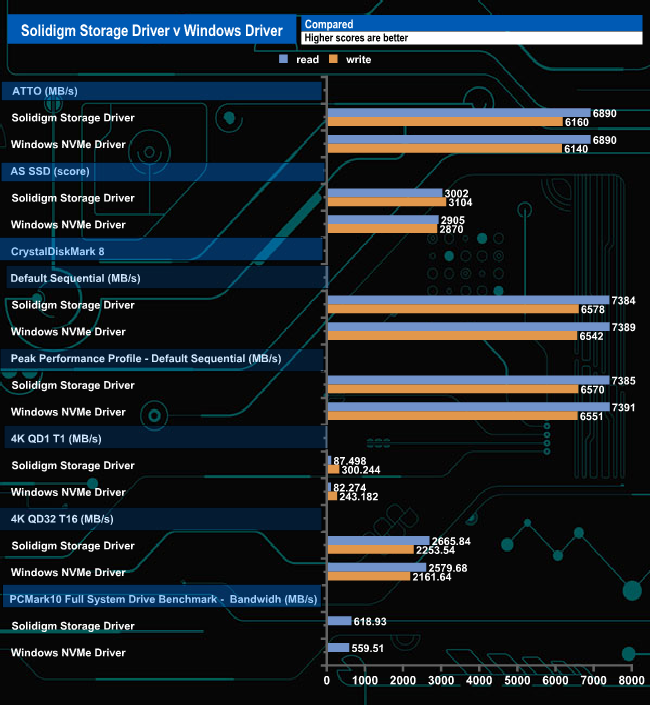
Looking at our benchmark results the best gain we saw from using the Solidigm driver was from the 4K QD1 T1 test of CrystalDiskMark 8, where the write score rose from 243.182MB/s to 300.244MB/s.
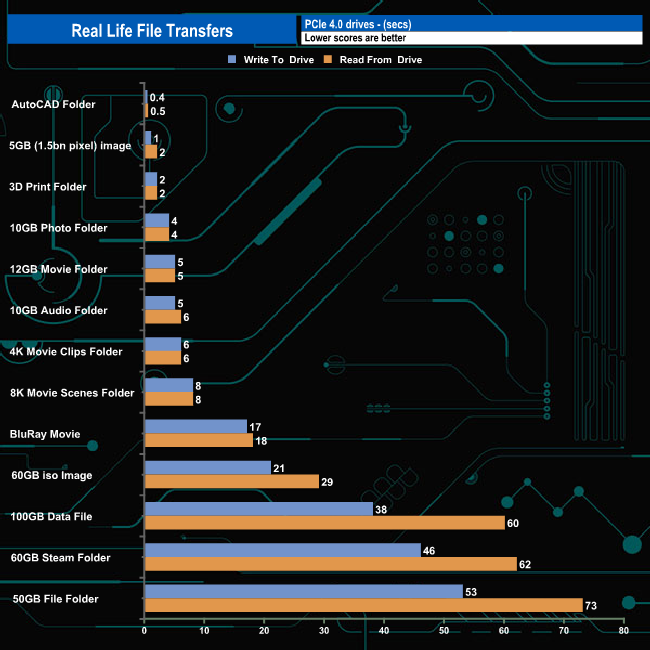
To test the real-life performance of a drive we use a mix of folder/file types and by using the FastCopy utility (which gives a time as well as MB/s result) we record the performance of the drive reading from & writing to a 256GB Samsung SSD850 PRO.
We use the following folder/file types:
100GB data file.
60GB iso image.
60GB Steam folder – 29,521 files.
50GB File folder – 28,523 files.
21GB 8K Movie demos.
12GB Movie folder – 24 files (mix of Blu-ray and 4K files).
11GB 4K Raw Movie Clips (8 MP4V files).
10GB Photo folder – 621 files (mix of png, raw and jpeg images).
10GB Audio folder – 1,483 files (mix of mp3 and .flac files).
5GB (1.5bn pixel) photo.
Blu-ray movie.
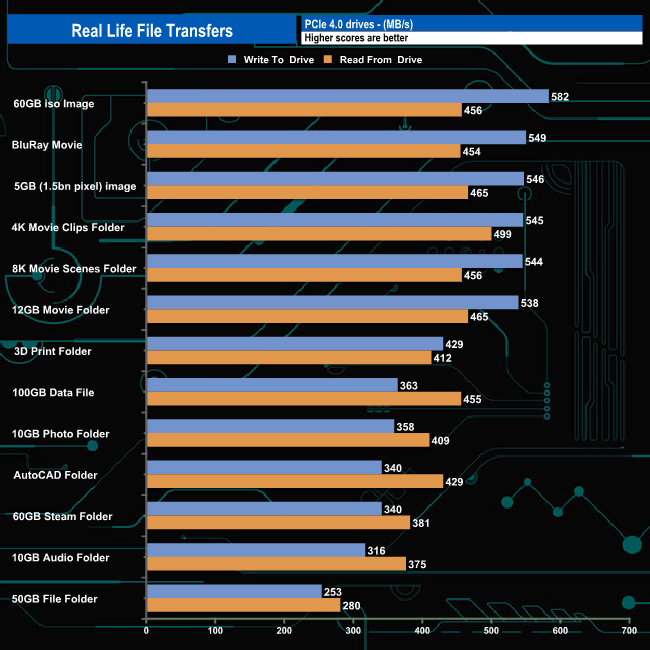
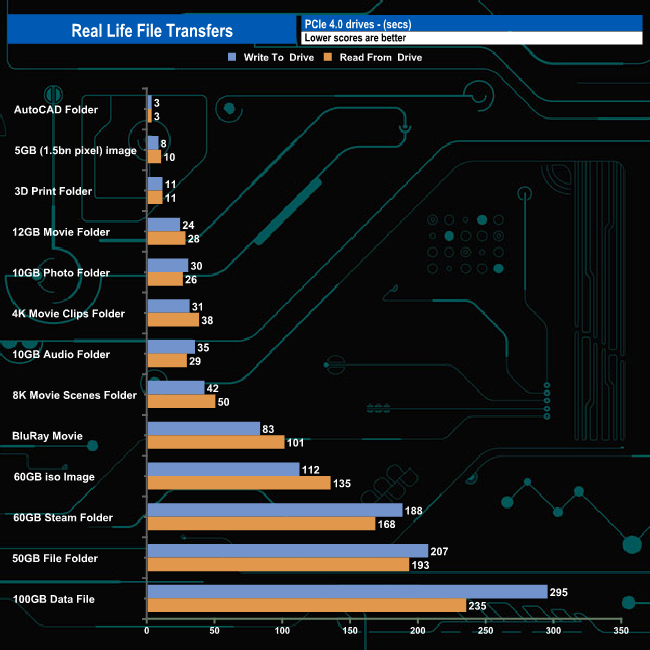
Solidigm's P44 Plus averaged 550MB/s for writes when dealing with the larger file size transfers and 465MB/s when reading the data back. However, It's not quite as efficient when dealing with smaller file sizes, averaging 299MB/s for writes and 391MB/s for reads. As normal, the 50GB file folders are the slowest; 253MB/s writes and 280MB/s reads.
To get a measure of how much faster PCIe NVMe drives are than standard SATA SSD's we use the same files but transfer to and from a 2TB Kioxia Exceria Plus drive:
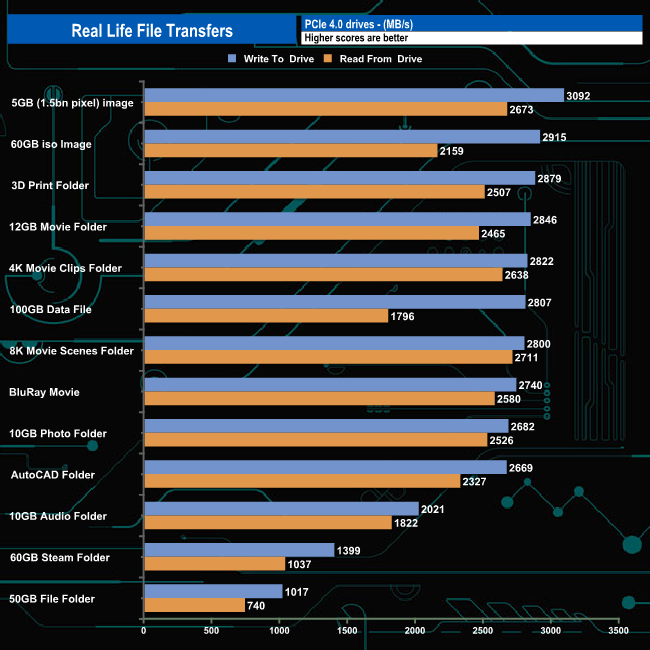
Switching to an all-NVMe environment, transfer speeds increased dramatically and access times plummeted. Ten of the write transfers topped 2GB/s, the fastest being the 3,092MB/s for the 5GB/s image transfer. Nine of the read transfers topped 2GB/s, again the fastest being for 5GB/s image transfer at 2,673MB/s,
The P44 Pro is the second Solidigm-branded SSD to be launched and where the first drive, the P41 Plus, was aimed at the value end of the market, the flagship client P44 Pro SSD has been designed to cater for the needs of high-performance gaming, content creation, and PC workstation segments. It also meets the published requirements for the Sony PS5 but in this case, will need a heatsink.
The P41 Plus is a DRAMless design built around a combination of a 4-channel controller and QLC NAND. The P41 Pro uses a much more conventional approach of an eight-channel controller looking after 3D TLC NAND. The controller in question is an SK hynix product, code-named Aries. Manufactured on a 12nm process the ACNS075 is an eight-channel controller with a transfer rate of 1600MT/s for each channel. Internally the ACNS075 uses quad-core Cortex-R5 architecture. With the 1TB P44 Pro, this is looking after a pair of SK hynix 176-Layer 3D TLC packages
Solidigm rates the Sequential performance of the 1TB P44 Pro as up to 7,000MB/s for reads and up to 6,500MB/s for writes. Testing the drive with the ATTO benchmark we couldn't quite reach the official maximums for either reads or writes. However, the test results of 6,890MB/s for reads and 6,160MB/s for writes are the fastest figures we've seen to date for a consumer 1TB class drive. Switching over to the CrystalDiskMark 8 benchmark we could confirm both official figures with test results of 7,384MB/s (reads) and 6,578MB/s (writes).
Random 4K performance for the P44 Pro is up to 1,400,000 IOPS for reads and 1,300,000 IOPS for writes. With our four-threaded testing, we couldn't get close to either of these figures with a best-read result of 390,029 IOPS at a QD of 8 with writes at 313,446 IOPS at QD32. The best random read/write performance figures we saw from testing came from the Peak Performance profile in CrystalDiskMark 8 at 648,842.29 IOPS and 545,564.21 IOPS respectively.
Solidigm backs the drive with a couple of useful downloads, Solidigm Storage Driver and Solidigm Storage Tool. Solidigm claims that by using this driver instead of the default Windows it can deliver read and write speeds up to 21% higher than the standard version. We used the driver to test the P44 Pro but we did do some testing with the standard Windows driver to see if we could see any performance improvements. The most significant advantage we saw came when the drive was tested with CrystalDiskMark 8's 4K QD1 Thread 1 test, using the Solidigm driver saw the write performance rise from 243.182MB/s to 300.244MB/s.
As you might have gathered from its name, the Solidigm Storage Tool is their SSD management utility. Although not as flashy as some utilities offered by some of Solidigm's competitors it has all you really need to keep the drive in good shape.
The P44 Pro doesn't have any sort of heatsink fitted and although we got pretty close to the maximum of 70° C during some of our test runs we didn't see any indications of any throttling. But as always with a Gen 4 drive, it would be prudent to use any motherboard cooling available.
We found the 1TB Solidigm P44 Pro on ebuyer.com for £122.99 (inc VAT) HERE.
Discuss on our Facebook page HERE.
Pros
- Overall Performance.
- Solidigm Storage Tool.
- Solidigm Storage Driver.
Cons
- Couldn't hit the maximum official 4K figures under testing.
- Lack of heatsink.
KitGuru says: Solidigm's first branded SSD aimed at the higher end of the market is quite some drive. The 1TB version of the drive we tested topped our results charts on a number of occasions.