

WD's latest SSD is the Blue SN580, a mainstream drive and the successor to the popular SN570. The new drive uses a PCIe Gen 4 x4 interface rather than the PCIe Gen 3 x4 of the SN570. With the 1TB model available for just over £50, we put this drive through its paces to see if it's worth buying.
The WD Blue SN580 comes in four capacities; 250GB. 500GB, 1TB (the drive we are looking at here) and a flagship 2TB drive. The drive uses a combination of a SanDisk four-channel controller (details of which are very scarce) and 112-Layer BiCS5 3D TLC NAND.
WD quote Sequential read/write performance figures for the 1TB Blue SN580 as up to 4,150MB/s. The 250GB and 500GB drives are rated as up to 4,000MB/s for reads while the 2TB drive has the same 4,150MB/s read figure as the 1TB drive. As for write performance, the 250GB drive is rated as up to 2,000MB/s, the 500GB drive 3,600MB/s and the 2TB drive 4,150MB/s.
When it comes to 4K random performance the 1TB and 2TB drives are rated as up to 600,000 IOPS and 750,000 IOPS for reads and writes respectively. The 500GB drive gets the same 750,000 IOPS write figure but with a 450,000 IOPS read rating. The 250GB drive has read/write figures of up to 240,000 IOPS and up to 470,000 IOPS respectively.
WD rate the endurance of the 1TB drive as 600TBW and back the drive with a 5-year warranty.
Physical Specifications:
- Usable Capacities: 1TB.
- NAND Components: 112-Layer BiCS5 3D TLC NAND.
- NAND Controller: SanDisk 4-channel.
- Cache: none.
- Interface: PCIe Gen 4 x4, NVMe 1.4.
- Form Factor: M.2, 2280.
- Dimensions: 80 x 22 x 2.38mm.
- Drive Weight: 5.5g
Firmware Version: 281010WD.
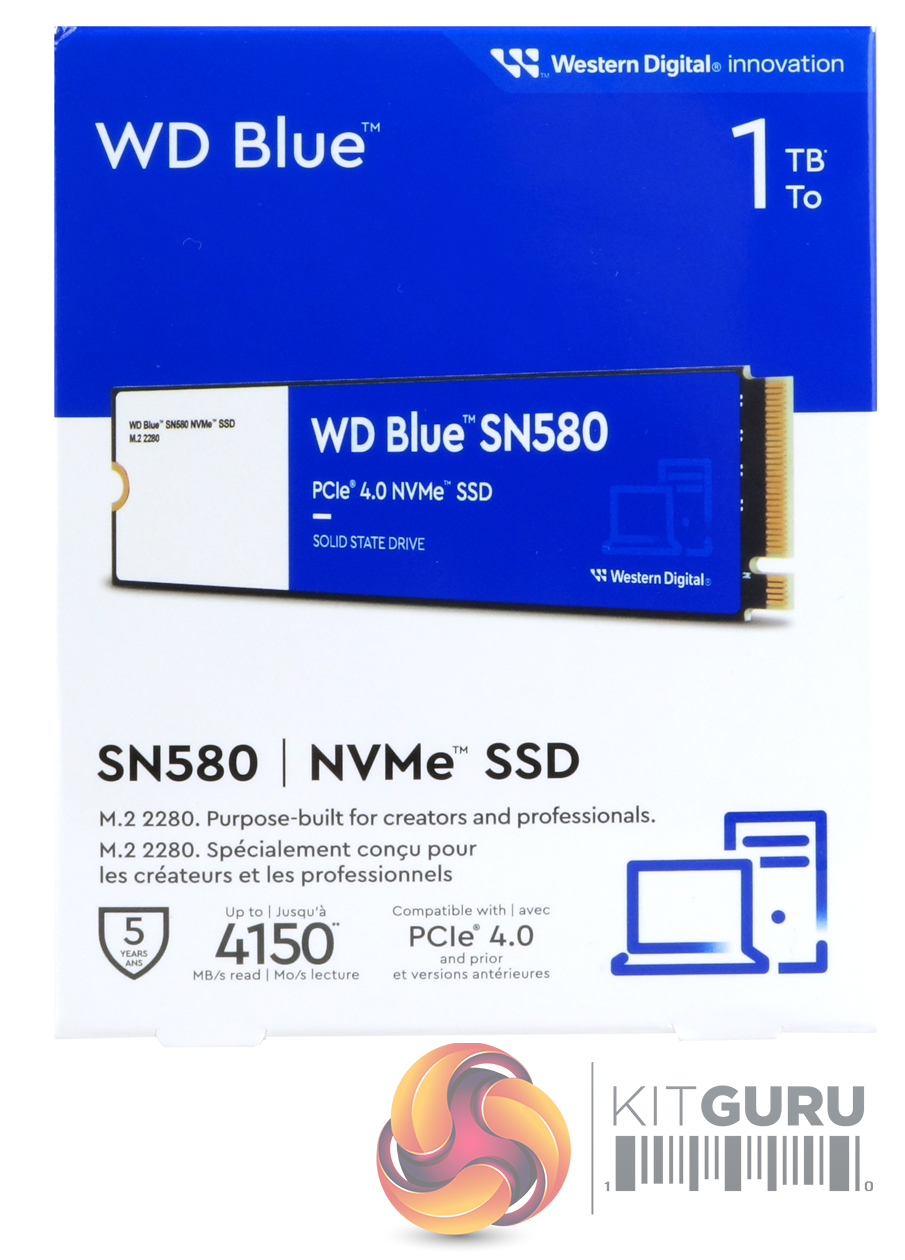
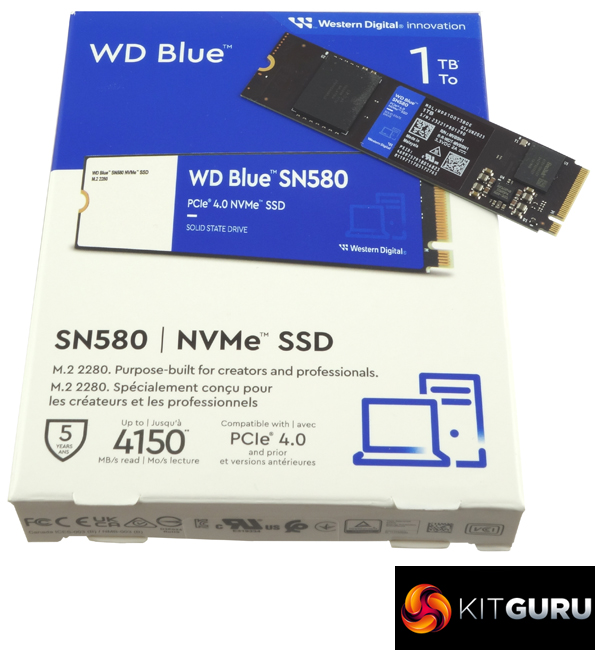
The WD Blue SN580 comes in a smallish box with a clear image of the drive on the front. Under the image is a line of text that tells you that it's an M.2 2280 drive and under this is an icon displaying the fact that the drive is supported by a 5-year warranty and the Sequential read figure (up to 4,150MB/s).
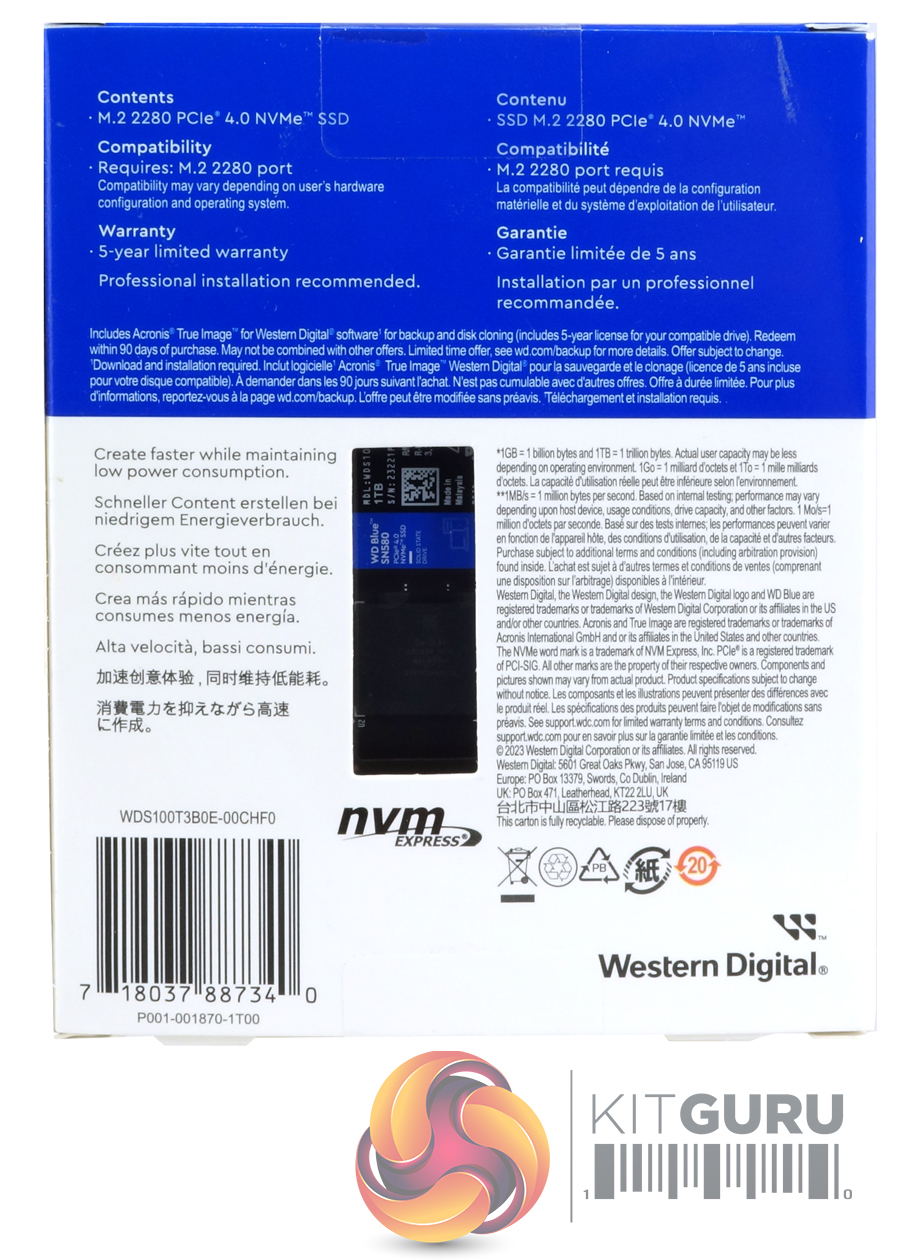
The rear of the box has a small clear plastic panel through which part of the drive is visible, sitting in its protective plastic enclosure. The only other thing in the box is a Technical Support and Warranty Guide.
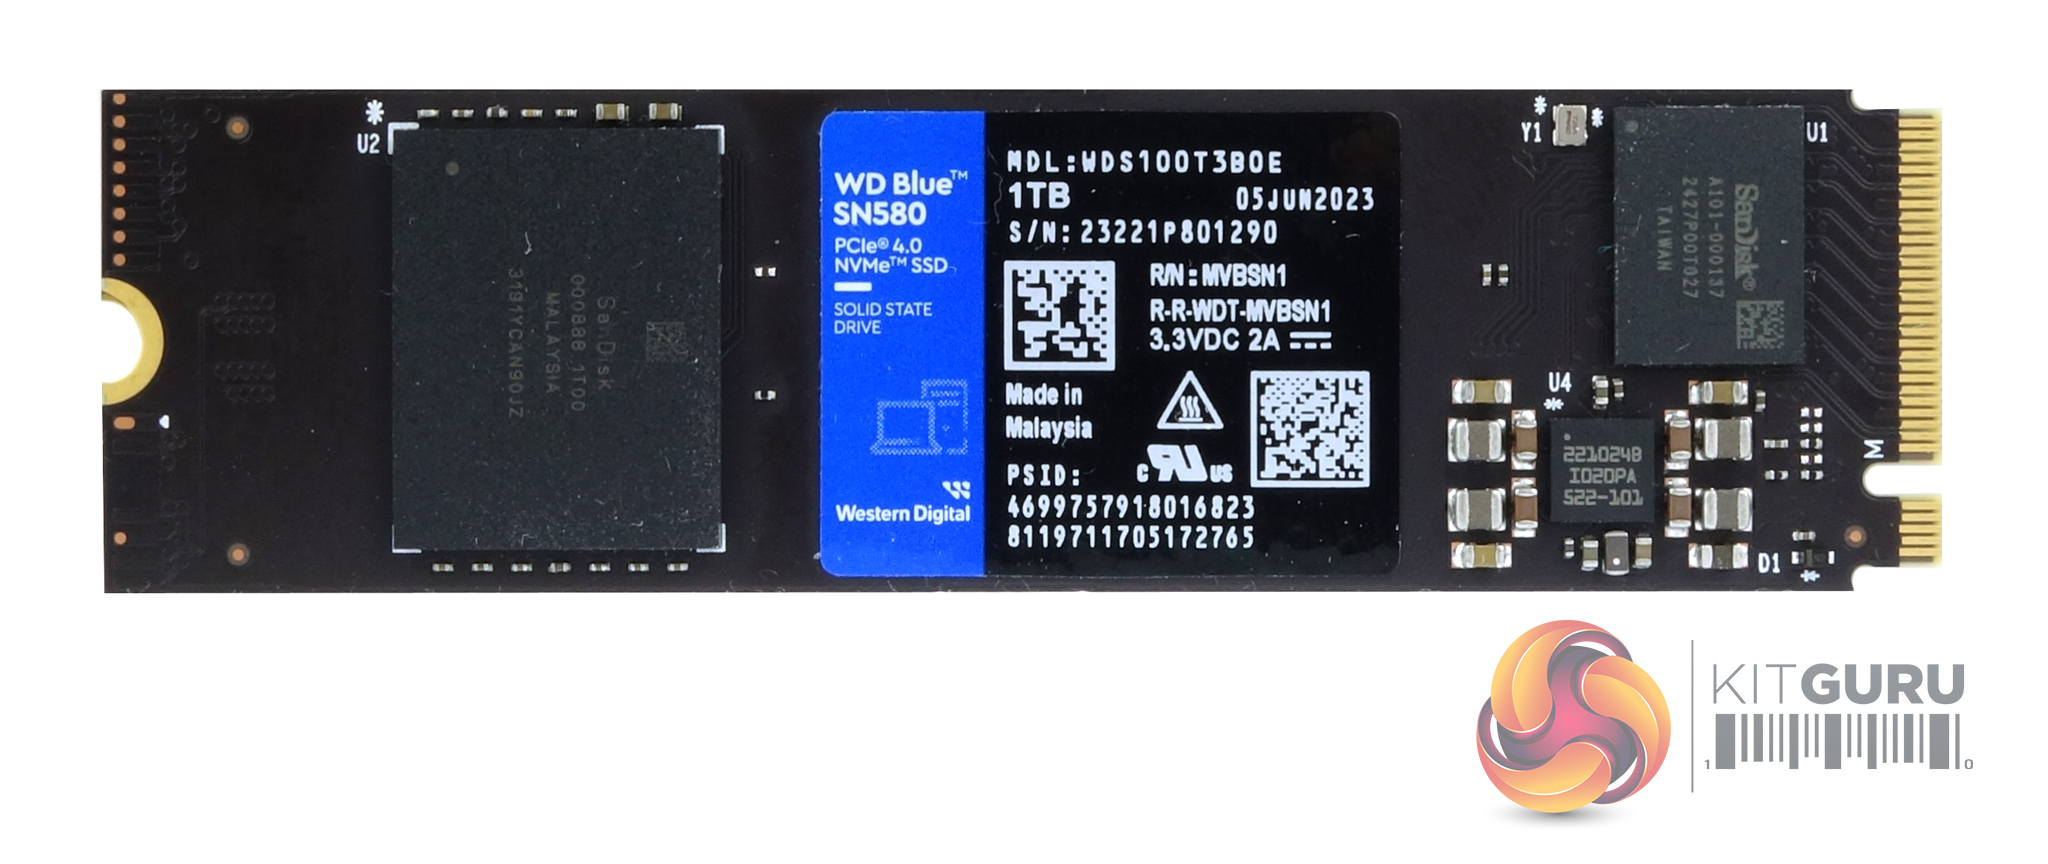
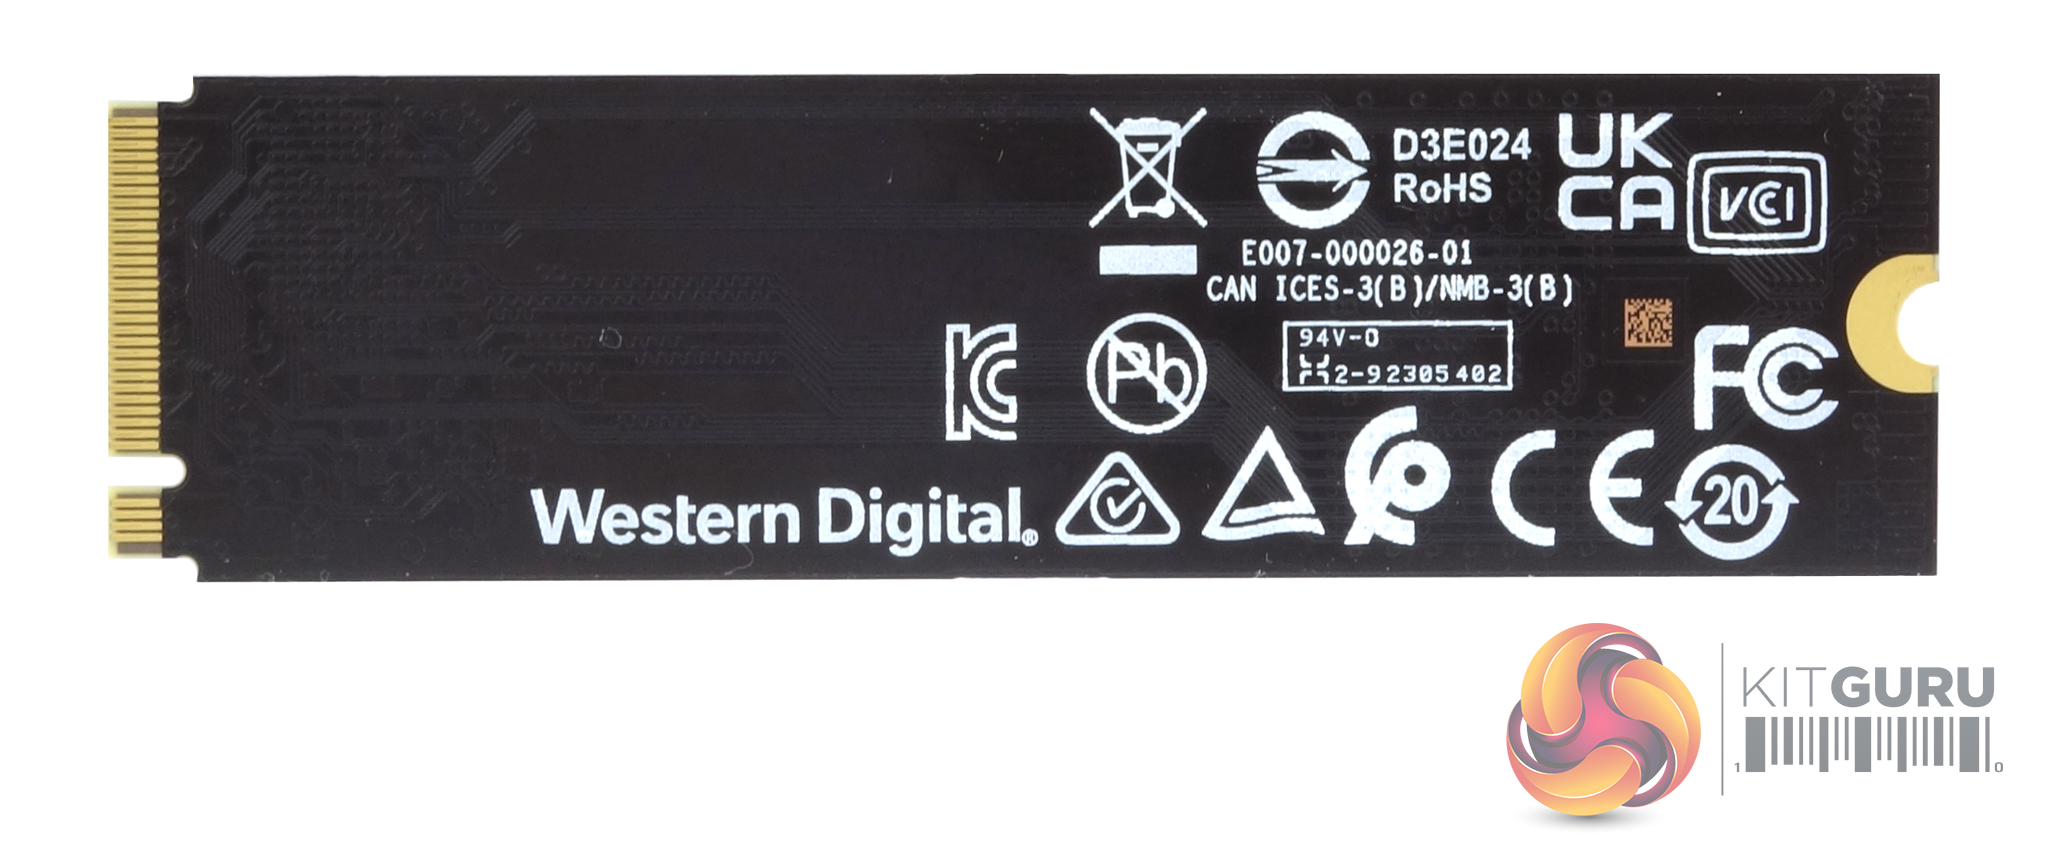
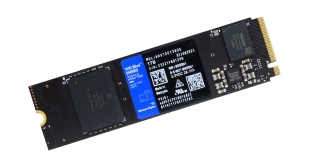
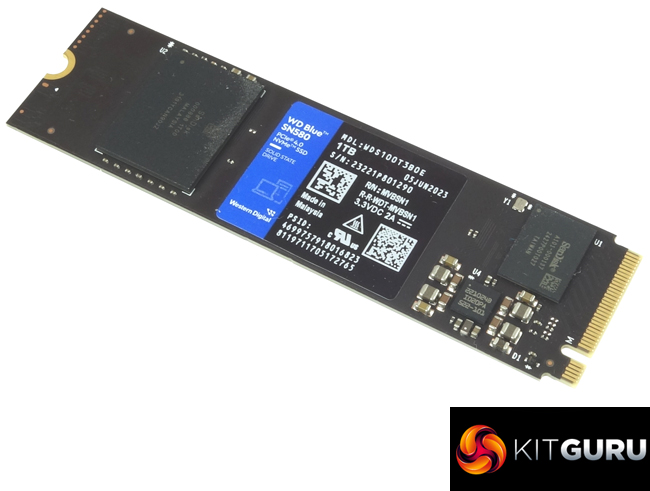
WD’s 1TB Blue SN580 is a single-sided PCB design, so the rear of the drive is empty, mind you, with only a very small controller, a single NAND package (coded Sandisk 000888 1T00) and a power management chip, the front side of the drive isn't exactly crowded either. Details on the controller (coded A101-000137) are very hard to find but the best guess is that it's four-channel while the NAND is 112-Layer BiCS5 3D TLC NAND.
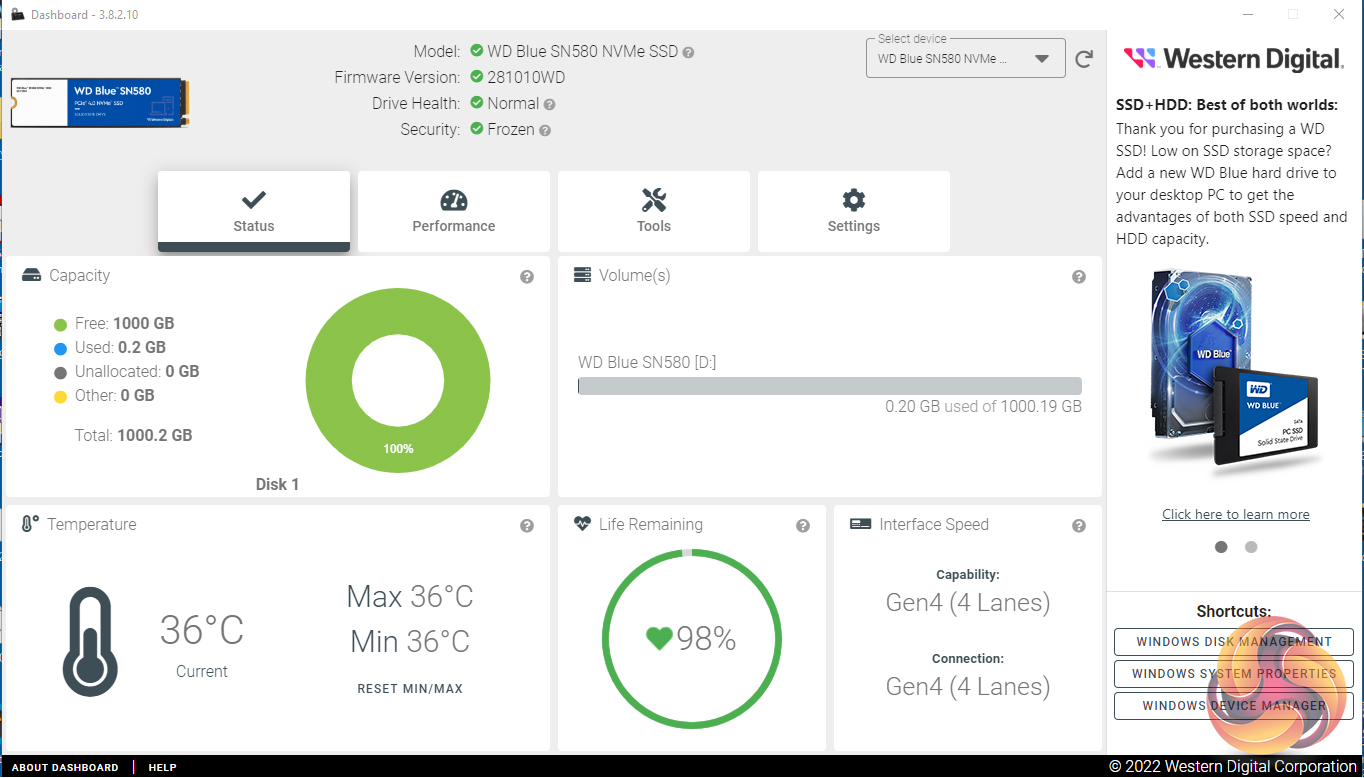
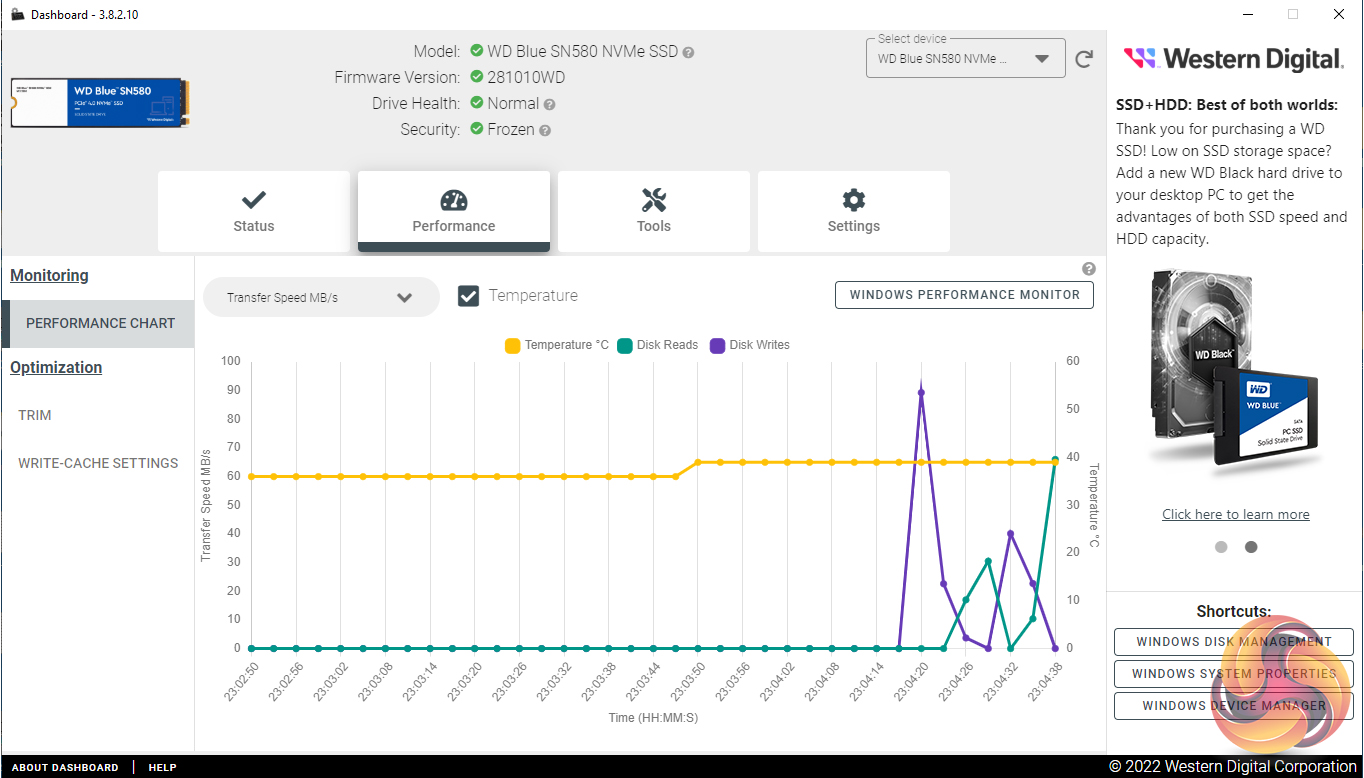
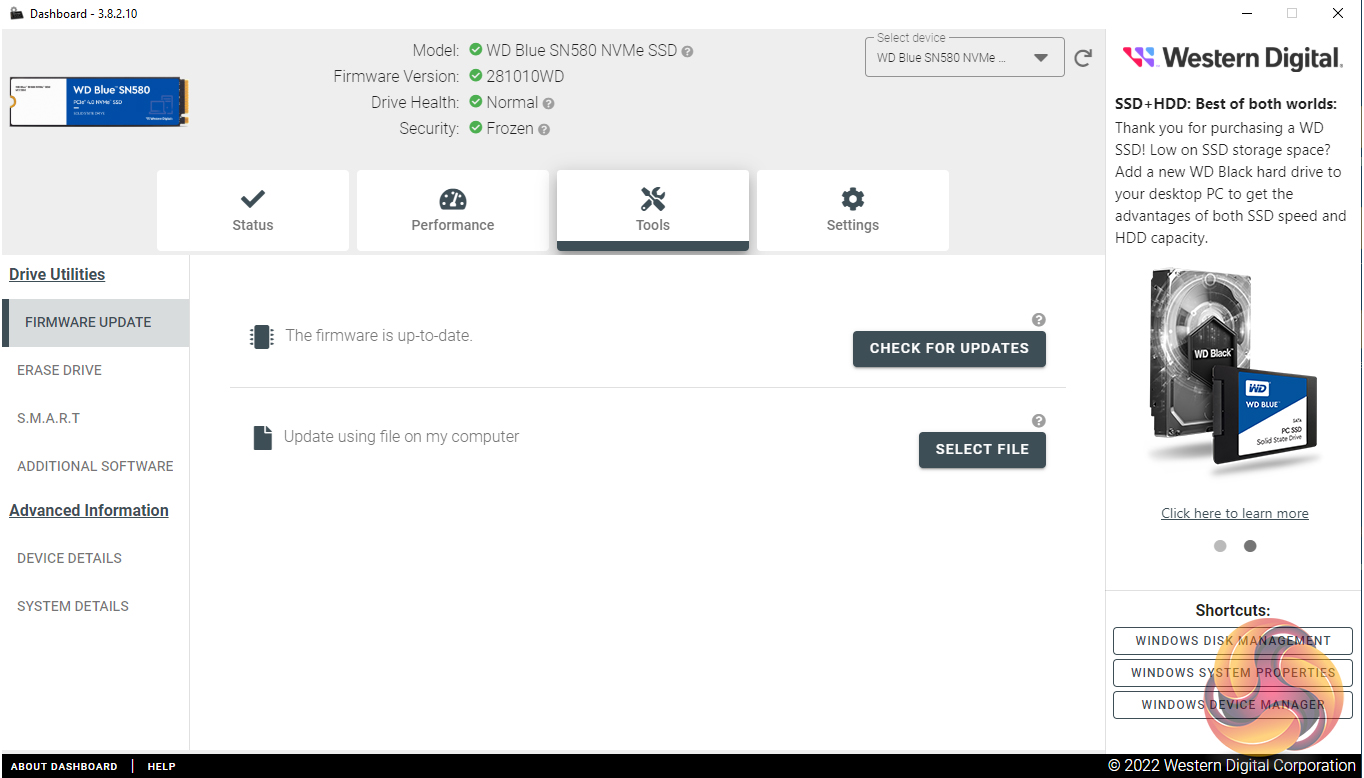
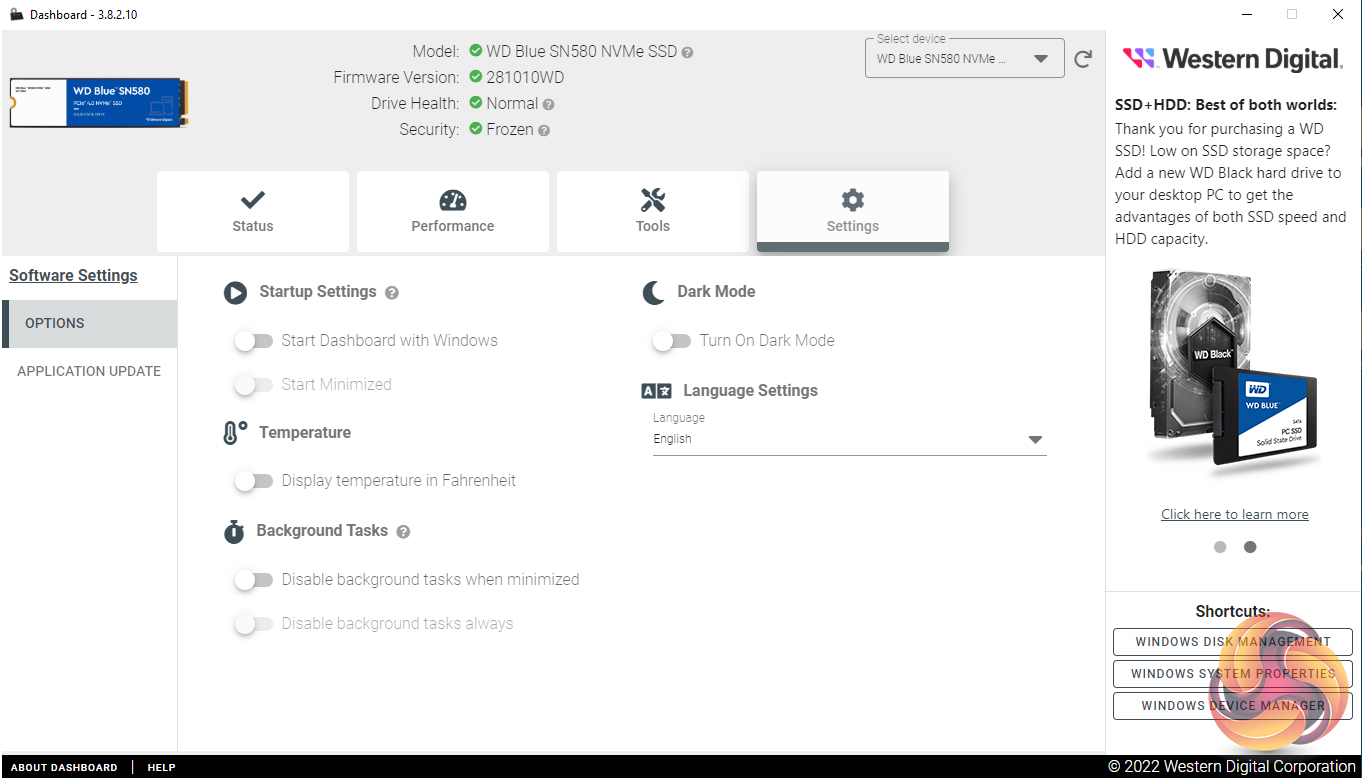
WD’s SSD management utility goes under the name of SSD Dashboard. With it, you can monitor drive status, performance, update firmware and monitor temperatures. There’s no cloning tool integrated into the utility but you can download Acronis True Image WD Edition from the WD website. There is also an option to change the layout to a dark mode.
For testing, the drives are all wiped and reset to factory settings by HDDerase V4. We try to use free or easily available programs and some real-world testing so you can compare our findings against your own system.
This is a good way to measure potential upgrade benefits.
Main system:
AMD Ryzen 5 3600X, 16GB DDR4-2400, Sapphire R9 390 Nitro and an MSI MPG X570 Gaming Edge Wifi motherboard
Other drives
Corsair Force MP600 1TB
Crucial P5 Plus 1TB
Kingston NV2 1TB
Kioxia BG5 1TB
Patriot Viper VPN4100 1TB
PNY XLR8 CS3040 1TB
PNY XLR8 CS3140 1TB
Sabrent Rocket 4 Plus 1TB
Samsung SSD980 PRO 1TB
Samsung SSD980 PRO Heatsink 1TB
Seagate FireCuda 520 1TB
Solidigm P41 Plus 1TB
Solidigm P44 Pro 1TB
Teamgroup T-Force Cardea Zero Z440 1TB
Teamgroup T-Force Cardea A440 Pro Special Series 1TB
WD Black SN770 1TB
WD Black SN850 1TB
Software:
Atto Disk Benchmark 4.
CrystalMark 8.0.0.
AS SSD 2.0.
UL Solutions PC Mark 10.
UL Solutions 3DMark Storage Benchmark.
Final Fantasy XIV Endwalker Official Benchmark.
All our results were achieved by running each test five times with every configuration this ensures that any glitches are removed from the results. Trim is confirmed as running by typing fsutil behavior query disabledeletenotify into the command line. A response of disabledeletenotify =0 confirms TRIM is active.
CrystalDiskMark is a useful benchmark to measure the theoretical performance levels of hard drives and SSDs. We are using v8.0.
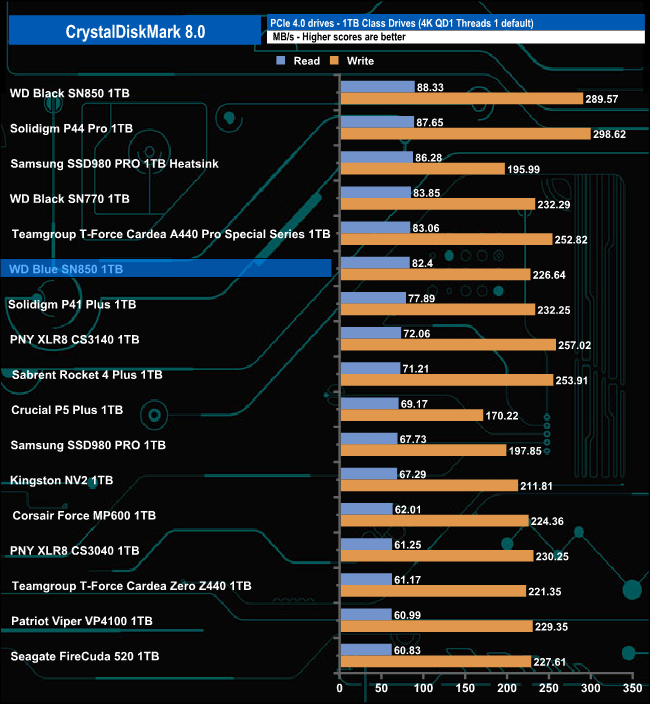
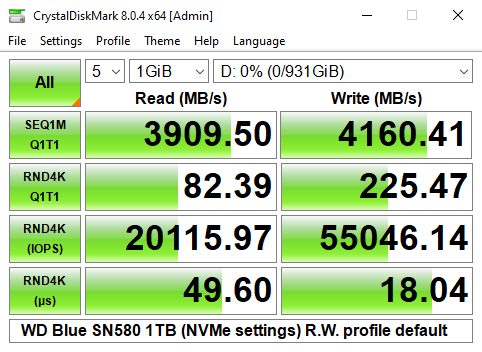
In the CrystalDiskMark 4K QD1 T1 test, the Blue SN580 does pretty well, with a 82.4MB/s read score with writes at 226.64MB/s, good enough to see it in sixth place in the results chart. It's also an improvement on the previous generation SN570 which scored 68.45MB/s and 200.67MB/s (read/writes respectively) for the same test.
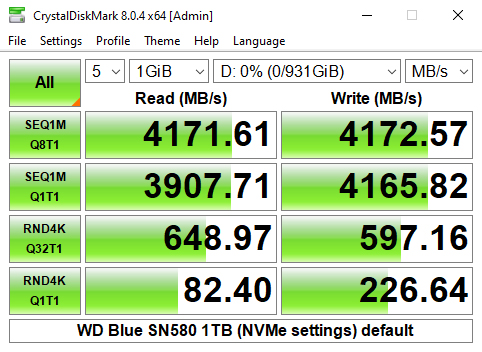
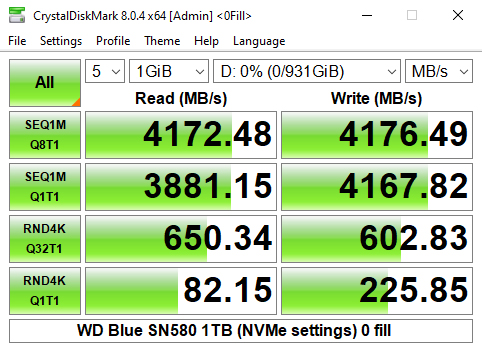
Looking at the two benchmark screens, it's clear that the in-house WD controller doesn't really have a preference for the type of data it's being asked to handle. We could also confirm the official Sequential performance figures for the drive; up to 4150MB/s for both reads and writes with test scores of 4,171MB/s for reads and 4,172MB/s for writes.
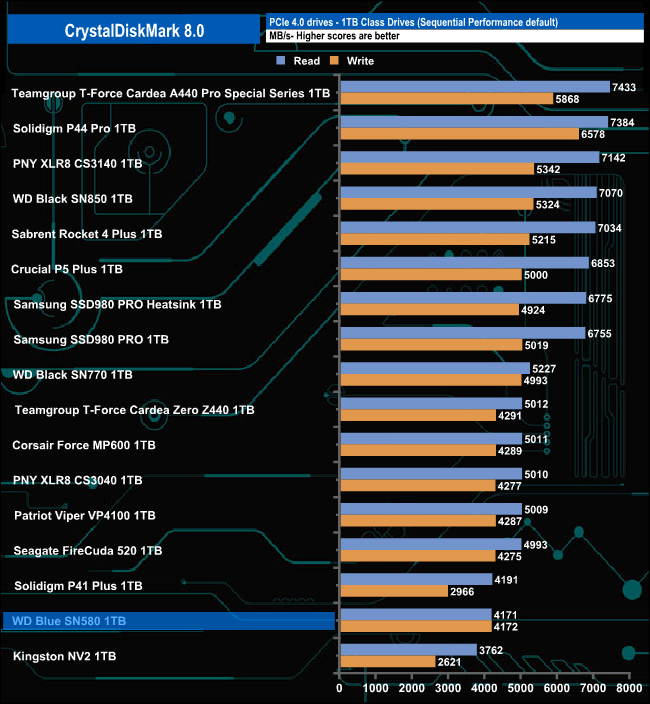
Those Sequential scores see the drive in last but one place on our results chart.
CrystalDiskMark 8 Peak Performance profile.
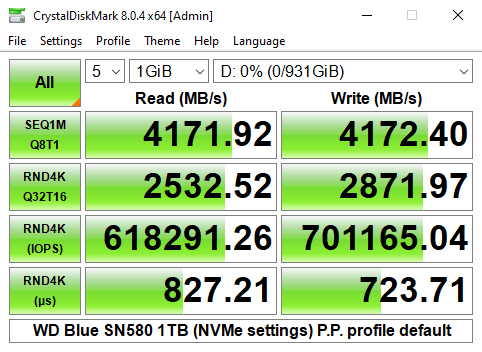
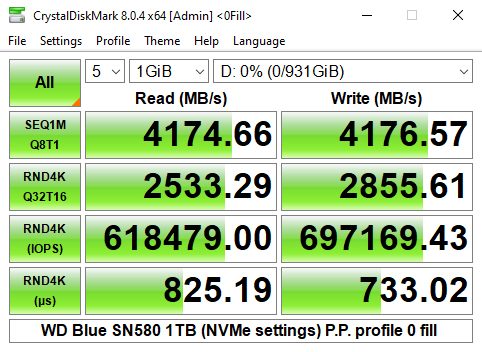
CrystalDiskMark 8's Peak Performance profile result screen displays the 4K result in IOPS. The best-read test result of 618,479 IOPS confirms and betters a little the official rating of up to 600,000 IOPS. However, the tested write result of 701,165 IOPS is someway short of the official 750,000 IOPS.
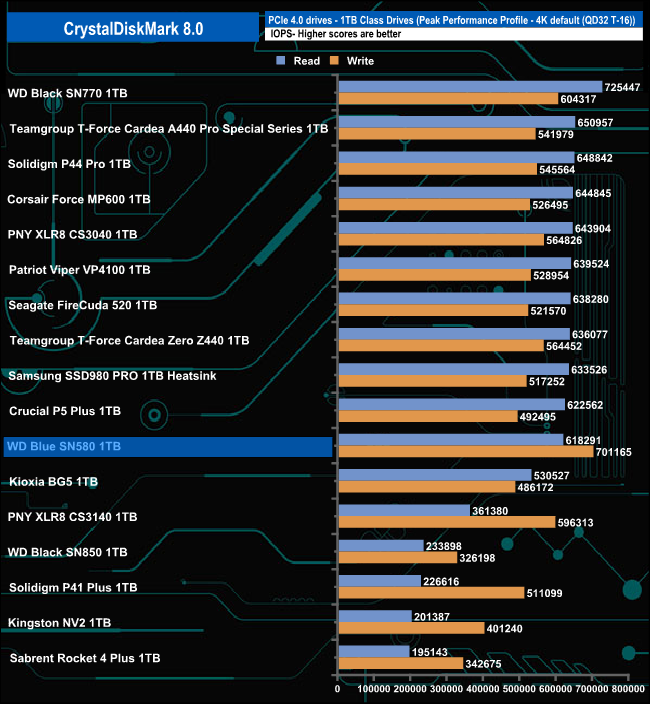
Although the 4K read score of 618,291 IOPS is only good enough to see the drive in the bottom half of the results chart, its write score of 701,165 IOPS is the second fastest we've seen to date for a 1TB class Gen 4 drive.
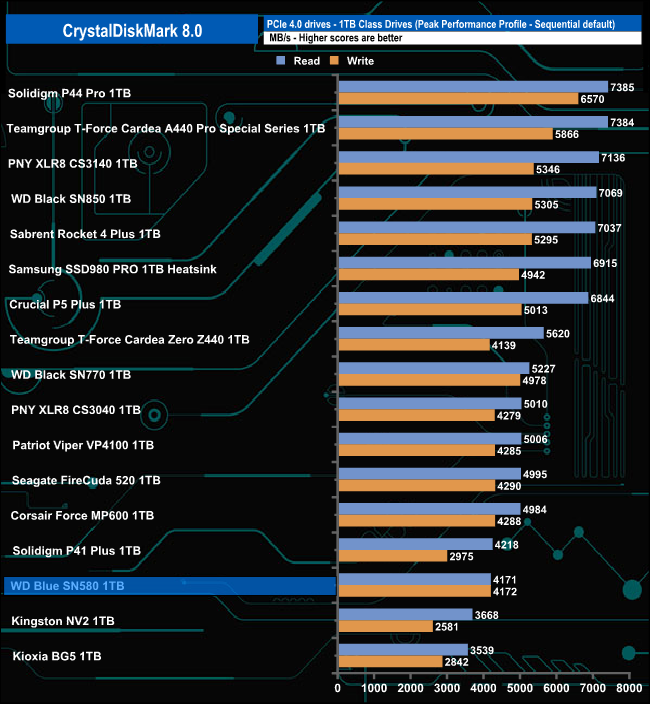
The read and write results of 4,171MB/s and 4,172MB/s respectively in CrystalDiskMark 8's Peak Performance profile confirm the official ratings of 4,150MB/s for both reads and writes.
CrystalDiskMark 8 Real World profile.

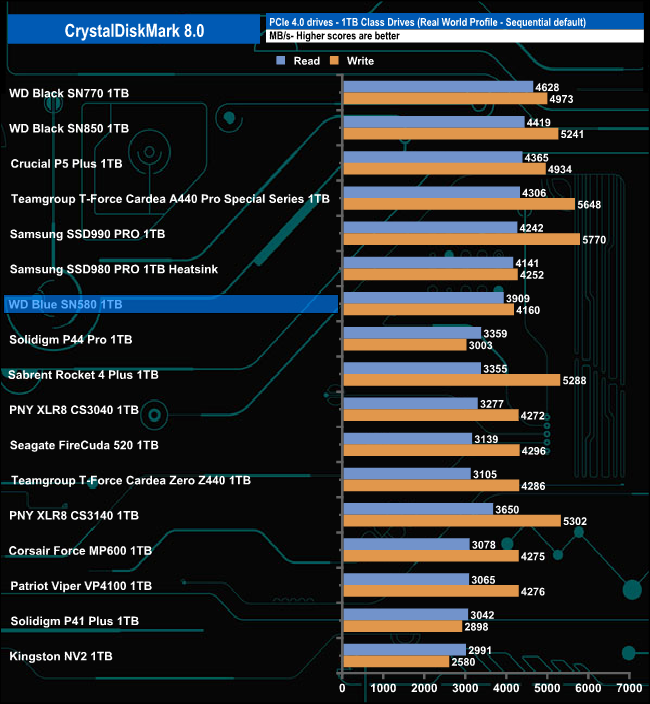
The Real World profile Sequential read/write results of 3,909MB/s and 4,160MB/s respectively show the improvement in performance that the Gen 4 interface, which the Blue SN580 uses, offers over the Gen 3 interface of the previous generation SN570. The SN580 read result is 1,195.20MB/s faster than the older drive while the write result is a 1,242.87MB/s improvement.
The ATTO Disk Benchmark performance measurement tool is compatible with Microsoft Windows. Measure your storage systems performance with various transfer sizes and test lengths for reads and writes. Several options are available to customize your performance measurement including queue depth, overlapped I/O and even a comparison mode with the option to run continuously. Use ATTO Disk Benchmark to test any manufacturer's RAID controllers, storage controllers, host adapters, hard drives and SSD drives and notice that ATTO products will consistently provide the highest level of performance to your storage.
We are using version 4.0 for our NVMe disk tests.
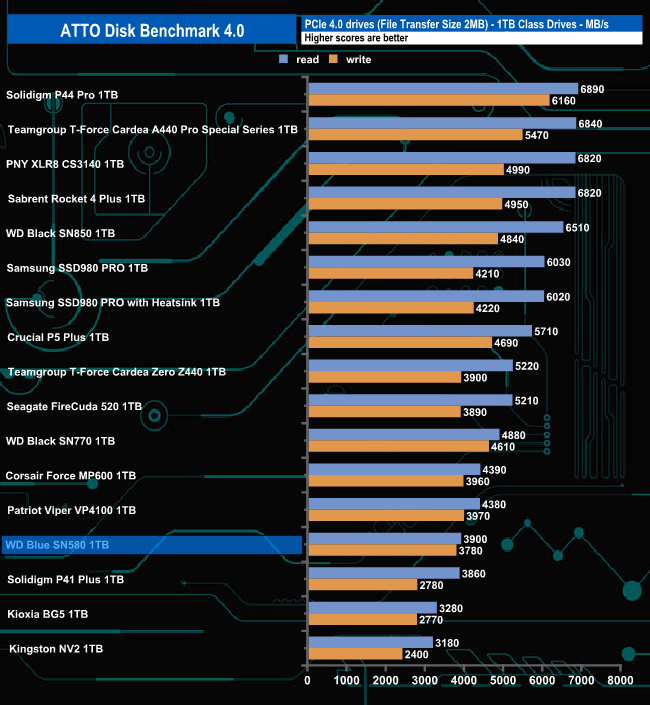
With the ATTO benchmark, we couldn't quite hit the official maximum Sequential ratings of 4,150MB/s for both reads and writes with best test results of 3,900MB/s and 3,780MB/s for read and writes respectively.
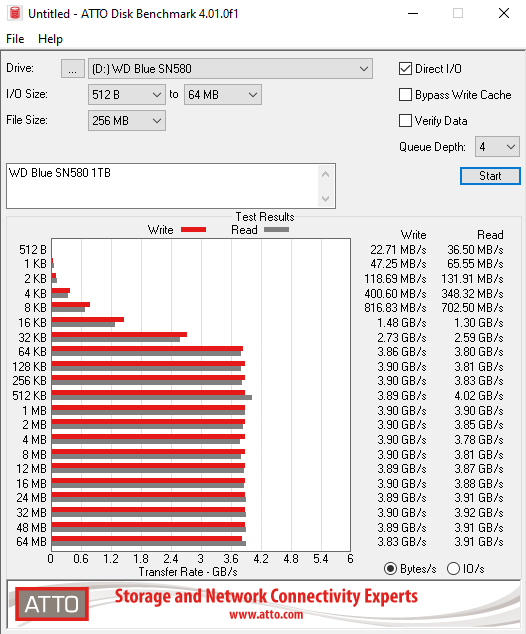
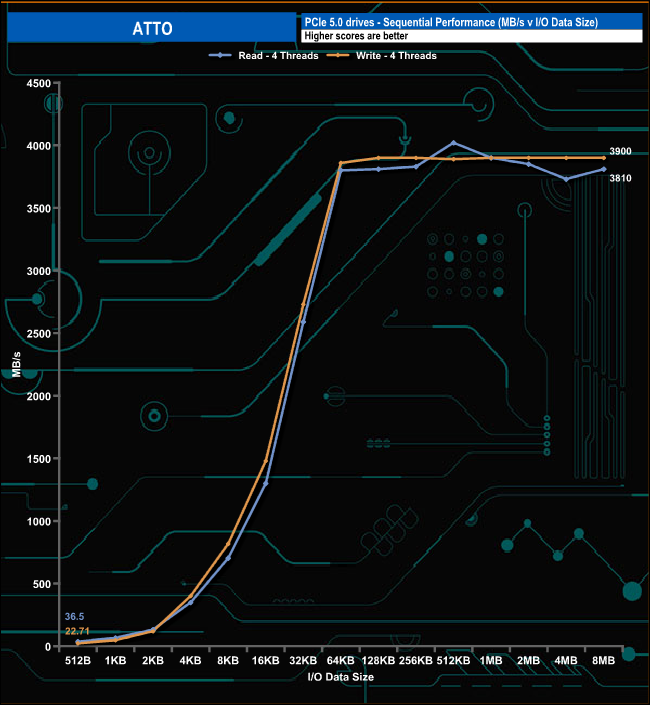
In the ATTO benchmark, the drive peaks at the 512KB mark at 4,020MB/s for reads, still short of the official maximum of 4,150MB/s before dropping back to 3,180MB/s at the 8MB mark. When it came to write performance the drive peaked at the 128KB mark at 3,900MB/s and pretty much stayed at that level for the rest of the test run.
AS SSD is a great free tool designed just for benching Solid State Drives. It performs an array of sequential read-and-write tests, as well as random read-and-write tests with sequential access times over a portion of the drive. It uses
incompressible data samples which many drives struggle with, so results can be viewed as the worst-case scenarios.
AS SSD includes a sub suite of benchmarks with various file pattern algorithms but this is difficult in trying to judge accurate performance figures.
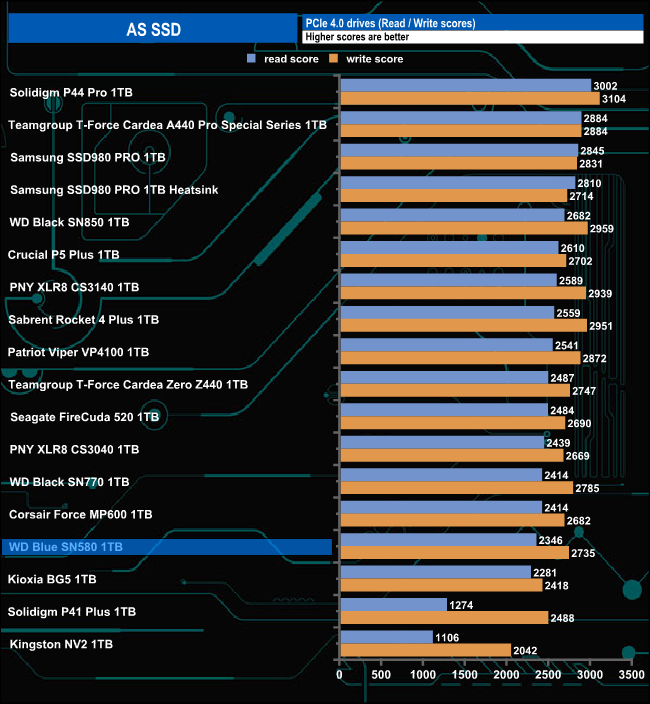
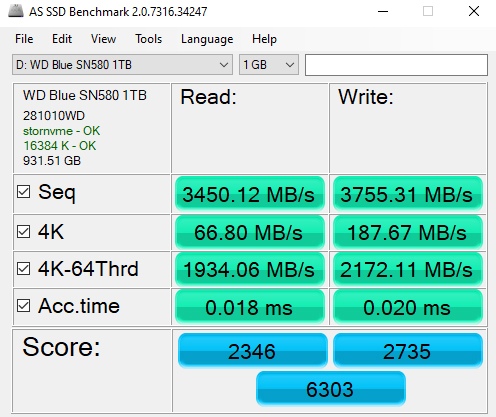
Although the read score of 2346 in the AS SSD benchmark sees the SN580 near the bottom of the results chart, its write result of 2735 is pretty strong. Both scores are an improvement over the previous generation SN570 which scored 1539 and 2330 for reads and writes respectively.
We used CrystalDiskMark 8‘s custom settings to test the Sequential read and write performance of the drive through a range of queue depths. The setup for the tests is listed below.
128KB Sequential Read / Write.
Transfer Request Size: 128KB, Thread(s): 1, Outstanding I/O: 1-32.
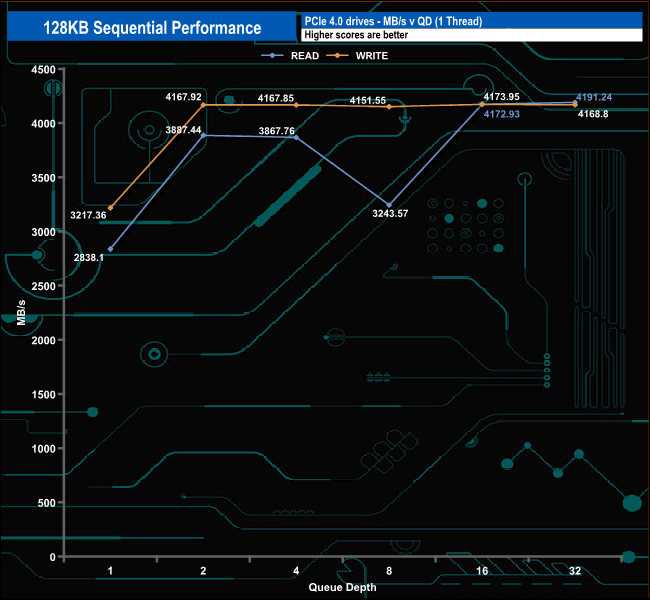
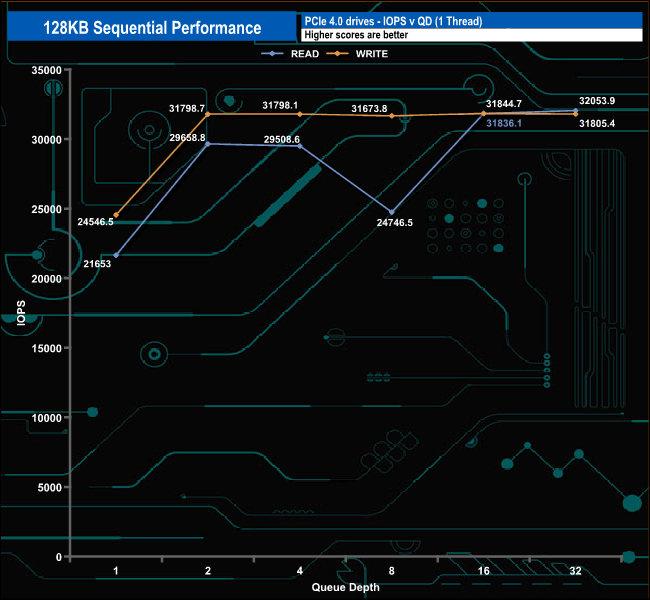
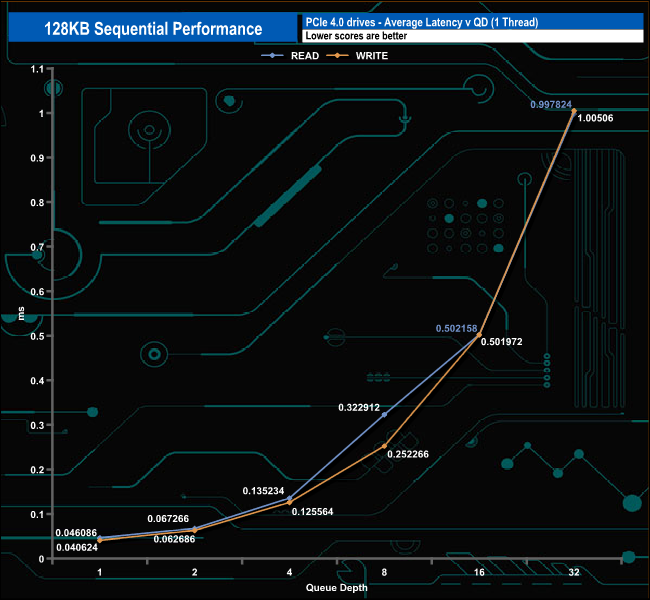
In these Sequential tests, the read performance dropped sharply at QD8 but the drive recovers very well to finish the test run at 4,191.24MB/s, confirming the official figure of 4,150MB/s. No such performance worries with the write performance which is pretty consistent from QD2. The test run finishes with a write result of 4,168.8MB/s, again confirming the official figure.
128KB Sequential Read v QD
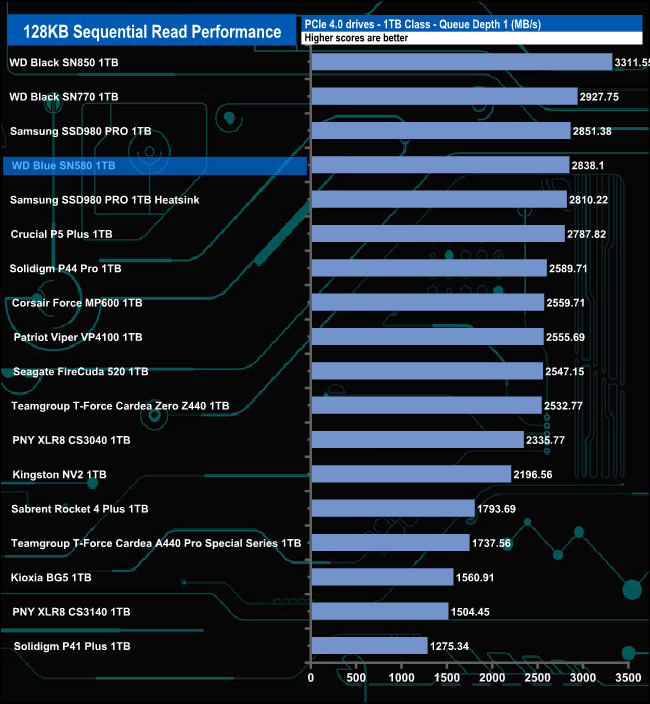
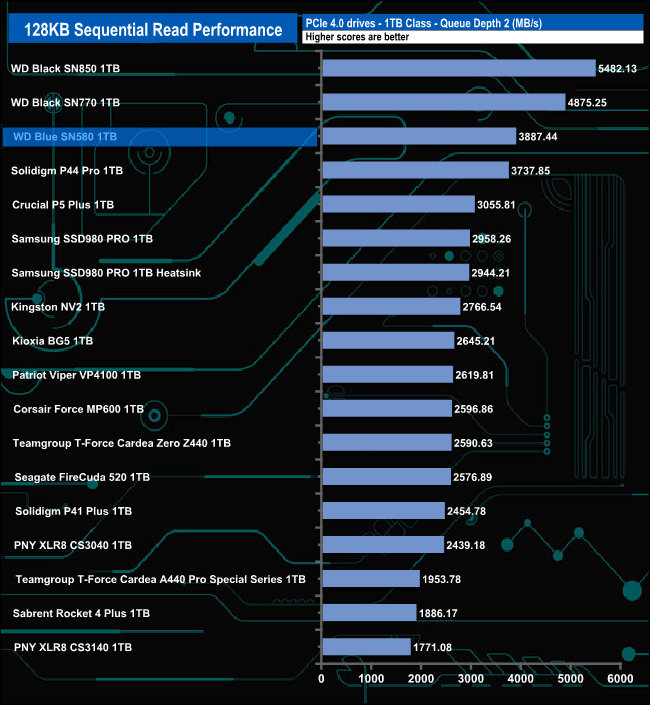
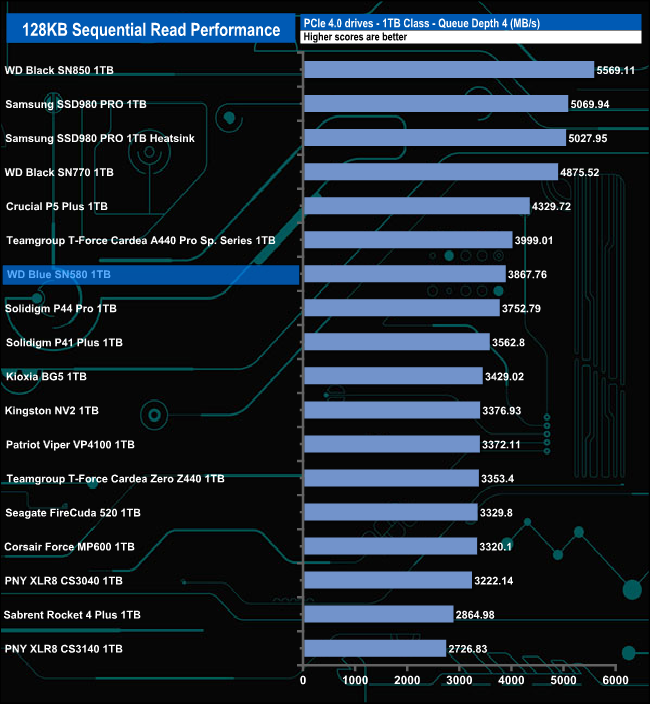
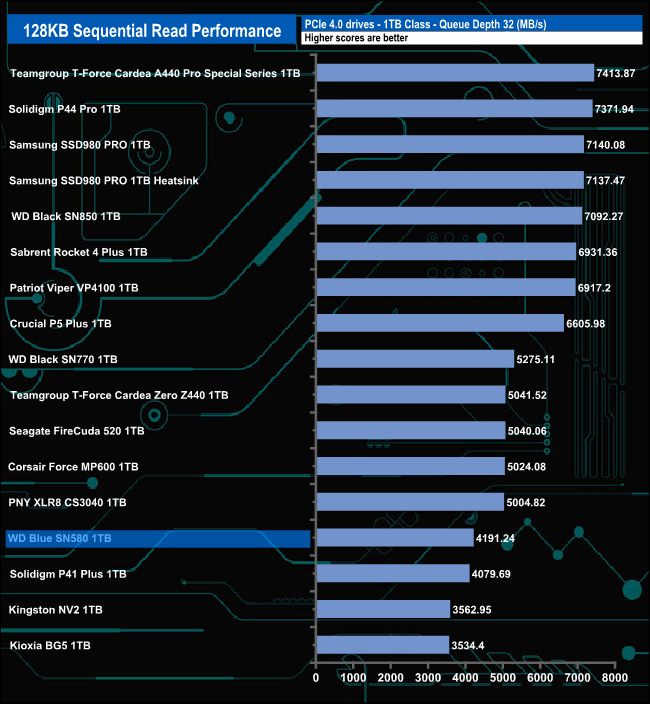
In relation to other drives around it, the WD Blue SN580 performs best at QD2 followed by QD1 in our Sequential read test. As the queue depth deepens the performance falls back.
128KB Sequential Write v QD
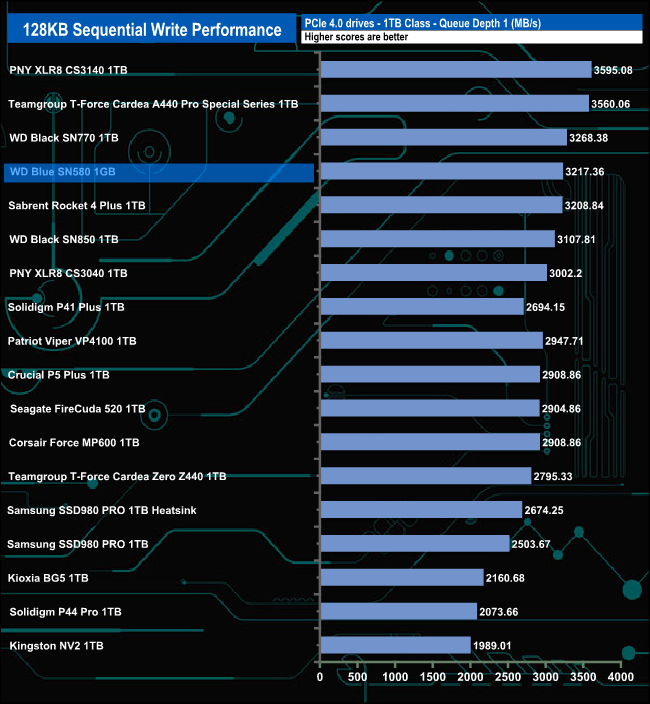
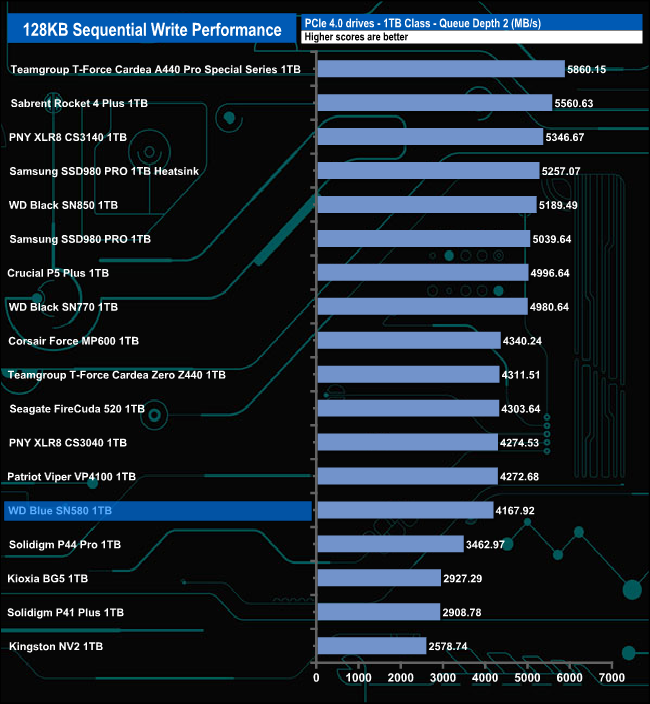
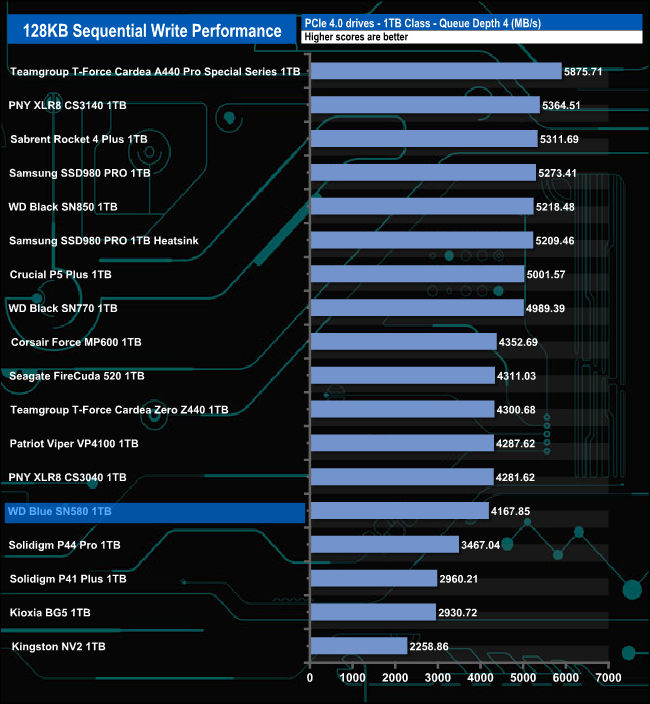
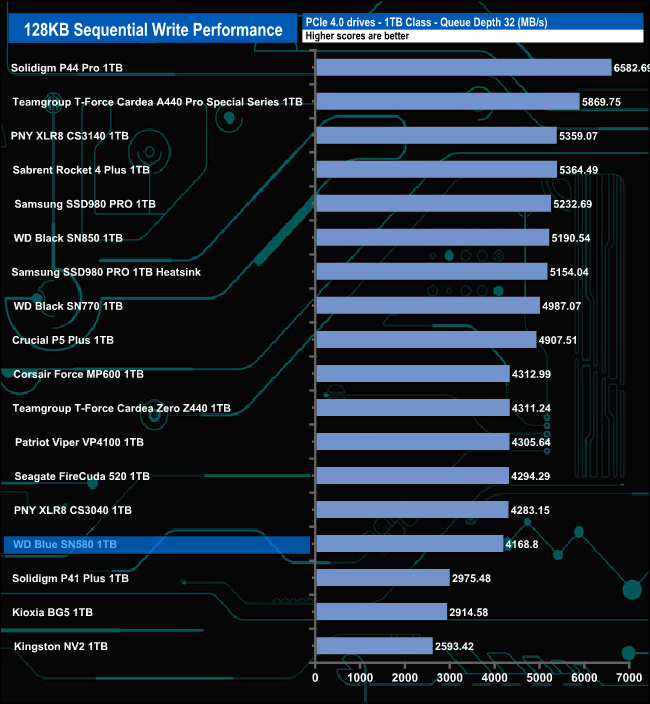
In our Sequential write test, the best performance from WD's Blue SN850 came at QD1. As the queue depth deepens the performance drops off sharply.
We used CrystalDiskMark 8‘s custom settings to test the 4K random read performance of the drive through a range of queue depths. The setup for the tests is listed below.
Transfer Request Size: 4KB, Outstanding I/O: 1-32.
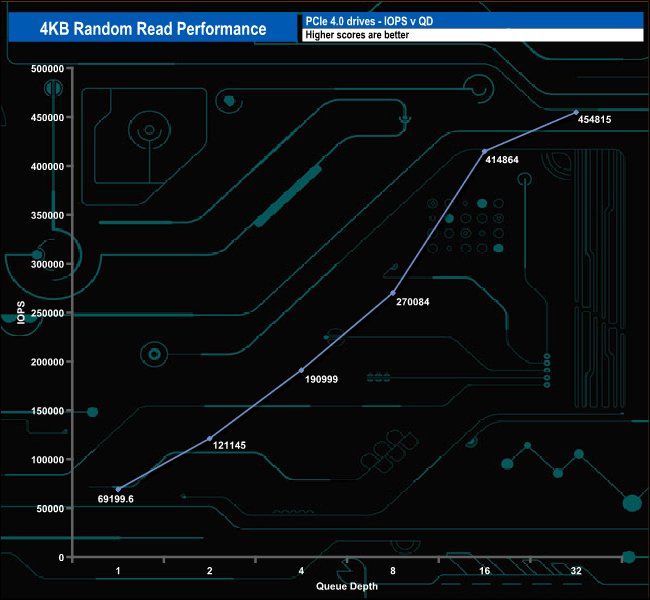
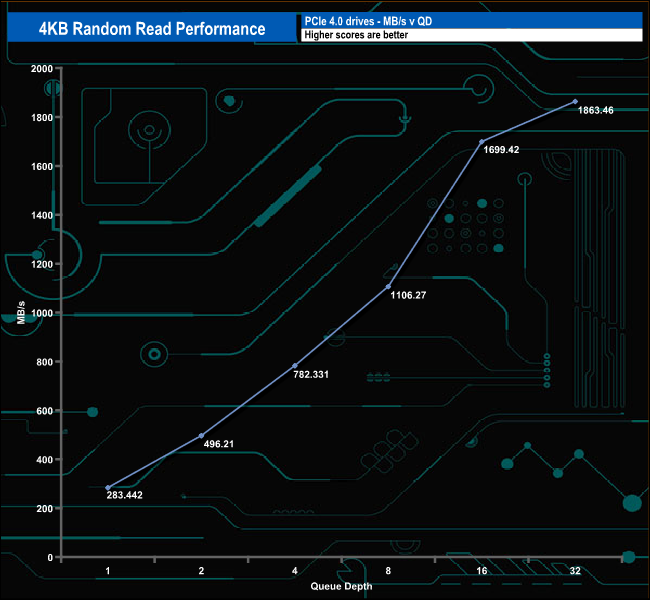
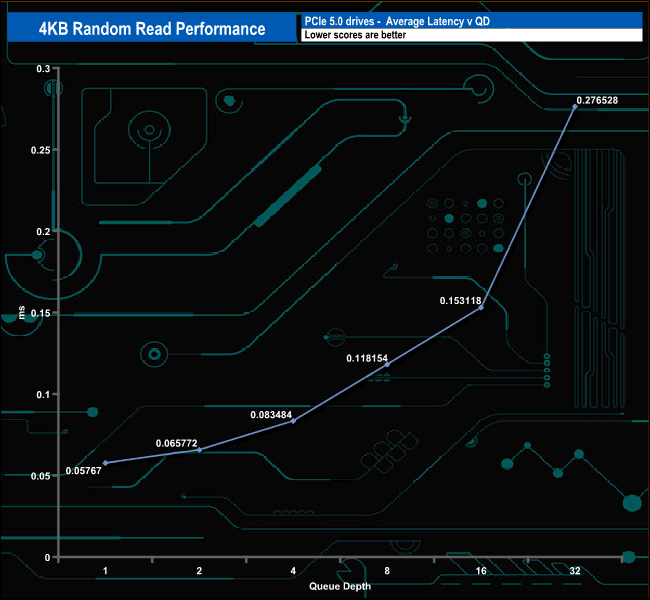
WD rate the 1TB Blue SN580 at up to 600,000 IOPS for 4K random reads. With our 4-threaded test, we were unable to reach this figure, our test producing a maximum of 454,815 IOPS. The drive climbs steadily through the tested queue depths till the end of the test run.
4K Random Read v QD compared.
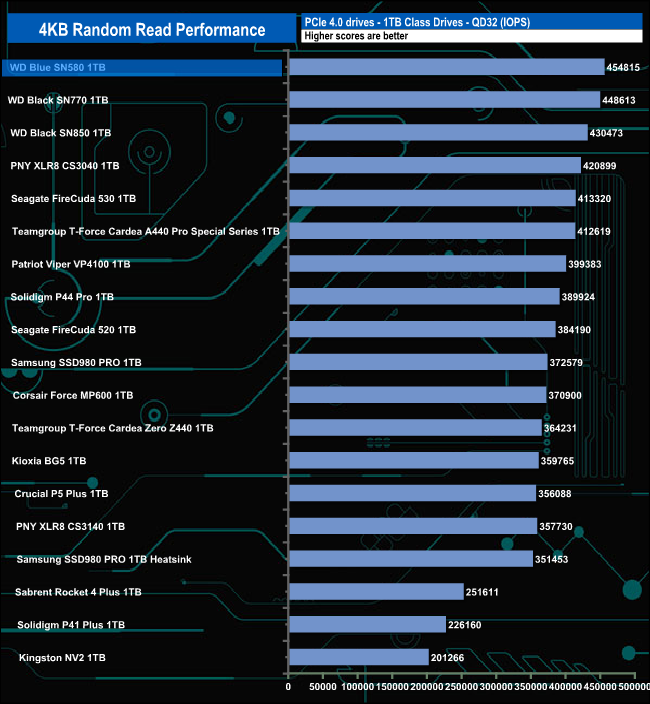
We may not have been able to match WD's maximum 4K random read rating for the drive, but it still produces an impressive feat by being the fastest 1TB class Gen 4 drive we've seen at QD32.
We used CrystalDiskMark 8‘s custom settings to test the 4K random write performance of the drive through a range of queue depths. The setup for the tests is listed below.
Transfer Request Size: 4KB, Outstanding I/O: 1-32.
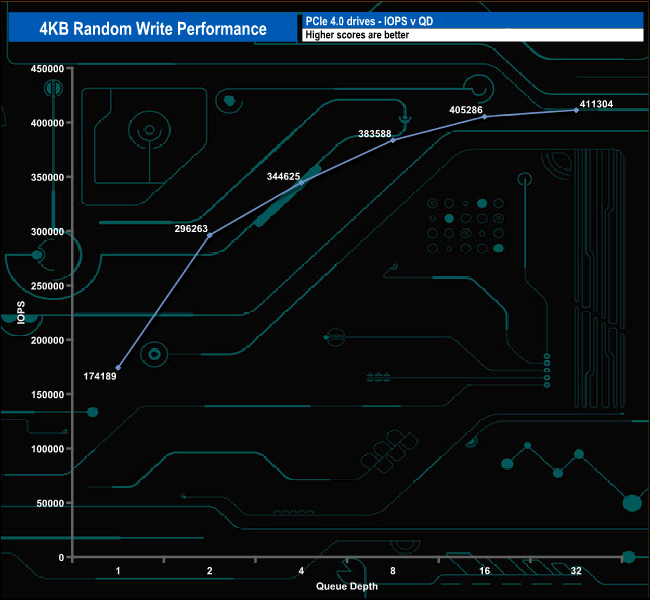
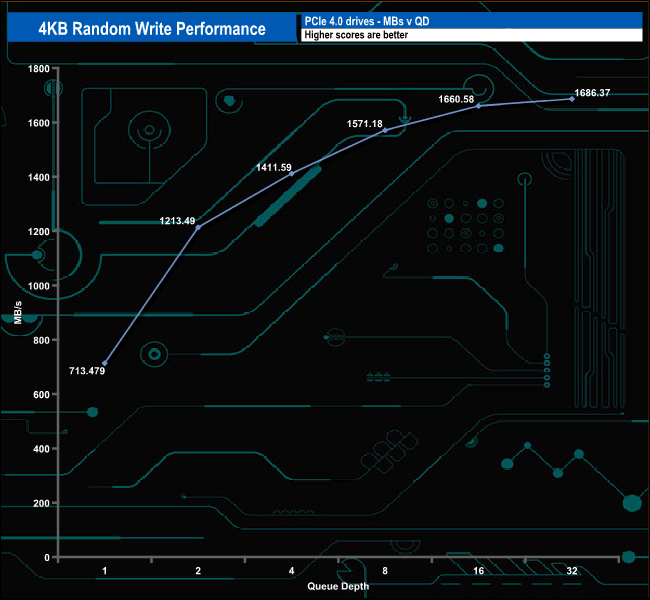
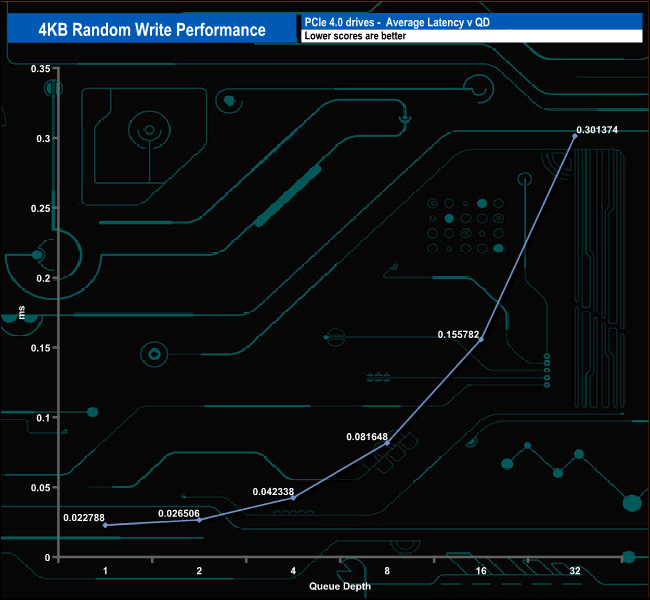
As with the random read testing when it came to random writes our 4-threaded test results were nowhere near the official maximum figure of 750,000 IOPS, the best we saw was 411,304 IOPS at QD32.
4K Random Write v QD compared.
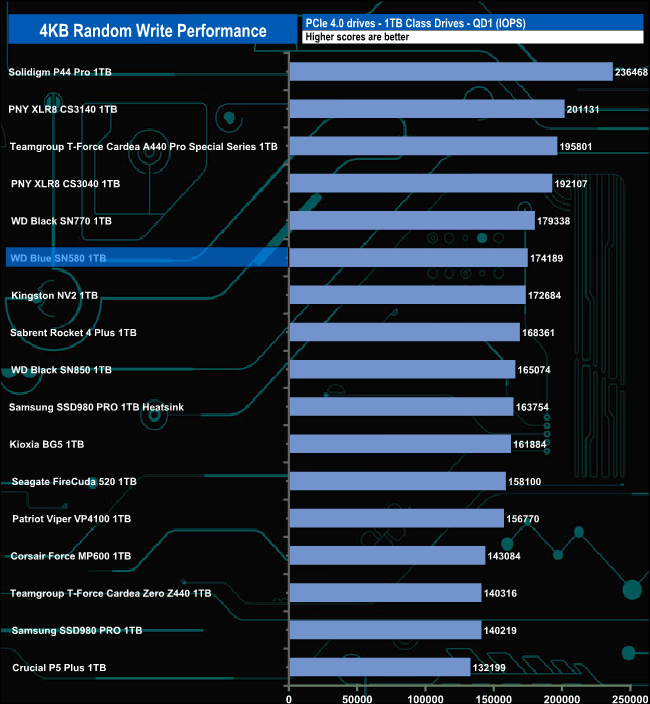
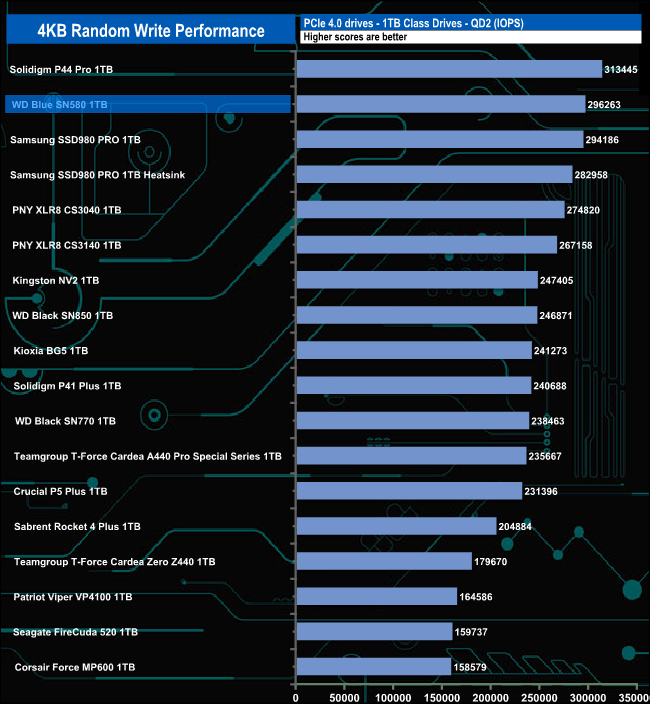

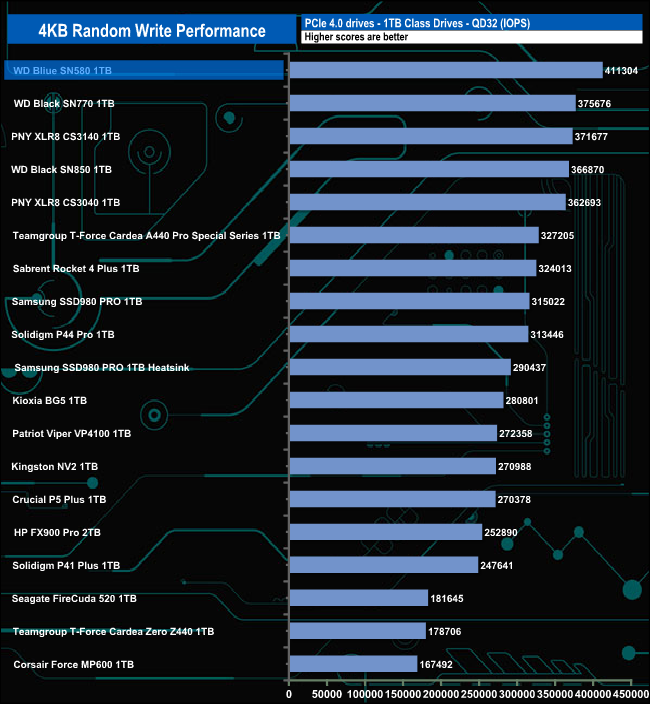
Compared with the drives around it, the SN580 performs the poorest at QD1, and even then it's still in the top 10 drives. But as the queue depth deepens the performance improves so at QDs 2 and 4 it's sitting in second spot and at QD32 it's sitting on top of the pile.
We used CrystalDiskMark 8’s custom settings to test the 4K 70/30 mixed read/write performance of the drive through a range of queue depths.
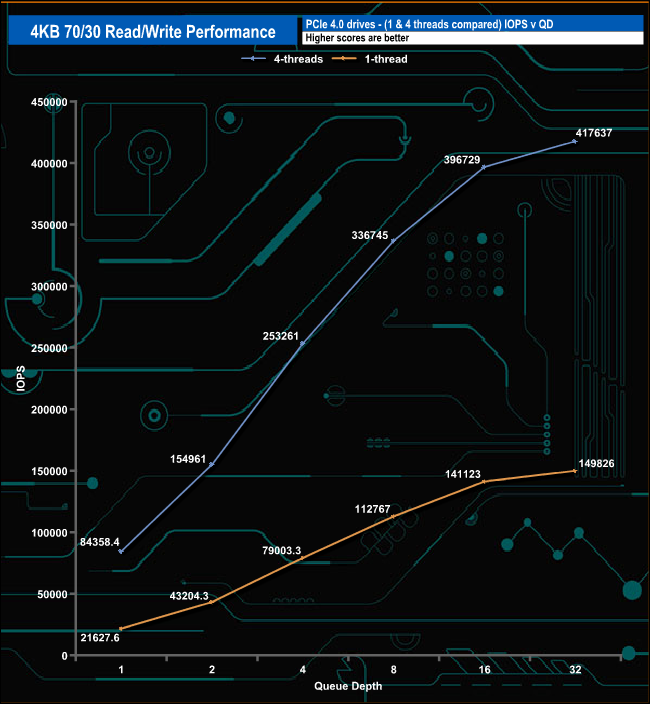
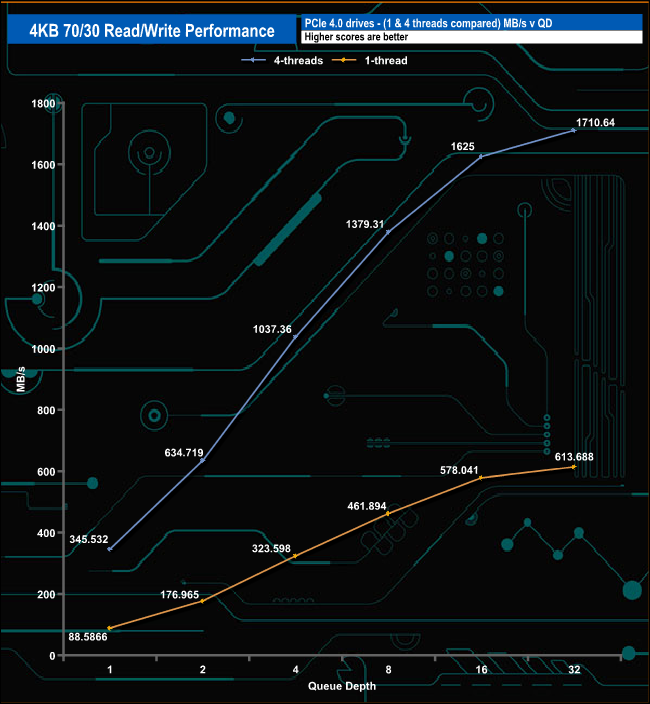
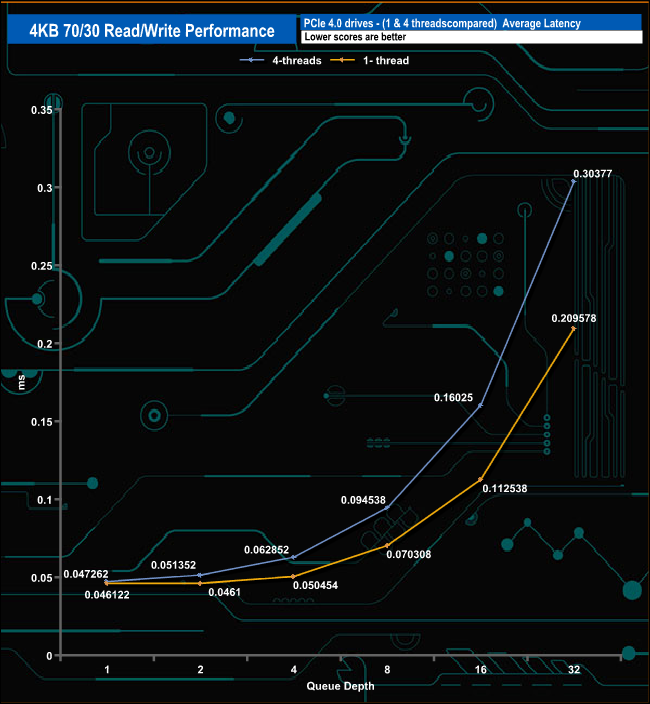
In our read/write 70/30 mixed tests the SN580 produces a best result of 417,637 IOPS (1,170.64MB/s) using four threads and 149,826 IOPS (613.688MB/s) using a single thread.
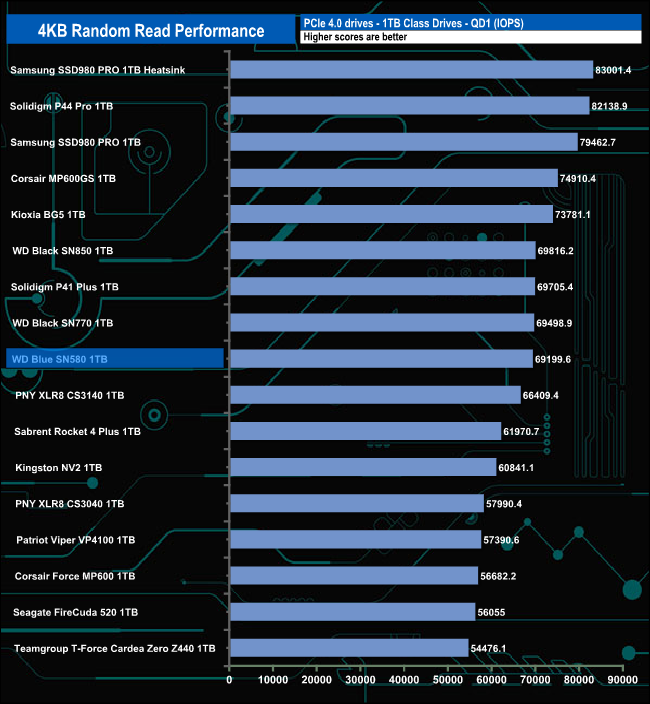
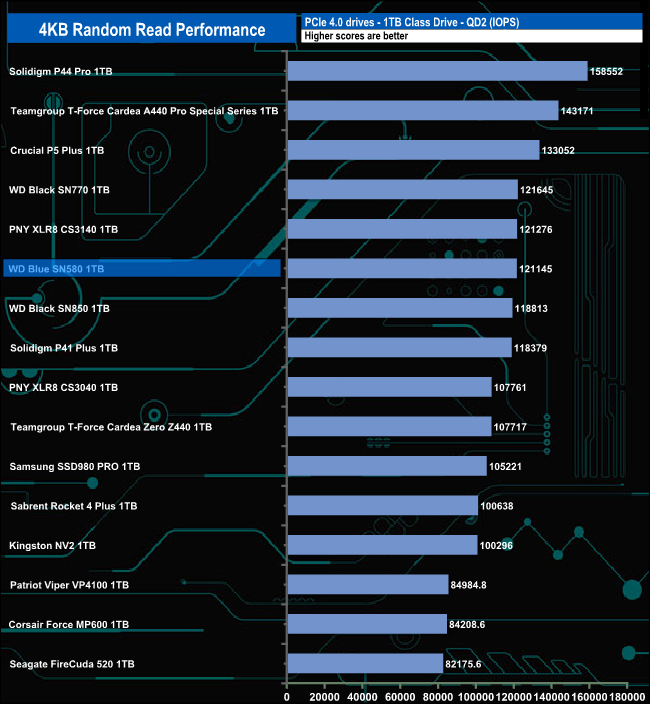
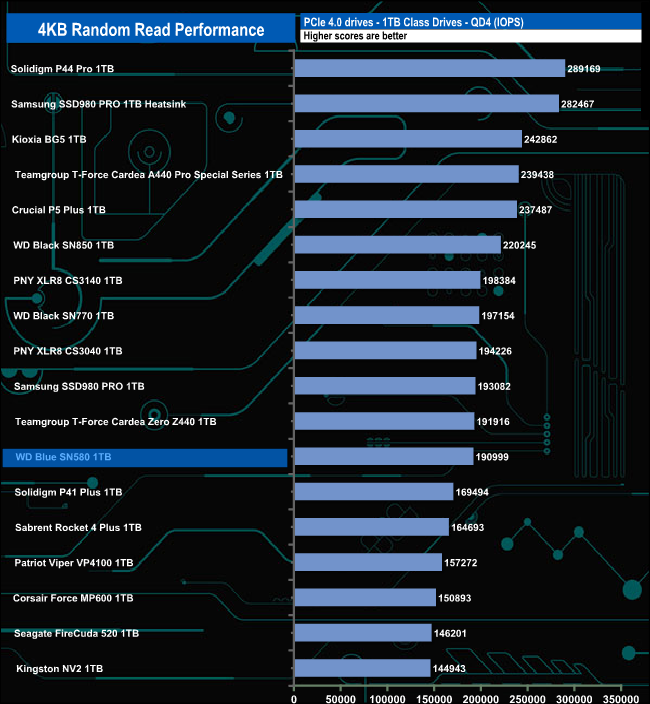
We used CrystalDiskMark 8 to test the random performance of the drive at lower queue depths (QD1 – QD8 where most of the everyday workloads occur) using 1 to 4 threads.
Random Read
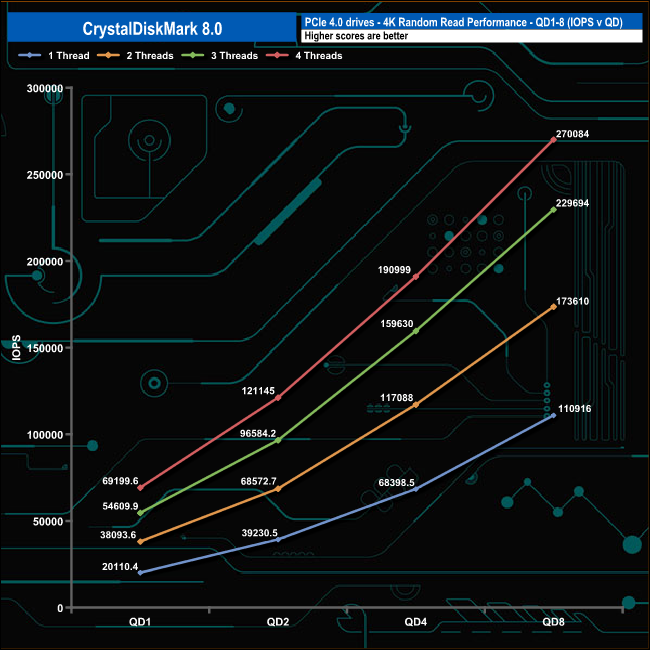
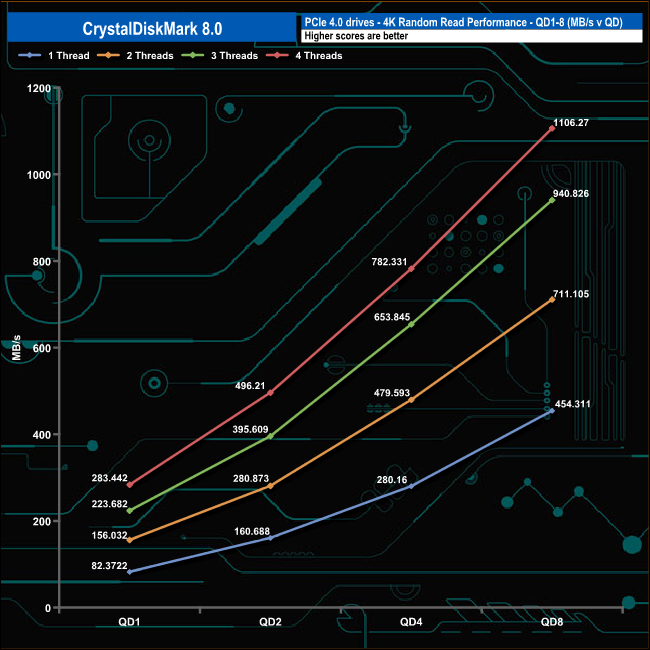
At QD1 the performance of the 1TB WD Blue SN580 ranges from a lowly 20,110 IOPS (82MB/s) using a single thread up to 69,199 IOPS (283MB/s) using four threads. The performance increases steadily as the queue depth deepens for each thread count.
Random Write
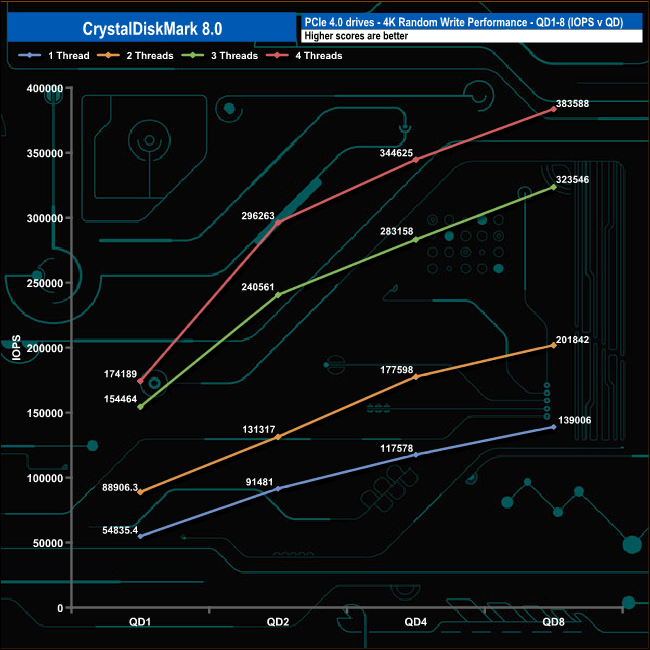
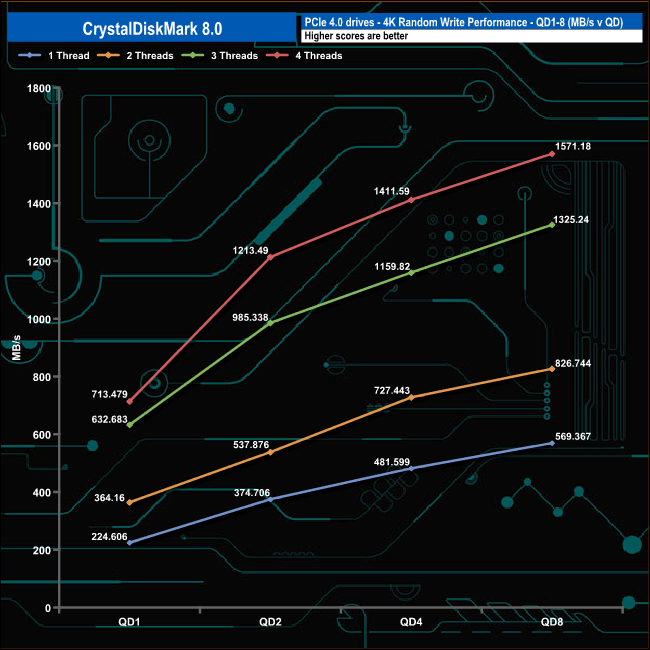
When it comes to random writes, there is a noticeable sharp rise between QD1 and QD2 with the three and four-threaded tests. Although the performance keeps increasing as the queue depth deepens, the rate of increase isn't as sharp.
Read Throughput
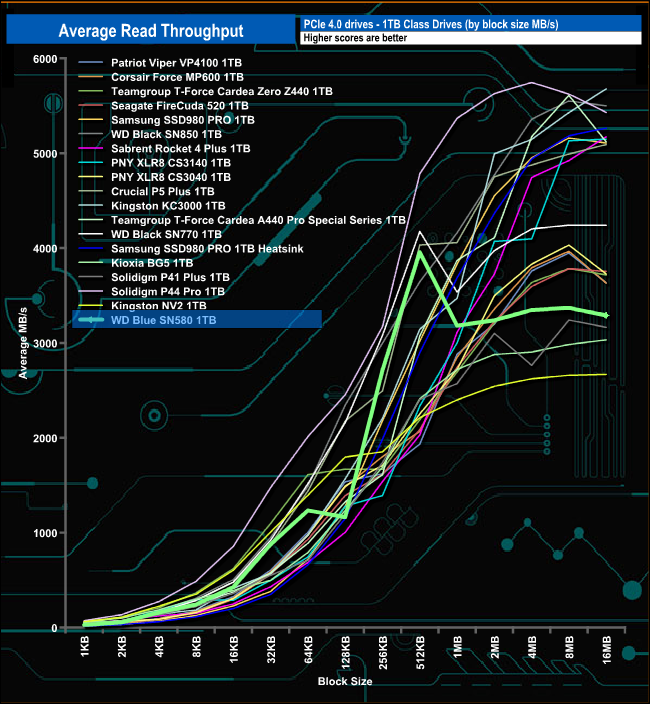
In the read throughput test the drive peaks at the 512KB block size at 3,956.30MB/s before ending the test run on 3,289.57. Both of these scores are some way behind the official maximum of 4,150MB/s.
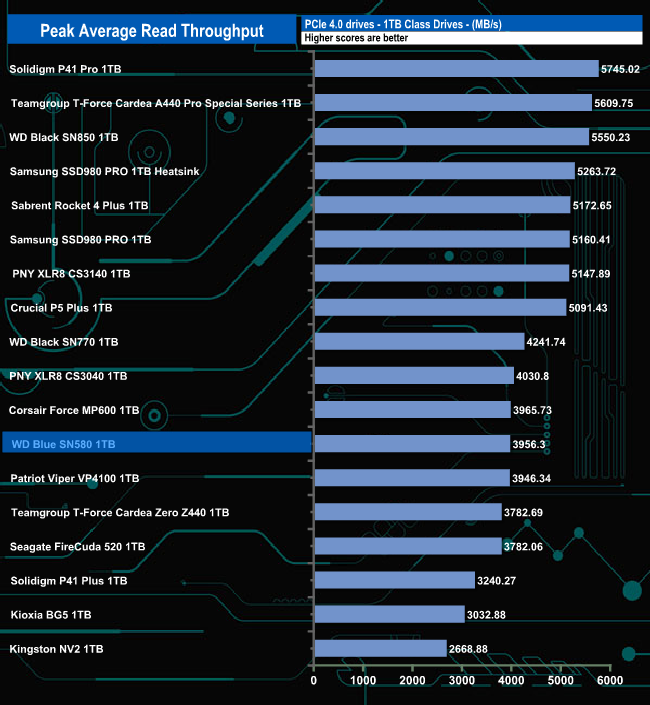
The peak read result of 3,956MB/s sees the WD Blue SN580 in the bottom half of the results chart.
Random Write
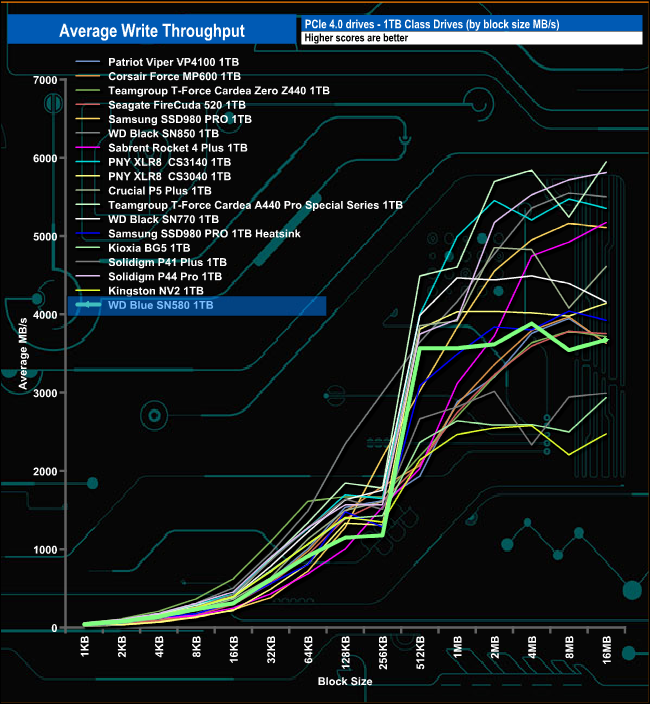
In the write throughput test the drive peaks at 3,882.34MB/s at the 4MB block mark before falling away to finish the test run at 3,673.35MB/s,
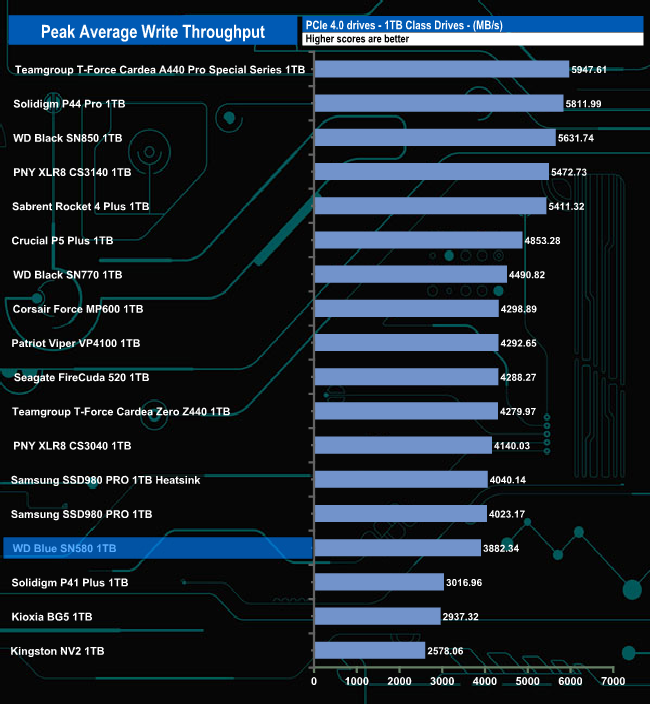
As with the read throughput test, the write test result sees the WD Blue SN580 in the bottom half of the results chart.
The PCMark 10 Full System Drive Benchmark uses a wide-ranging set of real-world traces from popular applications and common tasks to fully test the performance of the fastest modern drives. The benchmark is designed to measure the performance of fast system drives using the SATA bus at the low end and devices connected via PCI Express at the high end.
The goal of the benchmark is to show meaningful real-world performance differences between fast storage technologies such as SATA, NVMe, and Intel’s Optane. The Full System Drive Benchmark uses 23 traces, running 3 passes with each trace. It typically takes an hour to run.
Traces used:
Booting Windows 10.
Adobe Acrobat – starting the application until usable.
Adobe Illustrator – starting the application until usable Adobe Premiere Pro – starting the application until usable.
Adobe Photoshop – starting the application until usable.
Battlefield V – starting the game until the main menu.
Call of Duty Black Ops 4 – starting the game until the main menu.
Overwatch – starting the game until main menu.
Using Adobe After Effects.
Using Microsoft Excel.
Using Adobe Illustrator.
Using Adobe InDesign.
Using Microsoft PowerPoint.
Using Adobe Photoshop (heavy use).
Using Adobe Photoshop (light use).
cp1 Copying 4 ISO image files, 20 GB in total, from a secondary drive to the target drive (write test).
cp2 Making a copy of the ISO files (read-write test).
cp3 Copying the ISO to a secondary drive (read test).
cps1Copying 339 JPEG files, 2.37 GB in total, to the target drive (write test).
cps2 Making a copy of the JPEG files (read-write test).
cps3 Copying the JPEG files to another drive (read test).
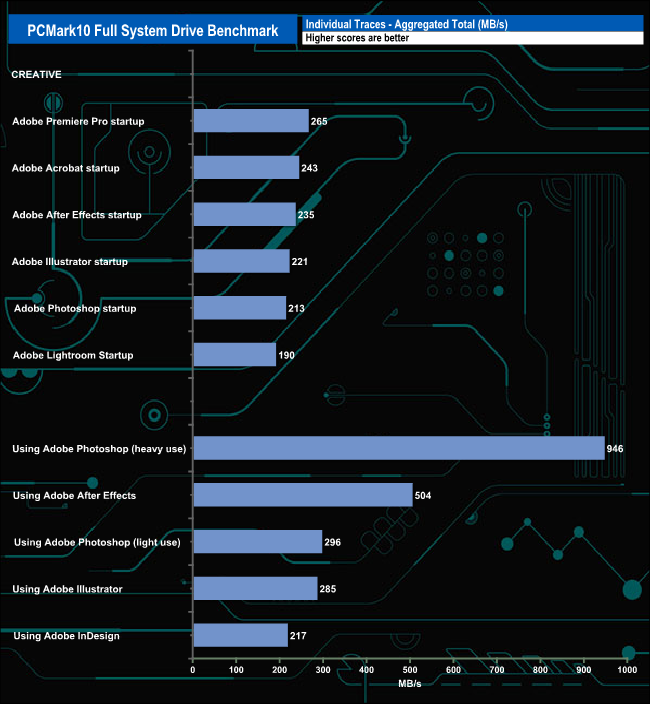
The WD Blue SN580 dealt with the rigours of the PCMark10’s Full System Drive reasonably well. The best result from the Creative set of test traces was the 946MB/s for the Heavy Use Adobe Photoshop trace. The drive averaged 192.3MB/s for the six Adobe startup traces and 449.6MB/s for the five Adobe usage traces including that Photoshop Heavy result.
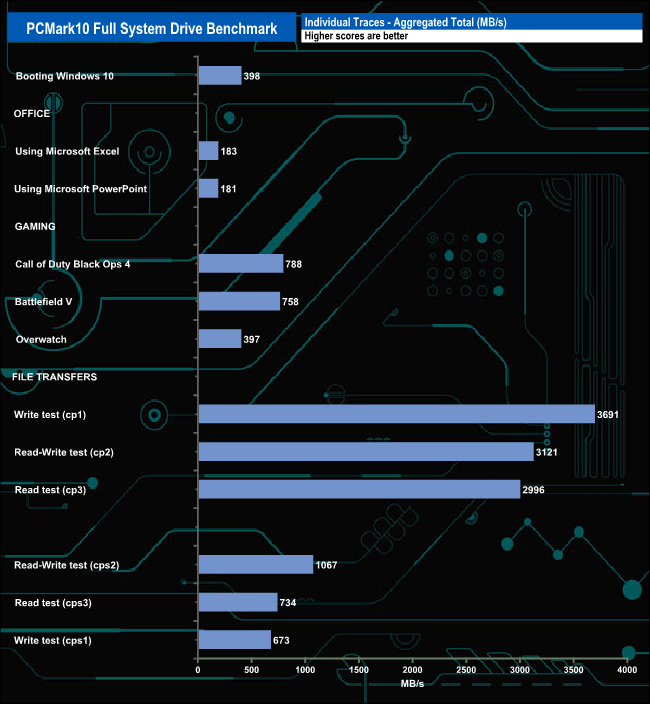
The file transfer tests also produced a very good cp1 (write test) figure of 3,691MB/s backed up by 3,121MB/s for the cp2 read/write test and 2,996MB/s for the cp3 read test.
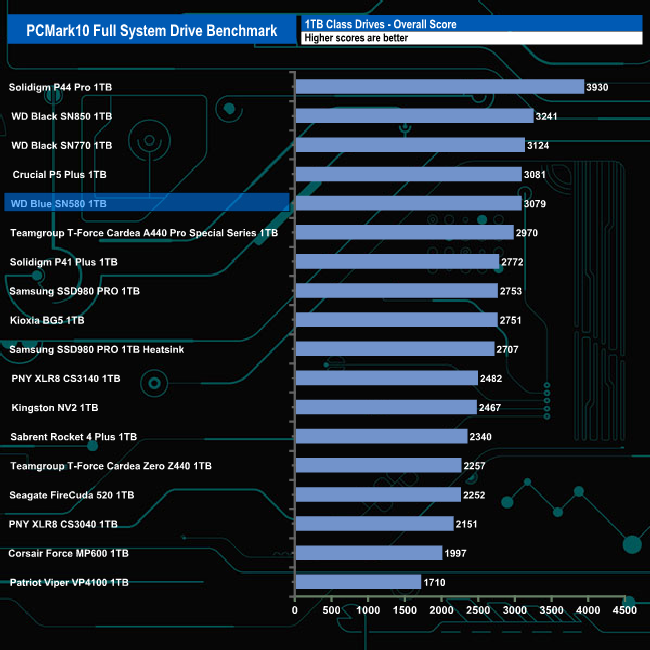
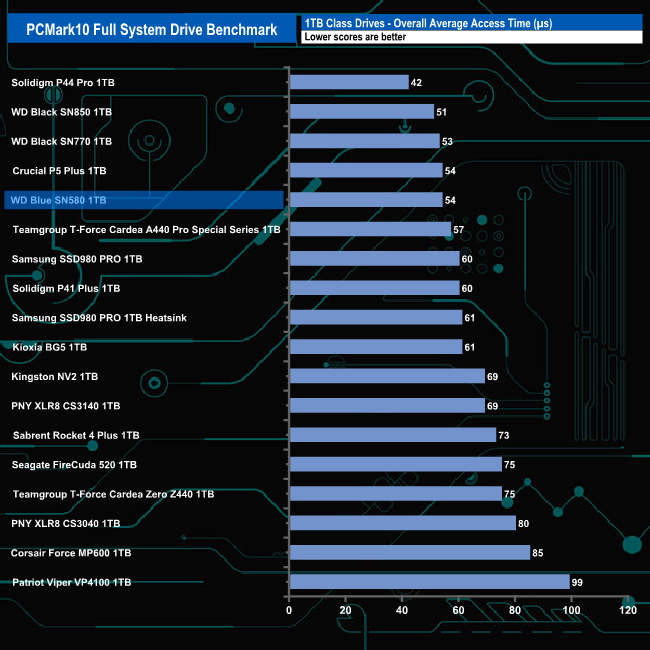
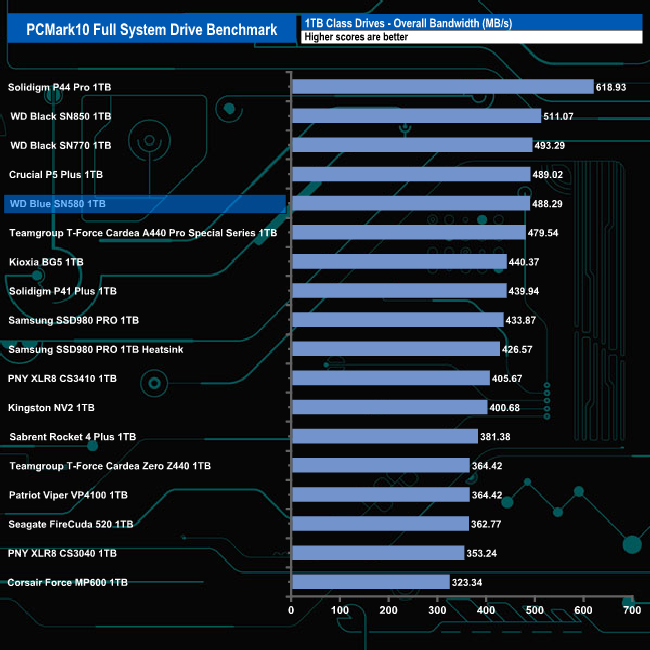
The overall bandwidth figure of 488.20MB/s sees the WD Blue SN580 in the top five in our results chart. Incidentally, the previous generation SN570 produced a bandwidth result of 333.86 using a Gen 3 interface.
The 3DMark Storage Benchmark uses traces recorded from popular games and gaming-related activities to measure real-world gaming performance.
Traces used –
Battlefield V
Loading Battlefield™ V from launch to the main menu.
Call of Duty Black Ops 4
Loading Call of Duty®: Black Ops 4 from launch to the main menu.
Overwatch
Loading Overwatch® from launch to the main menu.
Game Move
Copying the Steam folder for Counter-Strike®: Global Offensive from an external SSD to the system drive.
Game Recording
Recording a 1080p gameplay video at 60 FPS with OBS (Open Broadcaster Software) while playing Overwatch®.
Installing Game
Installing The Outer Worlds® from the Epic Games Launcher.
Game Saving
Saving progress in The Outer Worlds game.
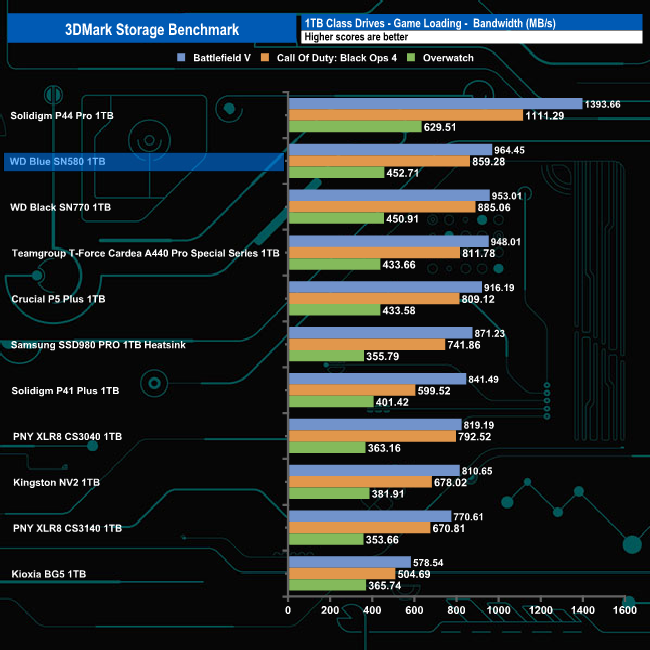
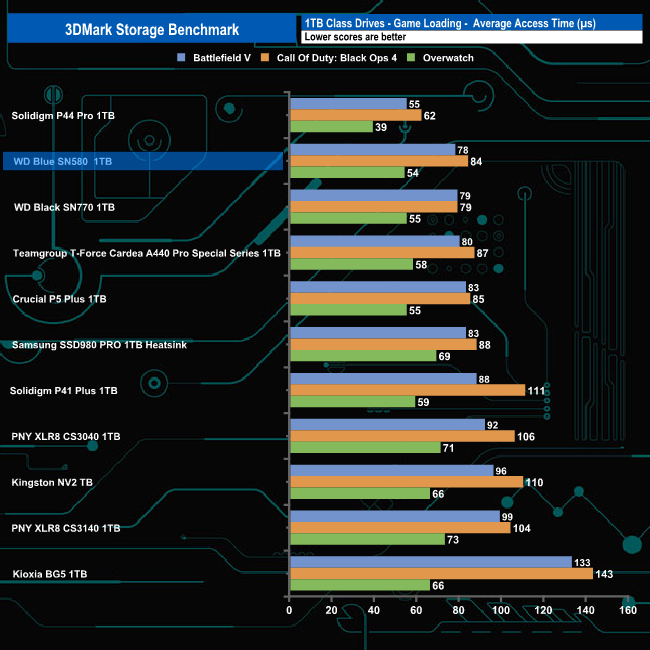
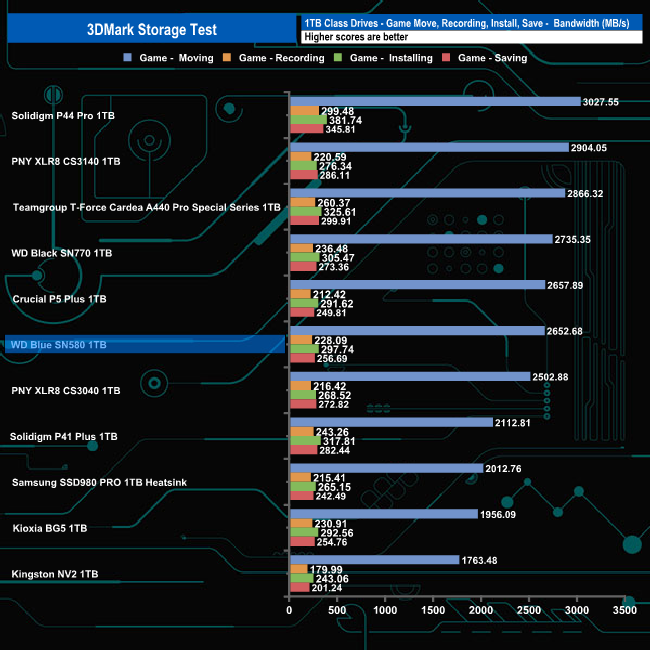
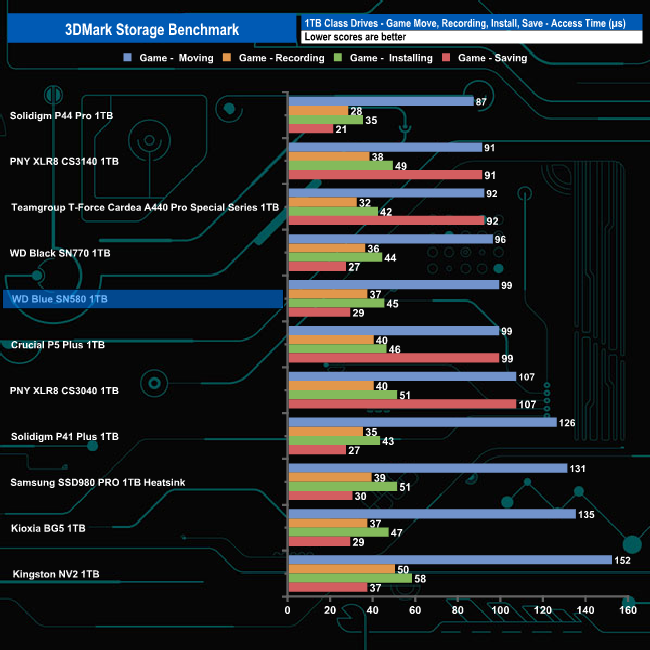
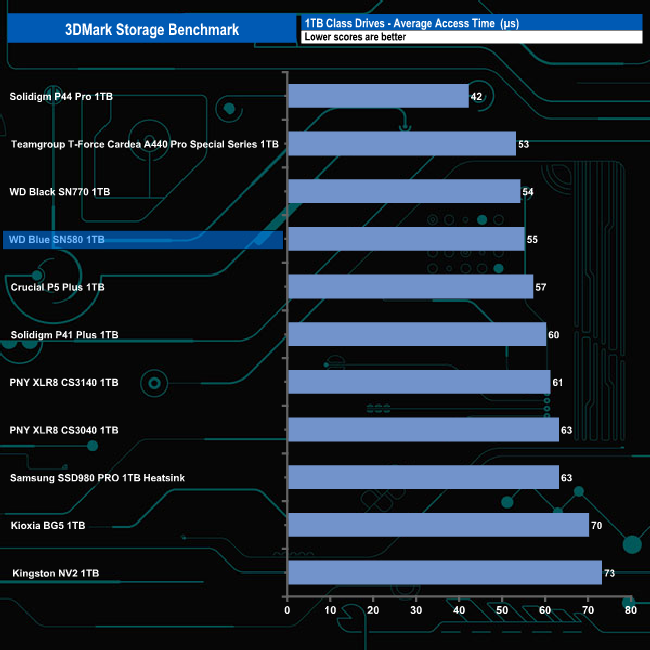
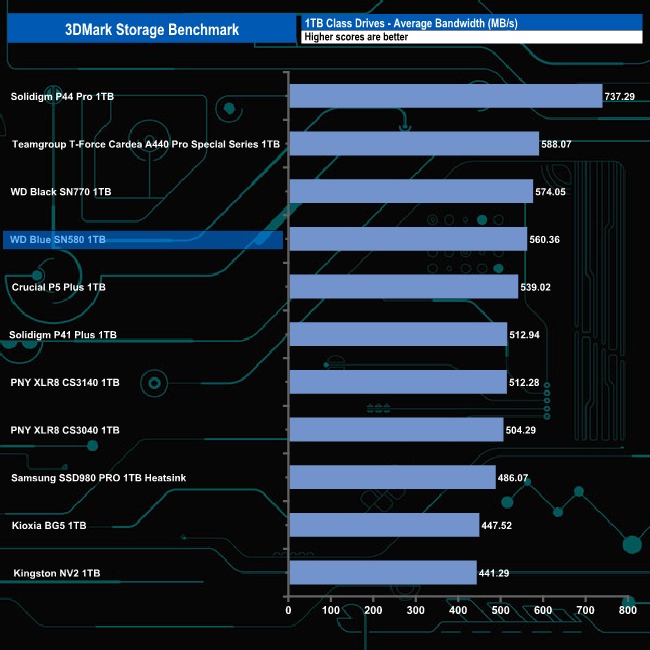
WD's Blue SN580 made a decent fist of the 3DMark Storage Benchmark with an average bandwidth score of 560MB/s, good enough to fill the fourth spot on the results chart but a long way off Solidigm's P44 Pro which sits in first place with a bandwidth figure of 737MB/s.
The Final Fantasy XIV Endwalker Official Benchmark uses actual maps and playable characters to assign a score to your PC and rate its performance including scene loading times.
The benchmark gives an overall load time as well as loading times by scene.
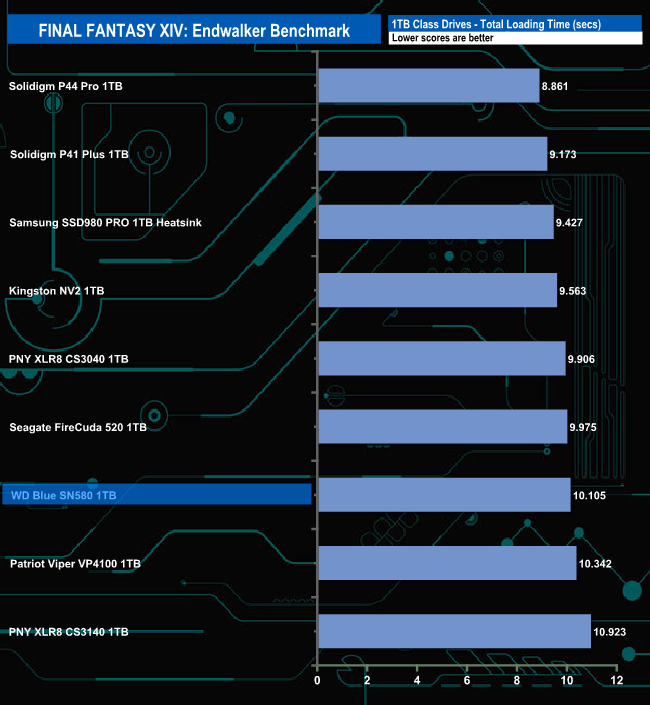
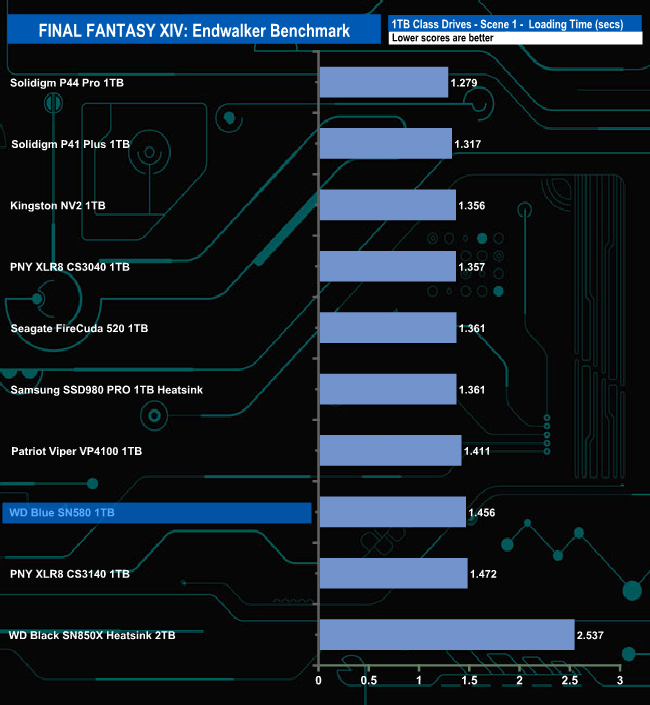
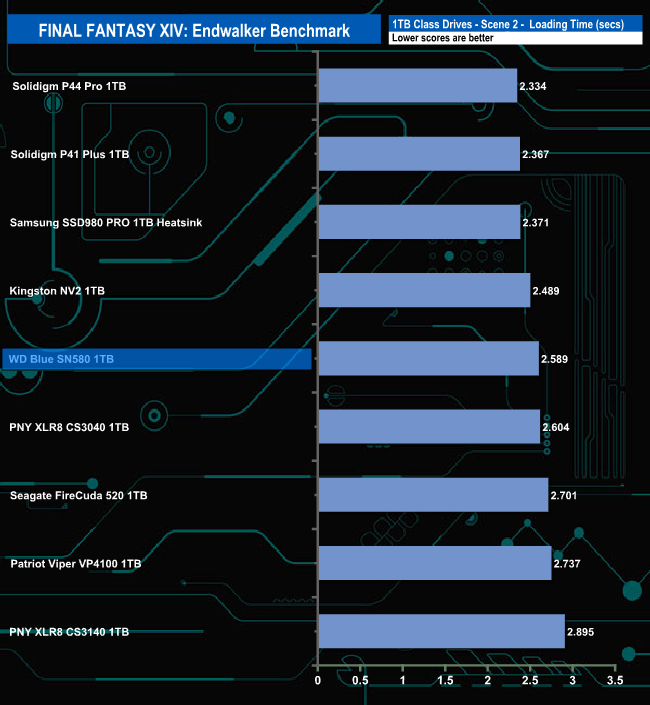
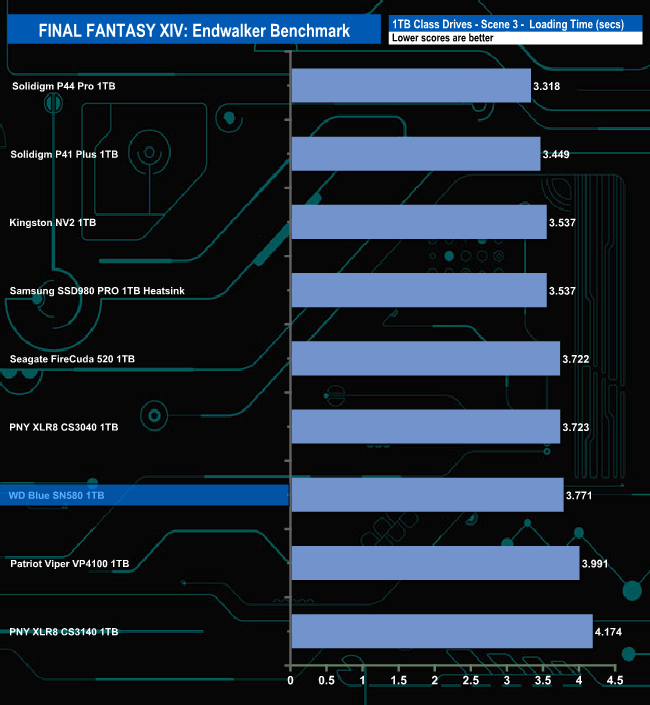
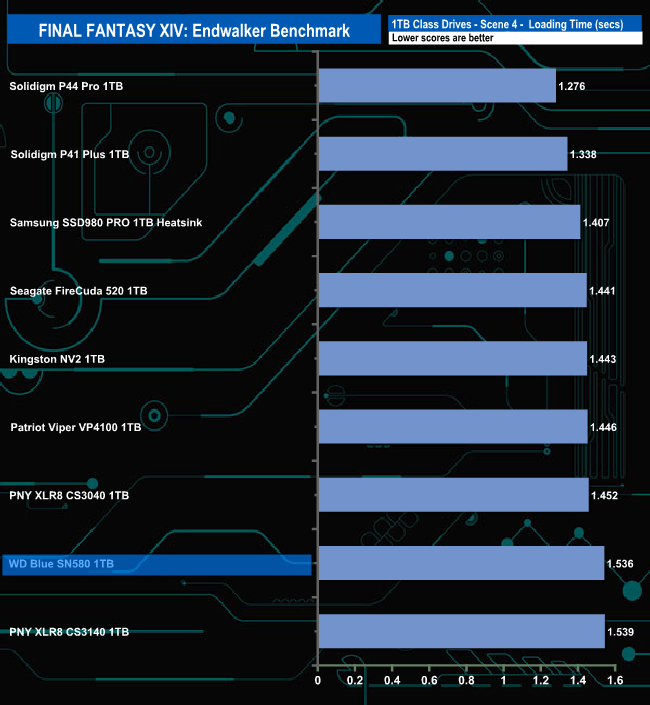
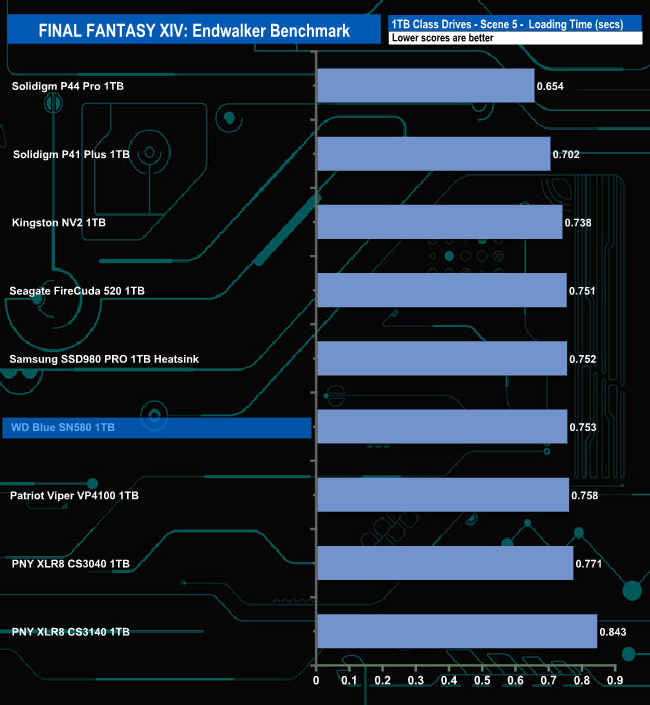
The SN580 doesn't appear to handle the Final Fantasy XIV Endwalker Official Benchmark very well as it sits very close to the bottom place in the results charts for three out of the five tests.
We took note of the drive’s temperature during some of our benchmarking runs.
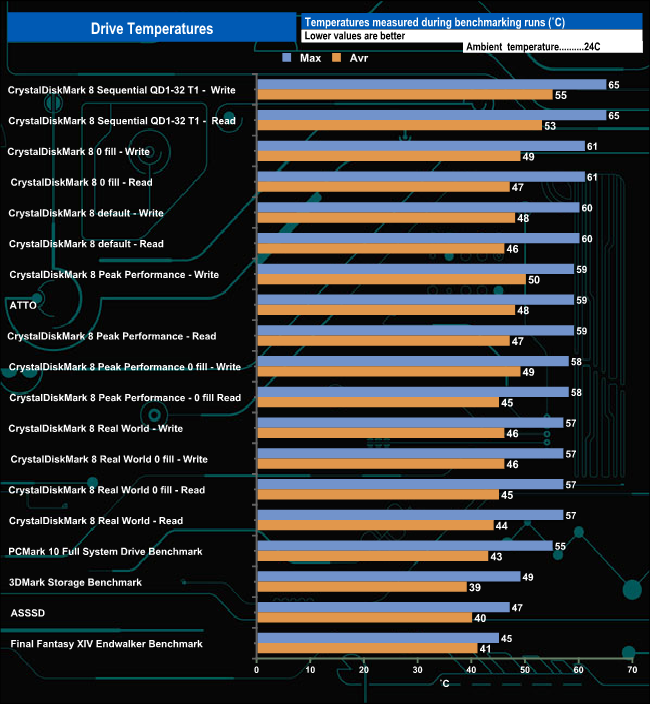
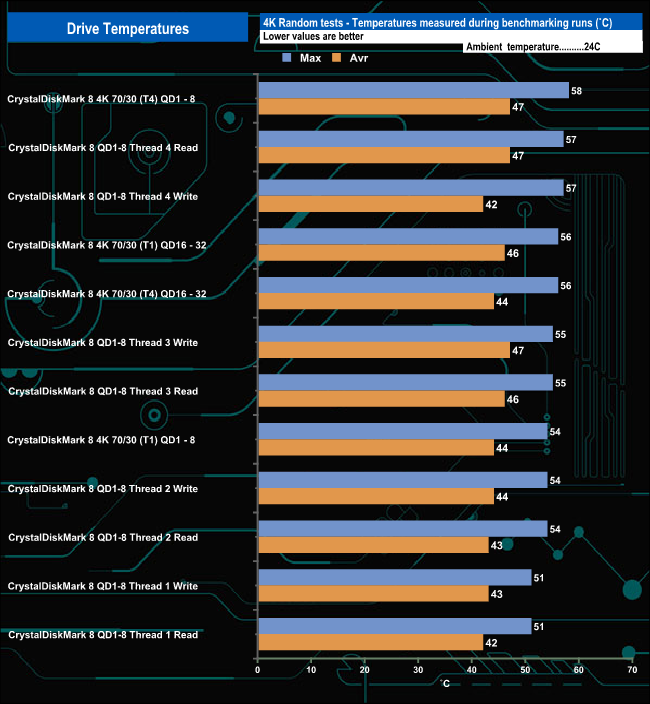
We took note of the drive’s temperature during some of our benchmarking runs. The WD Blue SN580 doesn’t have a heatsink, but as there are so few components on the PCB, there is plenty of room for air circulation. The drive did get particularly hot during some of the testing but to be fair on the drive it was being pushed very hard by some of the benchmarks, far harder than it would see in everyday usage, so these figures are very much worse case scenario.
To test real-life performance of a drive we use a mix of folder/file types and by using the FastCopy utility (which gives a time as well as MB/s result) we record the performance of drive reading from & writing to a 2TB Kioxia Exceria Plus.
Transfer Details:
Windows 10 backup – 118GB.
Data file – 100GB.
BluRay Movie – 42GB.
Windows 11 iso – 5.4GB.
File folder – 50GB – 28,523 files.
Steam folder – 222GB (8 games: Alien Isolation, Battlefield 4, BioShock Infinite, Crysis 3, Grand Theft Auto V, Shadow Of Mordor, Skyrim, The Witcher3 Wild Hunt).
Movie demos 8K – 21GB – (11 demos).
Raw Movie Clips 4K – 16GB – (9 MP4V files).
Movie folder – 12GB – 15 files – (8 @ .MKV, 4 @ .MOV, 3 @ MP4).
Photo Folder – 10GB – 304 files – (171 @ .RAW, 105 @ JPG, 21 @ .CR2, 5 @ .DNG).
Audio Folder – 10GB – 1,483 files – (1479 @ MP3, 4 @ .FLAC files).
Single large image – 5GB – 1.5bn pixel photo.
3D Printer File Folder – 4.25GB – (166 files – 105 @ .STL, 38 @ .FBX, 11 @ .blend, 5 @ .lwo, 4 @ .OBJ, 3@ .3ds).
AutoCAD File Folder – 1.5GB (80 files – 60 @ .DWG and 20 @.DXF).
![]()
![]()
The WD Blue SN580 handled our real-life file testing without displaying any problems. It averaged 2,282.35MB/s when writing to the Kioxia drive, the fastest being 100GB data file at 3,090MB/s. Reading the data back the drive averaged 2,400.21MB/s. The fastest transfer this time was the 8K Movie scenes folder at 3,145MB/s.
WD has just recently refreshed its mainstream Blue family of SSD drives with the arrival of the SN580. The fourth-generation SN580 takes over the crown as the fastest Blue drive currently available from the popular SN570 (reviewed HERE).
The new drive sees the switch to a PCIe Gen 4 interface from the Gen 3 format that the SN570 uses, so there is a solid boost in performance for the Blue range. The drive uses a SanDisk labelled controller but WD are keeping details close to their chest details, though it appears to be a 4-channel chip, looking after 112-layer BiCS5 TLC flash, the same NAND that the SN570 used.
Four models make up the SN580 line (at the time of writing) ; 250GB. 500GB, 1TB (the drive we are looking at here) and a flagship 2TB drive.
WD quote Sequential read/write performance figures for the 1TB Blue SN580 as up to 4,150MB/s for both. That 4,150MB/s figure is 650MB/s faster for reads than the previous generation 1TB SN570 and 1,150MB/s faster for writes. When the SN580 was benchmarked using the ATTO benchmark we couldn't hit the official maximums, the best we saw was 3,900MB/s for reads and 3,780MB/s for writes. Switching over to the CrystalDiskMark 8 benchmark we could confirm the official rating with best test results of 4,171MB/s and 4,172MB/s for read and writes respectively.
WD quotes random 4K figures for the 1TB SN580 as up to 600,000 IOPS and 750,000 IOPS for reads and writes respectively. This is a very healthy rise from the up to 460,000 IOPS (reads) and up to 450,000 IOPS (writes) of the 1TB SN570. With our standard 4-threaded tests we couldn't get close to these official figures, with a best-tested read figure of 454,815 IOPS with writes topping out at 411,304 IOPS. However, switching over to using the Peak Performance profile in CrystalDiskMark 8 we could confirm the official read figure with a test result of 618,291 IOPS. While we still came up short of the official maximum write figure with this test, we were certainly in the ballpark with a best result of 701,165 IOPS.
Although there is a performance improvement for the SN580 over the SN570, the endurance of the new drive is quoted at the same 600TBW figure as the previous drive. In fact, it's the same figure as the drive before that, the SN550, which we reviewed all the way back in 2019.
The 1TB WD Blue SN580 we reviewed today is priced at £56.99 direct from WD HERE.
Discuss on our Facebook page HERE.
Pros
- Overall performance.
- 5-year warranty.
- Price.
Cons
- Couldn’t match the official maximum 4K random write figures with some of our testing.
KitGuru says: WD’s Blue SN580 shows a marked increase in performance over the previous Blue SN570 thanks to the move to the PCIe Gen 4 interface. In a very crowded and cutthroat market space, WD has given it every chance with a pretty competitive price tag.