

According to Seagate, the IronWolf 510 is the world's first PCIe M.2 SSD built from the ground up to be used for caching duties in NAS devices. Priced around £370 for the 1.92TB model, we put this drive through its paces today.
Available in four capacities (at the time of writing this review); 240GB, 480GB, 960GB and the flagship 1.92TB we are reviewing here, the IronWolf 510 is built around an eight-channel Phison PS5012-E12DC controller and Kioxia BiCS3 64-layer 3D TLC NAND.
The quoted official Sequential read figures for the range are up to 3,150MB/s for the 1.92TB and 960GB models, 2650MB/s for the 480GB drive and up to 2,450MB/s for the 240GB drive. Write performance is quoted as up to 850MB/s for the 1.92TB drive, while the 960GB drive is faster at up to 1,000MB/s. The 480GB drive is rated as up to 600MB/s and the entry model 240GB drive gets a 290MB/s figure.
Random 4K performance for the four drive range is quoted as up to 290,000 IOPS read and up to 27,000 IOPS write (QD32 8 threads) for the 1.92TB model. The 960GB drive is rated faster at up to 345,000 IOPS for reads and up to 29,000 IOPS for writes. The 480GB drive is rated as up to 199,000 IOPS and 21,000 IOPS for read and write respectively while the 240GB drive makes do with up to 100,000 IOPS reads and 13,000 IOPS writes.
Seagate has built some very serious endurance into the IronWolf 510. It has a DWPD (Drive Write Per Day) figure of one for the length of the 5-year warranty that backs the drive and a TBW figure of 3,500TB together with an MTBF of 1.8M hours.
Physical Specifications:
- Usable Capacities: 1.92TB.
- NAND Components: Kioxia BiCS3 64-layer 3D TLC NAND.
- NAND Controller: Phison PS5012-E12DC.
- Cache: 2GB DDR4.
- Interface: PCIe Gen3 x4, NVMe 1.3.
- Form Factor: M.2 2280.
- Dimensions: 22.15 x 80.15 x 3.58mm.
- Drive Weight: 8.3g.
Firmware Version: STIS1029.
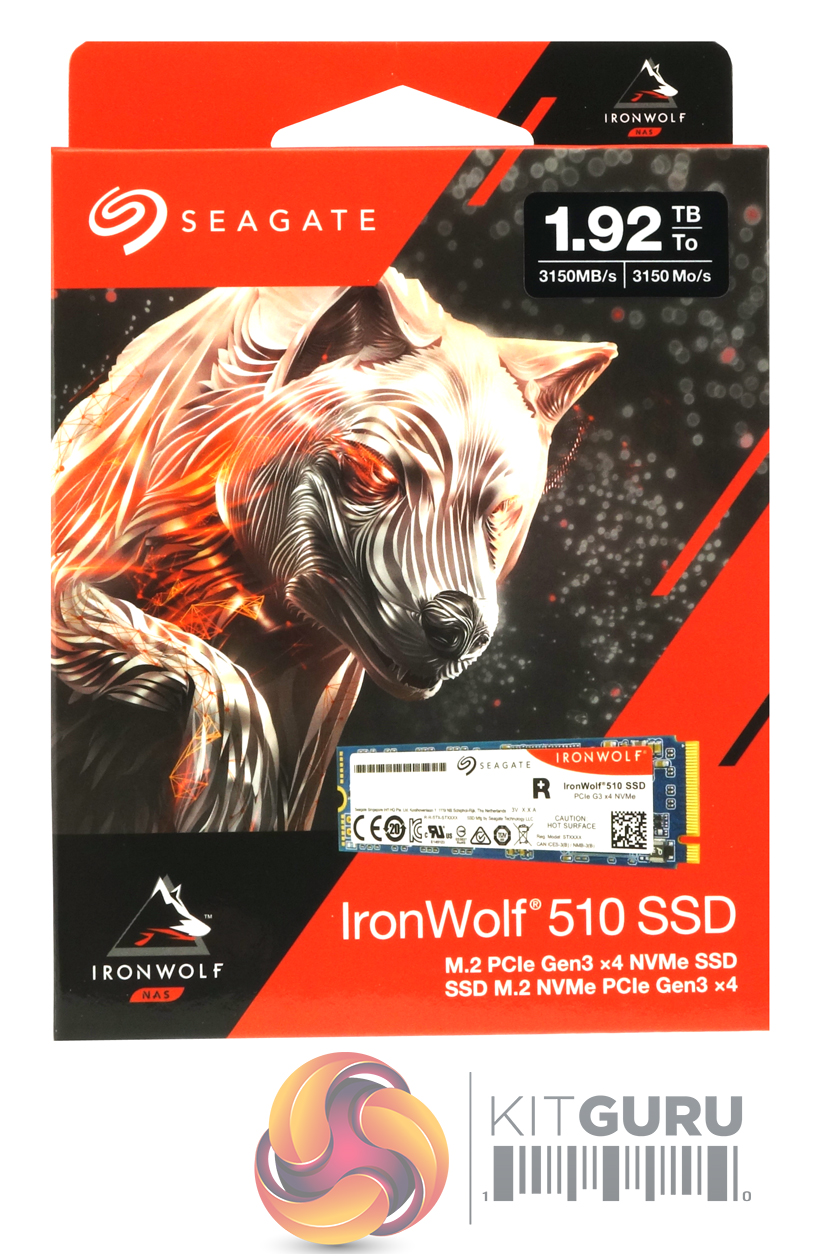
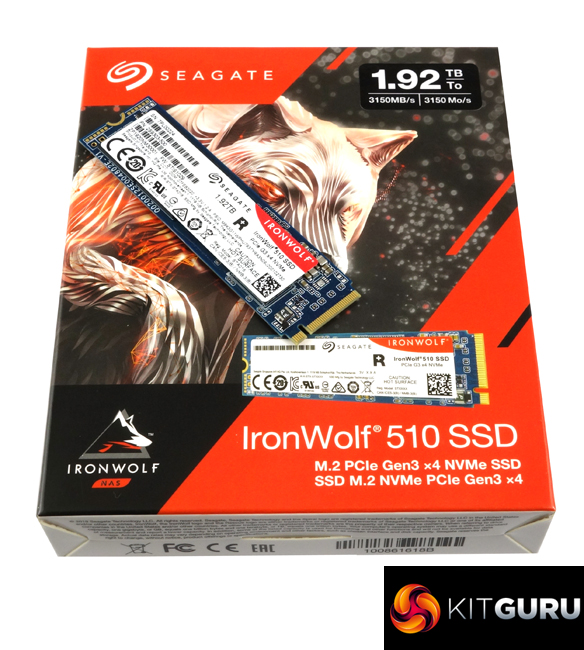
Seagate’s IronWolf 510 comes in a striking orange and white box with Seagate’s IronWolf wolf mascot prominently displayed along with a small image of the drive on the front. At the top of the box is a sticker which displays the drive’s capacity and the Sequential read speed of the drive. Towards the bottom of the box is some text displaying the interface of the drive.
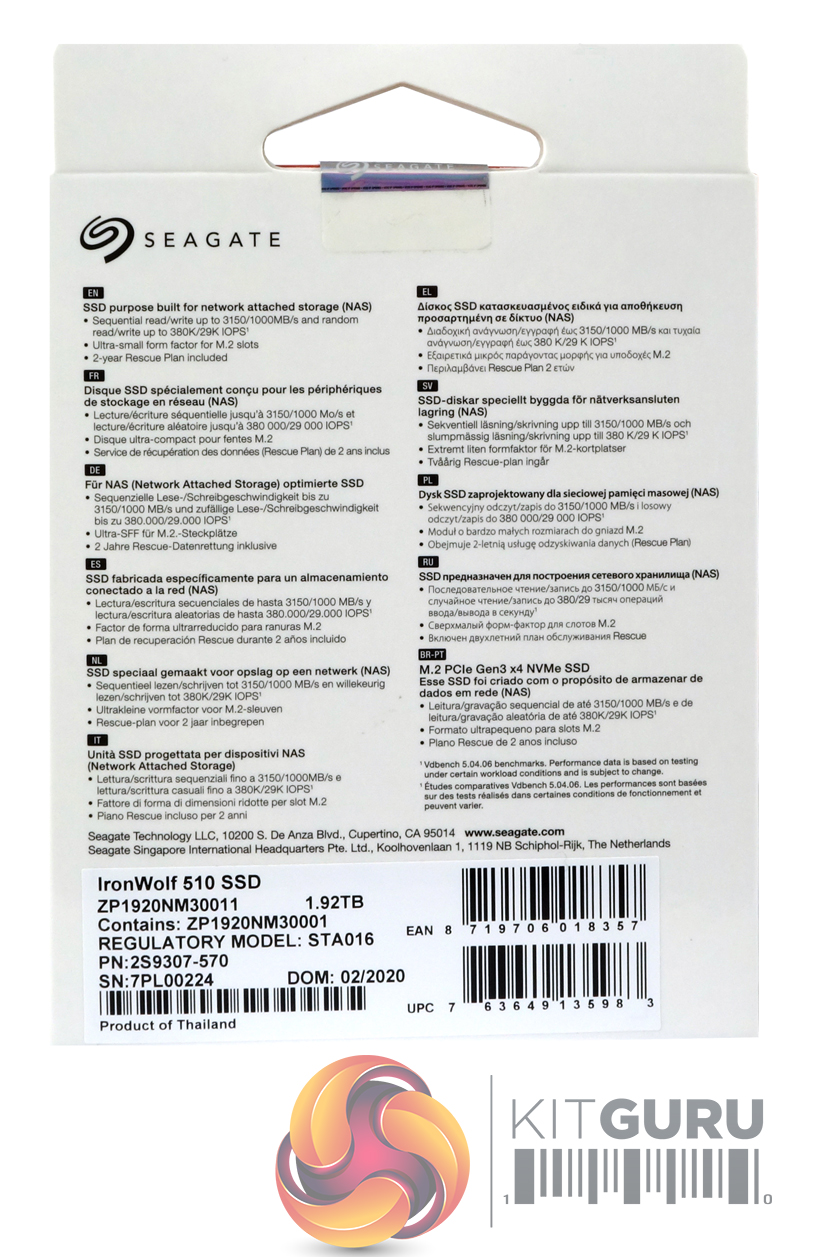
The rear of the box is covered my multilingual bullet points about the drive being purpose-built for NAS, Sequential read/write and random read/write speeds and the fact it comes with a 2-year Rescue Plan included.
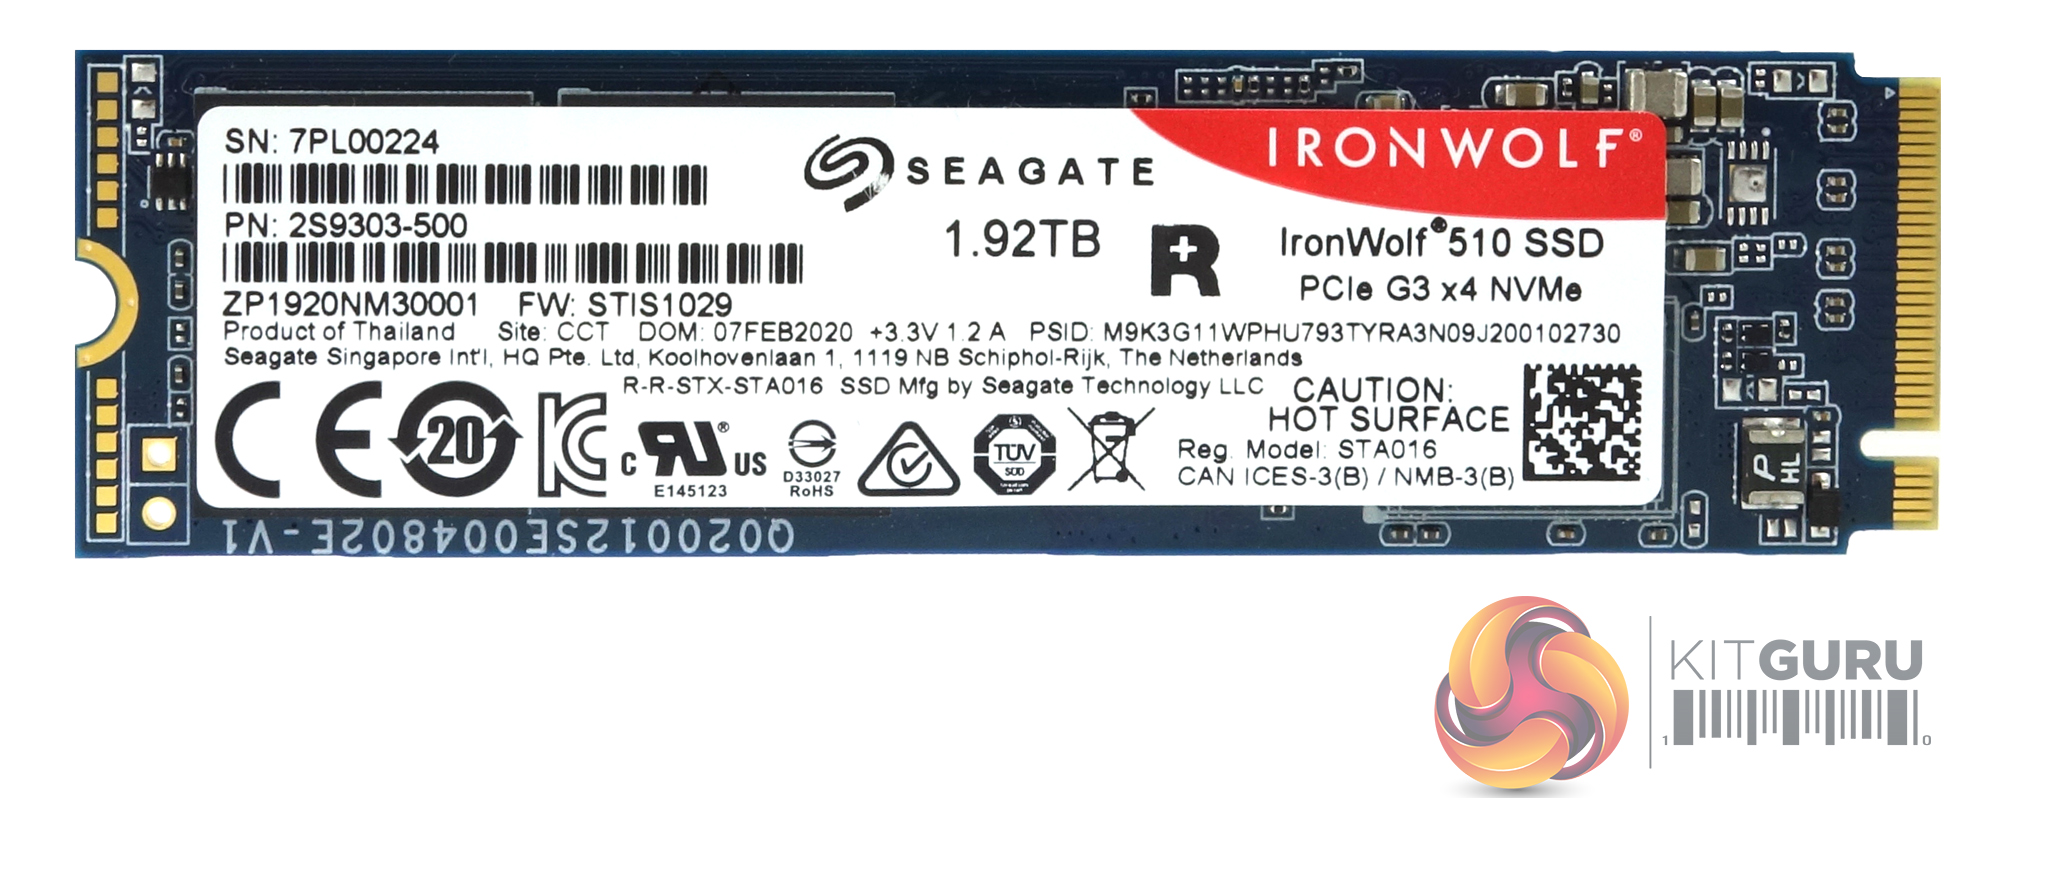

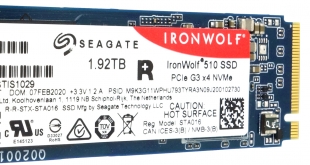
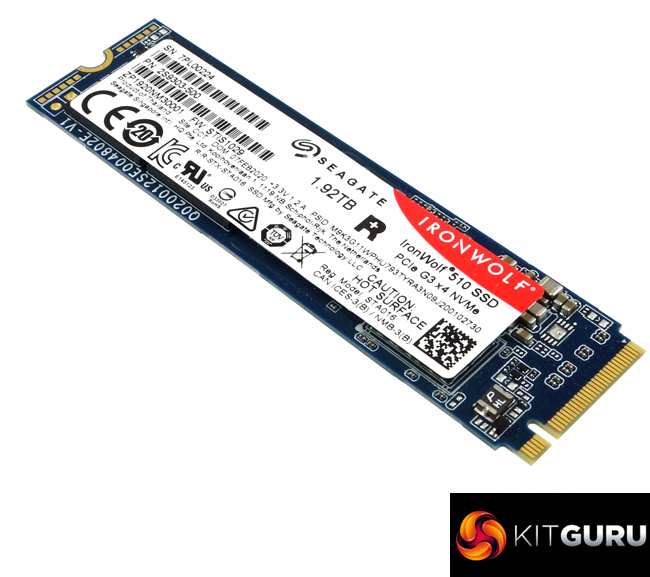
The 1.92TB IronWolf 510 is built on a dual-sided M.2 2280 format PCB.
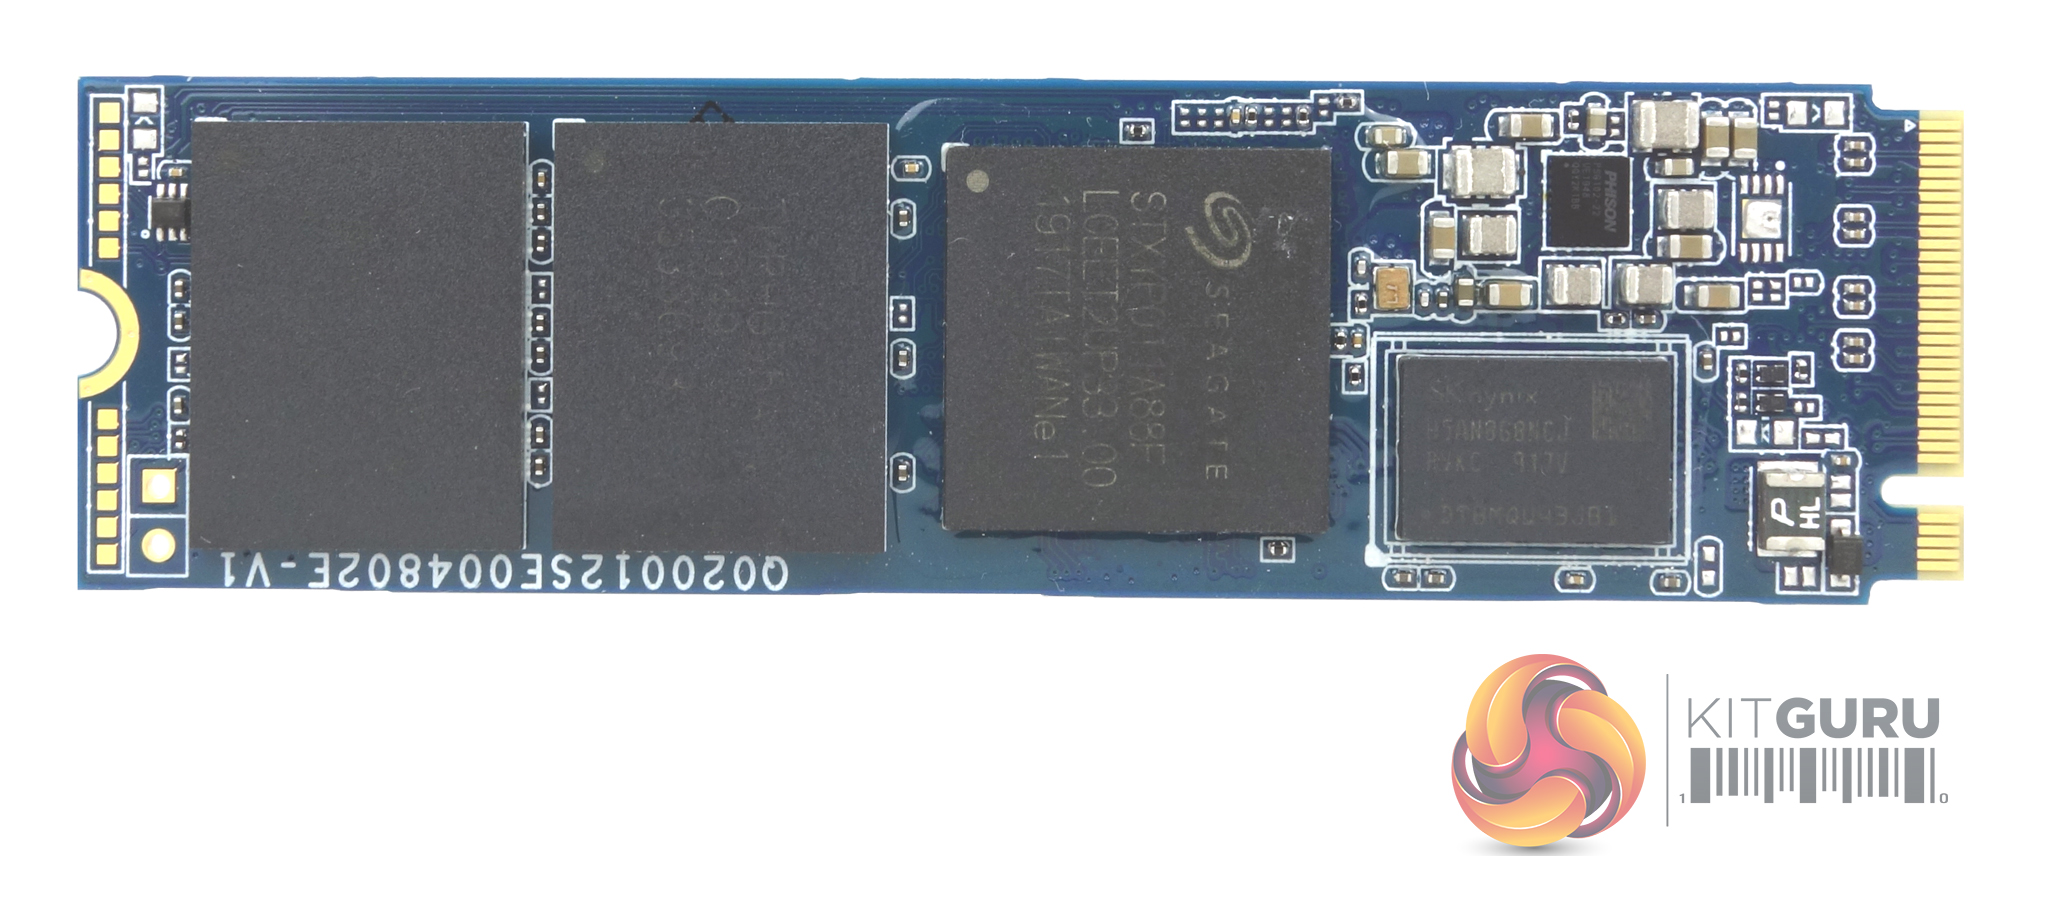
Sitting under the product label is the Phison PS5012-E12DC controller (branded as Seagate), alongside two packages of Kioxia BiCS3 64-layer 3D TLC NAND (coded TPBHG55AIV) and one DDR4 DRAM (SK hynix H5AN8G8NCJ) chip. On the other side of the PCB are two more NAND packages and a second DRAM IC.
Phison's PS5012-E12DC is an enterprise-class controller. Built on a 28nm process, the controller features Phison's 3rd generation LDPC ECC engine and supports AES 256 bit hardware-based encryption.
For testing, the drives are all wiped and reset to factory settings by HDDerase V4. We try to use free or easily available programs and some real-world testing so you can compare our findings against your own system.
This is a good way to measure potential upgrade benefits.
Main system:
AMD Ryzen 5 3600X, 16GB DDR4-2400, Sapphire R9 390 Nitro and an MSI MPG X570 Gaming Edge Wifi motherboard
Other drives
Corsair MP400 2TB
Corsair Force MP510 960GB
Crucial P1 1TB
Kingston KC2000 1TB
Kingston KC2500 1TB
Patriot Viper VPR100 RGB 1TB
Patriot Viper VPN100 1TB
PNY CS3030 1TB
Seagate FireCuda 510 1TB
Samsung SSD970 PRO 1TB
Samsung SSD960 EVO 1TB
Samsung SSD960 EVO Plus 1TB
Kioxia Exceria Plus 2TB
Kioxia Exceria NVMe 1TB
Kioxia BG4 1TB
Kioxia XG6 1TB
Western Digital Black SN750 1TB
Western Digital Black SN750 1TB with Heatsink
Western Digital Blue SN550 1TB
Software:
ATTO Disk Benchmark 4.
CrystalMark 6.0 & 7.0.0.
AS SSD 2.0.
IOMeter.
Futuremark PC Mark 10
All our results were achieved by running each test five times with every configuration this ensures that any glitches are removed from the results. Trim is confirmed as running by typing fsutil behavior query disabledeletenotify into the command line. A response of disabledeletenotify =0 confirms TRIM is active.
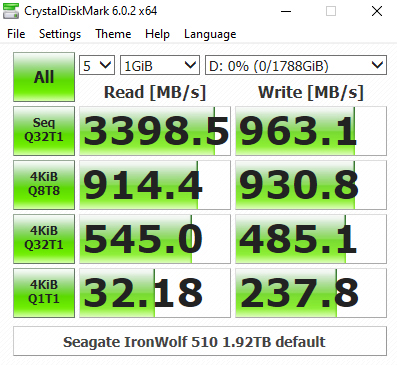
CrystalDiskMark is a useful benchmark to measure theoretical performance levels of hard drives and SSDs. We are using v6.0.
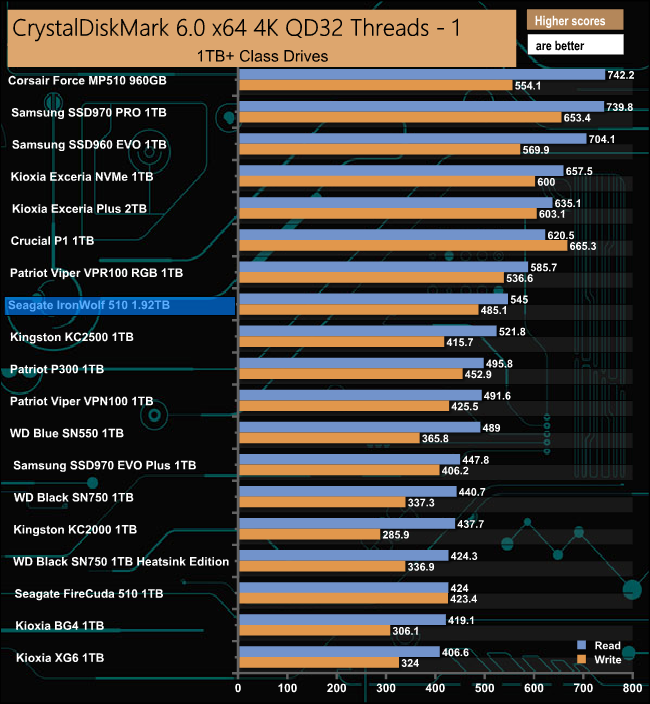
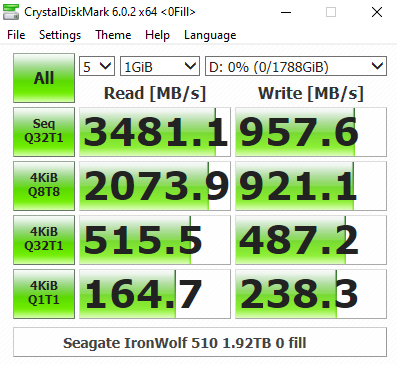
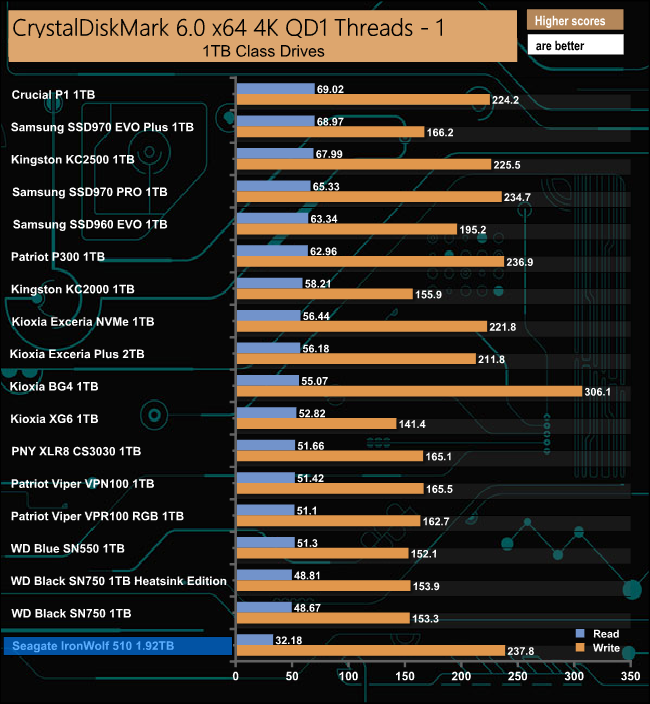
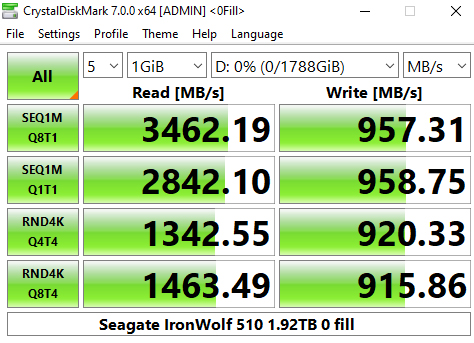
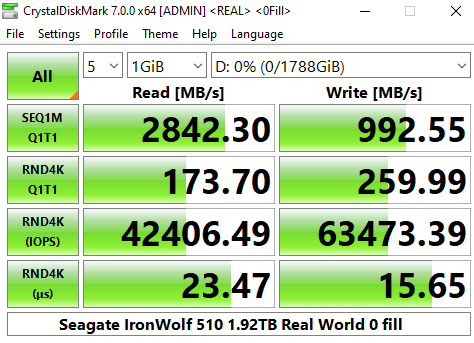
The IronWolf 510 performs reasonably well in CrystalDiskMark’s deeper queue depth 4K test. From looking at the two benchmark result screens, it seems that the controller has a preference for handling compressible data. Using this type of data sees a big boost in the random read performance at queue depths 1 and 8.
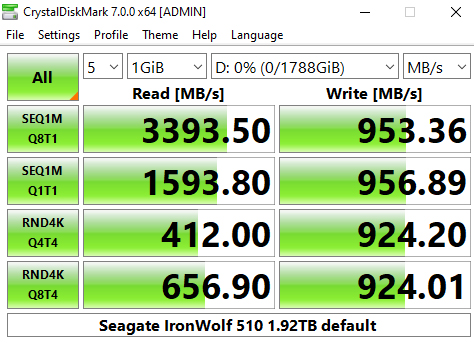

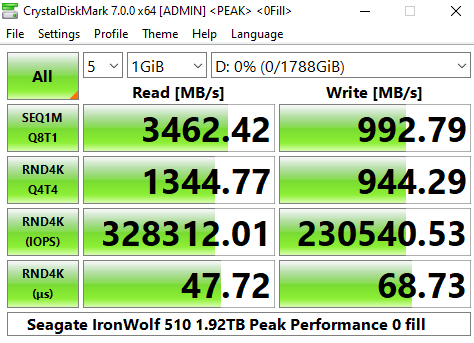
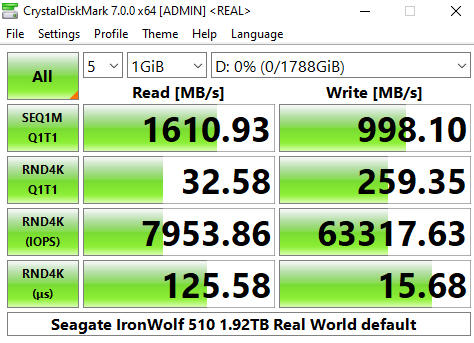
The latest version of CrystalDiskMark, version 7, includes a couple of profiles that can be used for testing – Peak Performance and Real World. The result screens for these two profiles not only display MB/s results but also IOPS and latency.
Looking at the Peak Performance results for Sequential read/write performance we could confirm both official Sequential performance figures. The drive is rated up to 3,150MB/s for reads, with the tested drive producing 3,431MB/s and up to 850MB/s for writes, with a test result of 996.35MB/s.
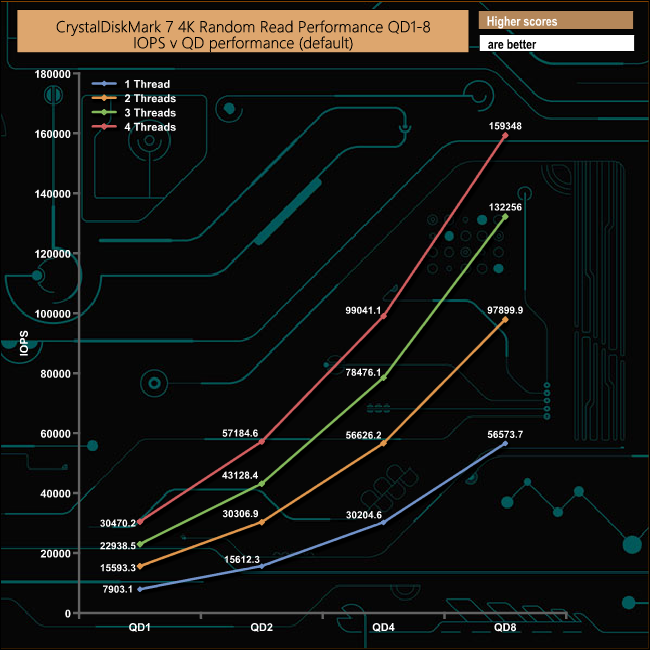
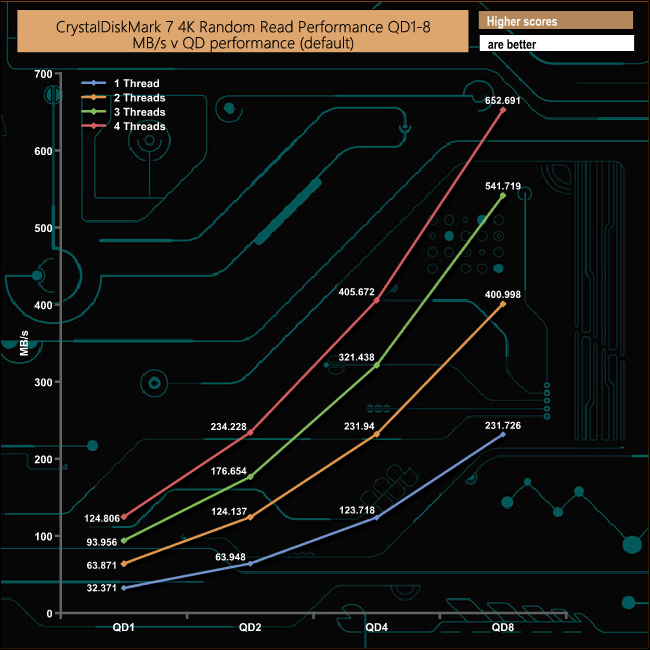
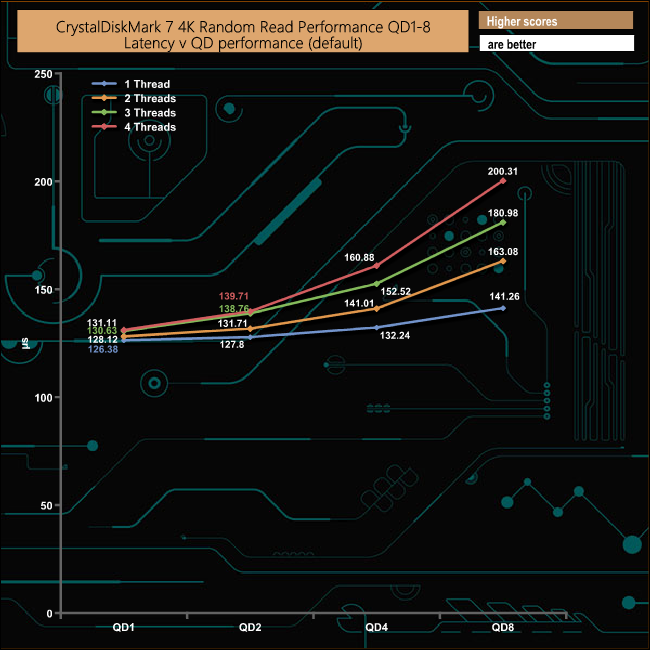
We also used CrystalDiskMark 7 to test the drive at lower queue depths (QD1 – QD8 where most of the everyday workloads occur) using 1 to 4 threads. The IronWolf 510's read performance climbs smoothly throughout the tested queue depths and threads.
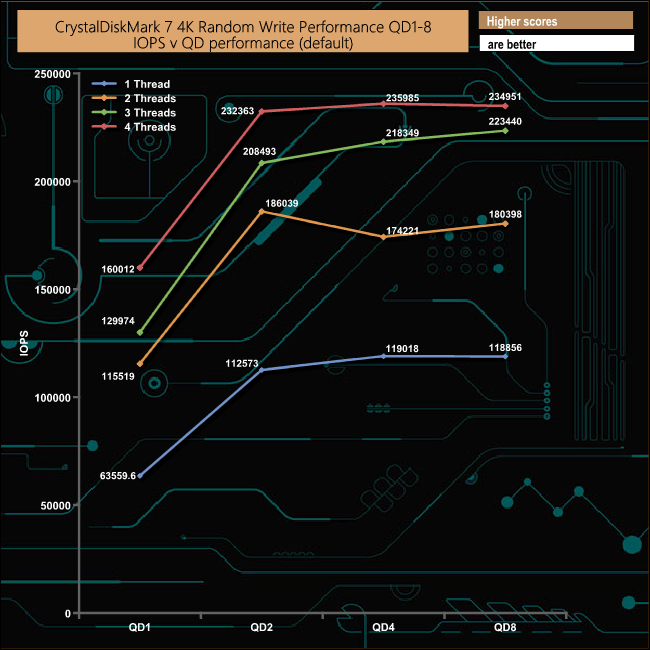
In the two-threaded test, the drive peaks at QD2 (186,039 IOPS) before dropping to 174,221 IOPS at QD4. At QD8 the drive had recovered to 180,398 IOPS.
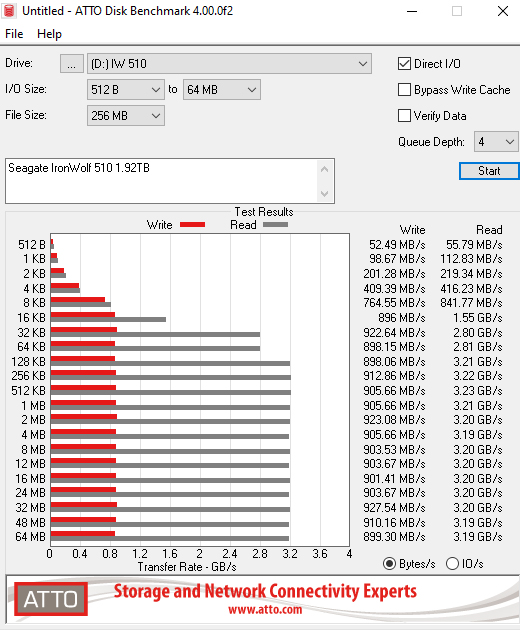
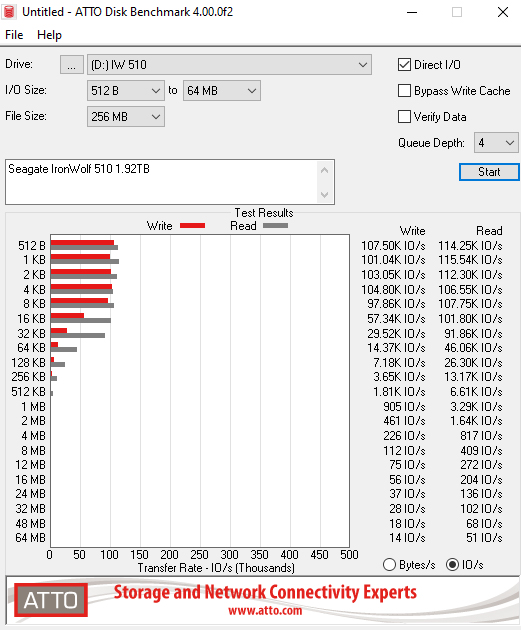
The ATTO Disk Benchmark performance measurement tool is compatible with Microsoft Windows. Measure your storage systems performance with various transfer sizes and test lengths for reads and writes. Several options are available to customize your performance measurement including queue depth, overlapped I/O and even a comparison mode with the option to run continuously. Use ATTO Disk Benchmark to test any manufacturers RAID controllers, storage controllers, host adapters, hard drives and SSD drives and notice that ATTO products will consistently provide the highest level of performance to your storage.
We are using version 4 for our NVMe disk tests.
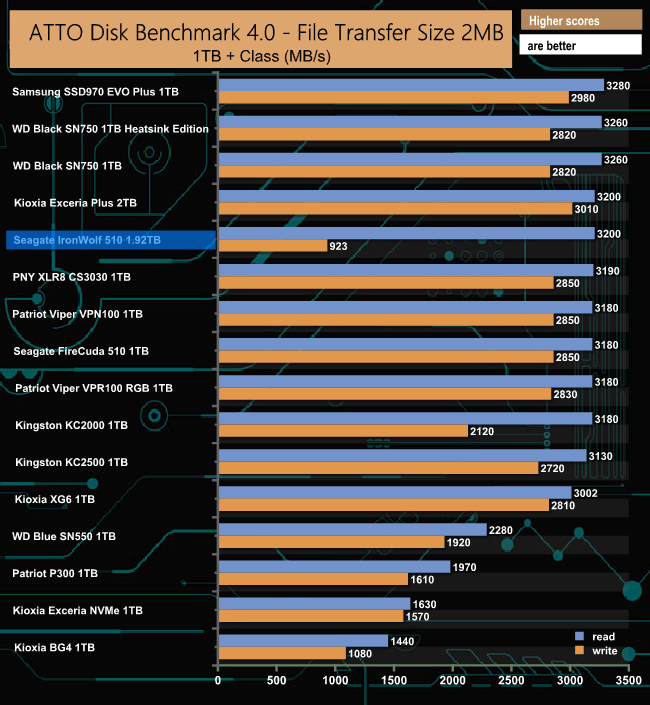
Officially the IronWolf 1.92TB is rated at up to 3,150MB/s for reads and 850MB/s for writes. We could confirm these figures with the ATTO benchmark, with our review drive producing a read figure of 3200MB/s and writes at 923MB/s, both being better than the official maximums.
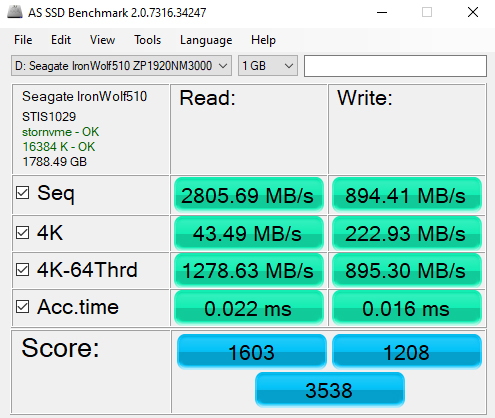
AS SSD is a great free tool designed just for benching Solid State Drives. It performs an array of sequential read and write tests, as well as random read and write tests with sequential access times over a portion of the drive. AS SSD includes a sub suite of benchmarks with various file pattern algorithms but this is difficult in trying to judge accurate performance figures.
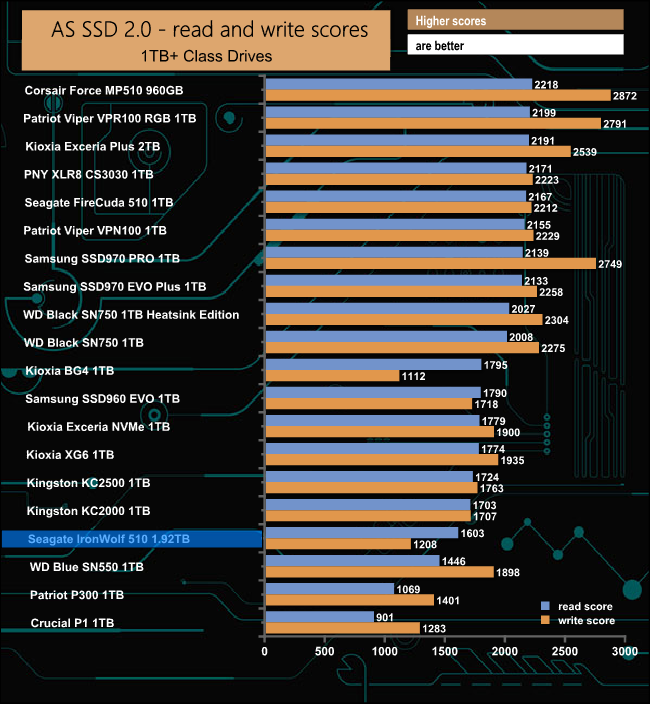
In the tougher AS-SSD test, the review drive doesn't reach the official 3,150MB/s, the review drive producing a figure of 2,805MB/s. However, the tested write score of 894.41MB/s is better than the official 850MB/s.
IOMeter is another open source synthetic benchmarking tool which is able to simulate the various loads placed on a hard drive and solid-state
drive technology. There are many ways to measure the IOPS performance of a Solid State Drive, so our results will sometimes differ from manufacturer’s quoted ratings. We do test all drives in exactly the same way, so the results are directly comparable.
We test 128KB Sequential read and write and random read and write 4K tests. The test setup’s for the tests are listed below. Each is run five times.
128KB Sequential Read / Write.
Transfer Request Size: 128KB Span: 8GB Thread(s): 1, Outstanding I/O: 1-32 Test Run: 20 minutes per test
4K Sustained Random Read / Write.
Transfer Request Size: 4KB Span: 80GB Thread(s): 4, Outstanding I/O:1-32 Test Run: 20 minutes per test
4K Random 70/30 mix Read/Write.
Transfer Request Size: 4KB Span: 80GB Reads: 70% Writes: 30% Thread(s): 4 Outstanding I/O: 2 – 32 Test Run: 20 minutes
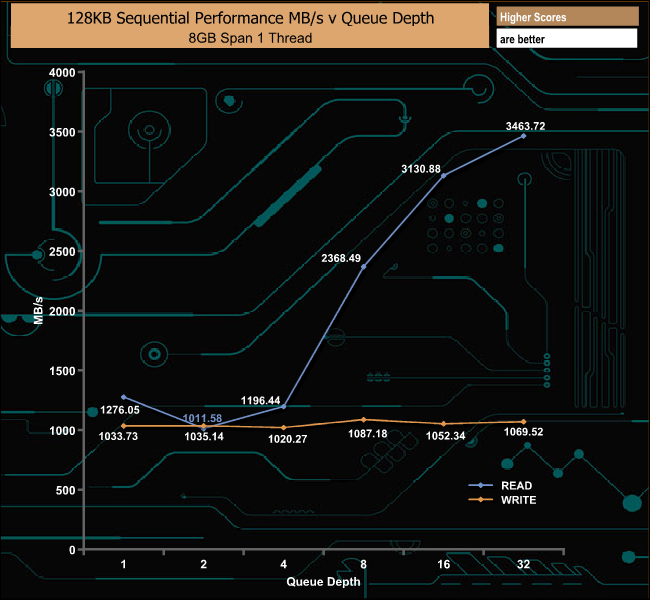
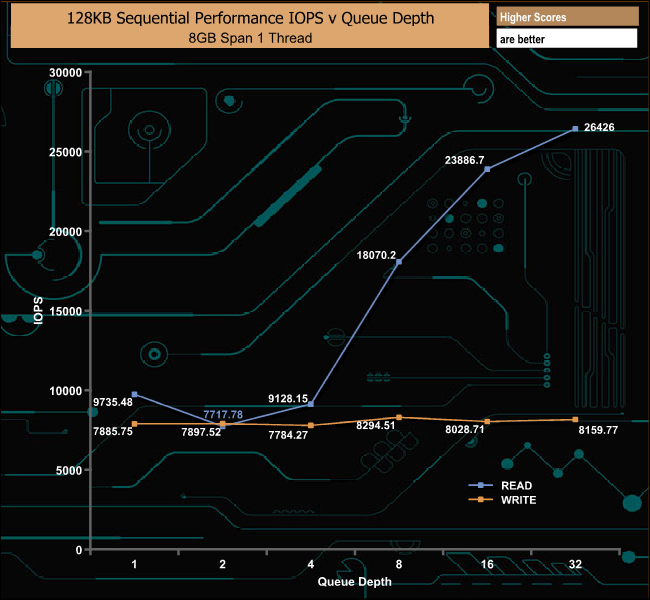
Using our own Sequential tests we saw a peak read figure of 3,463.72MB/s with writes peaking 1087.18MB/s, both figures bettering the official 3,150MB/s read and 850MB/s write ratings.
128KB Sequential Read Performance v QD Compared
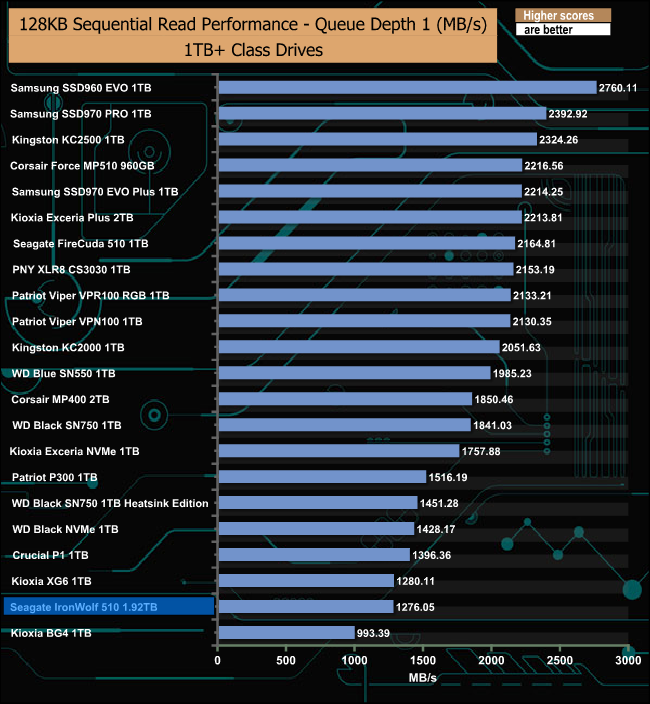
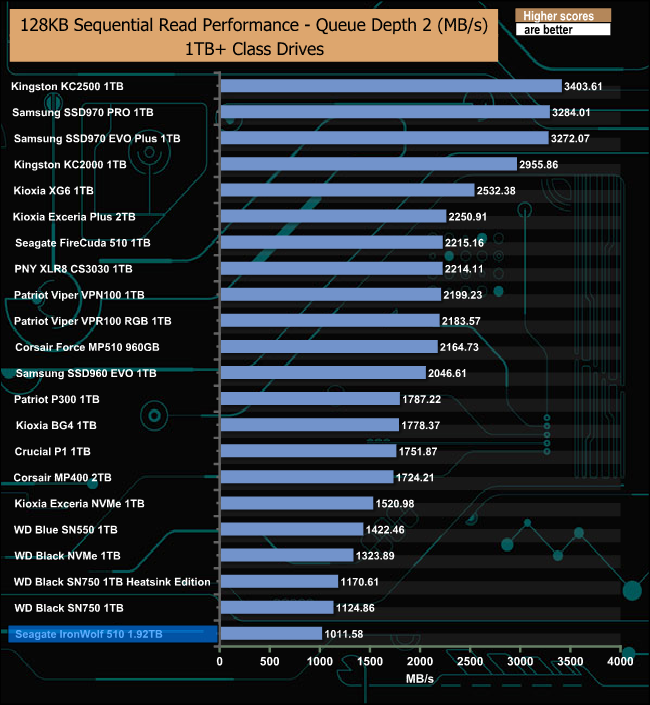
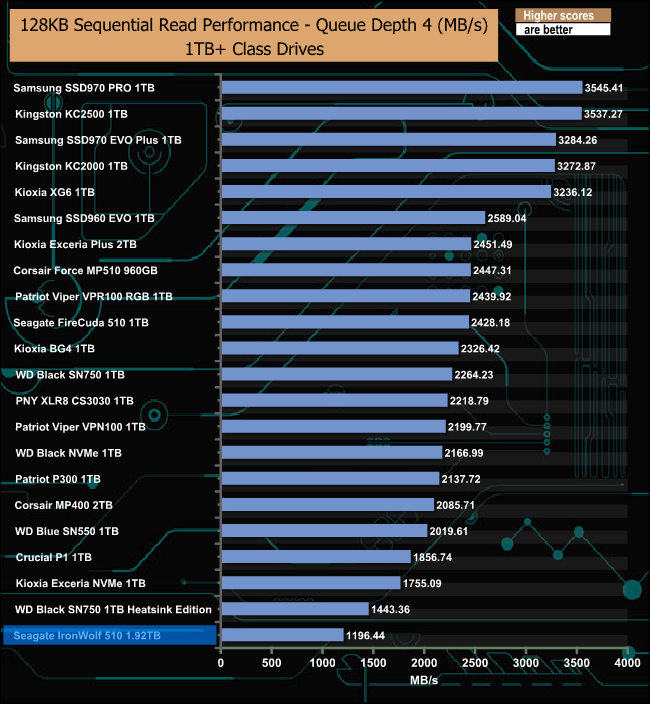
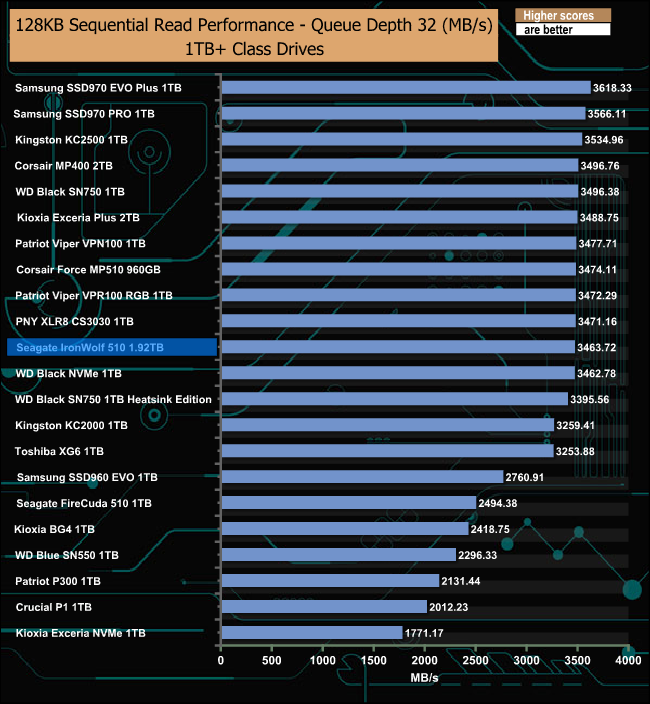
At low queue depths, the random read performance of the IronWolf 510 puts at the bottom of our results chart, but at a QD of 32, the performance improves significantly.
128KB Sequential Write Performance v QD Compared
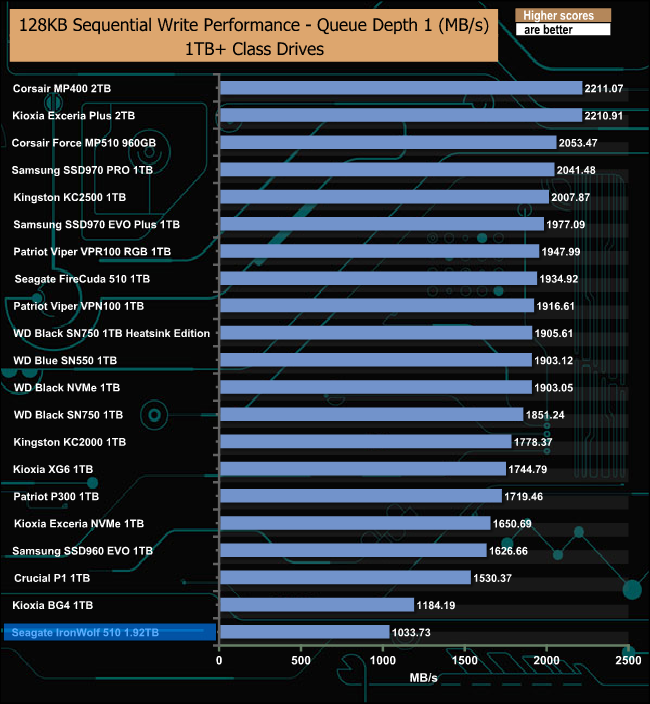
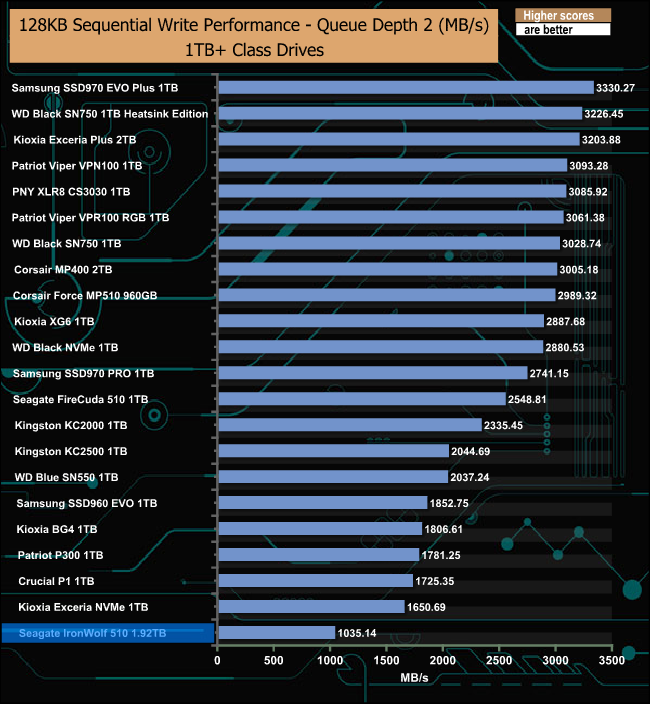
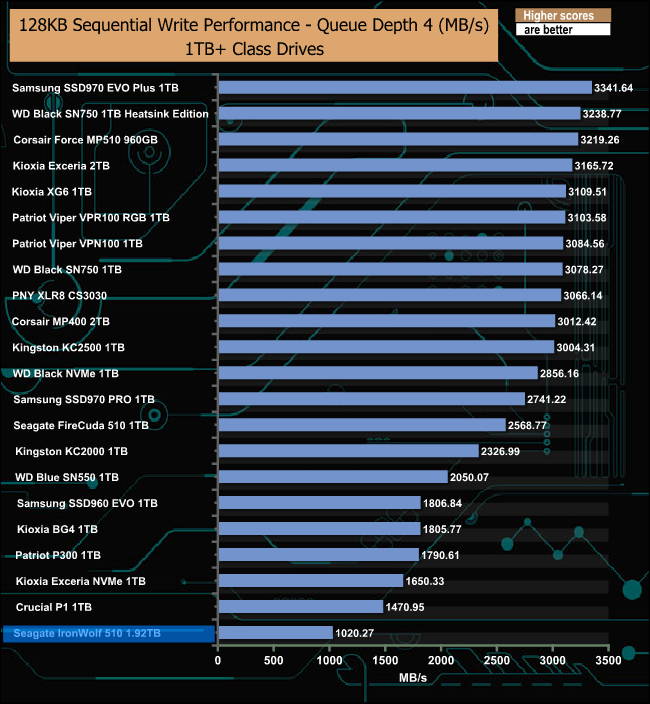
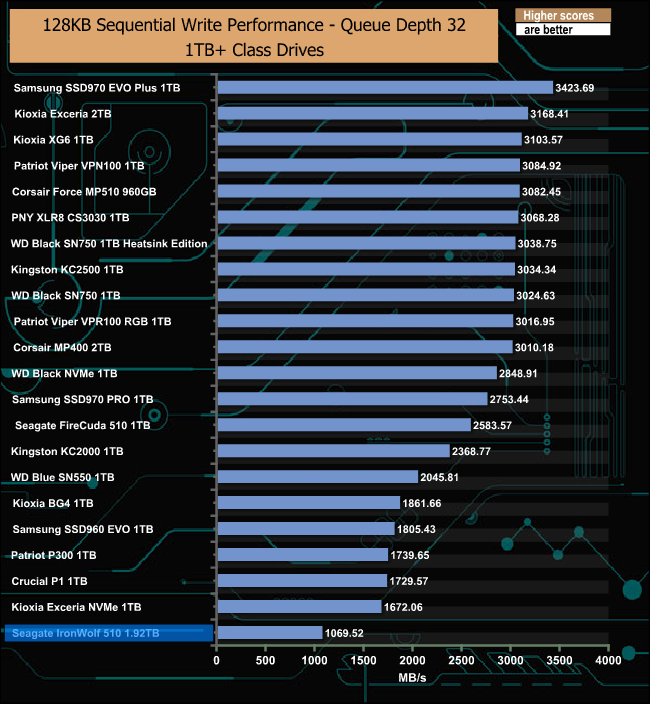
As the IronWolf 510 is a read-centric drive, it comes as no real surprise to find the write performance stays at the bottom of the Sequential write result charts throughout the tested queue depths.
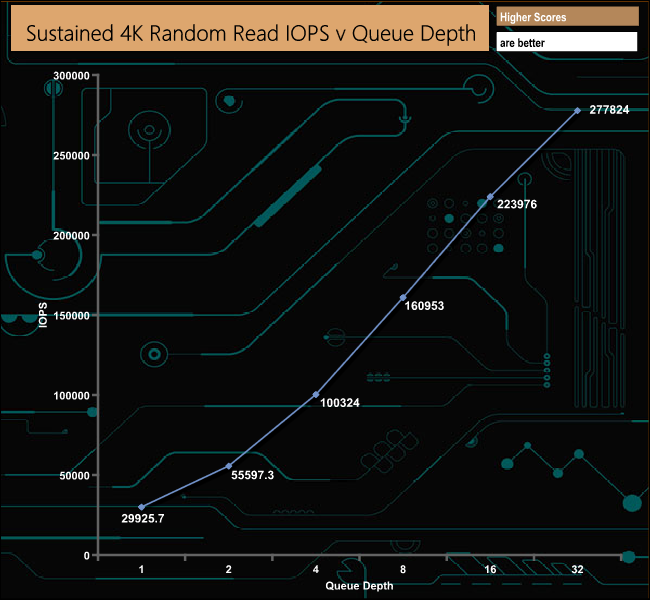
The IronWolf 510 is officially rated as up to 290,000 IOPS (QD32 8 threads) for random reads. With our standard 4-threaded tests we saw a figure of 277,824 IOPS at a QD of 32. We did a quick test at QD32 with 8 threads and got a figure of 345,030 IOPS, bettering the official figure.
4K Random Read v QD Performance Compared
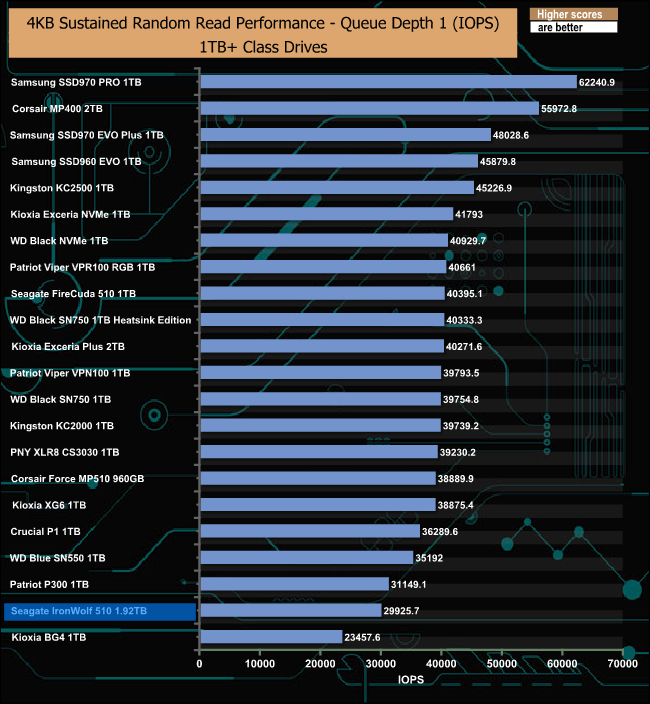
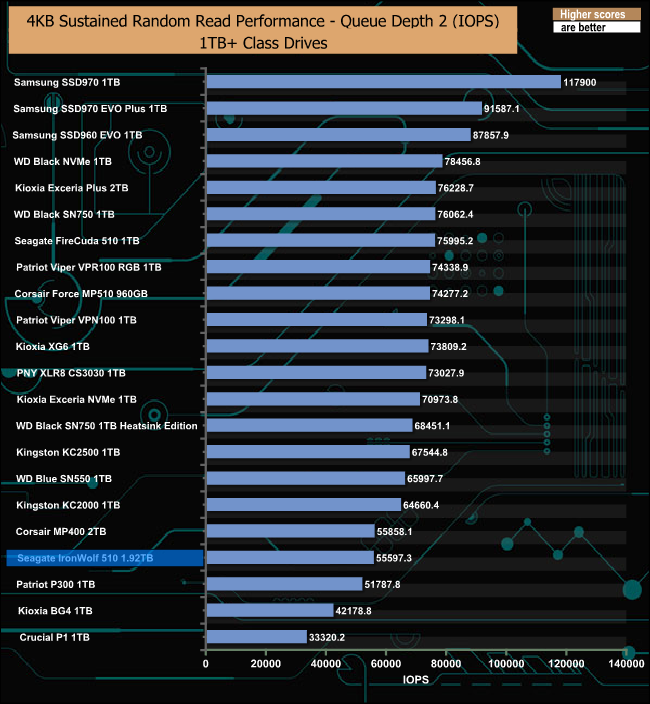
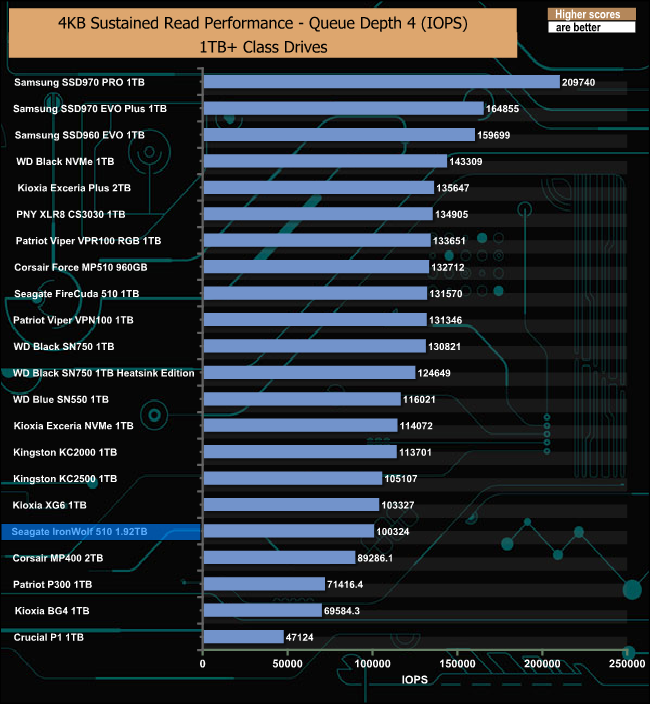
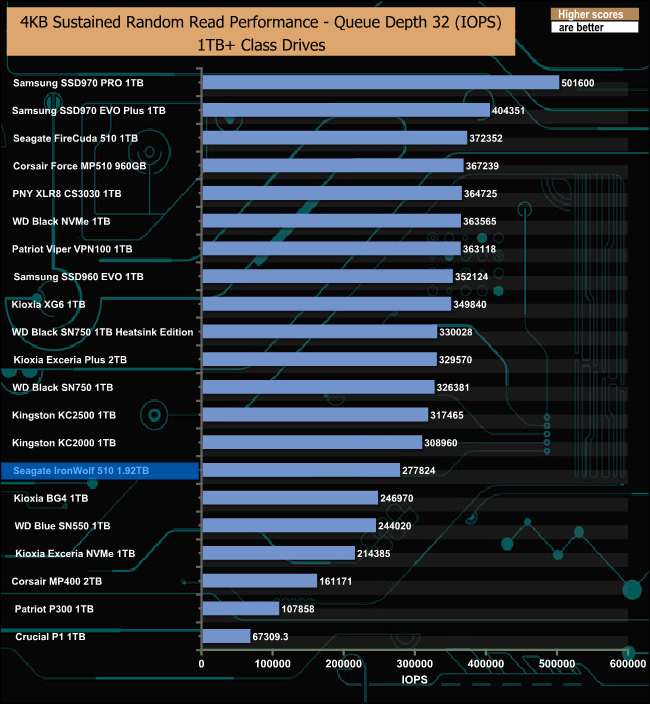
Throughout the tested queue depths, the IronWolf 510's random read performance sees it place in the bottom third of the results charts.
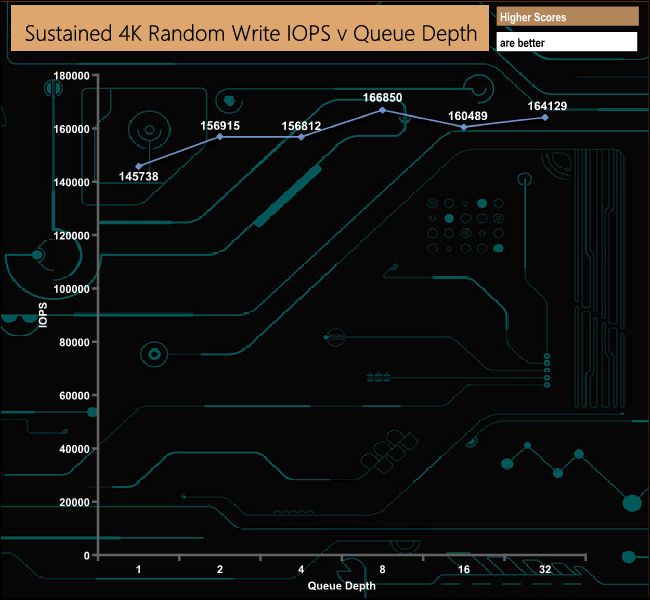
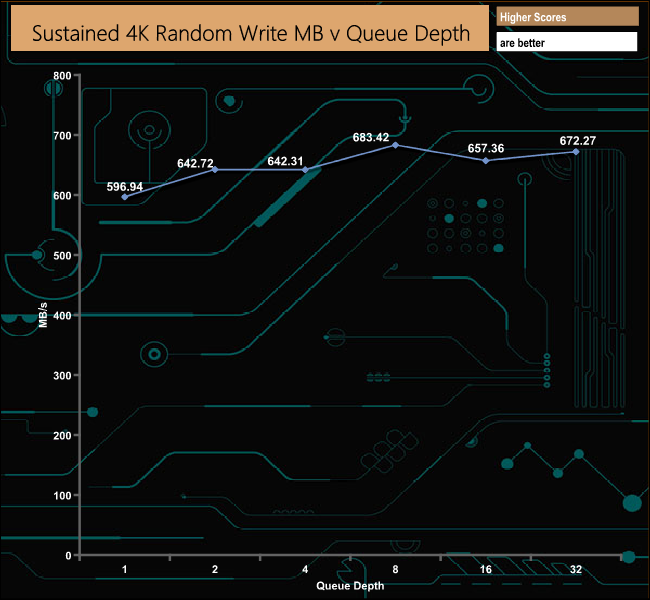
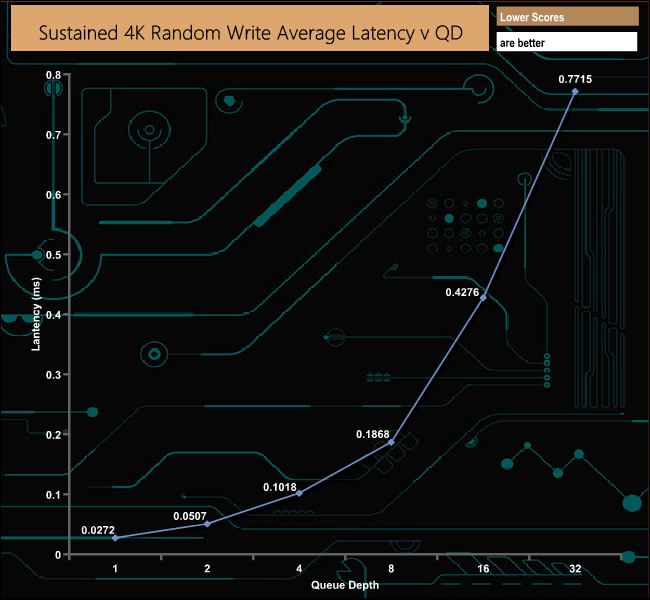
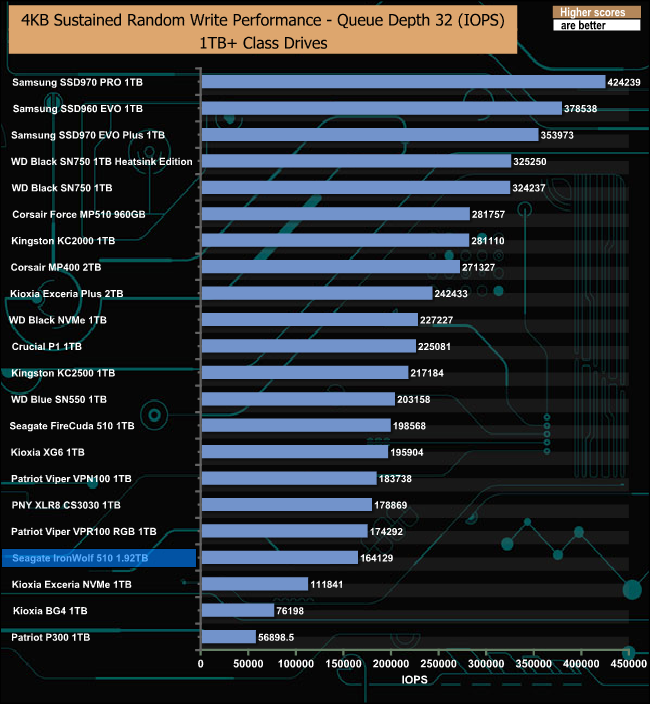
Officially the IronWolf is rated as up to 27,000 IOPS at a QD32 using 8 threads. With our 4-threading testing at a QD of 32, we exceed that by some margin, the review drive yielding a figure of 164,129 IOPS.
4K Random Write v QD Performance Compared
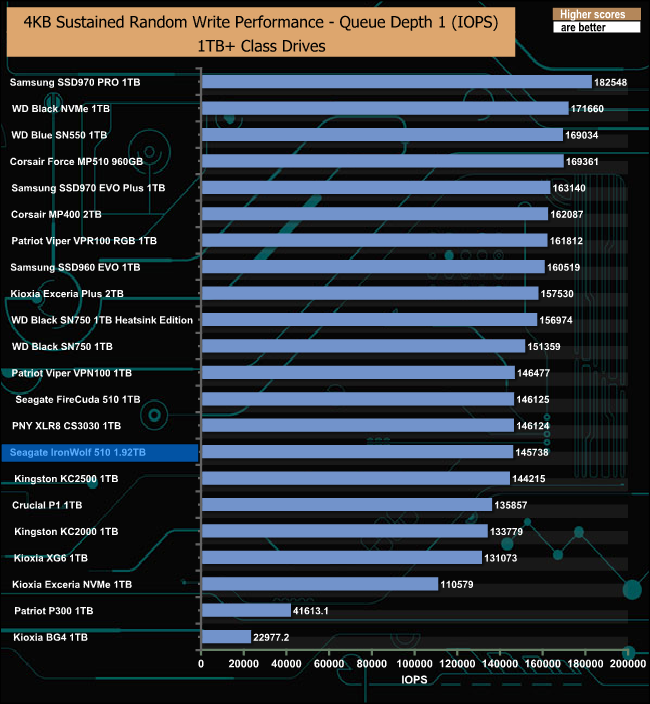
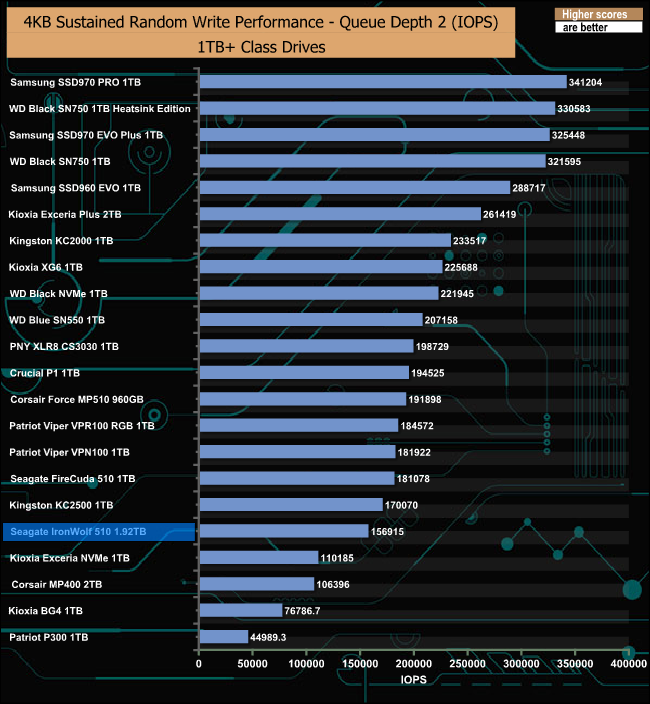
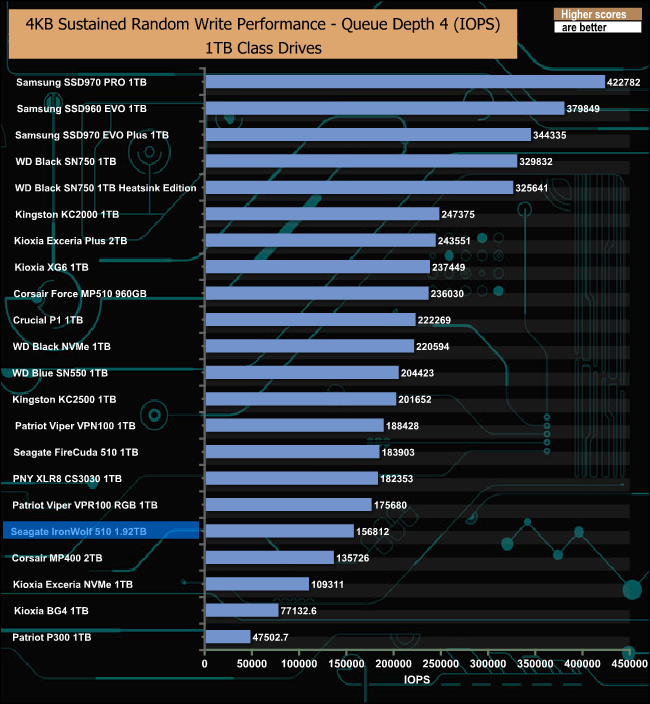
Compared to the drives around it, the strongest random write performance for the IronWolf 510 comes at a queue depth of 1.
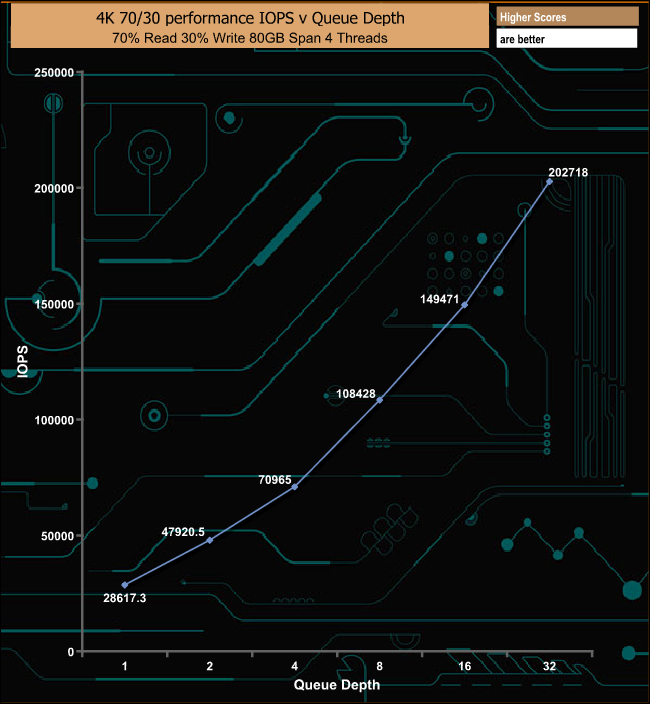
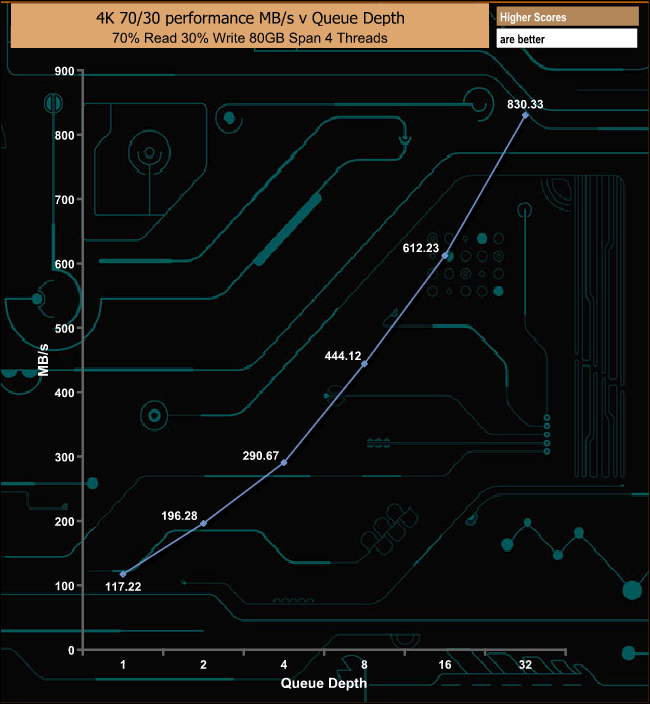
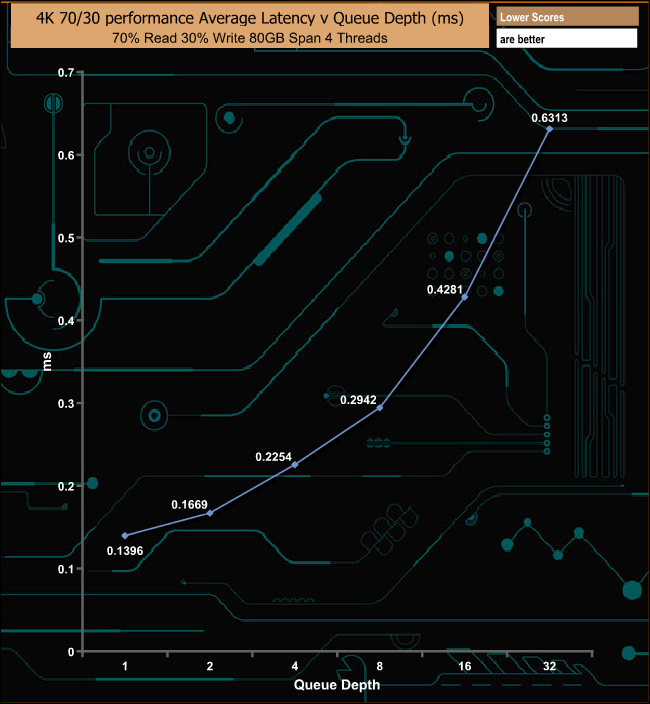
The drive performed well in our mixed 70/30 read/write tests, finishing the test at 202,718 IOPS (830.33MB/s).
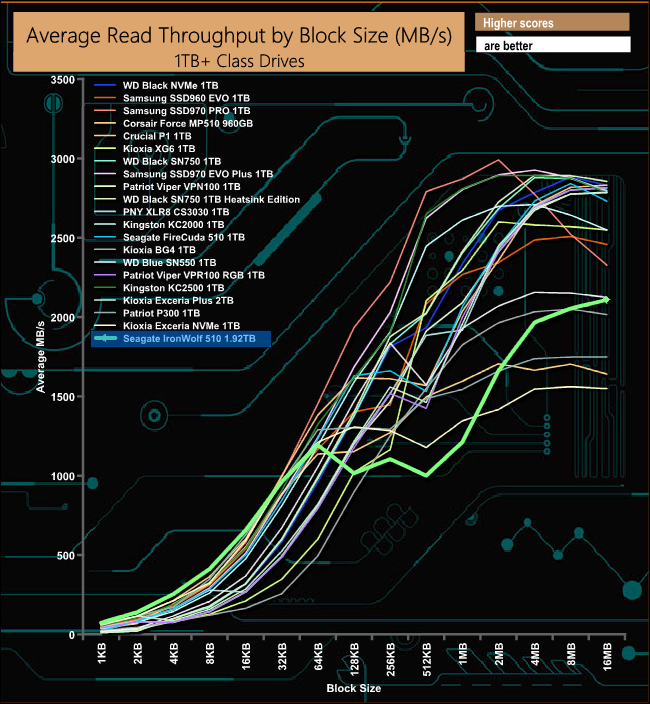
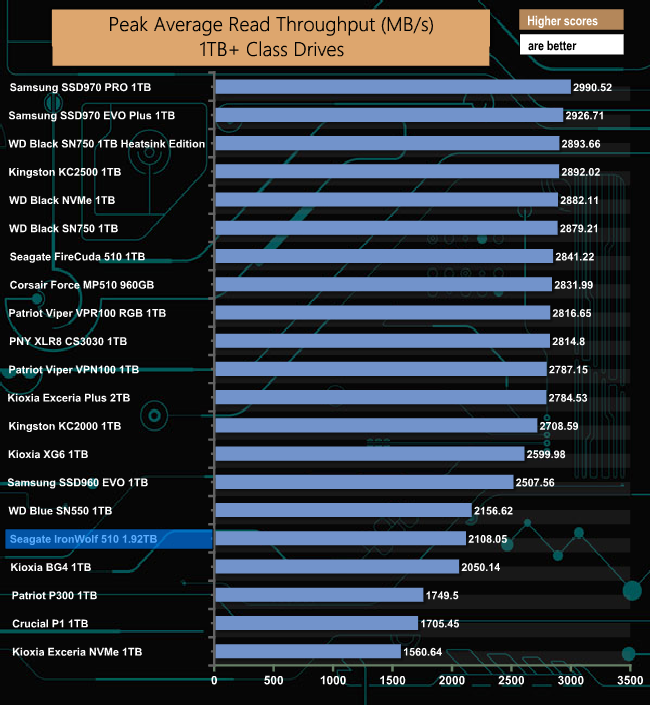
In our read throughput test, the IronWolf 510 peaked right at the end of the test run at 2,108MB/s.
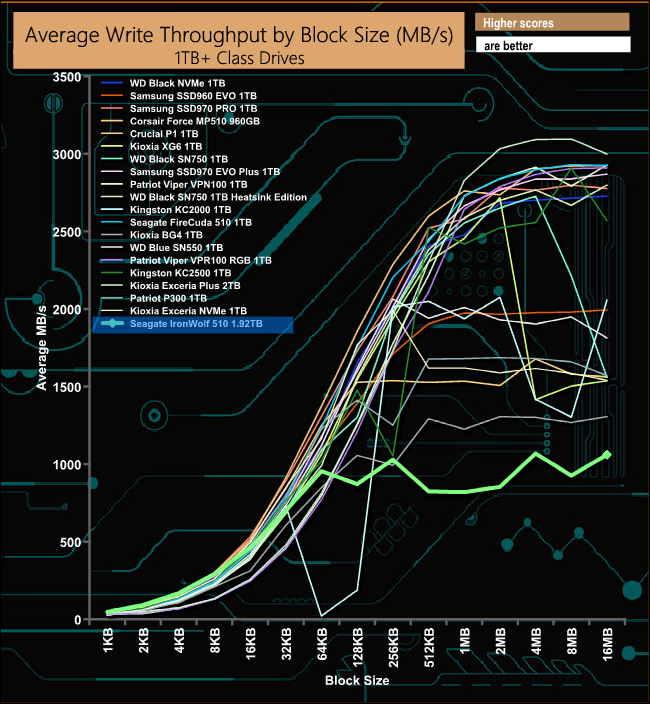
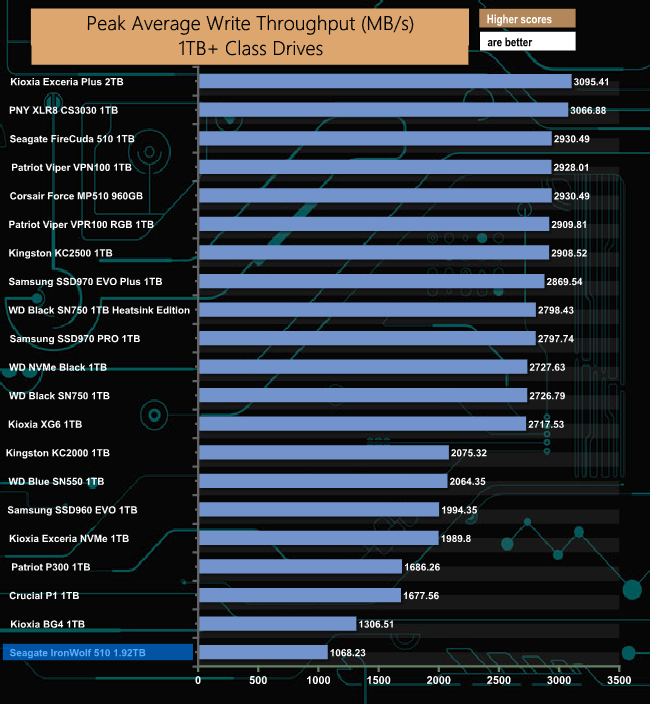
In the write throughput test, the IronWolf 510 peaked at the 4MB block mark at 1,068MB/s.
The PCMark 10 Full System Drive Benchmark uses a wide-ranging set of real-world traces from popular applications and common tasks to fully test the performance of the fastest modern drives. The benchmark is designed to measure the performance of fast system drives using the SATA bus at the low end and devices connected via PCI Express at the high end.
The goal of the benchmark is to show meaningful real-world performance differences between fast storage technologies such as SATA, NVMe, and Intel’s Optane. The Full System Drive Benchmark uses 23 traces, running 3 passes with each trace. It typically takes an hour to run.
Traces used:
Booting Windows 10.
Adobe Acrobat – starting the application until usable.
Adobe Illustrator – starting the application until usable Adobe Premiere Pro – starting the application until usable.
Adobe Photoshop – starting the application until usable.
Battlefield V – starting the game until the main menu.
Call of Duty Black Ops 4 – starting the game until the main menu.
Overwatch – starting the game until main menu.
Using Adobe After Effects.
Using Microsoft Excel.
Using Adobe Illustrator.
Using Adobe InDesign.
Using Microsoft PowerPoint.
Using Adobe Photoshop (heavy use).
Using Adobe Photoshop (light use).
cp1 Copying 4 ISO image files, 20 GB in total, from a secondary drive to the target drive (write test).
cp2 Making a copy of the ISO files (read-write test).
cp3 Copying the ISO to a secondary drive (read test).
cps1Copying 339 JPEG files, 2.37 GB in total, to the target drive (write test).
cps2 Making a copy of the JPEG files (read-write test).
cps3 Copying the JPEG files to another drive (read test).
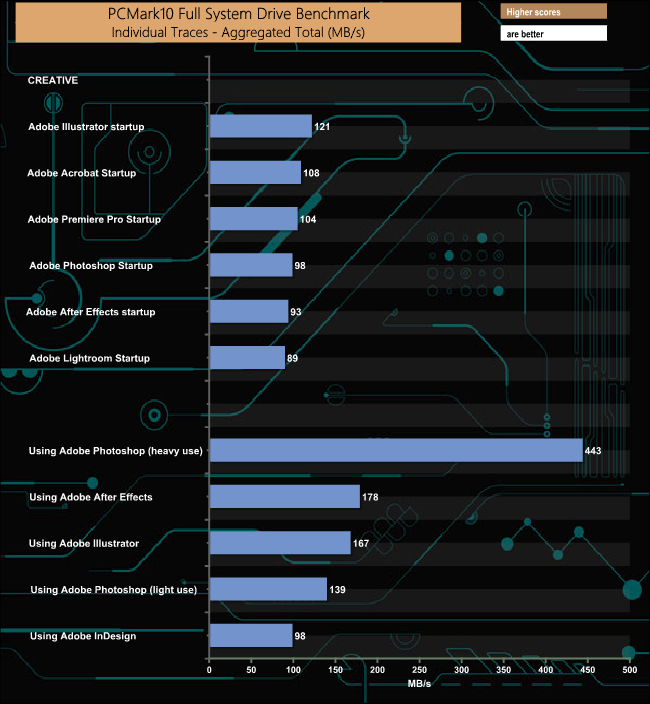
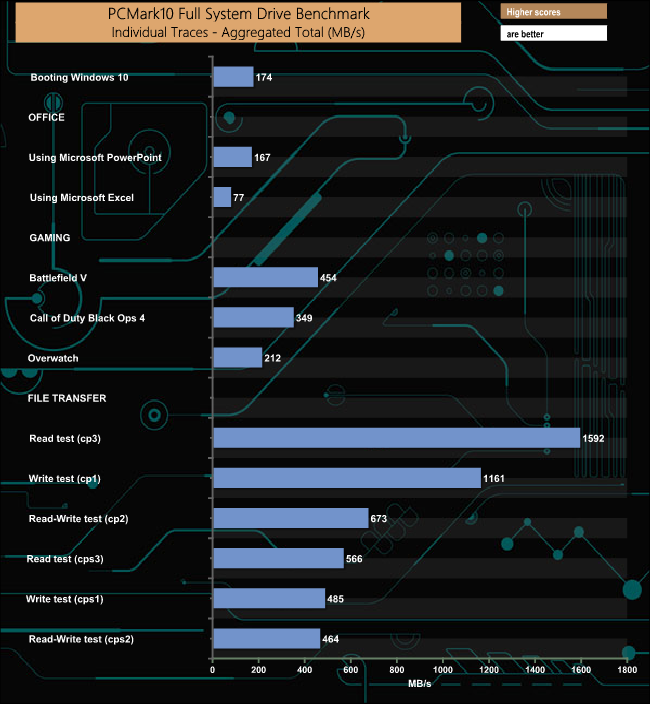
The best performance in the creative group of tests was the 443MB/s from the Adobe Photoshop heavy use test trace, while the IronWolf 510 also showed strong performance in the Battlefield V (454MB/s) game test, as well as the cp3 read (1592MB/s) file transfer test. The latter result is hardly a surprise as it is a drive focussed on read performance.
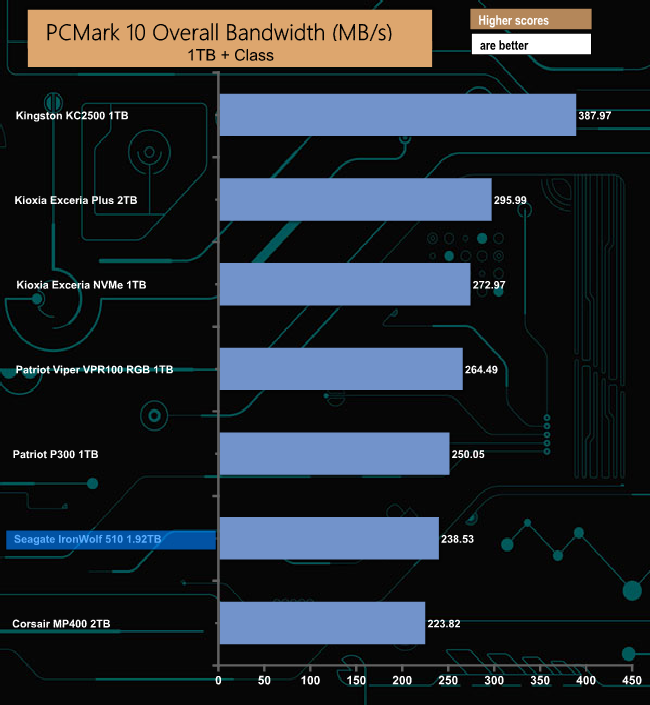
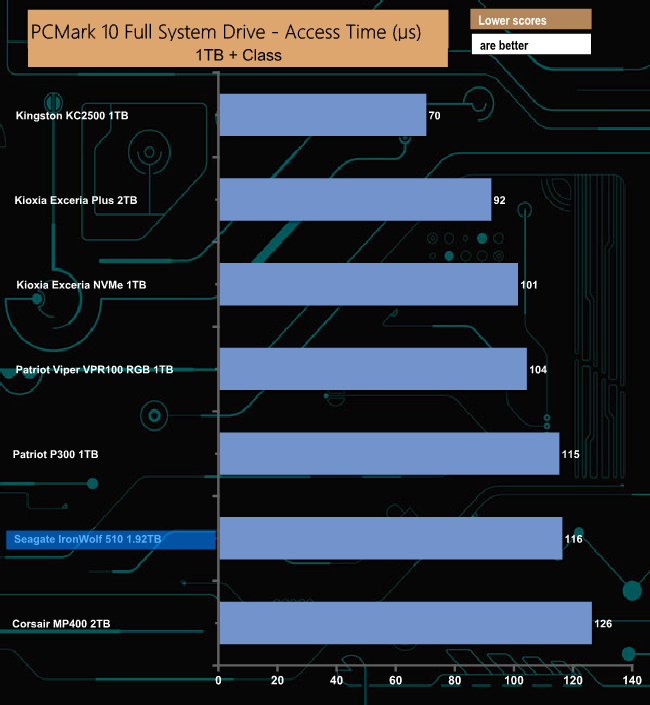
We've only just started to use the PCMark 10 Full System Drive Benchmark so the result tables are a little light on tested drives. Of the drives we have tested, the IronWolf 510 sits in-between the Patriot P300 and Corsair's MP400 drive.
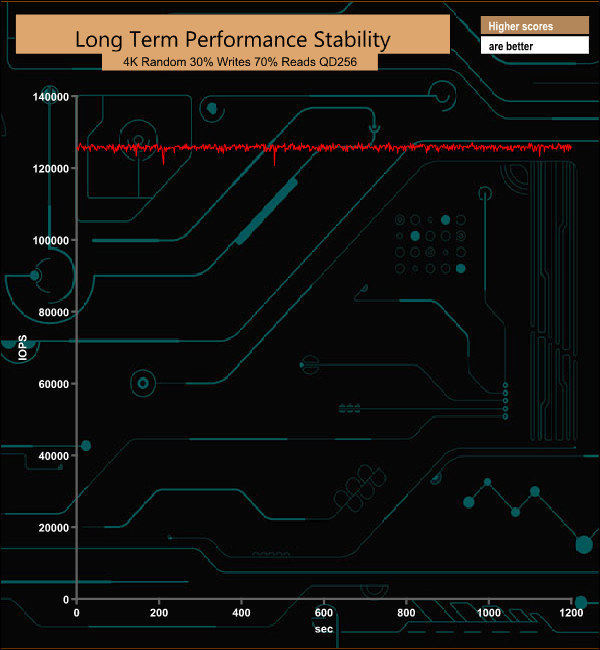
For the long term performance stability test, we set the drive up to run a 20-minute 4K random test with a 30% write, 70% read split, at a Queue Depth of 256 over the entire disk. The 1.92TB IronWolf 510 averaged 125,786 IOPS for the test with a performance stability of 98% which is enterprise-level stability.
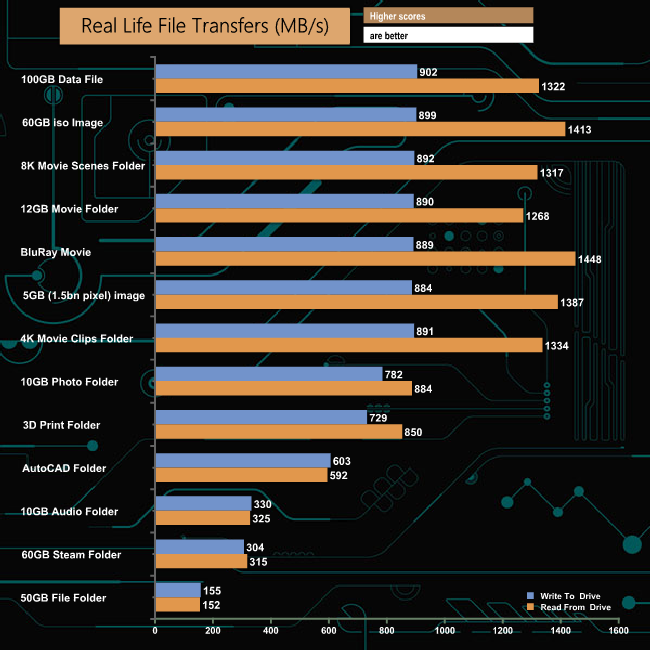
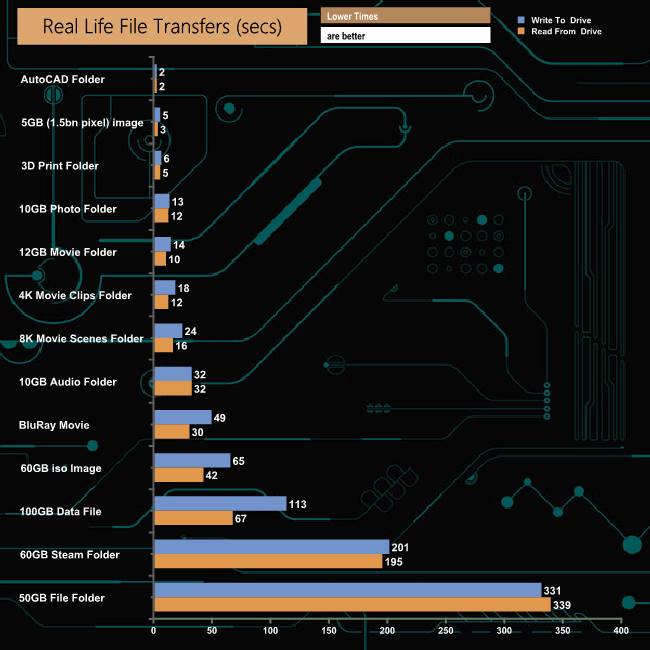
To test real-life performance of a drive we use a mix of folder/file types and by using the FastCopy utility (which gives a time as well as MB/s result) we record the performance of drive reading from & writing to a 256GB Samsung SSD850 PRO.
We use the following folder/file types:
- 100GB data file.
- 60GB iso image.
- 60GB Steam folder – 29,521 files.
- 50GB File folder – 28,523 files.
- 12GB Movie folder – (15 files – 8 @ .MKV, 4 @ .MOV, 3 @ MP4).
- 10GB Photo folder – (304 files – 171 @ .RAW, 105 @ JPG, 21 @ .CR2, 5 @ .DNG).
- 10GB Audio folder – (1,483 files – 1479 @ MP3, 4 @ .FLAC files).
- 5GB (1.5bn pixel) photo.
- BluRay Movie – 42GB.
- 21GB 8K Movie demos – (11 demos)
- 16GB 4K Raw Movie Clips – (9 MP4V files).
- 4.25GB 3D Printer File Folder – (166 files – 105 @ .STL, 38 @ .FBX, 11 @ .blend, 5 @ .lwo, 4 @ .OBJ, 3@ .3ds).
- 1.5GB AutoCAD File Folder (80 files – 60 @ .DWG and 20 @.DXF).
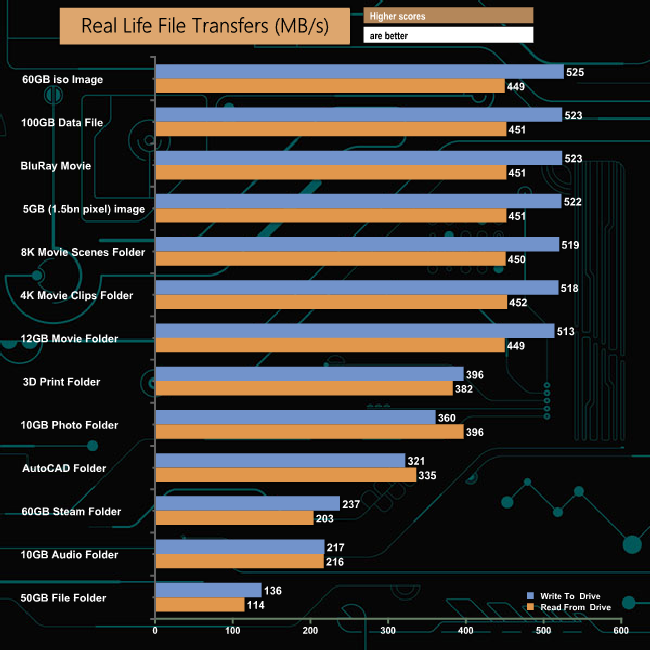
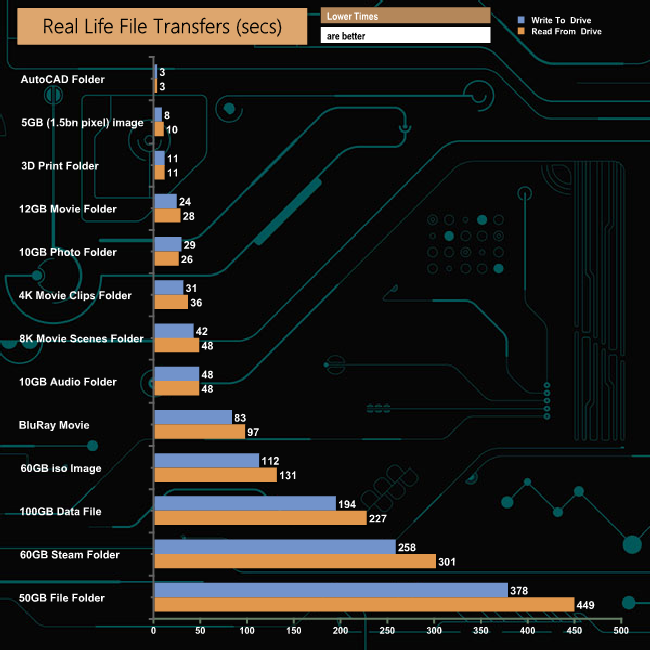
When it came to our real-life file transfer tests, the IronWolf 510 displayed very good consistency for both reads and writes when dealing with larger file sizes.
To get a measure of how much faster PCIe NVMe drives are than standard SATA SSD's we use the same files but transfer to and from a 512GB Toshiba OCZ RD400:
Transferring the files to and from another NVMe drive resulted in, as you might expect, huge improvements in file transfer speeds, especially when dealing with the larger file sizes.
Seagate's IronWolf 510 has been designed to meet the needs of SSD caching duties in NAS devices. In the past, that meant losing one or more of the main storage bays to allow SSD drives to be fitted to handle the caching. More recently some NAS manufacturers have taken to adding M.2 slots to the motherboards of a NAS.
At first, these slots only supported SATA drives but now support the NVMe architecture, and it's to these NAS units that the IronWolf 510 is aimed at. If your NAS doesn't come with onboard M.2 slots but does support add-in SSD NVMe expansion cards via a PCIe slot, then the drive should work in these too.
The IronWolf 510 range is made up of four capacities; a 240GB entry model, 480GB, 960GB and finally the flagship 1.92TB drive. At the heart of the drive is a Phison PS5012-E12DC controller (designed for enterprise) which looks after Kioxia BiCS3 64-layer 3D TLC NAND.
Seagate rate the Sequential read/write performance of the 1.92TB IronWolf as up to 3,150MB/s and 850MB/s respectively. When tested with the ATTO benchmark, our review sample produced figures of 3200MB/s and 923MB/s for read and writes, respectively. It was a similar story with our own Sequential tests, with figures of 3463.72MB/s for reads and 1087.18MB/s for writes.
4K random read performance is stated as up to 290,000 IOPS (QD32 8 threads) while writes are up to 27,000 IOPS (QD32 8 threads). Using our 4-threaded tests we saw a peak figure of 277,824 IOPS for reads and 164,129 IOPS for writes.
If you are going to use an SSD for cache duties in a 24×7 multi-user NAS environment, it needs some serious endurance and the IronWolf 510 certainly has that. The drive supports one drive write per day (DWPD) for the duration of the 5-year warranty, has an MTBF of 1.8M hours and a huge TBW rating of 3,500TB. The drive also supports Seagate's IronWolf Health Management technology (on compatible NAS devices) and comes with 2-year of data rescue services included.
We found the 1.92TB version of the IronWolf 510 for £363.60 (inc VAT) on Span.com HERE.
Discuss on our Facebook page HERE.
Pros
- Fast read speeds.
- Endurance.
- Data rescue service.
Cons
- Pricey.
KitGuru says: Designed for use as a 24/7 cache drive in NAS devices, the IronWolf 510 offers the very high endurance that its intended environment demands.

Be sure to check out our sponsors store EKWB here