 KitGuru KitGuru.net – Tech News | Hardware News | Hardware Reviews | IOS | Mobile | Gaming | Graphics Cards


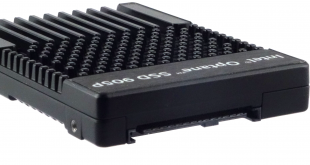
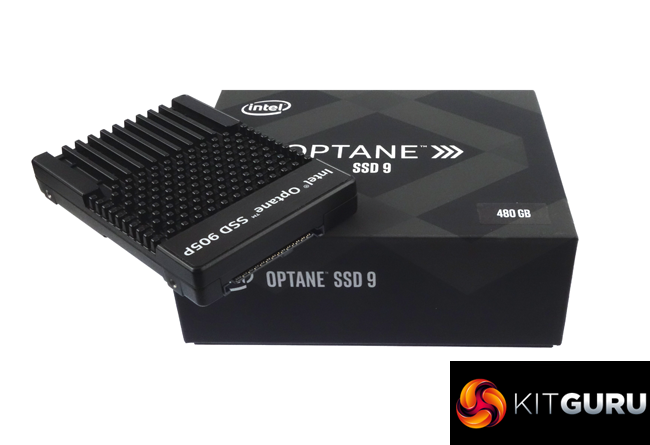
Aimed at the high-end enthusiast/workstation end of the market, Intel's expensive SSD Optane SSD 905P product line promise ultimate performance, incorporating Intel's 3D XPoint memory.
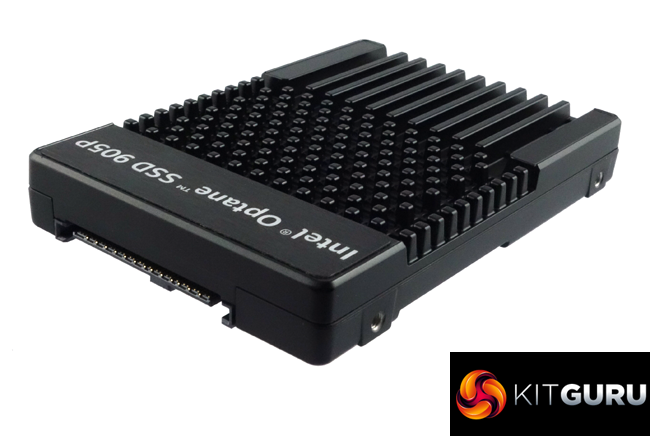
The Intel Optane SSD 905P ships in two form factors with three capacities. The U.2 15mm form factor line is made up of a 480GB (the drive we are reviewing here), and the recently launched 960GB and 1.5TB models. The other option is for a HHHL (Half Height Half Length) AIC which starts at 960GB, with a 1.5TB option.
At the heart of the Optane SSD 905P is Intel's 7-channel controller which handles the 3D XPoint memory inside the drive.
The official Sequential performance figures for the 480GB drive are up to 2,600MB/s for reads and up to 2,200MB/s for writes. Random performance is stated as up to 575,000 IOPS for reads and 550,000 IOPS for writes. These speeds are the same for all three drives in the range regardless of format.
Power figures for the drive are 3.3W when idle with an active rating of 12.8W.
The quoted endurance for the 480GB model is an astonishing 8.76PB written – yes that is petabytes, not the usual terabytes! To put it another way, you can write 5TB of data daily to the drive for the entire length of Intel's 5-year warranty.
Physical Specifications:
Usable Capacities: 480GB
NAND Components: Intel 3D XPoint
NAND Controller: Intel
Interface: U.2 PCIe NVMe 3.0 x4
Form Factor: 2.5in 15mm
Dimensions: 101mm x 70mm x 15mm
Drive Weight: 140g
Firmware Version: 0325
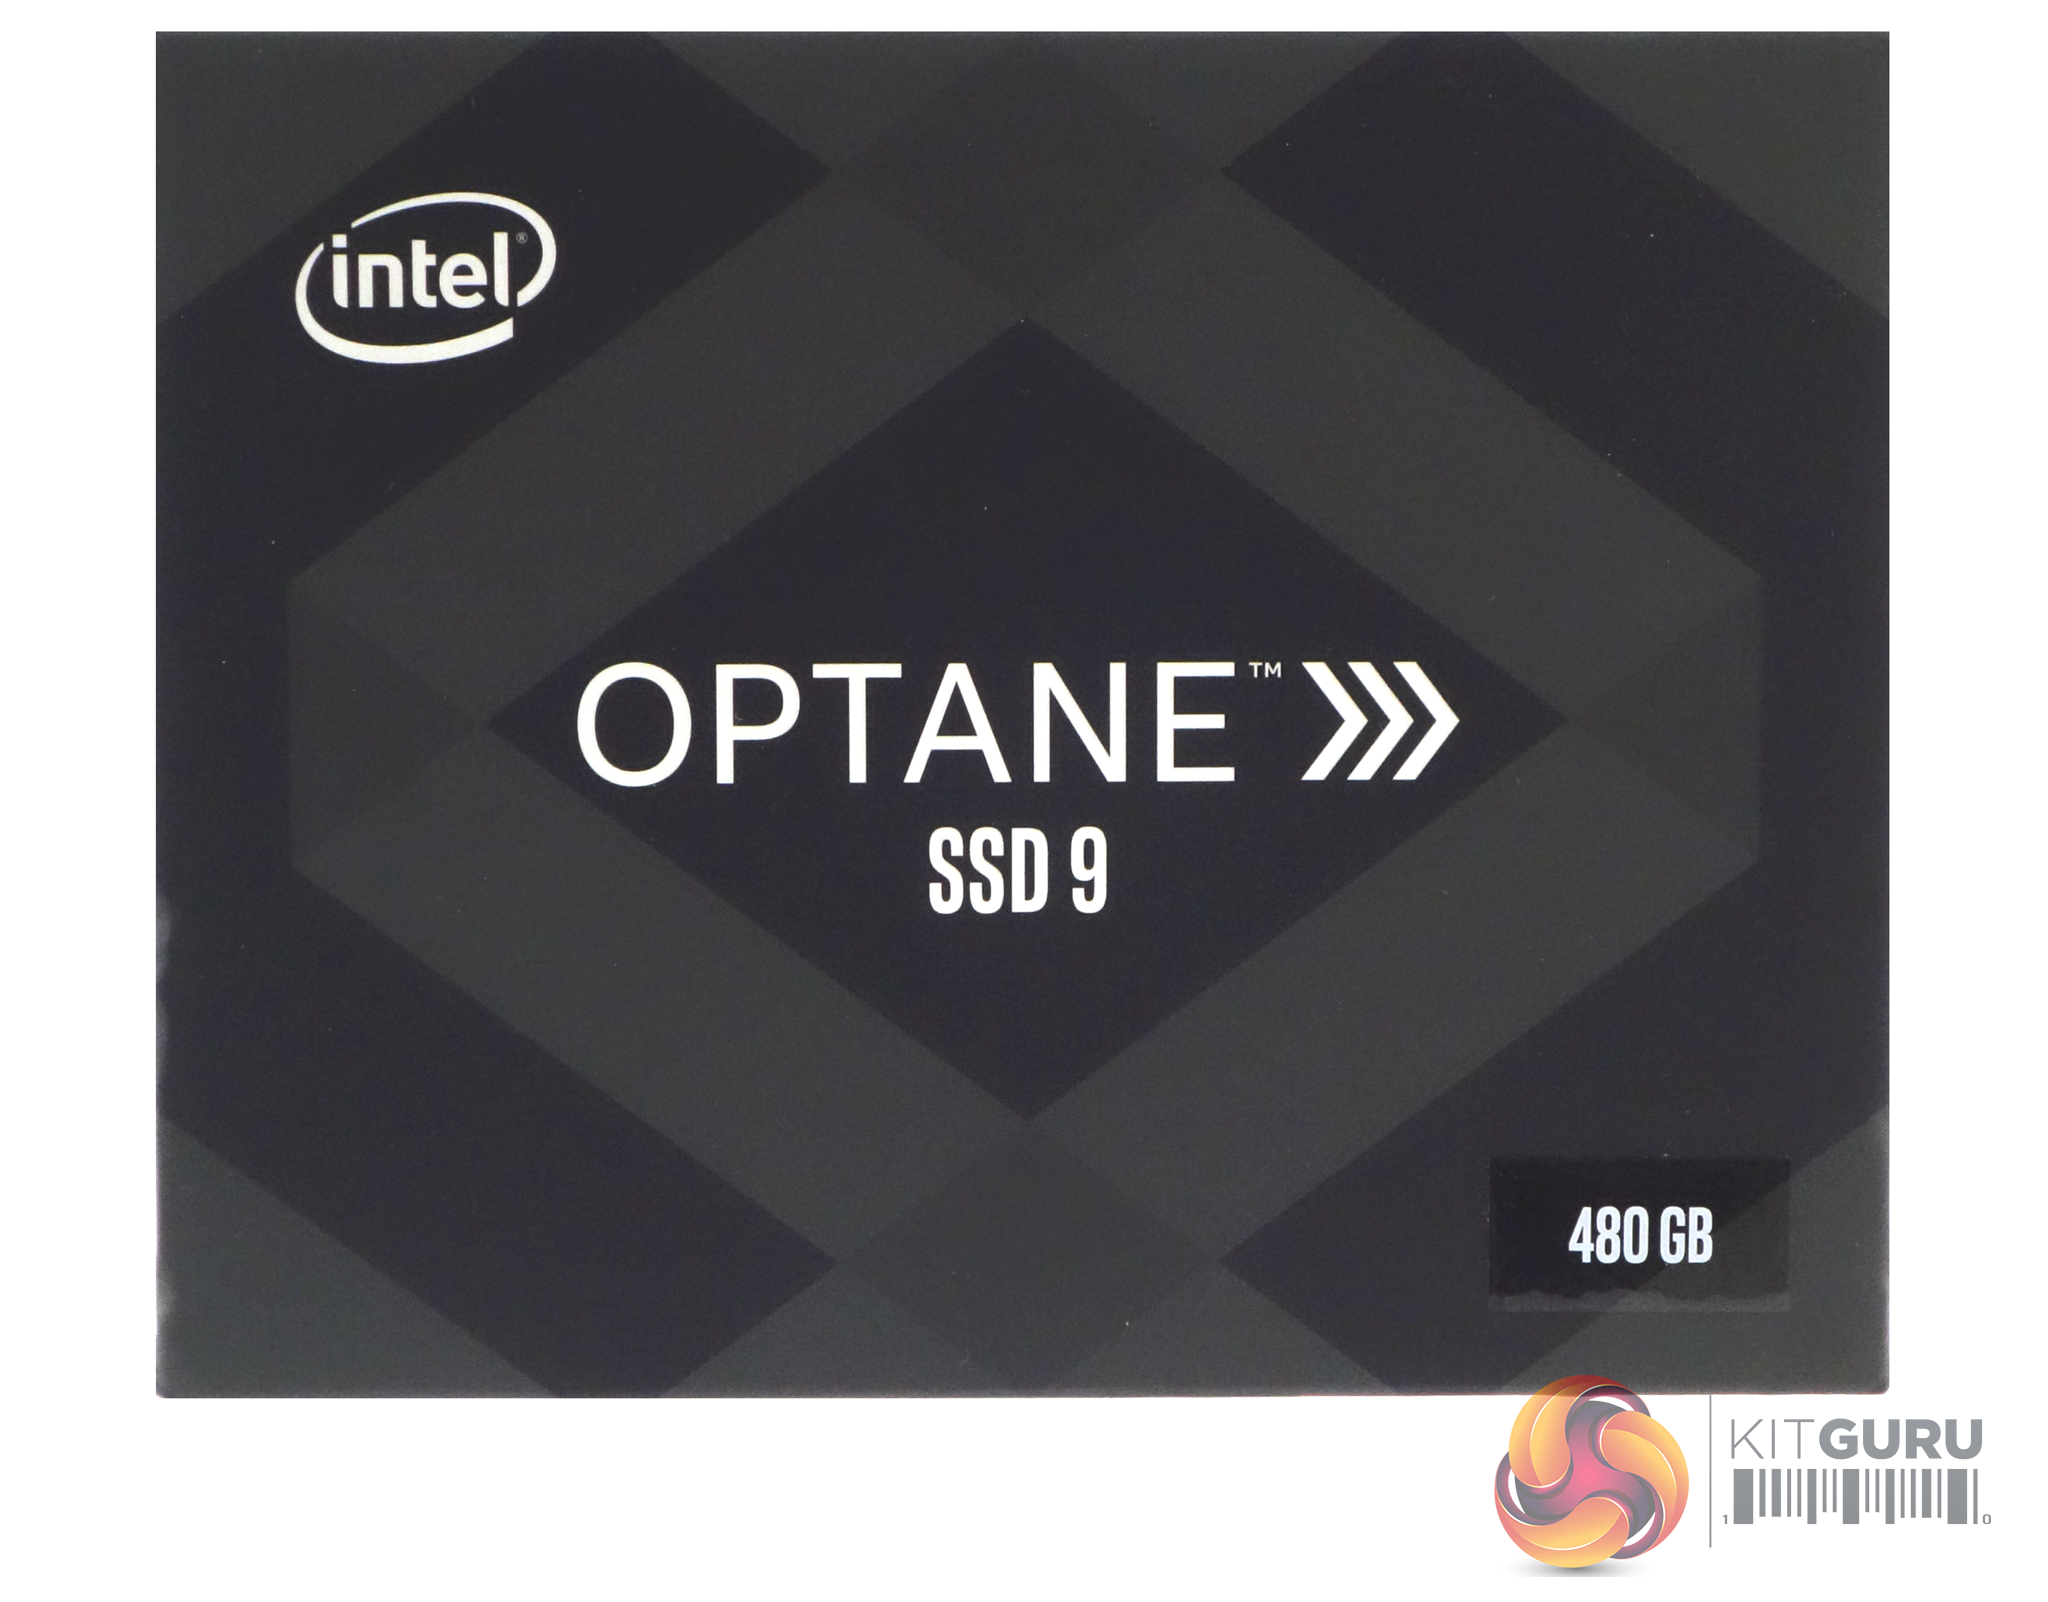
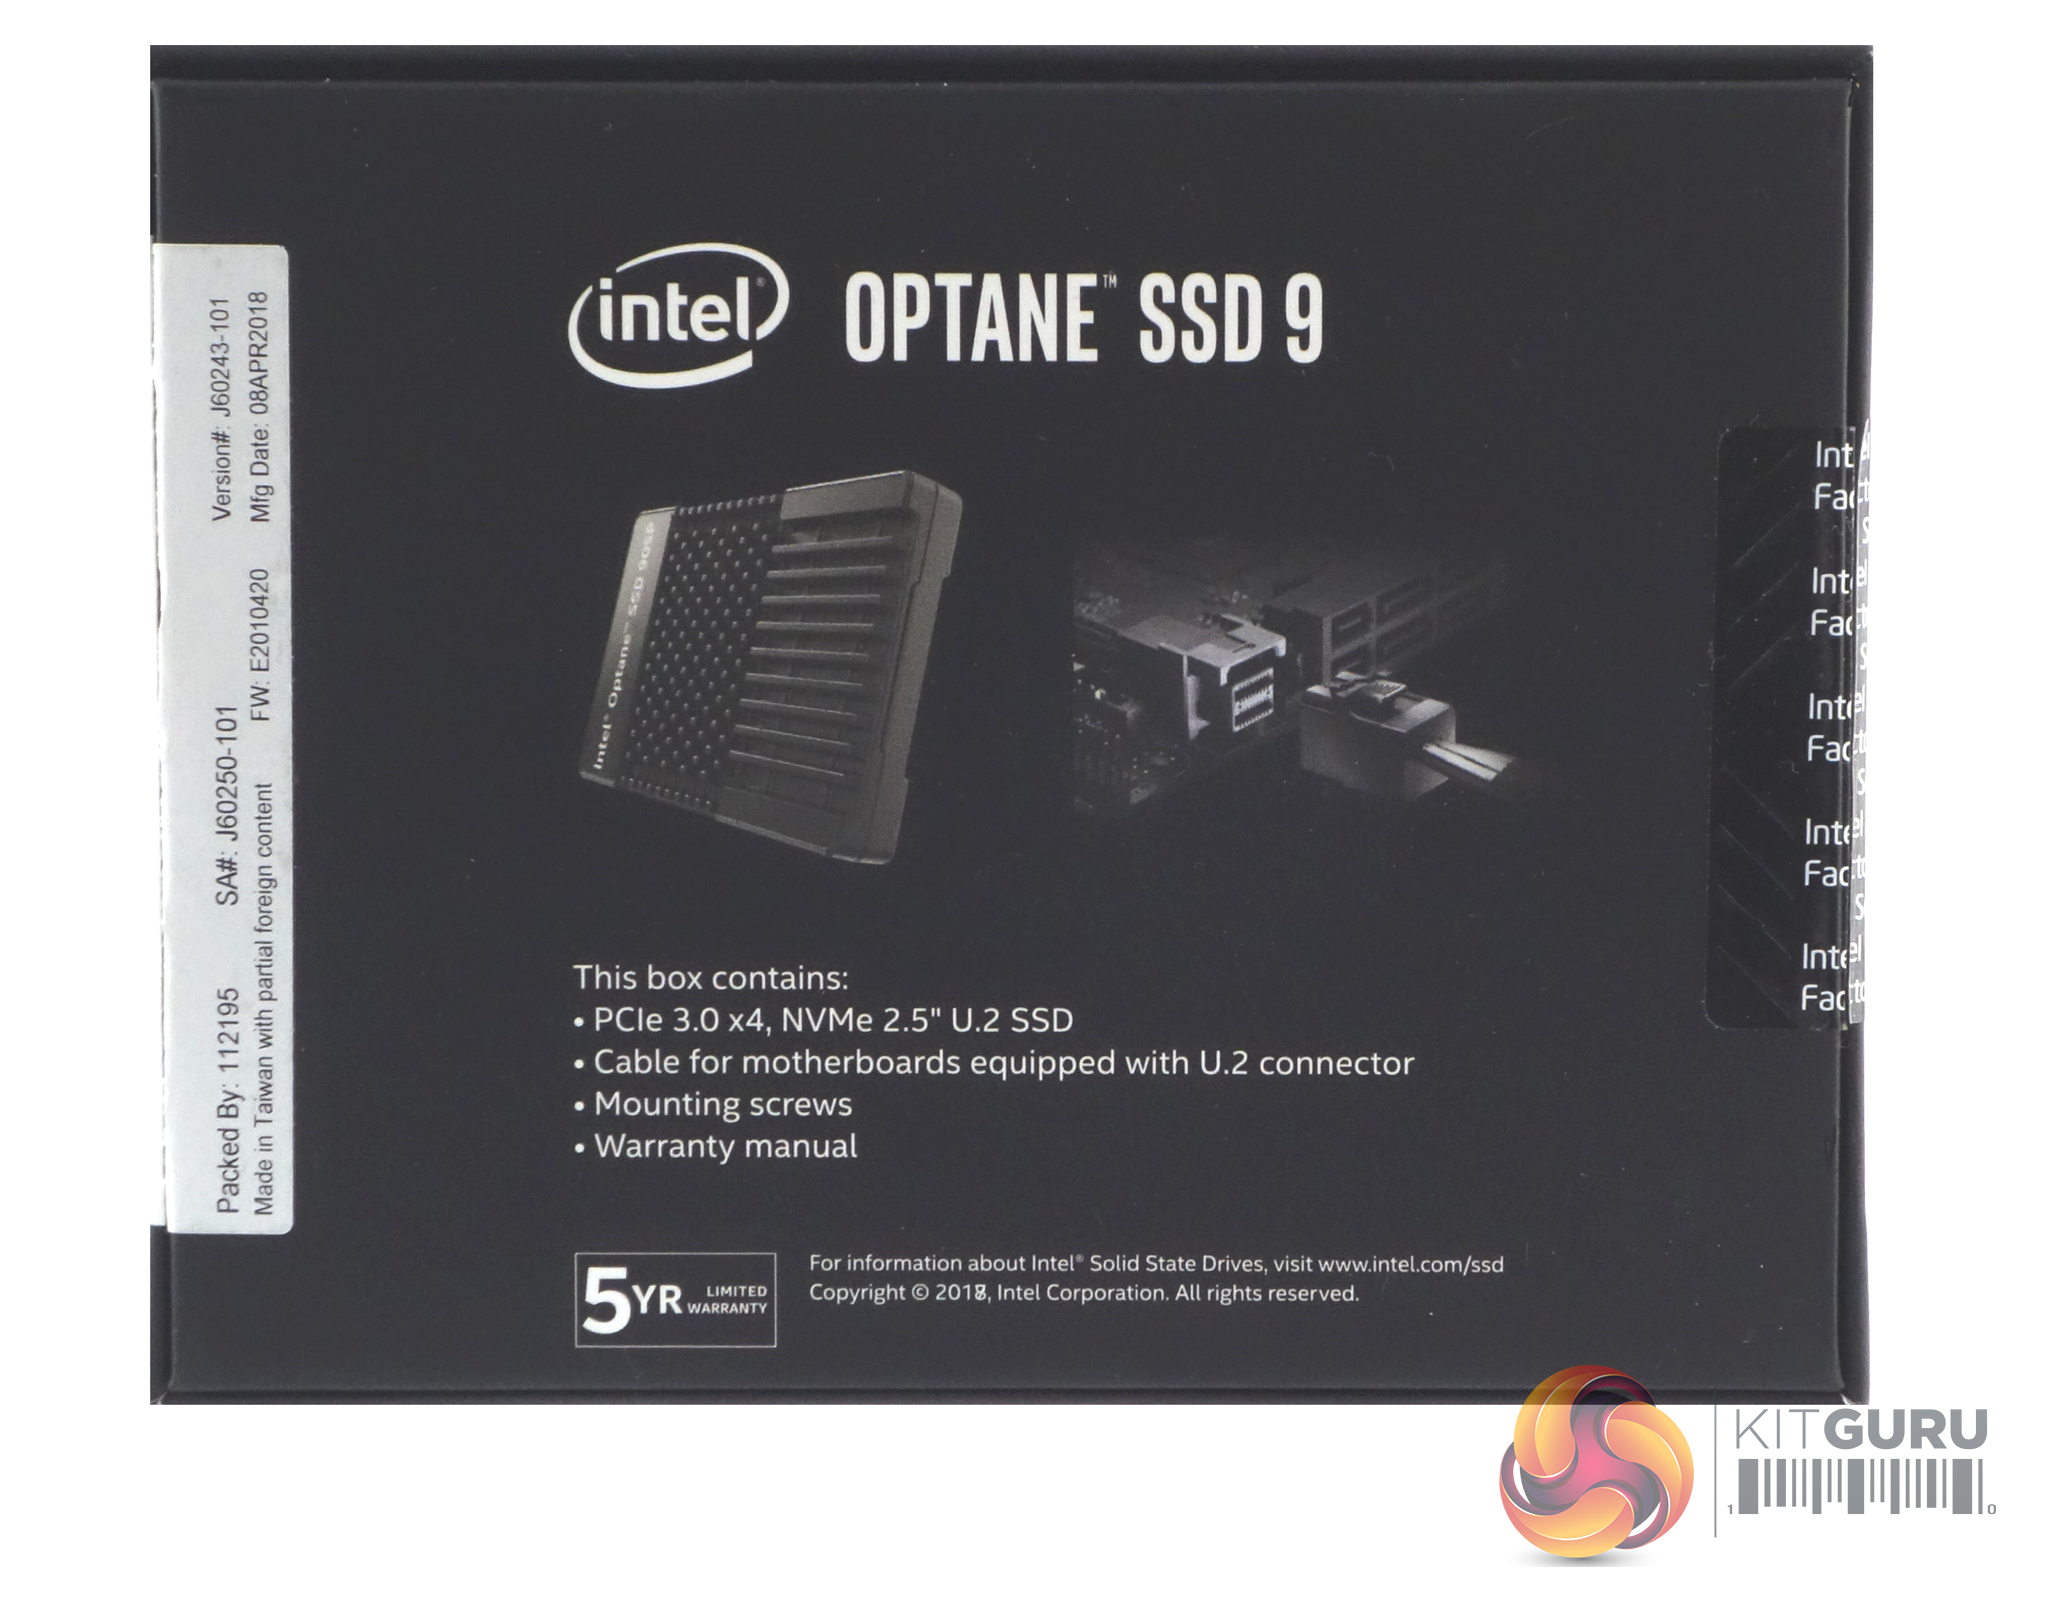
The Intel Optane SSD 905P 480GB ships in a sturdy, stylish box with a label on the front face, showing the capacity. The rear of the box has images of the drive and depicts how the business end of the bundled cable connects to an M.2 adapter (not included).
Under these is a list of what's in the box.
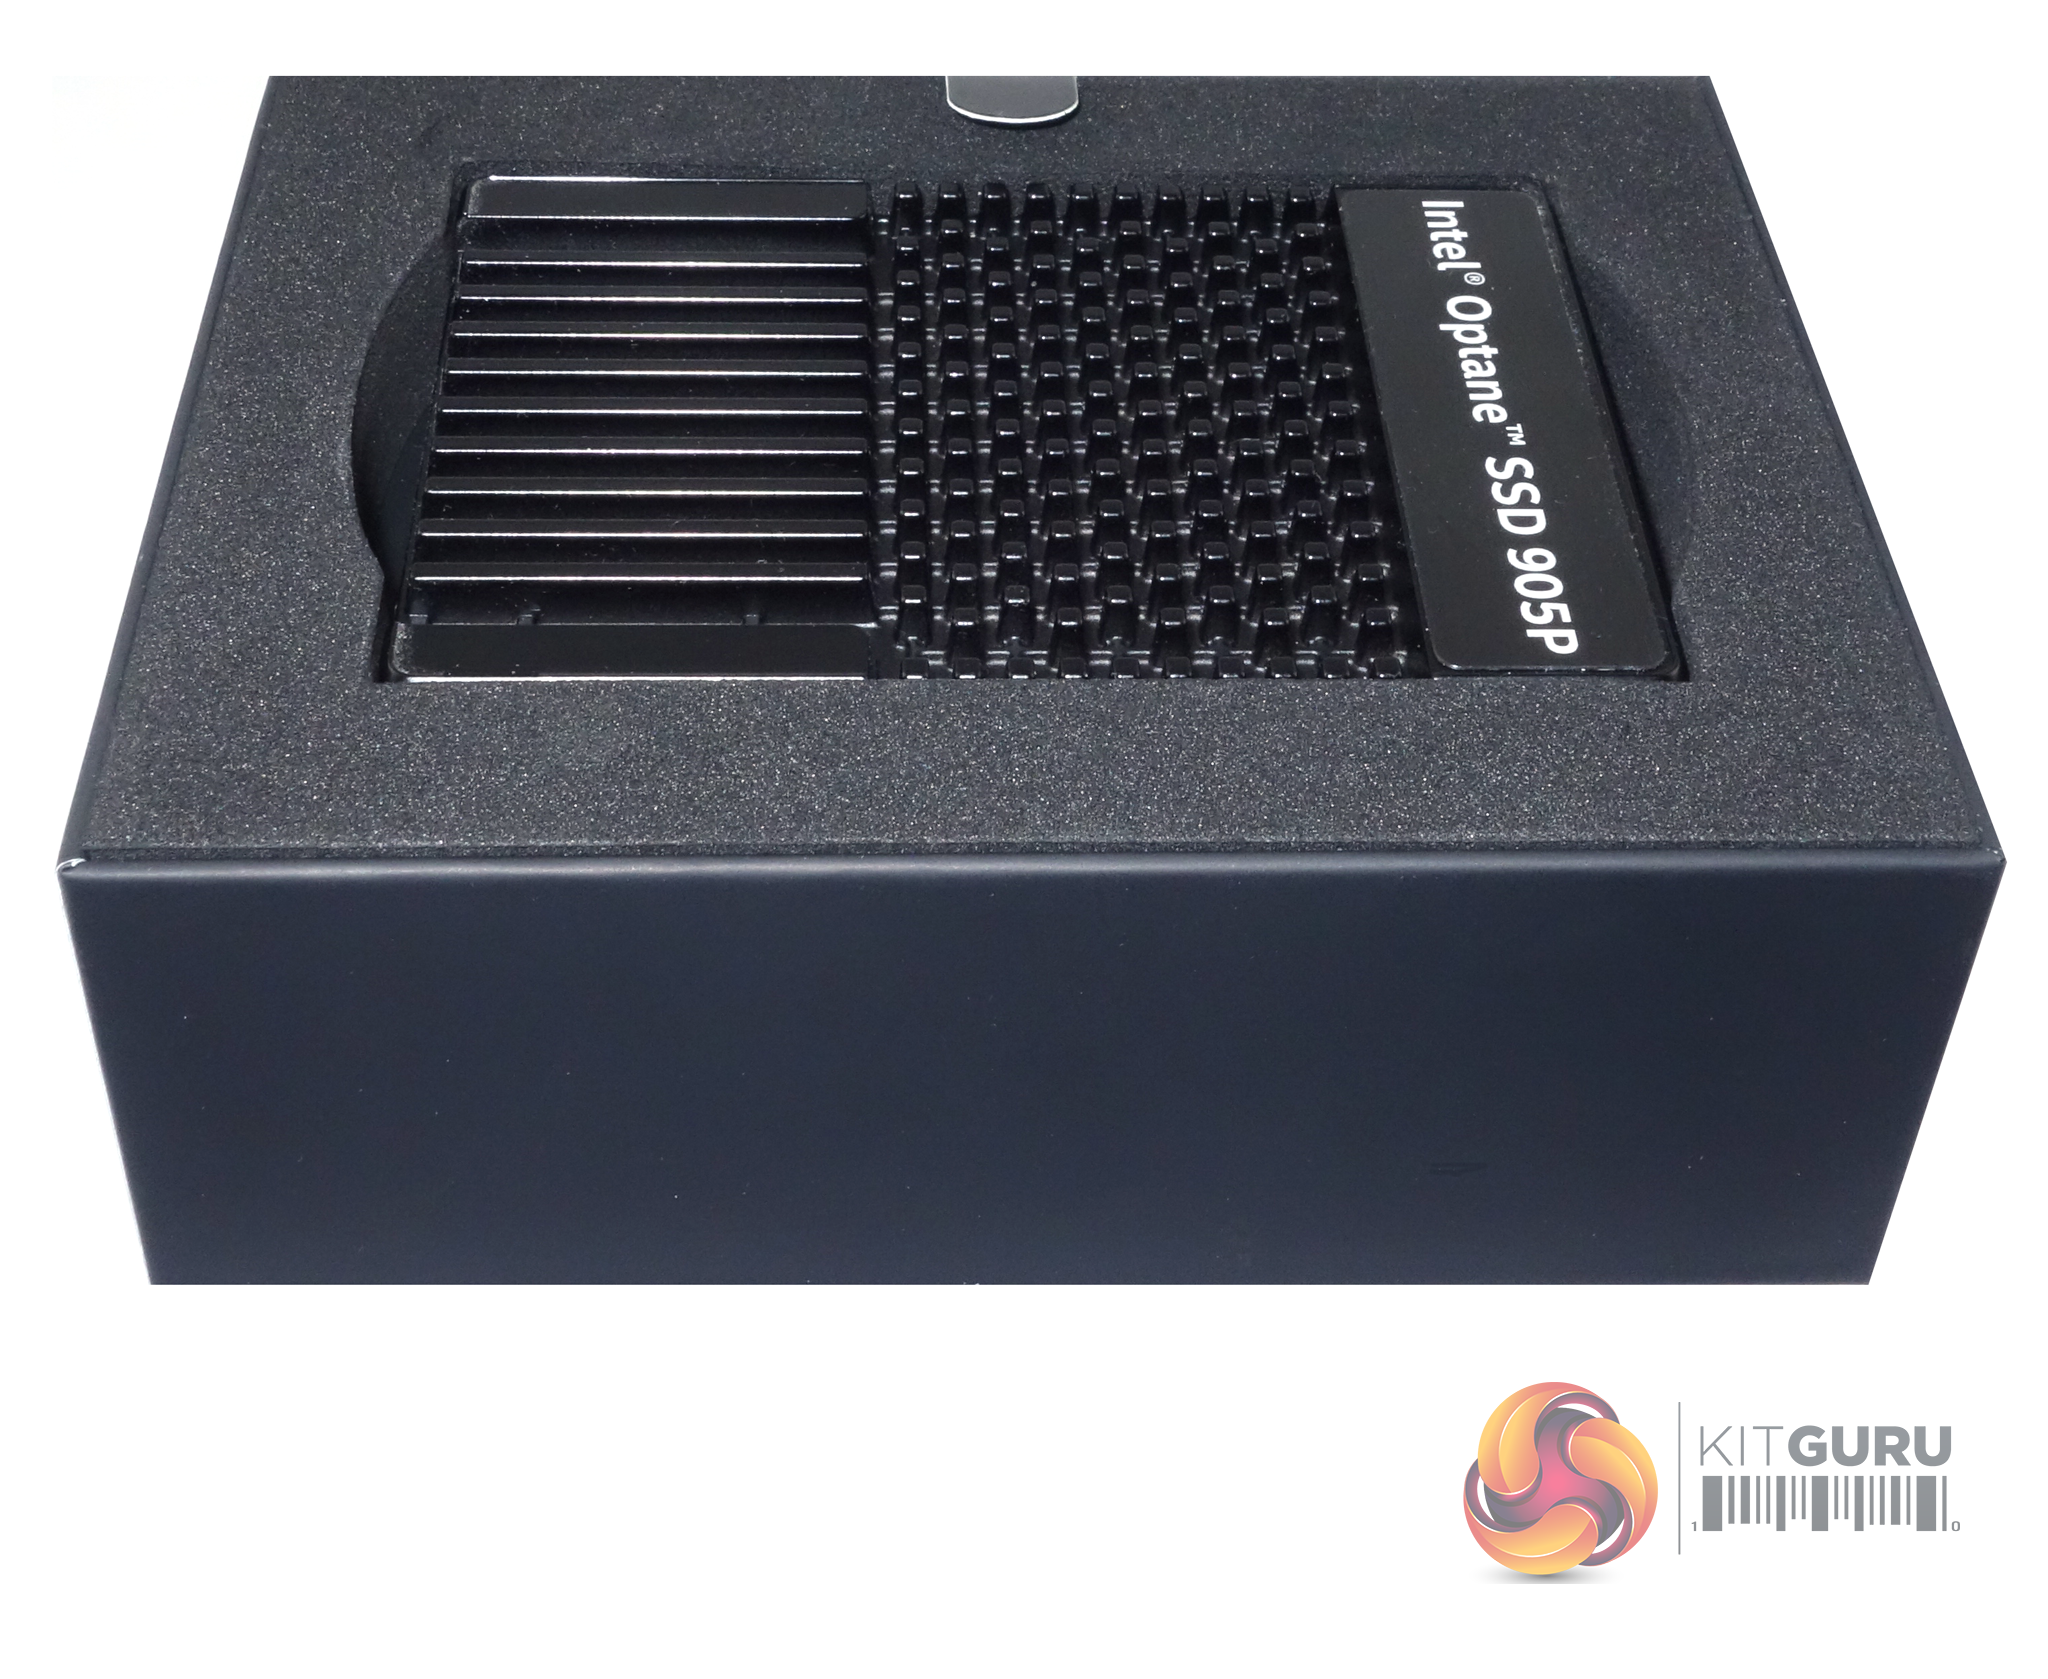
Inside the box there is plenty of protection for the drive as it sits, snugly surrounded by dense foam.
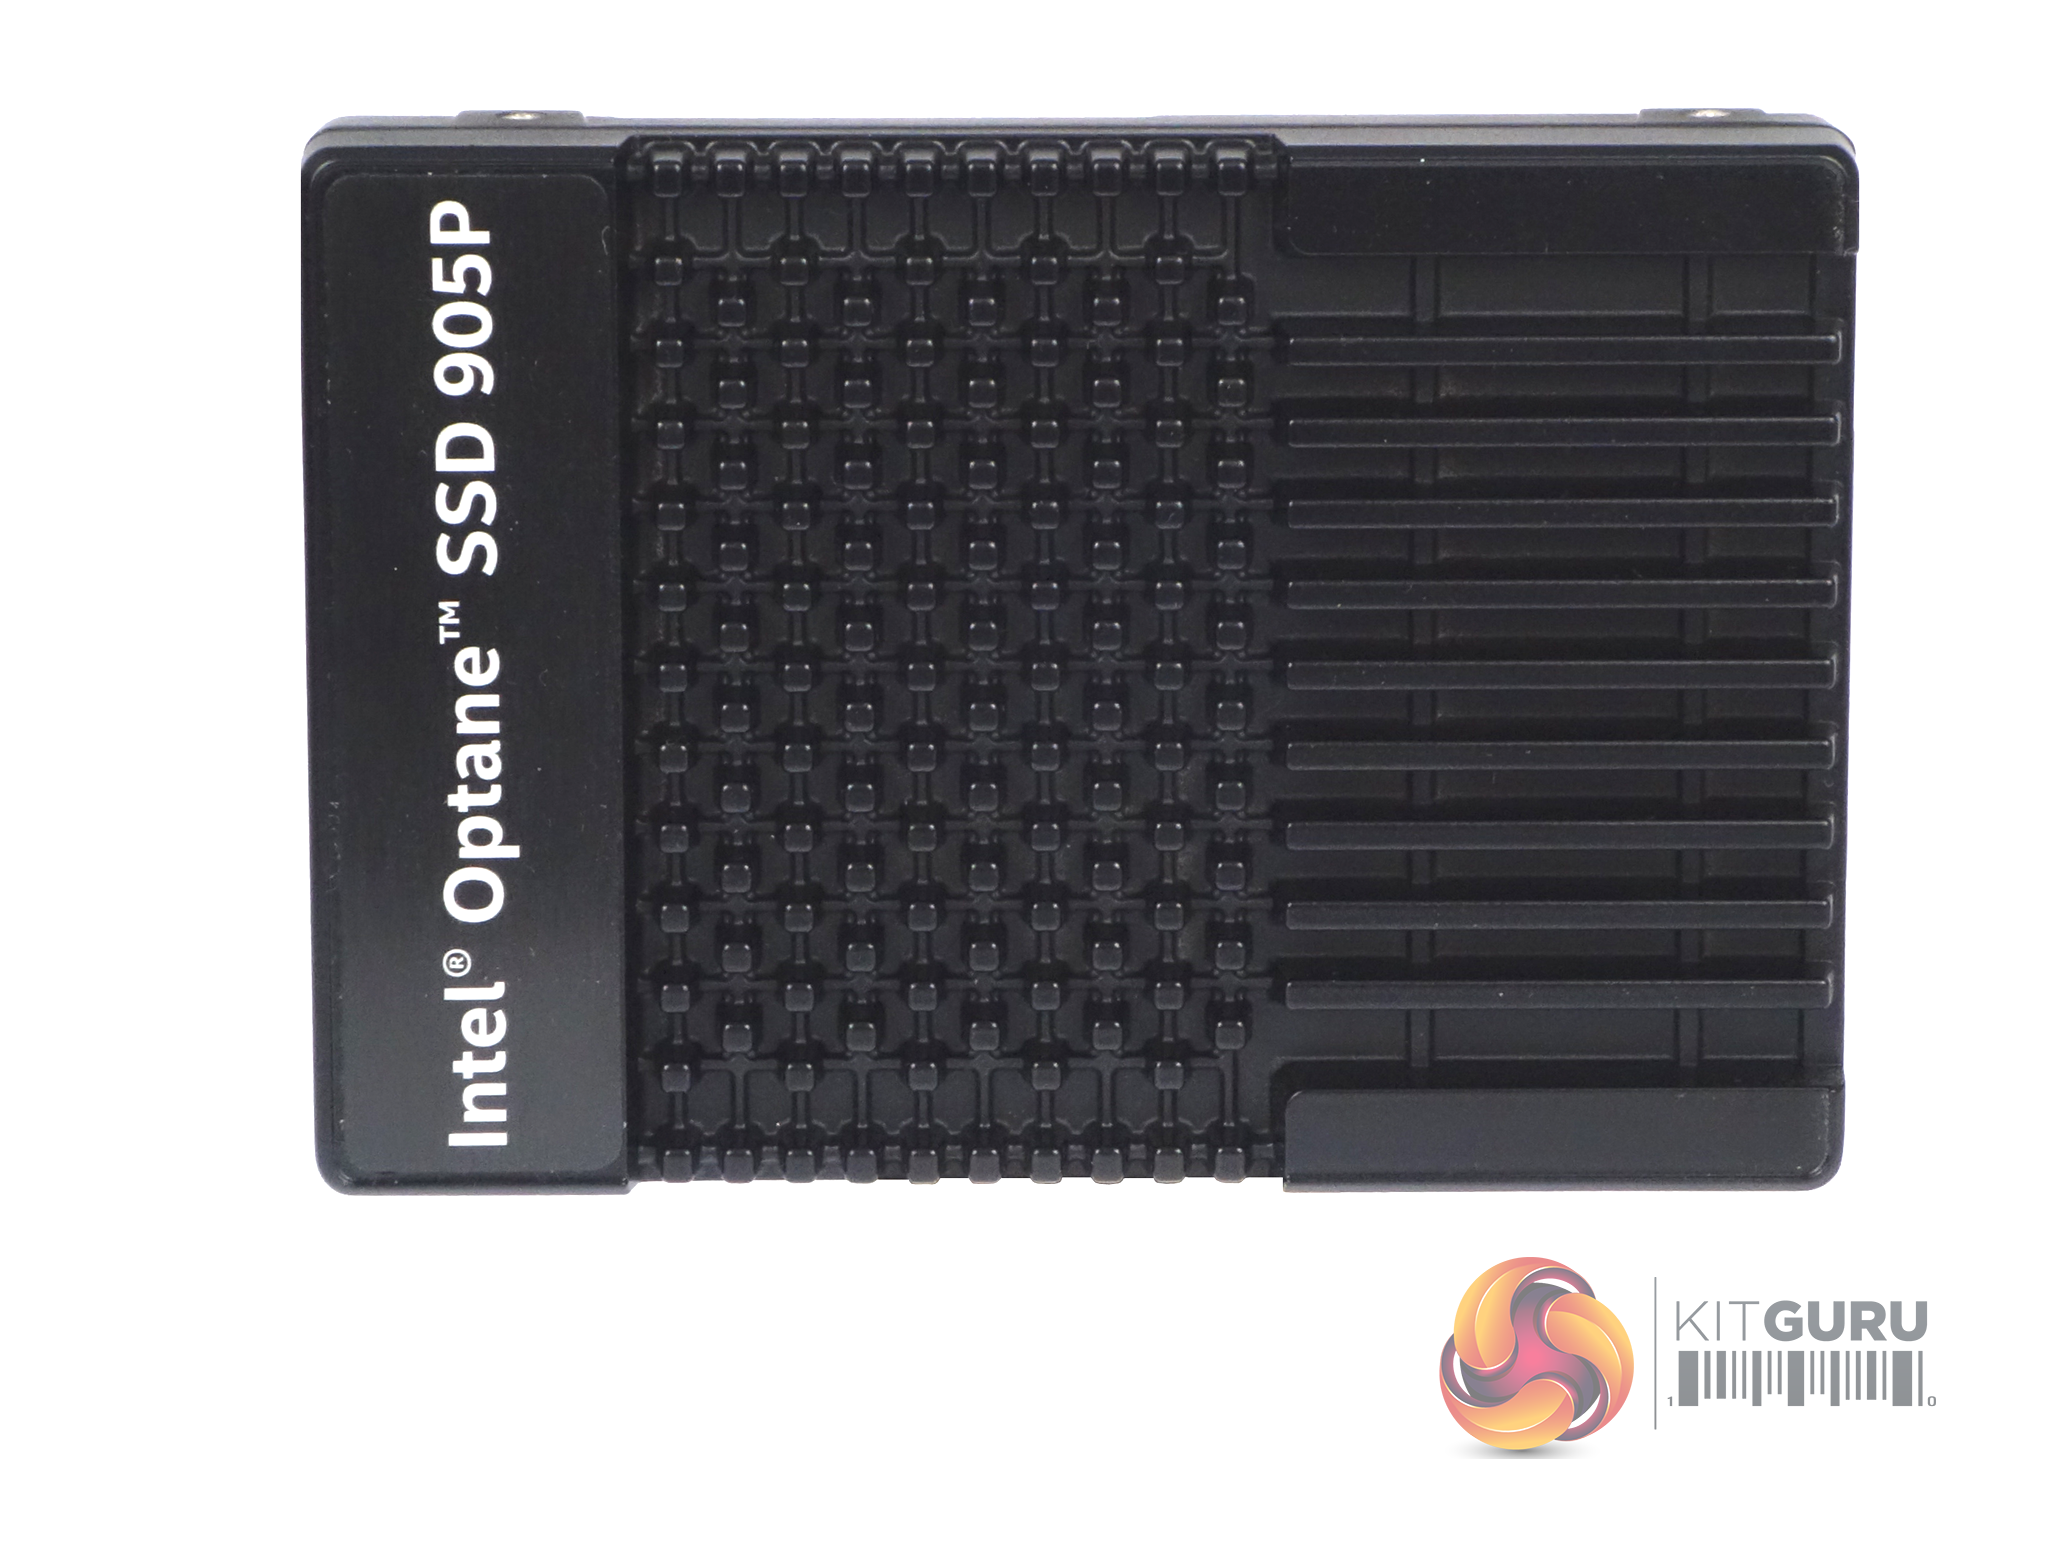
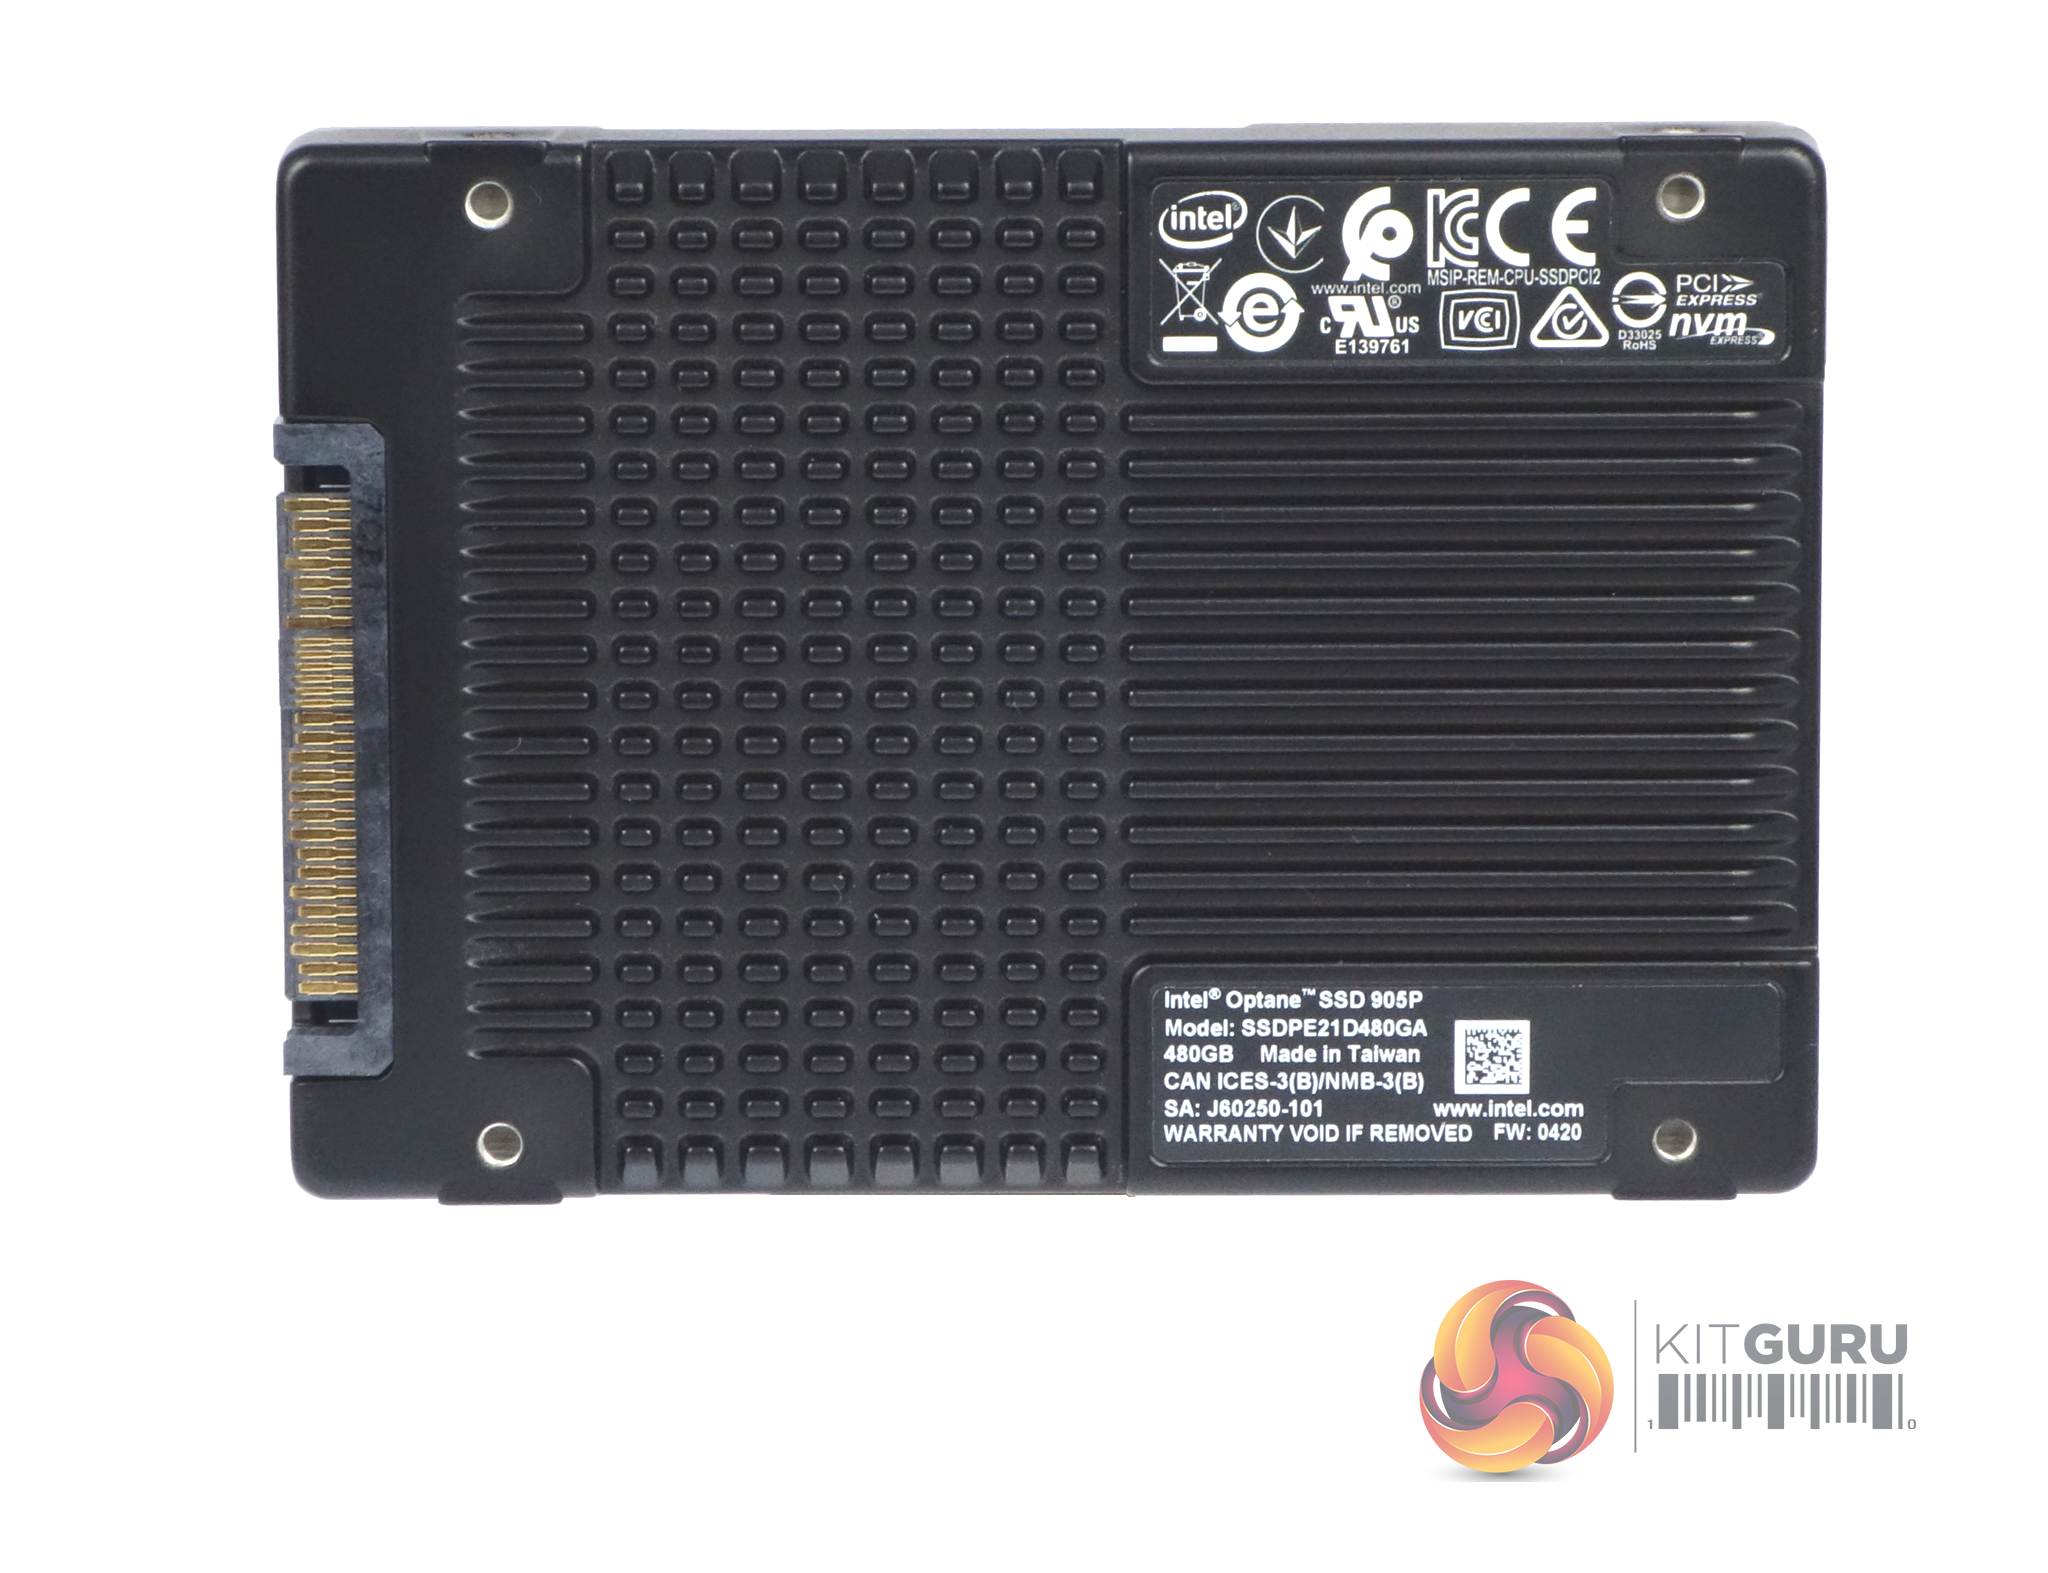
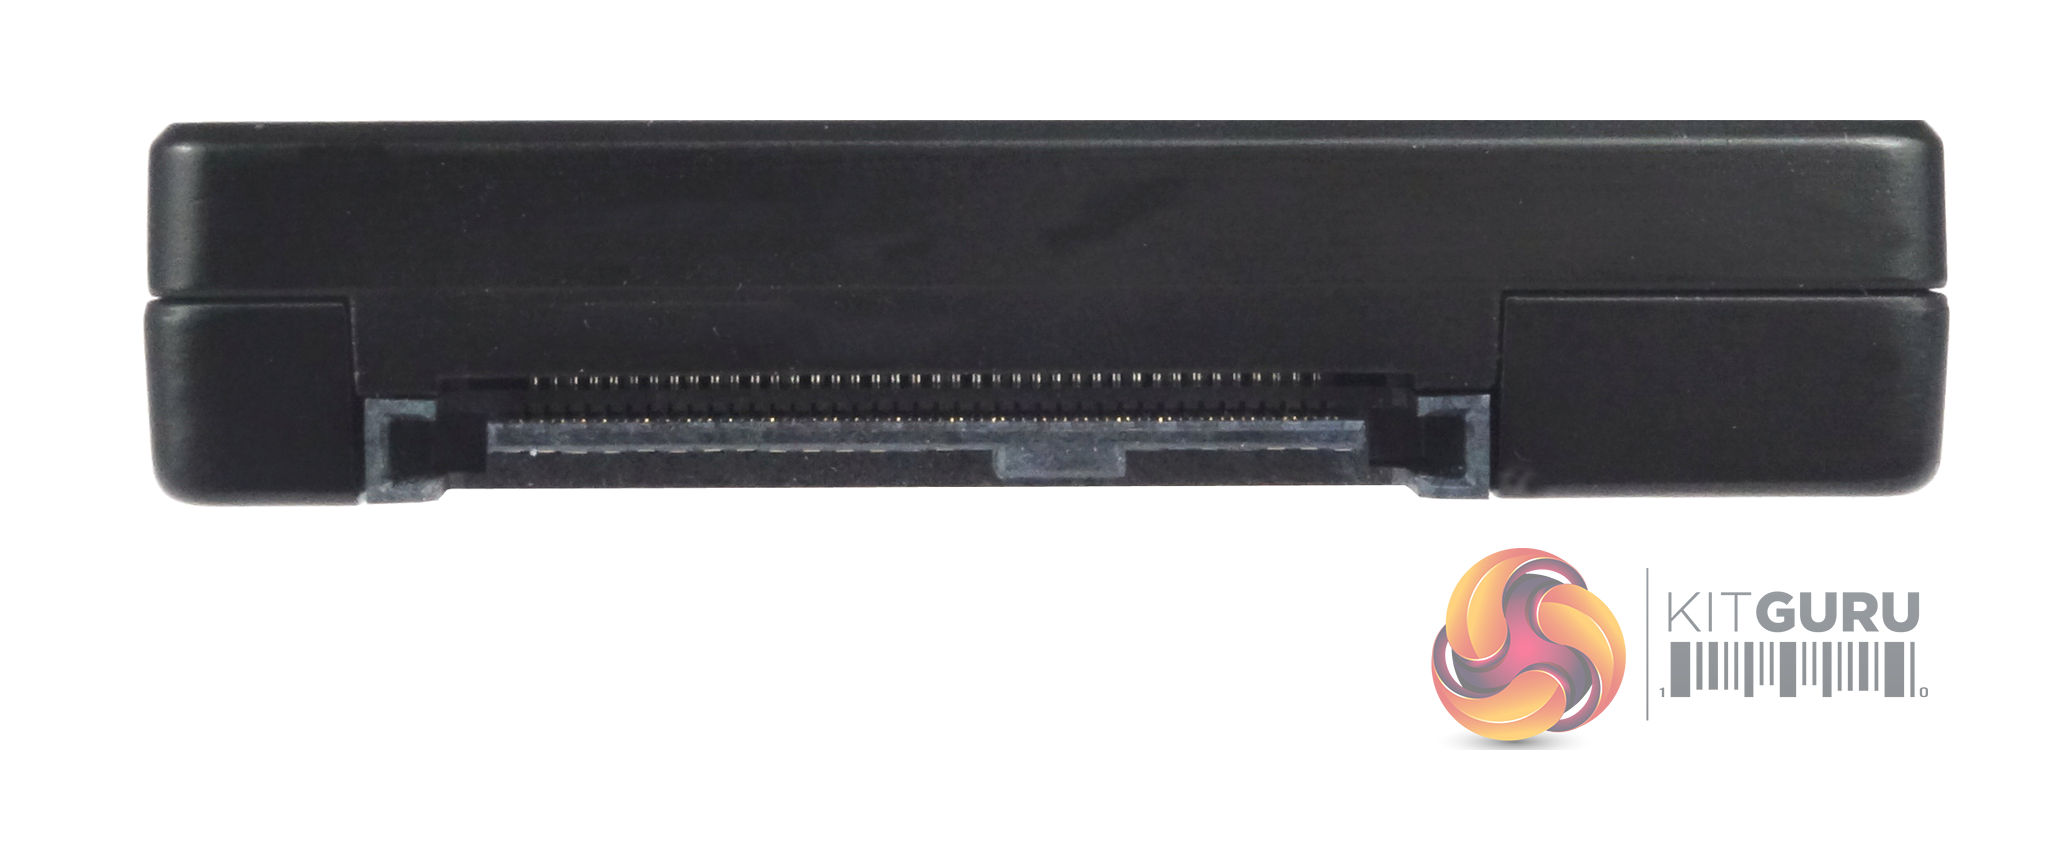
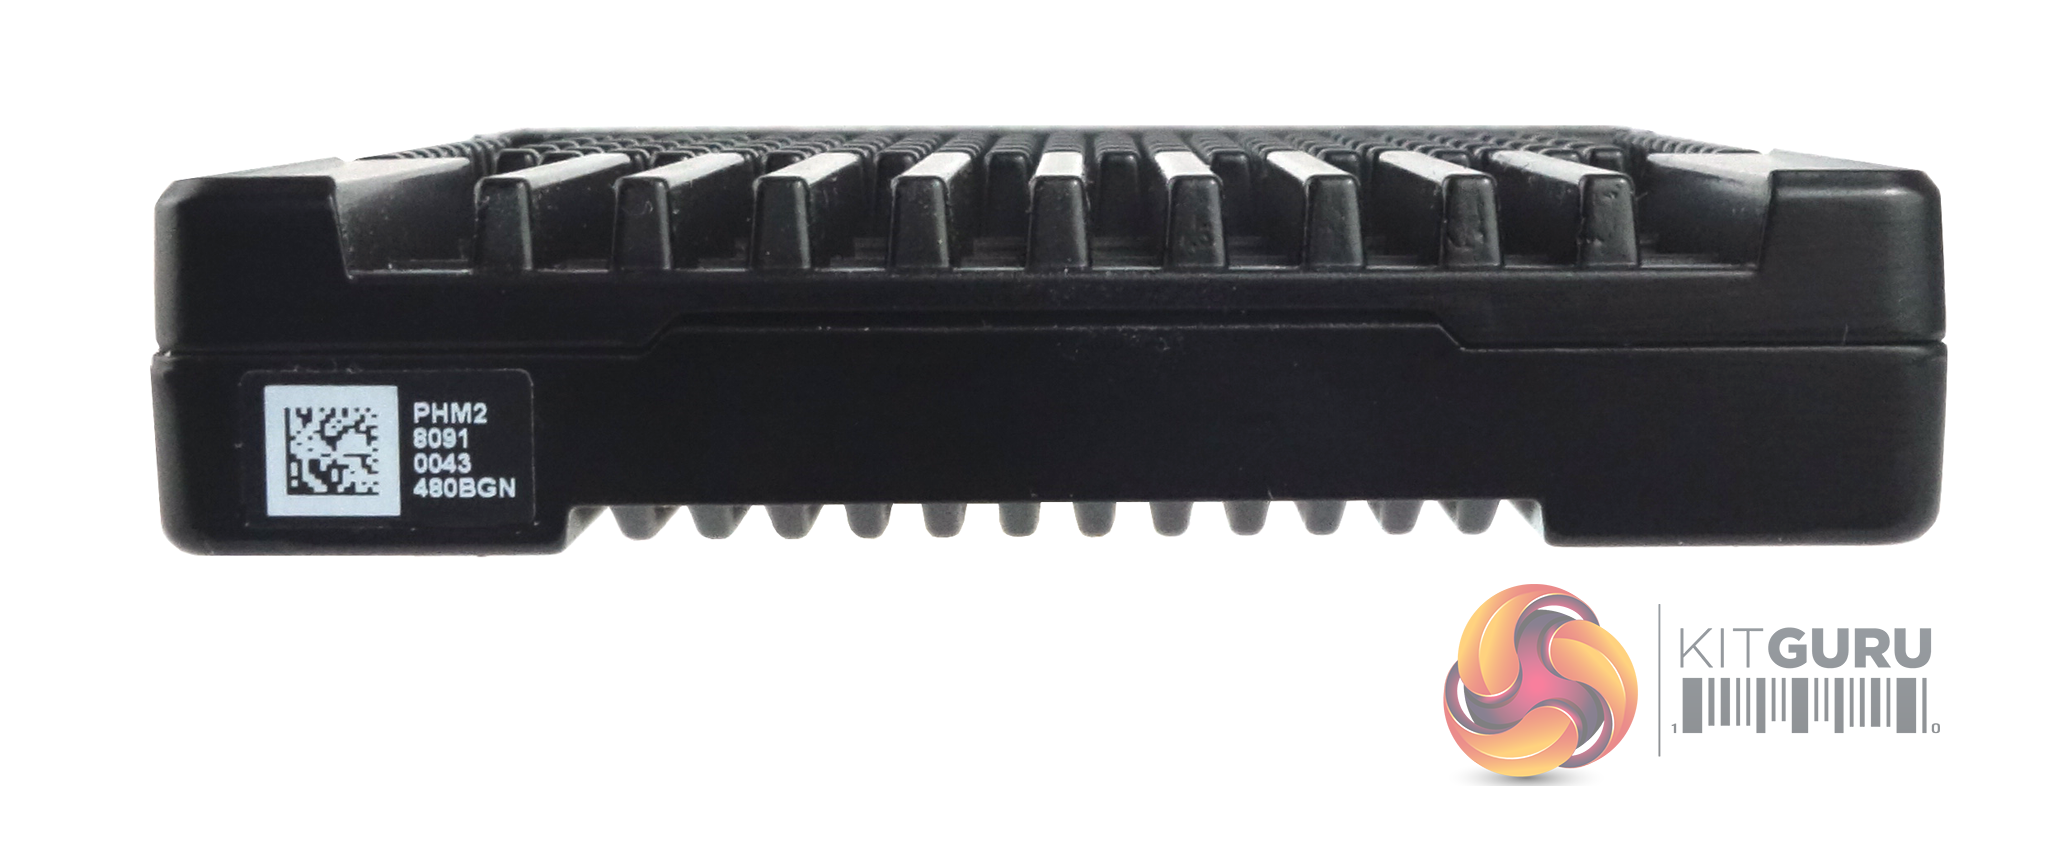
The drive is thicker than a standard SSD at 15mm and uses an aluminium casing with both the front and back areas styled into large heatsinks. Even with this design, the drive got pretty warm to the touch after some of our benchmarking runs.
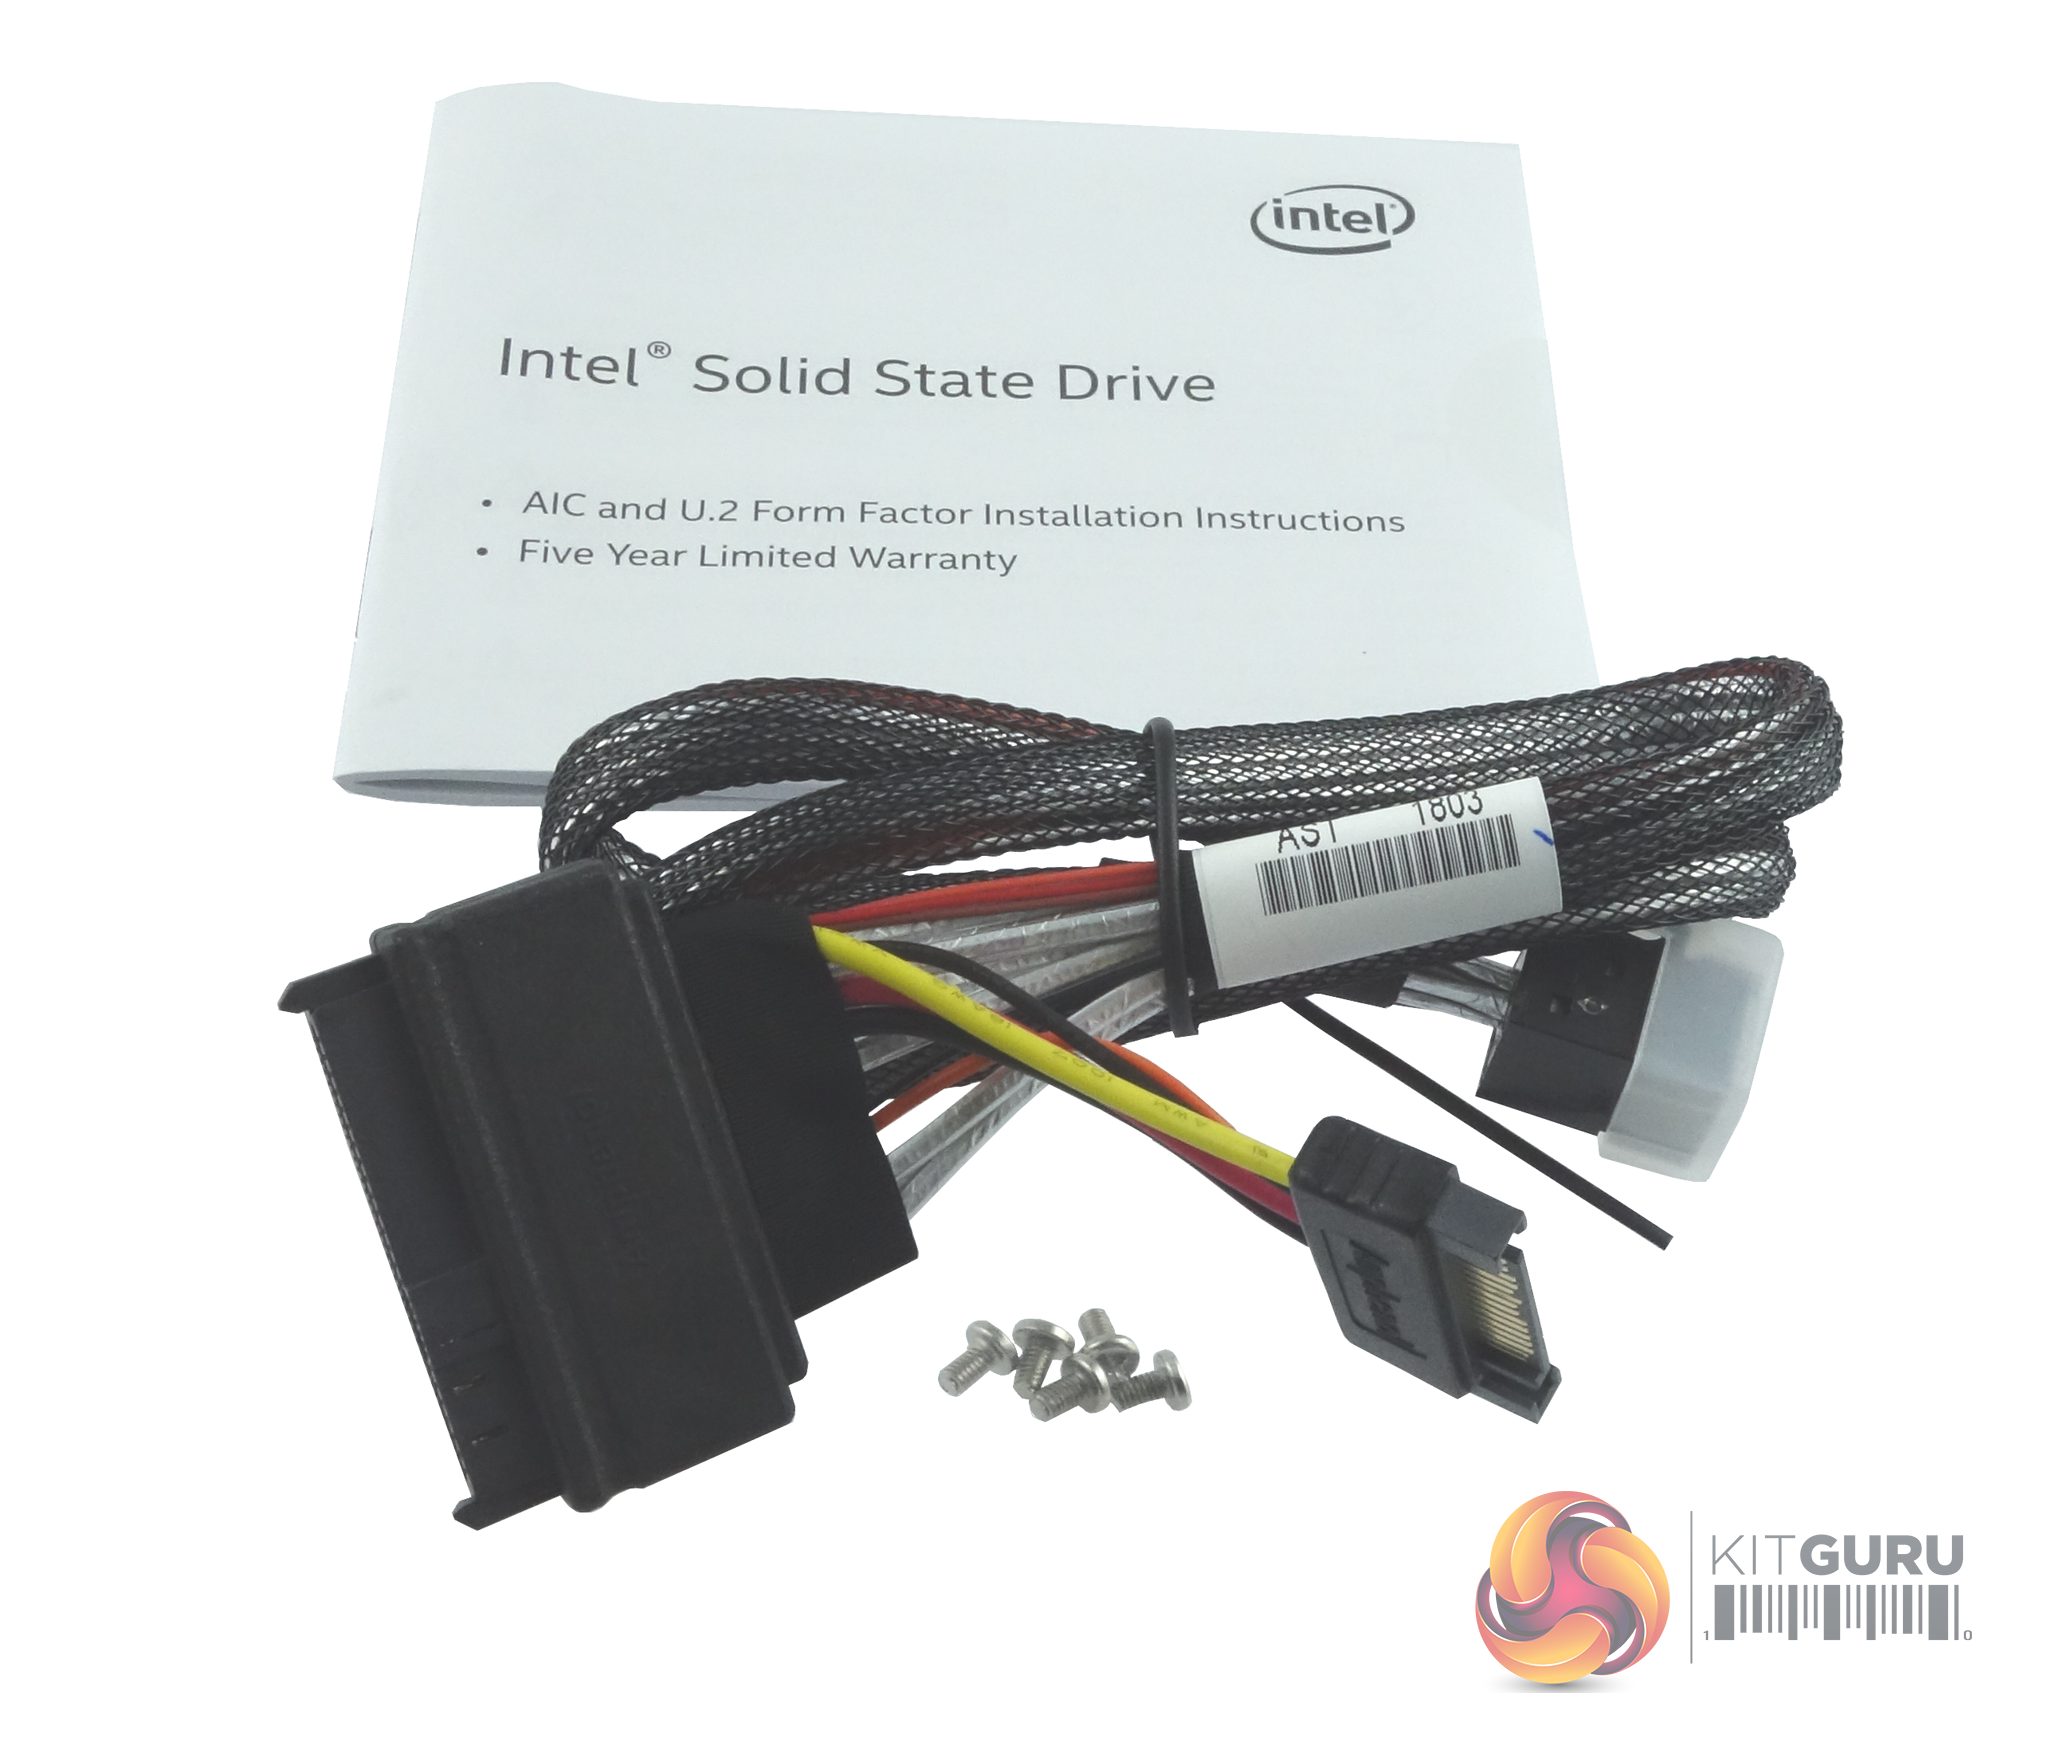
Bundled in with the drive is a SFF-8639 data / power combo cable which is handy, but you'll still need to get a M.2 To U.2 Mini-SAS adapter to connect the drive to a motherboard. There's also a set of fixing screws and a warranty manual.
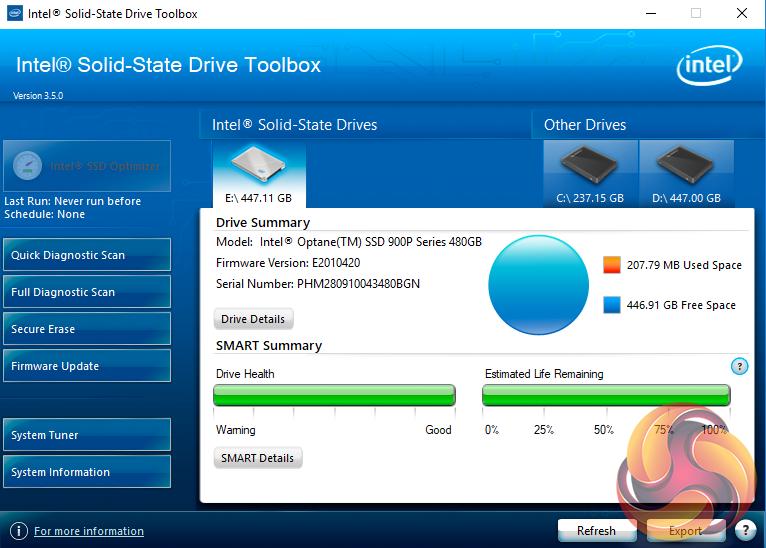
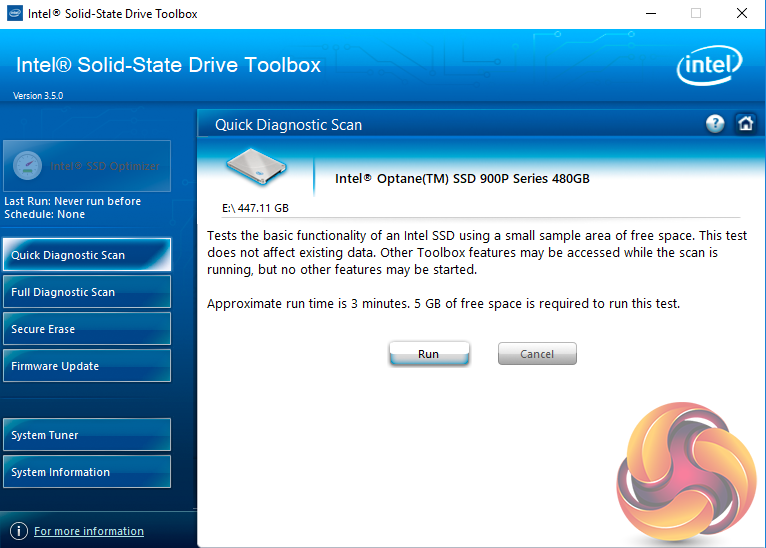
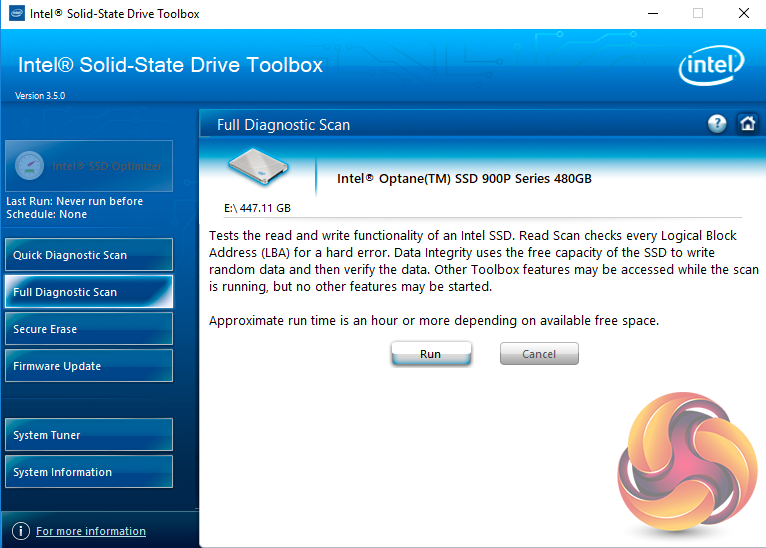
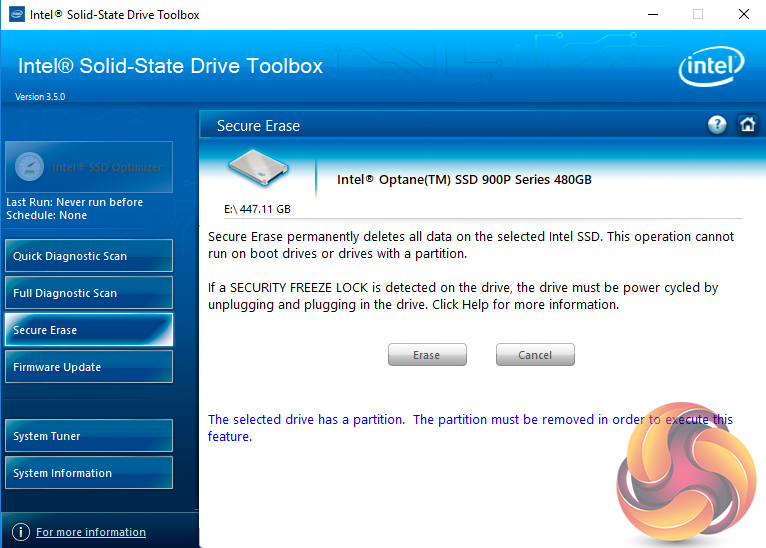
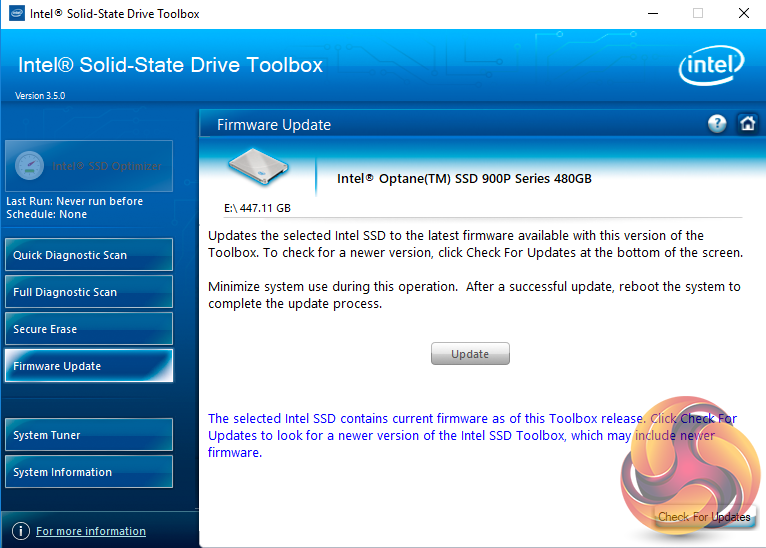
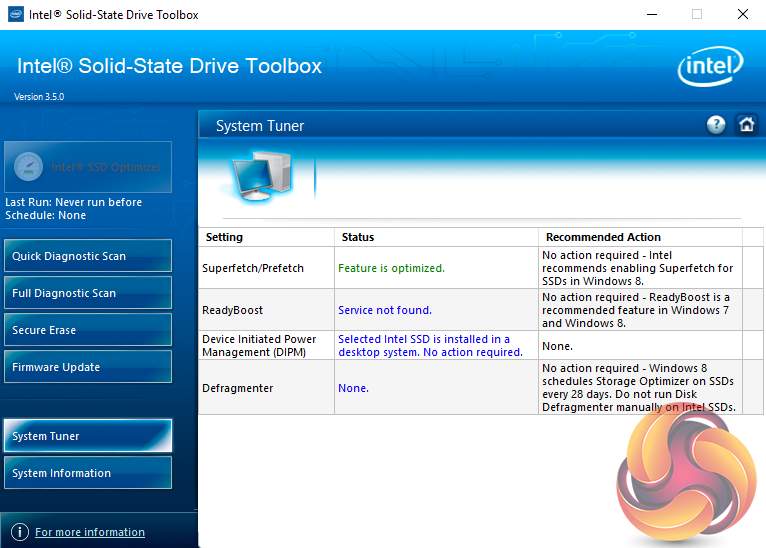
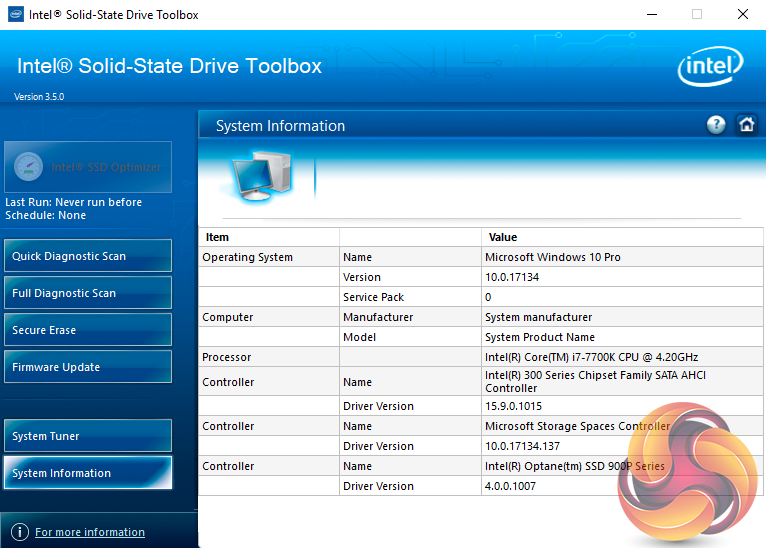
The Intel Toolbox SSD management utility is a pretty comprehensive tool for looking after your SSD. The home screen displays information about the drive, how the capacity is being used, its health and estimated life remaining.
There are seven buttons on the right hand side of the utility main screen. These are for Intel’s SSD Optimiser, two drive diagnostic scans, one quick / the other full, secure erase, firmware updates, a system tuner and a page for system information.
For testing, the drives are all wiped and reset to factory settings by HDDerase V4. We try to use free or easily available programs and some real world testing so you can compare our findings against your own system.
This is a good way to measure potential upgrade benefits.
Main system:
Intel Core i7-7700K with 16GB of DDR4-3200 RAM, Sapphire R9 390 Nitro and an Asus Prime Z270-A motherboard.
Other drives:
Corsair Force MP500 480GB
Corsair Force MP510 960GB
Intel SSD760p 512GB
Kingston A1000 480GB
Plextor M9Pe(Y) 512GB
Plextor M8PeG 512GB
PNY CS2030 240GB
Samsung SSD970 EVO 2TB
Samsung SSD970 PRO 1TB
Samsung SSD960 PRO 2TB
Samsung SSD960 EVO 1TB
Toshiba OCZ RD400 512GB
Western Digital Black NVMe 1TB
Western Digital Black PCIe 512GB
Software:
Atto Disk Benchmark.
CrystalMark 3.0.3.
AS SSD.
IOMeter.
Futuremark PC Mark 8
All our results were achieved by running each test five times with every configuration this ensures that any glitches are removed from the results. Trim is confirmed as running by typing fsutil behavior query disabledeletenotify into the command line. A response of disabledeletenotify =0 confirms TRIM is active.
CrystalDiskMark is a useful benchmark to measure theoretical performance levels of hard drives and SSD’s. We are using v6.0.
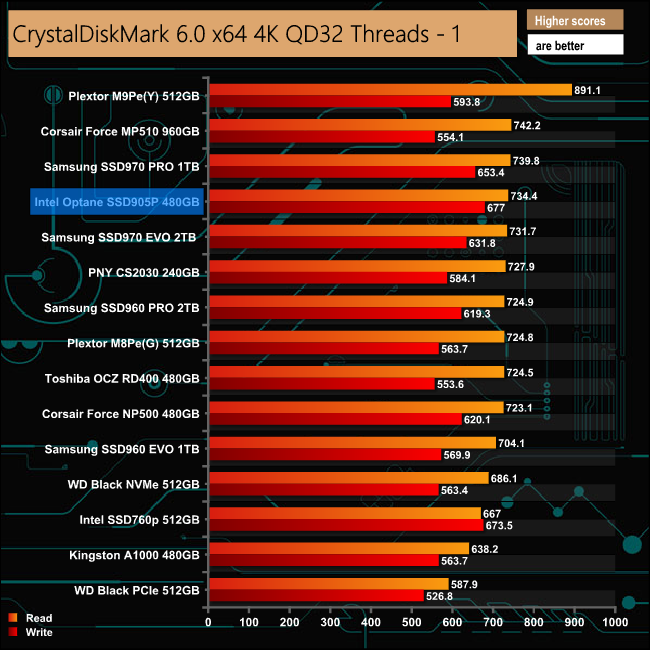
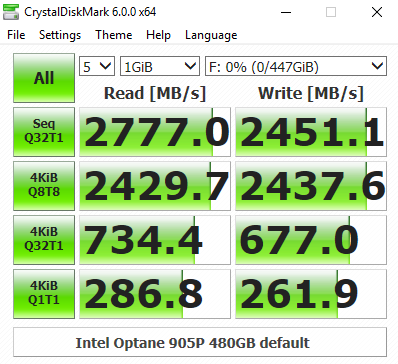
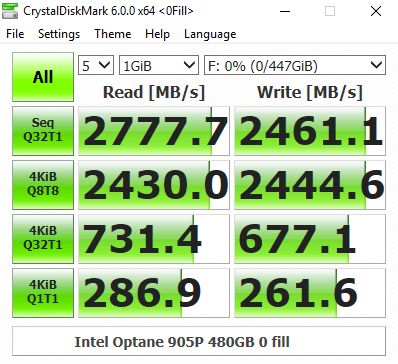
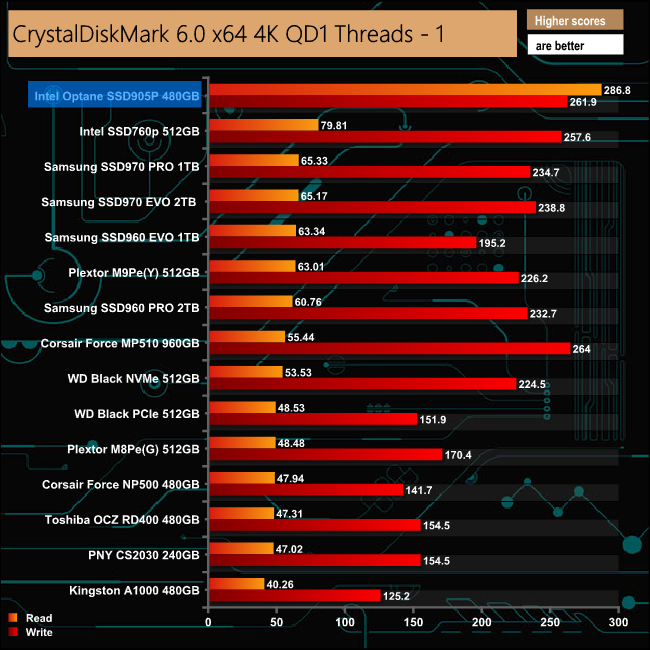
Intel's 3D XPoint memory is all about very high random performance at low queue depths, particularly read's, something perfectly illustrated by the two sets of CrystalDiskMark results. At a QD of 32 the drive sits behind the Plextor M9Pe(Y), the Corsair Force MP510 and Samsung's SSD970 PRO.
However, testing the drive at a QD of 1 proves the effectiveness of 3D XPoint memory with a stunning read test result of 268.8MB/s, three and a half times faster than the nearest NAND equipped drive – Intel's own SSD760p.
The ATTO Disk Benchmark performance measurement tool is compatible with Microsoft Windows. Measure your storage systems performance with various transfer sizes and test lengths for reads and writes. Several options are available to customize your performance measurement including queue depth, overlapped I/O and even a comparison mode with the option to run continuously.
Use ATTO Disk Benchmark to test any manufacturers RAID controllers, storage controllers, host adapters, hard drives and SSD drives and notice that ATTO products will consistently provide the highest level of performance to your storage.
We are using version 3.5 for our NVMe disk tests.
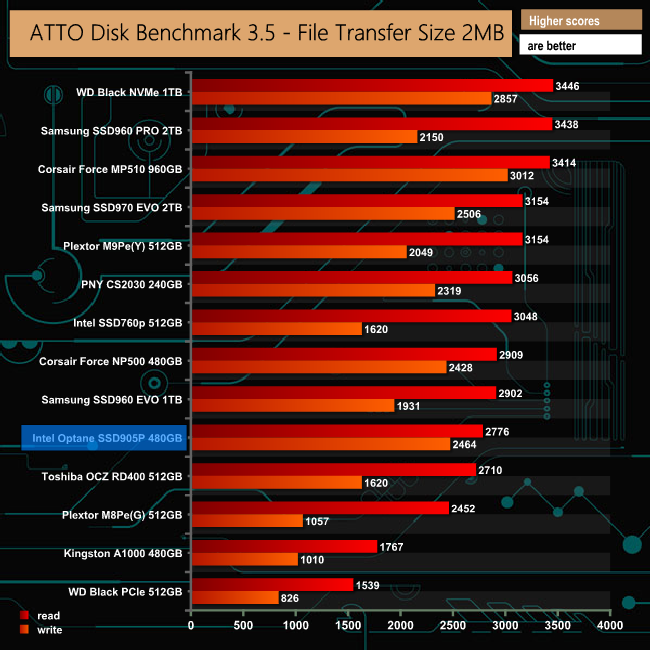
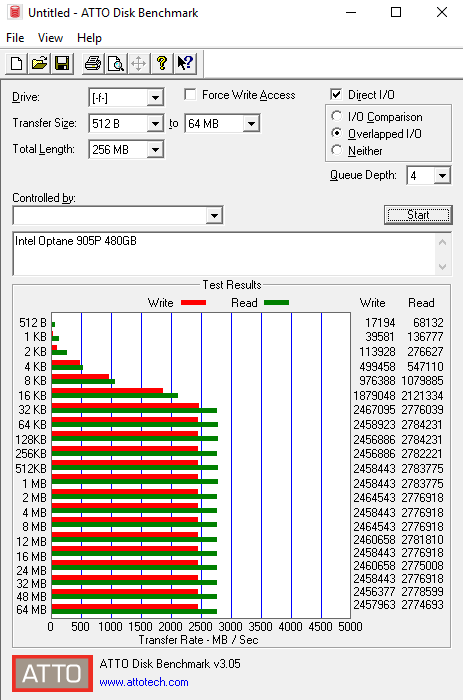
Intel quote Sequential performance figures for the 480GB SSD 905P as up to 2,600MB/s for reads and up to 2,200 MB/s for writes. Using the ATTO benchmark we able to squeeze a little more out of the drive with reads at 2,776MB/s and writes of 2,464MB/s.
AS SSD is a great free tool designed just for benching Solid State Drives. It performs an array of sequential read and write tests, as well as random read and write tests with sequential access times over a portion of the drive. AS SSD includes a sub suite of benchmarks with various file pattern algorithms but this is difficult in trying to judge accurate performance figures.
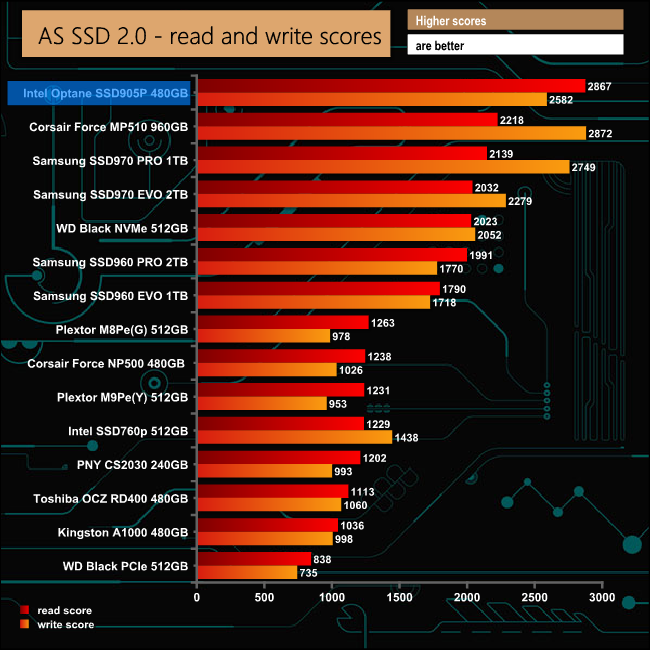
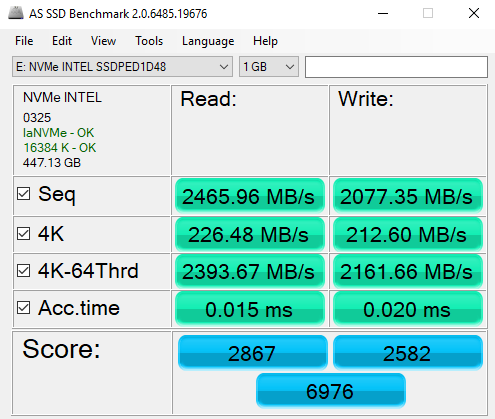
The Intel Optane SSD 905P goes straight to the top of the list of tested drives in the AS SSD benchmark with a read score of 2867, which is the fastest we have seen to date for a 480GB drive. The write score isn't quite as strong, being the third highest score behind the Corsair MP510 and Samsung's SSD970 PRO.
IOMeter is another open source synthetic benchmarking tool which is able to simulate the various loads placed on hard drive and solid state drive technology. There are many ways to measure the IOPS performance of a Solid State Drive, so our results will sometimes differ from manufacturer’s quoted ratings. We do test all drives in exactly the same way, so the results are directly comparable.
We test 128KB Sequential read and write and random read and write 4k tests. The test setup’s for the tests are listed below. Each is run five times.
128KB Sequential Read / Write.
Transfer Request Size: 128KB Span: 8GB Thread(s): 1, Outstanding I/O: 1-32 Test Run: 20 minutes per test
4K Sustained Random Read / Write.
Transfer Request Size: 4KB Span: 80GB Thread(s): 4, Outstanding I/O: 1-32 Test Run: 20 minutes per test
4K Random 70/30 mix Read/Write.
Transfer Request Size: 4KB Span: 80GB Reads: 70% Writes: 30% Thread(s): 4 Outstanding I/O: 2 – 32 Test Run: 20 minutes
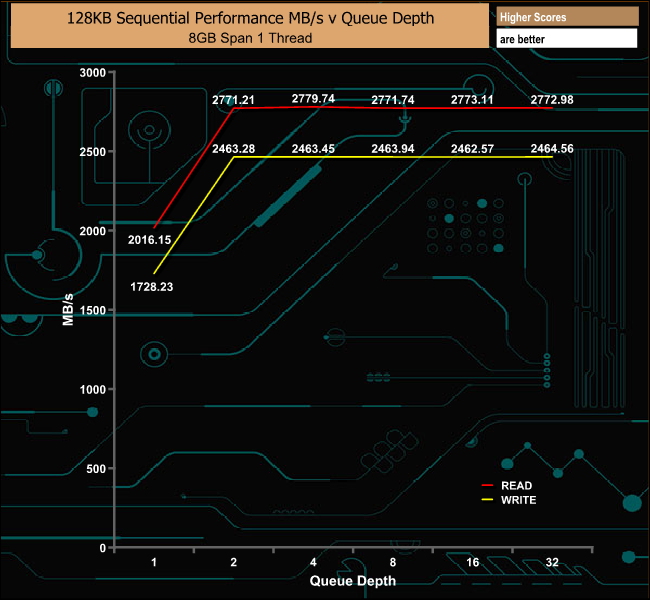
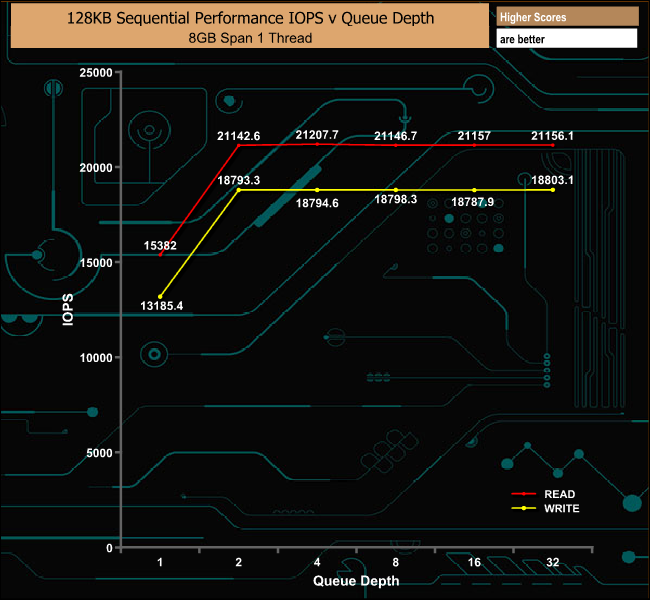
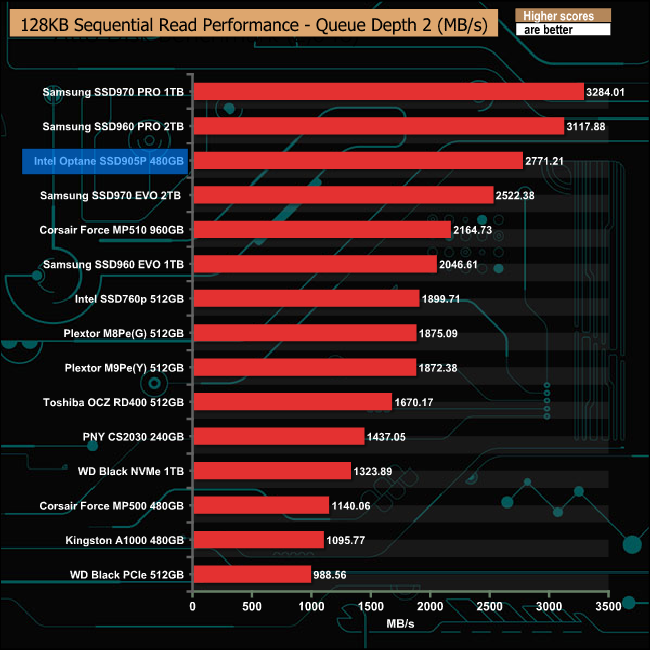
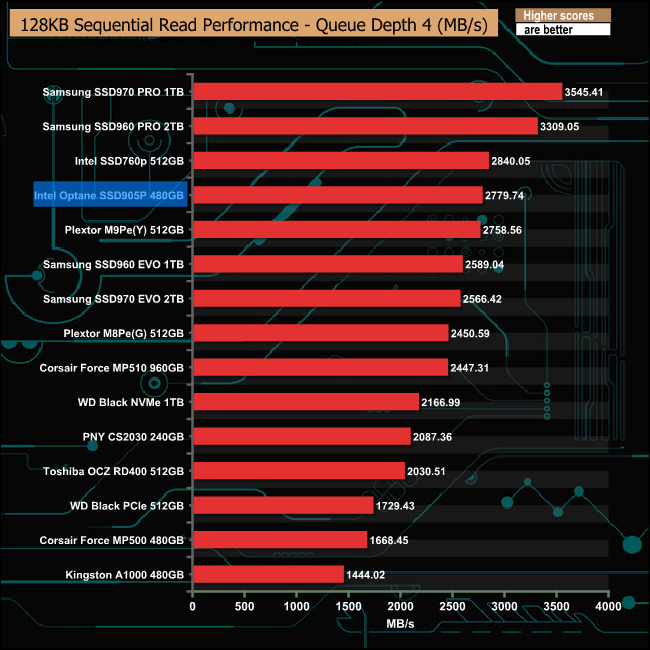
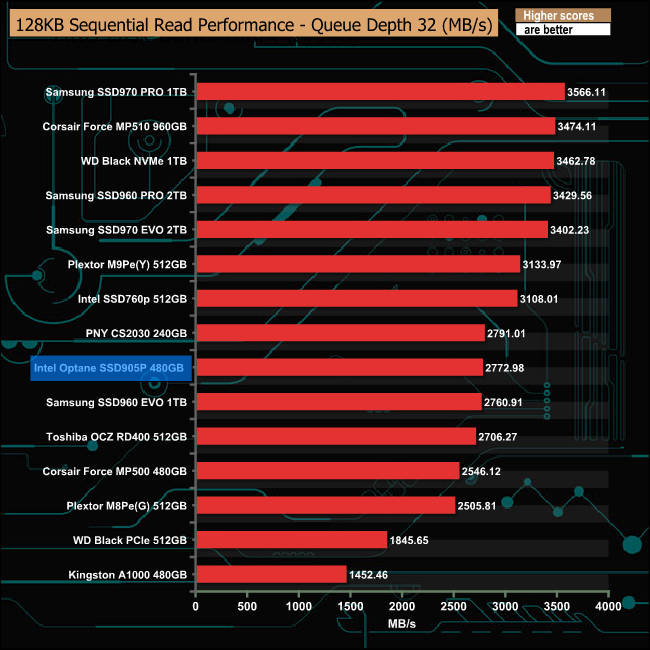
As with the ATTO benchmark we were able to get a bit more Sequential performance out of the drive than the official numbers with our 128KB Sequential tests. The best read score we saw was 2,779.94MB/s which is 179MB/s faster than the official top end figure while the write score of 2,464.56MB/s bettered the official 2,200MB/s.
128KB Sequential Read Comparison
128KB Sequential Write Comparison
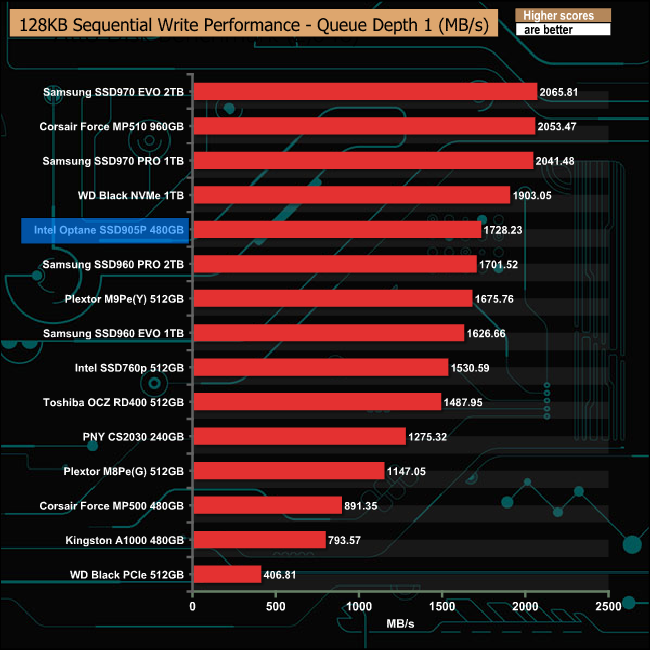
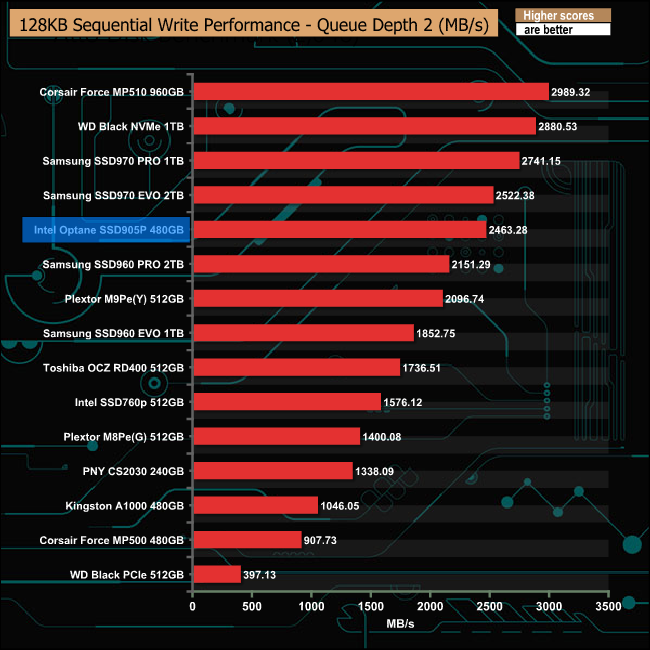
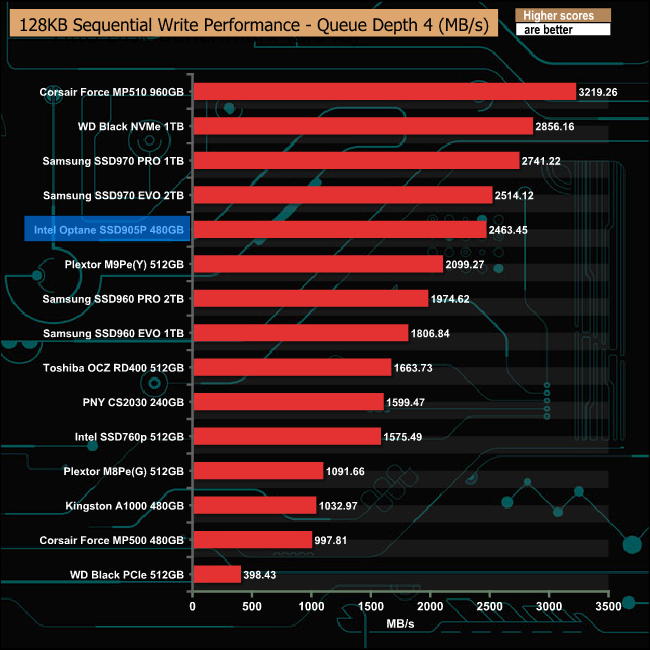
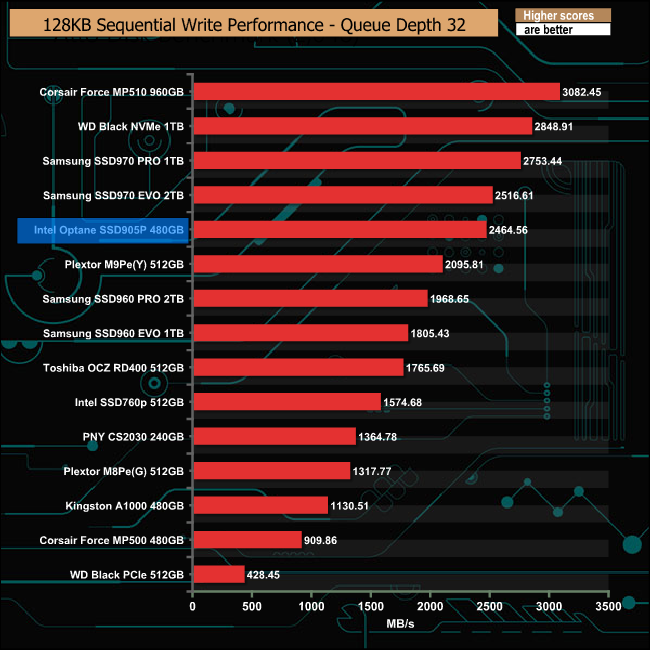
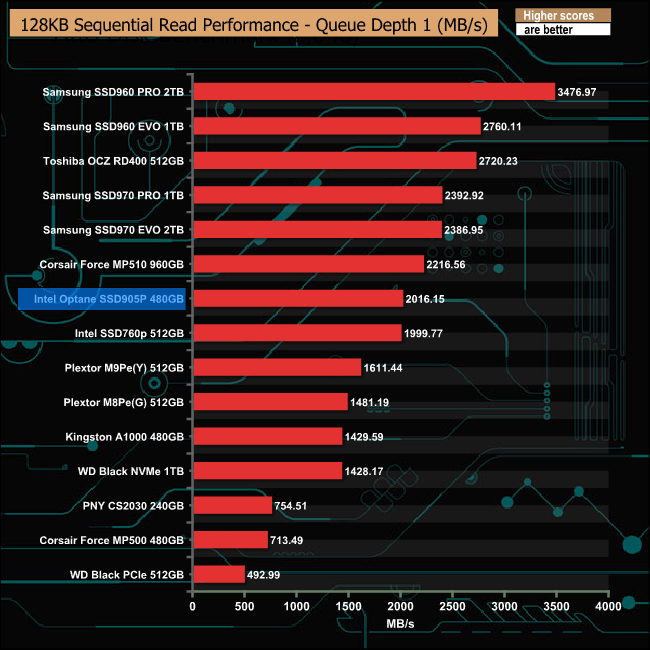
As can be seen from the read/write performance at the tested Queue Depth's, the drive isn't a speed demon when it comes to Sequential performance, but to be fair that's not what the drive is about.
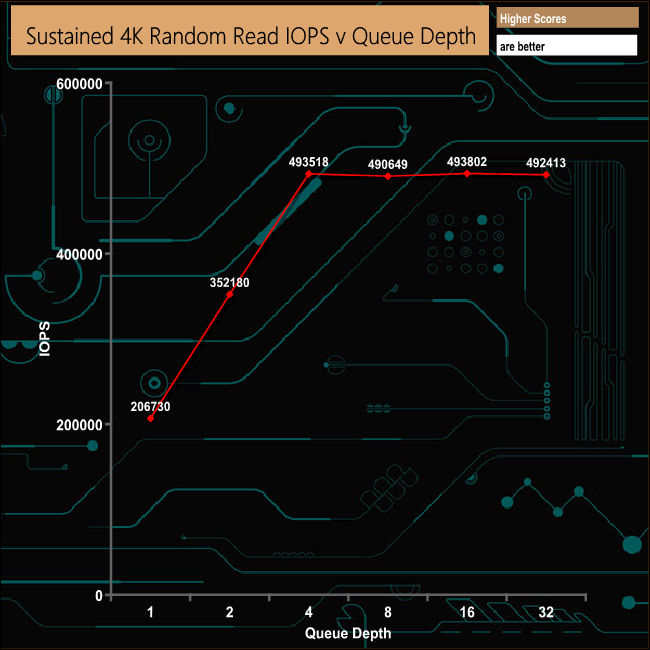
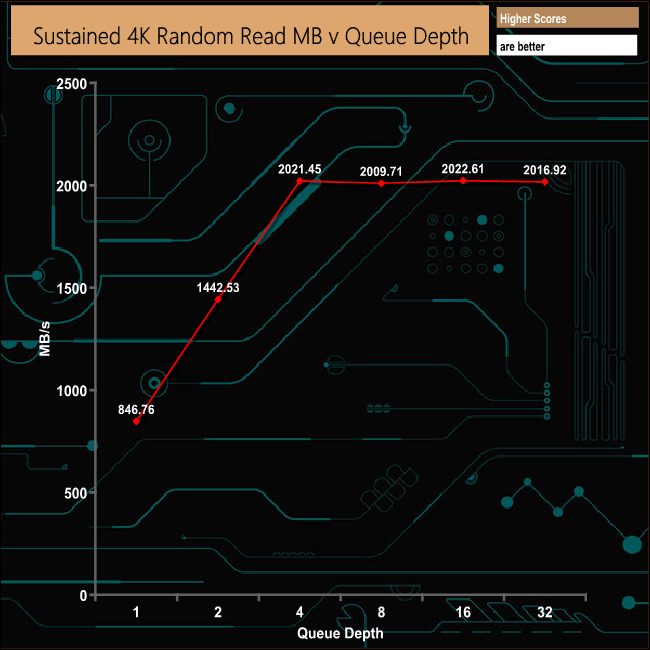
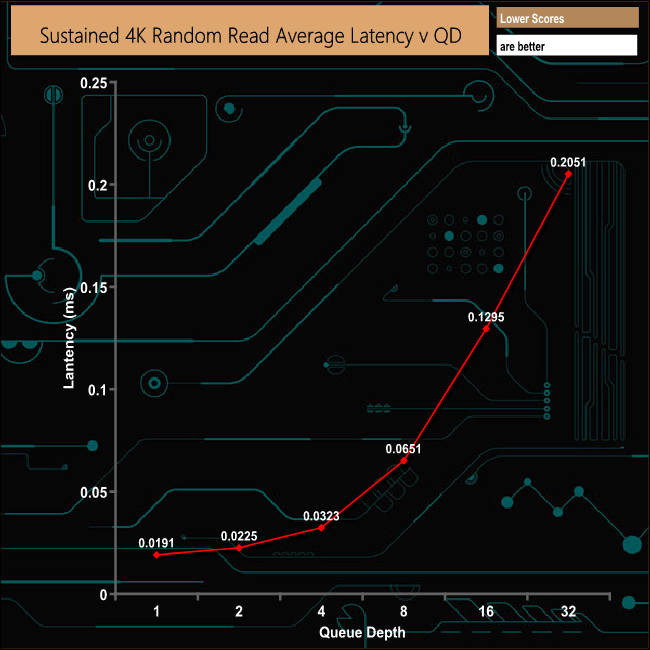
4K Random Read v QD Performance Comparison
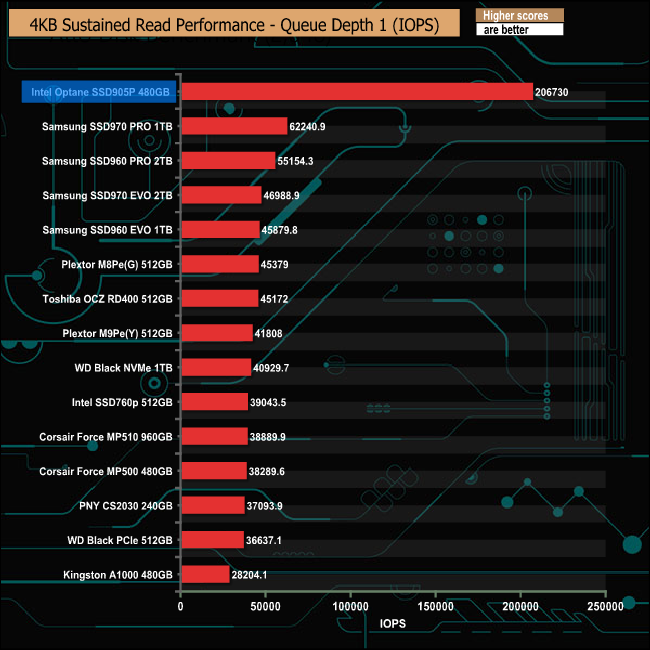
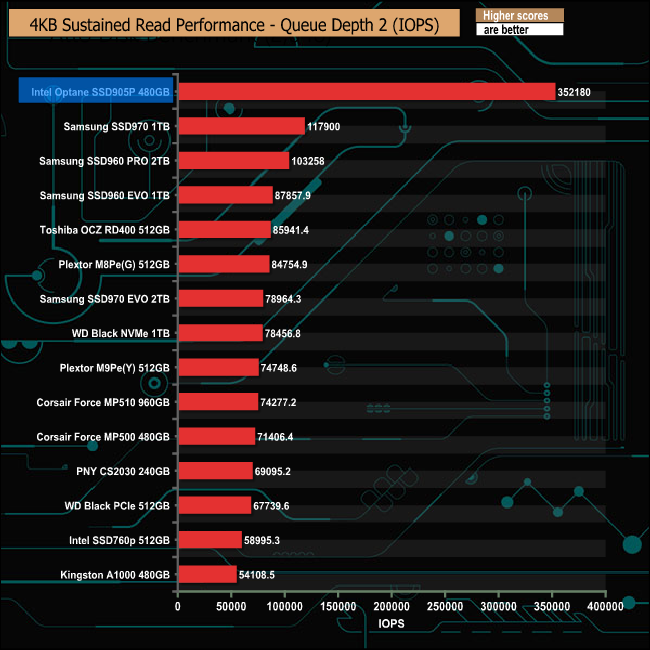
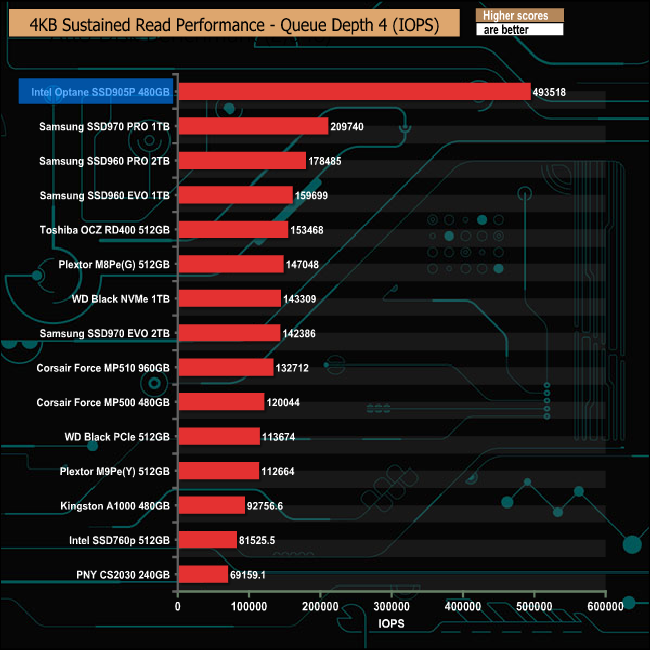
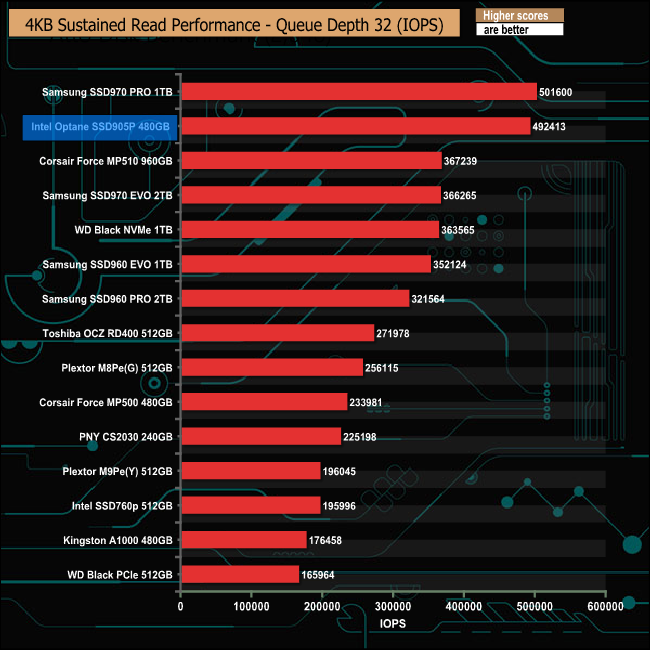
While the SSD 905P may not be breaking any speed records when it comes to Sequential performance, it's an entirely different matter when it comes to reading small chunks of data at low queue depths. It's an absolute monster, kicking sand in the face of every other consumer drive we've tested.
It's only at a fairly deep queue depth of 32 that the performance of the drive gives way to a standard NAND equipped drive.
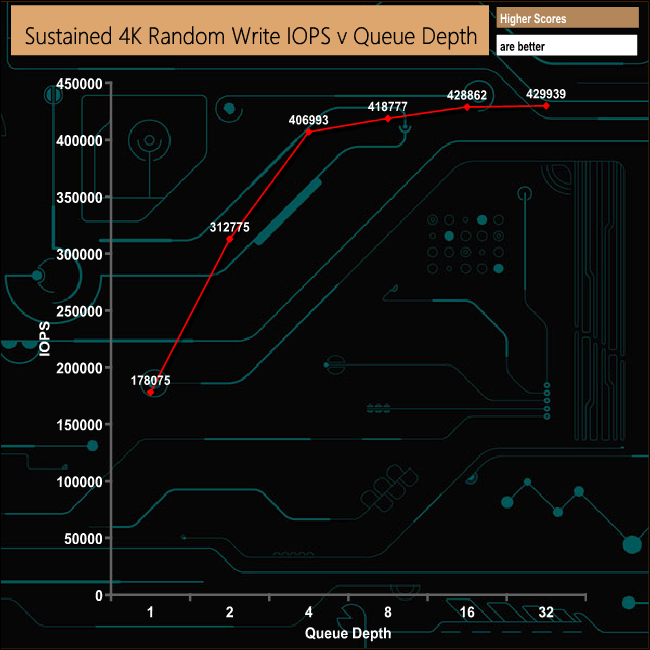
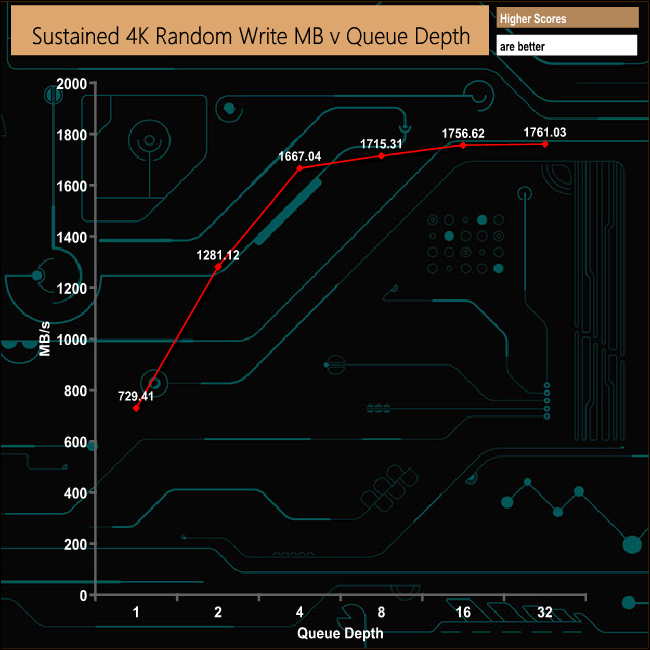
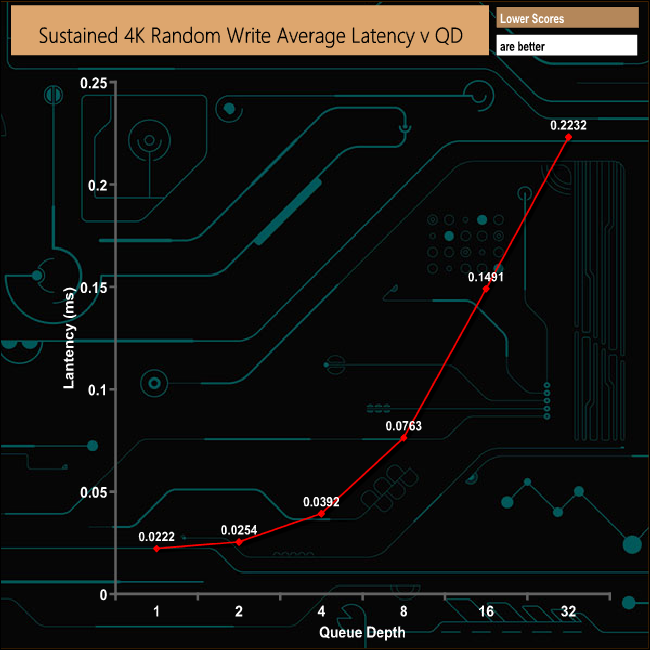
4K Random Write v QD Performance Comparison
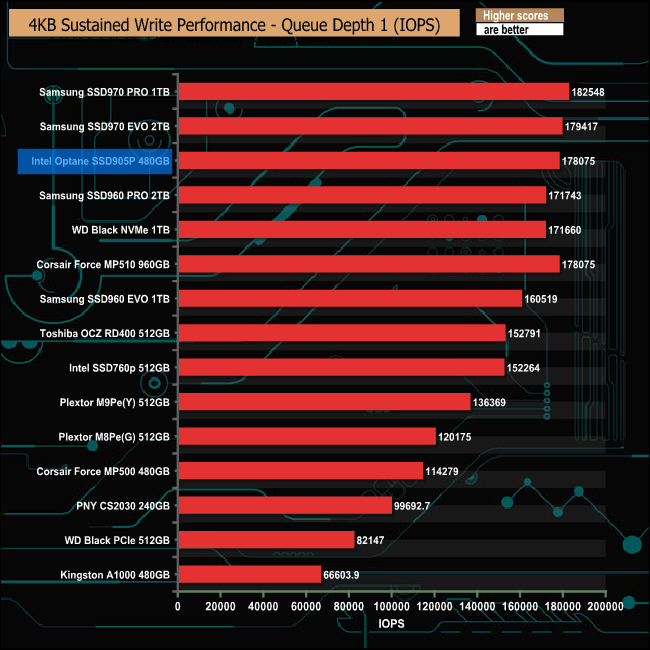
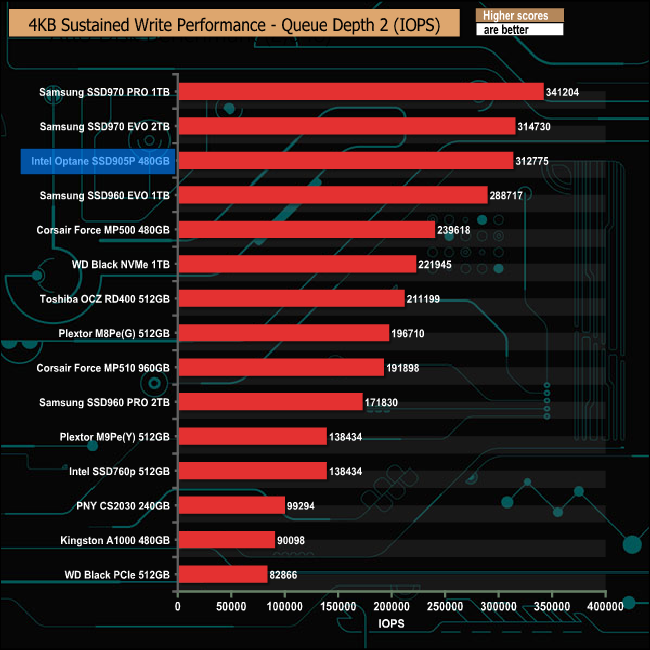
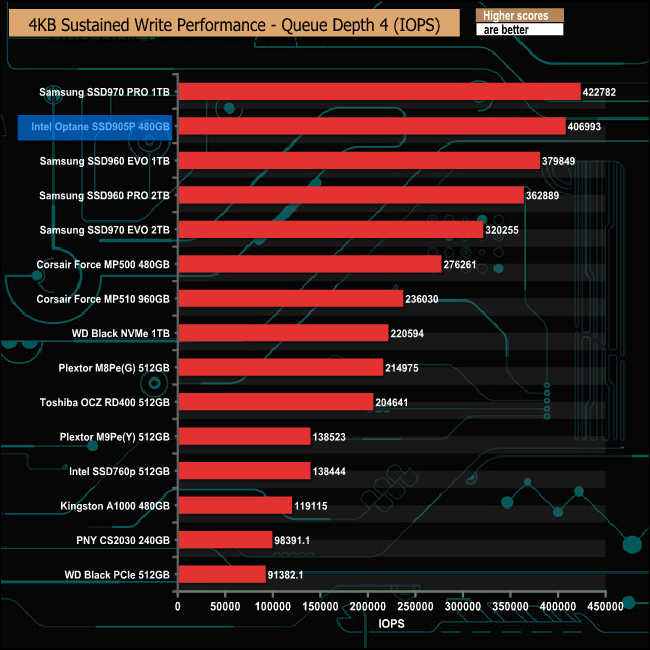
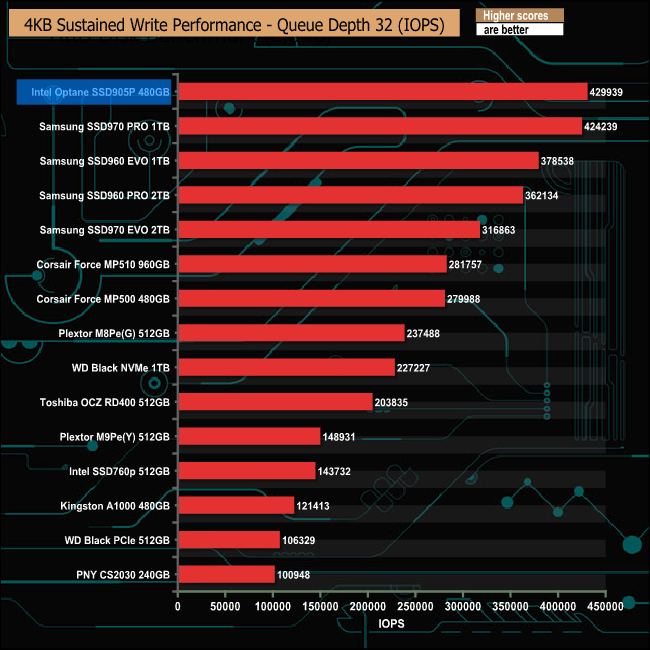
With random write performance it's a different picture with the drive getting quicker as the queue depth deepens.
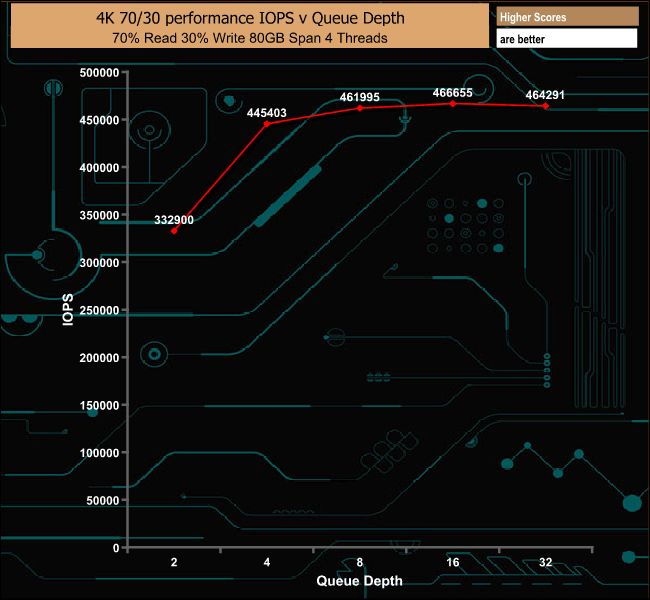
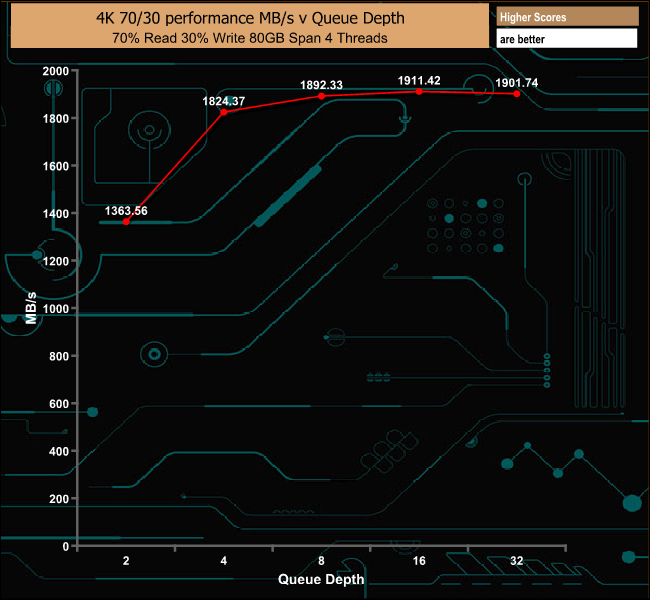
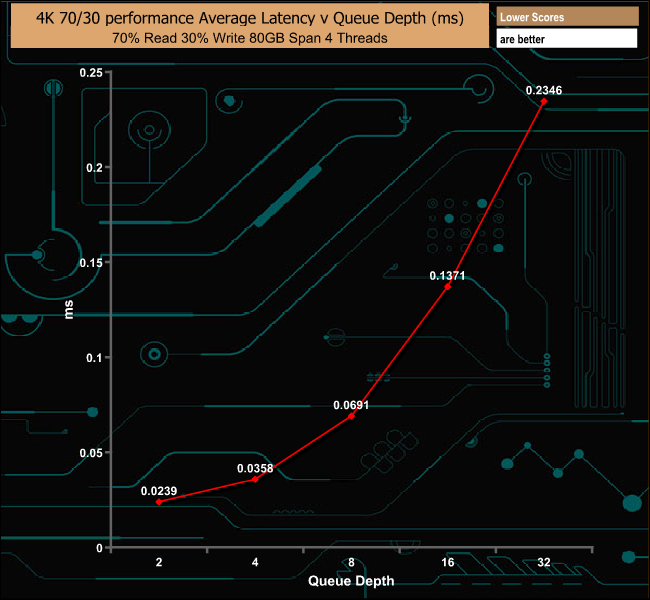
In the 70/30 read/write mixed test the drive performs well peaking at 466,655 IOPS (1911.42MB/s).
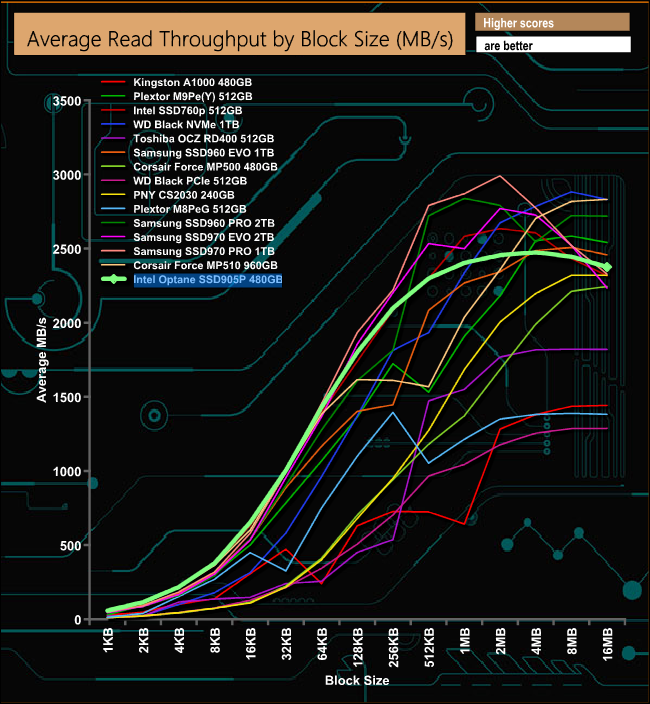
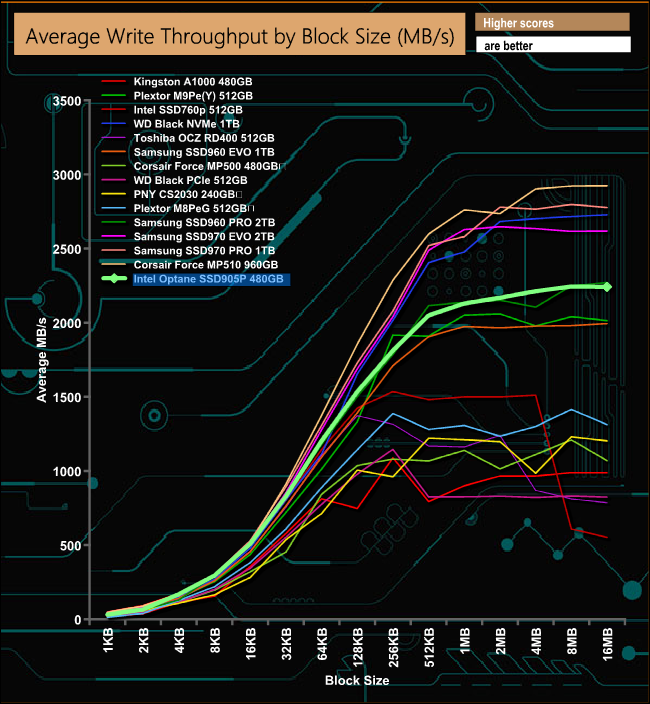
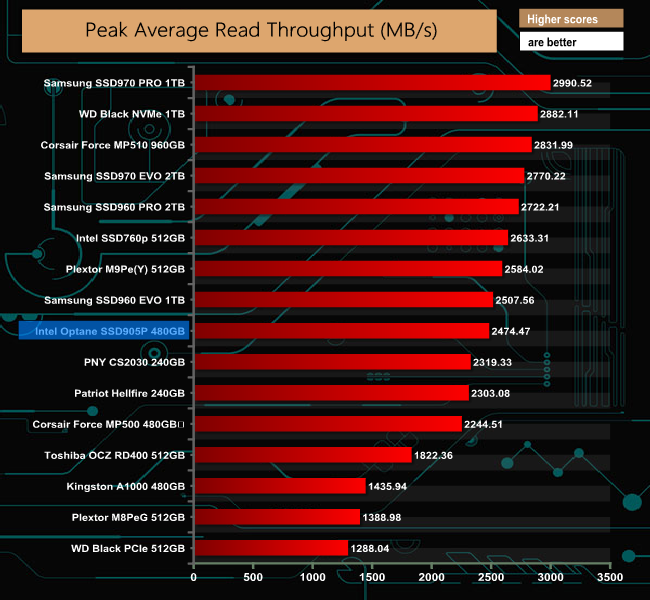
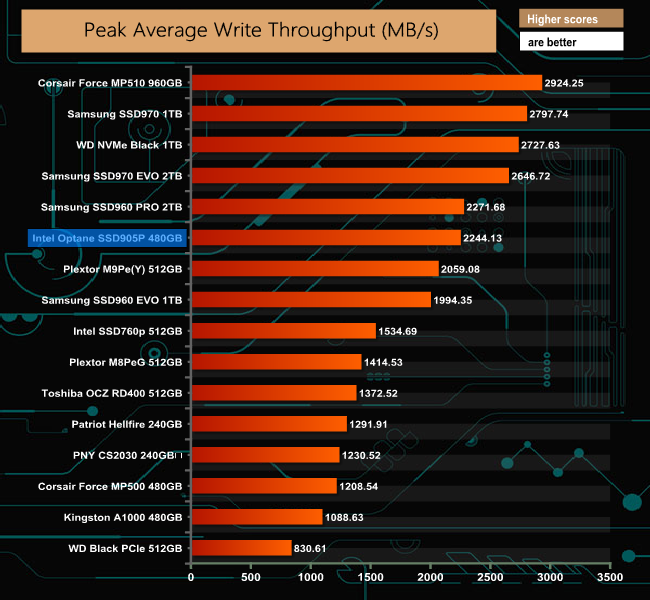
The 2,474.47MB/s average peak read speed came as the drive hit the 4MB block size while writes peaked at the 8MB block mark at 2,244.13MB/s. That read figure is a little short of the maximum 2,600MB/s Intel quote for the drive while the write figure is a wee bit more than the official 2,200MB/s figure.
Futuremark’s PCMark 8 is a very good all round system benchmark but it’s Storage Consistency Test takes it to whole new level when testing SSD drives. It runs through four phases; Preconditioning, Degradation, Steady State, Recovery and finally Clean Up. During the Degradation, Steady State and Recovery phases it runs performance tests using the 10 software programs that form the backbone of PCMark 8; Adobe After Effects, Illustrator, InDesign, Photoshop Heavy and Photoshop Light, Microsoft Excel, PowerPoint, Word, Battlefield 3 and World of Warcraft. With some 18 phases of testing, this test can take many hours to run.
Preconditioning
The drive is written sequentially through up to the reported capacity with random data, write size of 256 × 512 = 131,072 bytes. This is done twice.
Degradation
Run writes of random size between 8 × 512 and 2048 × 512 bytes on random offsets for 10 minutes. It then runs a performance test. These two actions are then repeated 8 times and on each pass the duration of random writes is increased by 5 minutes.
Steady State
Run writes of random size between 8 × 512 and 2048 × 512 bytes on random offsets for final duration achieved in degradation phase. A performance test is then run. These actions are then re-run five times.
Recovery
The drive is idled for 5 minutes. Then a performance test is run. These actions are then repeated five times.
Clean Up
The drive is written through sequentially up to the reported capacity with zero data, write size of 256 × 512 = 131,072 bytes.
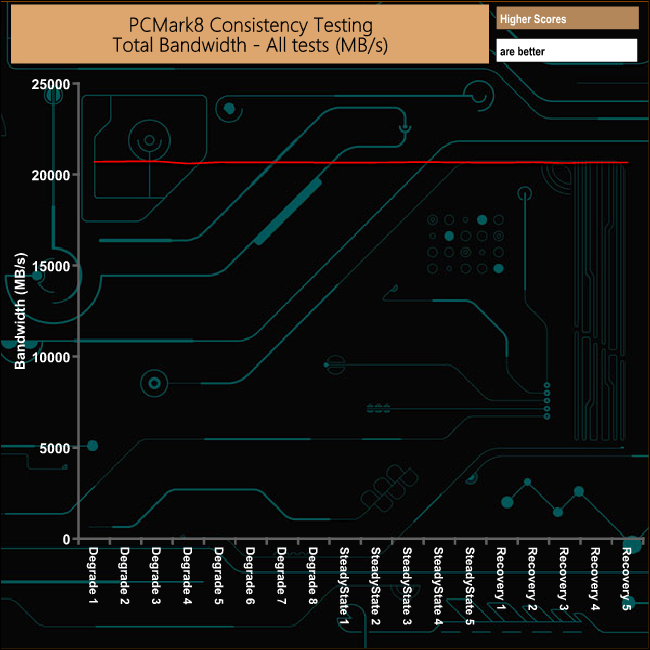
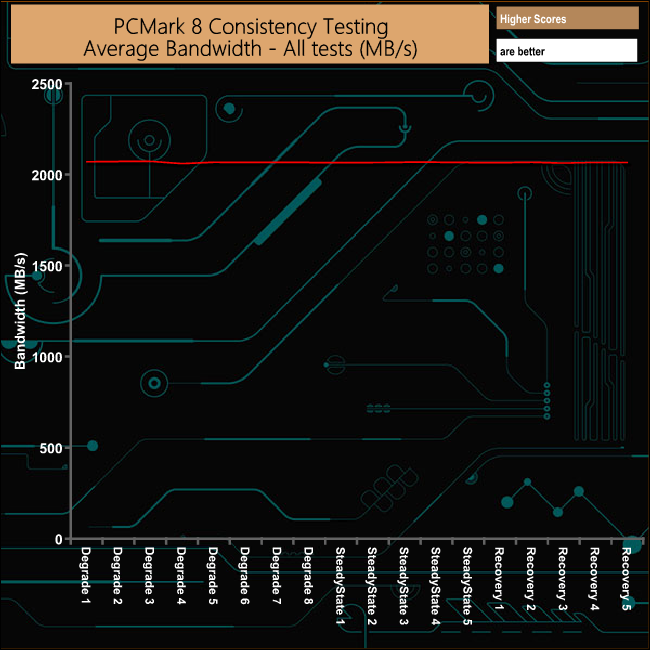
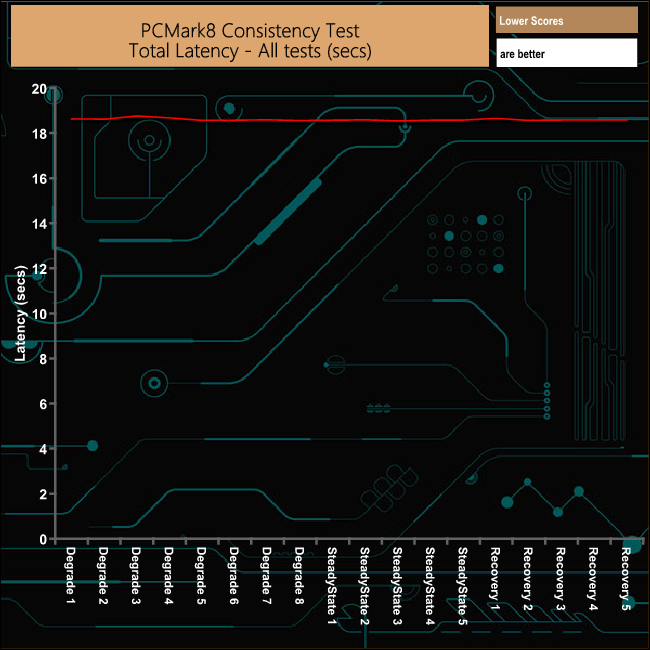
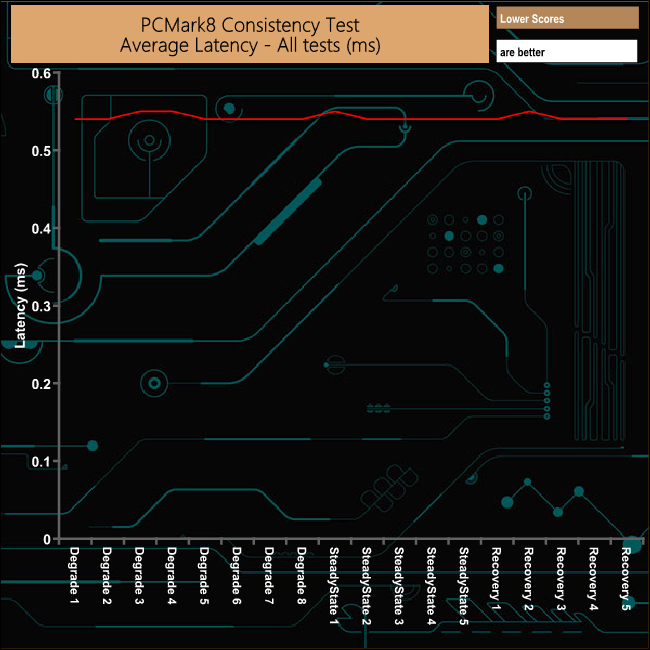
Overall Intel's Optane SSD 905P sails through PCM8's Consistency test with hardly a blip in performance which is quite remarkable.
PCMark 8’s Consistency test provides a huge amount of performance data, so here we’ve looked a little closer at how Intel's 480GB Optane SSD905P performs in each of the benchmarks test suites.
Adobe Creative Cloud
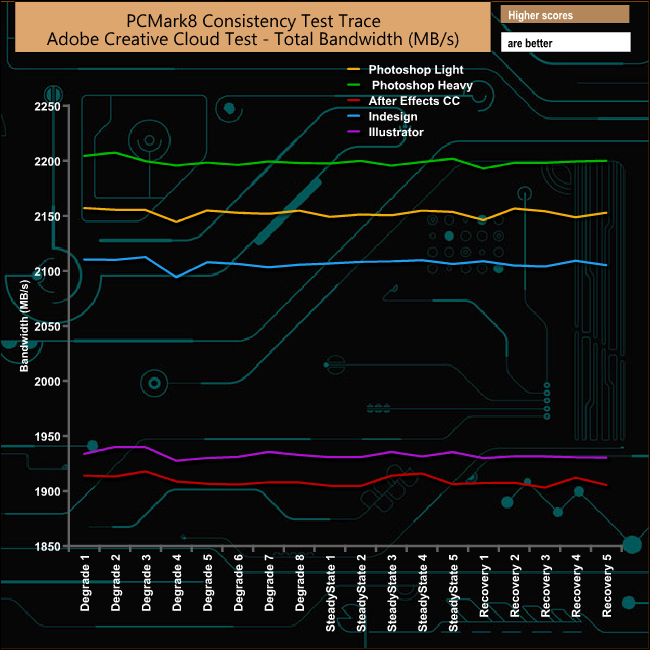
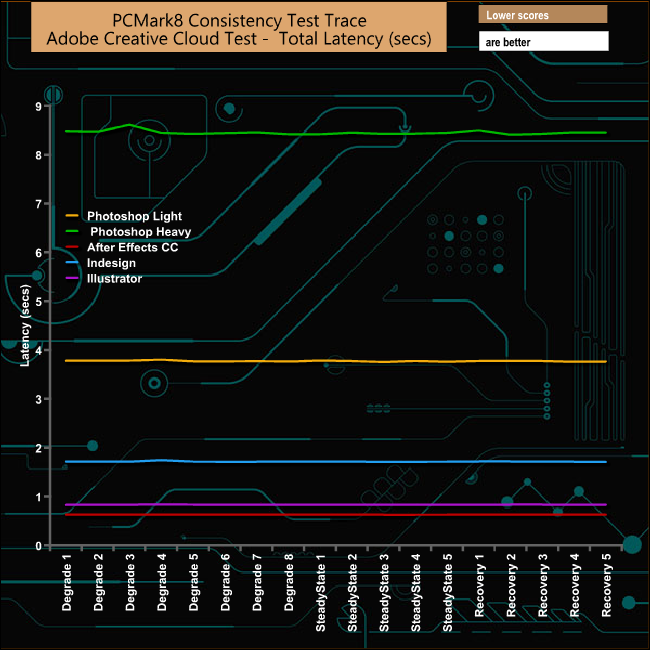
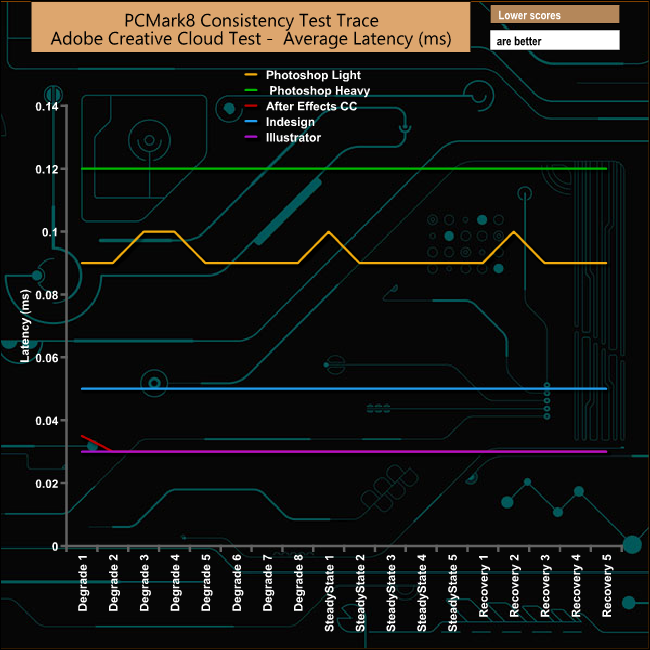
The drive produces some very strong and equally consistent bandwidth figures in the Adobe CC tests along with some low latency figures. The Adobe Photoshop Heavy trace which normal causes a drive problems is dealt with ease, averaging bandwidth figures of 2,199MB/s for the Degradation stages, 2,198MB/s for the five Steady State stages and 2,151MB/s for the Recovery phase.
Microsoft Office
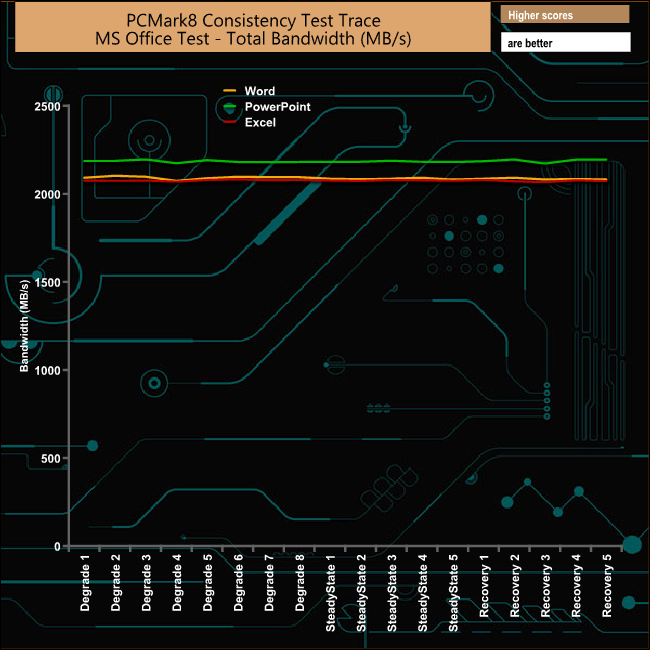
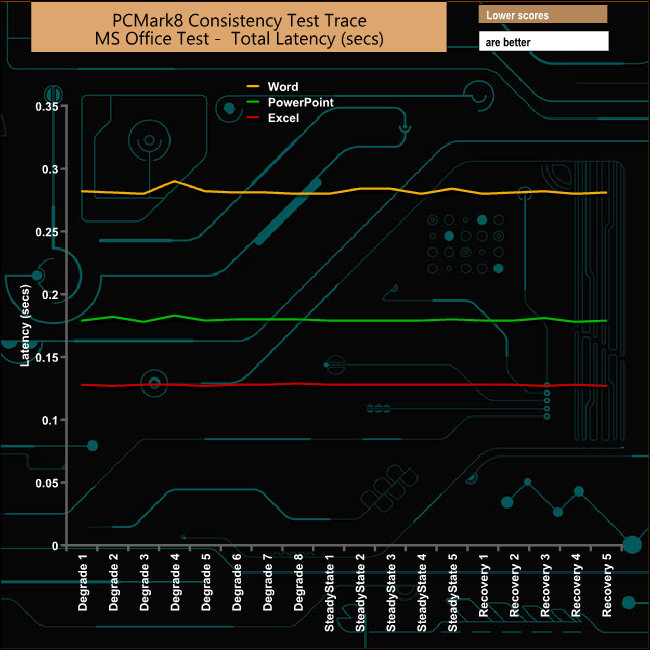

As with the Adobe CC tests, the Microsoft Office test traces were dealt with without seemingly stressing the drive at all. Even the Word test trace which, more often than not, causes a drive to drop bandwidth is dealt with without any difficulty.
Casual Gaming
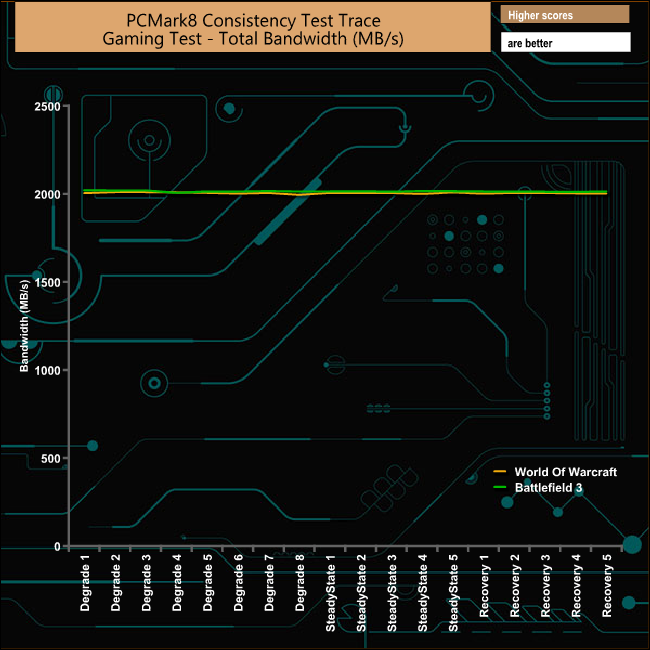
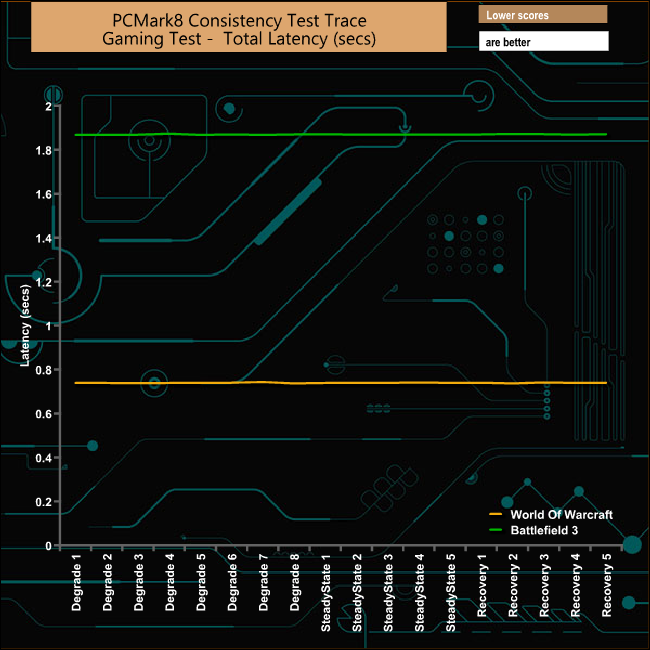
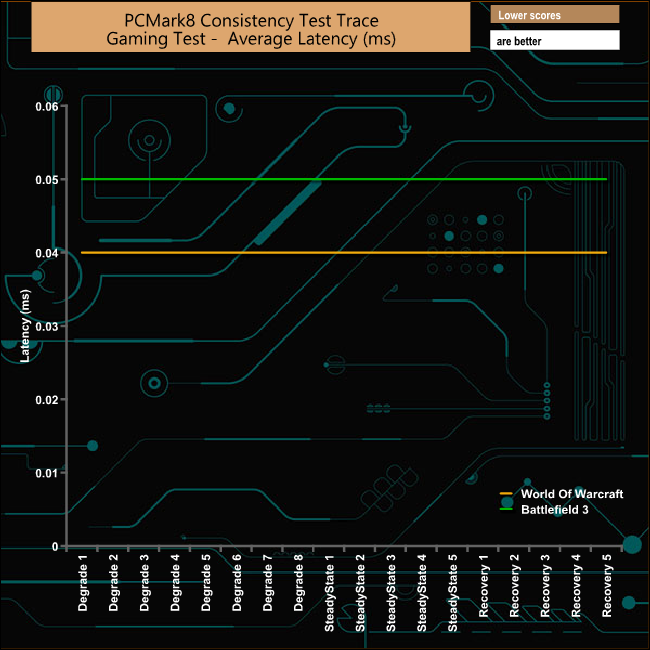
As with the previous two test suites, the Casual Gaming test doesn't seem to cause the drive any problems at all, with an average bandwidth for the whole test run of 2,004.71MB/s for the World Of Warcraft trace and 2,014.38MB/s for the Battlefield 3 one.
Just like the Consistency test, PCMark 8’s Standard Storage test also saves a large amount of performance data. The default test runs through the test suite of 10 applications three times. Here we show the total bandwidth performance for each of the individual test suites for the third and final benchmark run.
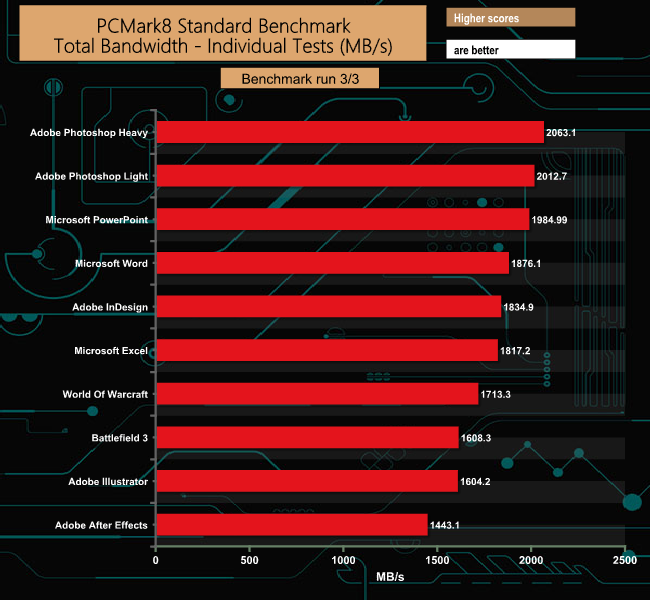
The bandwidth figures produced by the drive in PCMark 8's Standard Storage test are, quite frankly something else, with every test producing well over 1,000MB/s and in the case of the two Photoshop traces over 2,000MB/s.
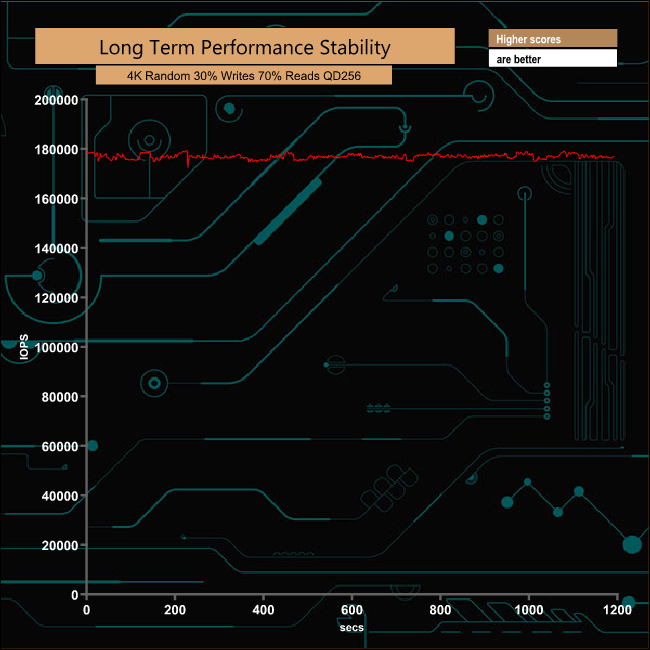
For the long term performance stability test, we set the drive up to run a 20-minute 4K random test with a 30% write, 70% read split, at a Queue Depth of 256 over the entire disk. The 480GB Intel Optane SSD 905P averaged 179,587 IOPS for the test with an excellent enterprise-class performance stability of 98.51%.
To test real life performance of a drive we use a mix of folder/file types and by using the FastCopy utility (which gives a time as well as MB/s result) we record the performance of drive reading from & writing to a 256GB Samsung SSD850 PRO.
100GB data file.
60GB iso image.
60GB Steam folder – 29,521 files.
50GB File folder – 28,523 files.
12GB Movie folder – 24 files (mix of Blu-ray and 4K files).
10GB Photo folder – 621 files (mix of png, raw and jpeg images).
10GB Audio folder – 1,483 files (mix of mp3 and .flac files).
5GB (1.5bn pixel) photo.
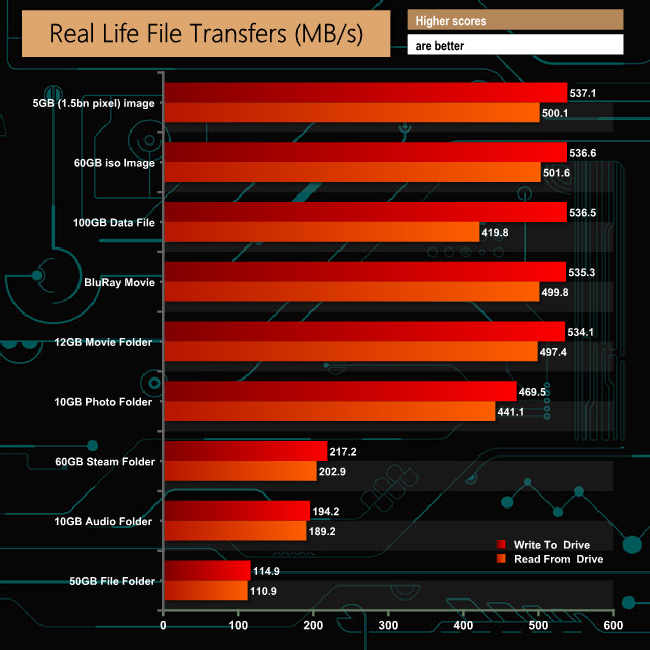
The drive is much happier dealing with the larger file sizes in our real life file transfer tests.
To get a measure of how much faster PCIe NVMe drives are than standard SATA SSD's we use the same files but transfer to and from a 512GB Toshiba OCZ RD400.
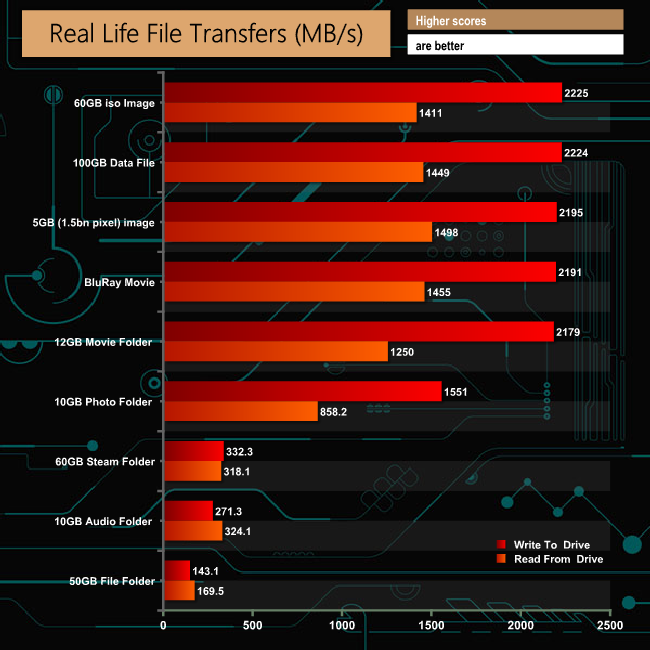
Transferring files between the SSD 905P and another NVMe drive shows the drives potential especially when it comes to moving around large files.
To quote from Intel's product brief for the Optane SSD 905P “The SSD 905P is designed for the most demanding storage workloads in client systems, delivering high random read/write performance coupled with low latency and industry-leading endurance”. The thing about the Optane series of drives is they deliver those high random read/write figures at low queue depths thanks to Intel's 3D XPoint memory.
Intel's 3D XPoint memory has been designed to perform at a consistently high level at very low queue depths; QD1 – QD4 and at low latencies. The point about these low queue depths is that it's at these depths where the vast majority of workload activity occurs in everyday usage.
Another advantage of 3D XPoint over standard NAND drives becomes apparent after the drive has been in normal operation for a time. Normally a NAND based drive will perform the best when it's new but after cycles of having data written and re-written to it, the performance starts to drop away. This doesn't happen with the 3D XPoint Optane drives, the performance remains consistent.
When it comes to performance, the Sequential speeds of the SSD 905P are good but not great in comparison with other NVMe SSD drives we have looked at … but then again superfast Sequential performance isn't really what the drive is about. Using the ATTO benchmark we got a score of 2,776MB/s for reads and 2,464MB/s which is a little quicker than the official up to 2,600MB/s for reads and up to 2,200 MB/s for writes. However, both of these scores are way off the performance of WD's Black NVMe drive, which has the fastest Sequential read/writes for a consumer drive we've seen to date.
So then what about the 4K random performance at low queue depths? A glance at 4K read/write scores in CrystalDiskMark shows this emphasis on low queue depths quite nicely. At a QD of 32 the SSD905P sits third in the table of tested drives, quite a way behind the fastest drive in this benchmark, the Plextor M9Pe(Y). However, once the drive drops to testing data at a QD of 1, the difference in 4K read performance against standard NAND equipped drives is, to say the least, startling and very, very impressive. With a read score of 268.8MB/s, it's some three and a half times faster than the nearest standard NAND equipped drive, Intel's own SSD760p.
In our IOmeter random read tests we tested at QD's 1,2, 4 and 32, the SSD 905P trounced all the other consumer drives we have tested in QD's 1,2 and 4 although the tables were turned at QD32 when a standard NAND drive, Samsung's SSD970 PRO regained the top spot.
When it comes to the drives endurance, forget about a TB TBW figure, the SSD905P's endurance figure is quoted in petabytes, yep 8.76PB to be exact, which works out to be around a massive 5TB of writes every day for the length of the 5-year warranty. That alone is a huge selling point for data intensive situations.
We found the 480GB Optane SSD 905P on Span.com for £630 (inc VAT) HERE
Pros
- Stunning random read performance at low QD.
- Astonishing endurance.
Cons
- Sequential performance isn't as impressive as the random read.
- Expensive.
Kitguru says: Intel's Optane SSD 905P offers exceptional random read performance at the low queue depths where the vast majority of everyday workloads occur and has incredible endurance but it all comes at a rather large stress to the wallet.