
The number of NVMe SSD drives continues to grow with devices being launched to cover many aspects of the storage sector. One of the latest drives to enter the fray is the Kingston's KC1000, which also has the distinction of being the company's first NVMe drive.
Somewhat surprisingly Kingston's first high performance NVMe drive hasn't been launched under their HyperX performance line but as part of the companies standard drive lineup. You can't miss it as it appears under Consumer, Business and System Builder banners.
The KC1000 has a PCIe Gen 3.0 x 4 interface with a Phison PS5007-E7 controller looking after Toshiba 15nm 2D Planer MLC NAND.
The KC1000 is available as a M.2 2280 drive or as a drive installed in a HHHL (Half-Height, Half-Length) adapter. The drive is available in three capacities; 240GB (M.2 – SKC1000/240, HHHL – SKC1000H/240G), 480GB (M.2 SKC1000/480G, HHHL – SKC1000H/480G) and the flagship 950GB unit (M.2 SKC1000/960G, HHHL – SKC1000H/960G).
Official performance figures quoted for the 960GB drive are up to 2,700MB/s and 1,600MB/s for Sequential read/writes respectively and up to 190,000 IOPS for 4K random reads and to 165,000 IOPS for 4K random writes.
Endurance for the 960GB drive is quoted as 1PB or 0.58 DWPD for the length of the 5 year warranty.
Physical Specifications:
Usable Capacities: 240GB, 480GB, 960GB
NAND Components: 15nm MLC
Interface: PCIe Gen 3.0 x4 (NVMe)
Form Factor: HHHL (Half-Height, Half-Length) adapter
NAND Controller: Phison PS5007-E7
Dimensions: 180.98 x 120.96 x 21.59mm
Drive Weight: 76g
Firmware Version: E7FT04.6
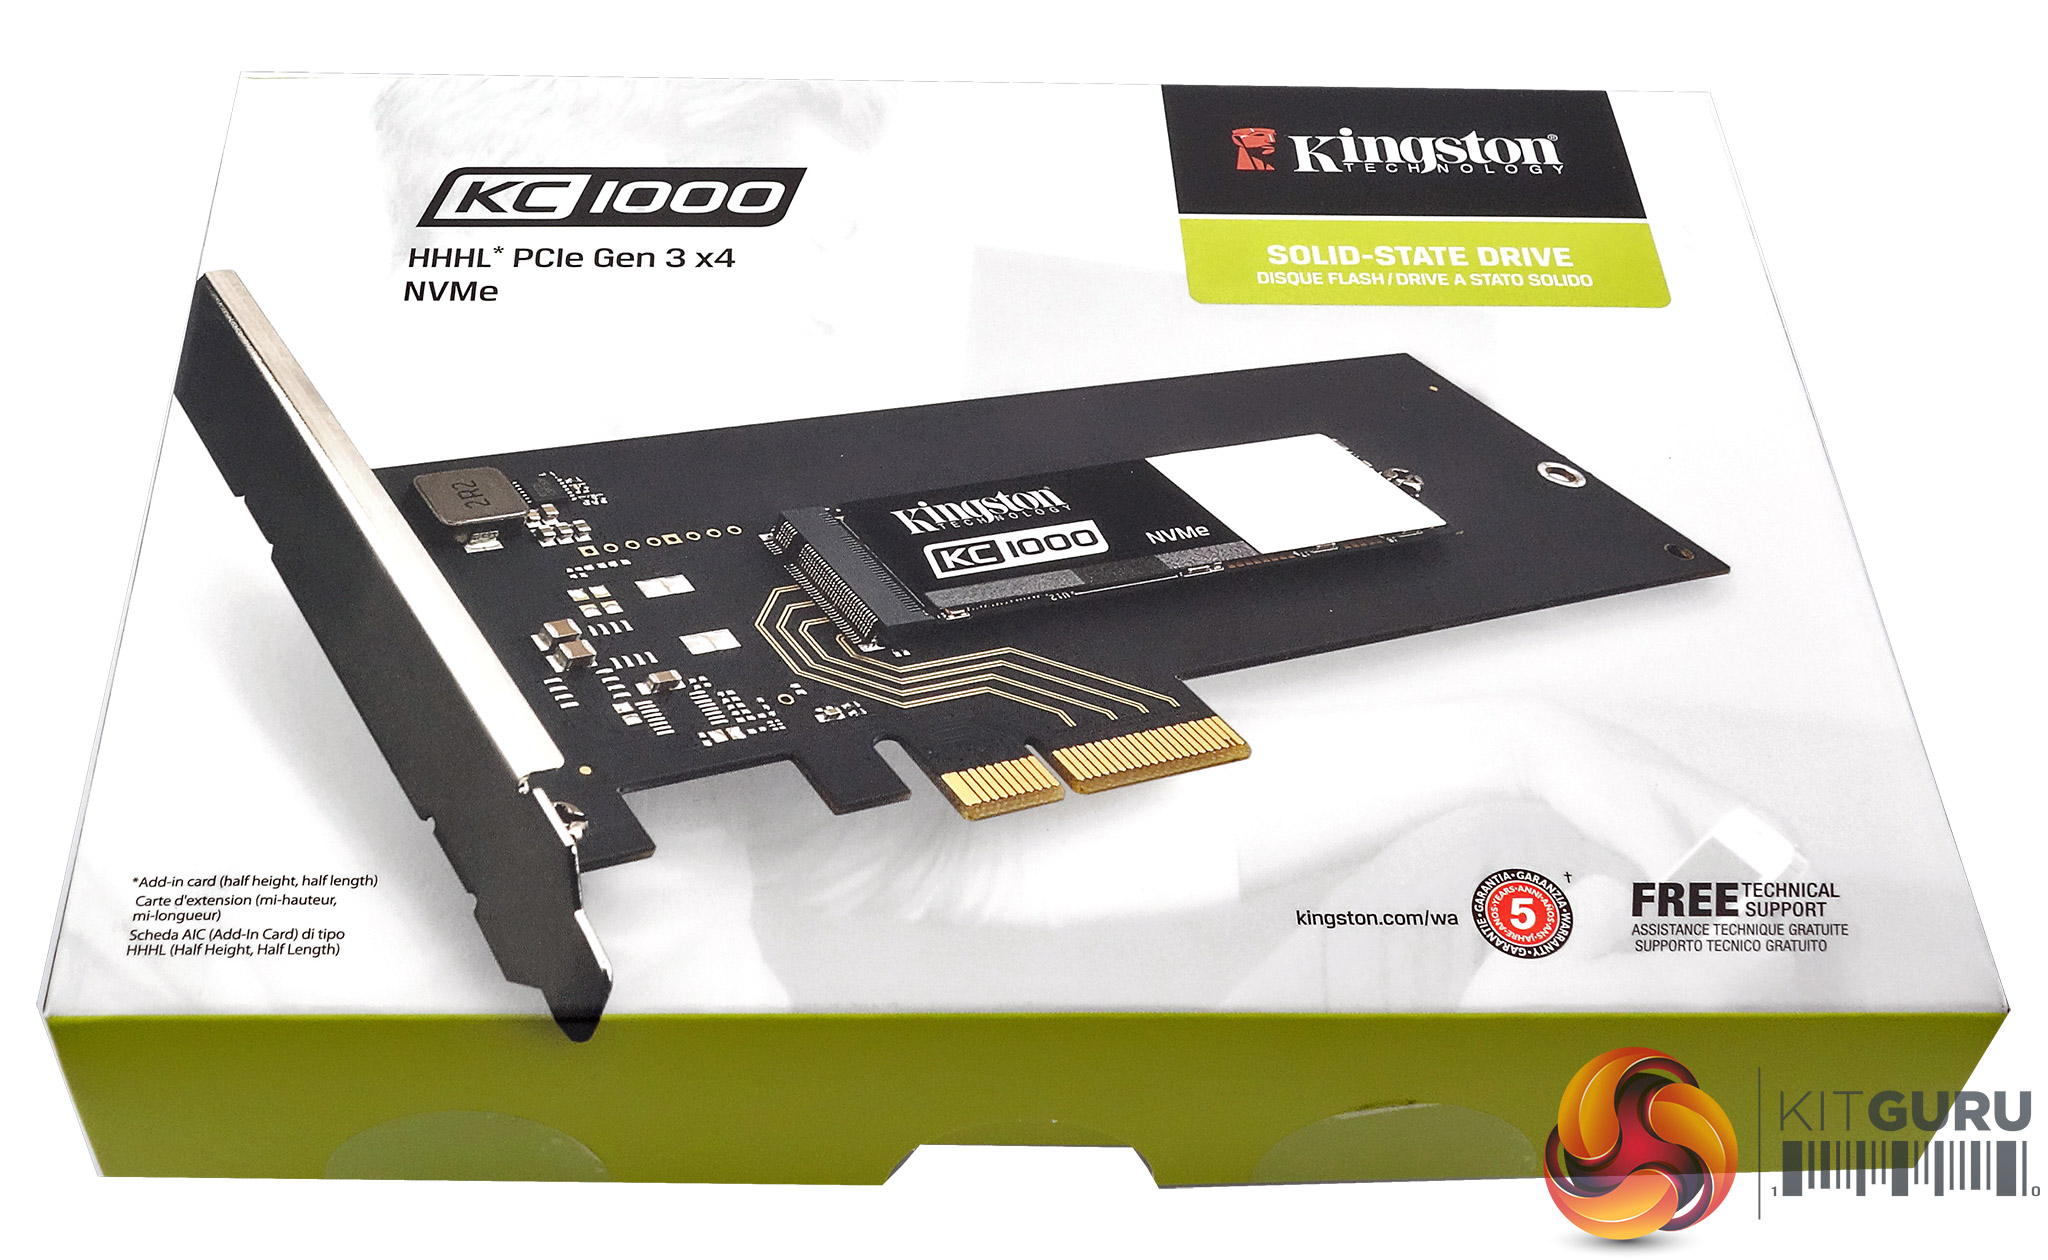
The Kingston KC1000 comes in a clamshell type box with a good clear image of the drive on the front along with description of what HHHL stands for, logo for the 5-year warranty and a reminder that the drive comes with free technical support.
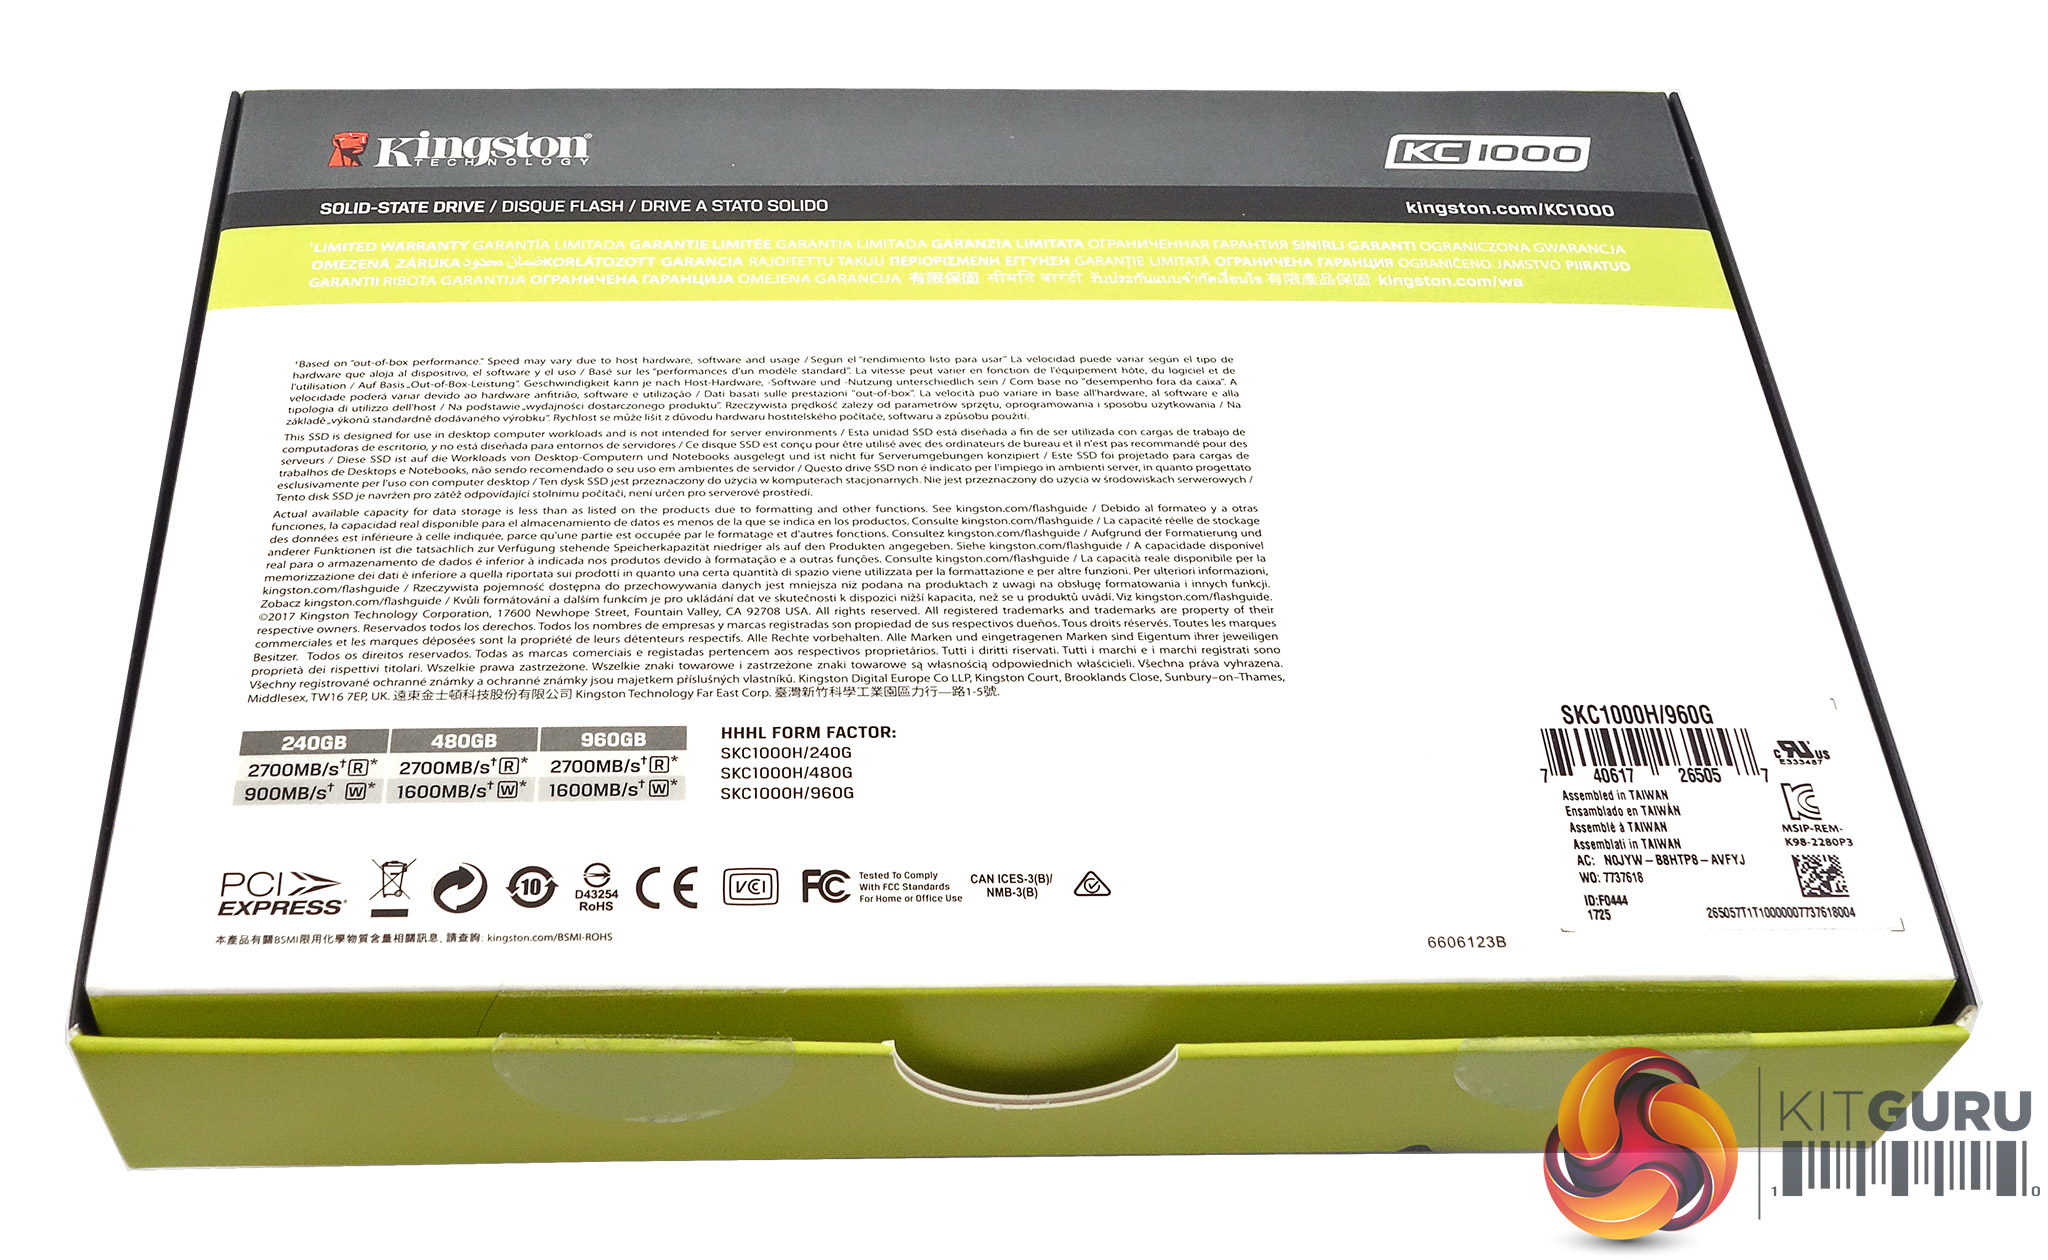
The rear of the box has a panel at the top holding multilingual limited warranty information. Under this is another multilingual section, this time with notes about performance, what workloads the KC1000 has been designed to work with and capacity.
Sitting under these are the Sequential read/write figures for all three capacities of drive along with the product codes for all three HHHL models. At the bottom right-hand corner of the box is the product code along with the capacity.

Bundled in with the drive is a low-profile bracket along with a small getting started guide and a download coupon for Acronis True Image backup software.
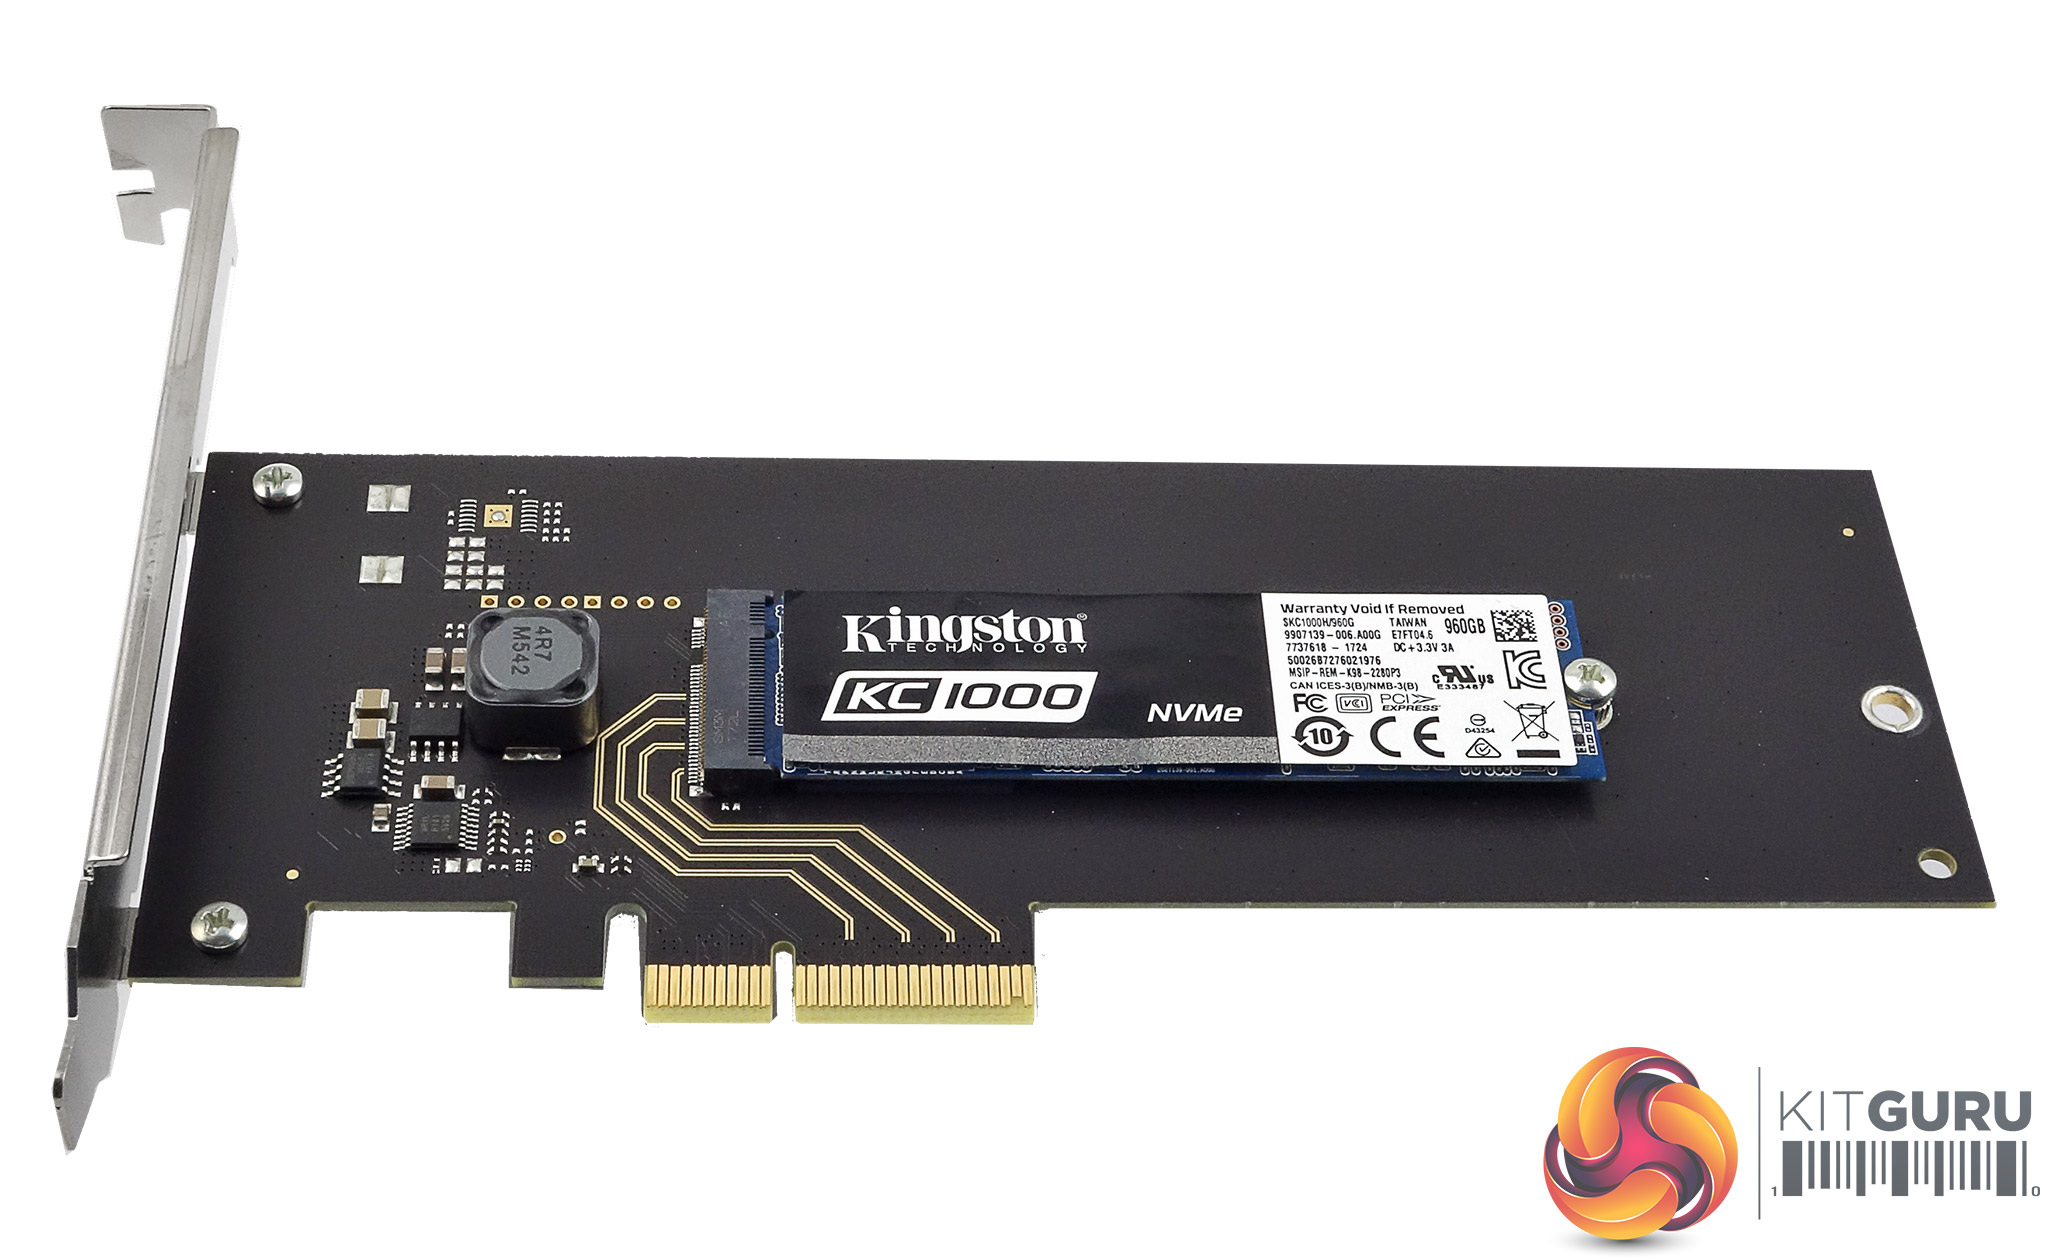
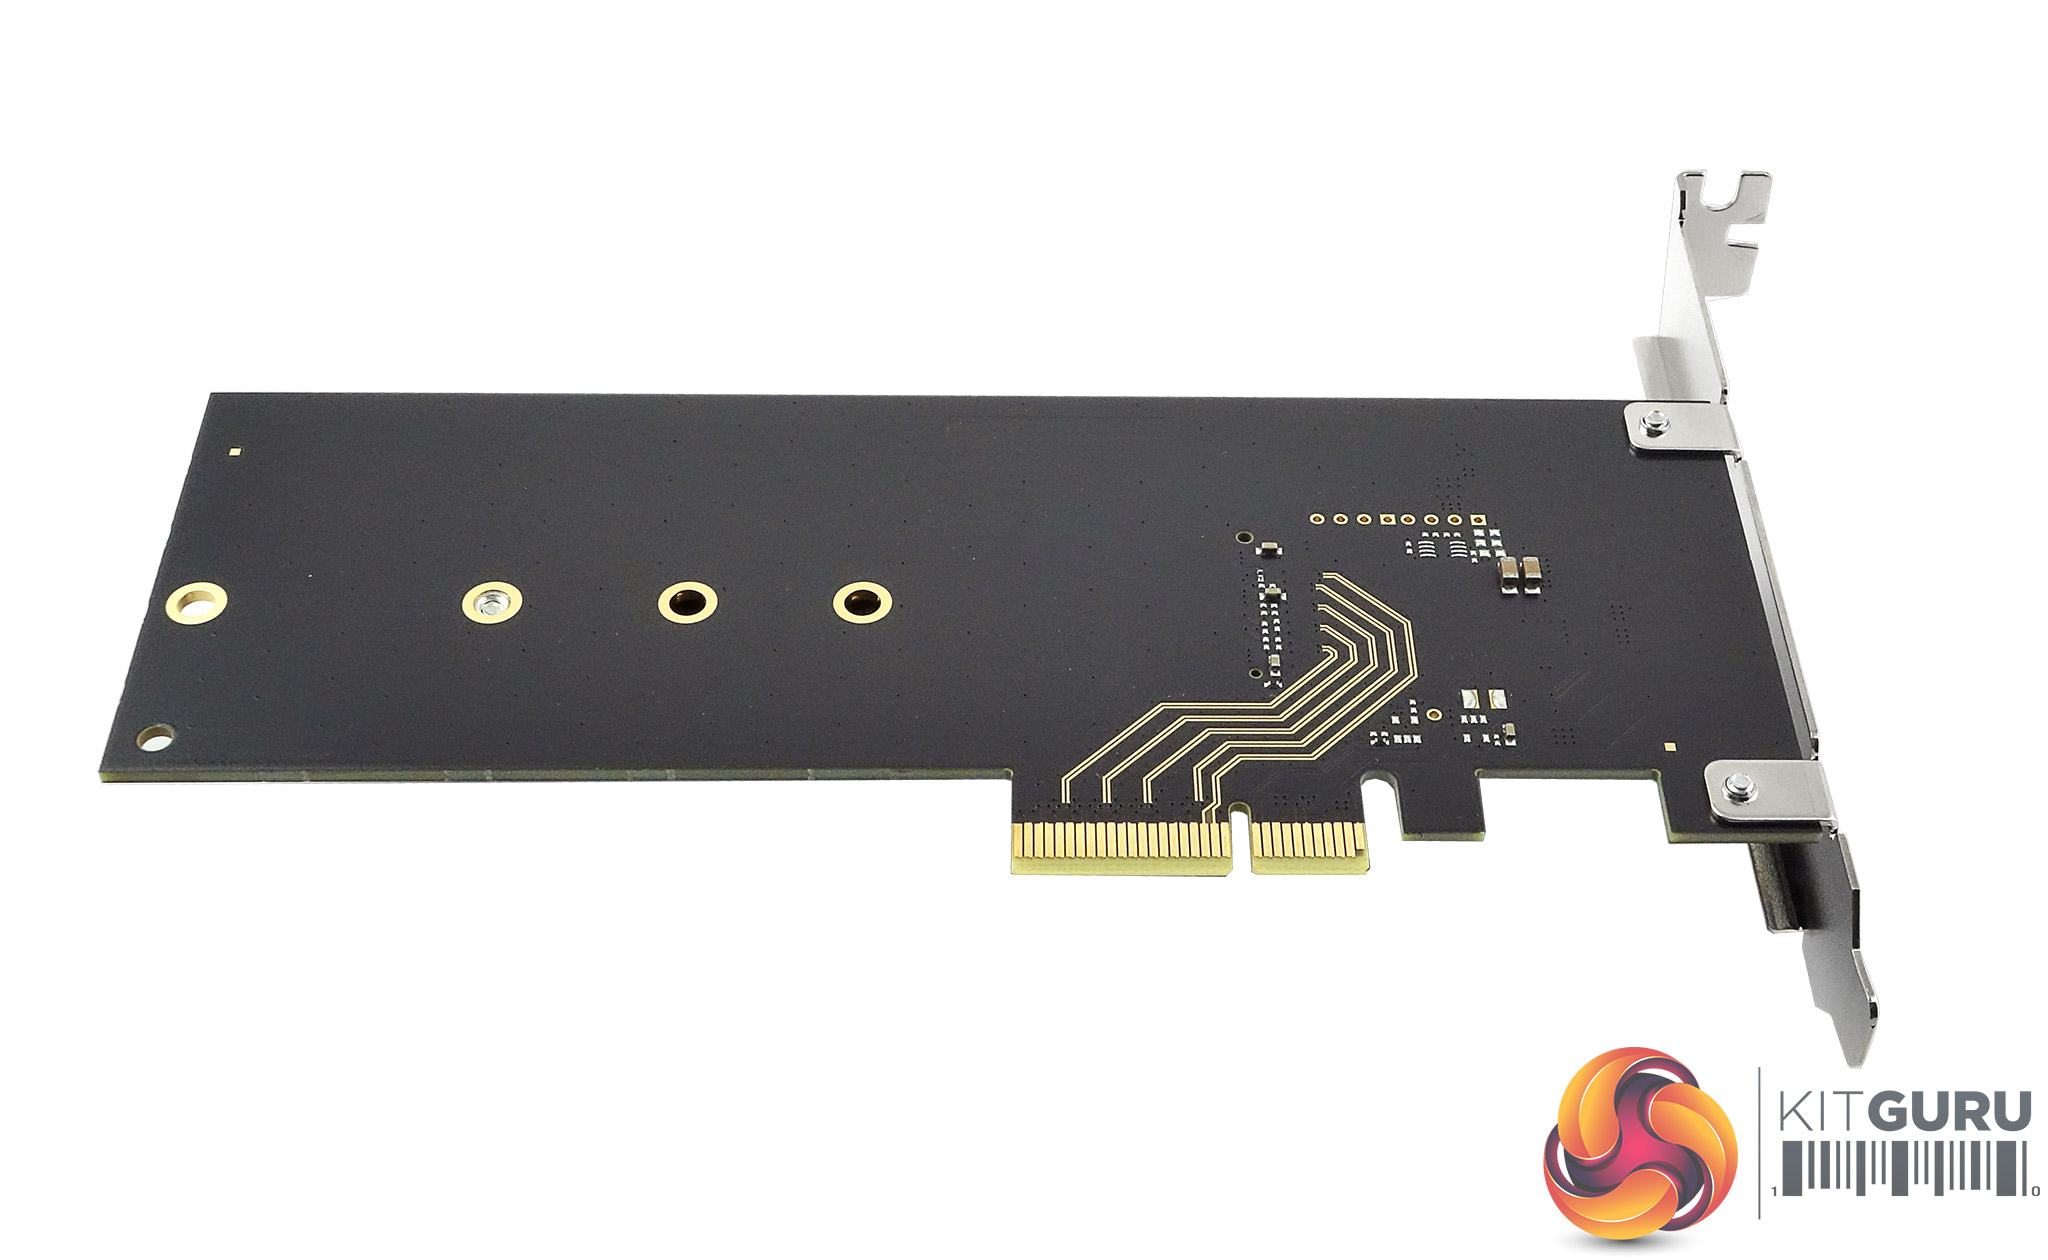
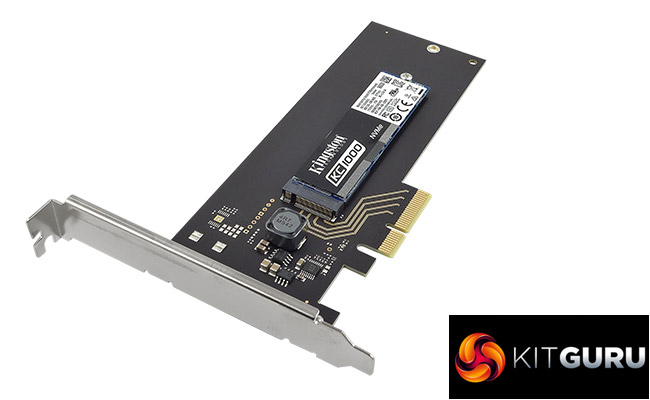
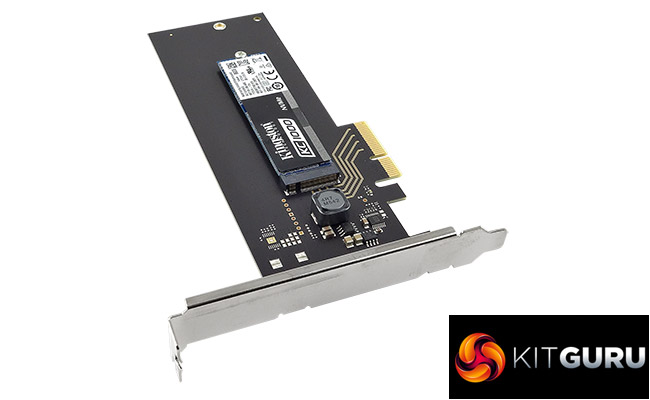
The HHHL (Half-Height, Half-Length) adapter version of the KC1000 means that those people who have an older motherboard without a PCIe M.2 slot but with a spare PCIe x4 slot can still use the drive. It's an attractive looking PCB with the gold trackways standing out well against the black finish of the PCB.
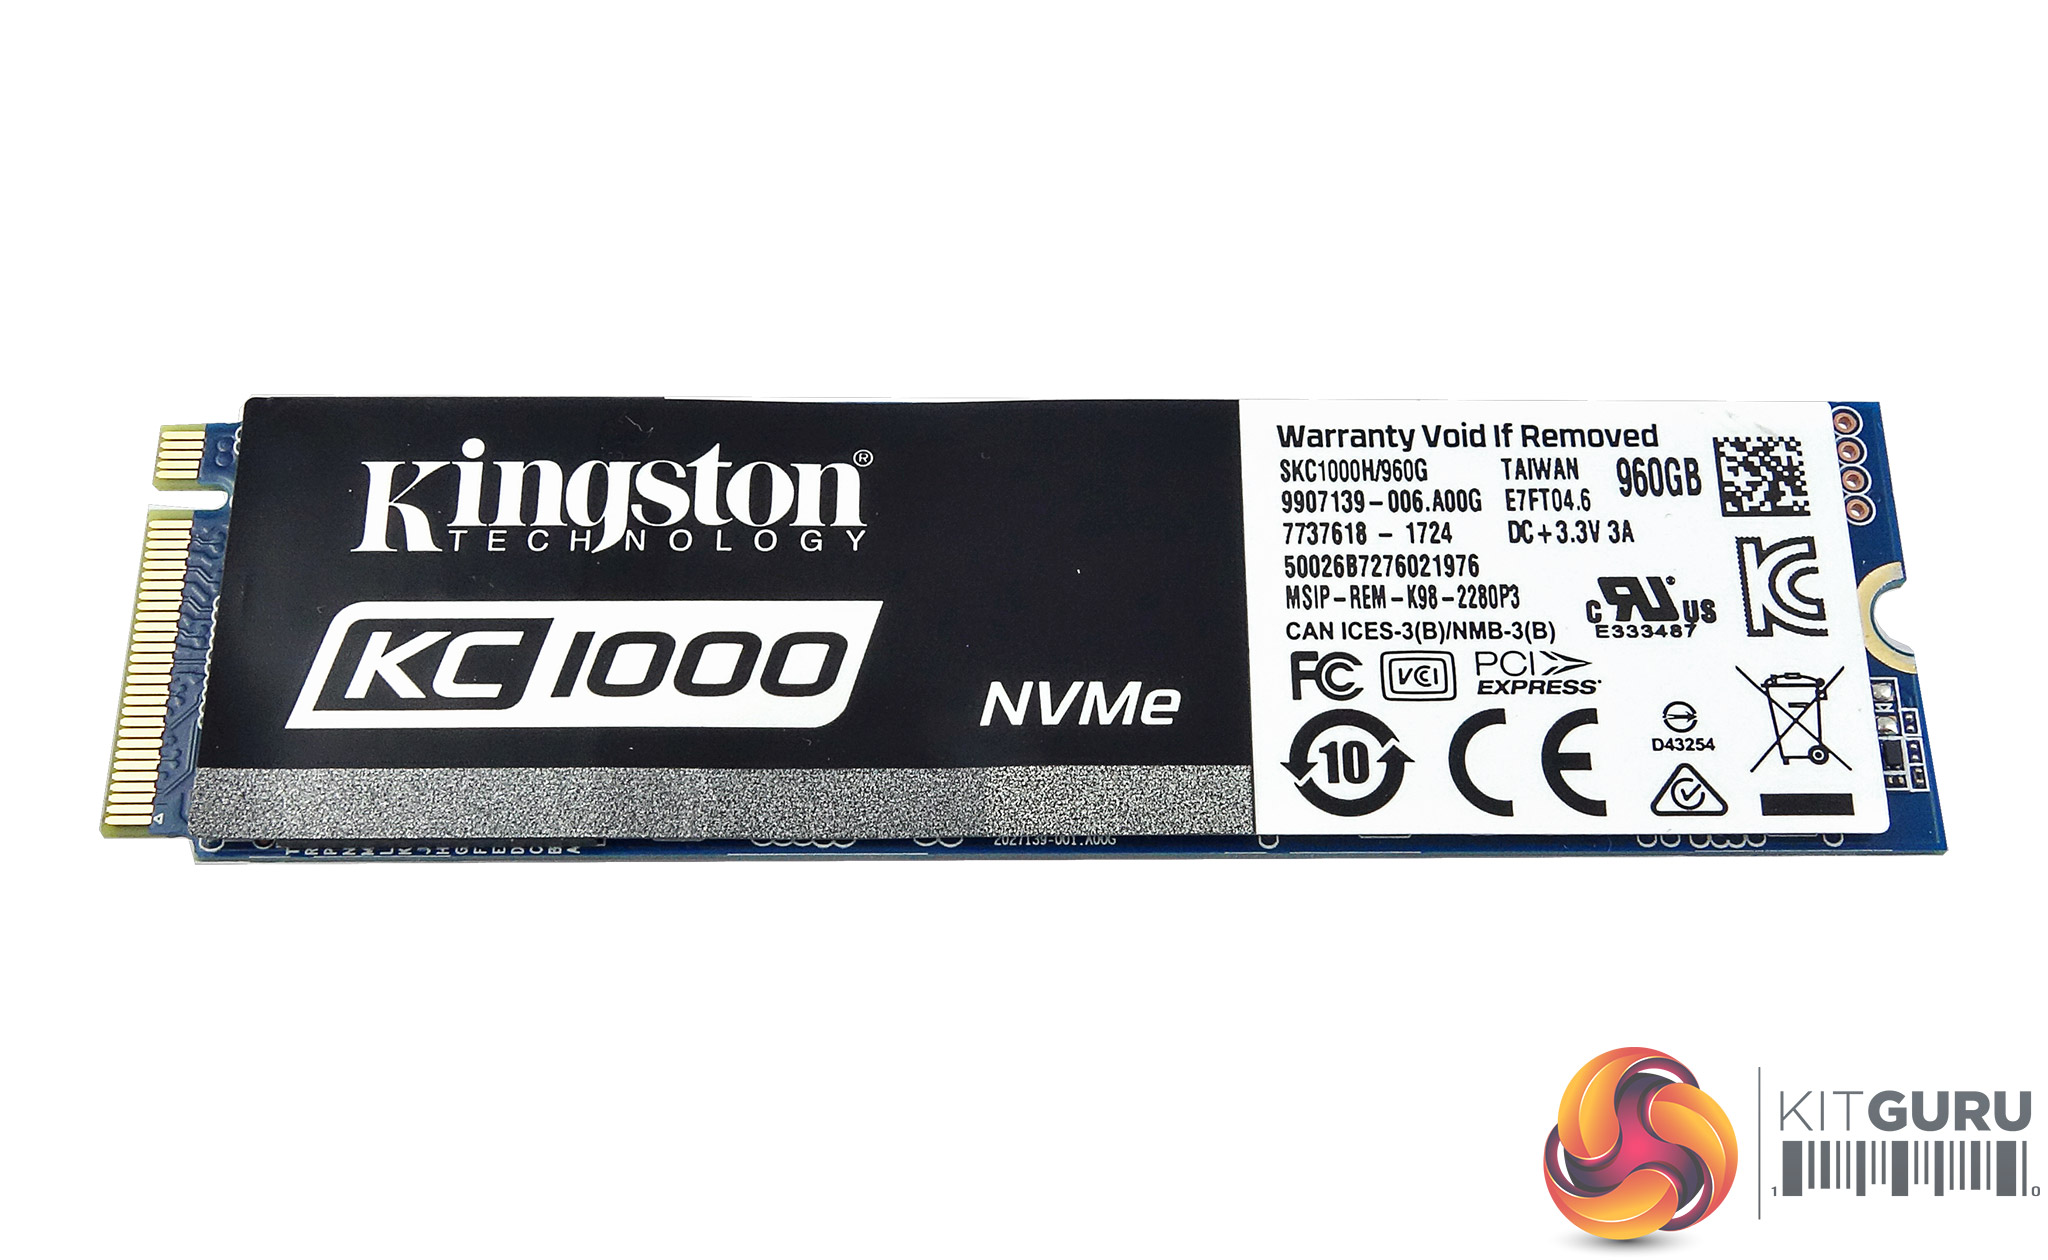
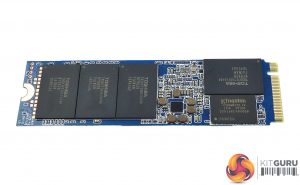
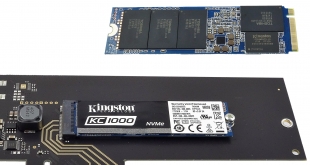
The KC1000 drive itself is a M.2 2280 format drive with both sides of the PCB occupied by various components. The drive uses Toshiba 2D 15nm MLC NAND (coded TH58TFT0DFLBA8H) together with a Phison PS5007-E7 controller. The 8-channel PS5007-E7 is Phison's first PCIe NVMe controller bringing support for 1z nm MLC, TLC and 3D NAND.
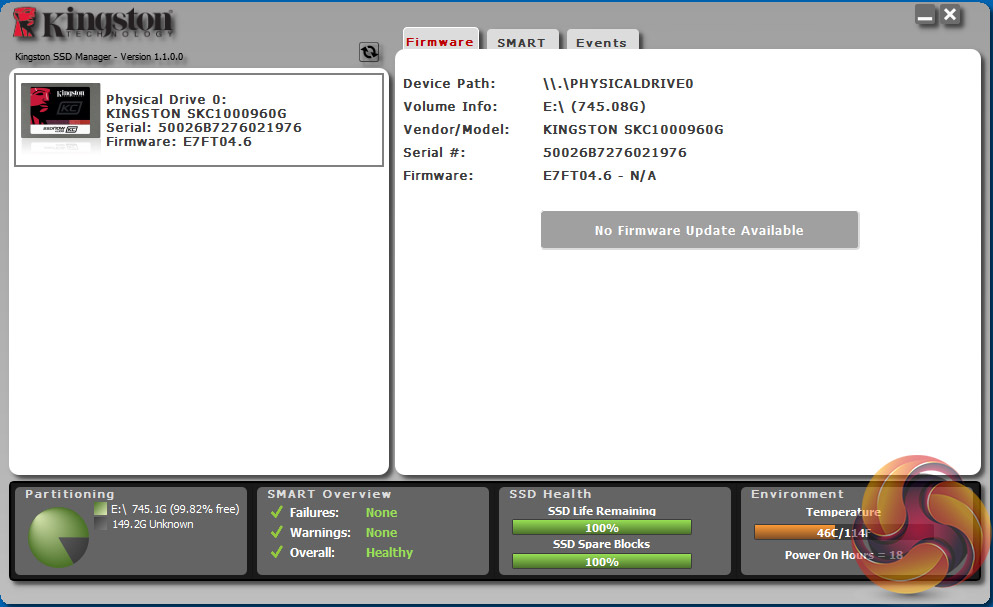
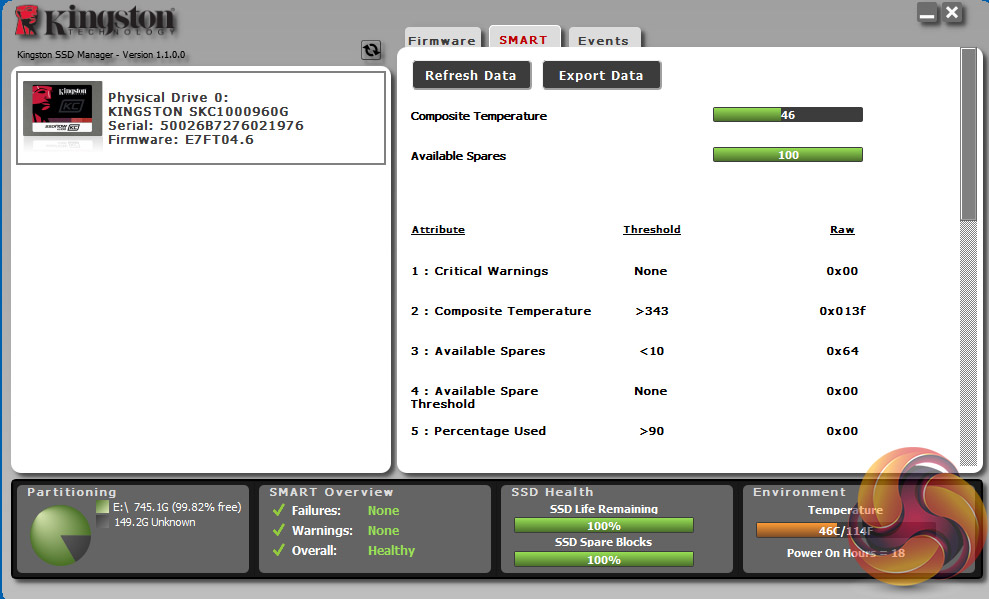
Kingston's SSD management software goes under the name of SSD Manager. It might not be as comprehensive as some of its competitors but it does display Partitioning details, an overview of S.M.A.R.T details, SSD health and drive temperature along the bottom of the page so its fairly straightforward to see what's going on at a glance. The utility also supports updating the drives firmware.
For testing, the drives are all wiped and reset to factory settings by HDDerase V4. We try to use free or easily available programs and some real world testing so you can compare our findings against your own system.
This is a good way to measure potential upgrade benefits.
Main system:
Intel Core i7-7700K with 16GB of DDR4-3200 RAM, Sapphire R9 390 Nitro and an Asus Prime Z270-A motherboard.
Other drives:
Corsair Force MP500 480GB
Intel Optane Memory 32GB
Kingston HyperX Predator 480GB
OCZ RevoDrive 350 480GB
OCZ RevoDrive 3 x2 480GB
Plextor M8PeG 512GB
Plextor M6e Black Edition PCIe 256GB
PNY CS2030 240GB
Samsung SSD960 PRO 2TB
Samsung SSD960 EVO 1TB
Samsung SSD950 PRO 256GB
Samsung SM951 256GB
Samsung XP941 512GB
Toshiba OCZ RD400 512GB
Western Digital Black PCIe 512GB
Software:
Atto Disk Benchmark.
CrystalMark 3.0.3.
AS SSD.
IOMeter
All our results were achieved by running each test five times with every configuration this ensures that any glitches are removed from the results. Trim is confirmed as running by typing fsutil behavior query disabledeletenotify into the command line. A response of disabledeletenotify =0 confirms TRIM is active.
Crystalmark is a useful benchmark to measure theoretical performance levels of hard drives and SSD’s. We are using V3.0.3.
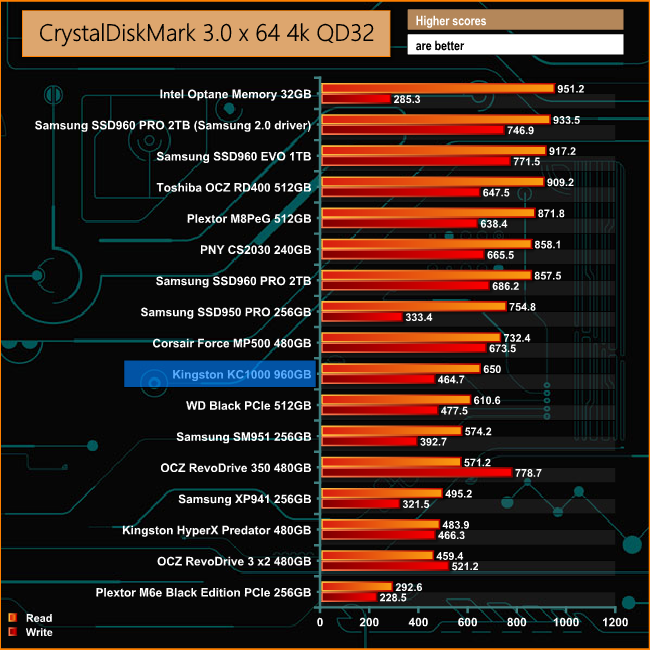
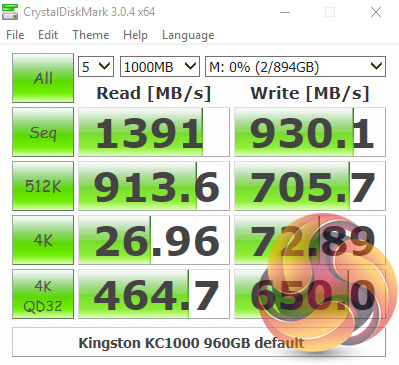
When it comes to dealing with small bity file's at fairly deep queue depths, the KC1000 lags behind a number of the drives we have looked at recently for both reads and writes.
While its write performance is on par with the last Kingston M.2 drive, the non NVMe HyperX Predator, its read performance is much improved.
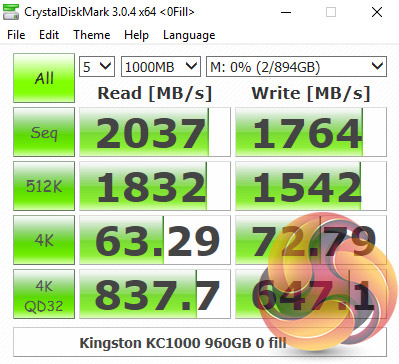
The Phison PS5007-E7 controller is clearly happier dealing with highly compressible data as can be seen by the jump in read performance in particular, when the drive is tested with the highly compressible data test of CrystalDiskMark.
The ATTO Disk Benchmark performance measurement tool is compatible with Microsoft Windows. Measure your storage systems performance with various transfer sizes and test lengths for reads and writes. Several options are available to customize your performance measurement including queue depth, overlapped I/O and even a comparison mode with the option to run continuously.
Use ATTO Disk Benchmark to test any manufacturers RAID controllers, storage controllers, host adapters, hard drives and SSD drives and notice that ATTO products will consistently provide the highest level of performance to your storage.
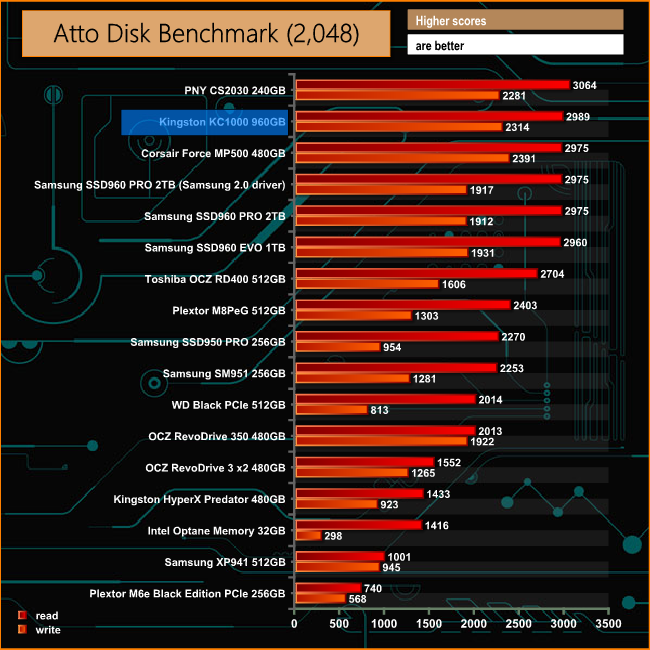
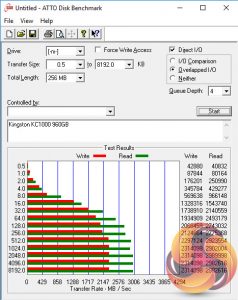
Under the ATTO benchmark the review drive produced Sequential read/write figures of 2,989MB/s and 2,314MB/s respectively which is way above Kingston's official Sequential figures – 2,700 MB/s for reads and 1,600MB/s for writes. These do seem very conservative in light of the scores we got from the drive.
AS SSD is a great free tool designed just for benching Solid State Drives. It performs an array of sequential read and write tests, as well as random read and write tests with sequential access times over a portion of the drive. AS SSD includes a sub suite of benchmarks with various file pattern algorithms but this is difficult in trying to judge accurate performance figures.
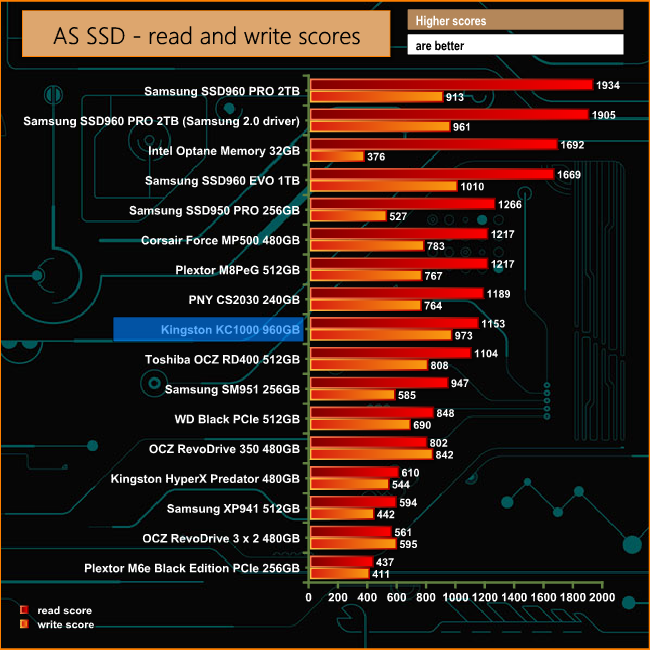
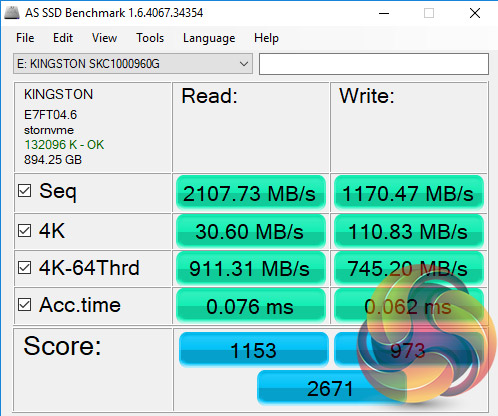
While it's AS SSD read score of 1153 puts it around half way on our list of drives tested, the 973 write score of the KC1000 is the second fastest we have seen to date, behind Samsung's SSD960 EVO.
IOMeter is another open source synthetic benchmarking tool which is able to simulate the various loads placed on hard drive and solid state drive technology.

We test with both random read and write 4k tests, as shown above. There are many ways to measure the IOPS performance of a Solid State Drive, so our results will sometimes differ from manufacturer’s quoted ratings. We do test all drives in exactly the same way, so the results are directly comparable.
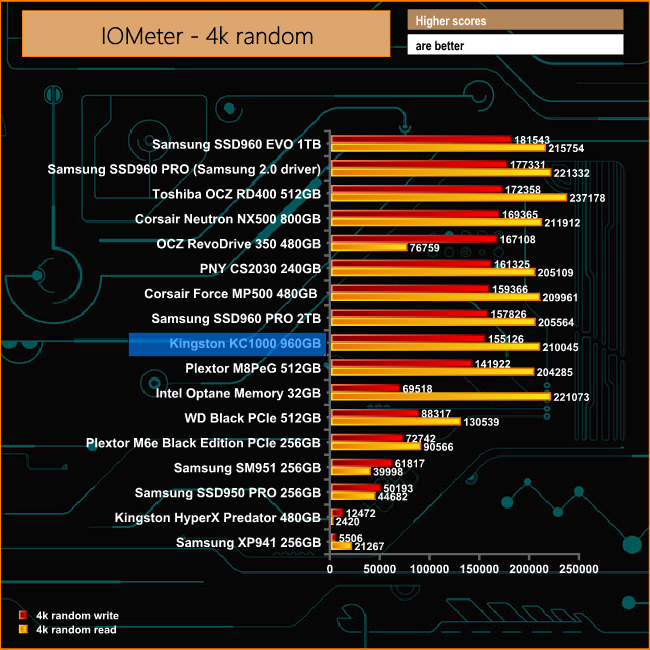
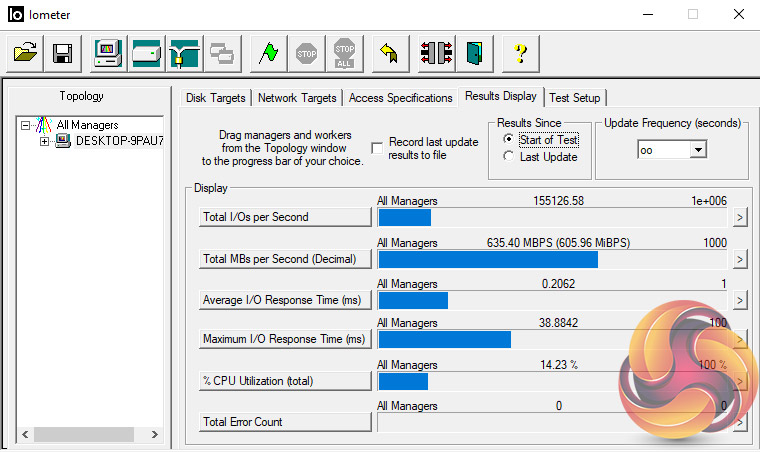
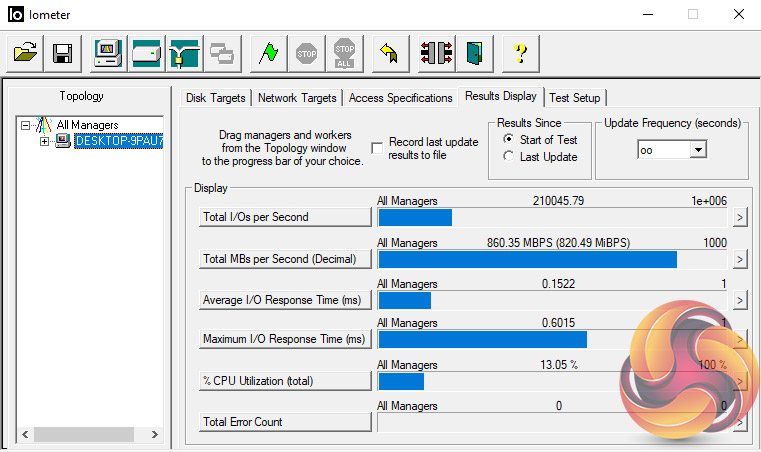
Its swings and roundabouts with the random 4K figures. Under test the drive produced 155,126 IOPS for writes which is down on the official 165,000 IOPS. On the other hand the read figure of 210,045 IOPS surpassed the official 190,000 IOPS rated figure.
Futuremark’s PCMark 8 is a very good all round system benchmark but it’s Storage Consistency Test takes it to whole new level when testing SSD drives. It runs through four phases; Preconditioning, Degradation, Steady State, Recovery and finally Clean Up. During the Degradation, Steady State and Recovery phases it runs performance tests using the 10 software programs that form the backbone of PCMark 8; Adobe After Effects, Illustrator, InDesign, Photoshop Heavy and Photoshop Light, Microsoft Excel, PowerPoint, Word, Battlefield 3 and World of Warcraft. With some 18 phases of testing, this test can take many hours to run.
Preconditioning
The drive is written sequentially through up to the reported capacity with random data, write size of 256 × 512 = 131,072 bytes. This is done twice.
Degradation
Run writes of random size between 8 × 512 and 2048 × 512 bytes on random offsets for 10 minutes. It then runs a performance test. These two actions are then repeated 8 times and on each pass the duration of random writes is increased by 5 minutes.
Steady State
Run writes of random size between 8 × 512 and 2048 × 512 bytes on random offsets for final duration achieved in degradation phase. A performance test is then run. These actions are then re-run five times.
Recovery
The drive is idled for 5 minutes. Then a performance test is run. These actions are then repeated five times.
Clean Up
The drive is written through sequentially up to the reported capacity with zero data, write size of 256 × 512 = 131,072 bytes.
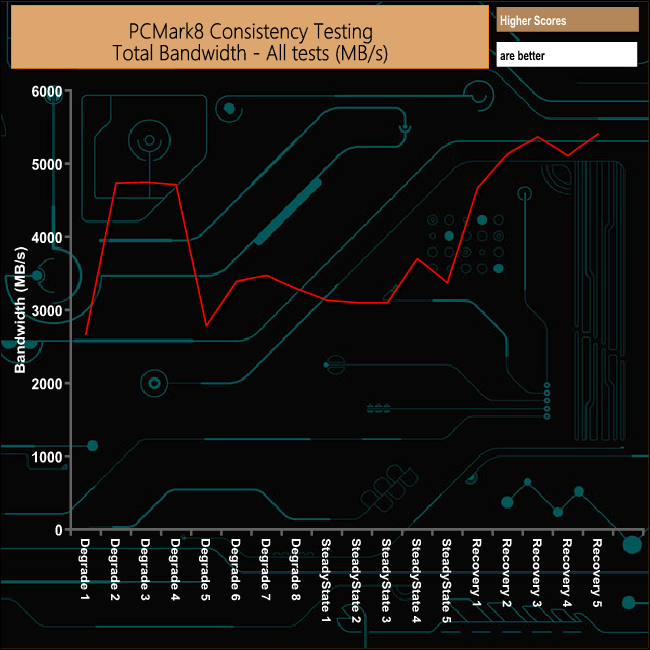
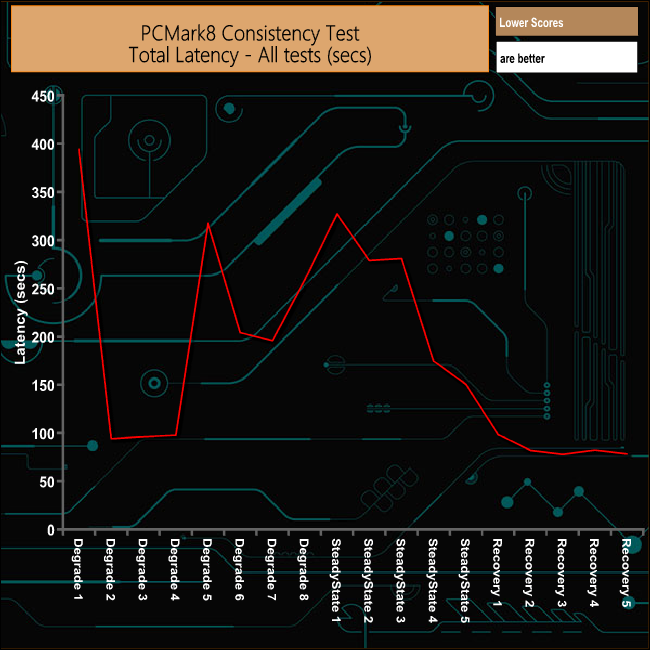
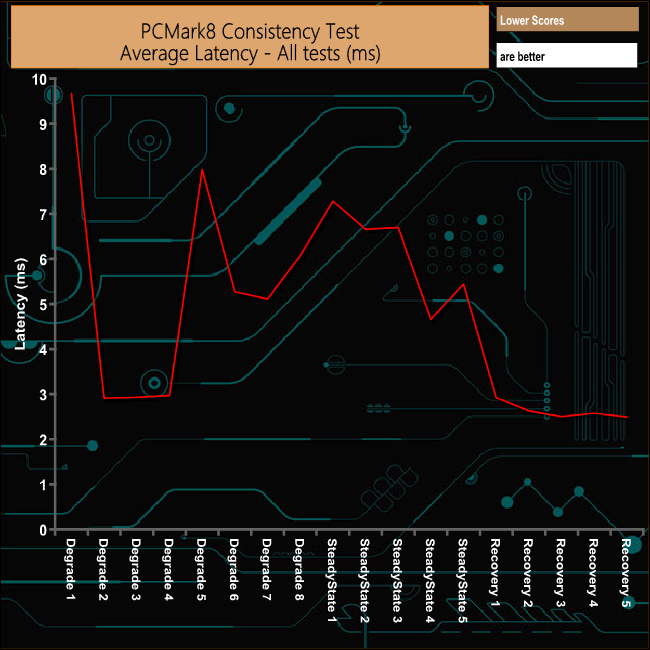
The KC1000 shows a burst of performance at the beginning of the Degrade run of PCMark 8's Consistency test before dropping back towards the end of the run and through the Steady State runs. It does however recover well from the stresses of the test.
PCMark 8’s Consistency test provides a huge amount of performance data, so here we’ve looked a little closer at how the KC1000 960GB performs in each of the benchmarks test suites.
Adobe Creative Cloud
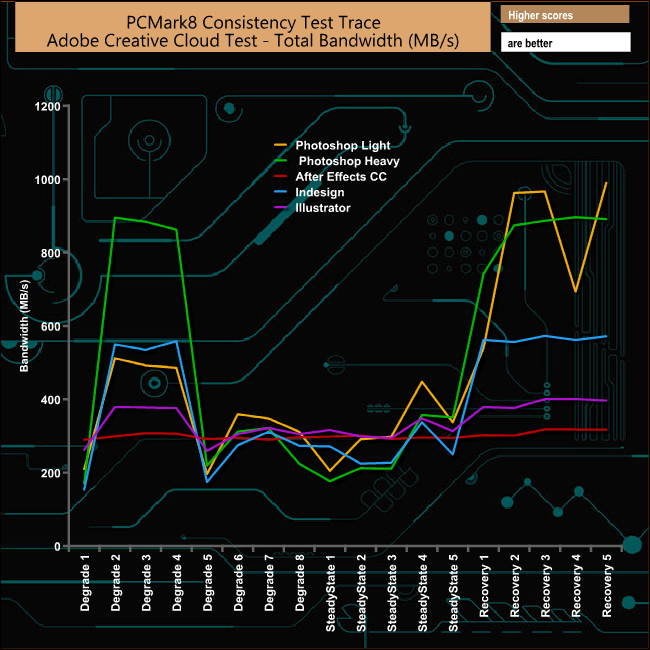
The Photoshop Heavy test is one that tends to stress drives the most and the Kingston KC1000 is no different. From the beginning of the test through Degrade runs 2 to 4 where bandwidth peaks at 880MB/s it then drops to 176MB/s at the start of the Steady State runs. However It recovers well from the ordeal at an average bandwidth of 858MB/s for the five recovery runs.
Microsoft Office
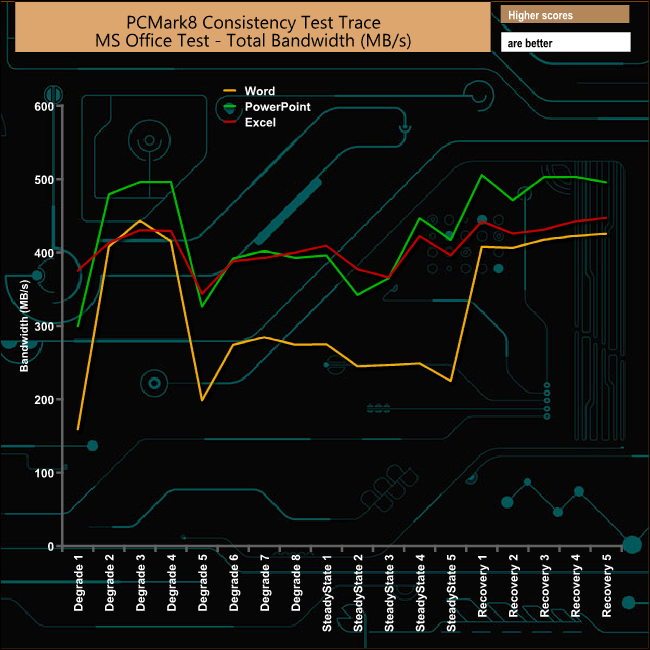
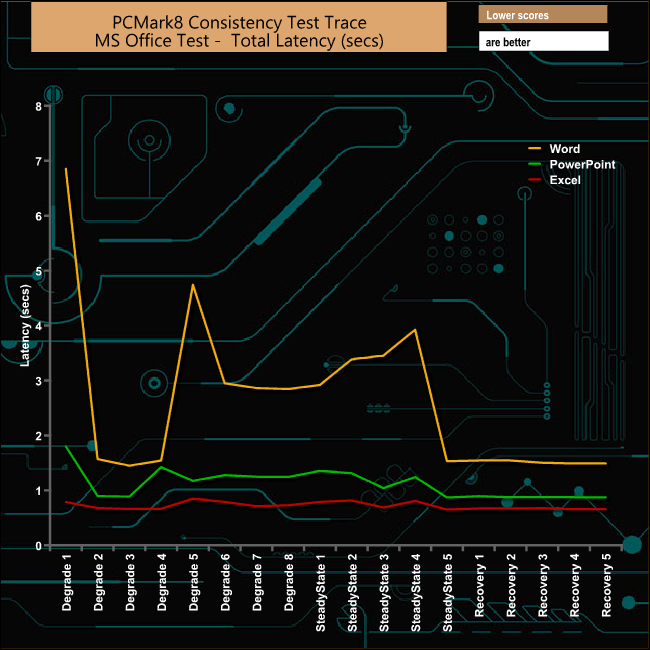
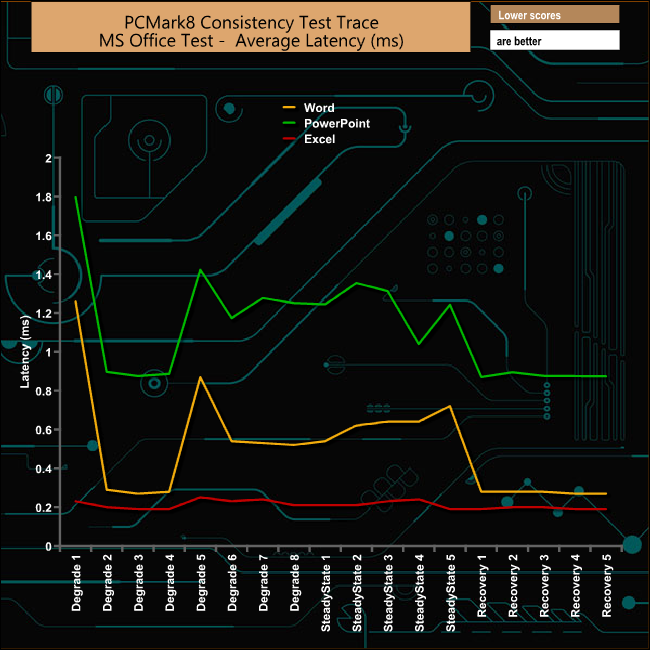
In the Microsoft Office suite, it’s the Word tests that stress’s the drive but nowhere near as hard as the Photoshop Heavy test. Once again the drive shows very good recovery from the Degrade and Steady State tests.
Casual Gaming
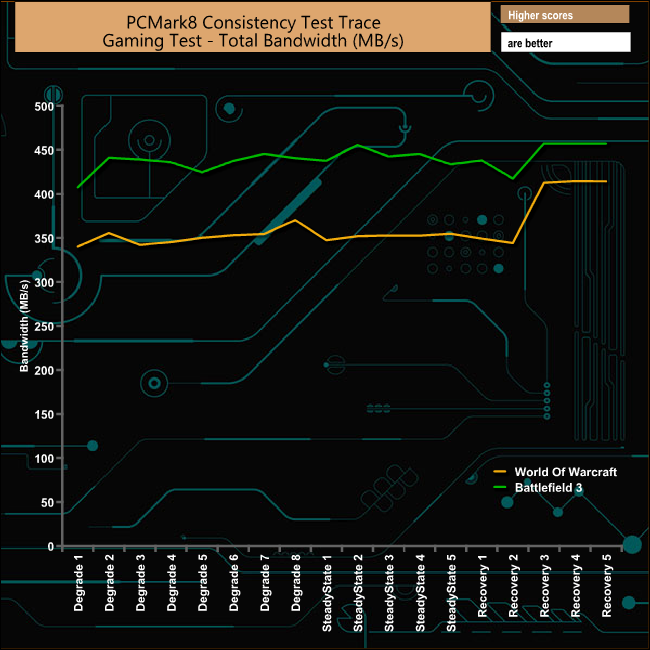
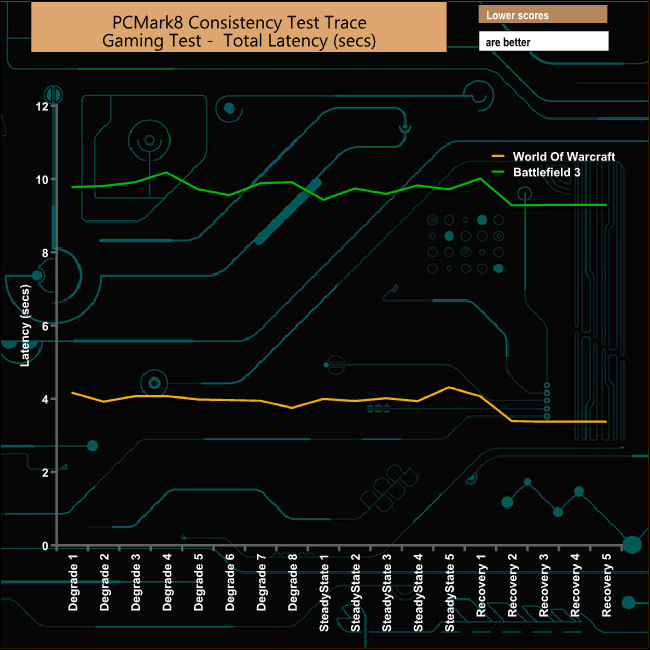
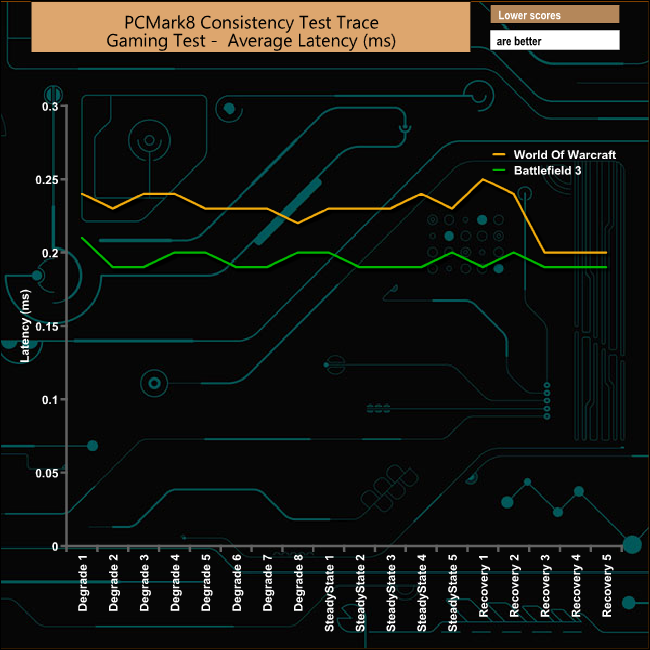
Kingston's KC1000 makes light work of the Casual Gaming test with a pretty good level of performance for both World Of Warcraft and Battlefield 3 throughout the test.
Just like the Consistency test, PCMark 8’s standard Storage test also saves a large amount of performance data. The default test runs through the test suite of 10 applications three times. Here we show the total bandwidth performance for each of the individual test suites for the third and final benchmark run.
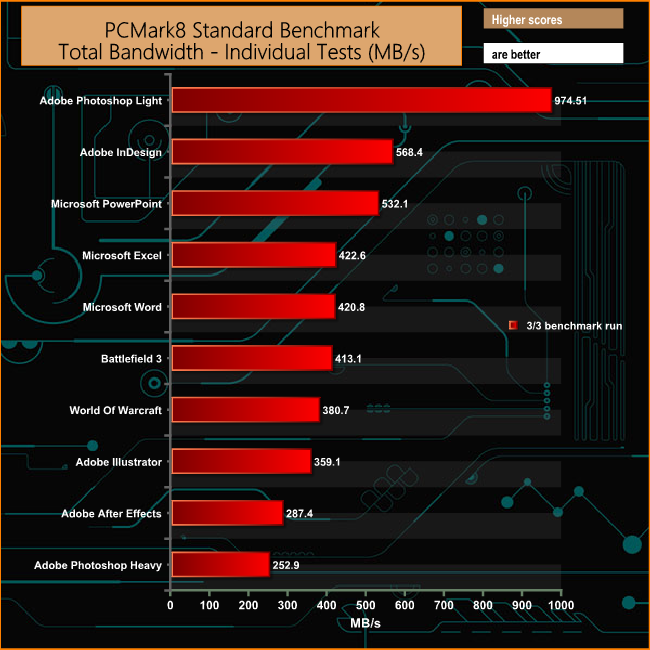
The drive takes the Adobe Photoshop Light tests in its stride with a total bandwidth for the test of 974.51MB/s. Its a different story with the much more demanding Photoshop Heavy test. The drive really struggles through the test resulting in a bandwidth of just 252.9MB/s.
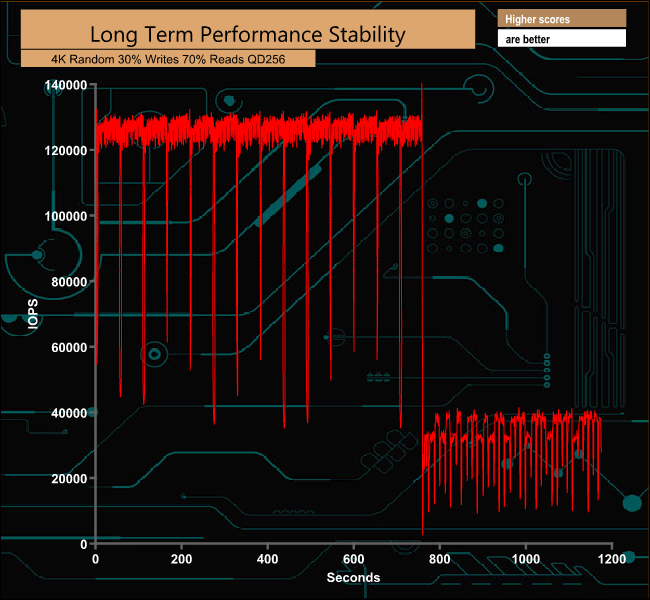
For the long term performance stability test, we set the drive up to run a 20-minute 4K random test with a 30% write, 70% read split, at a Queue Depth of 256 over the entire disk. The 960GB KC1000 averaged 92,658 IOPS for the test with a performance stability of 71%.
To test real life performance of a drive we use a mix of folder/file types and by using the FastCopy utility (which gives a time as well as MB/s result) we record the performance of drive reading from & writing to a 256GB Samsung SSD850 PRO.
60GB Steam folder – 29,521 files.
50GB File folder – 28,523 files.
12GB Movie folder – 24 files (mix of Blu-ray and 4K files).
10GB Photo folder – 621 files (mix of .png, raw and .jpeg images).
10GB Audio folder – 1,483 files (mix of mp3 and .flac files).
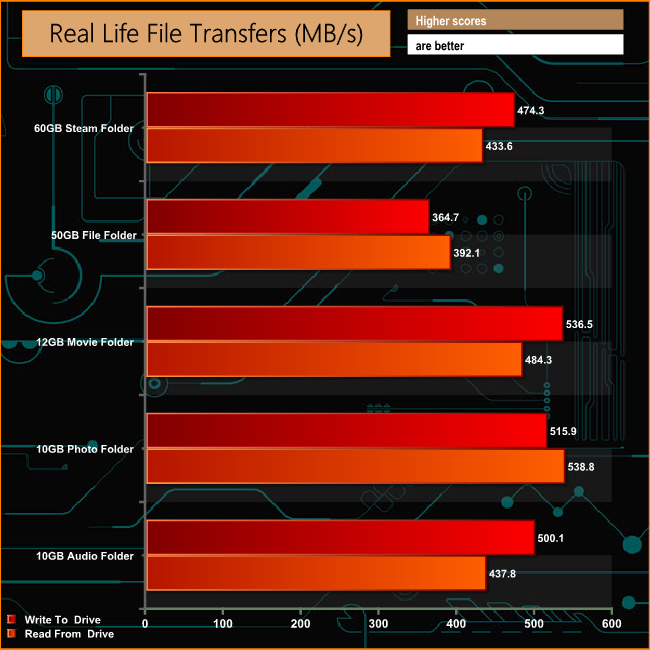
The KC1000 sailed through the real life folder transfer tests without any problems, hitting and passing the 500MB/s mark when writing the contents of the multimedia folders.
It is somewhat of a surprise to find that the fastest Kingston drive we have tested to date doesn't come from the companies high performance HyperX line. The KC1000 is listed under the company's Consumer, Business and System Builder segments. This does make me wonder what might be on its way from the HyperX side of the business.
The KC1000 is a very quick drive – Kingston officially quote sequential read/write figures for the 960GB version of up to 2,700MB/s and 1,600MB/s respectively. Unusually for official company figures these appear to be rather conservative, especially the write performance. Using the ATTO benchmark we got a read score of 2,989MB/s and a write score of 2,314MB/s.
Random 4K read performance is quoted at up 190,000 IOPS, and again we sailed passed this with a score of 210,045 IOPS. That said the tested 4K random write performance of 155,216 IOPS was short of the official 165,000 IOPS number.
We like the idea of offering the drive in two formats. A M.2 2280 drive if your motherboard has a x4 PCIe M.2 slot or having the drive mounted in PCIe card for those people who have a motherboard a couple of generations older than the current ones with no M.2 slot.
The drives endurance is stated at 1PB TDW or 0.58 DWPD (Drive Writes Per Day) of the 5 year warranty.

We found the 960GB HHHL version of the KC1000 available to preorder at Overclockers UK for £489.95 (inc VAT) HERE
Discuss on our Facebook page, over HERE.
Pros
- Overall performance.
- Choice of formats for the drive.
- Acronis True HD download voucher.
- Endurance.
Cons
- 4K performance is a bit disappointing.
Kitguru says: Kingston's KC1000 NVMe SSD is the fastest Kingston drive we have tested to date. It combines fast performance and a large capacity with very strong all round endurance.

Be sure to check out our sponsors store EKWB here