

Probably better known for their comprehensive range of memory cards, Lexar also has a range of SSDs in M.2 NVMe, M.2 SATA and 2.5in SATA formats. The current flagship of the NVMe M.2 range is the NM600, using a combination of a Silicon Motion controller and Micron 3D TLC NAND.
There are just two capacities in the NM600 range, 480GB and 240GB. The drives use Micron 64-layer 3D TLC NAND combined with a Silicon Motion SM2263XT, 4-channel controller. The XT version of Silicon Motion's SM2263 used by the NM600, is a DRAM-less design which helps keep the cost of a drive down by reducing the number of components needed on the PCB.
Official Sequential Read/Write figures for the 480GB model are up to 2,100MB/s and 1,600MB/s respectively. The 240GB drive is rated at up to 2,000MB/s for reads and 1,200MB/s for writes.
When it comes to 4K random performance the 480GB drive is rated as up to 188,000 IOPS for reads and 156,000 IOPS for writes. For the 240GB drive it's up to 110,000 IOPs and 151,000 IOPS for read and writes respectively.
Endurance for the 480GB NM600 is stated as 240TBW (the 240GB drive is 120TBW) and Lexar back the drive with a 3-year limited warranty.
Physical Specifications:
- Usable Capacities: 480GB.
- NAND Components: Micron 64-layer 3D TLC.
- NAND Controller: Silicon Motion SM2263XT.
- Cache: none.
- Interface: PCIe Gen3 x4. (NVMe 1.3).
- Form Factor: M.2 2280.
- Dimensions: 80 x22 x 2.25 mm.
- Drive Weight: 9g.
Firmware Version: R1115A0.
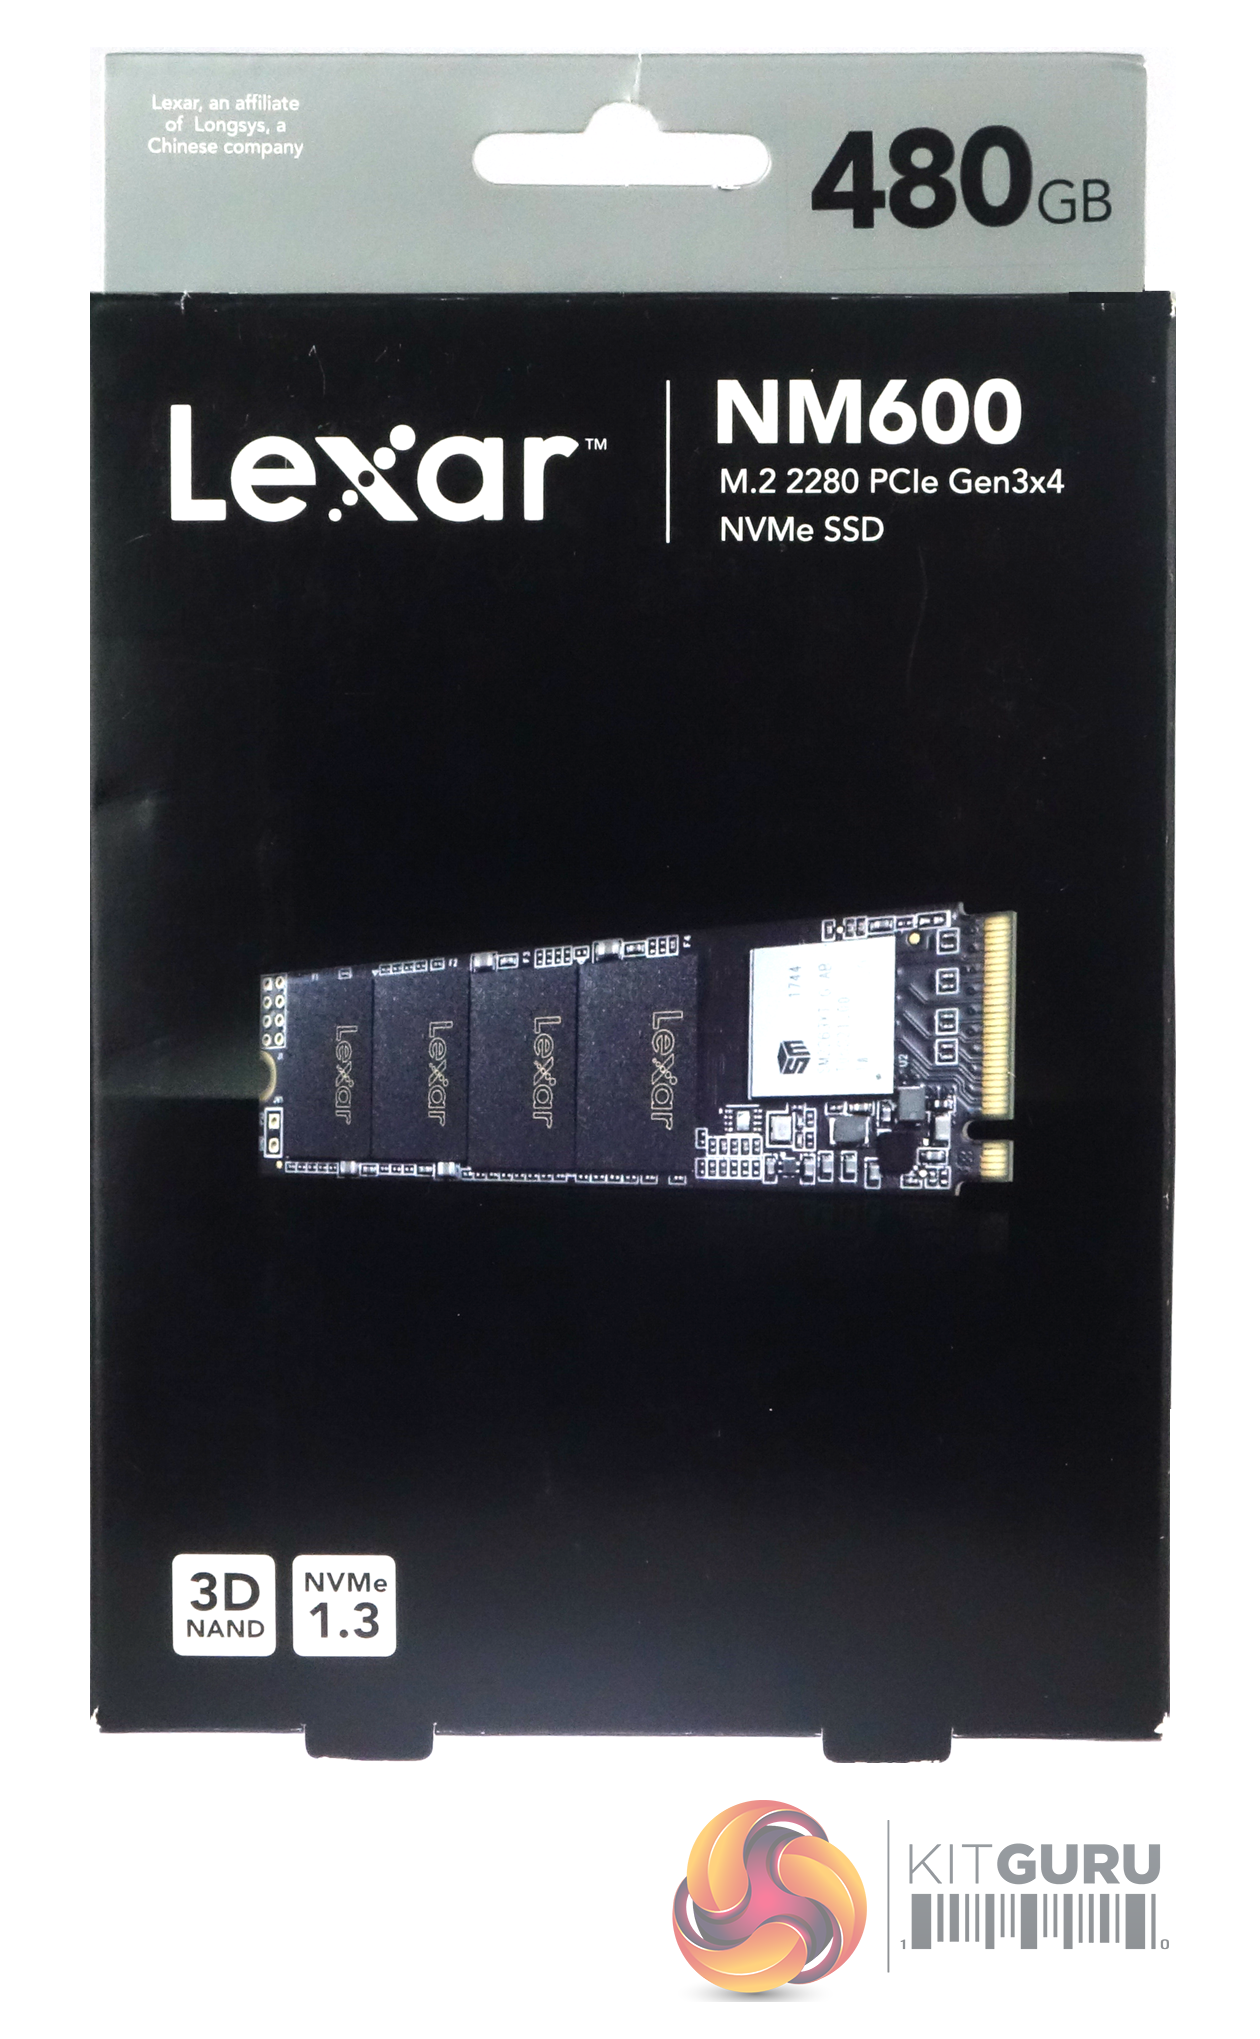
The front of the box has a large clear image of the drive on it along with notes about the fact it uses 3D NAND and supports the NVMe 1.3 specifications. The tab at the top of the box is labelled with the drive's capacity.
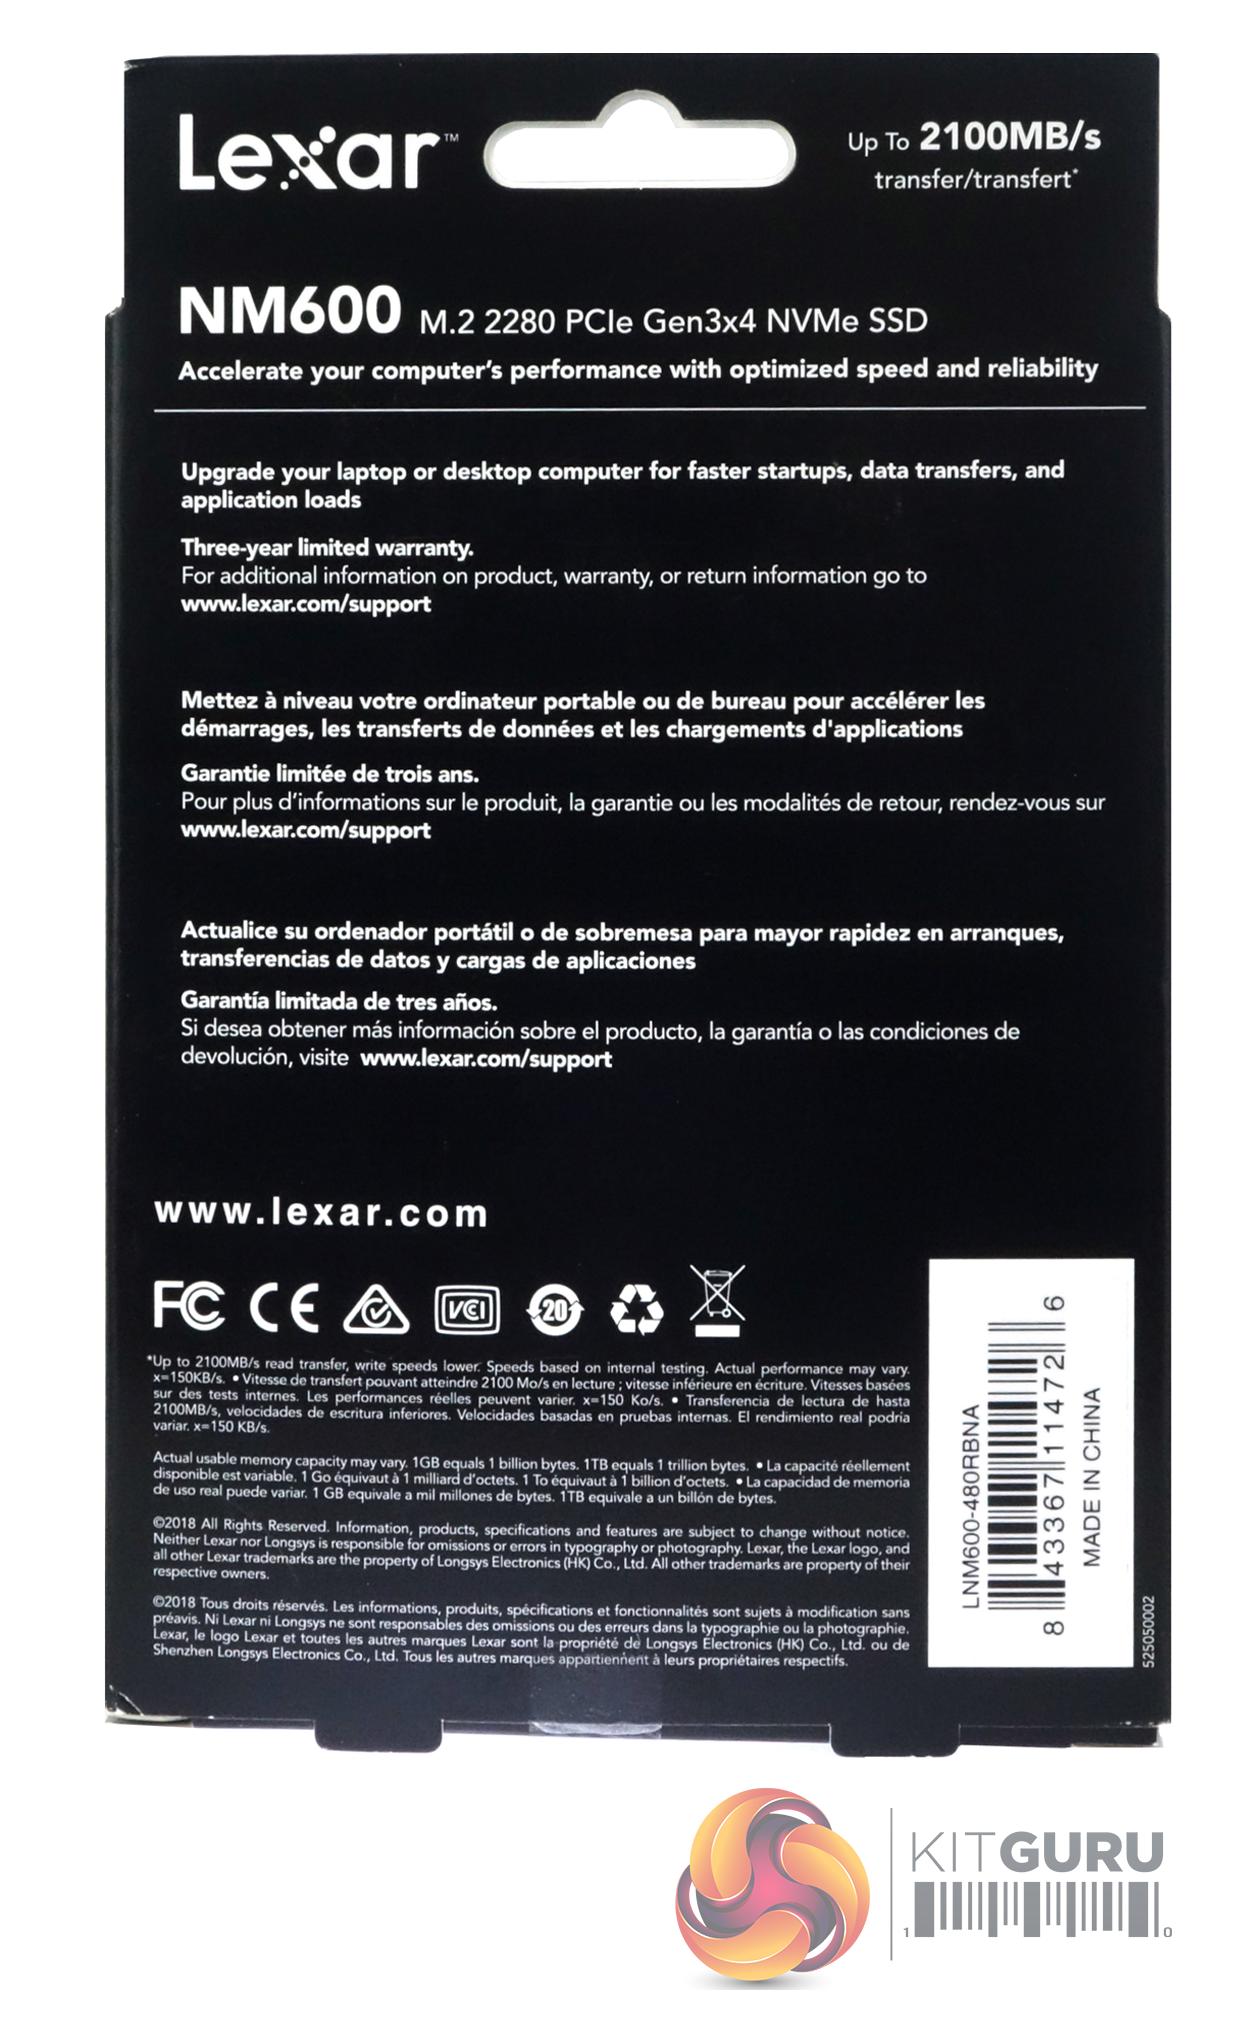
The rear of the box has, at the top right, the maximum rated Sequential read speed (up to 2,100MB/s). Under this are a few lines of multilingual marketing text.
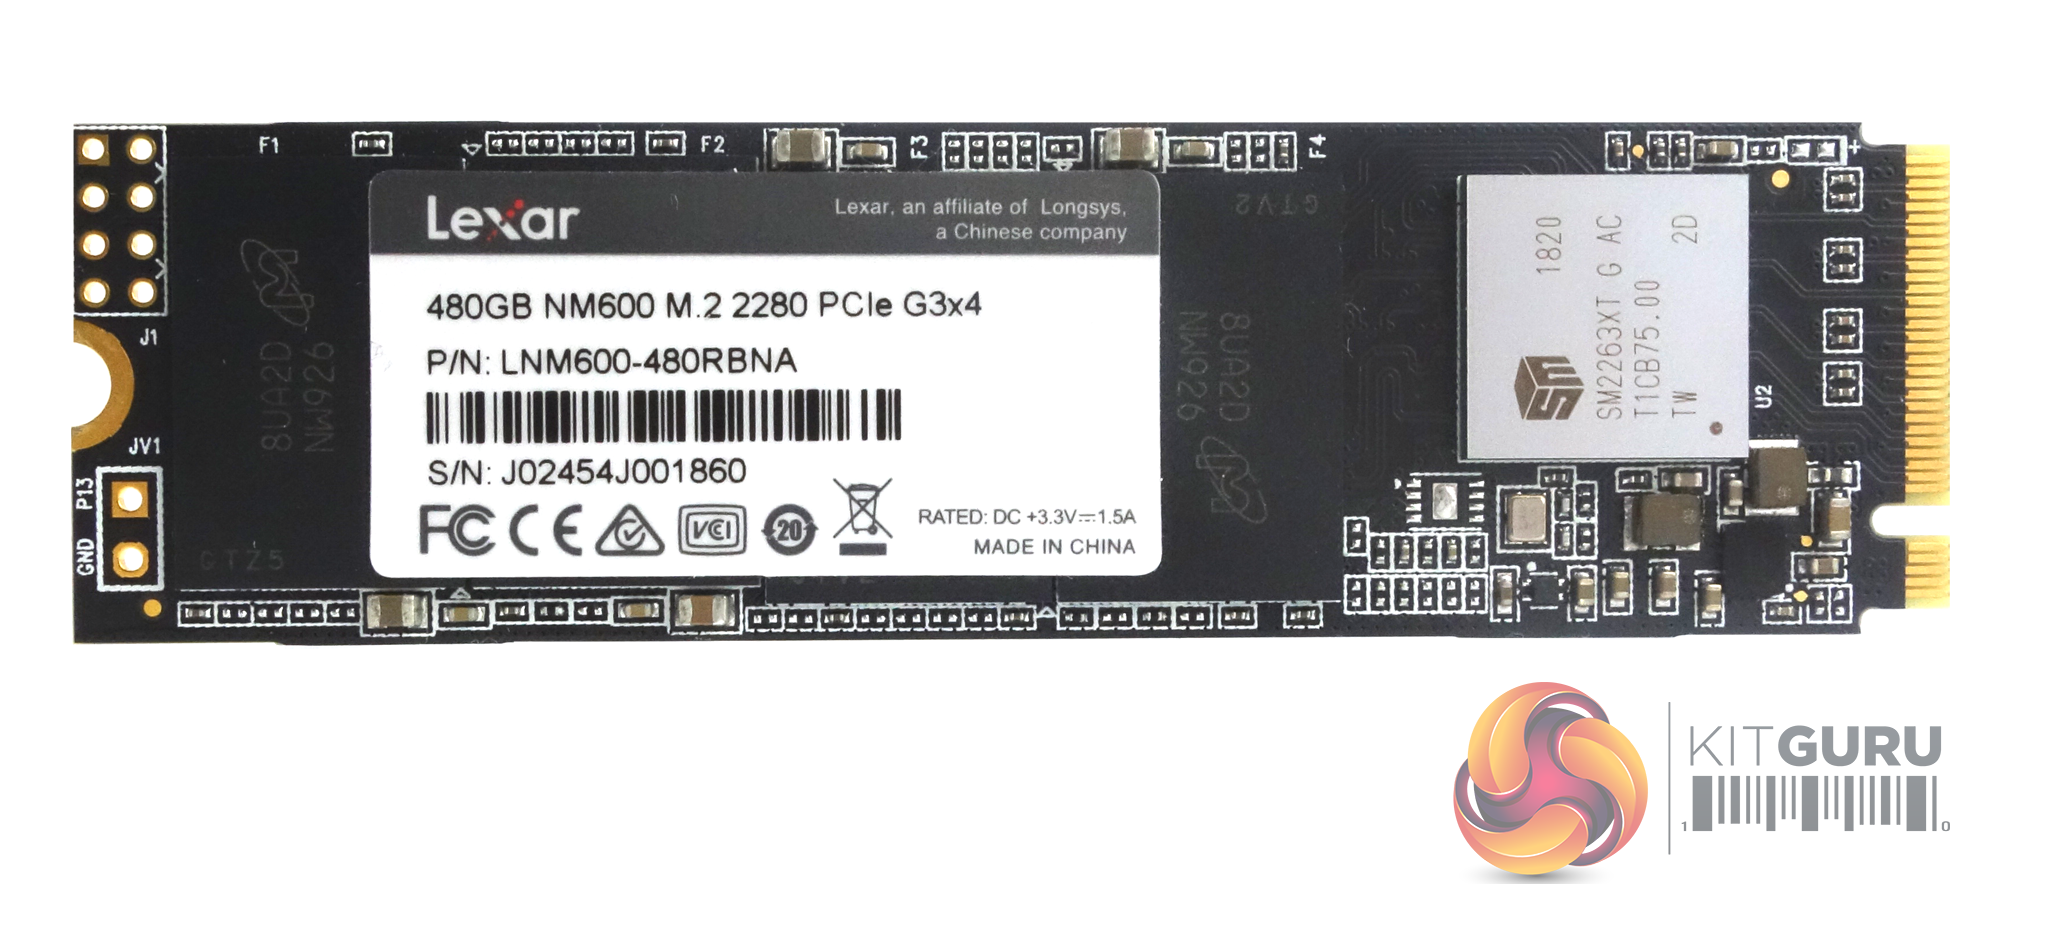
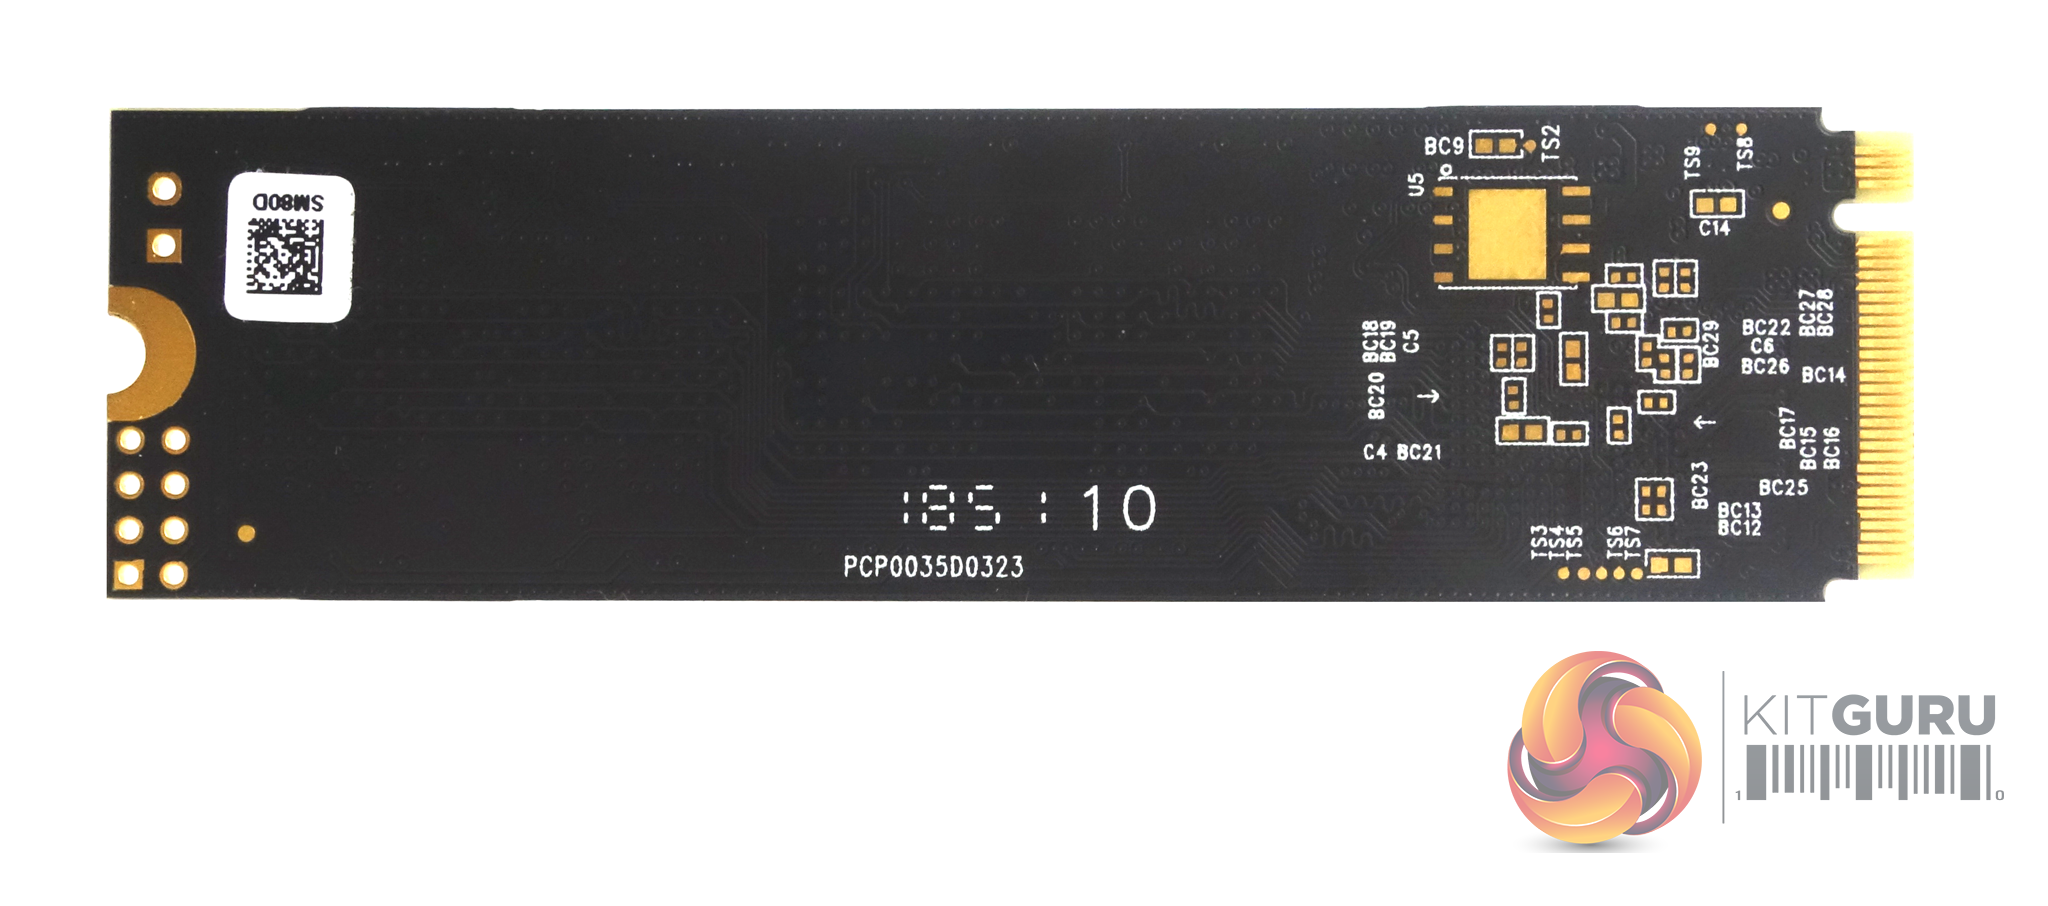
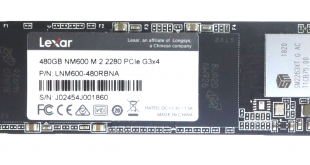
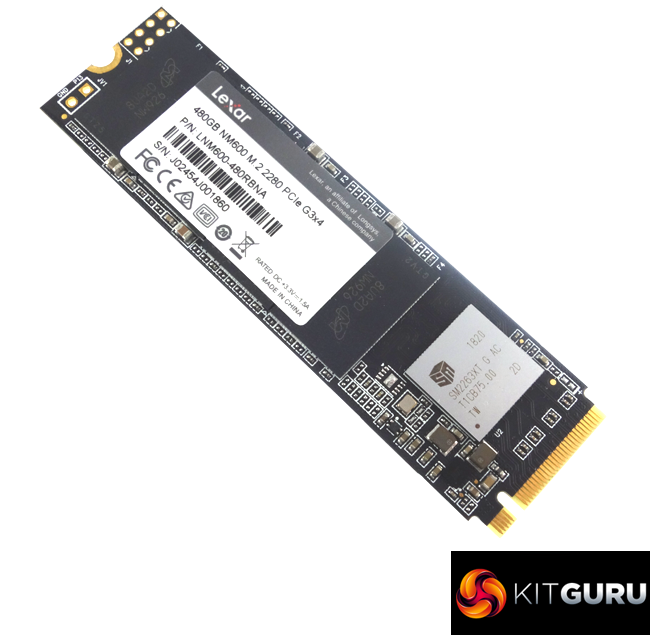
The NM600 is a single sided design with all the components one side of the PCB. This layout is made easier because it's a DRAM-less design, so that's one less chip to find space for. At one end of the PCB, sitting on its own is the Silicon Motion SM2263XT controller while under the product label there are four packages of Micron 64-layer 3D TLC NAND.
Silicon Motion's SM2263XT 4-channel controller supports the NVMe 1.3 specification and ONFi 3.0 / 4.0, Toggle 2.0 / 3.0 & NV-DDR3 NAND to 667MT/s. Security-wise it supports real time full drive encryption with 256-bit AES and TCG Opal and IEEE-1667 (Microsoft's eDrive) protocols while SMI's NANDXtend ECC technology takes care of data protection when is in the Flash.
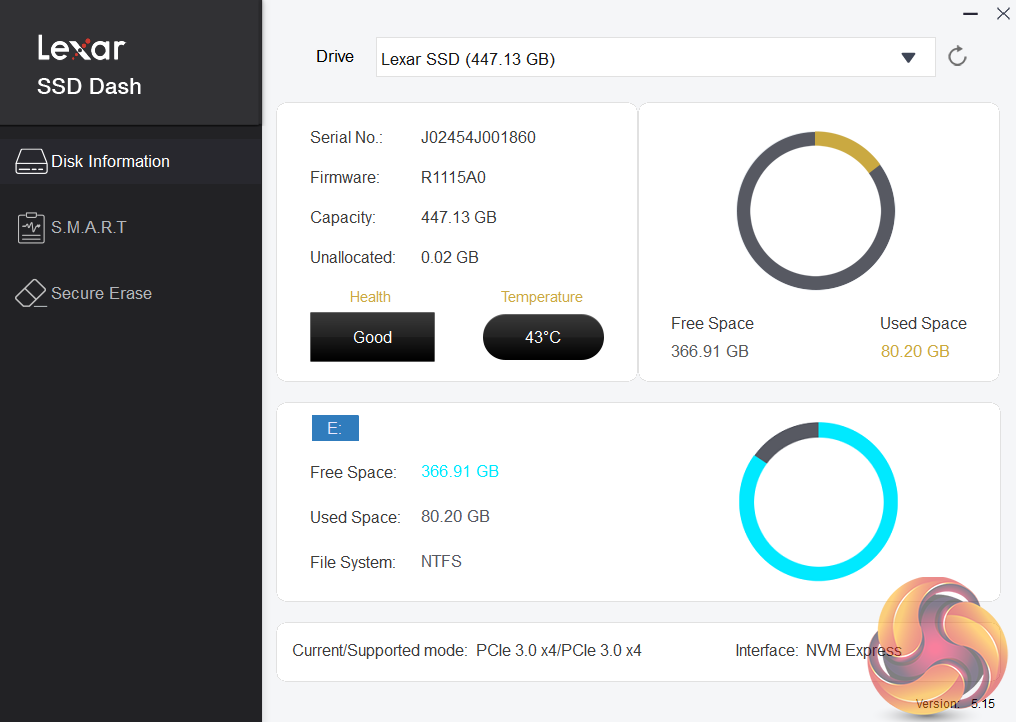
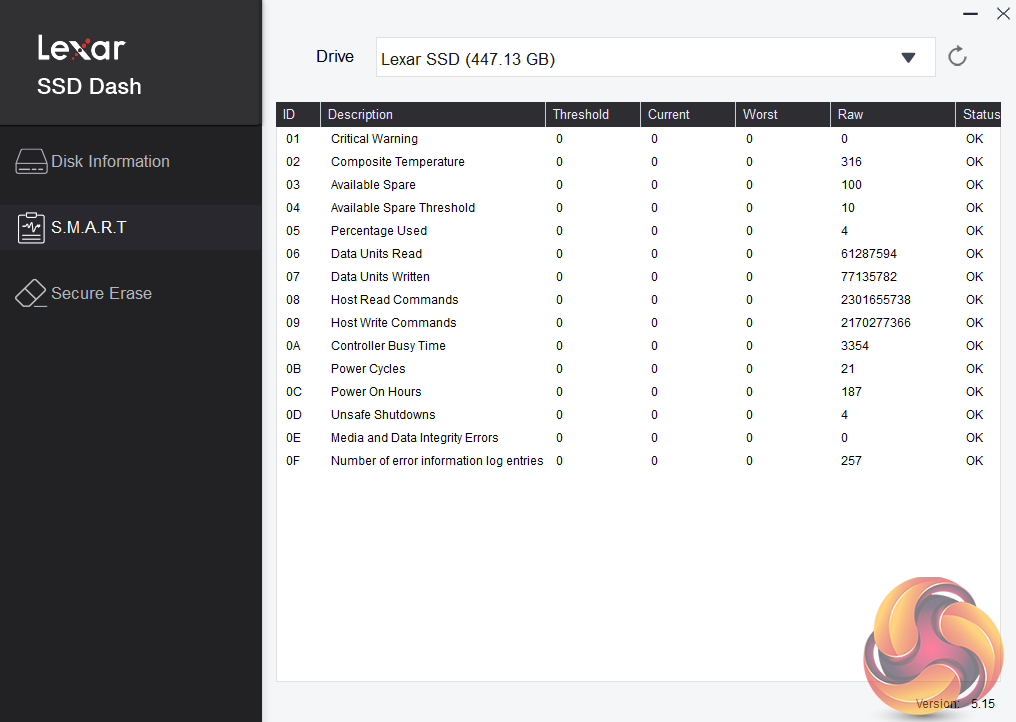
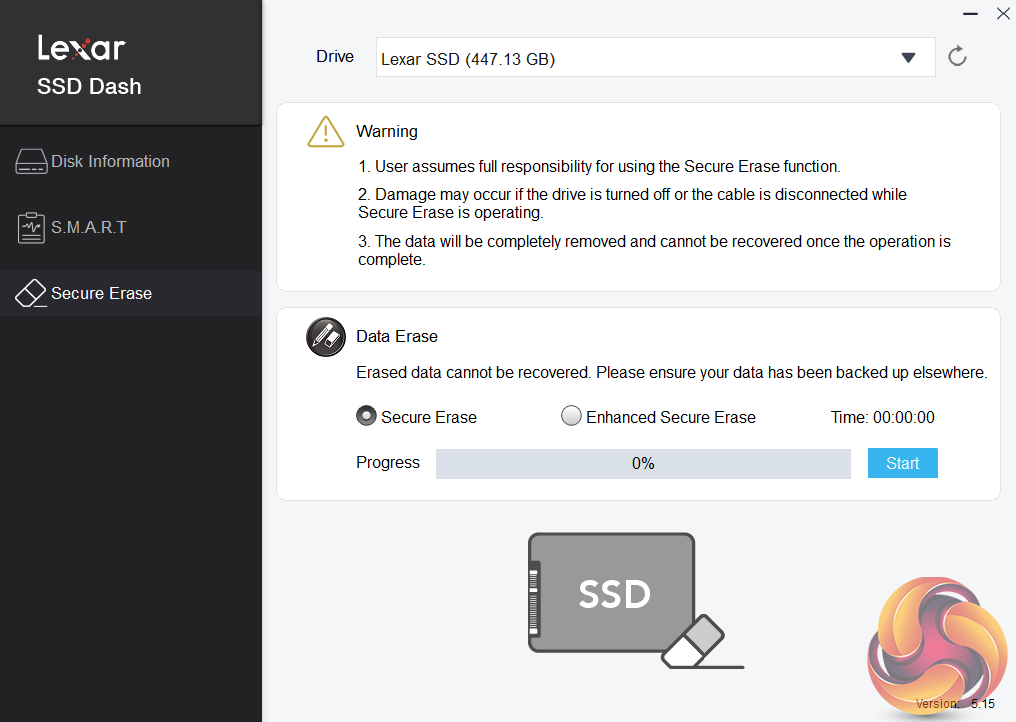
Lexar's SSD utility goes under the name of SSD Dash. It's not as fully featured as some of its competitor's from, for example Samsung or WD, but it does offer all the basic information you might need to keep an eye on your drive in an easy to understand way. It also supports Secure Erase.
For testing, the drives are all wiped and reset to factory settings by HDDerase V4. We try to use free or easily available programs and some real world testing so you can compare our findings against your own system.
This is a good way to measure potential upgrade benefits.
Main system:
Intel Core i7-7700K with 16GB of DDR4-3200 RAM, Sapphire R9 390 Nitro and an Asus Prime Z270-A motherboard.
Other drives
Corsair Force MP500 480GB
Corsair Force MP510 960GB
Crucial P1 1TB
Gigabyte Aorus RGB 512GB
Intel Optane SSD900P 480GB
Intel Optane SSD905P 480GB
Intel SSD760p 512GB
Kingston KC2000 1TB
Kingston A1000 480GB
Plextor M9Pe(Y) 512GB
Plextor M8PeG 512GB
Patriot Viper VPN100 1TB
PNY CS3030 1TB
PNY CS2030 240GB
Samsung SSD970 EVO 2TB
Samsung SSD970 PRO 1TB
Samsung SSD960 PRO 2TB
Samsung SSD960 EVO 1TB
Samsung SSD960 EVO Plus 1TB
Toshiba XG6 1TB
Toshiba OCZ RD400 512GB
Western Digital Black SN750 1TB
Western Digital Black SN750 1TB with Heatsink
Western Digital Black NVMe 1TB
Western Digital Black PCIe 512GB
Software:
Atto Disk Benchmark 3.05.
CrystalMark 6.0.0.
AS SSD 2.0.
IOMeter.
Futuremark PC Mark 8.
All our results were achieved by running each test five times with every configuration this ensures that any glitches are removed from the results. Trim is confirmed as running by typing fsutil behavior query disabledeletenotify into the command line. A response of disabledeletenotify =0 confirms TRIM is active.
CrystalDiskMark is a useful benchmark to measure theoretical performance levels of hard drives and SSD’s. We are using v6.0.
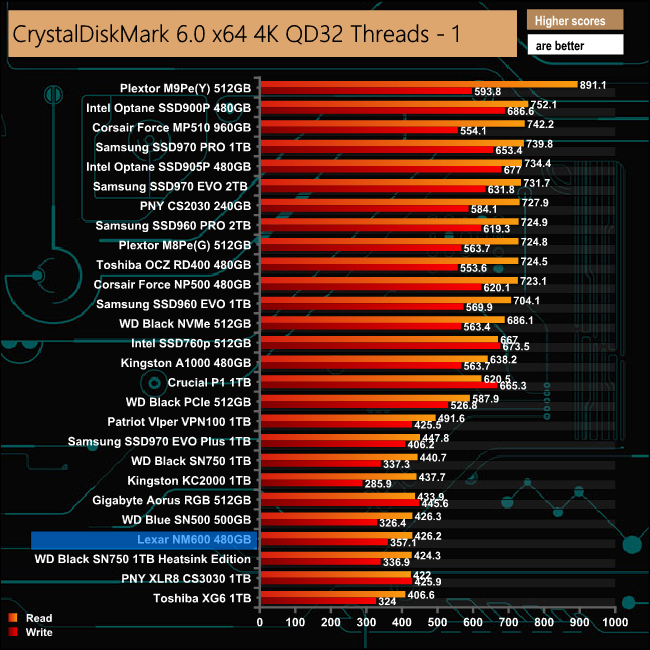
The Lexar NM600 doesn't perform well in the CrystalDiskMark benchmark at a deep queue depth of 32. Looking at the two benchmark result screens, the Silicon Motion controller doesn't seem to have a preference as to the type of data is asked to handle.
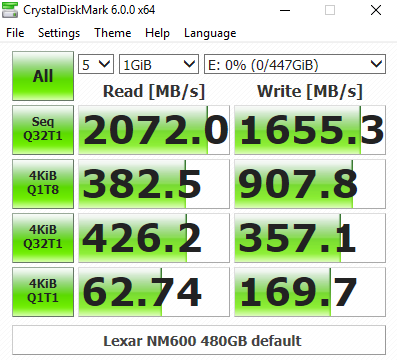
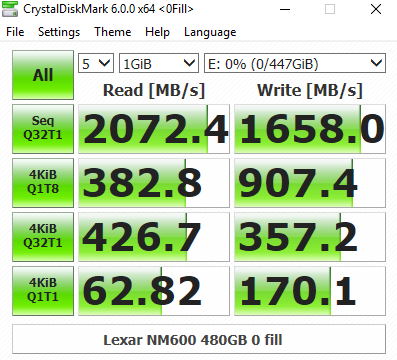
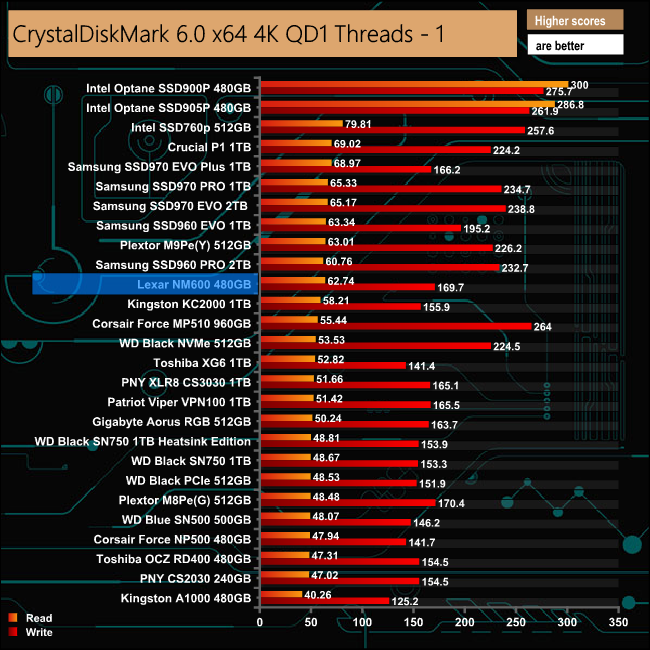
At a QD of 1, where most of today's desktop workloads take place, the NM600 seems to perform better, with a read score of 62.74MB/s with writes at 169.7MB/s.
The ATTO Disk Benchmark performance measurement tool is compatible with Microsoft Windows. Measure your storage systems performance with various transfer sizes and test lengths for reads and writes. Several options are available to customize your performance measurement including queue depth, overlapped I/O and even a comparison mode with the option to run continuously.
Use ATTO Disk Benchmark to test any manufacturers RAID controllers, storage controllers, host adapters, hard drives and SSD drives and notice that ATTO products will consistently provide the highest level of performance to your storage.
We are using version 3.5 for our NVMe disk tests.
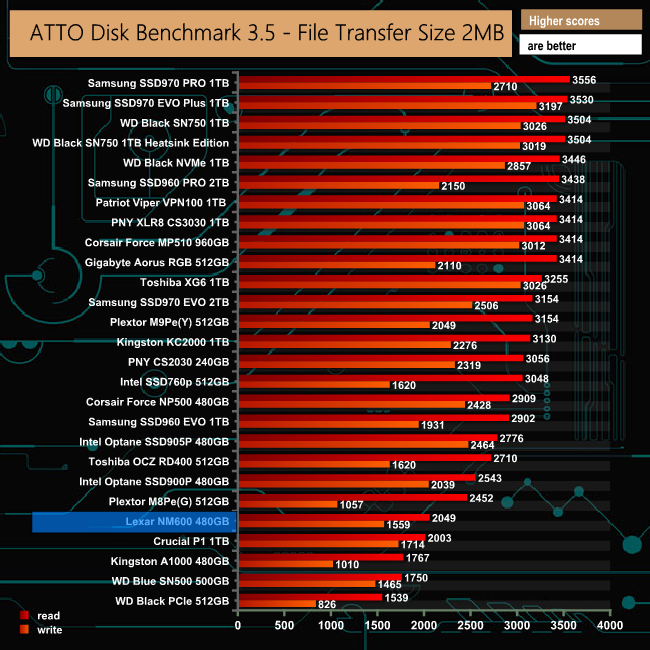
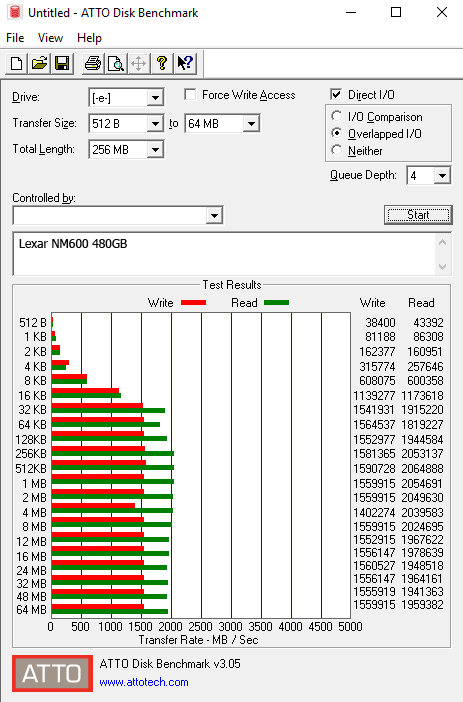
Lexar quote Sequential read/write performance for the 480GB NM600 as up to 2,100MB/s for reads and up to 1,600MB/s for writes. Using the ATTO benchmark we couldn't quite reach the maximum performance rates but with a read result of 2,049MB/s and 1,559MB/s for writes, it's not that far short.
AS SSD is a great free tool designed just for benching Solid State Drives. It performs an array of sequential read and write tests, as well as random read and write tests with sequential access times over a portion of the drive. AS SSD includes a sub suite of benchmarks with various file pattern algorithms but this is difficult in trying to judge accurate performance figures.
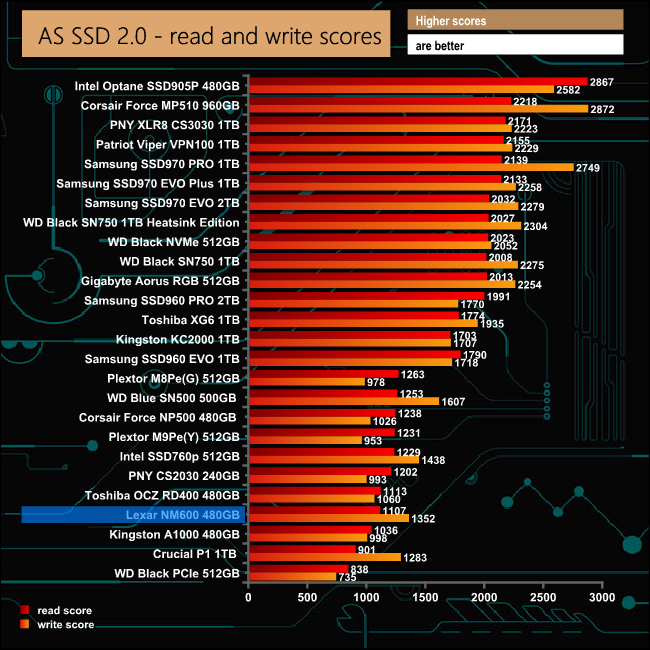
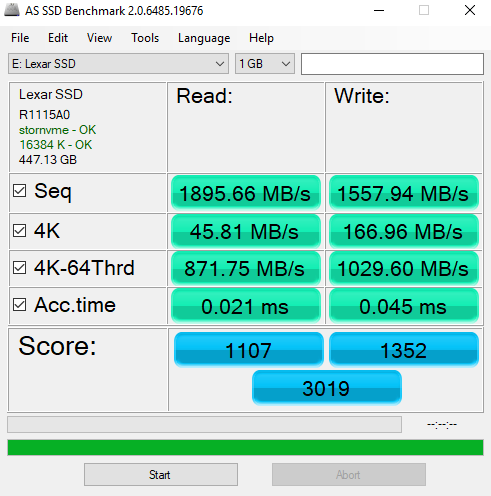
The AS SSD read score of 1107 puts the NM600 in the bottom five of drives we have tested to date, however its write score of 1352 is a good deal faster than most of the drives around it.
IOMeter is another open source synthetic benchmarking tool which is able to simulate the various loads placed on hard drive and solid state drive technology. There are many ways to measure the IOPS performance of a Solid State Drive, so our results will sometimes differ from manufacturer’s quoted ratings. We do test all drives in exactly the same way, so the results are directly comparable.
We test 128KB Sequential read and write and random read and write 4k tests. The test setup’s for the tests are listed below. Each is run five times.
128KB Sequential Read / Write.
Transfer Request Size: 128KB Span: 8GB Thread(s): 1, Outstanding I/O: 1-32 Test Run: 20 minutes per test
4K Sustained Random Read / Write.
Transfer Request Size: 4KB Span: 80GB Thread(s): 4, Outstanding I/O: 1-32 Test Run: 20 minutes per test
4K Random 70/30 mix Read/Write.
Transfer Request Size: 4KB Span: 80GB Reads: 70% Writes: 30% Thread(s): 4 Outstanding I/O: 2 – 32 Test Run: 20 minutes


With our Sequential read/write test we couldn't quite match the official maximum read figure of 2,100MB/s at 2,068MB/s but we bettered the official write score of 1,600MB/s, the test runs producing 1,779.36MB/s.
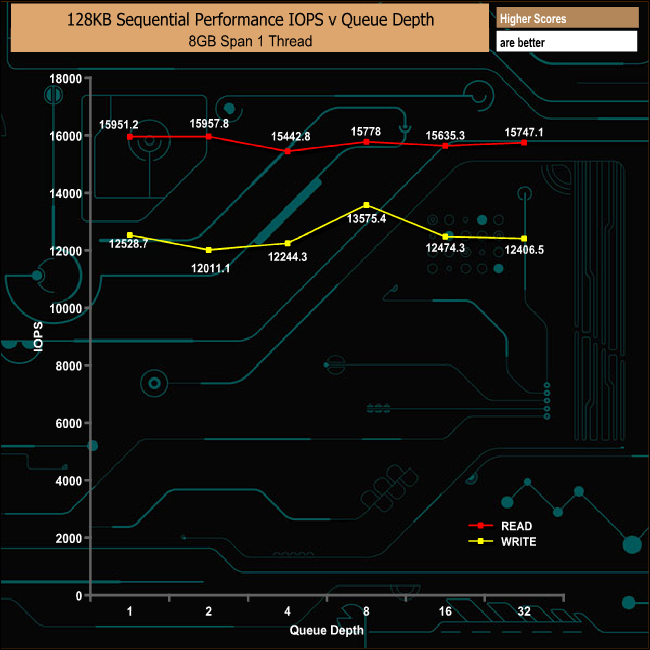
128KB Sequential Read Performance v QD Compared.
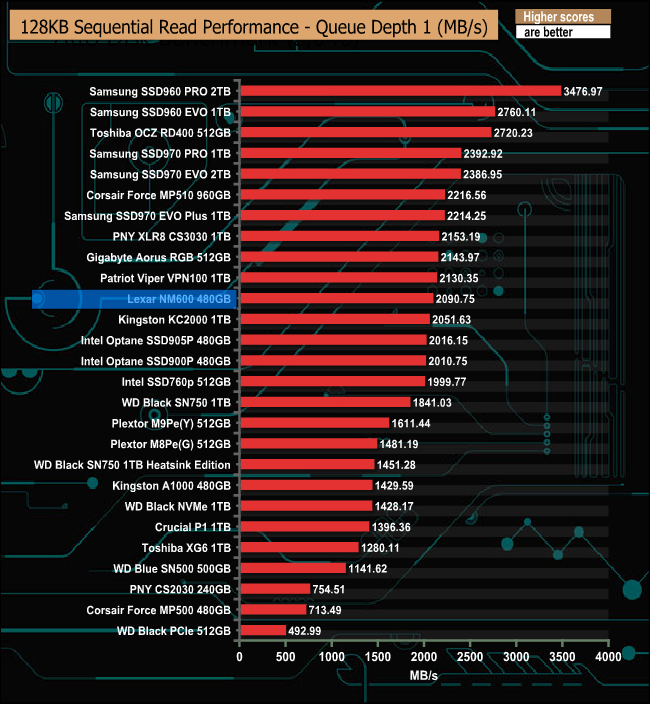
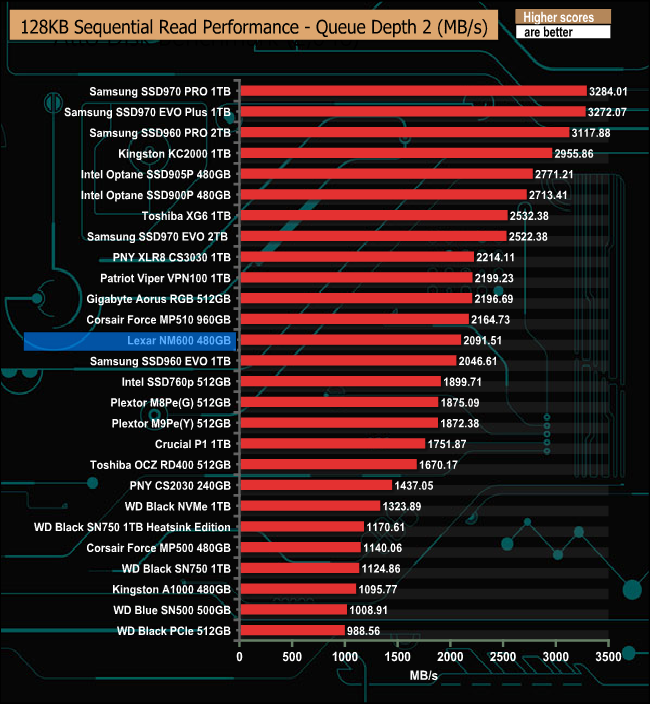
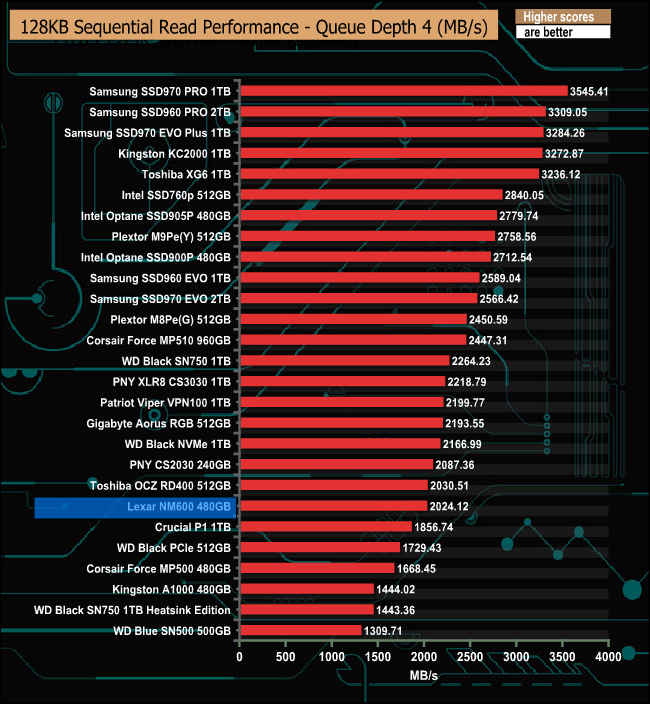
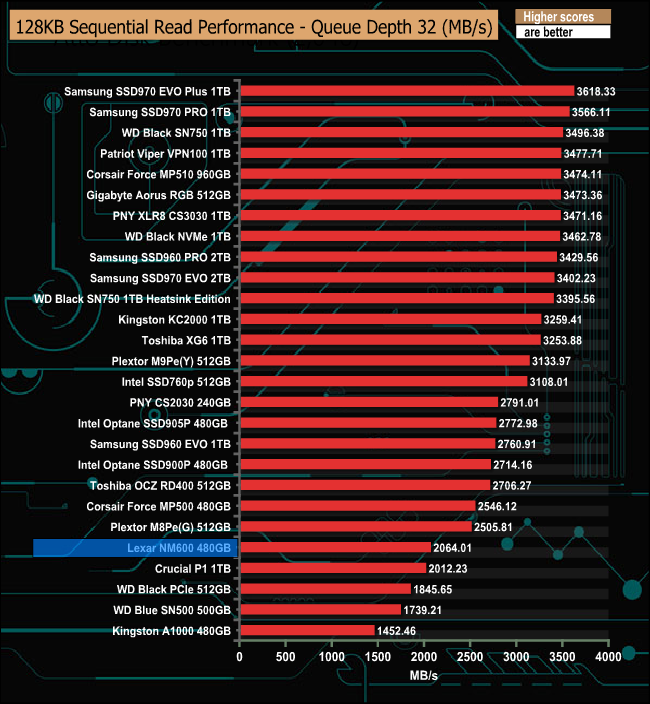
Up to a QD of 4, the NM600 hovers around mid-table for Sequential reads, but as the queue depth deepens the drive drops down the table.
128KB Sequential Write Performance v QD Compared


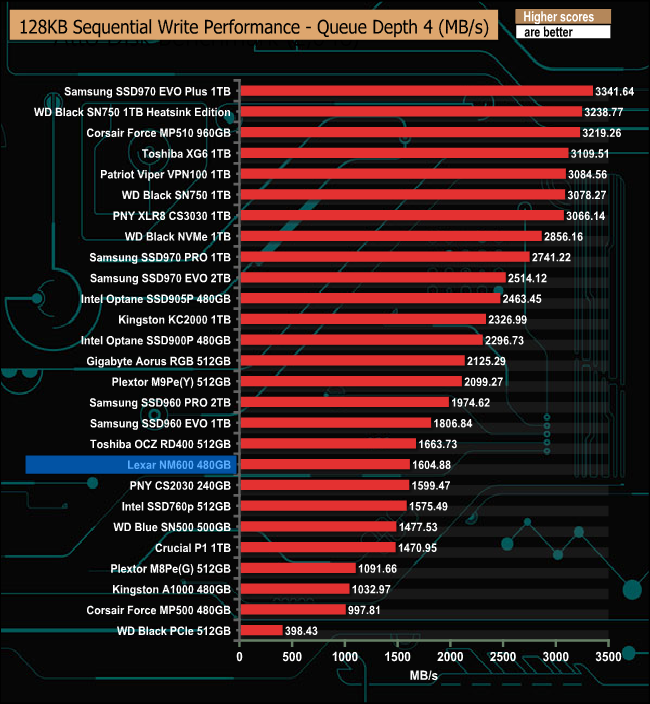
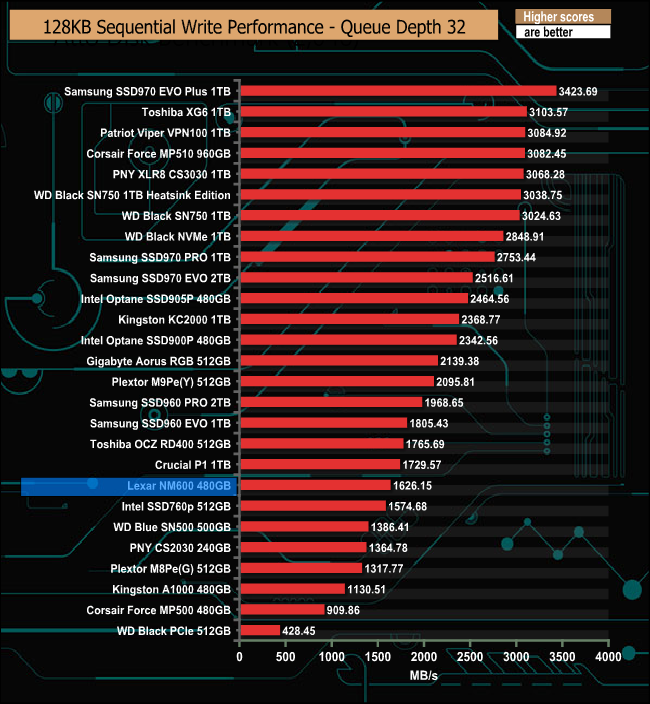
The Lexar NM600's Sequential write performance remains pretty consistent throughout the tested queue depths.
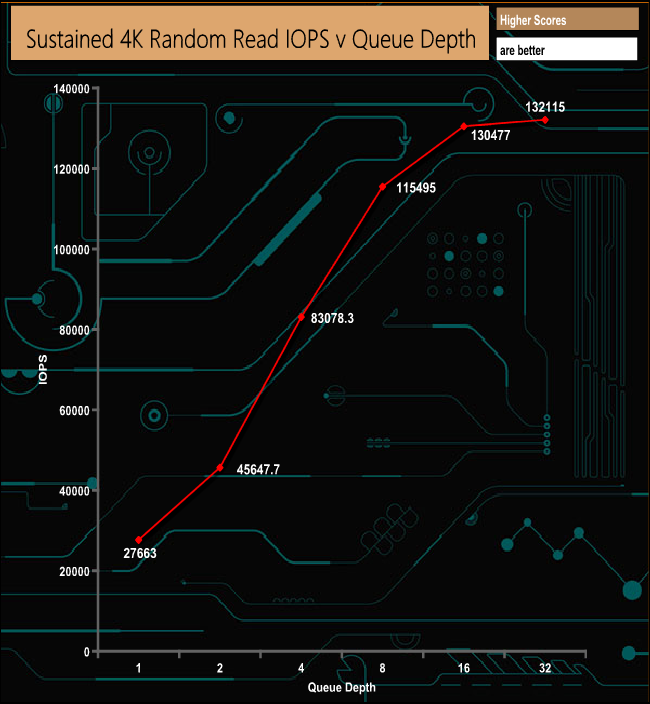
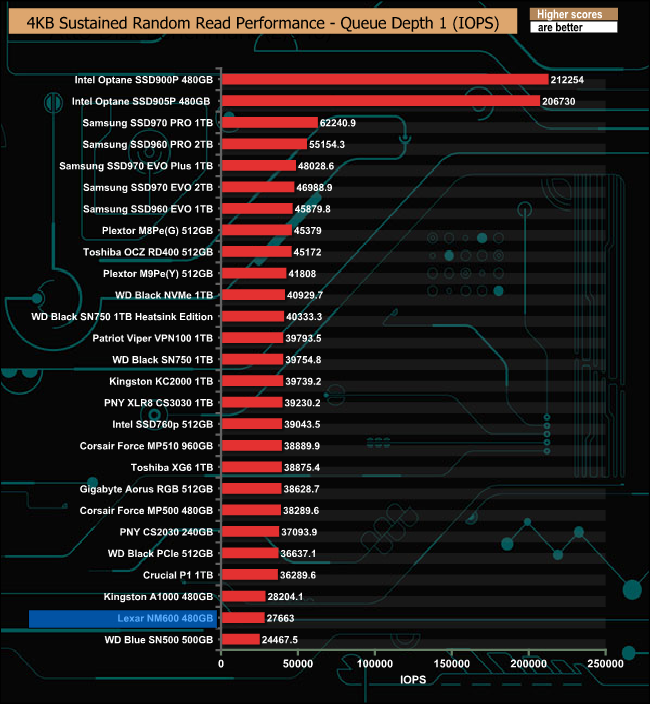
Lexar quote random 4K performance for the 480GB NM600 as up to 188,000 IOPS. With our standard 4 thread testing we couldn't get close to that figure, the best we saw was 132,115 IOPS at a QD of 32. However, a quick test at QD32 with 8 threads saw the random read performance rise to 150,208 IOPS, still short of the official maximum figure.
4K Random Read v QD Performance Compared
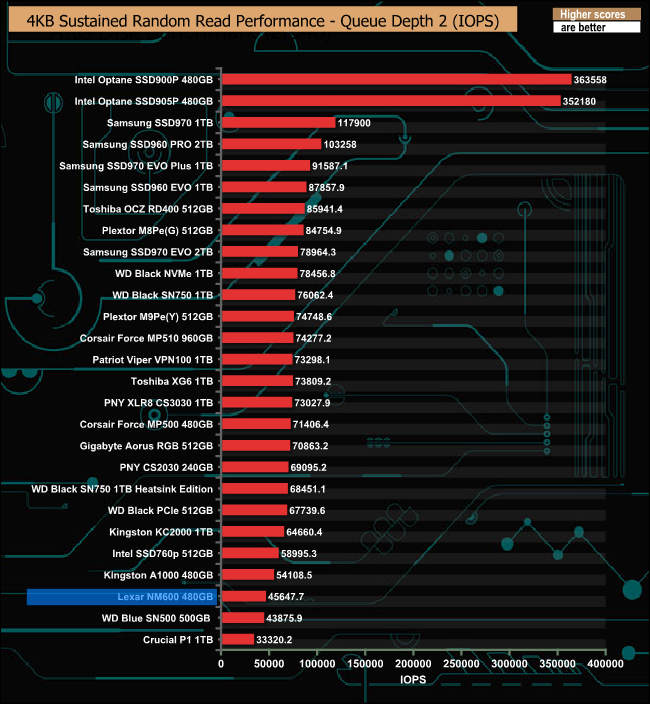
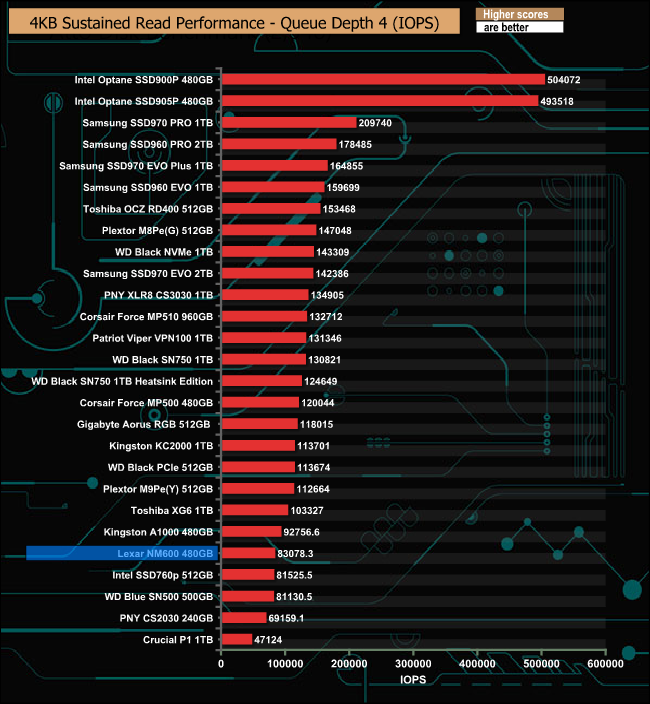
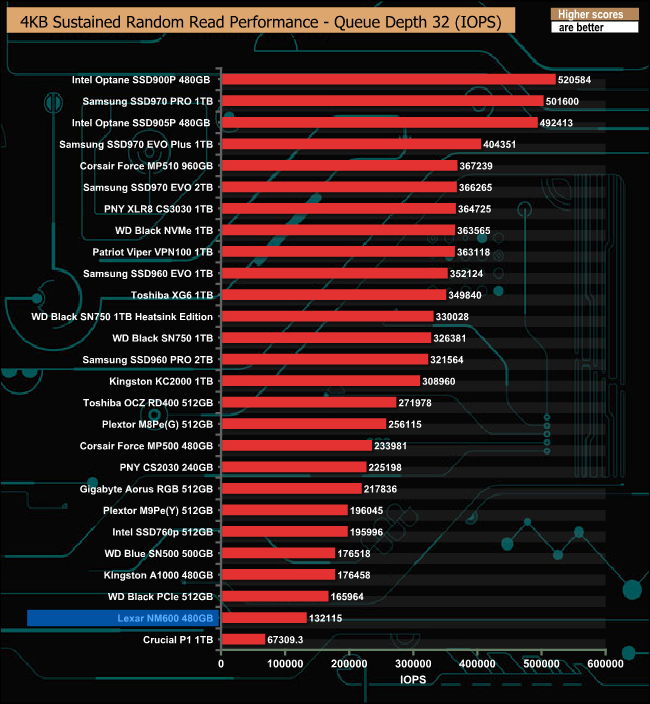
The drive didn't handle our 4K random read test very well at all even at QD's 1 & 2, however it must be said that the performance picked up at a QD of 4 at 83,078 IOPS before dropping back at a QD of 32.
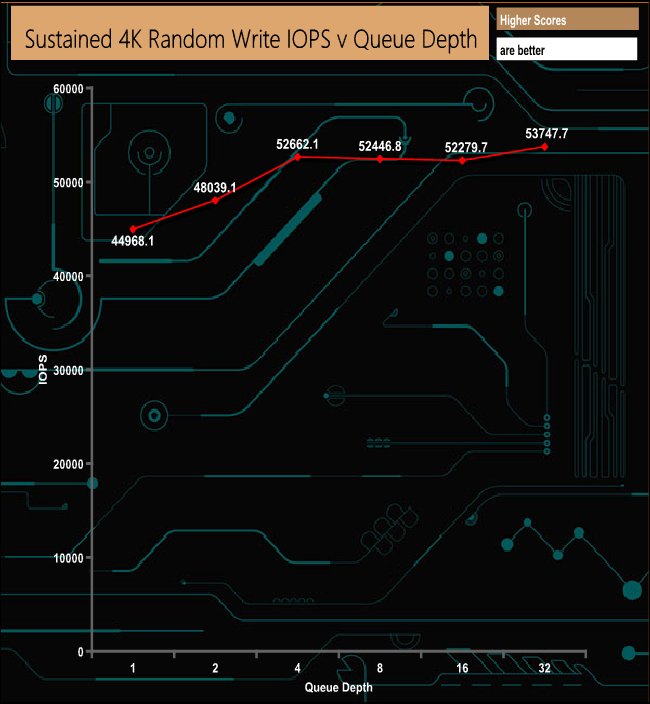
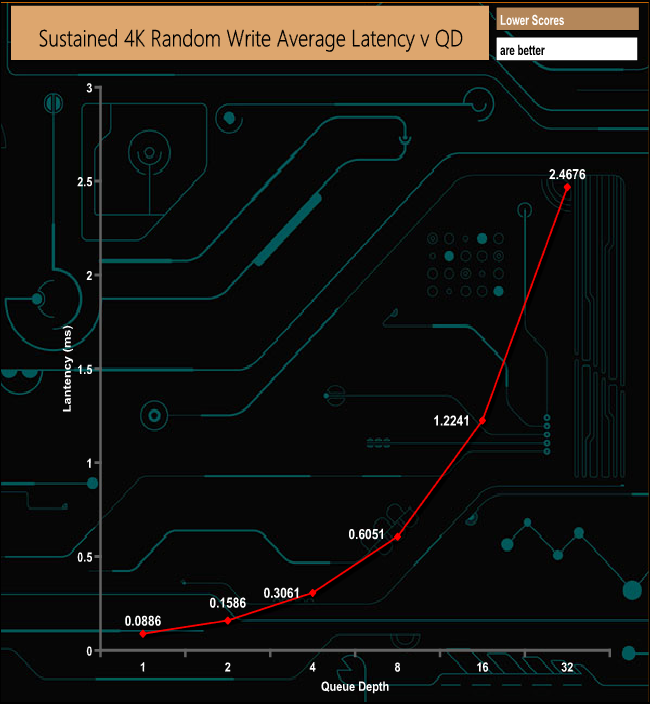
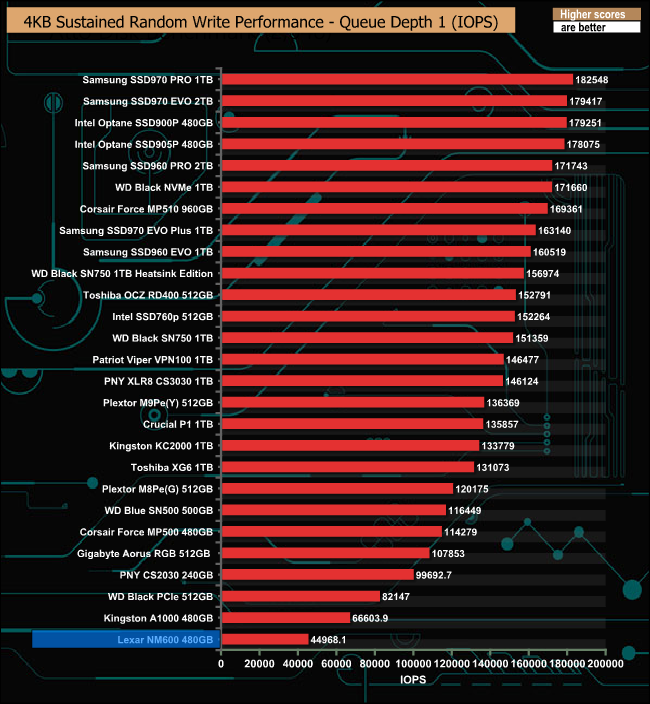
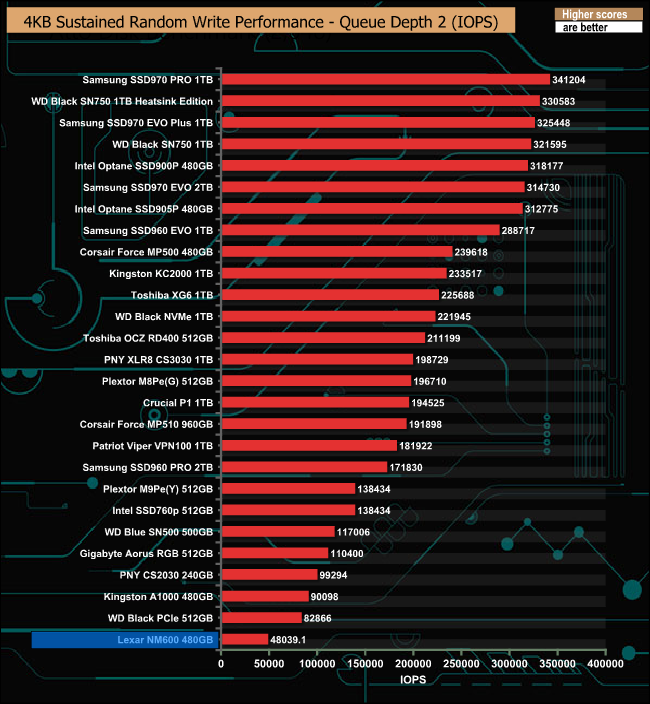
The official 4K random write rating for the NM600 480GB drive is up to 156,000 IOPS. As you can see from the results graph at 53,747 IOPS (QD32) we couldn't get anywhere close to that figure with our 4 thread tests. As with the random read tests, we did a quick test using eight threads at a QD of 32 which saw a dramatic rise in IOPS, with the drive reaching a maximum of 212,825.7 IOPS – far exceeding the official figure.
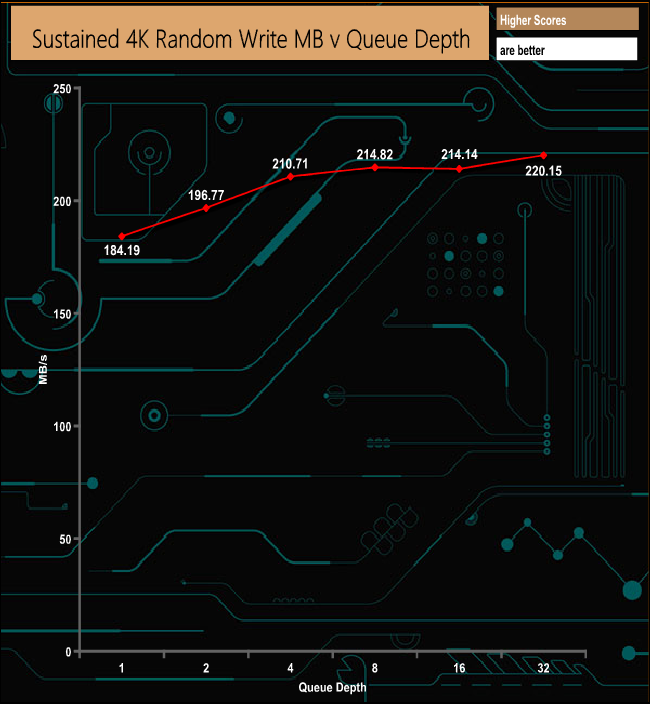
4K Random Write v QD Performance Compared.
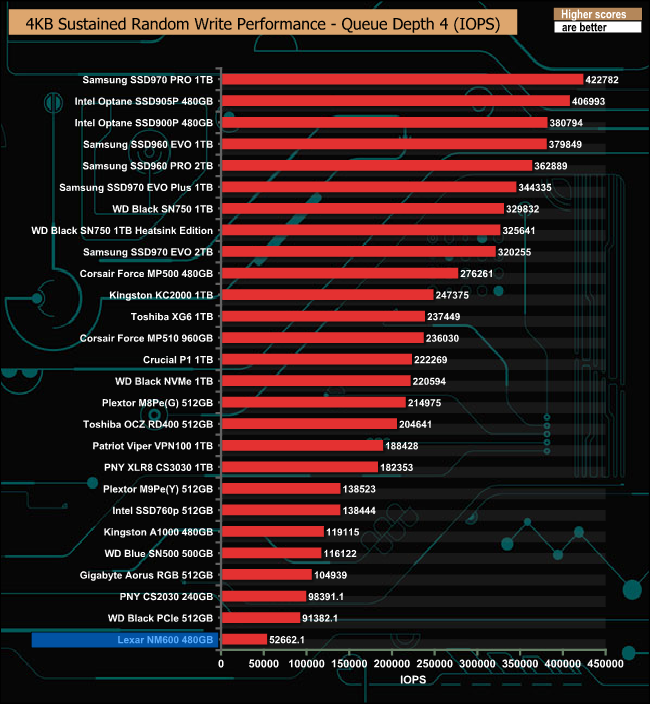
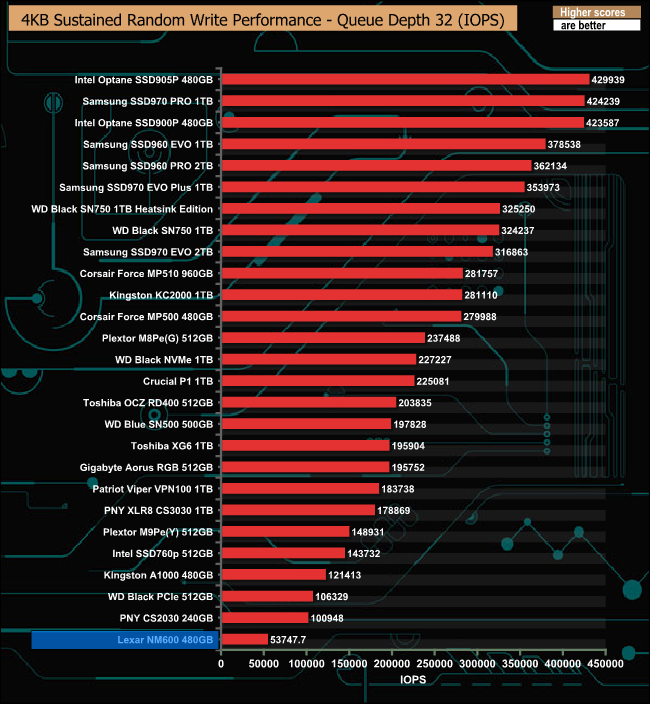
The NM600 has real problems with our 4K write tests, sitting at the bottom the of the chart throughout the tested queue depths.
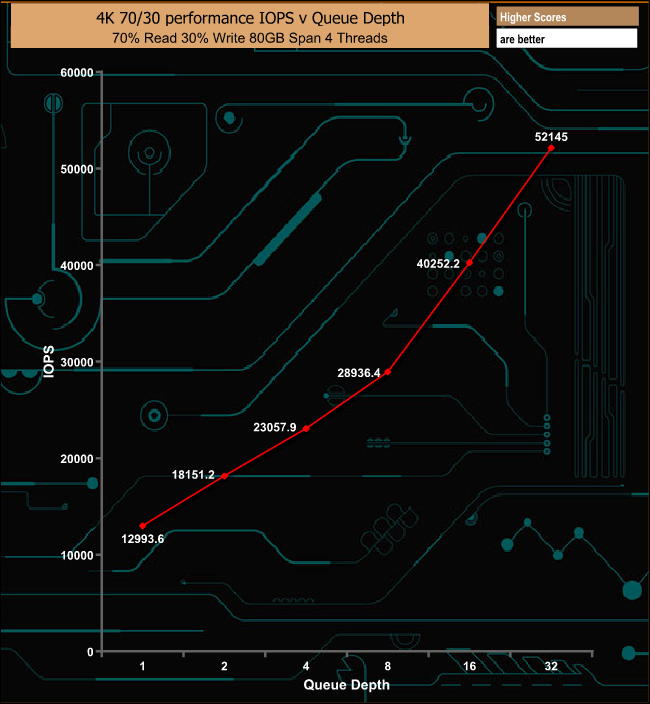
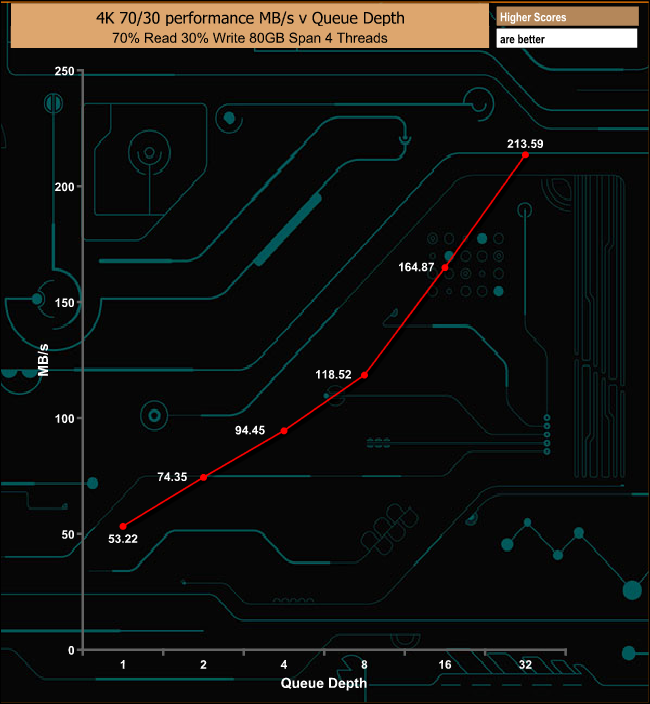
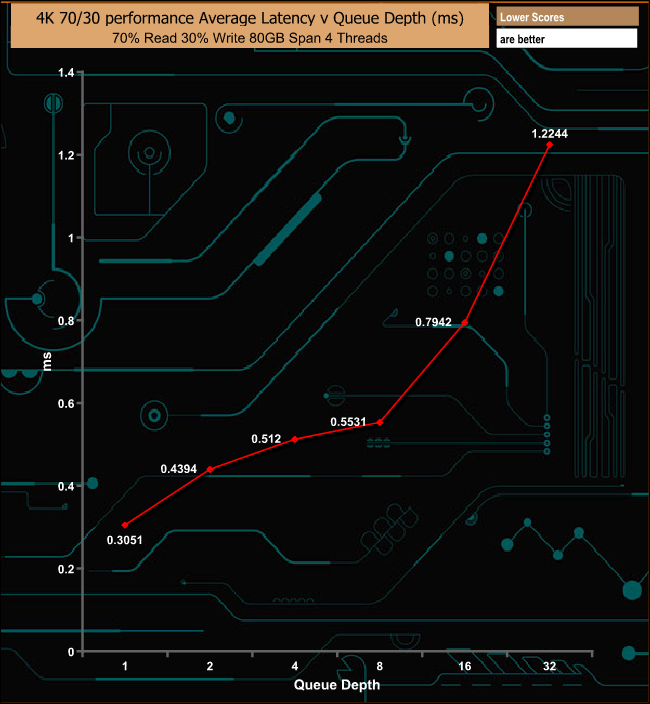
In the mixed 70/30 read/write tests the drive was consistent if not particularly fast.
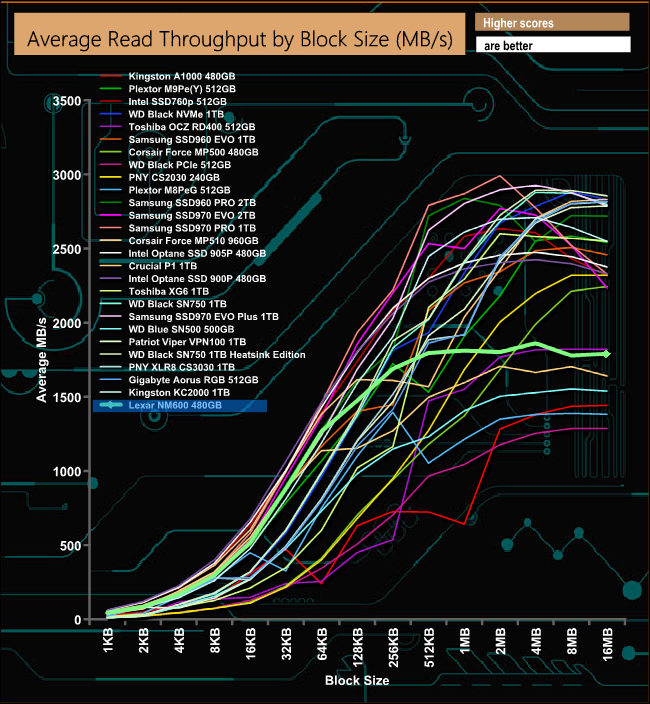
In our throughput test, the peak read came at the 4MB block mark at 1,860.52MB/s.
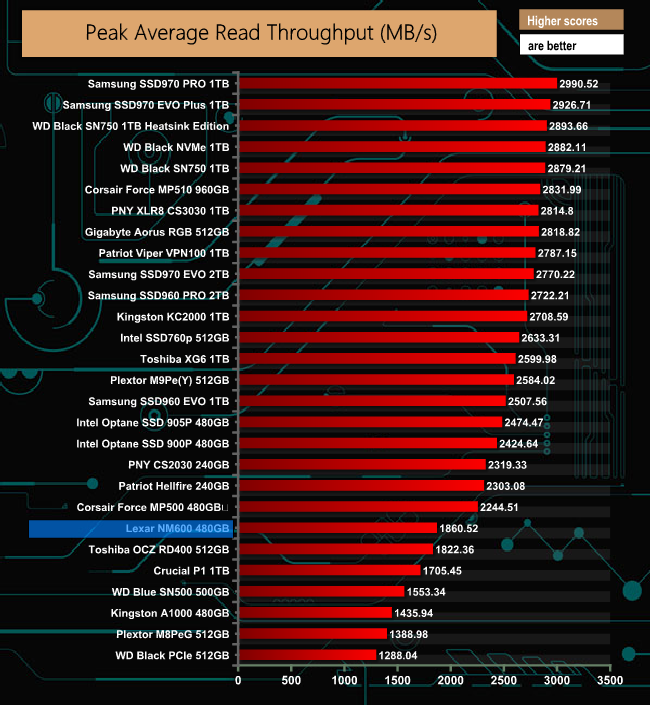
That peak read figure of 1,860.52MB/s puts the NM600 into the bottom segment of our results chart.
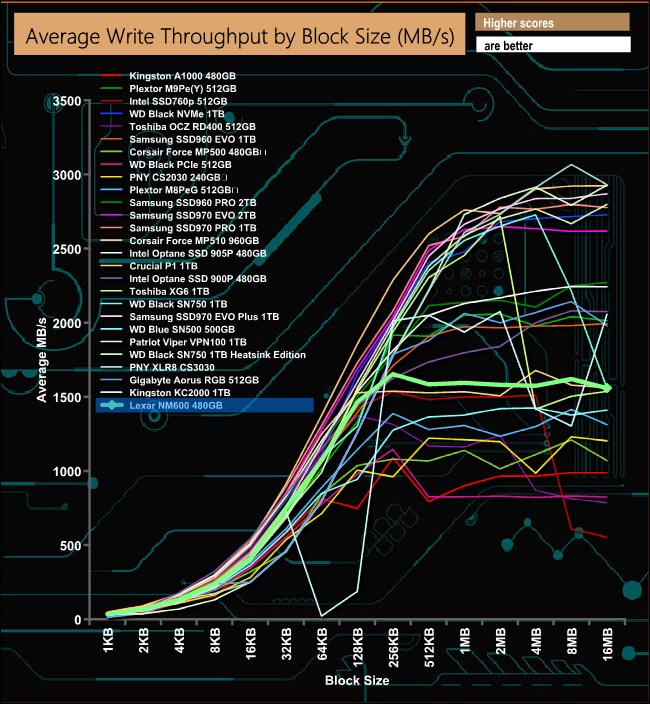
The peak write throughput occurred at the 256KB block mark when the drive produced a score of 1,652.75MB/s.
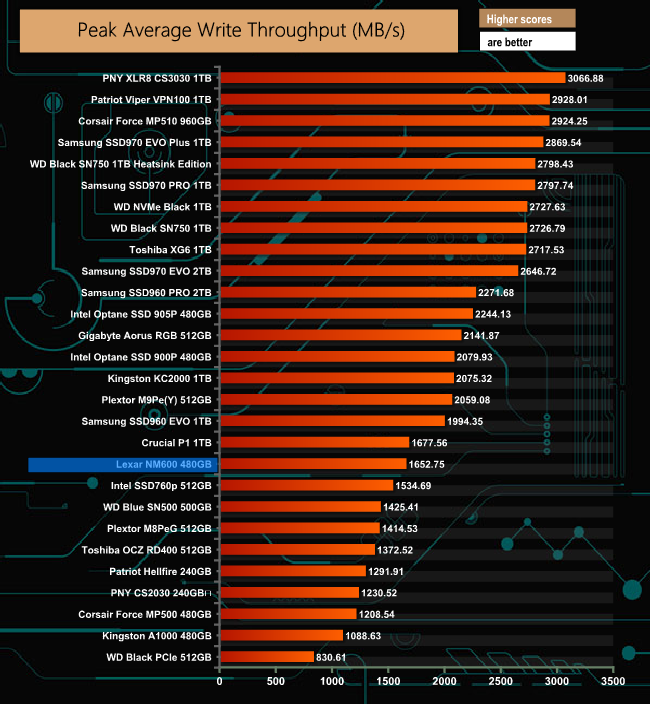
The 1,652.75MB/s write throughput score propels the drive further up the chart than the read score does.
Futuremark’s PCMark 8 is a very good all round system benchmark but its Storage Consistency Test takes it to whole new level when testing SSD drives. It runs through four phases; Preconditioning, Degradation, Steady State, Recovery and finally Clean Up. During the Degradation, Steady State and Recovery phases it runs performance tests using the 10 software programs that form the backbone of PCMark 8; Adobe After Effects, Illustrator, InDesign, Photoshop Heavy and Photoshop Light, Microsoft Excel, PowerPoint, Word, Battlefield 3 and World of Warcraft. With some 18 phases of testing, this test can take many hours to run.
Preconditioning
The drive is written sequentially through up to the reported capacity with random data, write size of 256 × 512 = 131,072 bytes. This is done twice.
Degradation
Run writes of random size between 8 × 512 and 2048 × 512 bytes on random offsets for 10 minutes. It then runs a performance test. These two actions are then repeated 8 times and on each pass the duration of random writes is increased by 5 minutes.
Steady State
Run writes of random size between 8 × 512 and 2048 × 512 bytes on random offsets for final duration achieved in degradation phase. A performance test is then run. These actions are then re-run five times.
Recovery
The drive is idled for 5 minutes. Then a performance test is run. These actions are then repeated five times.
Clean Up
The drive is written through sequentially up to the reported capacity with zero data, write size of 256 × 512 = 131,072 bytes.


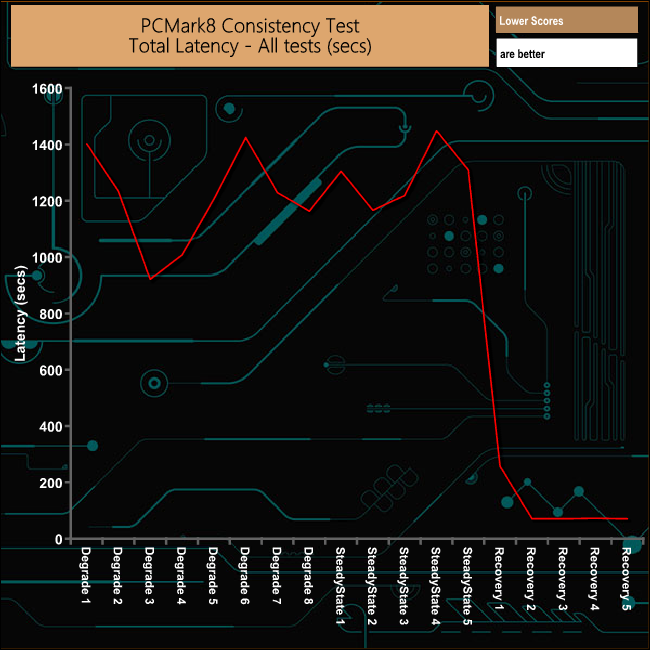
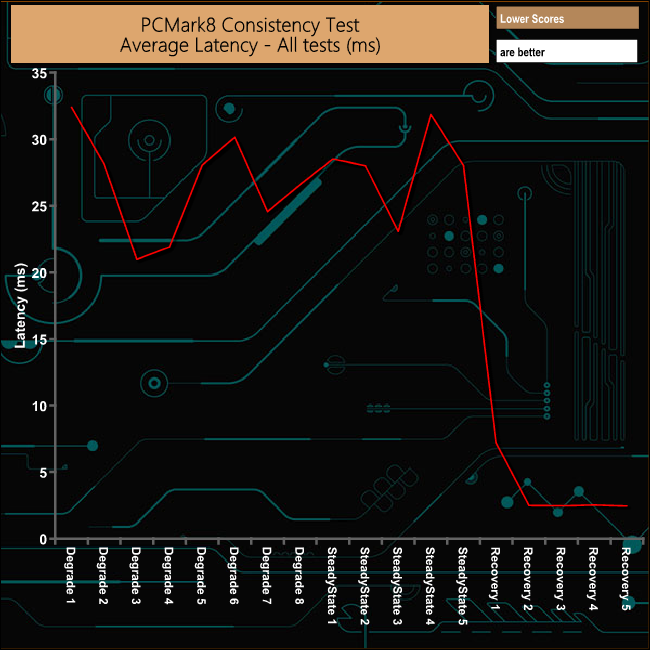
Overall in PCMark 8's Consistency test, the drive suffered in the Degradation and SteadyState phases, but the recovery phases for the NM600 were very good indeed.
PCMark 8’s Consistency test provides a huge amount of performance data, so here we’ve looked a little closer at how the Lexar NM600 performs in each of the benchmarks test suites.
Adobe Creative Cloud
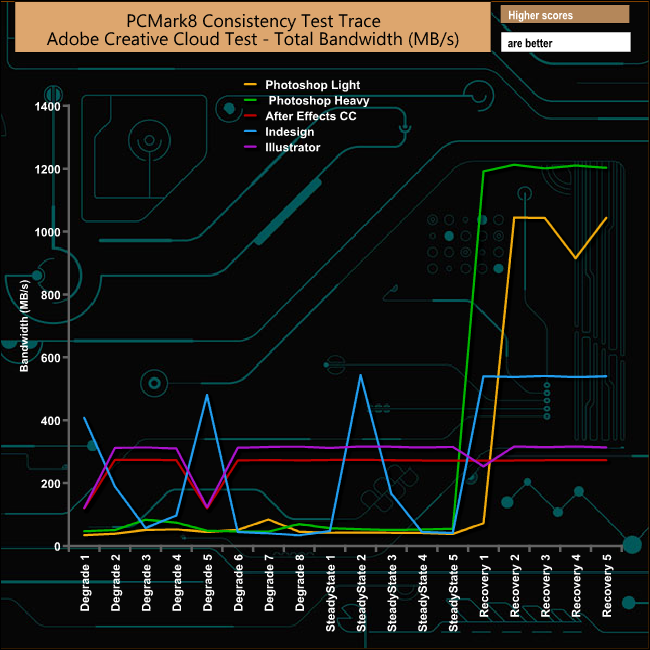
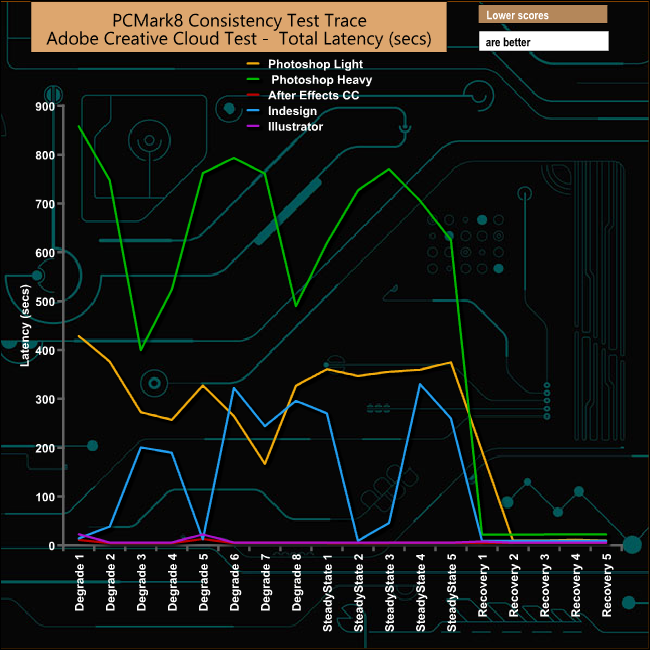
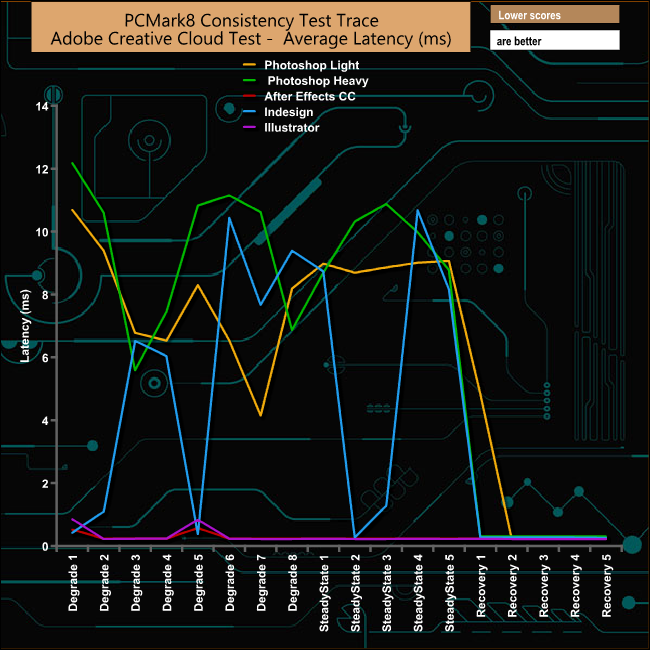
The drive suffered during the Adobe CC suite of tests particularly during the two Photoshop runs. But the recovery from the ordeal was very good, if a little erratic in the case of the Photoshop Light test runs.
Microsoft Office
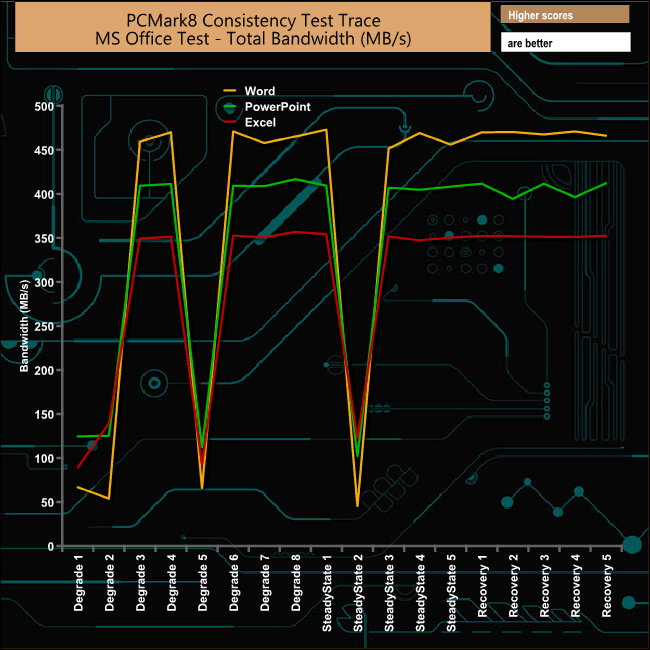
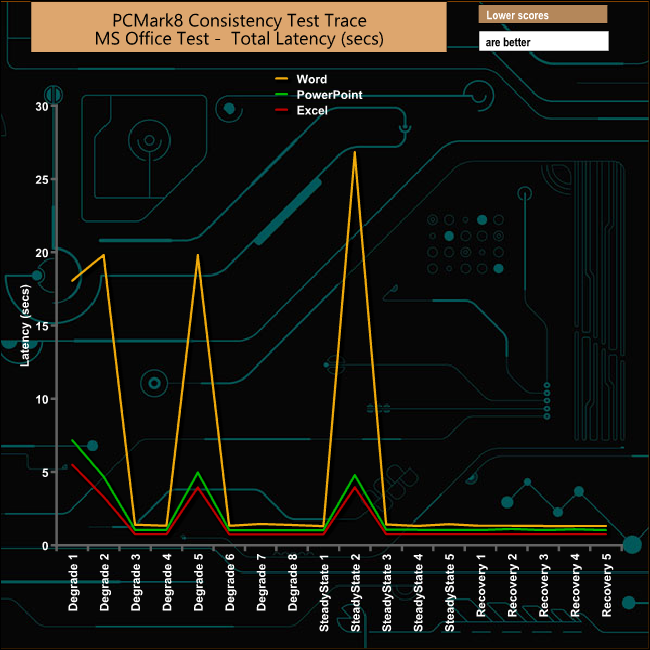
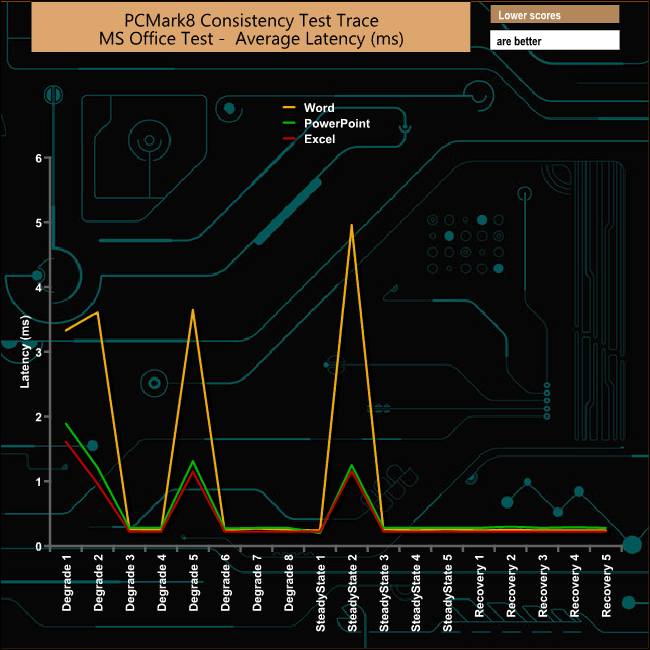
The drive didn't handle the MS Office test traces to well either with huge drops in bandwidth in the fifth Degradation and second SteadyState phases for all three traces. However, once again the recovery is good but erratic.
Casual Gaming

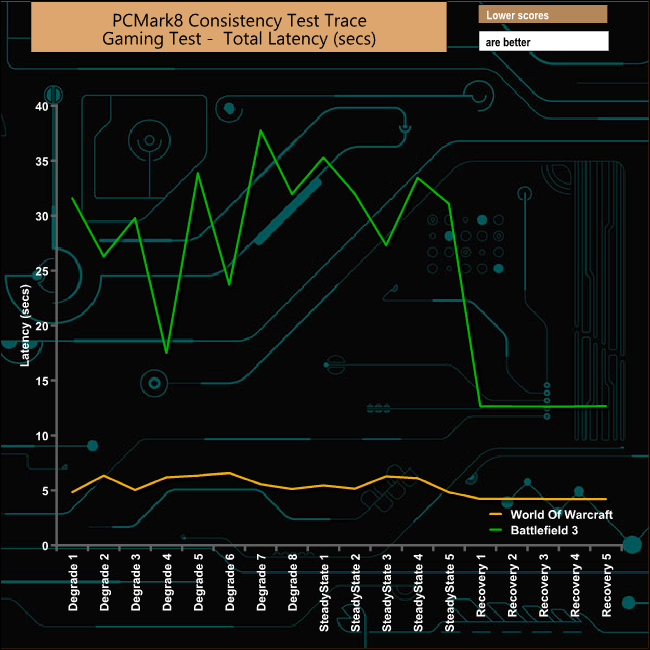
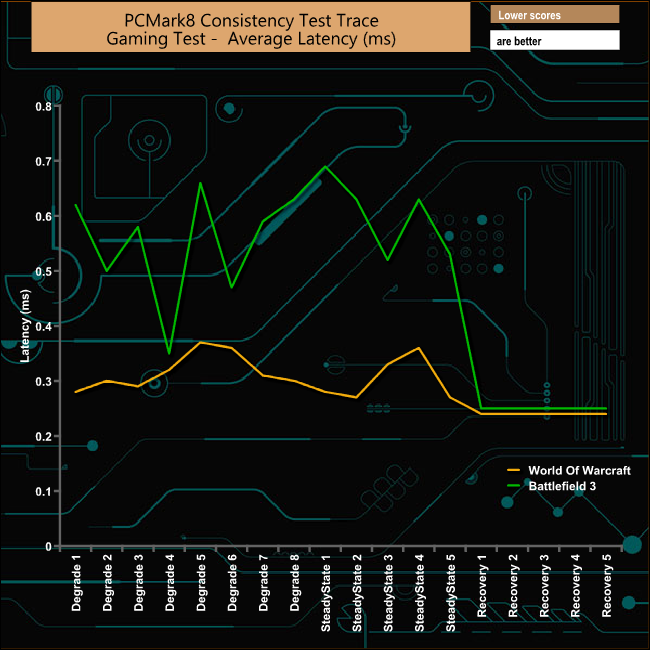
It was a bumpy ride for the drive in the pair of Casual Gaming tests as well, but once again the drive recovered well.
Just like the Consistency test, PCMark 8’s standard Storage test also saves a large amount of performance data. The default test runs through the test suite of 10 applications three times. Here we show the total bandwidth performance for each of the individual test suites for the third and final benchmark run.
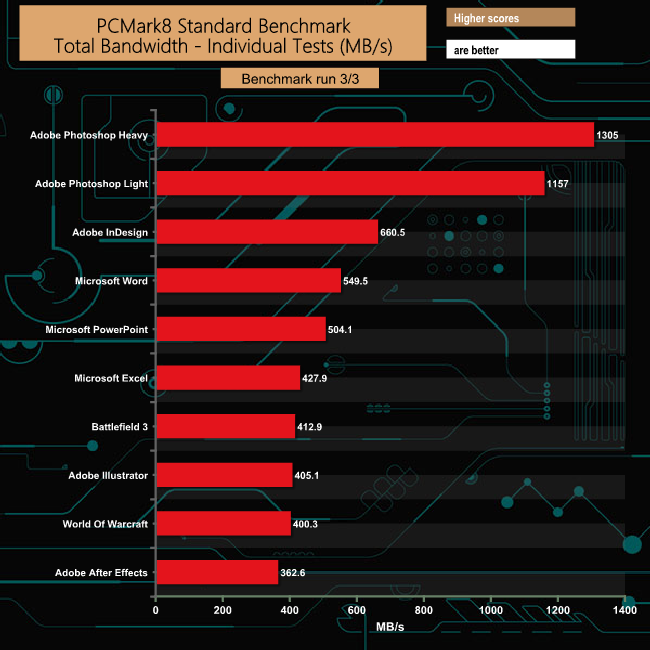
The NM600 performed quite well in the PCMark 8 Standard Storage test with over 1GB/s of bandwidth for both the Adobe Photoshop tests.
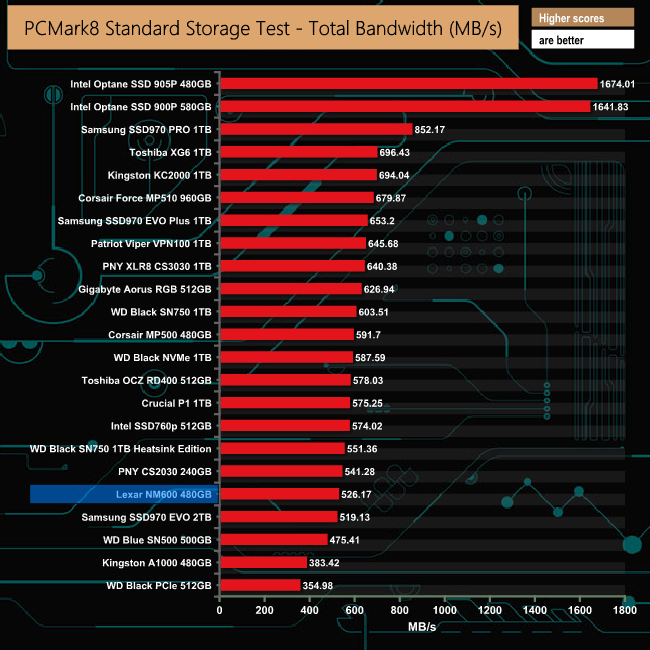
The overall bandwidth result of 526.17MB/s in PCMark 8's Standard Storage test wasn't enough to pull the drive out from the bottom five drives we have tested to date.
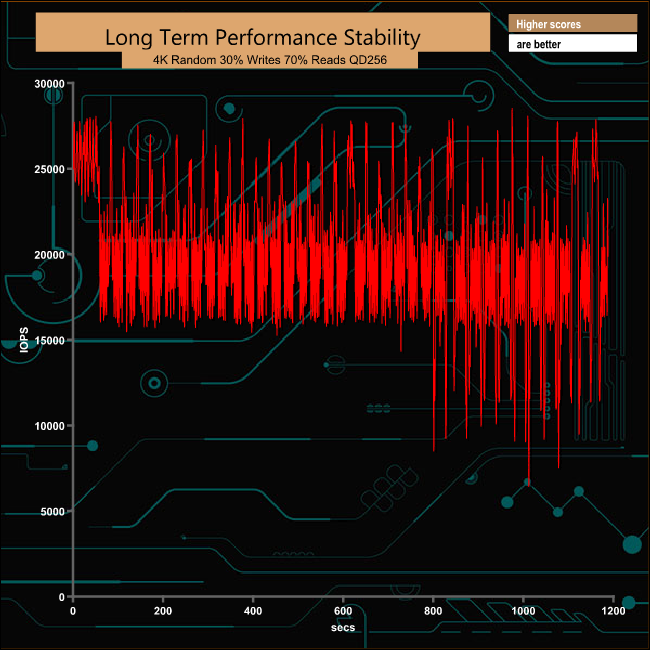
For the long term performance stability test, we set the drive up to run a 20-minute 4K random test with a 30% write, 70% read split, at a Queue Depth of 256 over the entire disk. The 480GB Lexar NM600 averaged 19,877.39 IOPS for the test with a performance stability of 71.51% which is excellent for this class of drive.
To test real life performance of a drive we use a mix of folder/file types and by using the FastCopy utility (which gives a time as well as MB/s result) we record the performance of drive reading from & writing to a 256GB Samsung SSD850 PRO.
We use the following folder/file types:
- 100GB data file.
- 60GB iso image.
- 60GB Steam folder – 29,521 files.
- 50GB File folder – 28,523 files.
- 21GB 8K Movie demos.
- 12GB Movie folder – 24 files (mix of Blu-ray and 4K files).
- 11GB 4K Raw Movie Clips (8 MP4V files).
- 10GB Photo folder – 621 files (mix of png, raw and jpeg images).
- 10GB Audio folder – 1,483 files (mix of mp3 and .flac files).
- 5GB (1.5bn pixel) photo.
![]()
The drive had no problems dealing with our real life file transfers, with over 500GB/s speeds for most of the larger file sizes writing to the SATA drive.
To get a measure of how much faster PCIe NVMe drives are than standard SATA SSDs, we use the same files but transfer to and from a 512GB Toshiba OCZ RD400:
![]()
As with the transferring of files between the drive and a standard SATA SSD, it's in the small bity file transfers where the performance in the NVMe to NVMe drive transfer drops considerably.
Lexar is one name you might not associate with SSD drives, as the company is better known for its range of flash cards. They are trying to change this, however, with the launch of the M.2 NM family of drives. Currently the range comprises one SATA based drive, the NM210, and three NVMe lines, the 2242 format NM520, the 2280 NM500 and the flagship drive of the range, the NM600. There are just two capacities available (at the time of writing this review) in the NM600 line-up; 240GB and 480GB.
The NM600 uses a combination of Micron 64-layer 3D TLC NAND and a Silicon Motion SM2263XT controller. The XT is the DRAM-less version of Silicon Motion's 4-channel SM2263 controller which helps in trying to keep drive manufacturing costs down. To counteract the lack of DRAM cache support, the controller makes use of host memory buffer (HMB) technology which uses a small amount of system memory to cache the map table.

Lexar's official Sequential speed ratings for the 480GB drive are up to 2,100MB/s for reads and up to 1,600MB/s for writes. When tested with the ATTO benchmark the review drive couldn't quite get to that maximum read figure, but at 2,049MB/s it wasn't that far short. It was a similar story when we tested Sequential write performance, as at 1,559MB/s it fell just shy of the official maximum figure.
When it comes to 4K random performance the 480GB drive is rated as up to 188,000 IOPS for reads and 156,000 IOPS for writes. With our 4K testing, using four threads, we couldn't get close to either of those figures at 132,115 IOPS for reads and just 53,747 IOPS for writes. We then did a quick test using 8 threads which saw the read figure rise to 150,208 IOPS, still below the maximum figure. However, the write performance using 8 threads rocketed past the official maximum rating with a score of 212,825.7 IOPS.
Overall, it's clearly not the fastest SSD going – we consistently saw it place in the bottom section of our charts throughout our testing today. That said, there is a glimmer of hope for the drive as it is highly affordable – but as of now it does not seem there is any UK availability.
We could only find the 480GB version of Lexar's NM600 drive on Amazon for £64.04 (plus delivery) HERE. Do note that this price is from the Amazon Global Store, and the drive will be imported from the USA.
Pros
- Decent Sequential performance.
- Performance stability.
Cons
- Disappointing 4K performance under our standard tests.
- Hard to find.
KitGuru says: It's interesting to see Lexar enter the highly competitive NVMe SSD market, and although the NM600 doesn't bring anything new to the table, Lexar has given it a fighting chance with pretty competitive pricing.