

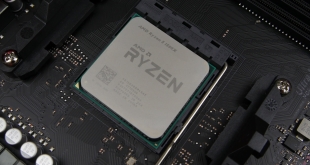
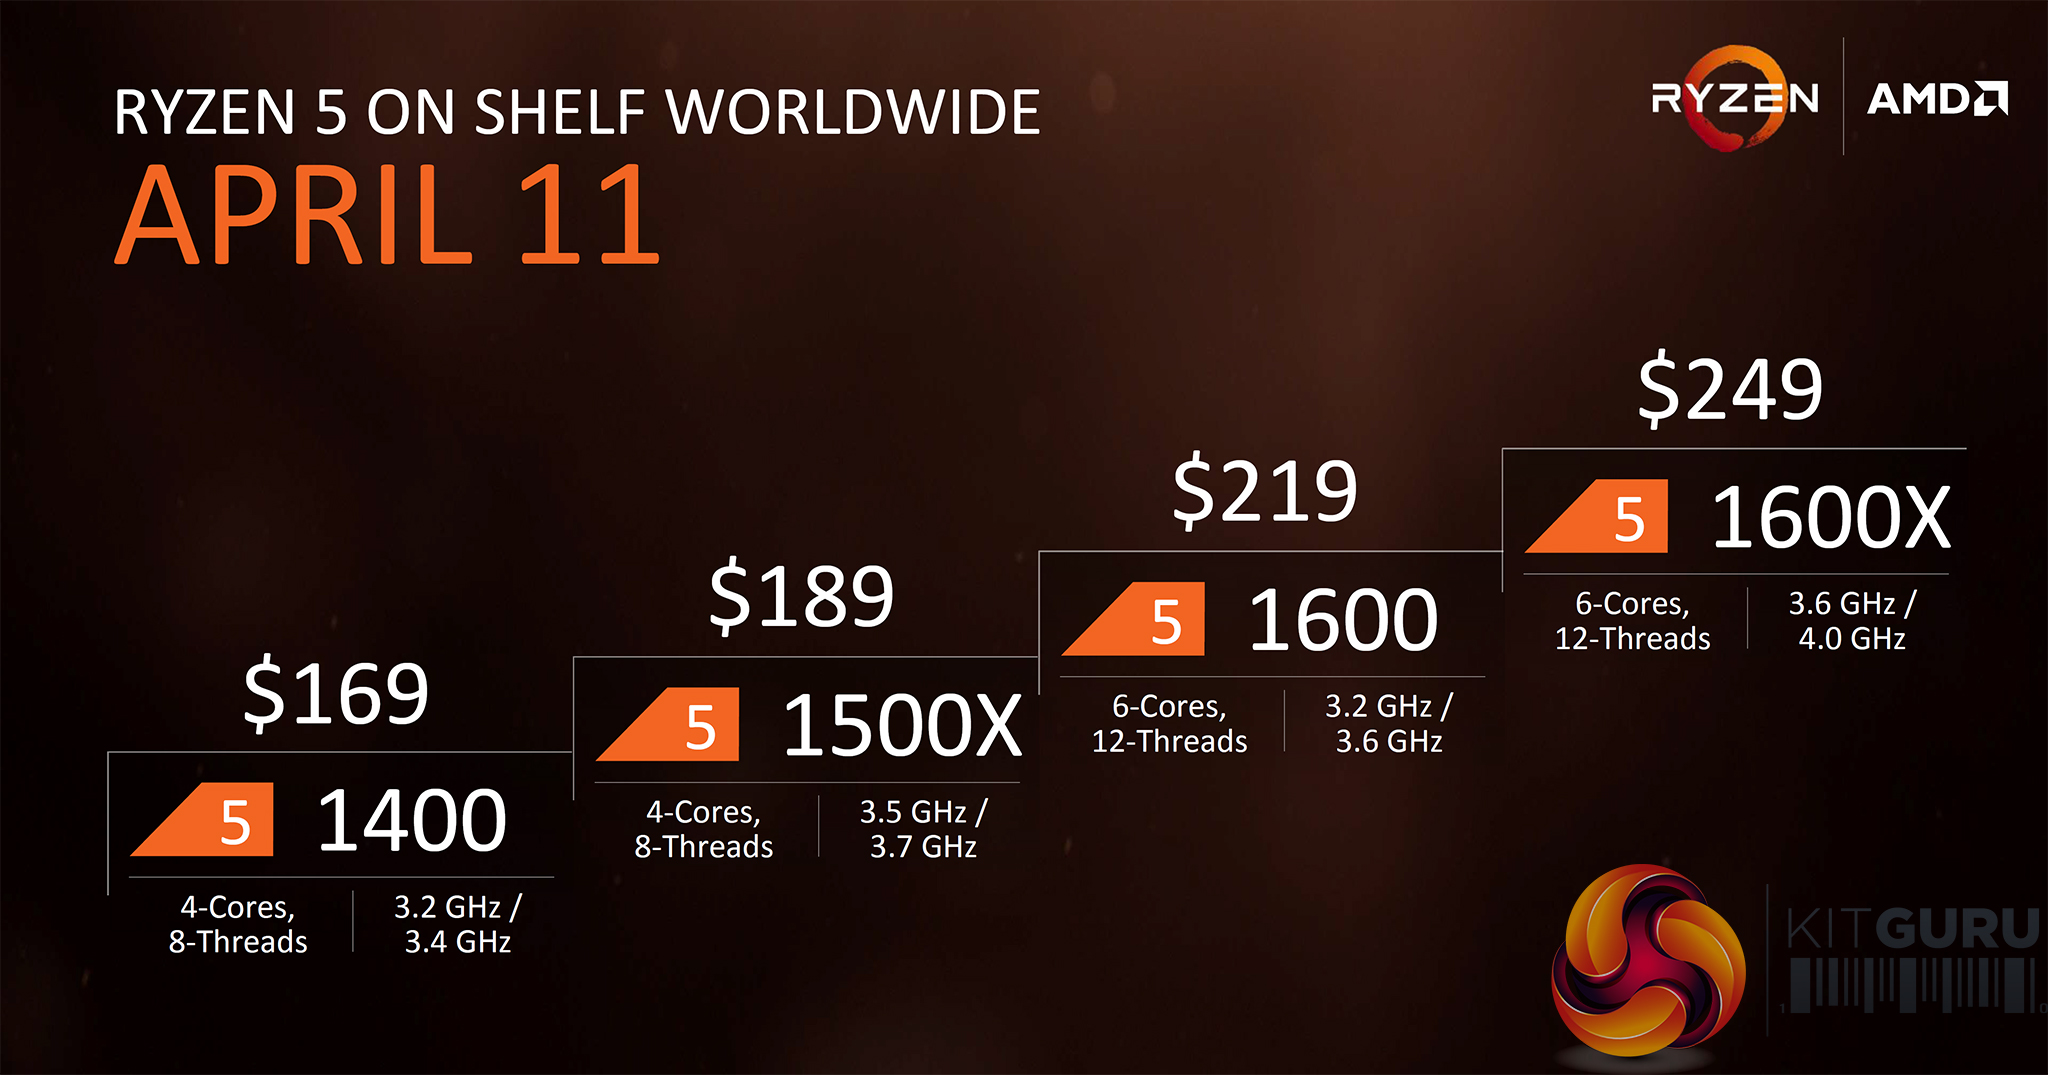
Ryzen 5 1500X is AMD’s fastest quad-core based on the new Zen architecture. Simultaneous Multi-Threading (SMT) makes this a four-core, eight-thread part that runs at an out-of-the-box frequency of 3.5-3.7GHz, with single-threaded boosts to 3.9GHz under Extended Frequency Range (XFR) conditions.
Priced at $189 and shipping with the Wraith Spire cooler, AMD pits overclockable Ryzen 5 4C8T parts against multiplier-locked Core i5 processors from Intel. Logical competitors to the Ryzen 5 1500X are Intel’s Kaby Lake Core i5-7400 and Core i5-7500, depending on e-tailer pricing in the UK.
AMD deploys the 4C8T Ryzen 5 1500X CPU as a design utilising dual CPU Complex (CCX) units. This gives the quad-core part a 2+2 design, as opposed to the asymmetrical 3+1 or 4+0 deployments that may have been theoretically possible. The balanced 2+2 design could mean that AMD is able to use Ryzen CCXs that don’t make the grade with all four cores enabled (or three cores that would form Ryzen 5 six-core chips).
Other characteristics for the Ryzen 5 1500X are interesting as they distinguish it from the lower-cost quad-core 1400. The full slab of shared L3 cache is retained for the 1500X, with 8MB per CCX being available. That gives an effective 4MB of L3 cache per core (though not dedicated) that is double the available per-core capacity of Ryzen 7 and even higher than Intel’s HEDT processors. L2 cache capacity is still 512KB per core, making the total amount 2MB.
Operating frequencies are also interesting for Ryzen 1500X. The base speed is 3.5GHz, with a maximum Precision Boost speed of 3.7GHz under 2-core loading conditions. That means that all-core loads see the chip running at a solid 3.6GHz. Noteworthy, though, is the 200MHz XFR headroom – double that we have seen on any other Ryzen processors to date. This gives the 1500X an ability to clock up to 3.9GHz under single-thread loads. As with all Ryzen parts, an unlocked core ratio multiplier with 0.25x granularity allows for overclocking on supported motherboards.
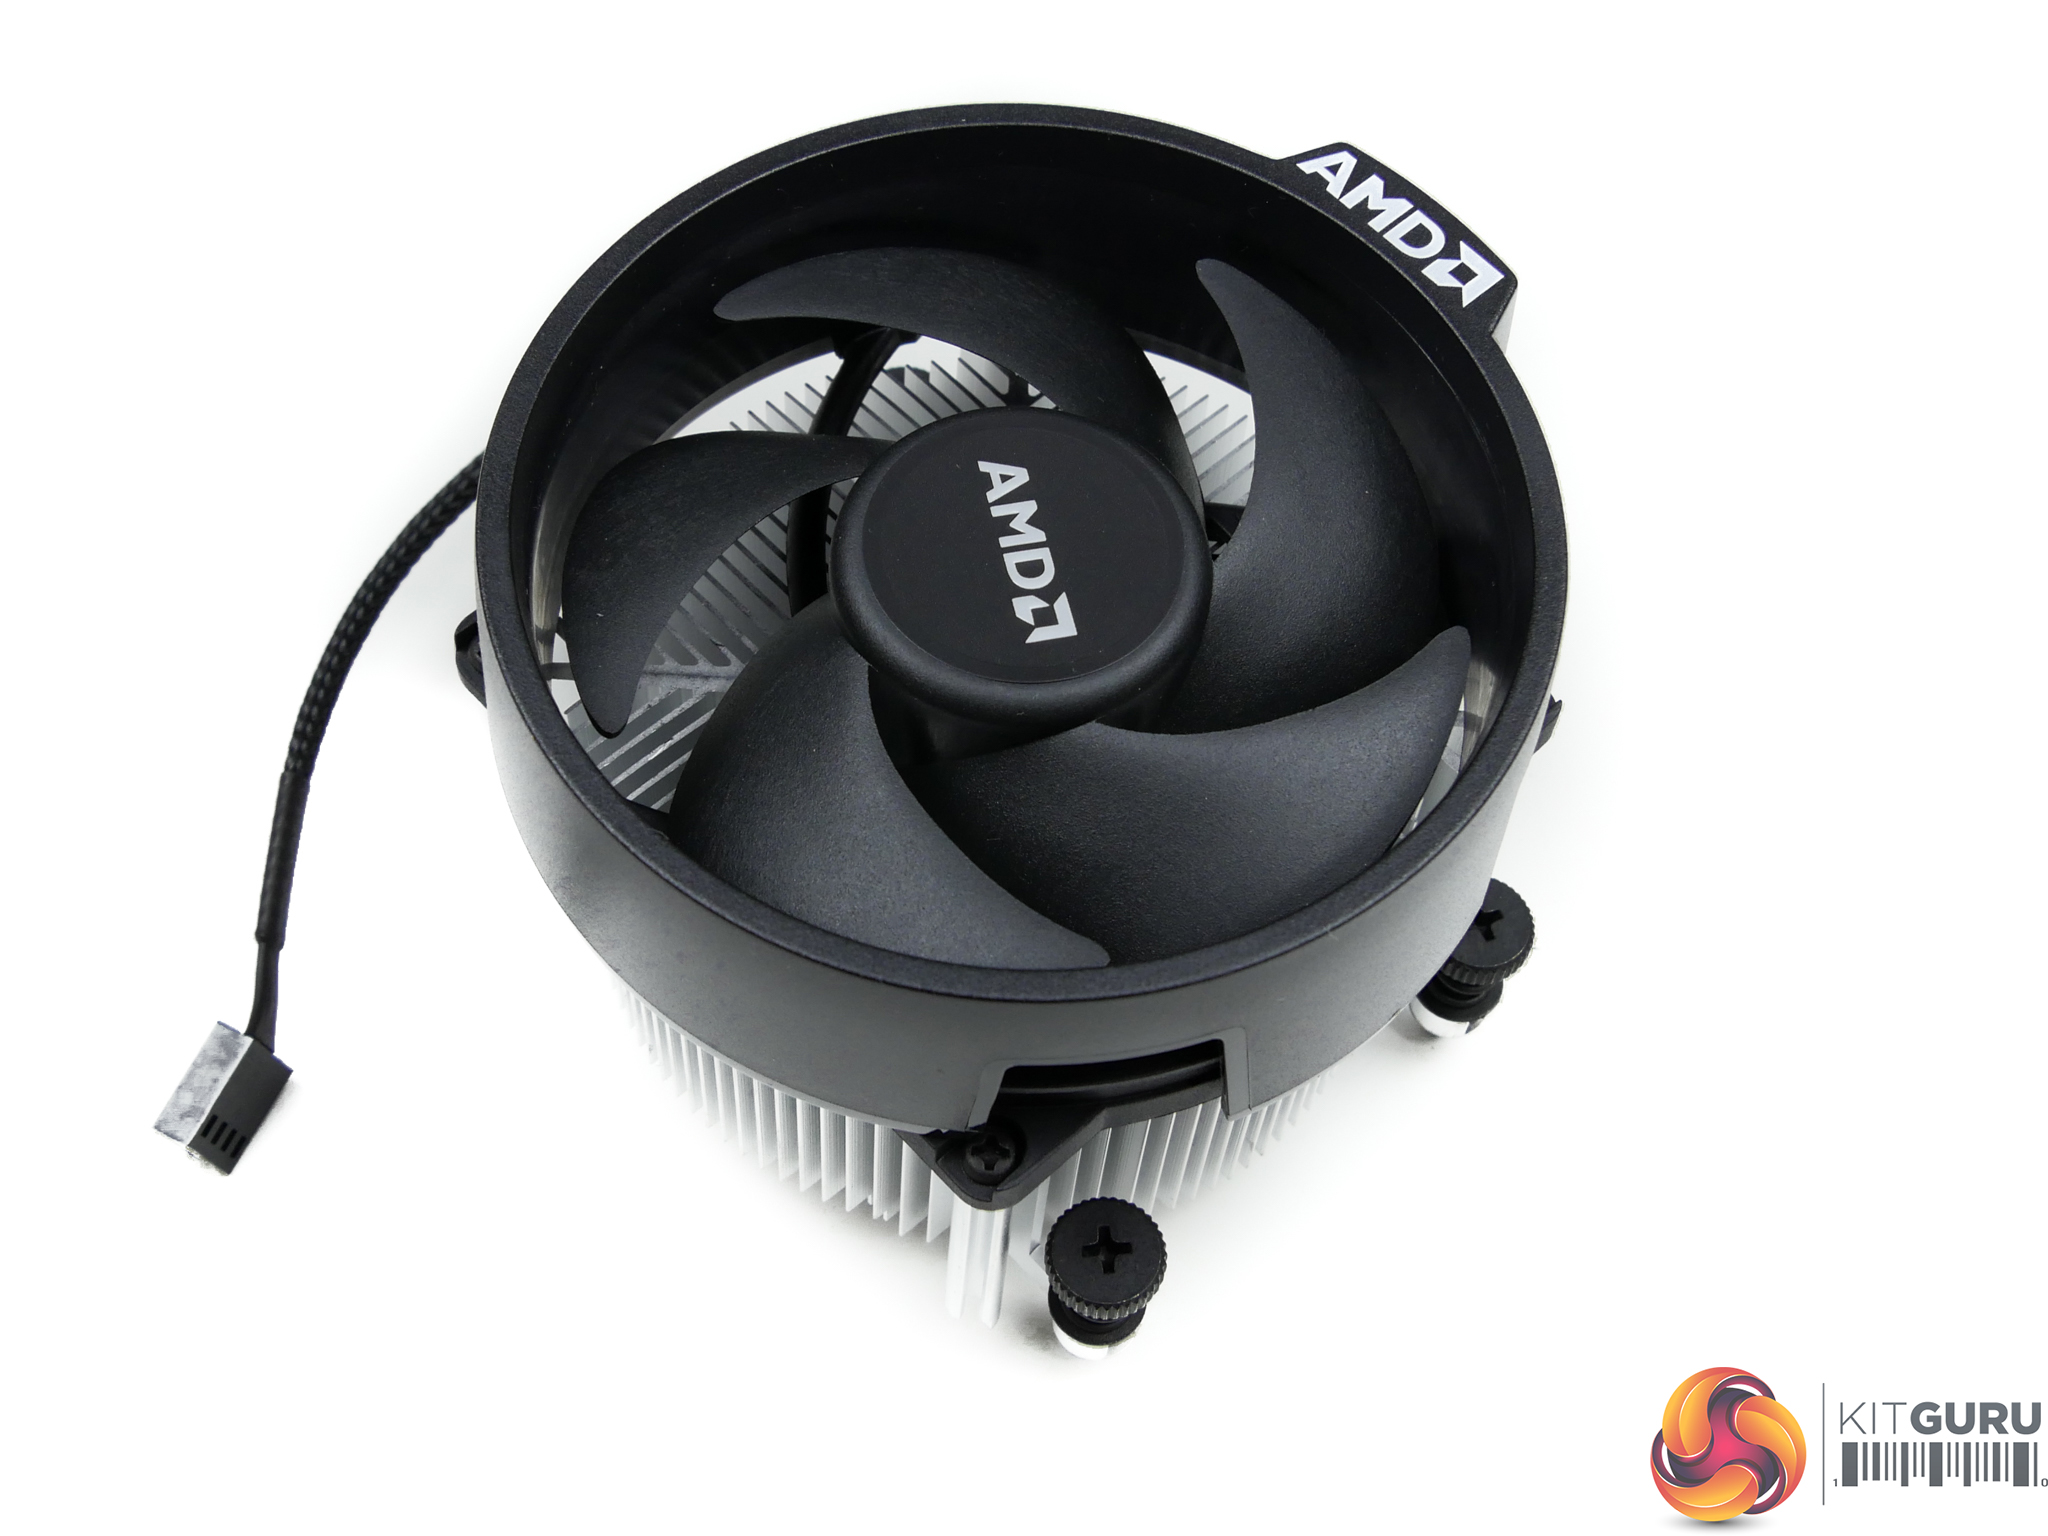
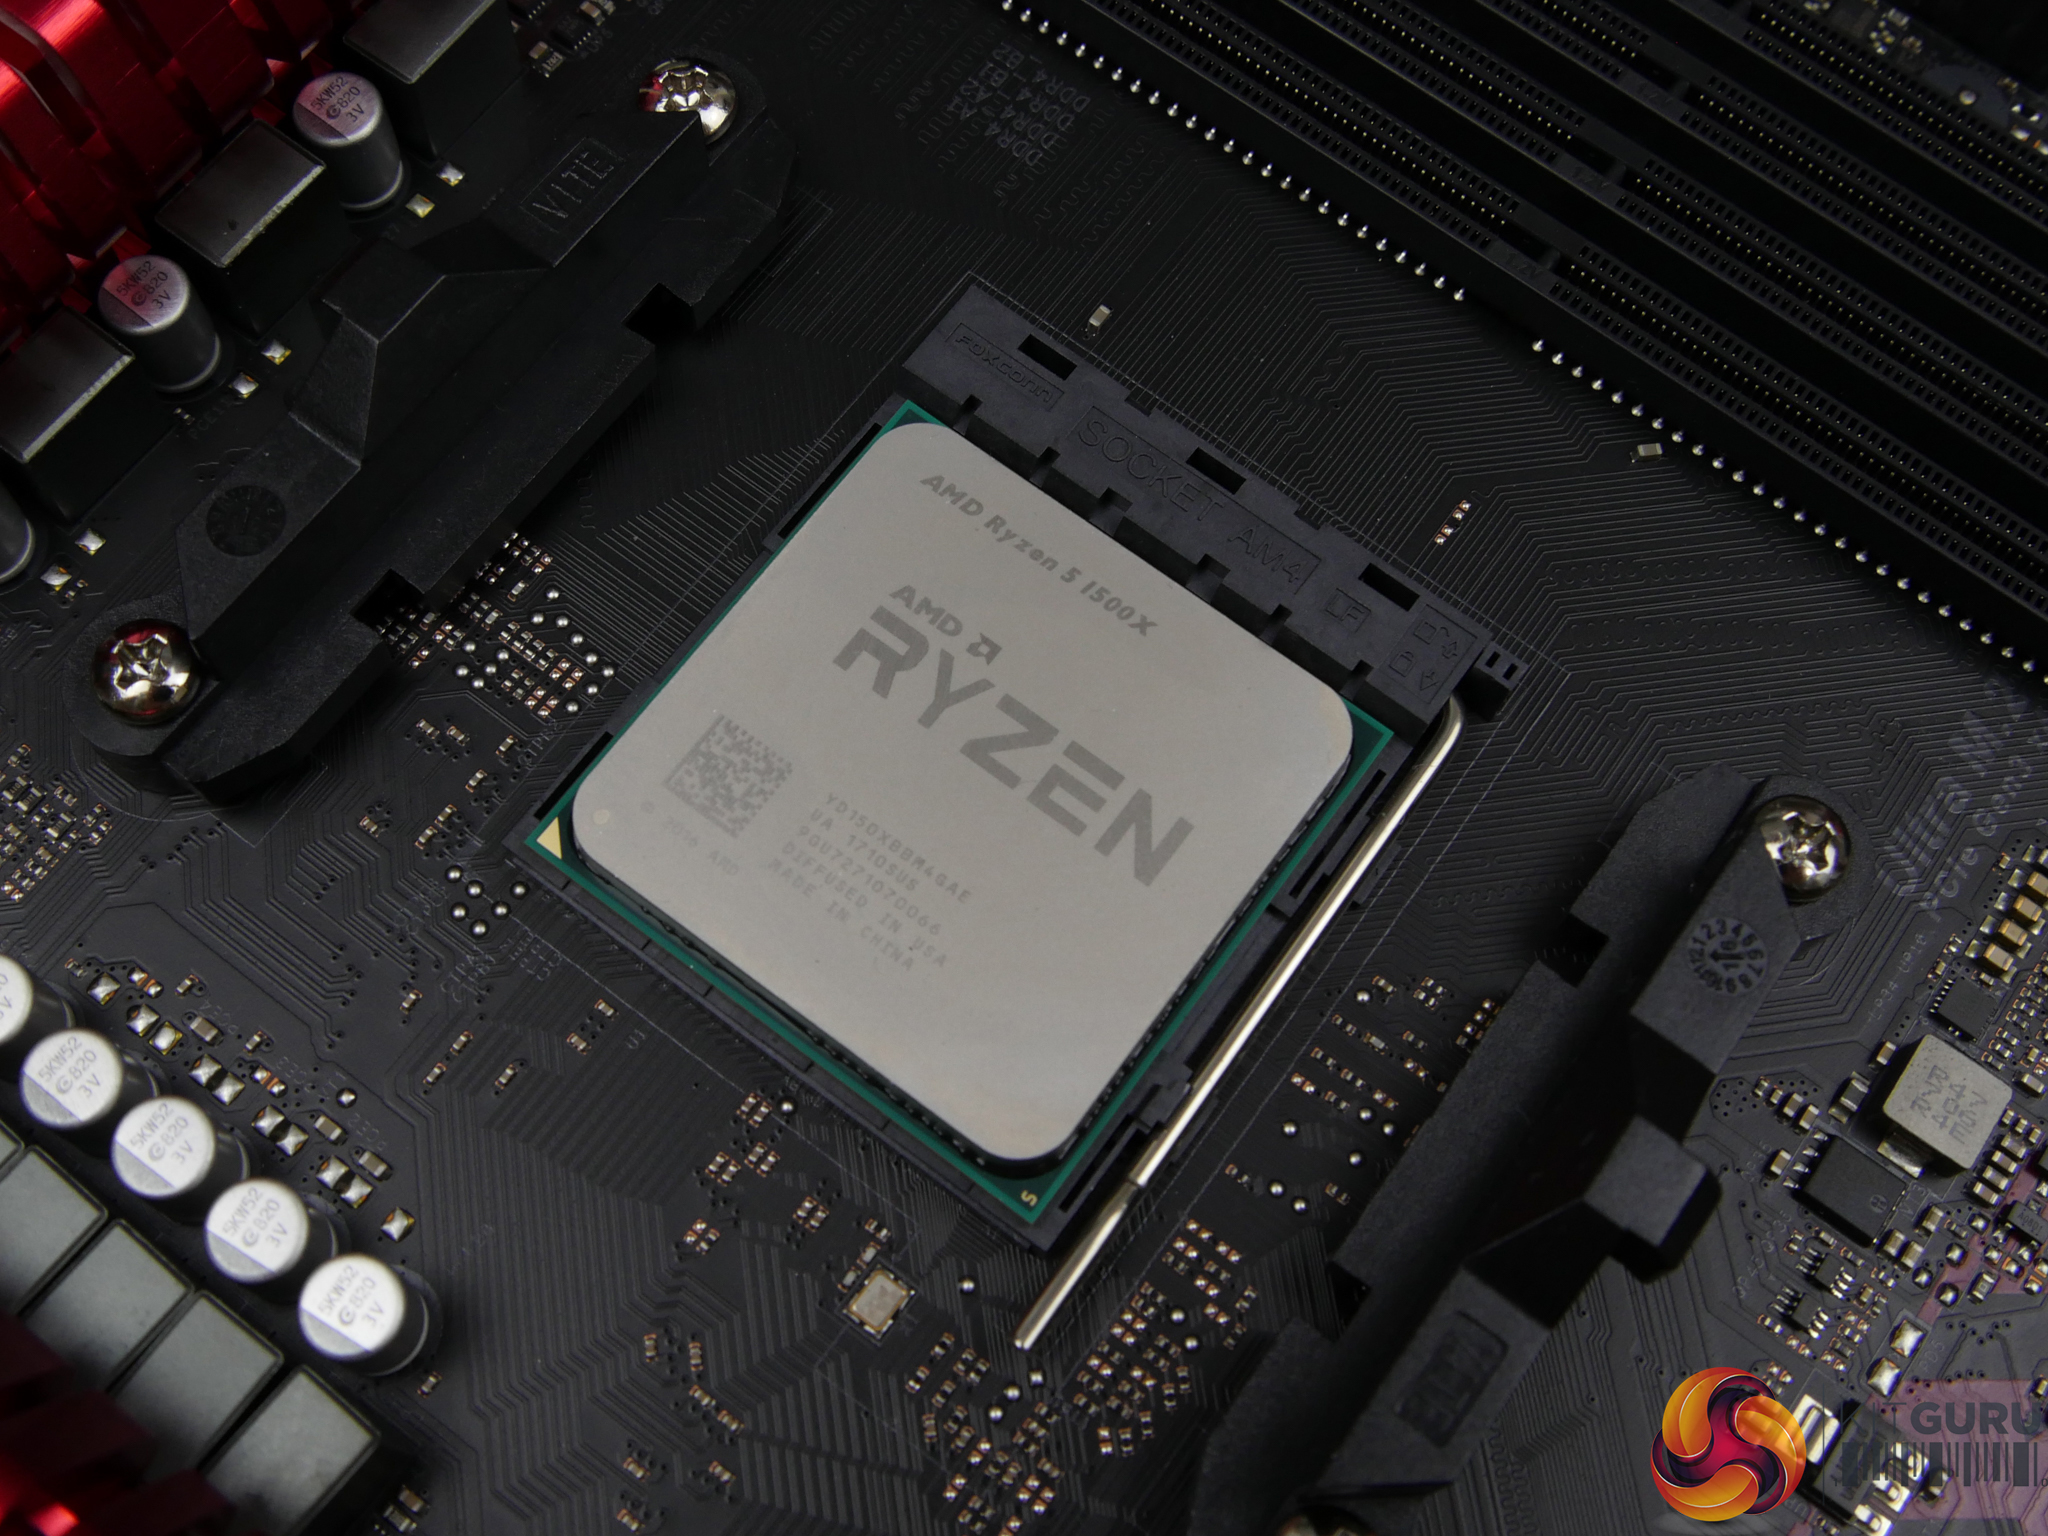
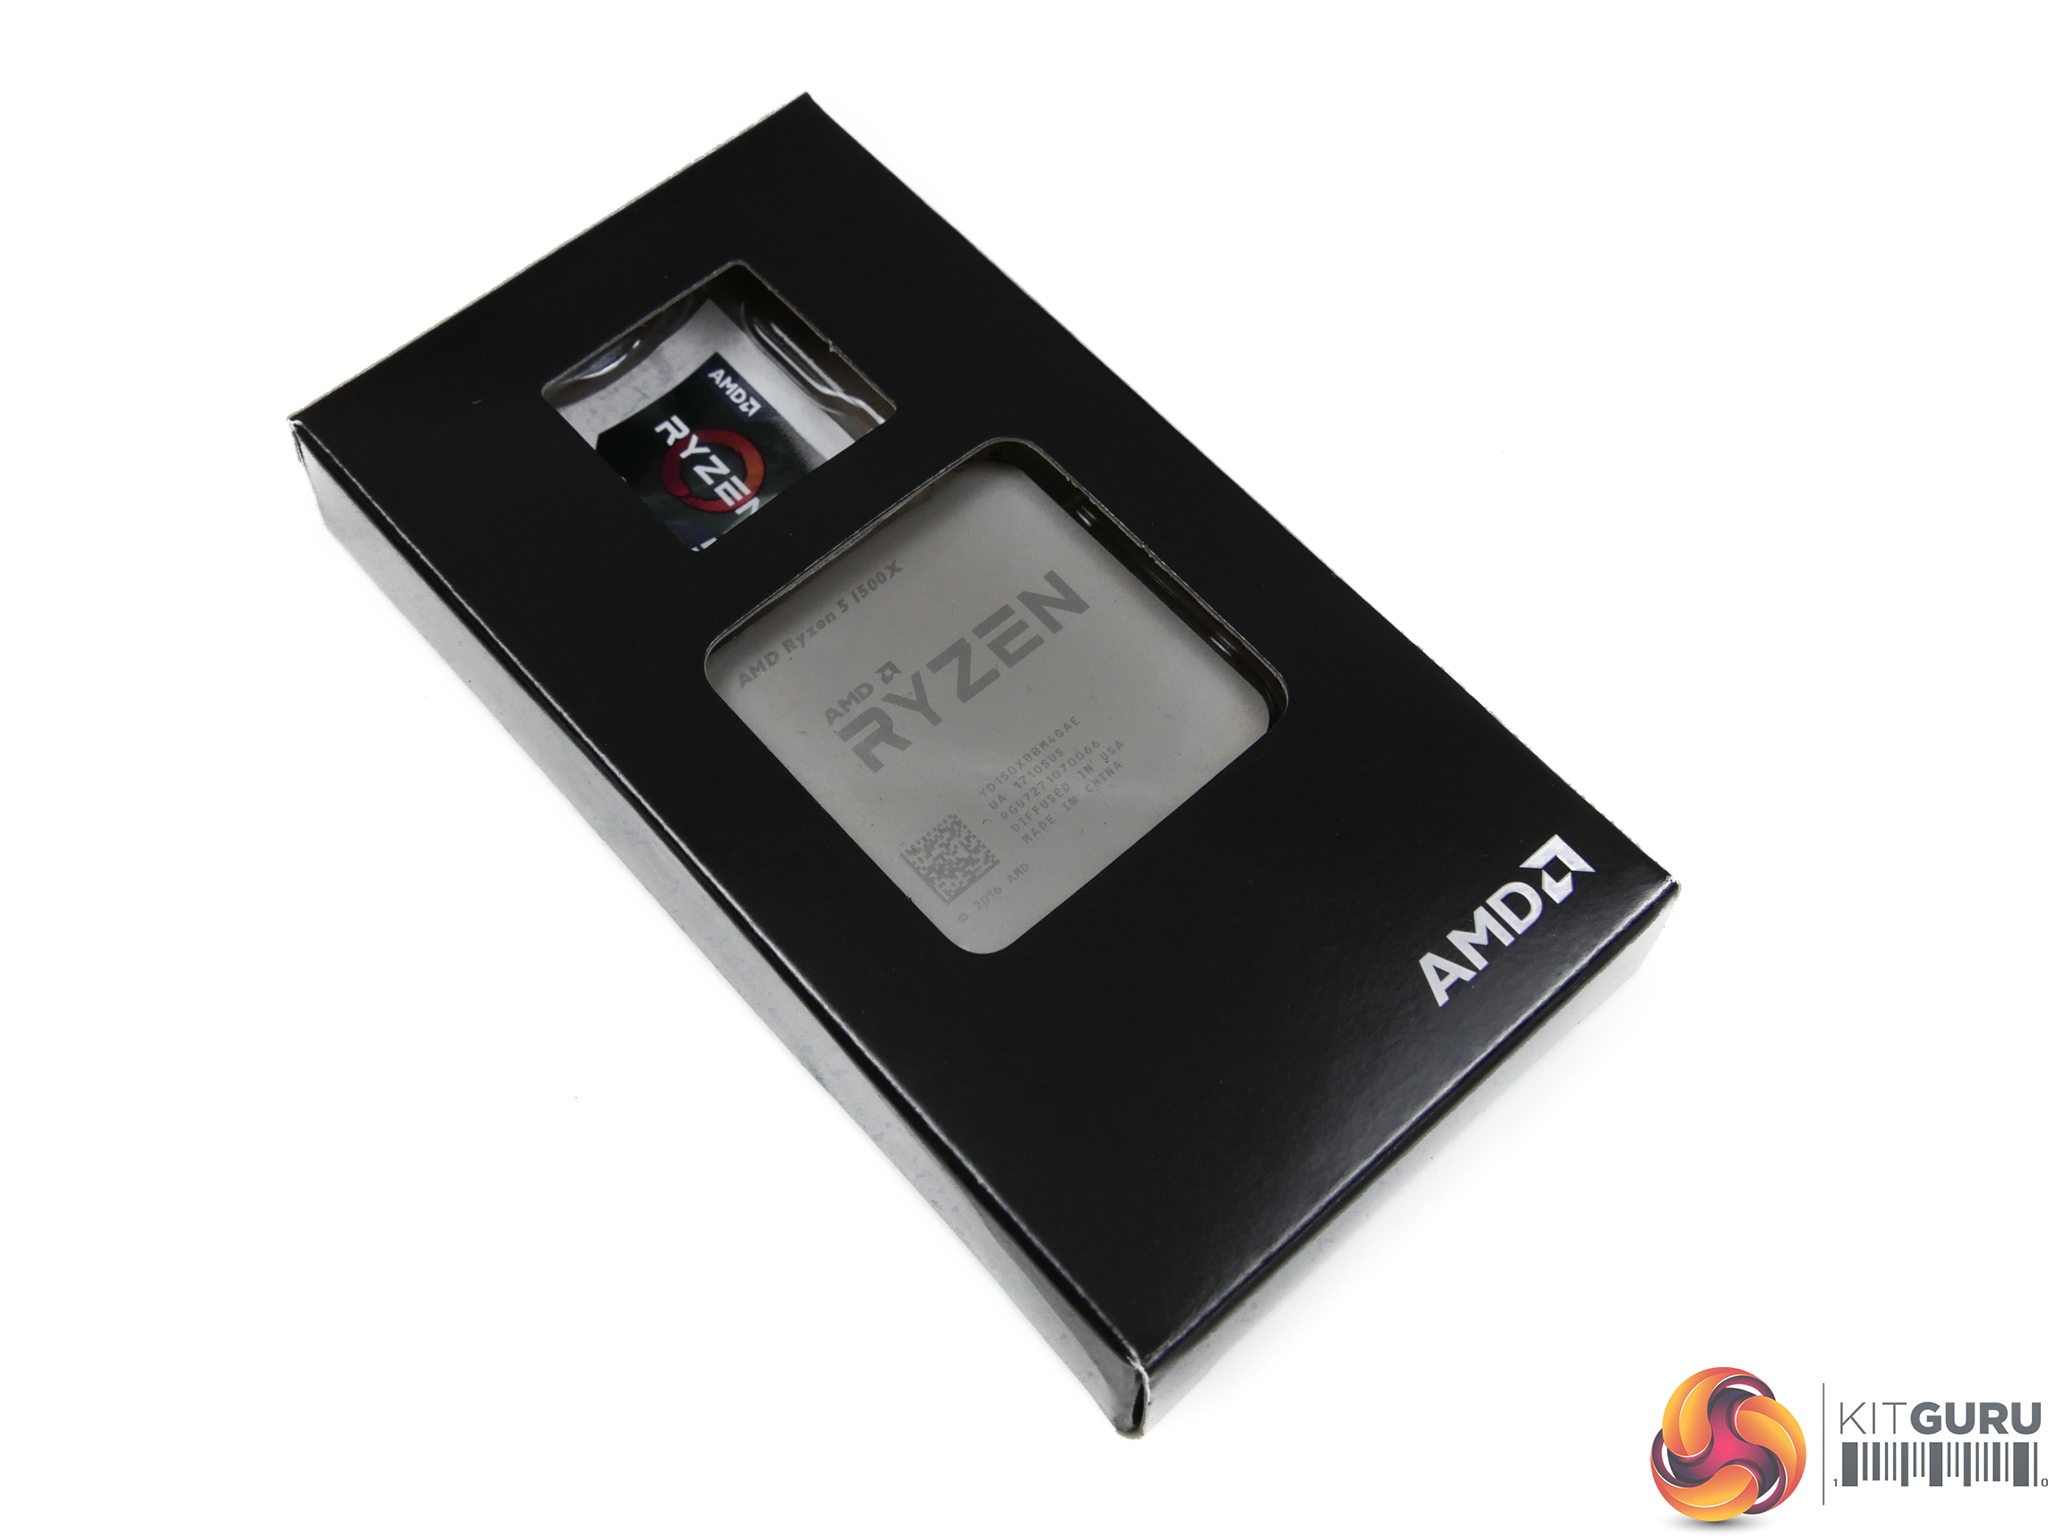
AMD’s well-balanced Wraith Spire is included with the 65W TDP 1500X. This model is, however, different to the Wraith Spire supplied with Ryzen 7 1700 as it does not feature RGB lighting. For reference, Intel’s boxed Core i5 CPUs in this price range also ship with coolers.
| CPU | AMD Ryzen 5 1600X | AMD Ryzen 5 1600 | AMD Ryzen 5 1500X | AMD Ryzen 5 1400 | Intel Core i5-7600K | Intel Core i5-7400 | Intel Core i3-7350K |
| CPU Codename | Zen | Zen | Zen | Zen | Kaby Lake | Kaby Lake | Kaby Lake |
| Core / Threads |
6 / 12 | 6 / 12 | 4 / 8 | 4 / 8 | 4 / 4 | 4 / 4 | 2 / 4 |
| CCX Config | 3+3 | 3+3 | 2+2 | 2+2 | n/a | n/a | n/a |
| Base Frequency | 3.6GHz | 3.2GHz | 3.5GHz | 3.2GHz | 3.8GHz | 3.0GHz | 4.2GHz |
| Boost Frequency | 4.0GHz | 3.6GHz | 3.7GHz | 3.4GHz | 4.2GHz | 3.5GHz | n/a |
| Maximum Frequency | 4.1GHz (100MHz XFR) | 3.7GHz (100MHz XFR) | 3.9GHz (200MHz XFR) | 3.45GHz (50MHz XFR) | n/a | n/a | n/a |
| Unlocked Core Multiplier | Yes (x0.25 granularity) | Yes (x0.25 granularity) | Yes (x0.25 granularity) | Yes (x0.25 granularity) | Yes (x1 granularity) | No | Yes (x1 granularity) |
| Total Cache | 16MB L3 + 3MB L2 | 16MB L3 + 3MB L2 | 16MB L3 + 2MB L2 | 8MB L3 + 2MB L2 | 6MB L3 + 1MB L2 | 6MB L3 + 1MB L2 | 4MB L3 + 0.5MB L2 |
| PCIe Lanes | 16+4+4 | 16+4+4 | 16+4+4 | 16+4+4 | 16 | 16 | 16 |
| CPU Socket | AM4 | AM4 | AM4 | AM4 | LGA 1151 | LGA 1151 | LGA 1151 |
| Manufacturing Process | 14nm | 14nm | 14nm | 14nm | 14nm | 14nm | 14nm |
| TDP | 95W | 65W | 65W | 65W | 91W | 65W | 60W |
| CPU Cooler | n/a | Wraith Spire (no LED) | Wraith Spire (no LED) | Wraith Stealth (no LED) | n/a | Intel E97379-003 (Al slug) | n/a |
| MSRP | $249 | $219 | $189 | $169 | $242 | $182 | $168-179 |
| UK Street Price | £249.99 | £219.99 | £189.99 | £169.99 | Approx. £230 | Approx. £170 | Approx. £170 |
On the face of it, Ryzen 5 1500X looks to be worthy of its $20 premium over the 1400 thanks to higher frequencies, double the L3 cache, and a better included cooler.
Prime competition on the Intel side comes from multiplier-locked Core i5-7500 and Core i5-7400 processors, depending on selling prices in retailers. They are quad-core Kaby Lake parts without any form of additional multi-threading.
For more information regarding Ryzen and the AM4 platform, read our launch review for the Ryzen 7 1800X HERE. You can also read our Ryzen 7 1700 review HERE and the Ryzen 7 1700X review HERE.
For further analysis regarding the platform and chipset capabilities of Ryzen and AM4, you can read our Ryzen 5 1600X coverage.
Overclocking
Overclocking with Ryzen 5 is a practically identical procedure to that of Ryzen 7. The main settings worth tweaking for CPU overclocking are the CPU VCore, loadline calibration, and SOC voltage to aid stability especially with higher-speed memory kits. If your motherboard has the option in its UEFI, bumping NB voltage up to around 1.10-1.15V can aid stability.
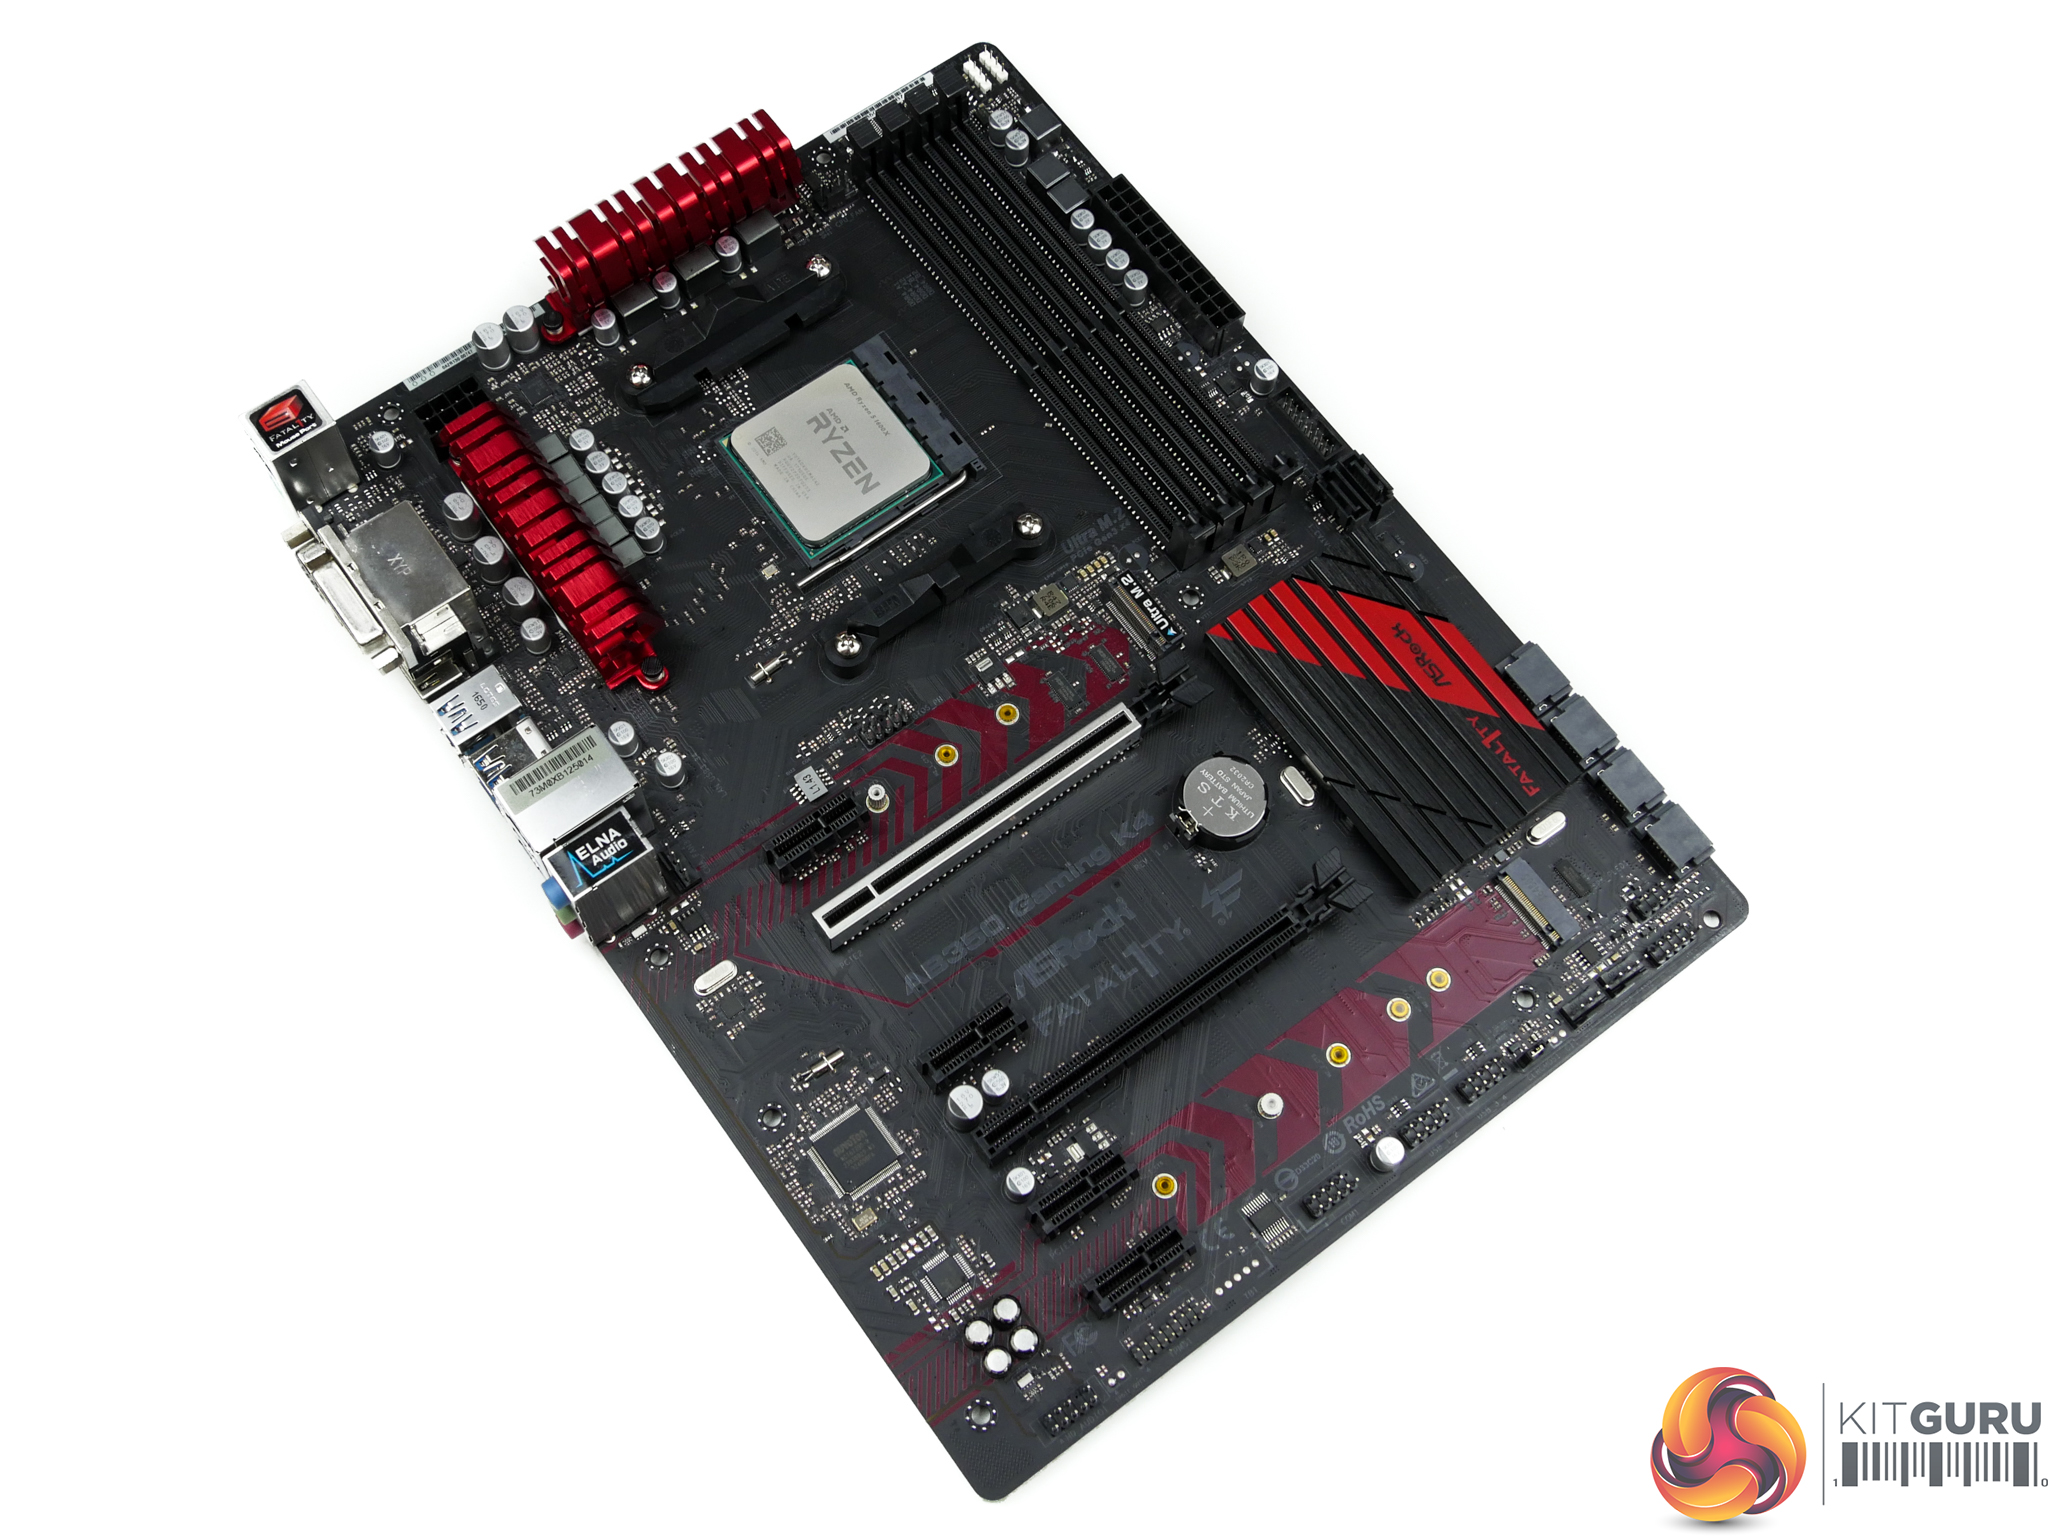
With that said, the number of adjustable voltage options on B350 motherboards is far more limited compared to X370, based on our experience with the ASRock Fatal1ty AB350 Gaming K4. This motherboard had no options for loadline calibration control and SOC voltage adjustment was not clear. That's not a major negative, necessarily, because the overclocking procedure is far more straightforward if CPU frequency and CPU voltage are the only worthwhile adjustable options.
Default voltage for manual tuning should start at around 1.3625V, according to AMD (though we noticed the Ryzen 5 1500X default to a lower voltage around 1.2xV in the UEFI). Users should be fine pushing to 1.40V with a decent CPU cooler and up to 1.45V with a high-end dual-tower heatsink or dual-fan AIO radiator. At 1.45V, however, AMD suggests that processor longevity could be negatively impacted.
In short, our final Ryzen 5 1500X overclocking settings using an ASRock Fatal1ty AB350 Gaming K4 motherboard were:
- 1.40V CPU VCore.
- Multiple Cinebench R15 multi-core runs to validate stability, as well as AIDA64 CPU stress test.
- DDR4-3200MHz 14-14-14-34 @ 1.35V (XMP).
The best frequency that we could achieve with these settings was 3.9GHz with 1.40V (1.376V under Cinebench loading due to a lack of loadline calibration settings on the ASRock AB350 Gaming K4 motherboard).
We could not reach 4000MHz while maintaining the voltage at the 1.40V that we deemed sensible for the Wraith Spire cooler.
The overclocking results for the Ryzen 5 1500X are a little lower than what our 1600X achieved with the same voltage level and test system. This is largely down to the silicon lottery but it is also a possible indication that Ryzen 5 1600X silicon is superior to that used on the quad-core 1500X. The reduced core count versus the 1600X does not seems to aid 1500X overclocking results.
Our superb kit of G.SKILL Trident Z DDR4 worked flawlessly at its 3200MHz C14 XMP settings on the ASRock motherboard. Temperatures were fine at a 1.376V load voltage even when using the bundle Wraith Spire CPU cooler, which is a decent unit in all fairness.
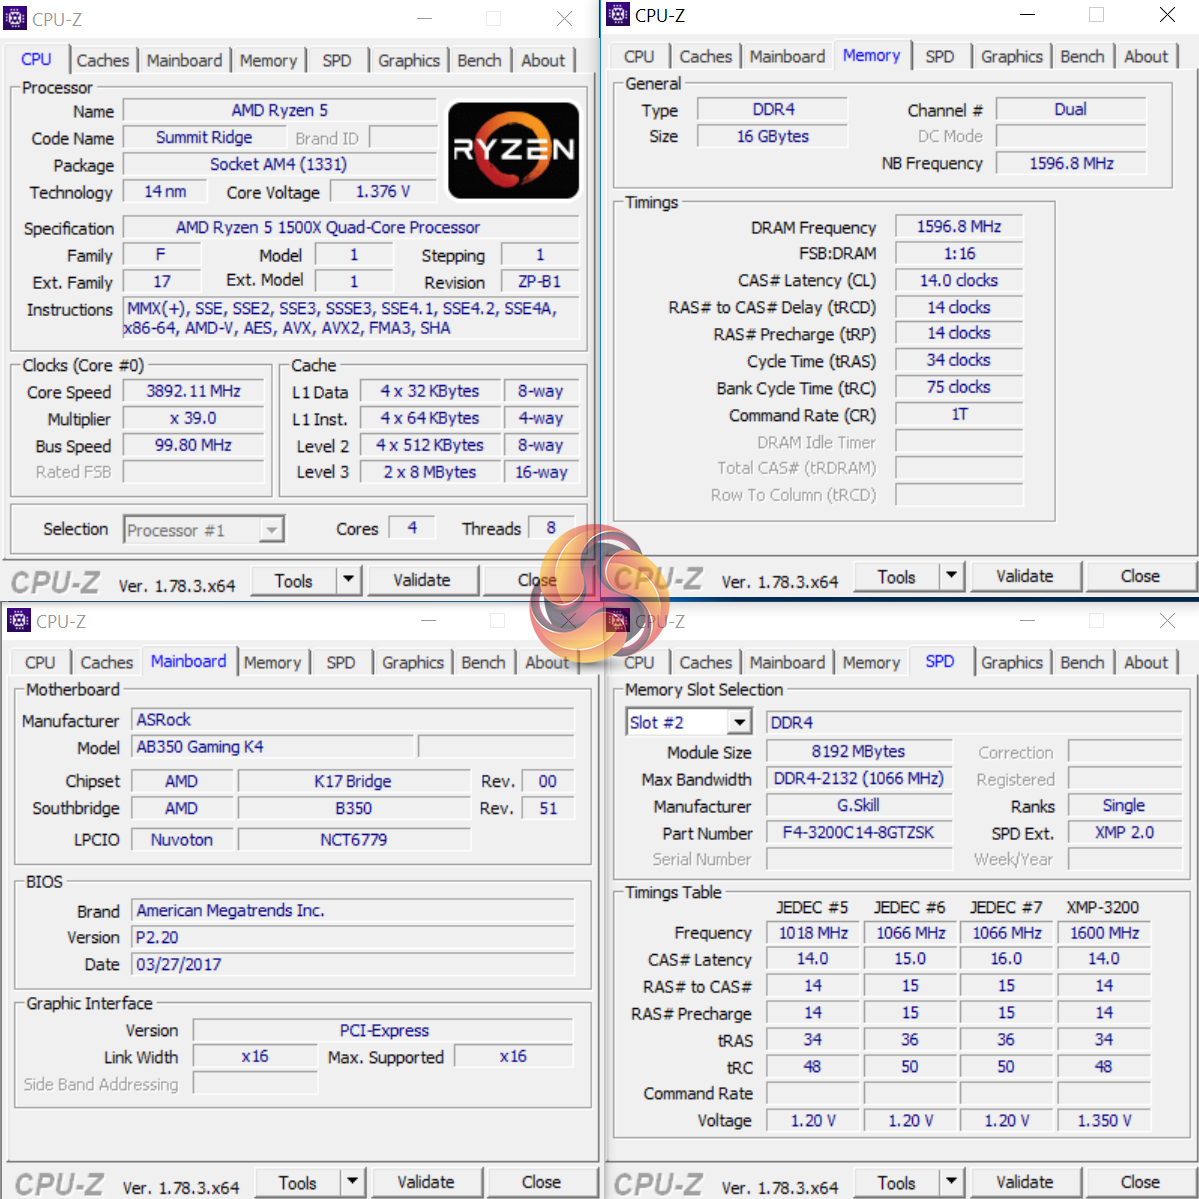
We will be outlining the Ryzen 5 1500X CPU's performance while using an ASRock Fatal1ty AB350 Gaming K4 AM4 motherboard.
A 16GB (2x8GB) kit of G.Skill's Trident Z DDR4 memory serves our test system. The kit's rated frequency of 3200MHz with CL14 timings should ensure that memory-induced bottlenecks are removed. A strength for the ASRock board is its ability to run this memory at 3200MHz CL14 using XMP, which is pushing on the limit of memory speed capability for the AM4 platform.
Today's comparison processors come in the form of:
- Piledriver FX-8370.
- Sandy Bridge i7-2700K.
- Ivy Bridge i5-3570K.
- Devil's Canyon i7-4790K (Haswell-based).
- Broadwell-E i7-6800K.
- Skylake's i5-6600K and i7-6700K.
- Kaby Lake's i3-7350K, i5-7400, i5-7600K, and i7-7700K.
- Ryzen 5 1600X.
- Ryzen 7 1700, 1700X and 1800X.
Where significant data is present in the chart (for games and all productivity benchmarks), the numbers are directly comparable with those displayed in our Ryzen 7 review HERE. This new test system is updated with the latest Windows build version which represents the only significant change (aside from multiple game updates) since Ryzen 7 testing.
It will be interesting to see how Ryzen 5 compares to its closest Kaby Lake competitor. Also of interest will be the ability of Ryzen 5 to compete with Ryzen 7 chips in lightly-threaded workloads, such as certain games.
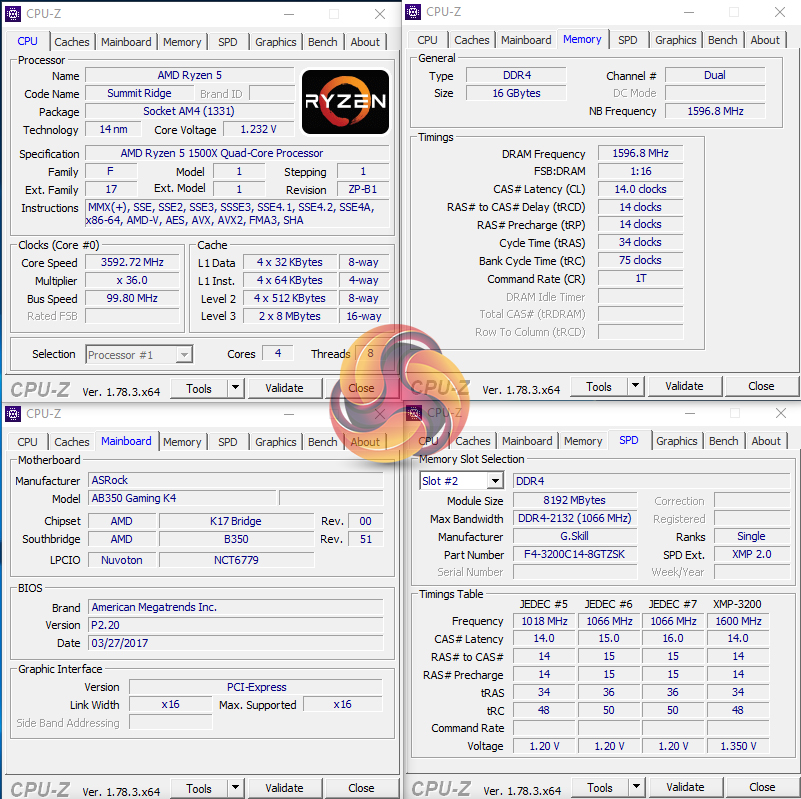
The Ryzen 5 1500X sat comfortably at its 3.6GHz all-core boost frequency throughout testing thanks to solid power delivery from the ASRock motherboard. XFR was confirmed as operating at 3.9GHz by running multiple different single-threaded workloads and checking the real-time clock speed.
We test Intel CPUs (except the Core i5-7400) using the forced turbo (multi-core turbo – MCT) setting that most motherboard vendors now enable by default or when using XMP memory. This feature pins all of the CPU's cores at the maximum turbo boost frequency all of the time. The voltage is bumped up to enhance stability but this results in greater power consumption and higher temperature readings which are important to remember when testing those parameters.
We also tested all CPUs' achievable overclocked frequencies so that you can see how your overclocked chip compares to another stock or overclocked chip.
CPU Test System Common Components:
- Graphics Card: Nvidia GeForce GTX Titan X Pascal (custom fan curve to eliminate thermal throttling).
- CPU Cooler: Cooler Master Hyper 212X / AMD Wraith Spire / Intel E97379-003 (stock, Aluminium slug) / Noctua NH-D14 / Noctua NH-D15 / Cryorig R1 Ultimate / Corsair H100i v2 / Corsair H110i GT.
- Games SSD: SK hynix SE3010 SATA 6Gbps 960GB.
- Power Supply: Seasonic Platinum 1000W / Seasonic Platinum 760W.
- Operating System: Windows 10 Pro 64-bit (Anniversary Update, latest version).
We try to use coolers that will realistically be partnered with the CPUs to gather performance measurements. In the case of Ryzen 5, this is a Cooler Master Hyper 212X for the 1600X and the supplied AMD Wraith Spire for the 1500X. The Core i5-7400 is tested with its stock Intel cooler.
Seasonic's Platinum-rated PSUs provide ample power to really push the CPU overclocks. Nvidia's GTX Titan X Pascal is the fastest gaming GPU on the planet, making it ideal for alleviating GPU-induced bottlenecks and putting the onus on CPU performance.
While we use a mixture of cooling and PSU hardware for general testing, where it is important to keep those items identical (power draw and temperature readings) we ensure that the correct hardware is used to deliver accurate data.
Ryzen 5 B350 System (Ryzen 5 1600X, 1500X):
- 1600X CPU: AMD Ryzen 5 1600X ‘Summit Ridge' 6 cores, 12 threads (3.6-4.0GHz stock w/ 4.1GHz XFR & 4.0GHz @ 1.4V overclocked).
- 1500X CPU: AMD Ryzen 5 1500X ‘Summit Ridge' 4 cores, 8 threads (3.5-3.7GHz stock w/ 3.9GHz XFR & 3.9GHz @ 1.4V overclocked).
- Motherboard: ASRock Fatal1ty AB350 Gaming K4 (AM4, B350).
- Memory: 16GB (2x8GB) G.Skill Trident Z 3200MHz 14-14-14-34 DDR4 @ 1.35V.
- System Drive: Crucial MX300 525GB.
Ryzen 7 X370 System (Ryzen 7 1800X, 1700X, 1700):
- 1800X CPU: AMD Ryzen 7 1800X ‘Summit Ridge' 8 cores, 16 threads (3.6-4.0GHz stock w/ 4.1GHz XFR & 4.1GHz @ 1.43125V overclocked).
- 1700X CPU: AMD Ryzen 7 1700X ‘Summit Ridge' 8 cores, 16 threads (3.4-3.8GHz stock w/ 3.9GHz XFR & 4.0GHz @ 1.41875V overclocked).
- 1700 CPU: AMD Ryzen 7 1700 ‘Summit Ridge' 8 cores, 16 threads (3.0-3.7GHz stock w/ 3.75GHz XFR & 4.0GHz @ 1.41875V overclocked).
- Motherboard: ASUS Crosshair VI Hero (AM4, X370).
- Memory: 16GB (2x8GB) G.Skill Trident Z 3200MHz 14-14-14-34 DDR4 @ 1.35V.
- System Drive: Crucial MX300 525GB.
Kaby Lake & Skylake LGA 1151 System (7350K, 7400, 7600K, 7700K, 6600K, 6700K):
- 7350K CPU: Intel Core i3-7350K ‘Kaby Lake' (Retail) 2 cores, 4 threads (4.2GHz stock MCT & 4.8GHz @ 1.35V overclocked).
- 7400 CPU: Intel Core i5-7400 ‘Kaby Lake' (Retail) 4 cores, 4 threads (3.0-3.5GHz stock).
- 7600K CPU: Intel Core i5-7600K ‘Kaby Lake' (Retail) 4 cores, 4 threads (4.2GHz stock MCT & 4.9GHz @ 1.35V overclocked).
- 7700K CPU: Intel Core i7-7700K ‘Kaby Lake (Retail) 4 cores, 8 threads (4.5GHz stock MCT & 4.8GHz @ 1.35V overclocked).
- 6600K CPU: Intel Core i5-6600K ‘Skylake' (Retail) 4 cores, 4 threads (3.9GHz stock MCT & 4.5GHz @ 1.35V overclocked).
- 6700K CPU: Intel Core i7-6700K ‘Skylake' (Retail) 4 cores, 8 threads (4.2GHz stock MCT & 4.7GHz @ 1.375V overclocked).
- Motherboard: MSI Z270 Gaming Pro Carbon & Gigabyte Aorus Z270X-Gaming 7 (LGA 1151, Z270).
- Memory: 16GB (2x8GB) G.Skill Trident Z 3200MHz 14-14-14-34 DDR4 @ 1.35V.
- System Drive: Samsung 840 500GB.
Broadwell-E LGA 2011-3 System (6800K):
- 6800K CPU: Intel Core i7 6800K ‘Broadwell-E' (Retail) 6 cores, 12 threads (3.6GHz stock MCT & 4.2GHz @ 1.275V overclocked).
- Motherboard: ASUS X99-Deluxe (LGA 2011-v3, X99).
- Memory: 32GB (4x8GB) G.Skill Trident Z 3200MHz 14-14-14-34 DDR4 @ 1.35V.
- System Drive: SanDisk Ultra Plus 256GB.
Devil's Canyon LGA 1150 System (4790K):
- 4790K CPU: Intel Core i7 4790K ‘Devil's Canyon' (Engineering Sample) 4 cores, 8 threads (4.4GHz stock MCT & 4.7GHz @ 1.30V overclocked).
- Motherboard: ASRock Z97 OC Formula (LGA 1150, Z97).
- Memory: 16GB (2x8GB) G.Skill Trident X 2400MHz 10-12-12-31 DDR3 @ 1.65V.
- System Drive: Kingston SM2280S3/120G 120GB.
Sandy Bridge & Ivy Bridge LGA 1155 System (2700K, 3570K):
- 2700K CPU: Intel Core i7 2700K ‘Sandy Bridge‘ (Retail) 4 cores, 8 threads (3.9GHz stock MCT & 4.6GHz @ 1.325V overclocked).
- 3570K CPU: Intel Core i5 3570K ‘Ivy Bridge' (Retail) 4 cores, 4 threads (3.8GHz stock MCT & 4.6GHz @ 1.30V overclocked).
- Motherboard: ASUS P8Z77-V (LGA 1155, Z77).
- Memory: 16GB (2x8GB) G.Skill Trident X 2400MHz 10-12-12-31 DDR3 @ 1.65V (@2133MHz for 2700K due to CPU IMC limitation).
- System Drive: Kingston HyperX 3K 120GB.
Vishera AM3+ System (FX-8370):
- FX-8370 CPU: AMD FX-8370 ‘Vishera' (Retail) 8 cores, 8 threads (4.0-4.3GHz stock & 4.62GHz @ 1.45V CPU, 2.6GHz @ 1.30V NB overclocked).
- Motherboard: Gigabyte 990FX-Gaming (AM3+, SB950).
- Memory: 16GB (2x8GB) G.Skill Trident X 2133MHz 12-12-12-31 DDR3 @ 1.65V.
- System Drive: Patriot Wildfire 240GB.
Software:
- ASRock Fatal1ty AB350 Gaming K4 BIOS 2.20 (latest for Ryzen 5 testing).
- GeForce 378.49 VGA drivers.
Tests:
Productivity-related:
- Cinebench R15 – All-core & single-core CPU benchmark (CPU)
- HandBrake 0.10.5 – Convert 6.27GB 4K video recording using the Normal Profile setting and MP4 container (CPU)
- Mozilla Kraken – Browser-based JavaScript benchmark (CPU)
- x265 Benchmark – 1080p H.265/HEVC encoding benchmark (CPU)
- WPrime – 1024M test, thread count set to the CPU's maximum number (CPU)
- SiSoft Sandra 2016 SP1 – Processor arithmetic, cryptography, and memory bandwidth (CPU & Memory)
- 7-Zip 16.04 – Built-in 7-Zip benchmark test (CPU & Memory)
Gaming-related:
- 3DMark Fire Strike v1.1 – Fire Strike (1080p) test (Gaming)
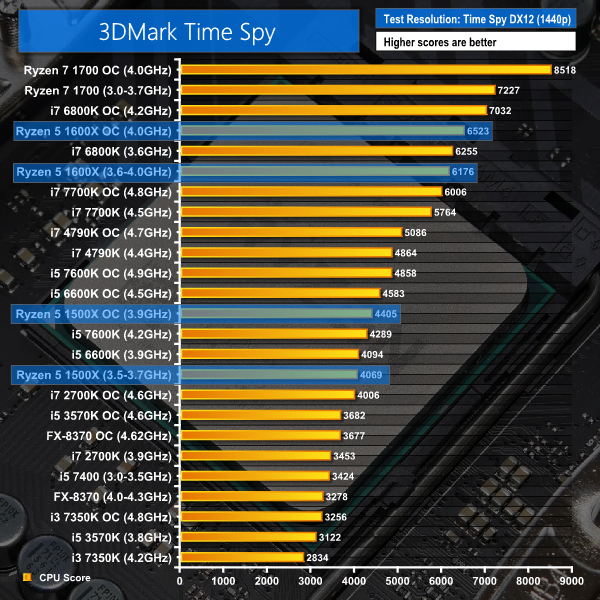
- 3DMark Time Spy – Time Spy (DX12) test (Gaming)
- VRMark – Orange room (2264×1348) test (Gaming)
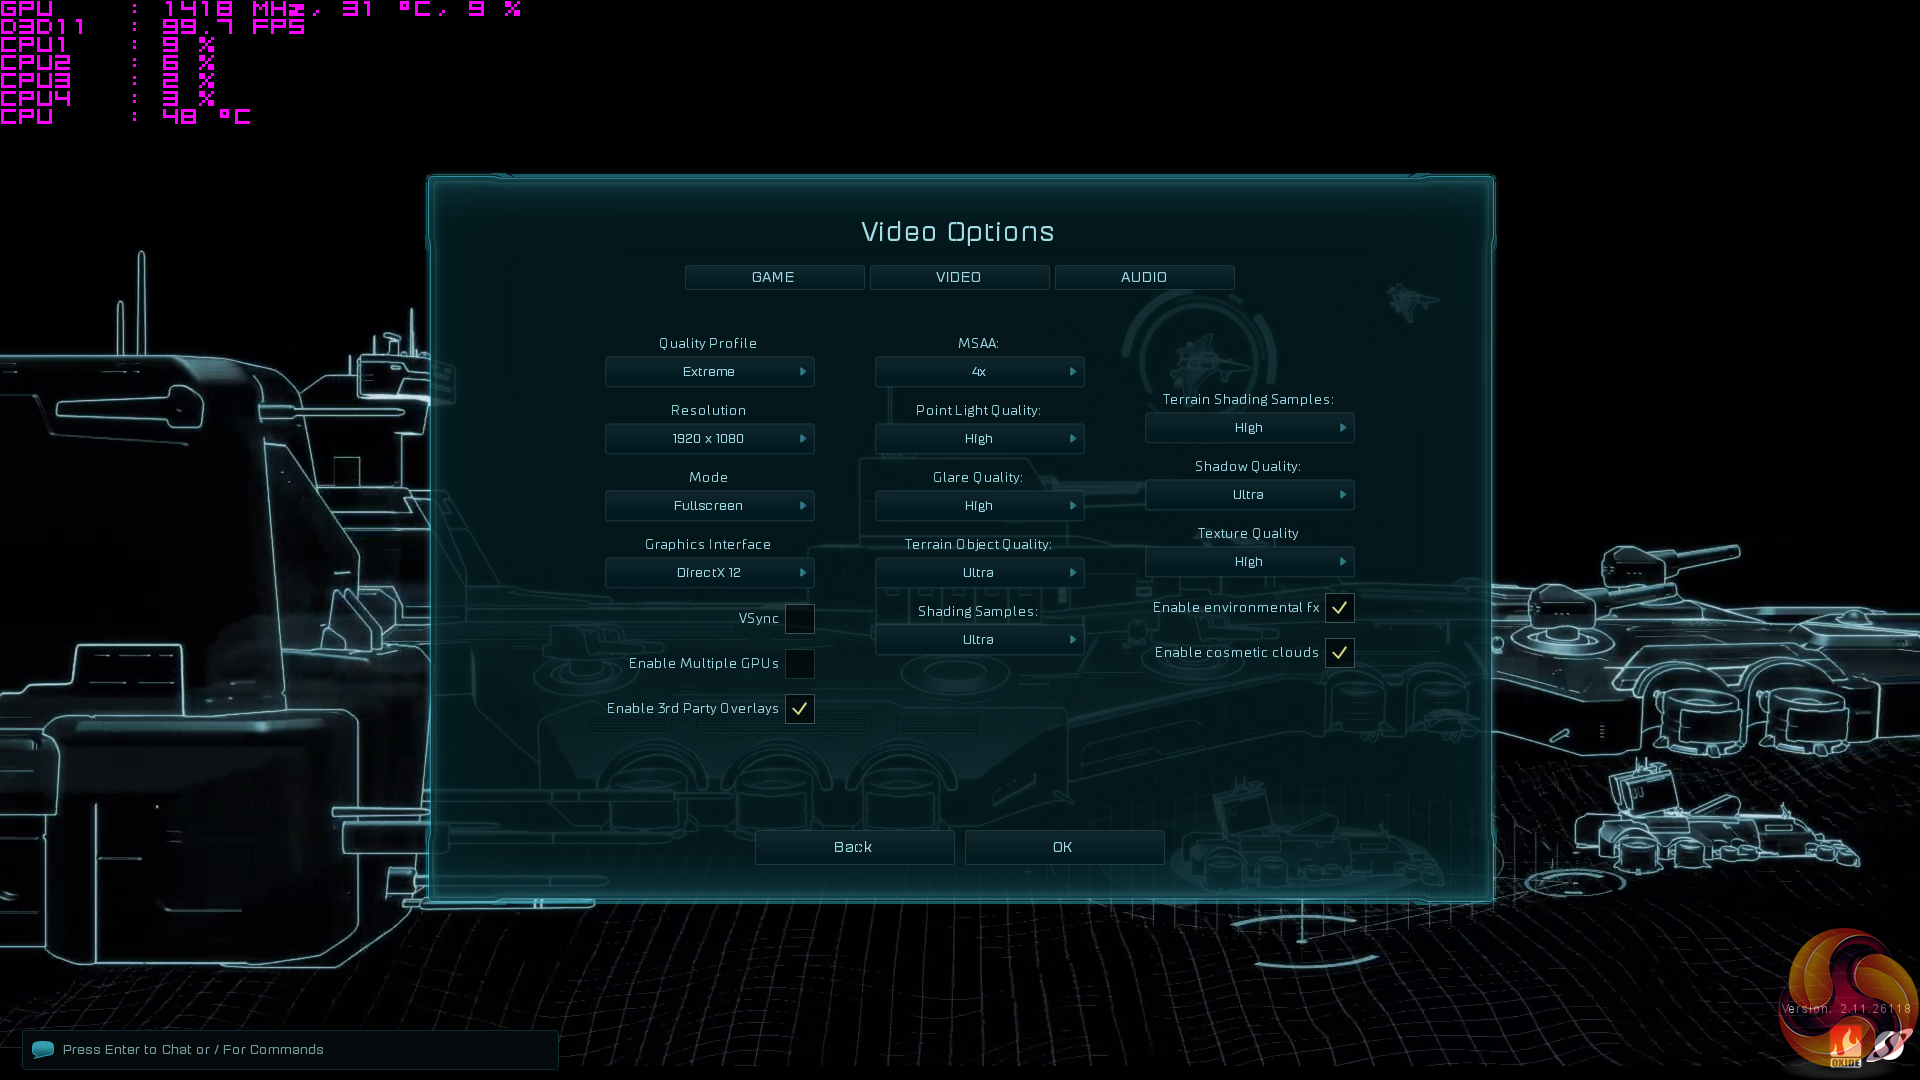
- Ashes of the Singularity Escalation – Built-in benchmark tool CPU-Focused test, 1920 x 1080, Extreme quality preset, DX12 version (Gaming)
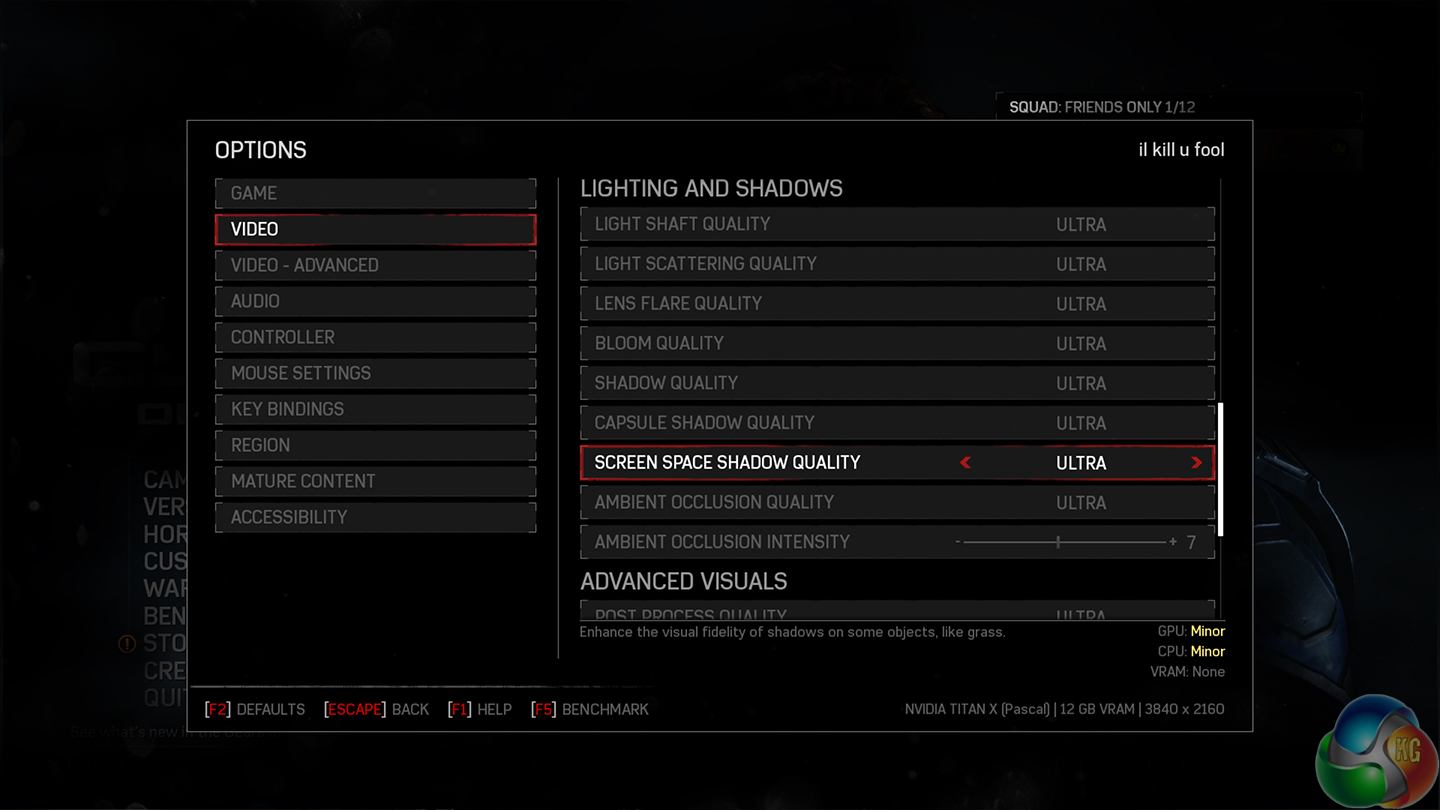
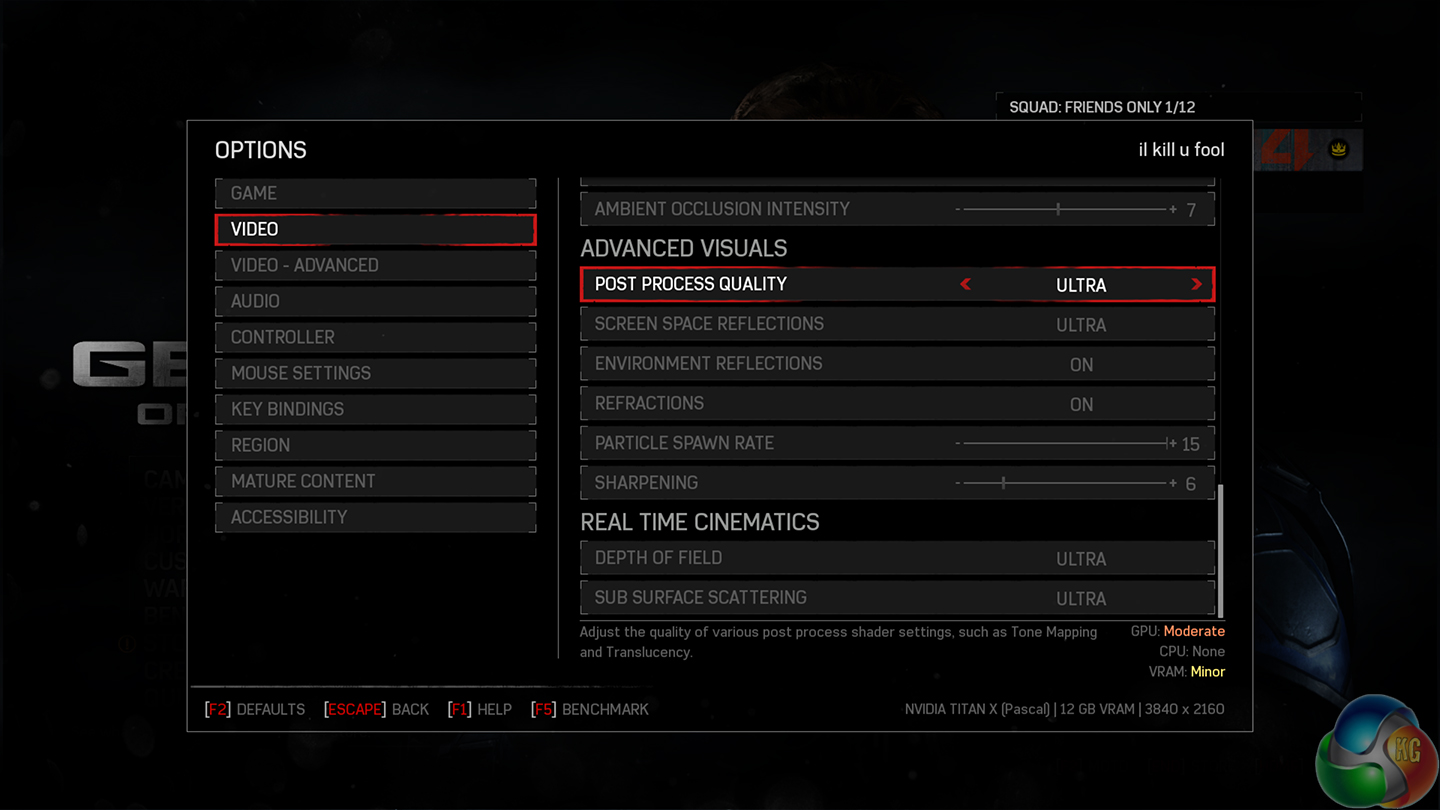
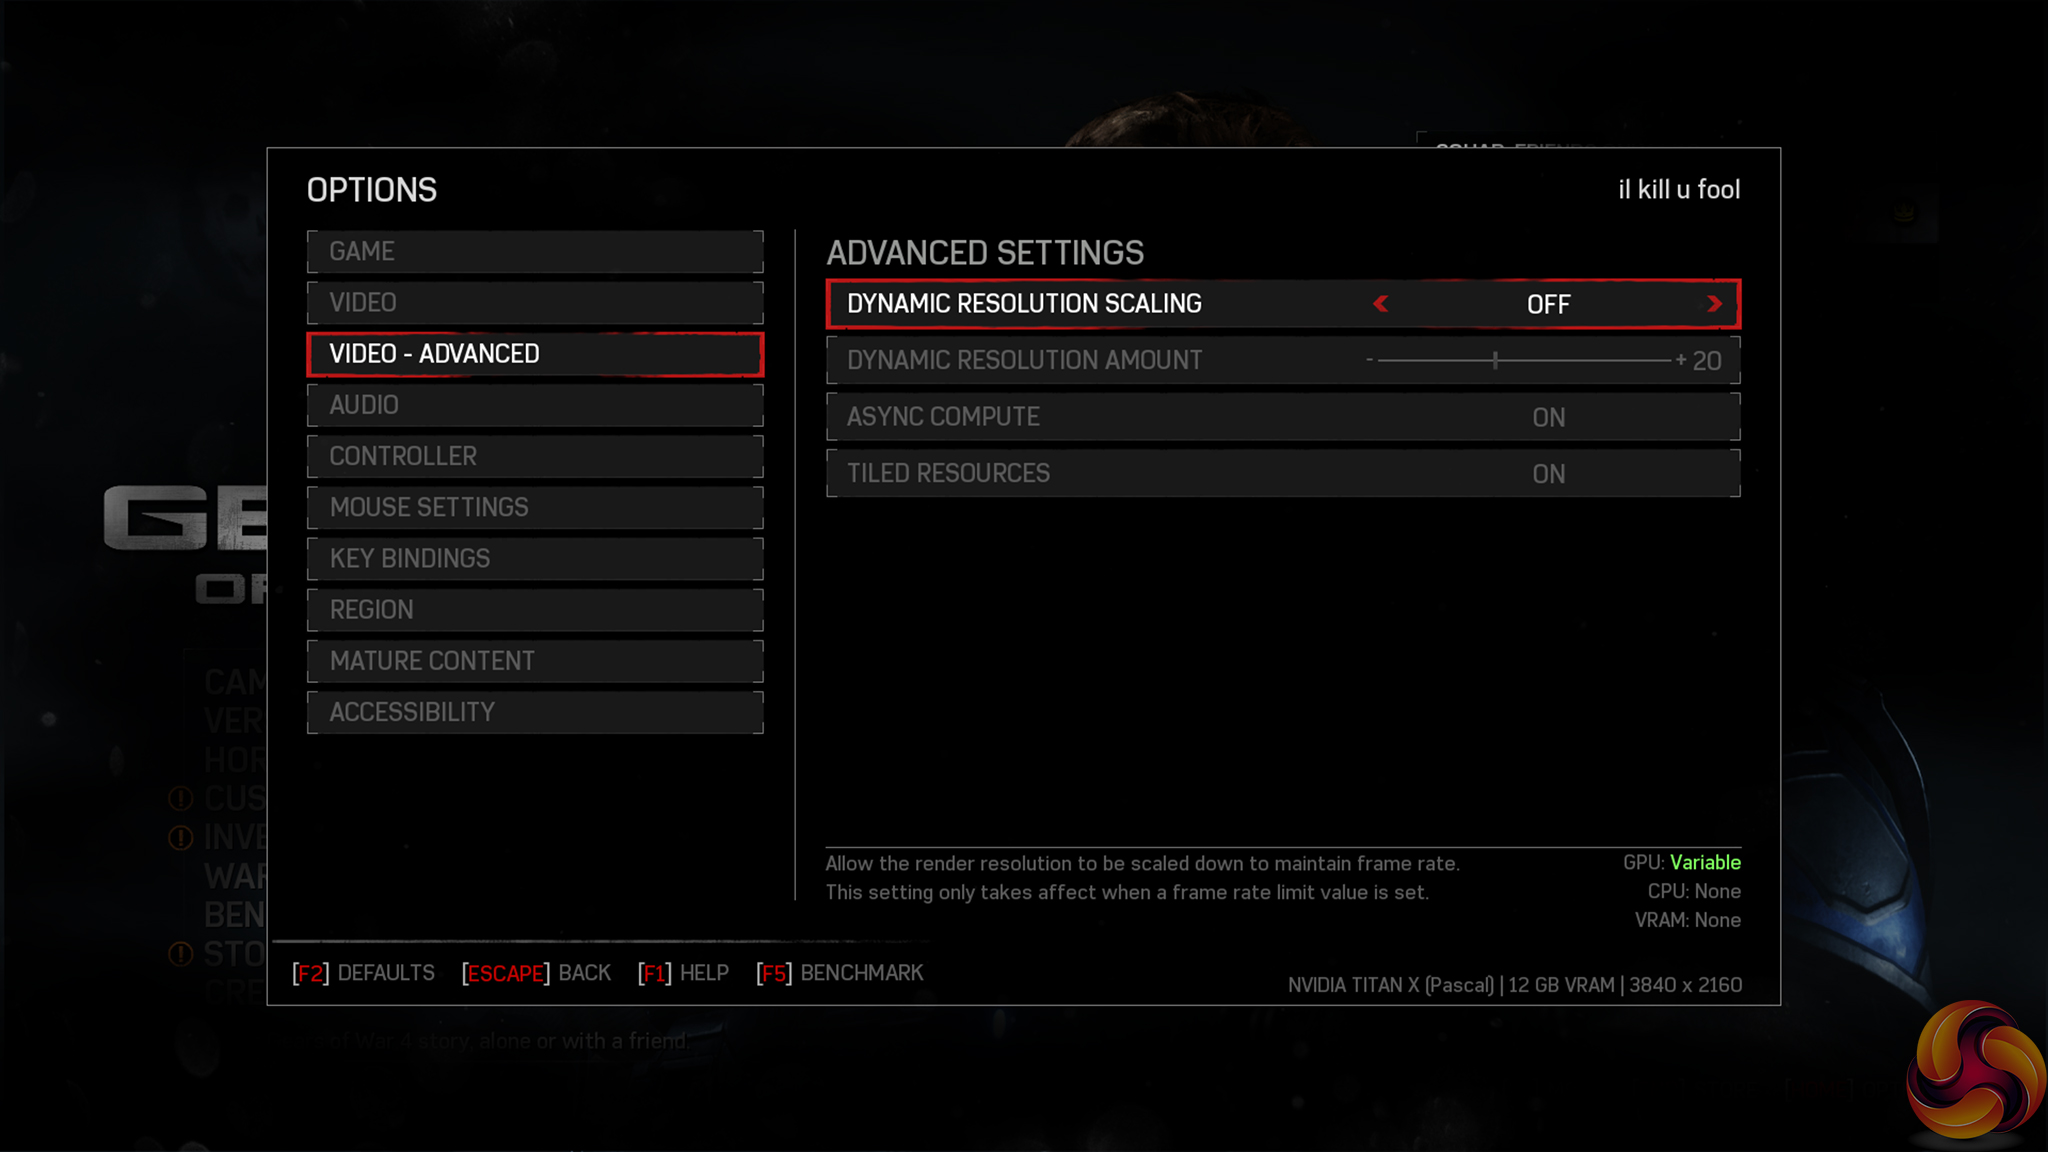
- Gears of War 4 – Built-in benchmark tool, 1920 x 1080, Ultra quality preset, Async Compute Enabled, DX12 (Gaming)
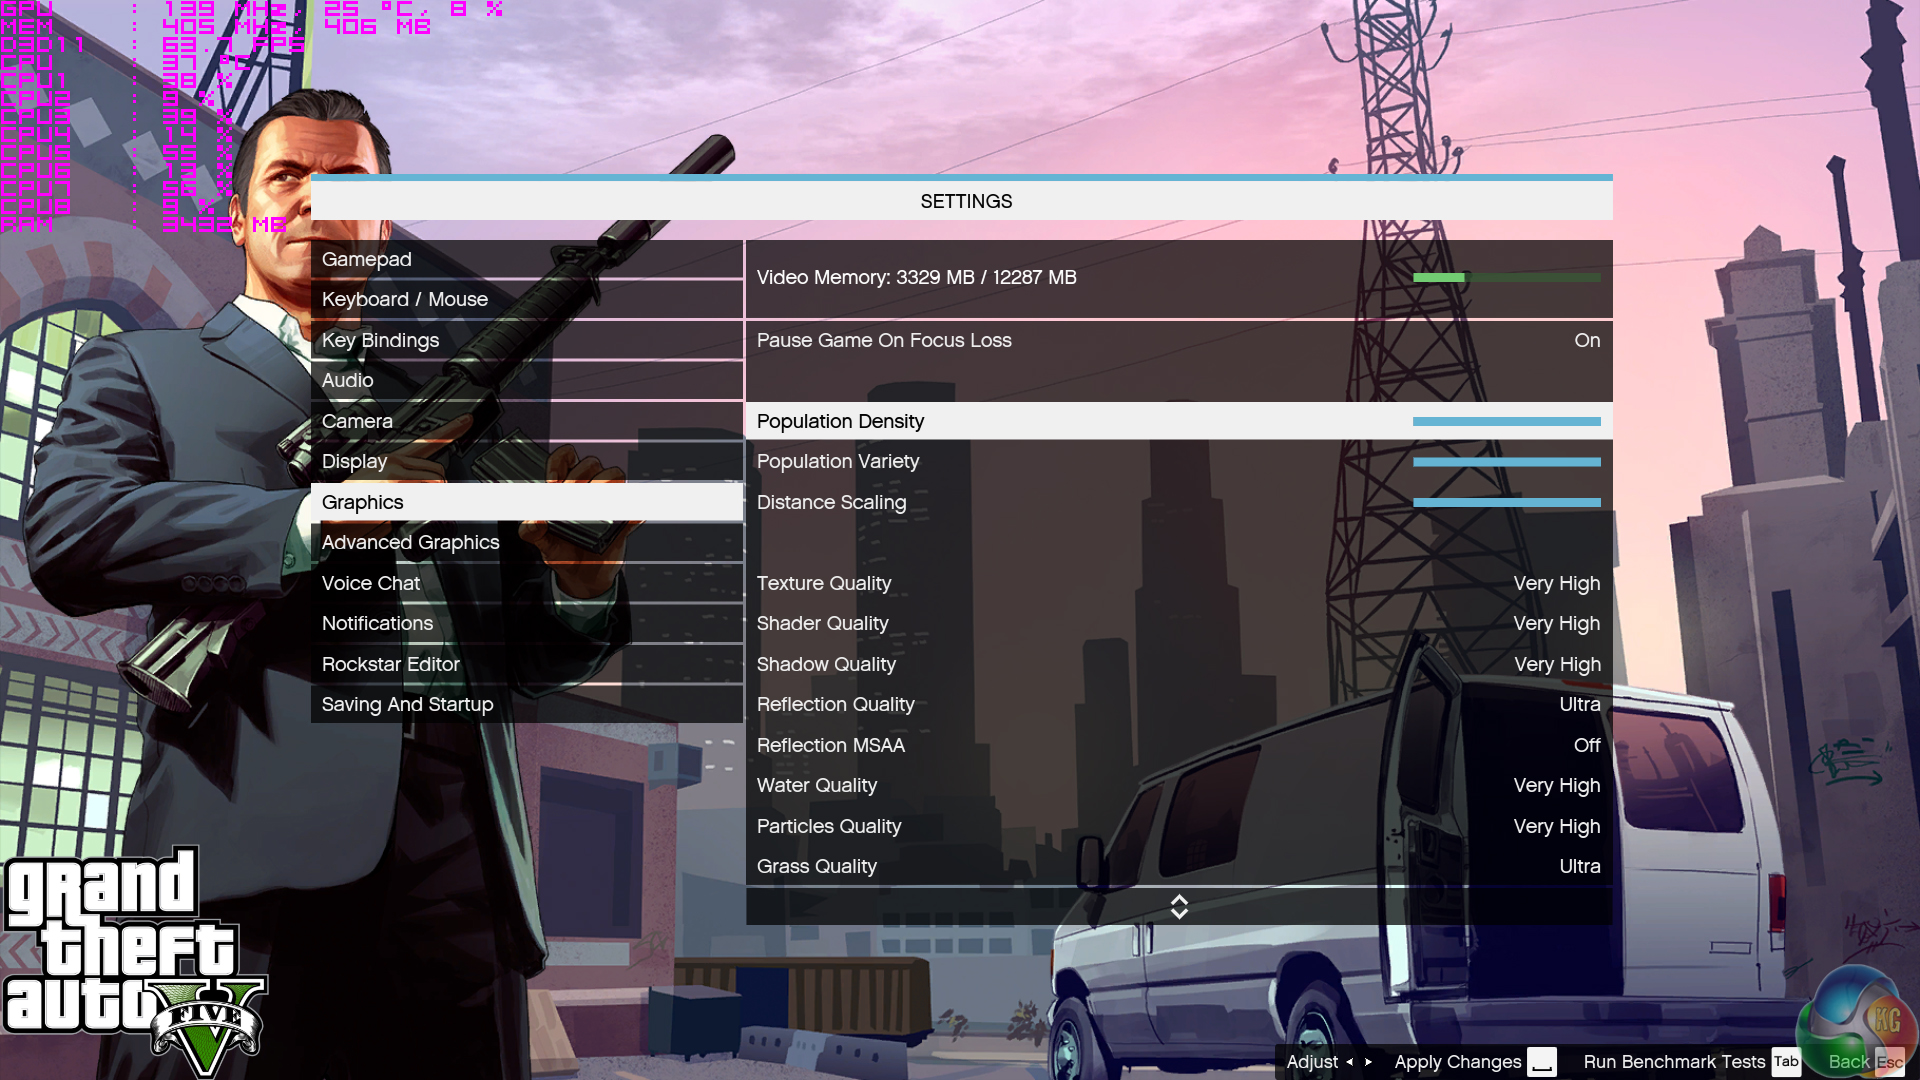
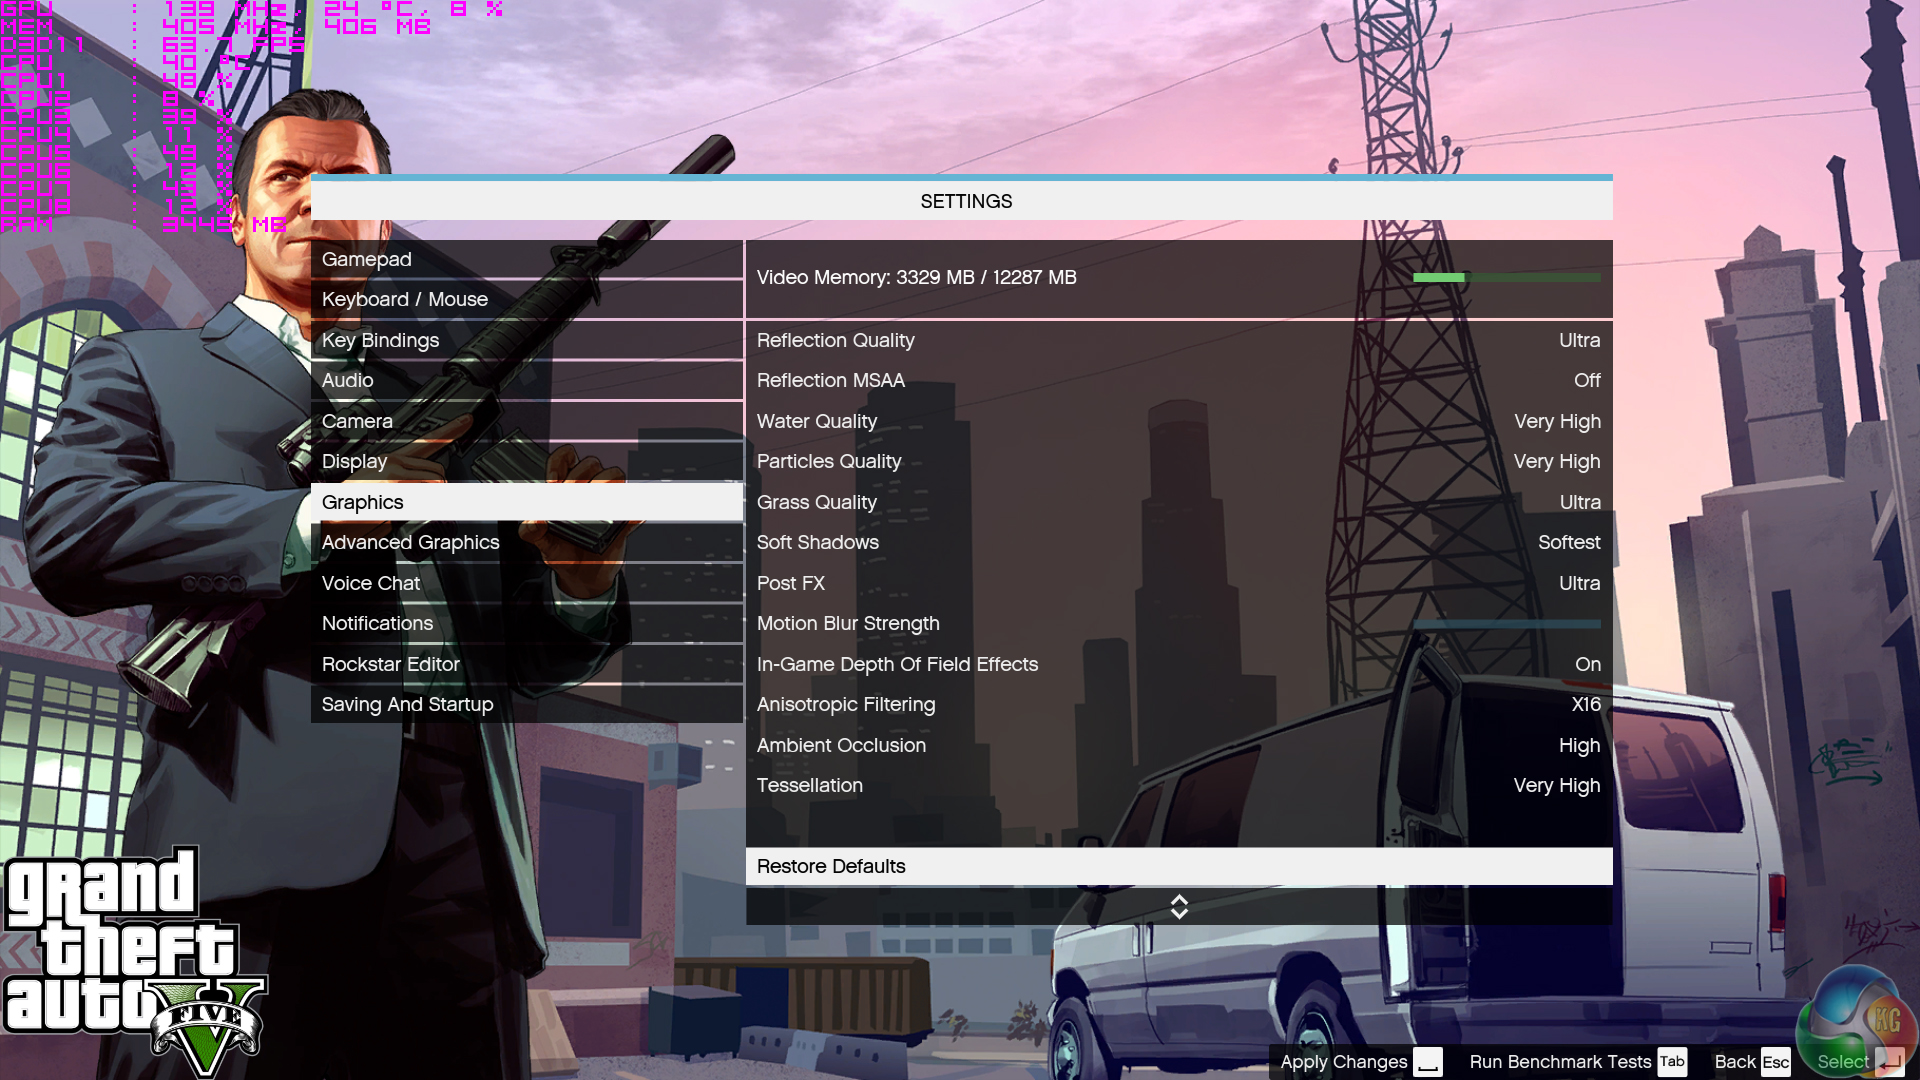
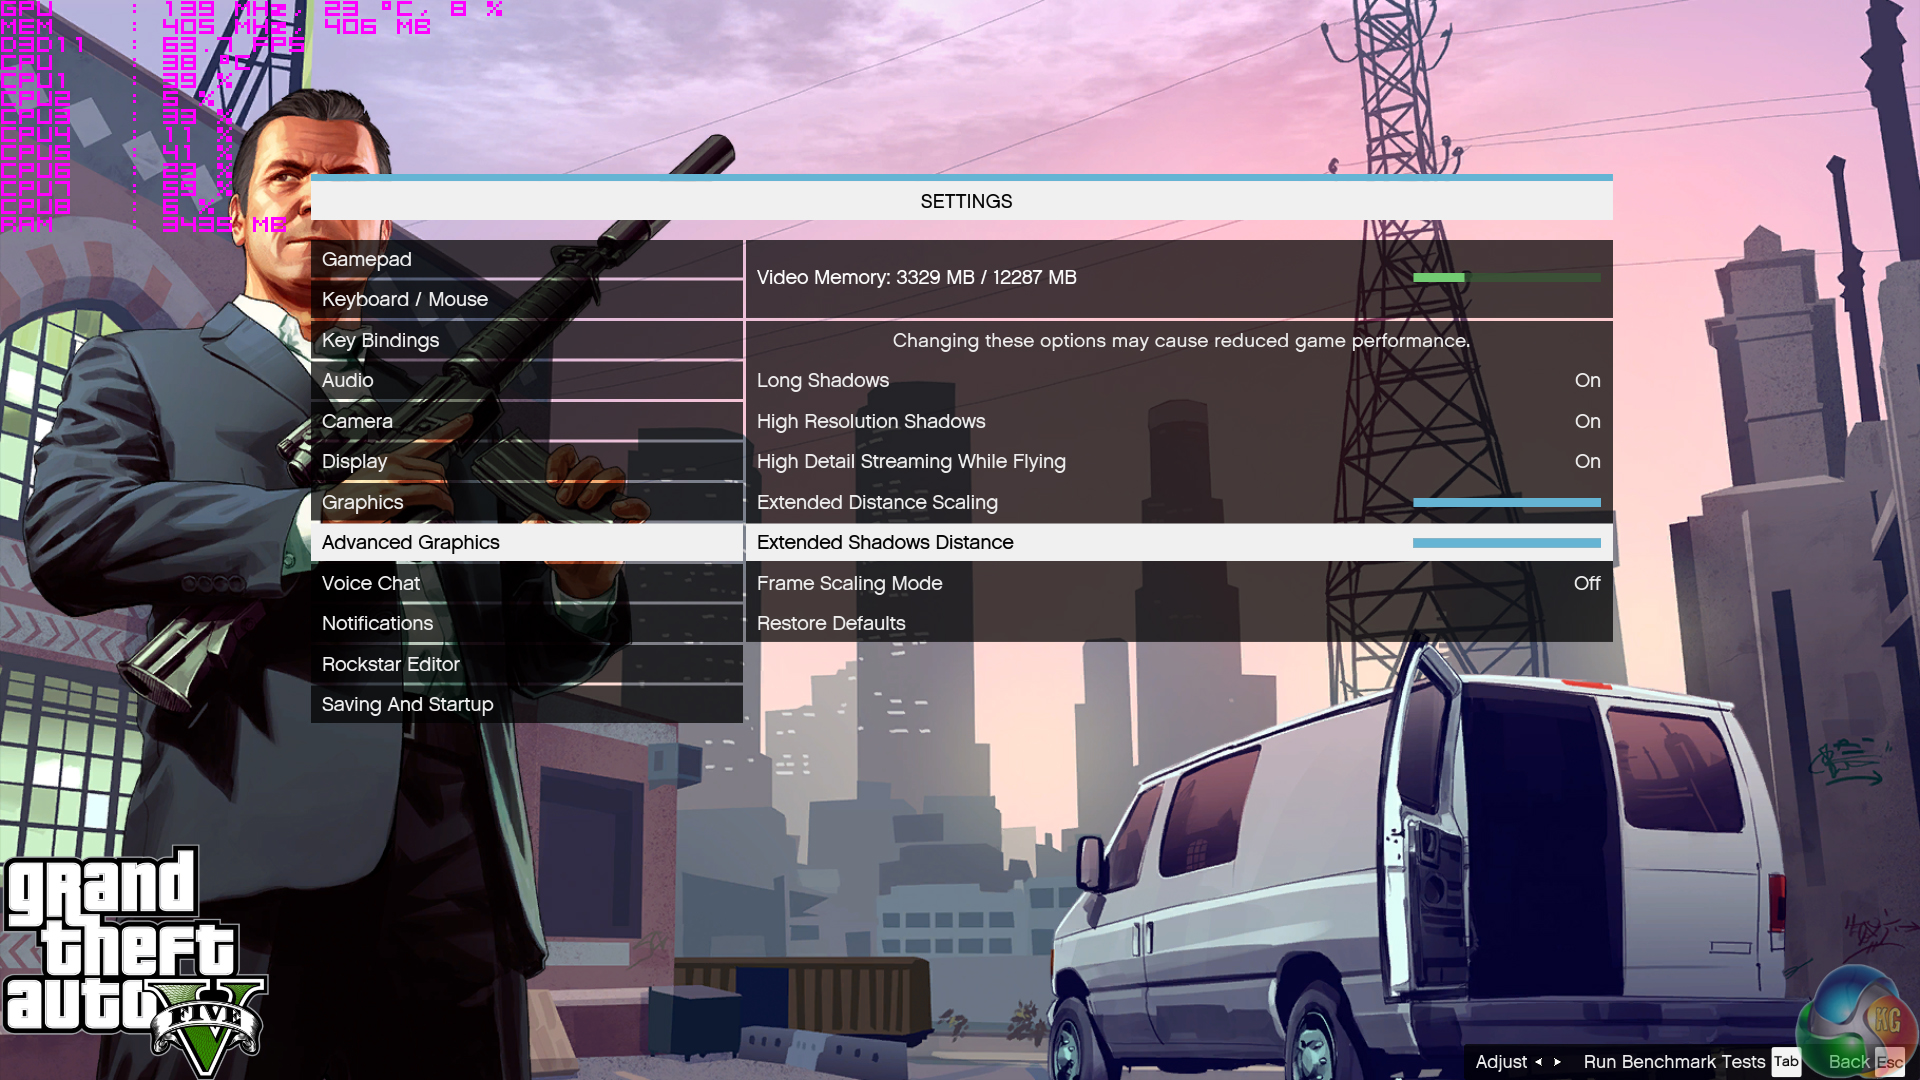
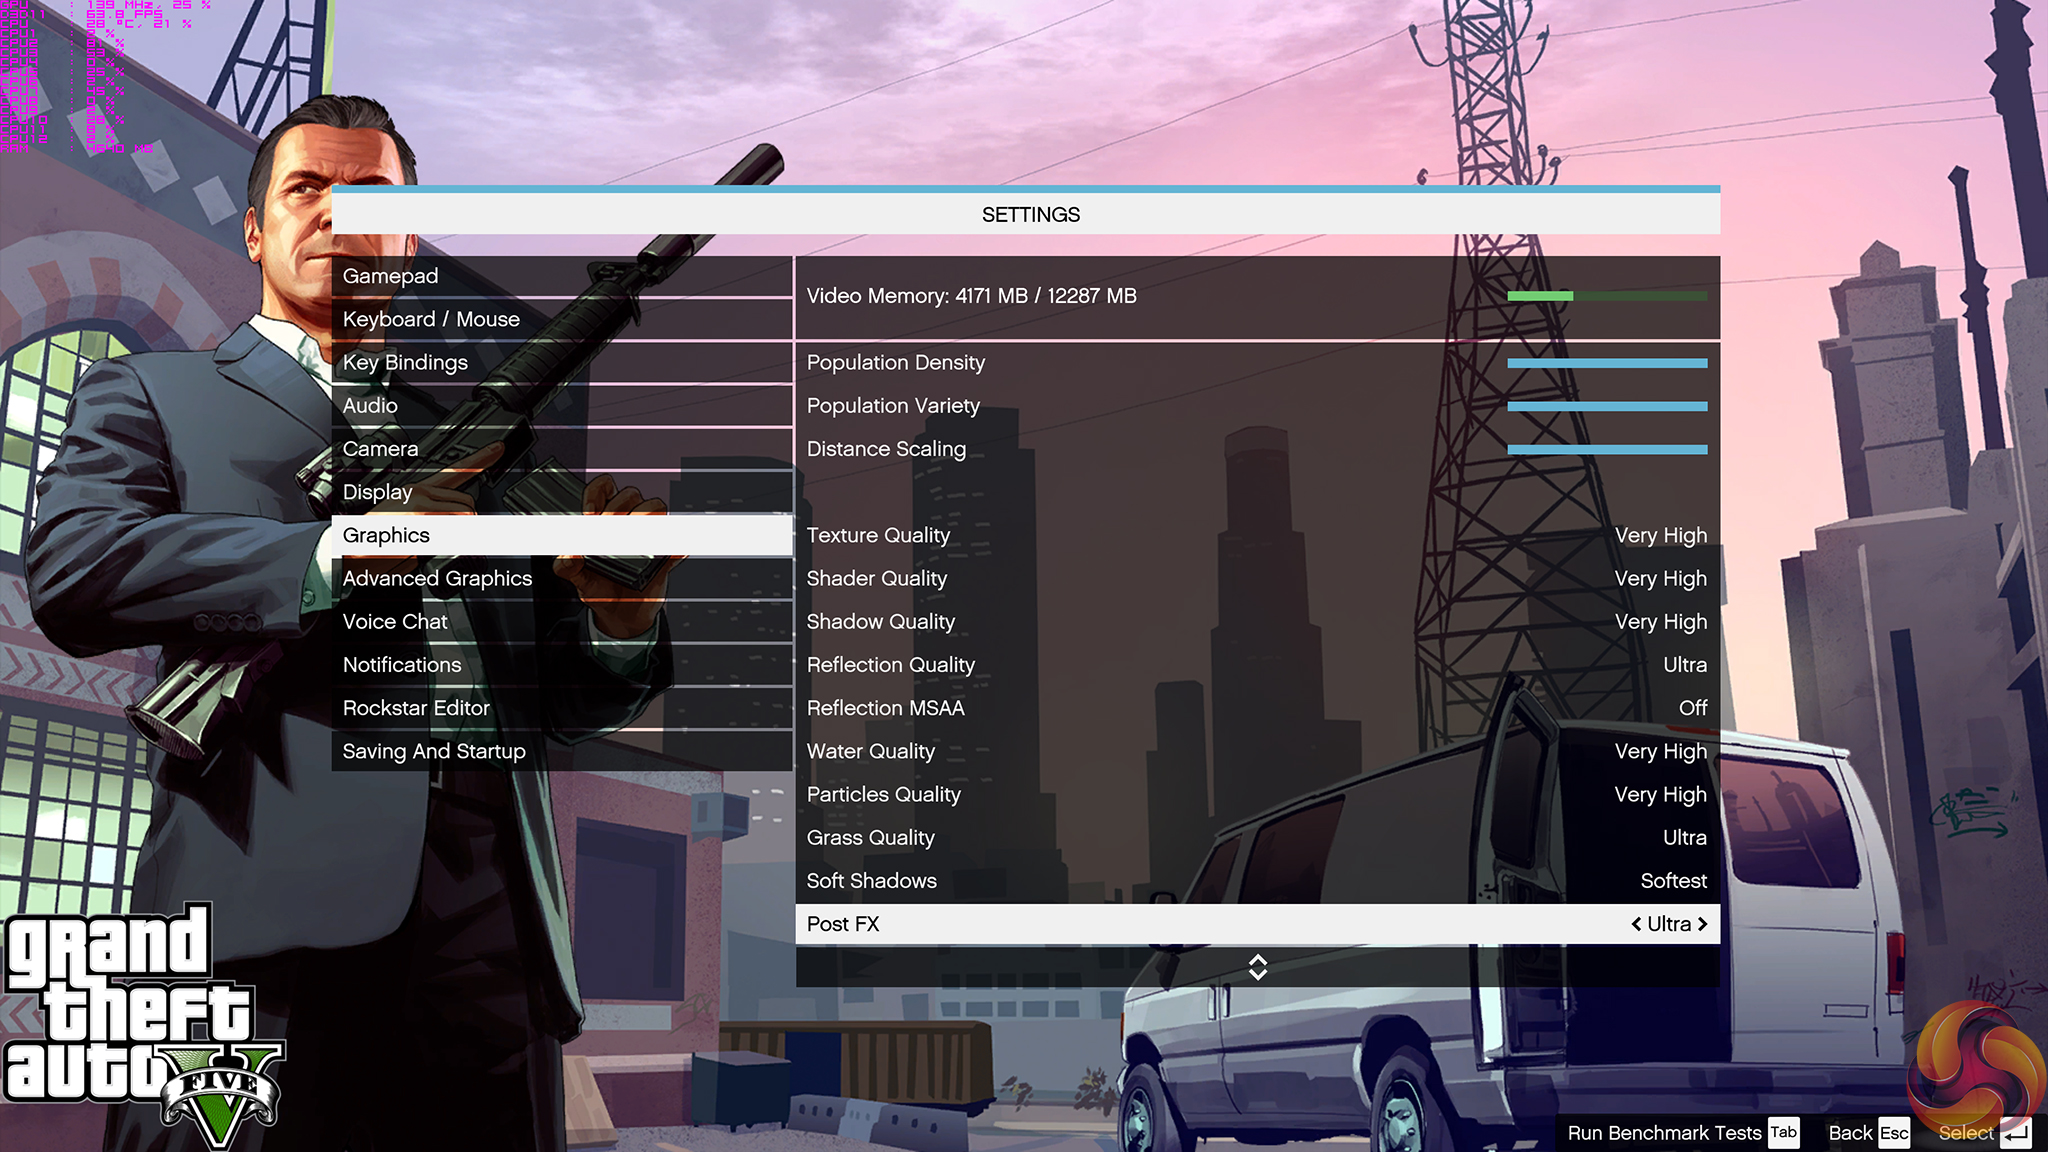
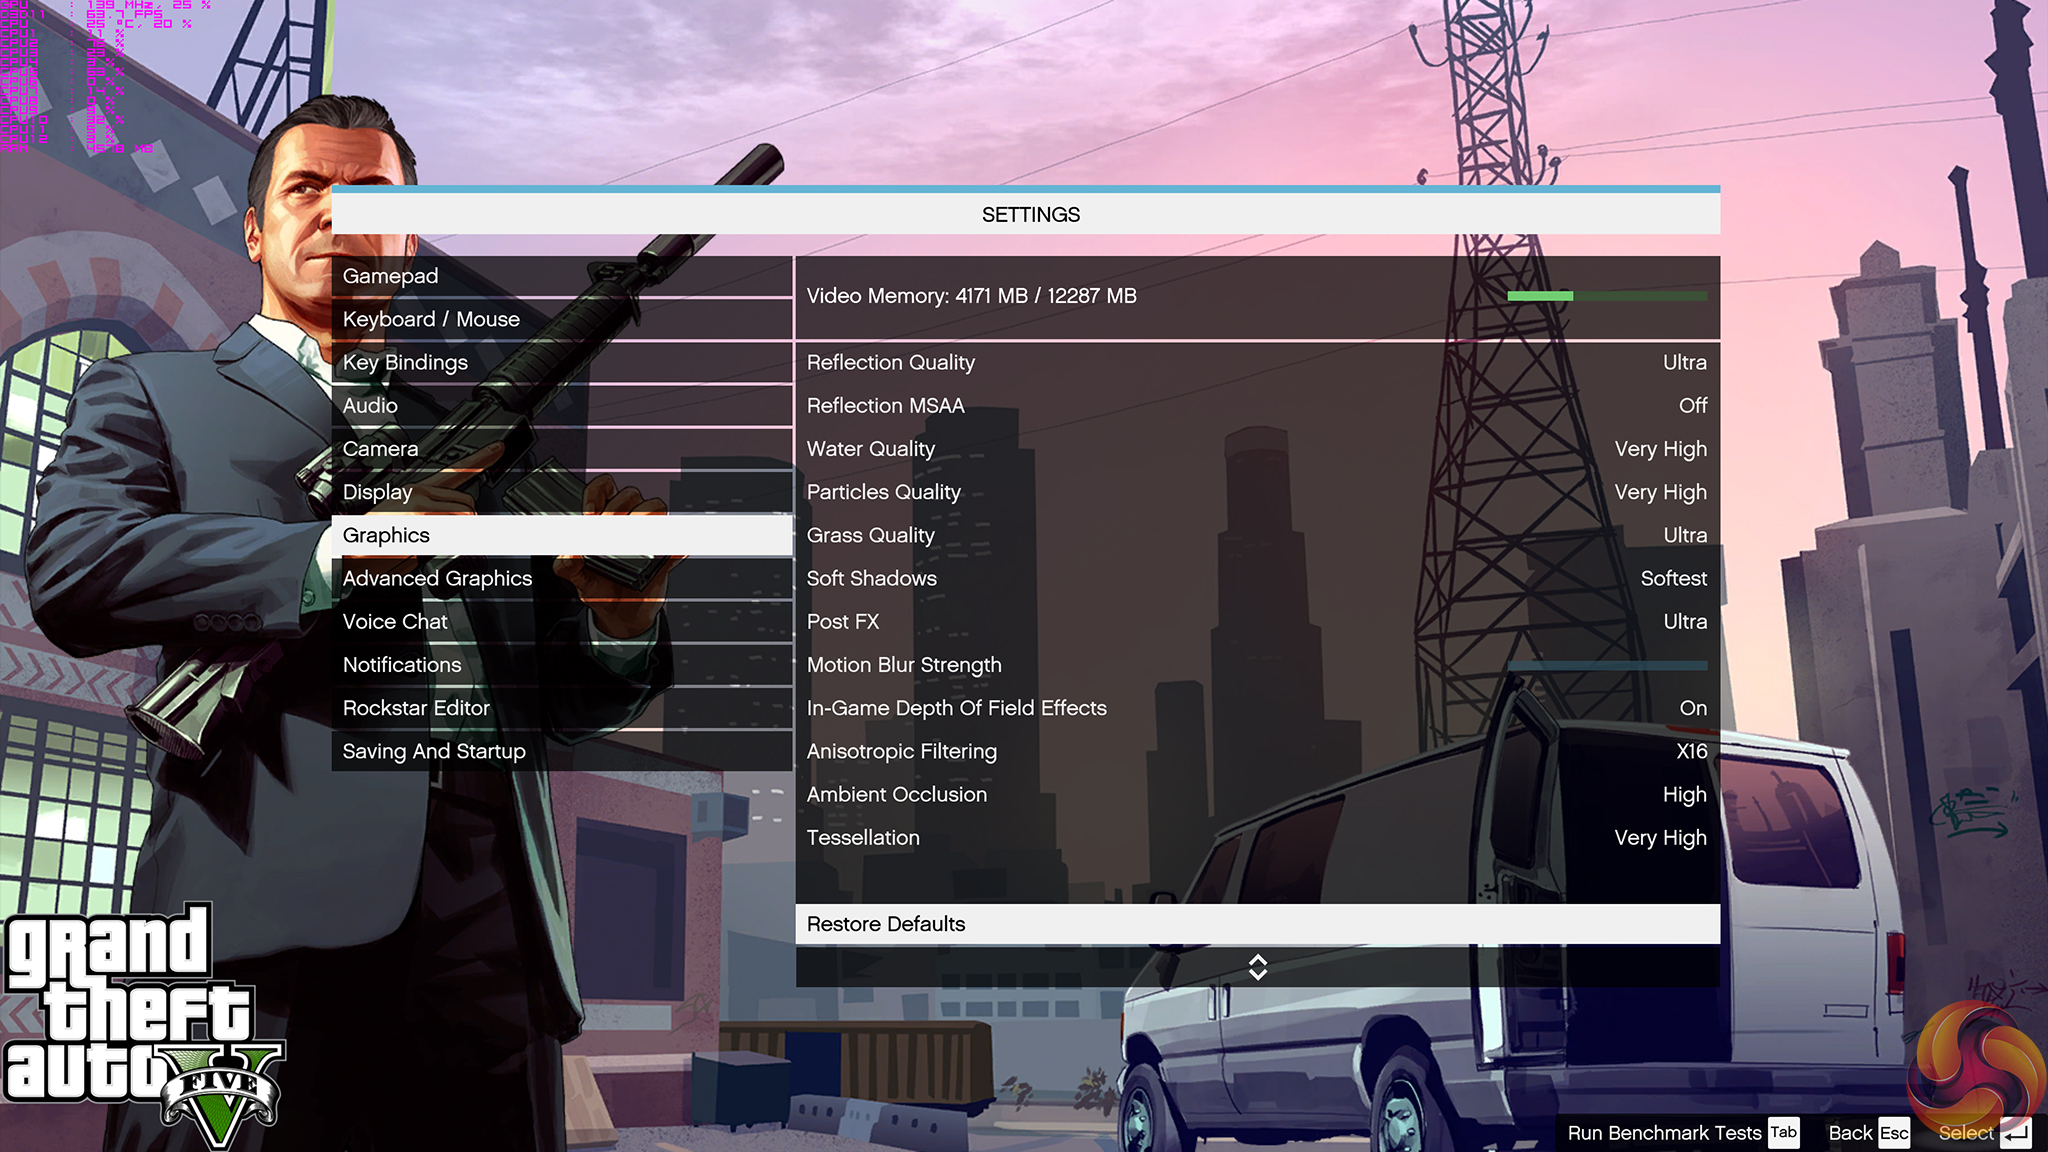
- Grand Theft Auto V – Built-in benchmark tool, 1920 x 1080, Maximum quality settings, Maximum Advanced Graphics, DX11 (Gaming)
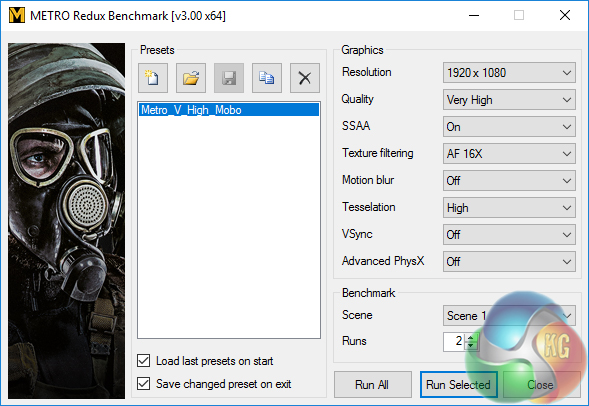
- Metro: Last Light Redux – Built-in benchmark tool, 1920 x 1080, Very High quality settings, SSAA Enabled, AF 16X, High Tessellation, DX11 (Gaming)
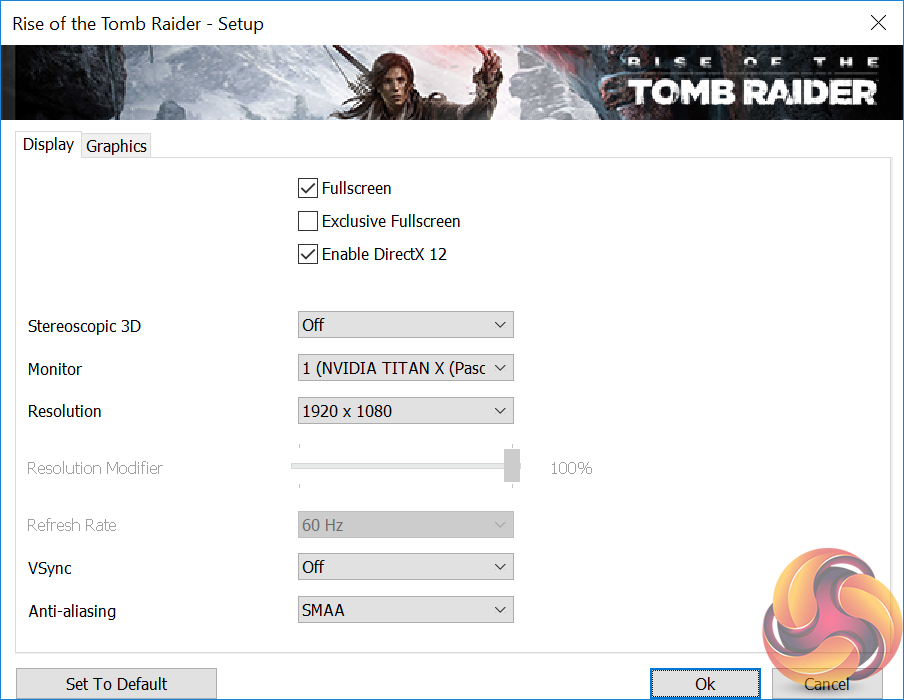
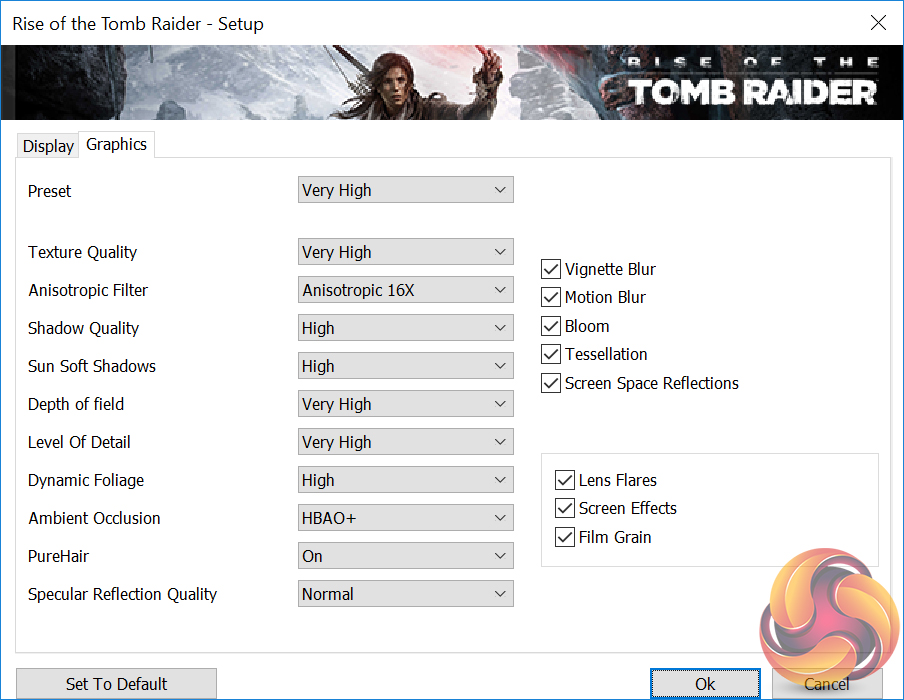
- Rise of the Tomb Raider – Built-in benchmark tool, 1920 x 1080, Very High quality preset, SMAA enabled, DX12 version (Gaming)
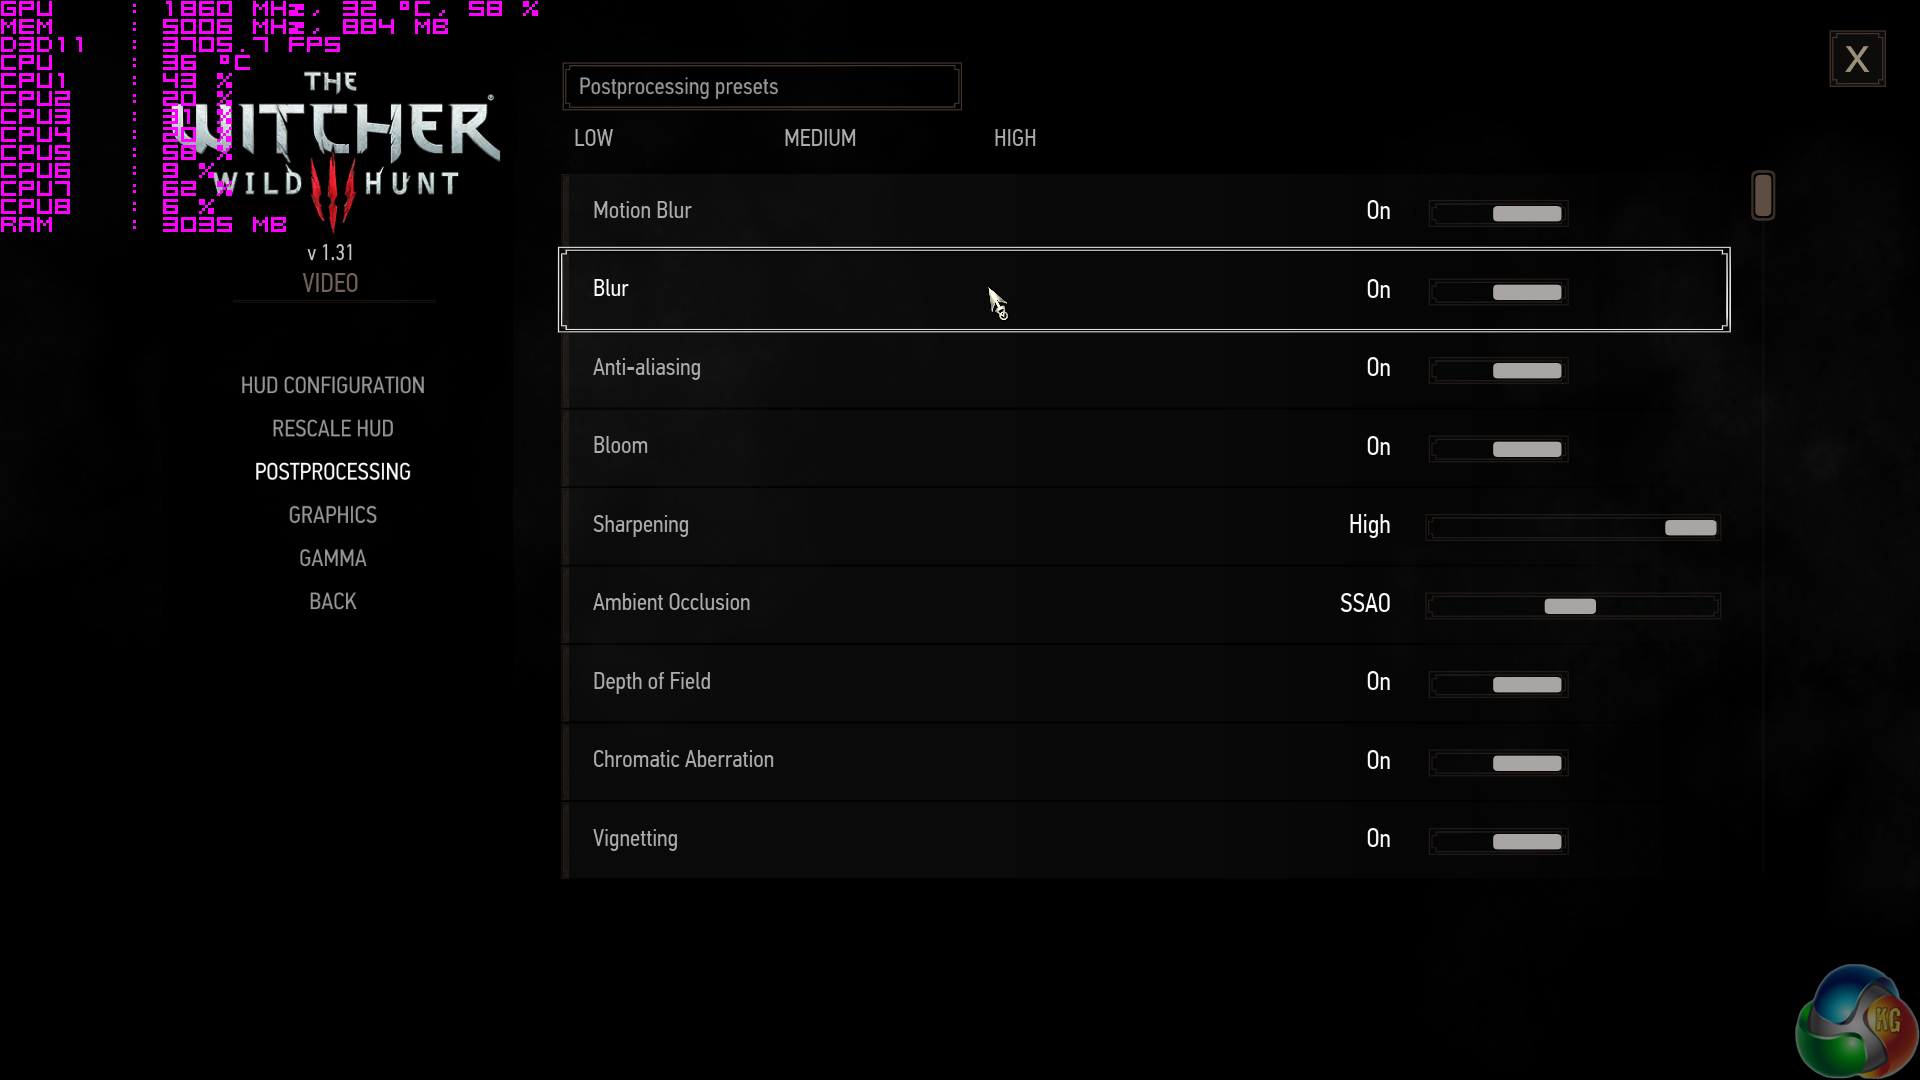
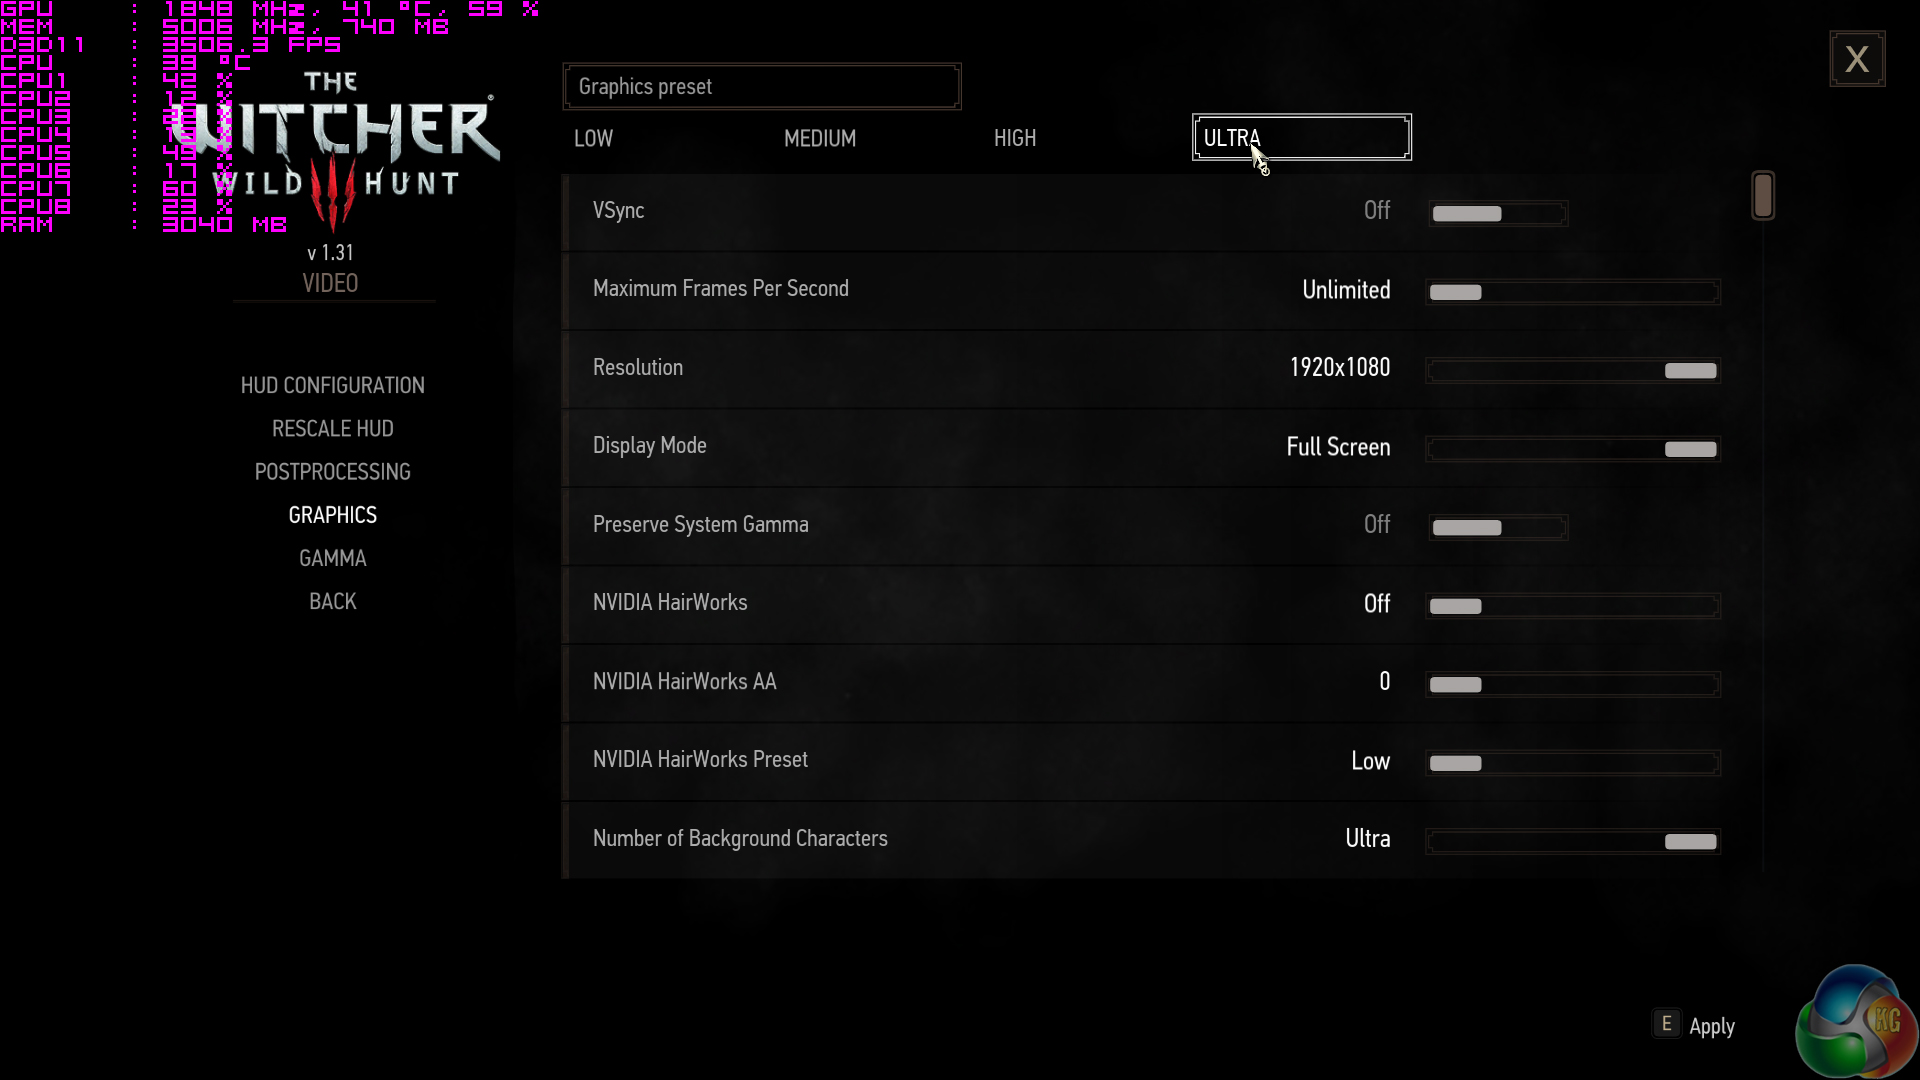
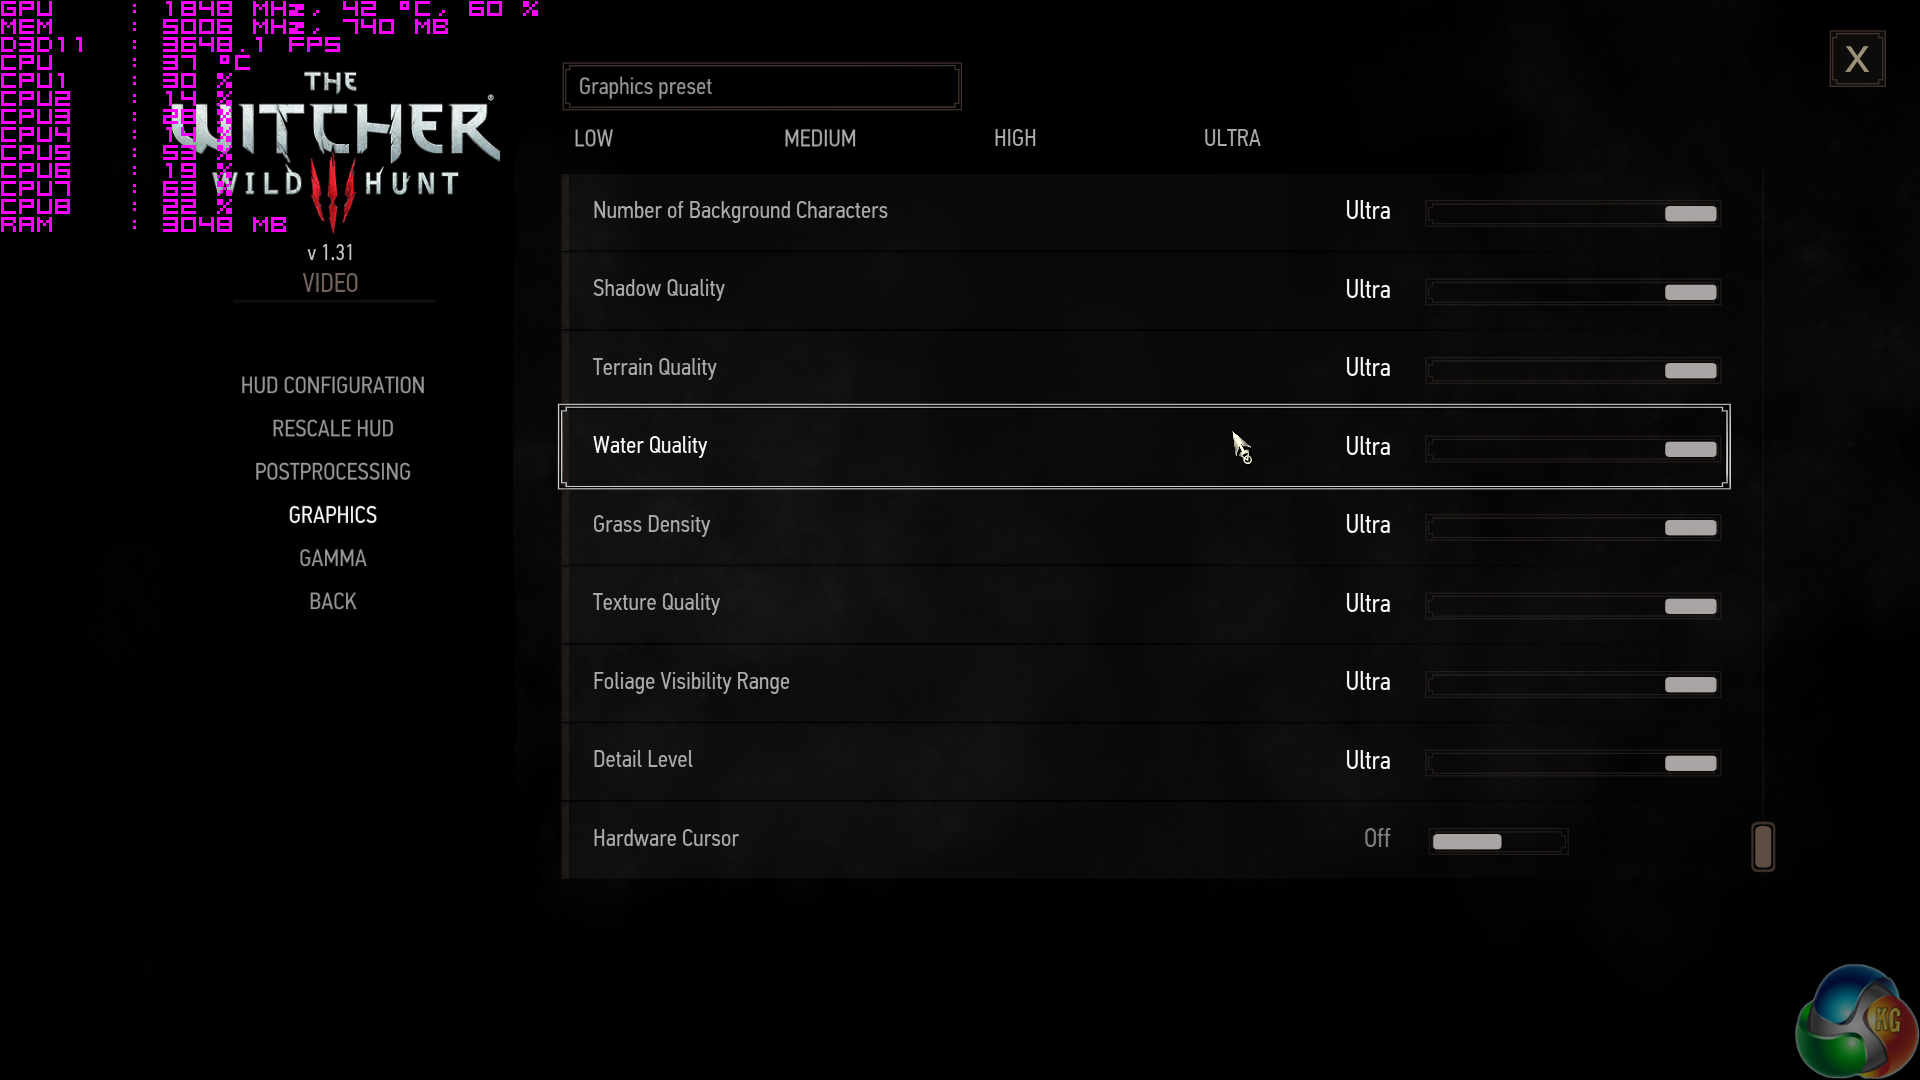
- The Witcher 3: Wild Hunt – Custom benchmark run in a heavily populated town area, 1920 x 1080, Maximum quality settings, Nvidia features disabled, DX11 (Gaming)
- Total War Warhammer – Built-in benchmark tool, 1920 x 1080, Ultra quality preset, DX12 version (Gaming)
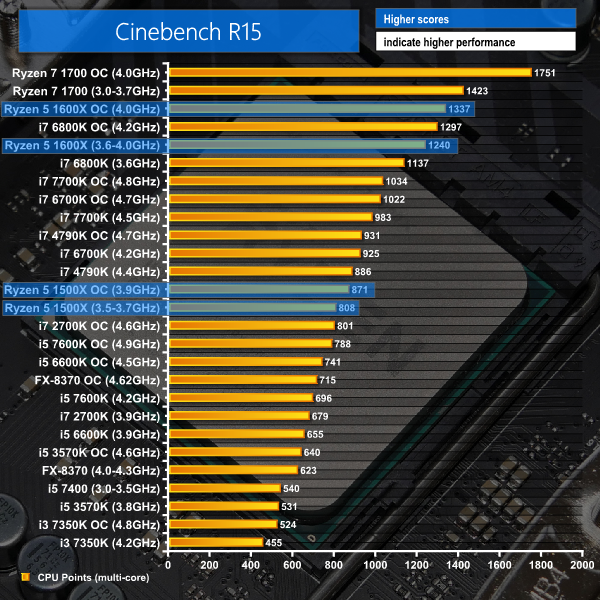
Cinebench
Cinebench is an application which renders a photorealistic 3D scene to benchmark a computer’s rendering performance, on one CPU core, all CPU cores or using the GPU. We run the test using the all-core CPU and single-thread CPU modes.
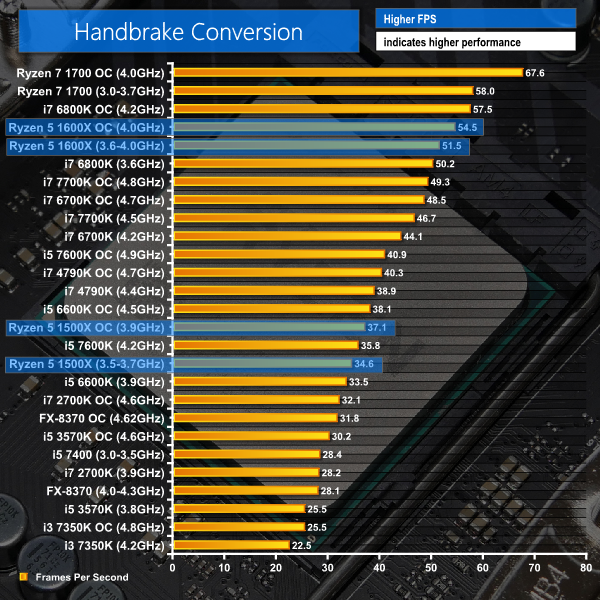
Handbrake Conversion
Handbrake is a free and open-source video transcoding tool that can be used to convert video files between different codecs, formats and resolutions. We measured the average frame rate achieved for a task of converting a 6.27GB 4K video using the Normal Profile setting and MP4 container. The test stresses all CPU cores to 100% and shows an affinity for memory bandwidth.
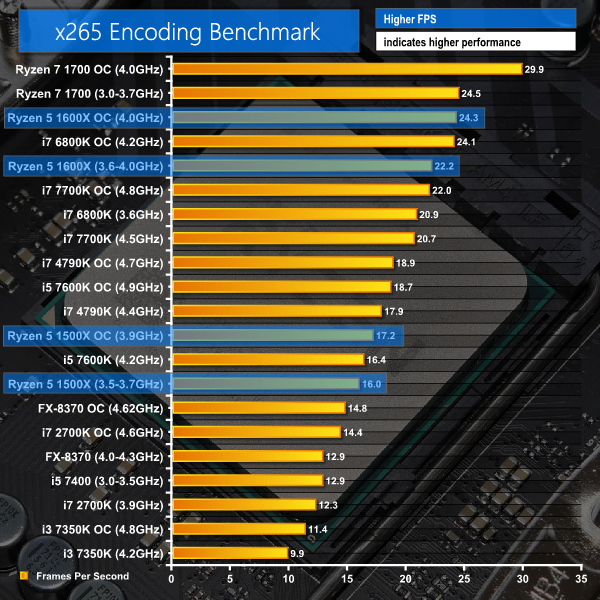
x265 Encoding
x265 Encoding tests system performance by encoding a 1080p test file using the x265/HEVC format.
CPU-related testing overview:
Ryzen 5’s fastest quad-core chip makes a strong start in the Cinebench multi-threaded test. The 4C8T AMD part can hang with fan favourites of Core i7 days gone by – the Sandy Bridge 2700K and Devil’s Canyon 4790K. Compared to the similarly-priced i5-7400, Ryzen 5 1500X is 50% faster out-of-the-box. An ability to overclock the Ryzen chip allows its lead to grow to 61%. Even the fast, multiplier-unlocked Core i5-7600K is outclassed by AMD’s 4C8T 1500X.
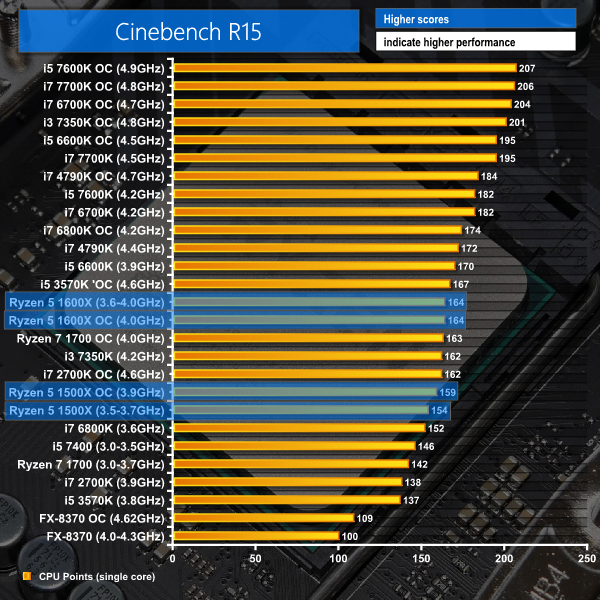
Single-threaded performance is where Intel’s well-tuned and fast Kaby Lake chips can guarantee victories. Or so one would have thought. The low clock speed of the i5-7400 sees it sitting in the bottom half of our performance hierarchy. Combine that with 200MHz of XFR headroom that boosts the 1500X to 3.9GHz on a single thread, and it is easy to see why AMD’s part takes the win this time. Compared to the multiplier-locked i5, Ryzen 5 1500X is 5% faster at stock and 9% faster when overclocked.
Handbrake is effective in leveraging the Ryzen 5 1500X processor’s eight threads. As such, the 4C4T Intel Core i5-7400 is handsomely outperformed to the tune of 21% at stock and 31% with AMD’s part overclocked. Ryzen 5 1500X is close to the performance levels of a Core i5-7600K, though Intel’s chip pulls ahead when its clock frequency is boosted to a lofty 4.9GHz.
Ryzen 5 1500X hands the Core i5-7400 another beating by way of the x265 encoding benchmark. AMD’s quad-core with SMT is 24% faster than the i5-7400 at stock. The 1500X’s lead grows to 33% when it is overclocked to 3.9GHz. Again, the 4C8T 1500X sits close to Core i5-7600K performance until that Kaby Lake chip turns on the afterburners and clocks to 4.9GHz.
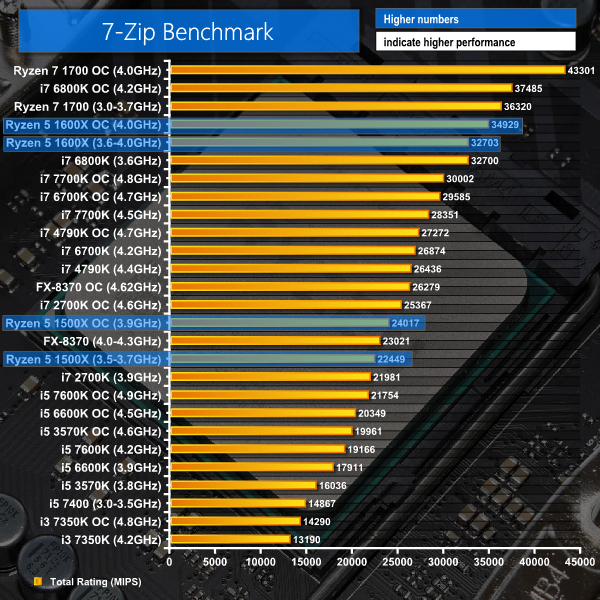
7-Zip
7-Zip is an open source Windows utility for manipulating archives. We measure the Total Rating performance using the built-in benchmark tool. The test stresses all CPU cores to 100% and shows an affinity for memory bandwidth.
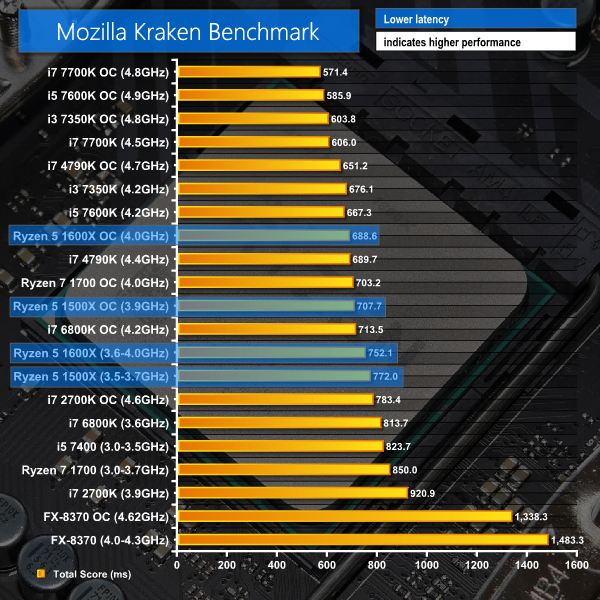
Mozilla Kraken
Mozilla Kraken is a browser-based JavaScript benchmark that tests a variety of real-world use cases. We use Chrome as the test browser. The test exhibits very little multi-threading and shows an affinity for CPU clock speed and IPC.
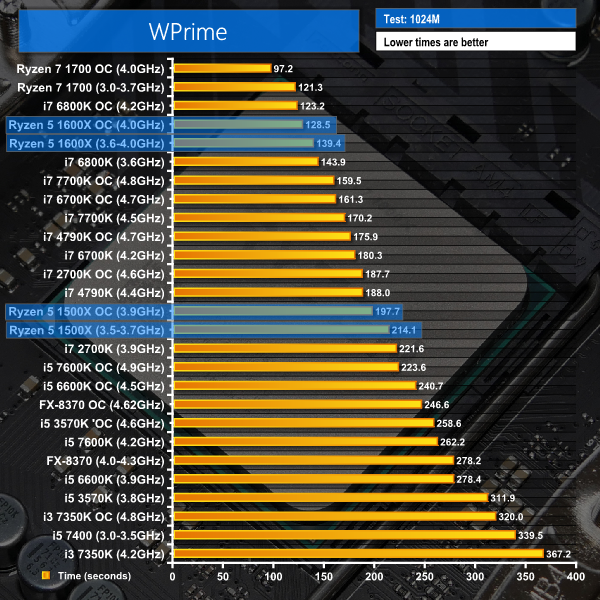
WPrime
WPrime is a leading multithreaded benchmark for x86 processors that tests your processor performance by calculating square roots with a recursive call of Newton’s method for estimating functions. We use the 1024M test in WPrime to analyse processor calculation performance.
CPU-related testing overview:
7-Zip leverages all eight of the Ryzen 5 1500X’s processing threads to return a handsome lead over the 4C4T i5-7400. At stock, Ryzen 5 1500X is 51% faster than the multiplier-locked Intel competitor. The lead grows to 62% when the 1500X is pushed to 3.9GHz. You get 7600K-beating performance from the 1500X in this program.
Kraken is largely single-threaded which puts the emphasis on IPC performance and clock frequency. That latter point hamstrings the Core i5-7400 and sees Ryzen 5 1500X posting superior performance numbers. Overclocking helps to put the 1500X in 4.2GHz i7-6800K territory, which is a bold result. Shining a light on the Core i3-7350K shows it to be a very strong contender at this price point in a test where frequency on a fast architecture is critical.
WPrime posts positive 1500X numbers thanks to its strong multi-threaded capabilities. All of Intel’s Kaby Lake Core i5 processors are outperformed by Ryzen 5 1500X. That’s before an overclock to the AMD chip even enters the equation.
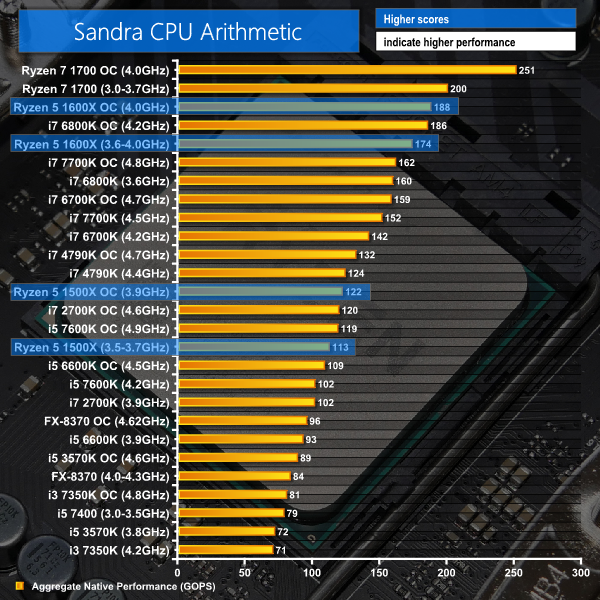
Sandra Processor Arithmetic
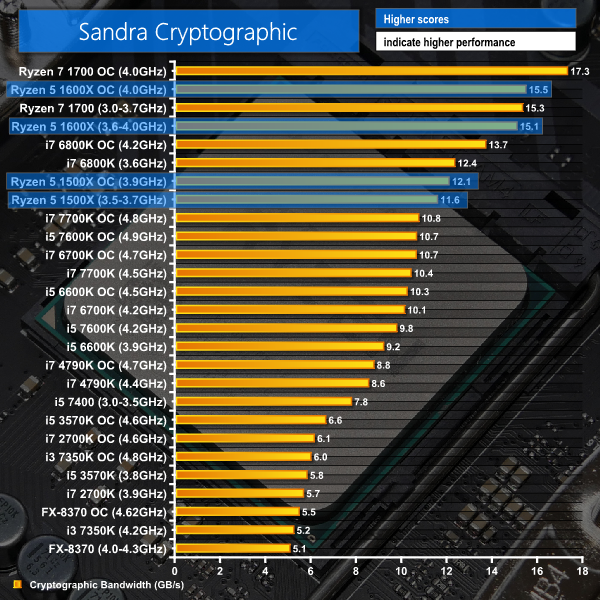
Sandra Cryptographic
Sandra Memory Bandwidth
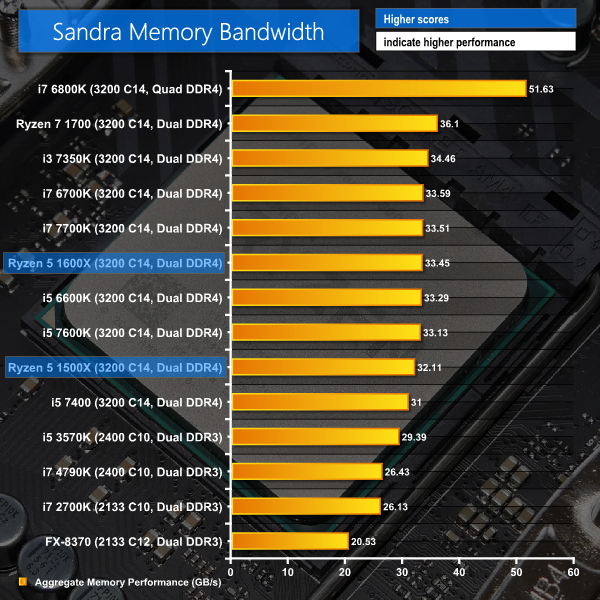
Synthetic tests reward Ryzen 5 1500X for its four cores and SMT implementation. Cryptographic performance is disproportionally strong on Ryzen and that holds true for the 1500X. Memory bandwidth is as one would expect for dual-channel DDR4.
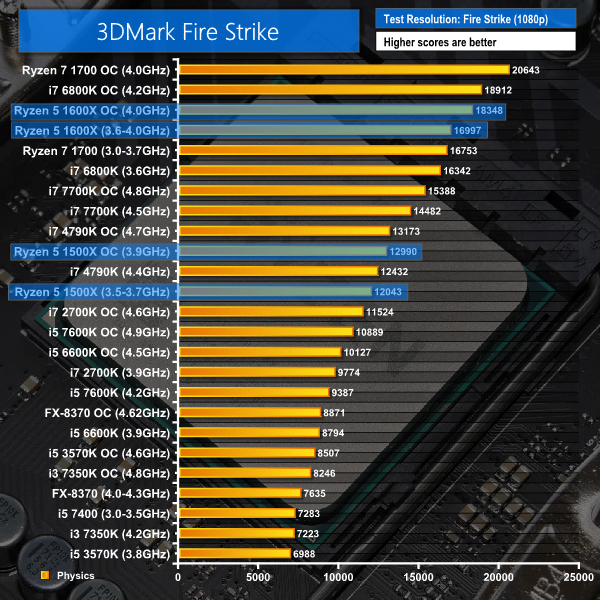
3DMark
3DMark is a multi-platform hardware benchmark designed to test varying resolutions and detail levels of 3D gaming performance. We run the Windows platform test and in particular the Fire Strike benchmark, which is indicative of high-end 1080p PC Gaming. We also test using the Time Spy benchmark which gives an indication of DirectX 12 performance.
VRMark
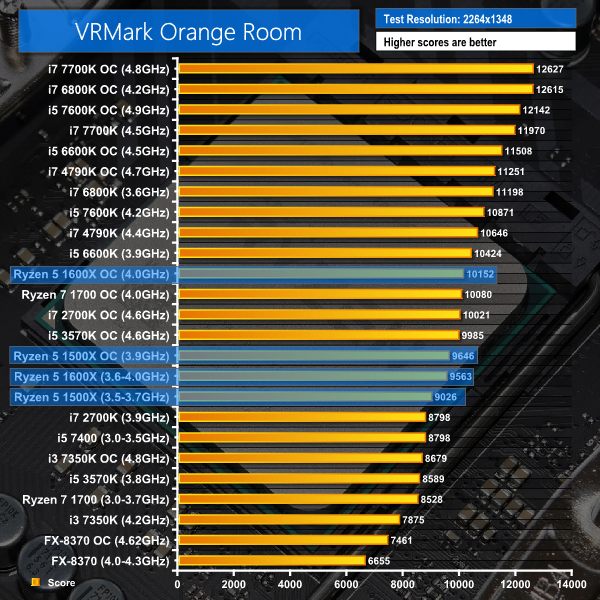
The recently-released VRMark benchmark aims to score systems based on their VR performance potential by using rendering resolutions associated with VR devices of today and the future. We test using the Orange Room benchmark which uses a rendering resolution of 2264×1348 to analyse the capability of hardware with current devices such as the HTC Vive and Oculus Rift.
3DMark Fire Strike and Time Spy are further synthetic tests that reward the 1500X for its high thread count. Core i5 performance is beaten by the AMD chip in Fire Strike, while it takes an overclock to the i5-7600K for it to pass stock Ryzen 5 1500X numbers.
A frequency advantage is primarily what keeps the Ryzen 5 1500X ahead of Intel’s Kaby Lake Core i5-7400 competitor when it comes to VRMark performance.
Grand Theft Auto V
Grand Theft Auto V remains an immensely popular game for PC gamers and as such retains its place in our test suite. The well-designed game engine is capable of providing heavy stress to a number of system components, including the GPU, CPU, and Memory, and can highlight performance differences between motherboards.
We run the built-in benchmark using a 1080p resolution and generally Maximum quality settings (including Advanced Graphics).

Metro: Last Light Redux
Despite its age, Metro: Last Light Redux remains a punishing title for modern computer hardware. We use the game's built-in benchmark with quality set to Very High, SSAA enabled, AF 16X, and High tessellation.
The Witcher 3: Wild Hunt
The Witcher 3 is a free-roaming game which can feature heavy interaction from NPCs in densely-populated urban areas, making it ideal for testing CPU performance. The well-designed game engine is capable of providing heavy stress to a number of system components and will happily use more than four CPU threads when such hardware is available.
We run a custom benchmark which is located in a heavily populated section of an urban town area. A 1080p resolution and Maximum quality settings are used (Nvidia Hairworks settings are disabled).
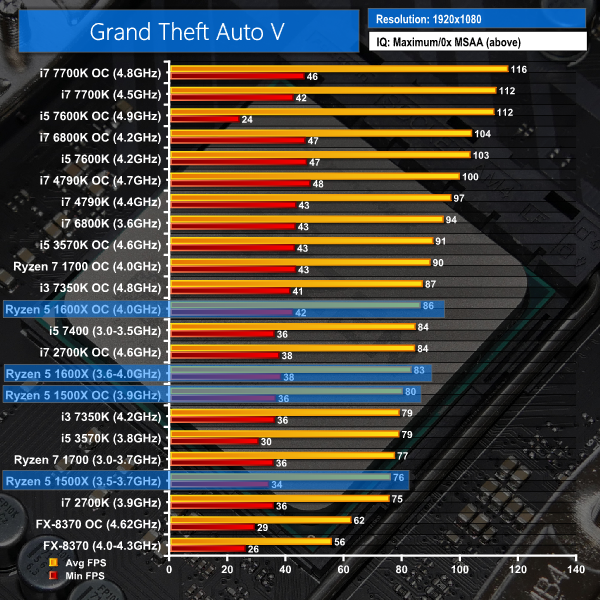
Grand Theft Auto V favours Intel hardware, despite its desire for high thread counts and core frequencies. The Ryzen 5 1500X is outperformed by the 4C4T i5-7400. It takes an overclock to 3.9GHz for Ryzen 5’s fastest quad-core to close the performance deficit to 5% against the i5-7400. Utilisation of the eight-thread Ryzen 5 hovered around 60% for this benchmark. The first core was loaded close to 70-80%, given the DX11 API for GTA V. There are spare CPU cycles for completing other tasks with the Ryzen 5 1500X. By comparison, the Core i5-7400 was pinned close to 100% usage for its higher frame rate.
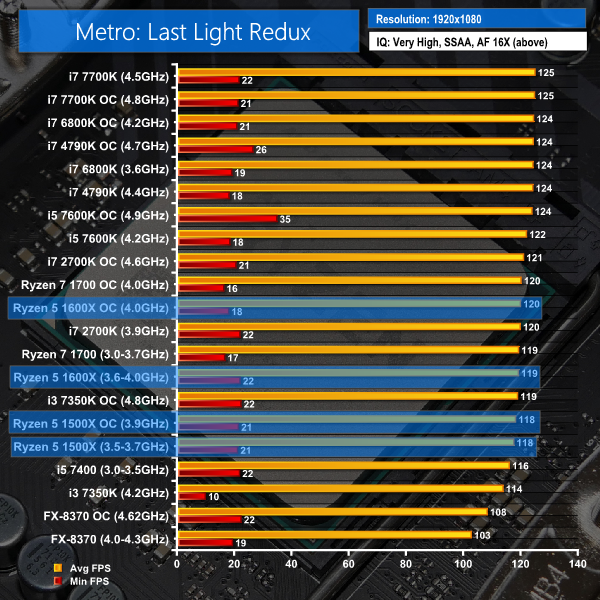
Metro: Last Light Redux shows Ryzen 5 1500X to be a perfectly adequate processor in GPU-bound gaming. The i5-7400 is a little slower than Ryzen due to its clock frequency disadvantage. However, the difference between 118 FPS and 116 FPS average is negligible.
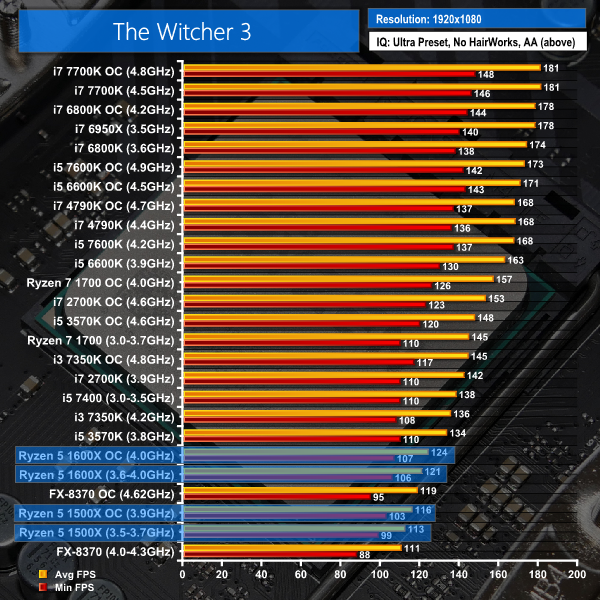
Performance in The Witcher 3 is not good for the 1500X. That point is on a comparative basis as we’d assume that most people will not complain about a 110+ FPS average frame rate and minimums around the 100 FPS mark. Nevertheless, the 4C8T chip takes its place close to the bottom of the chart and is outperformed by the Core i5-7400, which is 22% faster on average, at stock. CPU usage for the 1500X sat around 60% for our custom benchmark run.
Ashes of the Singularity Escalation
Ashes of the Singularity Escalation is a Sci-Fi real-time strategy game built for the PC platform. The game includes a built-in benchmark tool with DirectX 12 support. We run the CPU-focused benchmark using DirectX 12, a 1080p resolution and the Extreme quality preset.
Gears of War 4
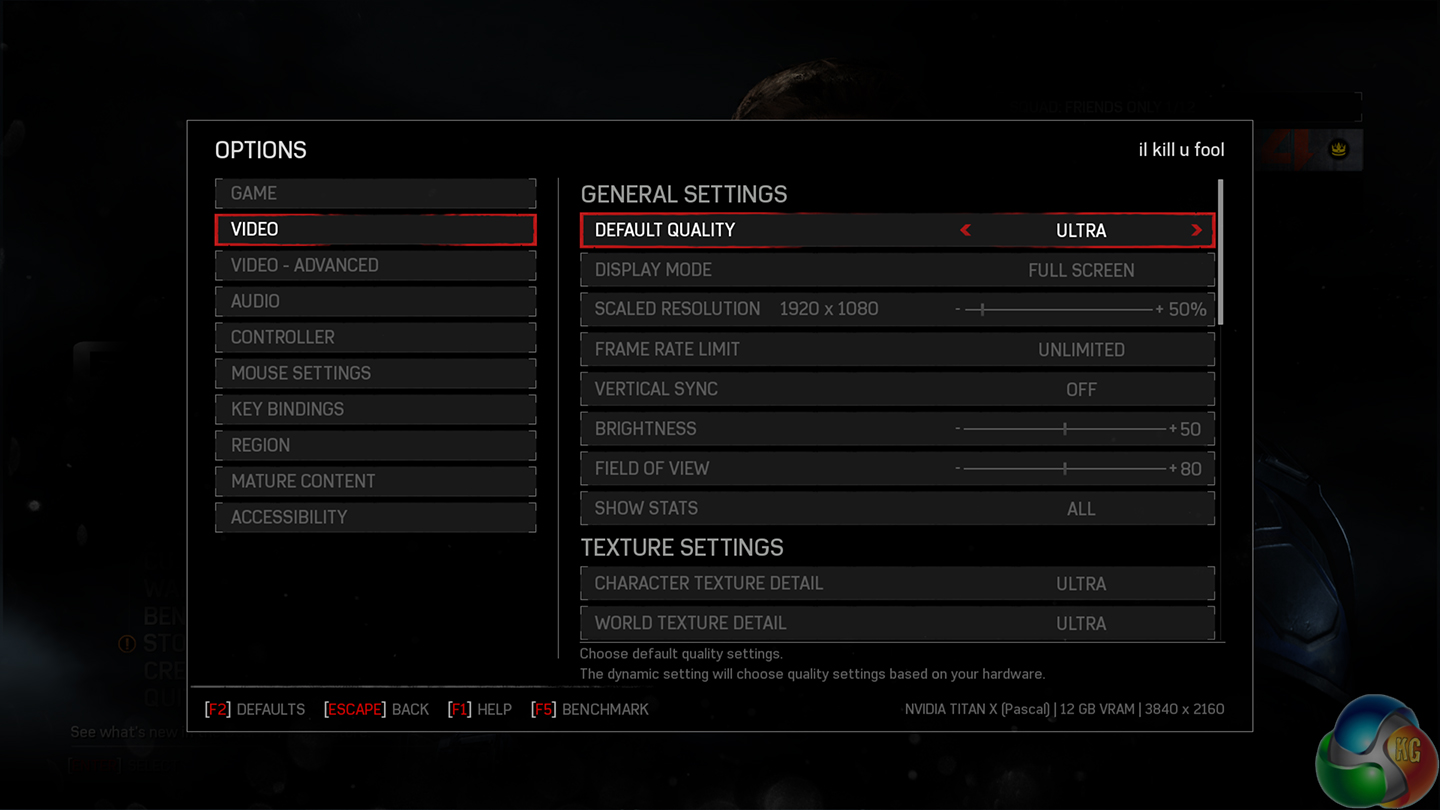
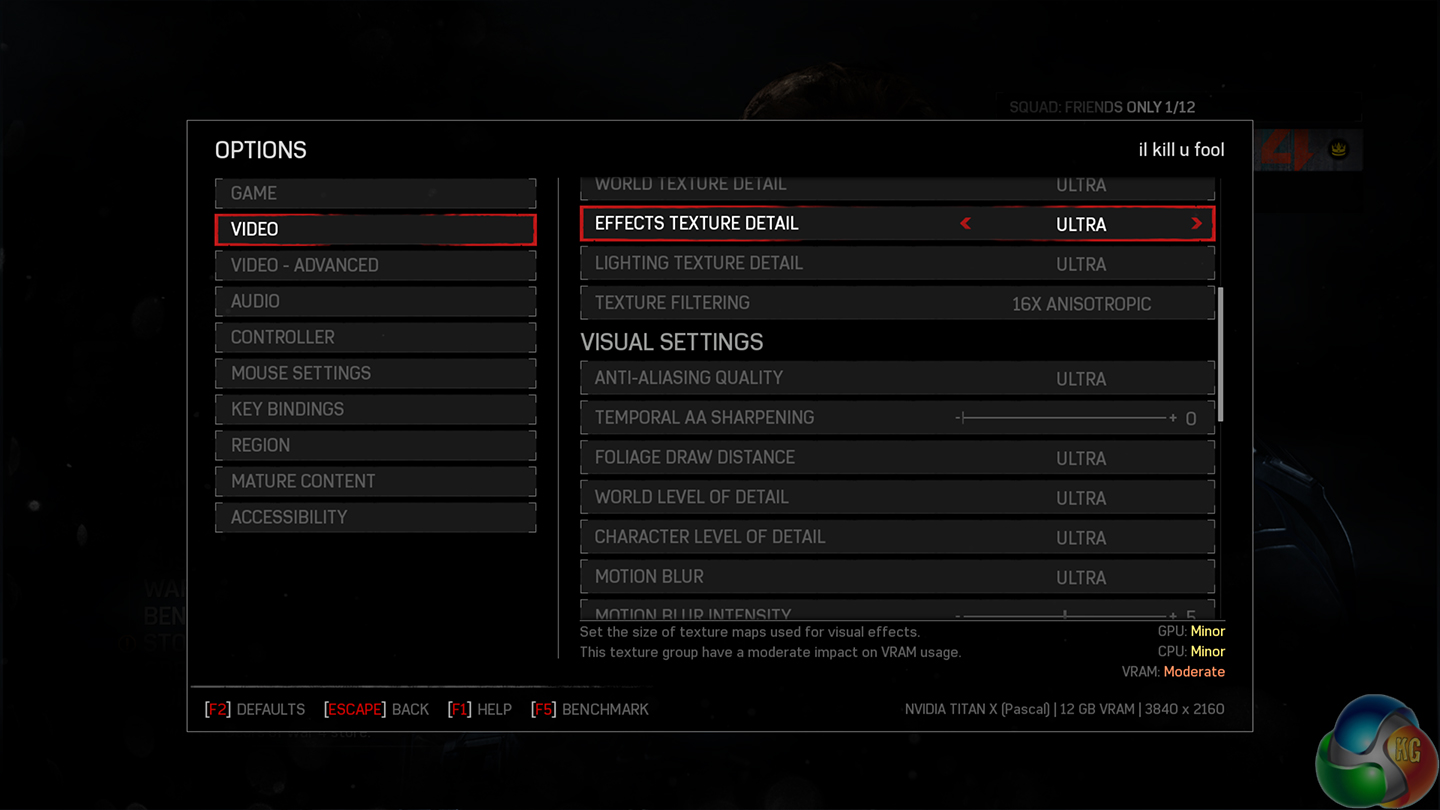
Gears of War 4 is a third-person shooter available on Xbox One and in the form of a well-optimised DX12-only PC port. We run the built-in benchmark using DirectX 12 (the only API supported), a 1080p resolution, the Ultra quality preset, and Async Compute enabled.
Note: The Core i7-2700K, i5-3570K, and i7-4790K are not shown in Gears of War 4 as the game download was too large to install on their system SSD and the clunky Windows Store platform gives errors when moving games installed on a secondary SSD between test systems.
Game version 9.8.0.2 used for current testing (earlier version used for previous testing).
Rise of The Tomb Raider
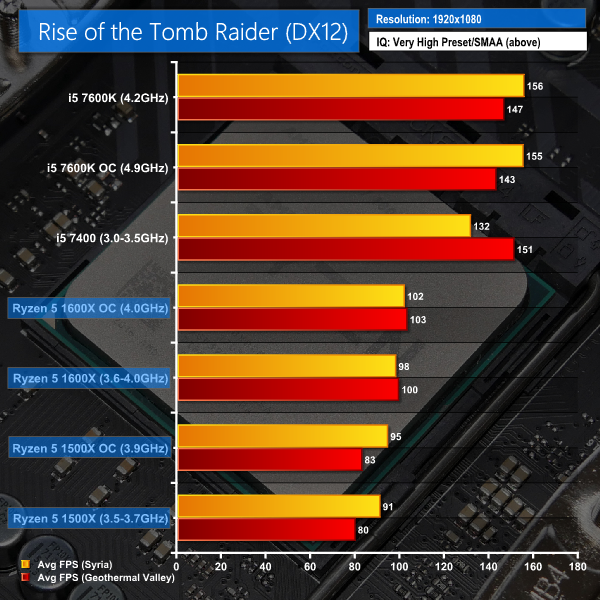
Rise of The Tomb Raider is a popular title which features both DX11 and DX12 modes. Heavy loading can be placed on the CPU, especially in the Syria and Geothermal Valley sections of the built-in benchmark.
We run the built-in benchmark using the DirectX 12 mode, a 1080p resolution, the Very High quality preset, and SMAA enabled.
Note: Rise of the Tomb Raider numbers were showing variation to the data gathered in previous reviews. As such, we have retested with the CPUs relevant for this comparison and removed the previously-acquired data.
Total War: Warhammer
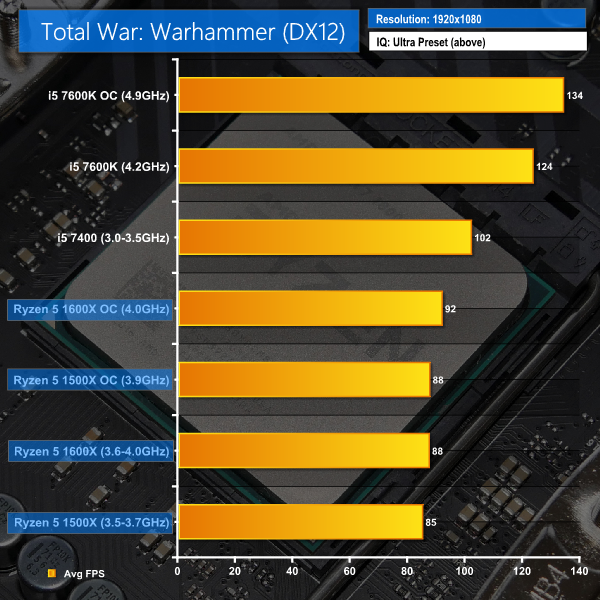
Total War: Warhammer is another title which features both DX11 and DX12 modes. Heavy loading can be placed on the CPU using the built-in benchmark. The DX12 mode is poorly optimised and tries to force data through a low number of CPU threads rather than balance operations across multiple cores. As such, this gives a good look at pure gaming performance of each CPU in titles that aren't well multi-threaded.
We run the built-in benchmark using the DirectX 12 mode, a 1080p resolution, and the Ultra quality preset.
Note: A game update for Total War: Warhammer has provided a performance increase on AMD and Intel CPUs to the tune of 5%. As such, we have retested with the CPUs relevant for this comparison and removed the previously-acquired data.


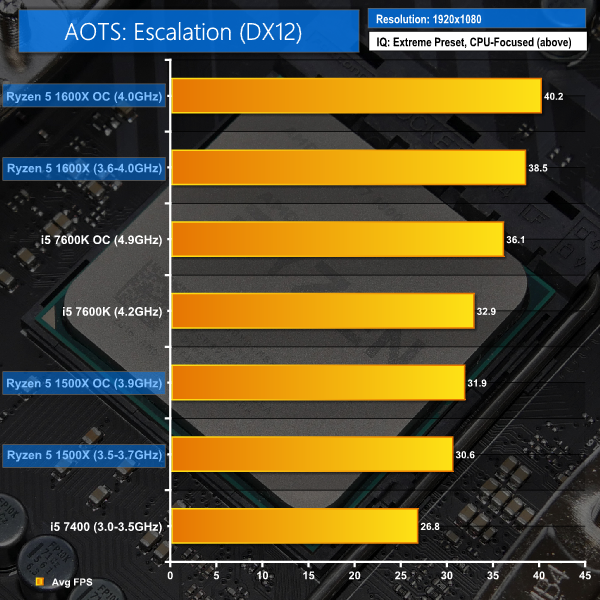
Ashes of the Singularity: Escalation and its recent Ryzen performance-boosting update fairs well on the 1500X. The similarly-priced i5-7400 is outperformed and an overclock for the Ryzen 5 quad-core takes it close to default 7600K performance.
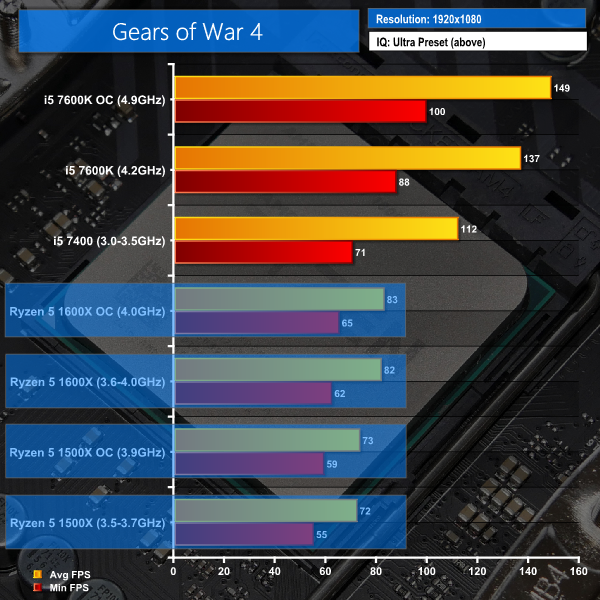
Gears of War 4 does not show good performance on Ryzen 5. The 4C8T 1500X is placed at the bottom of our performance hierarchy and only manages an average frame rate just above 70 FPS. That is despite registering around 50-60% overall CPU utilisation with the loading spread well across all eight threads. Intel’s Core i5-7400 is faster in this benchmark, even if it is running at full load throughout.
Rise of the Tomb Raider is another DX12 benchmark where Intel performs better. Ryzen 5 1500X doesn’t look so bad in this test as the performance loss from the six-core 1600X is lower. However, Intel’s similarly-priced Core i5-7400 is considerably faster in this game’s in-built benchmark. CPU usage was around 80-90% for the 1500X in this benchmark, with the load being spread across all eight threads but one of those being pinned close to 100% utilisation. What our numbers do not show, however, is the pop-in that we noticed with the Core i5-7400. This was not present on Ryzen 5 chips and therefore gives the 1500X an advantage despite its lower headline framerates.
Total War: Warhammer in its DX12 mode likes clock speed and IPC. That IPC point is what gives Intel’s i5-7400 the victory over Ryzen 5 1500X. This benchmark forces one or two threads to very high levels of utilisation while another two threads are also used quite heavily and the four SMT threads are barely loaded.
The market for people buying an expensive CPU and using it for gaming at 1080p is likely to be very slim. What 1080p does is give a good indication of the CPU's raw gaming performance as GPU power is sufficient to push frame rates to a level where the CPU and memory limitations can be observed.
We supplement the 1080p gaming results with a trio of games tested at 4K using the same Titan X Pascal graphics card that pushed through our 1080P suite. That saving against Intel's competing CPUs with similar core counts could buy a nice 4K monitor, so we will show how Ryzen 5 performs at such a resolution.
Gears of War 4
We run the built-in benchmark using a 4K resolution and the same settings as the 1080p test (Ultra quality preset, Async Compute enabled).
Game version 9.8.0.2 used for current testing (earlier version used for previous testing).
Note: The Core i7-2700K and i7-4790K are not shown in Gears of War 4 as the game download was too large to install on their system SSD and the clunky Windows Store platform gives errors when moving games installed on a secondary SSD between test systems.
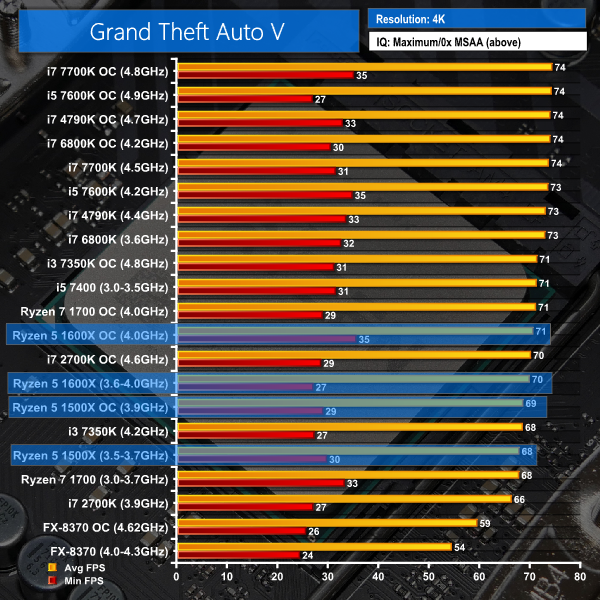
Grand Theft Auto V
We run the built-in benchmark using a 4K resolution and the same settings as the 1080p test (generally Maximum quality settings including Advanced Graphics). VRAM usage at 4K, according to the built-in GTA V counter, is 4171MB.

The Witcher 3 Wild Hunt
We run our custom 107-second benchmark in a densely-populated town area using a 4K resolution and the same settings as the 1080p test (Maximum quality, Nvidia settings disabled).
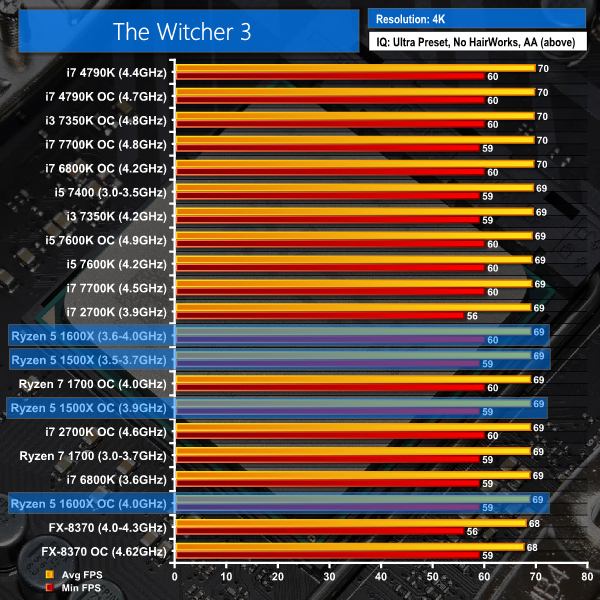
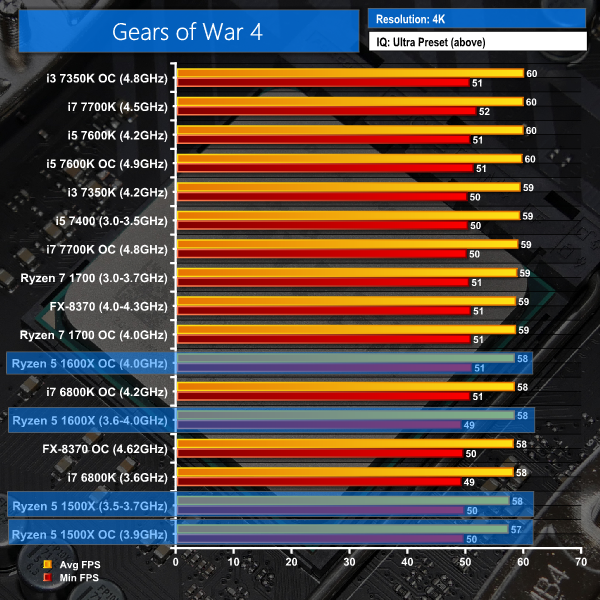
4K gaming performance shows tighter grouping in the results between processors as such emphasis is put on GPU horsepower. GTA V still runs faster on the Intel Core i5-7400 but the performance drop to AMD’s Ryzen 5 1500X is greatly reduced. The Witcher 3 and Gears of War 4 show very similar performance between Ryzen 5 1500X and Core i5-7400.
Feedback on our Ryzen 7 reviews highlighted that many users are interested in the performance comparisons between CPUs when partnered with a sensible graphics solution for the given price point. 1440P resolution testing was also shown to be in strong demand.
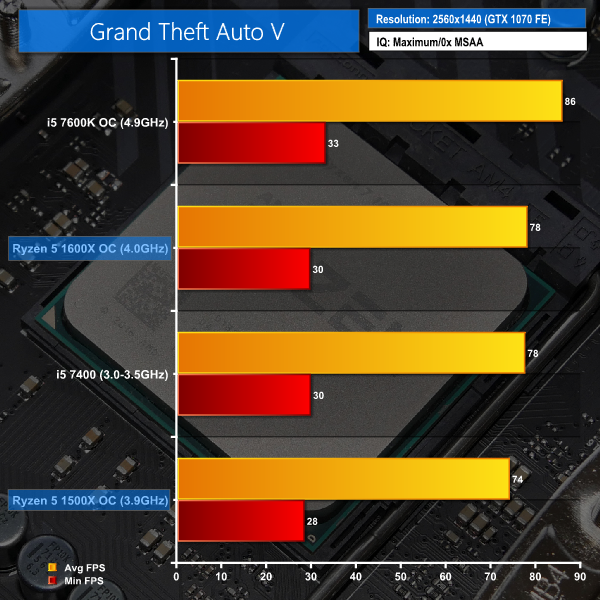
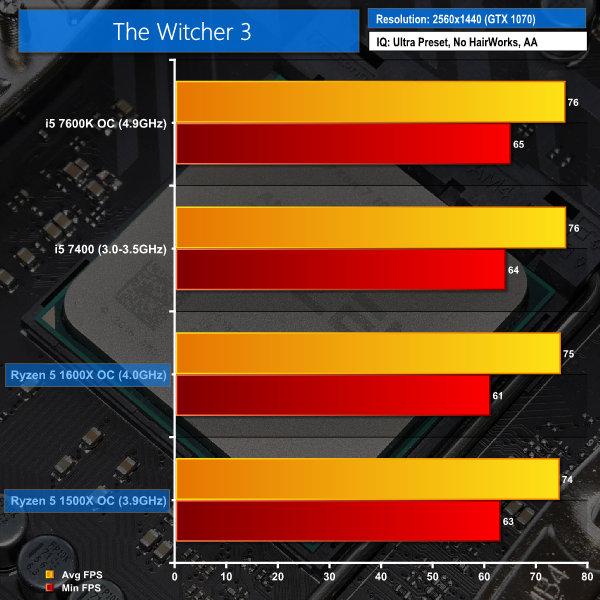
We have taken that feedback on board and have added test data for the Ryzen 5 and Core i5 Kaby Lake CPUs running with a GTX 1070 8GB Founder's Edition graphics card and a 1440P gaming resolution. We feel that the GTX 1070 currently hits a strong sweet-spot for graphics performance and cost to many Ryzen 5 buyers and also 1440P gamers.
The testing was conducted with the CPUs overclocked to their highest levels (4.0GHz for the Ryzen 5 1600X, 3.9GHz for the Ryzen 5 1500X, 4.9GHz for the i5-7600K, and stock 3.0-3.5GHz for the locked i5-7400) in order to show how a user can squeeze out 1440P gaming performance from their CPU.
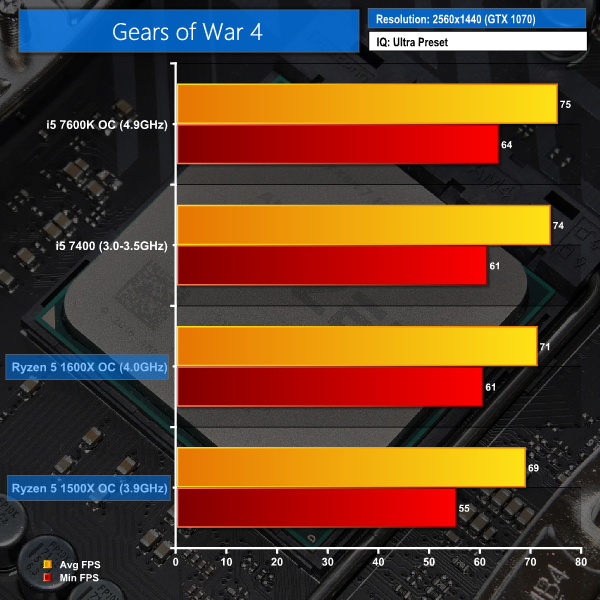
Gears of War 4
We run the built-in benchmark using a 2560×1440 resolution and the same settings as the 1080p and 4K tests that can be found on other pages (Ultra quality preset, Async Compute enabled).
Game version 9.8.0.2 used for current testing (earlier version used for previous testing).
Grand Theft Auto V
We run the built-in benchmark using a 2560×1440 resolution and the same settings as the 1080p and 4K tests that can be found on other pages (generally Maximum quality settings including Advanced Graphics). VRAM usage at 1440P, according to the built-in GTA V counter, is 3514MB.
The Witcher 3 Wild Hunt
We run our custom 107-second benchmark in a densely-populated town area using a 2560×1440 resolution and the same settings as the 1080p and 4K tests that can be found on other pages (Maximum quality, Nvidia settings disabled).
1440P gaming performance with a GTX 1070 is still stronger on the Core i5-7400 than on Ryzen 5 1500X in Gears of War 4 and GTA V. The performance deficits for Ryzen 5’s quad-core part are small but they are also measurable.
The Witcher 3, by contrast, does not seem to mind which CPU it uses to power the GTX 1070 and a 1440P resolution.
We leave the system to idle on the Windows 10 desktop for 5 minutes before taking a power draw reading. For CPU load results we read the power draw while running the Cinebench multi-threaded test as we have found it to push power draw and temperature levels beyond those of AIDA 64 and close to Prime 95 levels. Cinebench has a short run time on high-performance CPUs which influences the validity of the temperature reading, so we run AIDA64 stress test to validate data.
The power consumption of our entire test system (at the wall) is shown in the chart. The same test parameters were used for temperature readings.
Power Consumption
Power draw readings are accurate to around +/- 5W due to fluctuations in the value even at sustained load. We use a Platinum-rated Seasonic 760W PSU and install a GTX 1070 video card that uses very little power.
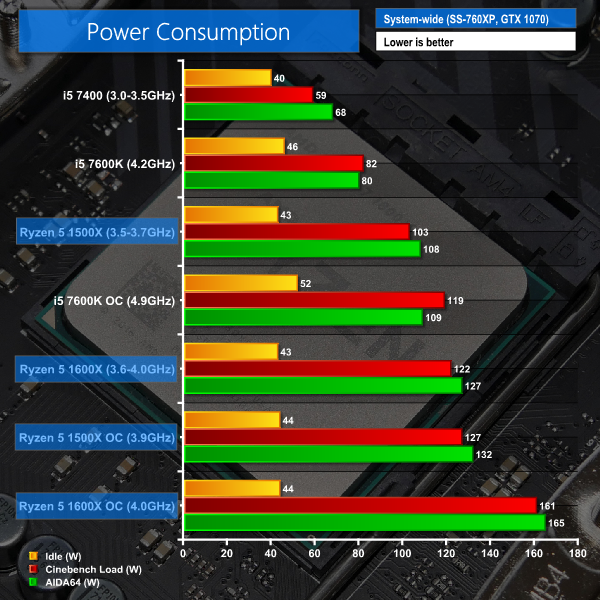
Power consumption numbers from Ryzen 5 1500X are decent for a quad-core, eight-thread part but they are significantly higher than those displayed by the similarly-priced Core i5-7400. That’s understandable, though, given the significant increase in performance when using our Cinebench test run. At stock, the Ryzen 5 1500X commands 75% more power than the Core i5-7400 in Cinebench and hands back a 50% performance increase.
On the positive side, power draw from AMD’s 4C8T chip is less than an overclocked Core i5-7600K, despite the Ryzen 5 part delivering higher performance in Cinebench.
Overclocking results in a sizeable increase to the 1500X’s power usage. A system-wide 127W power draw during Cinebench loading can still be considered low, which may be a positive factor for mini-ITX users.
Temperatures
Temperature recordings were taken using the superb, cost-effective Cooler Master Hyper 212X for the Ryzen 5 1600X and the Core i5-7600K. The supplied coolers are used for Ryzen 5 1500X (AMD's Wraith Spire) and Core i5-7400 (Intel E97379-003 with an Aluminium slug).
Each CPU cooler's fans were running at full speed. Ambient temperature was maintained at around 20°C.
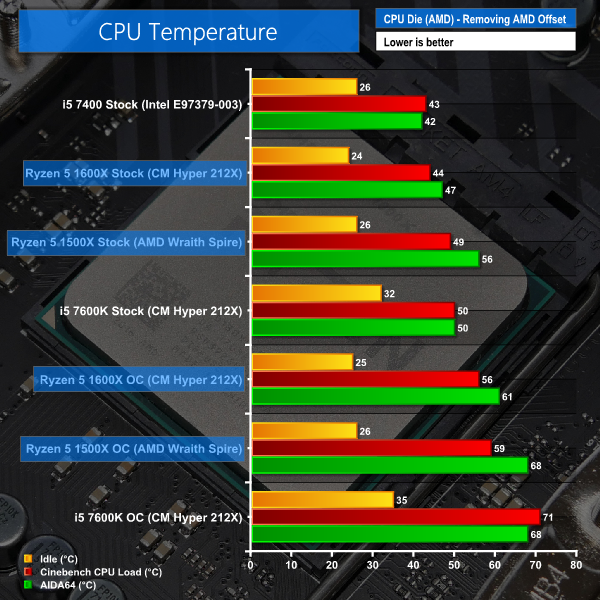
Despite AMD’s Wraith Spire cooler being significantly more capable than the heatsink and fan bundled with the Core i5-7400, the chip from Intel delivers lower temperature levels. This is due to its smaller power draw when compared to the Ryzen 5 1500X. Put simply, there is less heat for the inferior CPU cooler to contend with.
The Wraith Spire on Ryzen 5’s 1500X delivers solid performance that has us happy to recommend it for usage with sensible overclocked voltages. Our testing was conducted at 100% fan speed, which was surprisingly bearable for AMD’s cooler, so PWM-driven results will vary. The upgrade to a cost-effective CPU cooler such as the Hyper 212X is not a necessity for the Ryzen 5 1500X and Wraith Spire bundle.
Ryzen 5 1500X delivers strong performance when you focus on productivity tasks. Workloads such as video editing and rendering benefit from the additional threads provided by SMT, giving the 1500X a commanding lead over Intel’s similarly-priced competitors.
One of the most beneficial features for Ryzen 5 1500X is its unlocked core ratio multiplier. This gives the chip an ability to be easily overclocked to 3.9GHz, based on our sample’s headroom. By comparison, the only Intel multiplier-unlocked chip worthy of mentioning at this price point is the Core i3-7350K and that’s a dual-core, Hyper-threaded part. The frequency boost available to Ryzen 5 1500X helps it to overcome the raw IPC benefit of Kaby Lake’s Core i5-7400 in several scenarios.
Gaming performance for Ryzen is still off the pace set by Kaby Lake and other Intel architectures. That point is still true for Ryzen 5 in its four-core, eight-thread guise. There were instances where the Core i5 was significantly faster when paired with a powerful graphics card.
Switch to a 4K gaming resolution and you’ll struggle to notice a performance difference between Ryzen 5 1500X and Core i5-7400. However, even at 1440P when paired with a GTX 1070, the multiplier-locked Kaby Lake i5 is a little quicker.
Worth noting, though, is Ryzen 5 1500X’s spare CPU capacity whilst gaming thanks to its SMT implementation. Those four additional threads compared to a Core i5 can be used to power background activities such as game streaming. This is a task that will result in definite slow-down on the Core i5-7400 as it tended to stick close to 100% utilisation when delivering its gaming results.
Power draw on the 1500X is noticeably higher than that of the Core i5-7400. Disproportionally so, too, as the increase in power draw is larger than the performance boost obtained by opting for AMD’s eight-thread chip. With that said, the levels are far from concerning and they are not going to add significant cost to an energy bill.
Thermal performance was good, even with the included Wraith Spire cooler (which is a potent heatsink fan). We dialled in 1.40V for the overclock and were met by temperatures well below 80C. Core i5-7400 runs cooler, despite its physically inferior stock cooler, thanks largely to lower power draw.
Our conclusion for the Ryzen 5 1500X is somewhat mixed. If you have a hard budget of less than £200 for a CPU, the 4C8T AMD part offers superb value for money in computational workloads. However, Intel’s Kaby Lake competitors are faster if all you do is play games.
If you have a mixed variety of workloads which include gaming and productivity, Ryzen 5 1500X puts itself forward as a solid choice. This is thanks to its balance between productivity capabilities and good enough gaming performance when paired with a sensible graphics card for buyers in this market.
Unlike the Ryzen 5 flagship 1600X that is overshadowed by its cheaper, overclockable sibling, the 1500X is worth its $20 price increase over the 1400. You get noticeably higher out-of-the-box frequencies (especially for XFR), double the shared L3 cache, and a better CPU cooler.
As such, we have no problem giving the 1500X a positive recommendation if you use your system for more than just gaming. Significant challenges will, however, be thrown the 1500X’s way if there is any price reduction on the £30 more expensive six-core Ryzen 5 1600.
The AMD Ryzen 5 1500X will be available for £189.99.
Discuss on our Facebook page HERE.
Pros:
- Multi-threaded performance is far better than Intel’s price competitors.
- Single-threaded XFR boost to 3.9GHz is a high clock speed for this price point.
- Allows for manual overclocking with an unlocked core multiplier.
- Clock frequency helps it overcome IPC disadvantages versus the locked Kaby Lake Core i5.
- Spare processing capacity when gaming may appeal to streamers on a budget.
- Wraith Spire is a well-balanced cooler with headroom for overclocking.
- Plenty of flexibility thanks to the AM4 platform.
Cons:
- Gaming performance is behind that of Intel’s competition.
- Power draw in our Cinebench measurements is disproportionately higher than Intel’s competition.
- Worth a $20 upgrade over the 1400 but the six-core 1600 is only $30 more expensive.
KitGuru says: A worthy option to all-round users who want a low-cost point of entry onto the Ryzen eco-system. Not as fast as Kaby Lake quad-cores when it comes to gaming but vastly superior to Intel’s price point competition in tasks that leverage multiple threads.

eso no sirve
AMD are back in the game
Great to see you back AMD – Thanks for Ryzen!
Google is paying 97$ per hour! Work for few hours and have longer with friends & family! !mj149d:
On tuesday I got a great new Land Rover Range Rover from having earned $8752 this last four weeks.. Its the most-financialy rewarding I’ve had.. It sounds unbelievable but you wont forgive yourself if you don’t check it
!mj149d:
➽➽
➽➽;➽➽ http://GoogleFinancialJobsCash149HomePowerGetPay$97Hour… ★★✫★★✫★★✫★★✫★★✫★★✫★★✫★★✫★★✫★★✫★★✫★★✫★★✫★★✫★★✫★★✫★★✫★★:::::!mj149d:….,…..
“Grand Theft Auto V favours Intel hardware, despite its desire for high thread counts and core frequencies” With the 7700K beating the 6800K and Ryzen bottoming its charts, that game certainly does not favor high thread counts. Its a DX11 POS.
Any DX12 game should be tested with a Radeon GPU. It is quite clear by now that nVidia’s DX12 implementation fails to parallelize rendering workload properly. I’d even go as far as to say i beleive they may have built in some intel only optimizations (think GenuineIntel checks or such racket).
DX12 is Radeon territory. If you want to eliminate GPU Bottlenecks, use Fury X at 1080p. Or two 480s in CF. Gives much more representative results.
El i5 7400 es genial!!