
Following on from the huge success that was the Pascal architecture, today marks the release of Nvidia's Turing architecture into the wild. We have reviews of both the RTX 2080 and RTX 2080 Ti ready for launch – but this particular review focuses on the £1099 behemoth that is the RTX 2080 Ti.
Nvidia has certainly gone with a different pricing strategy with Turing – the GTX 1080 Ti costs £669 , when its supposed successor will set you back an extra £430 at launch. That's an effective 64% generation price hike – so what are you getting for your money?
Foremost among the appeal of the RTX 2080 Ti is the ray tracing abilities. As you may already be aware, we cannot yet test this feature out in actual games – we are still waiting for Microsoft's DirectX Raytracing (DXR) update that is slated for next month. We do have the results from one ray tracing demo, presented later in this review, while of course there are the usual slew of benchmarks as well.
| GPU | RTX 2080 Ti (FE) | GTX 1080 Ti (FE) | RTX 2080 (FE) | GTX 1080 (FE) |
| SMs | 68 | 28 | 46 | 20 |
| CUDA Cores | 4352 | 3584 | 2944 | 2560 |
| Tensor Cores | 544 | N/A | 368 | N/A |
| Tensor FLOPS | 114 | N/A | 85 | N/A |
| RT Cores | 68 | N/A | 46 | N/A |
| Texture Units | 272 | 224 | 184 | 160 |
| ROPs | 88 | 88 | 64 | 64 |
| Rays Cast | 10 Giga Rays/sec | 1.1 Giga Rays/sec | 8 Giga Rays/sec | 0.877 Giga Rays/sec |
| RTX Performance | 87 Trillion RTX-OPS | 11.3 Trillion RTX-OPS | 60 Trillion RTX-OPS | 8.9 Trillion RTX-OPS |
| GPU Boost Clock | 1635 MHz | 1582 MHz | 1800 MHz | 1733 MHz |
| Memory Clock | 7000 MHz | 5505 MHz | 7000 MHz | 5005 MHz |
| Total Video Memory | 11GB GDDR6 | 11GB GDDR5X | 8GB GDDR6 | 8GB GDDR5X |
| Memory Interface | 352-bit | 352-bit | 256-bit | 256-bit |
| Memory Bandwidth | 616 GB/sec | 484 GB/sec | 448 GB/sec | 320 GB/sec |
| TDP | 260W | 250W | 225W | 180W |
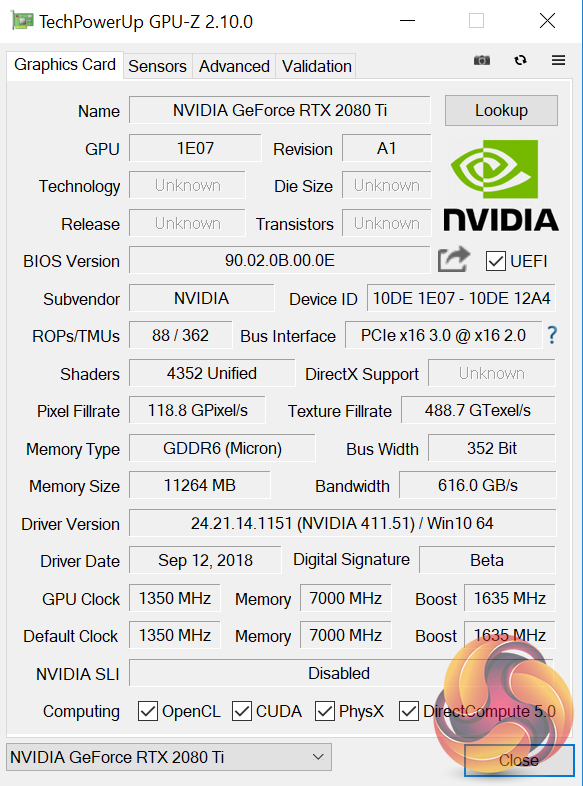
Note: GPU-Z has not yet been updated to show all of the RTX 20 series specs.
On paper, the Nvidia RTX 2080 Ti is nothing short of a spec monster. Not only does it sport 4352 CUDA cores – up from 3584 in the GTX 1080 Ti – but architectural improvements (detailed on the next page) mean these cores are even more effective than previous generations. The new GPU is also fabricated on a 12nm process, where Pascal used the 16nm process.
68 RT cores and 544 Tensor Cores also single this card out as a new GPU – Pascal does not have any such cores, and they were only first introduced with Volta's GV100.
In terms of clock speed, we can expect lower speeds than the RTX 2080, which benefits in that regard thanks to its lesser core count, but we can still expect the RTX 2080 Ti to exceed its rated 1635MHz clock thanks to GPU Boost 4.0.
One thing that remains consistent from the GTX 1080 Ti is the amount of VRAM, at 11GB. The RTX 2080 Ti, however, uses GDDR6 memory over a 352-bit bus, with memory bandwidth totalling 616 GB/s.Nvidia claims that the Turing architecture ‘represents the biggest architectural leap forward in over a decade', so here we detail what's new with Turing – with a particular focus on technologies that will affect/improve your gaming experience.
Note: if you have come directly from our RTX 2080 review, the information provided below is the same.
Turing GPUs
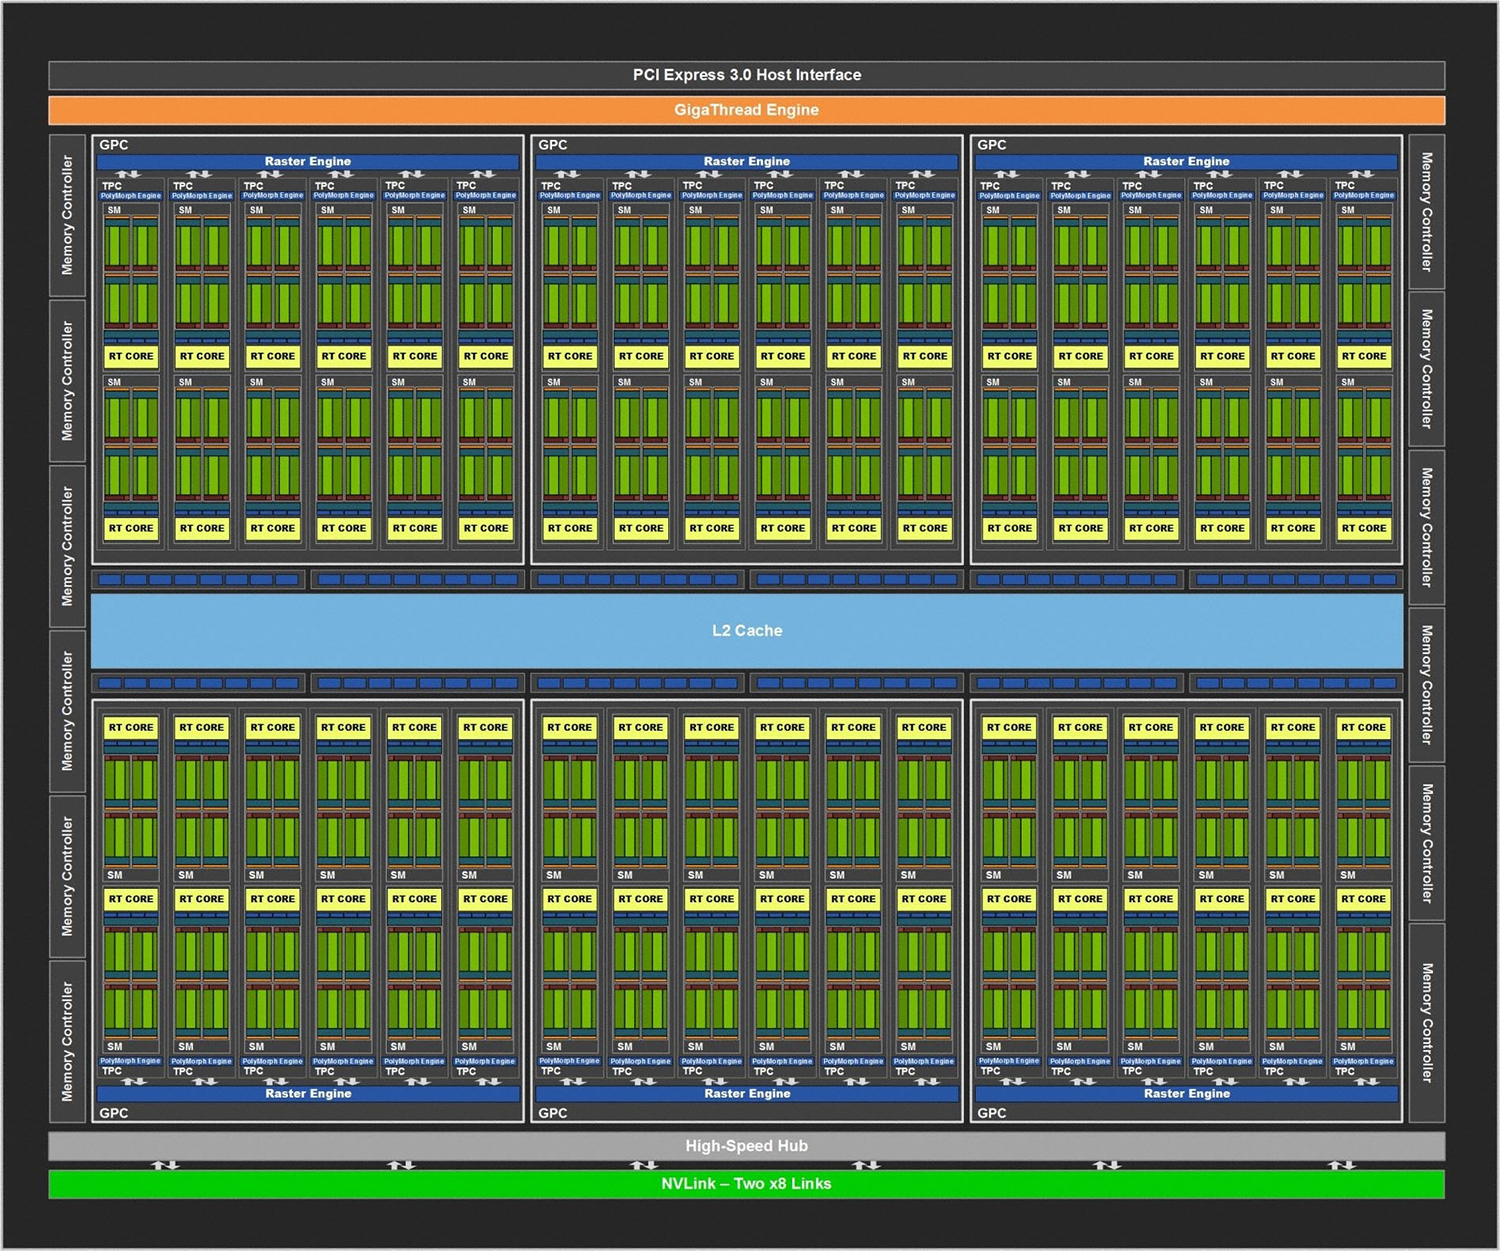
The first thing to note is that, currently, we have three Turing GPUs – TU102, TU104 and TU106. While the RTX 2080 Ti uses the TU102 GPU, it is not actually a full implementation of that chip. TU102, for instance, sports more CUDA cores, as well as a greater number of RT cores, Tensor cores and even an extra GB of memory.
For the sake of reference, however, the Turing architecture detailed below uses the full TU102 GPU as the basis for its explanation. The architecture obviously remains consistent with the TU104 (RTX 2080) and TU106 (RTX 2070) GPUs , but those GPUs are essentially cut-back versions of TU102.
Turing Steaming Multiprocessor (SM) and what it means for today's games
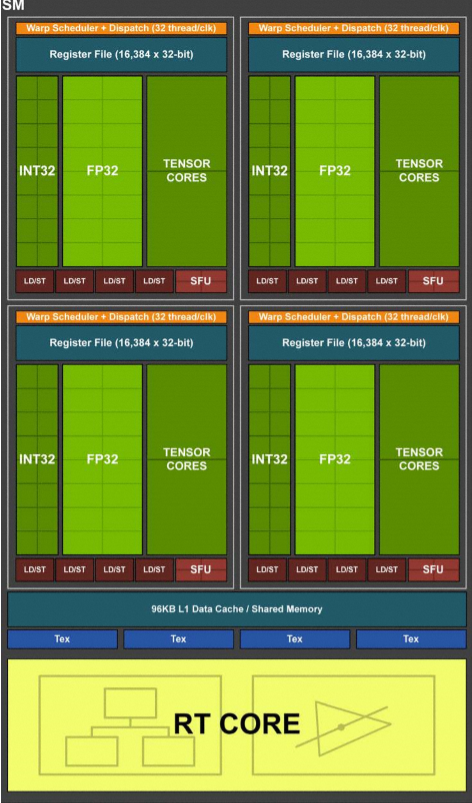
Compared to Pascal, the Turing SM sports quite a different design that builds on what we first saw with the Volta GV100 GPU. On the surface level, Turing includes two SMs per Texture Processing Cluster (TPC), with each SM housing 64 FP32 cores and 64 INT32 cores. On top of that, a Turing SM also includes 8 Tensor Cores and one RT core.
Pascal, on the other hand, has just 1 SM per TPC, with 128 FP32 cores within each SM, and obviously no Tensor or TR cores being present either.
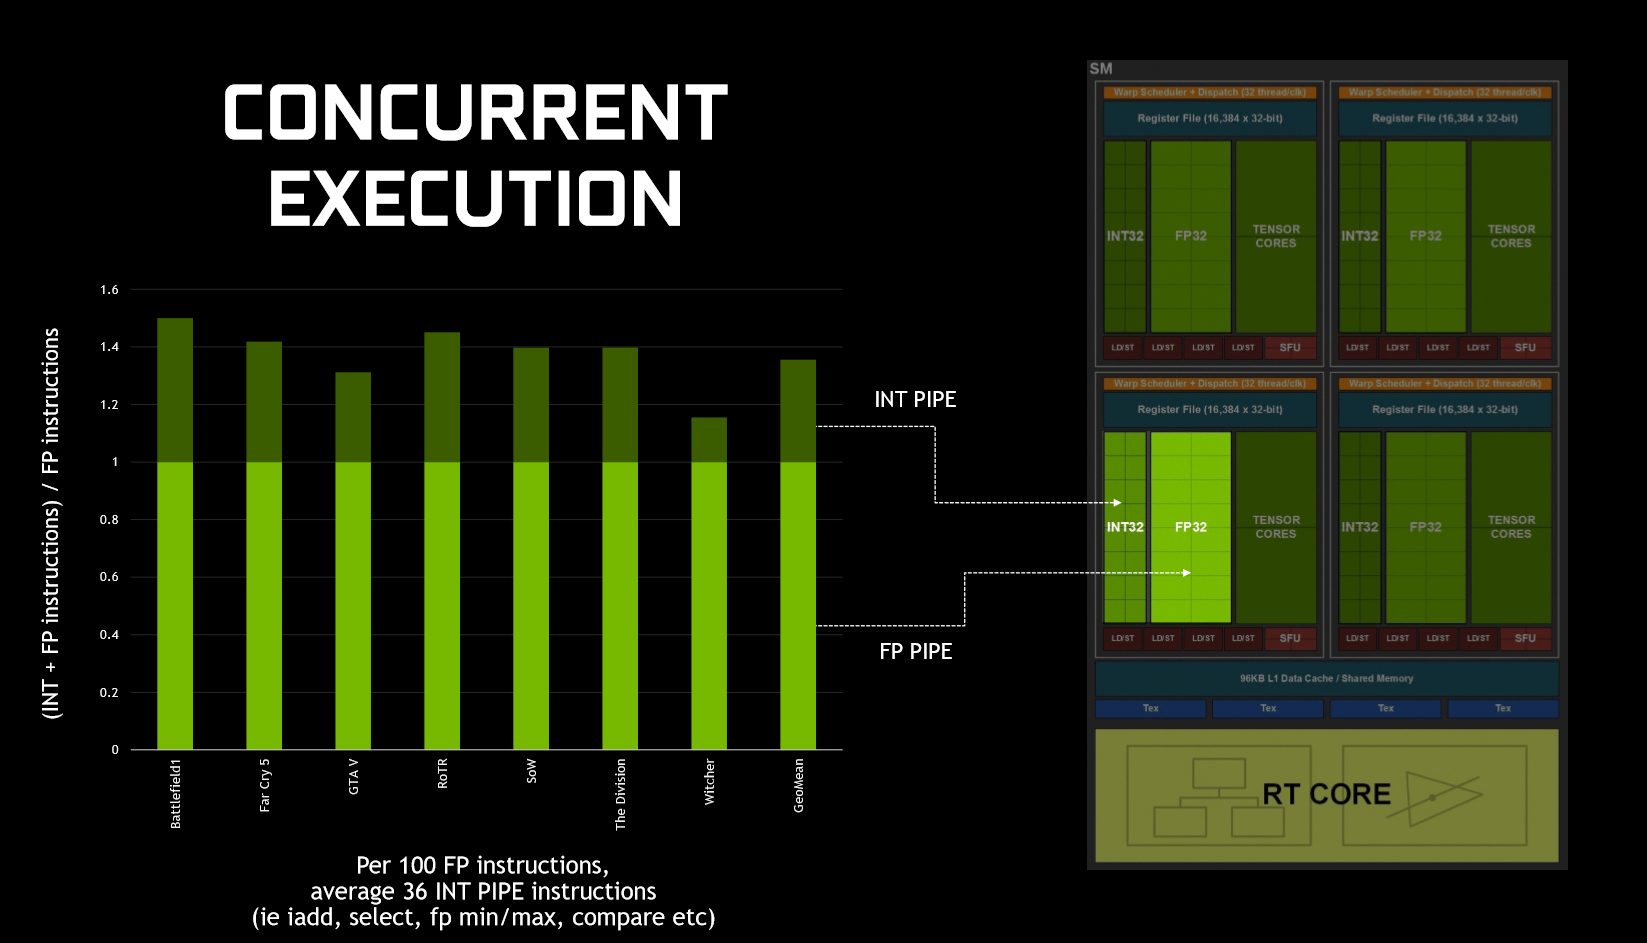
What makes Turing significant for today's games, is how it executes datapaths. That's because, in game, GPUs typically execute both floating point (FP) arithmetic instructions, as well as simpler integer instructions. To demonstrate this, Nvidia claims that we ‘see about 36 additional integer pipe instructions for every 100 floating point instructions', although this figure will vary depending on what application/game you run.
Previous architectures – like Pascal – could not run both FP and integer instructions simultaneously – integer instructions would instead force the FP datapath to sit idle. As we've already mentioned, however, Turing includes FP and integer cores within the same SM, and this means the GPU can execute integer instructions alongside (in parallel with) the FP maths.
In a nutshell, this should mean noticeably better performance while gaming as FP and integer instructions can be executed in parallel, when previously integer instructions stopped FP instructions executing.
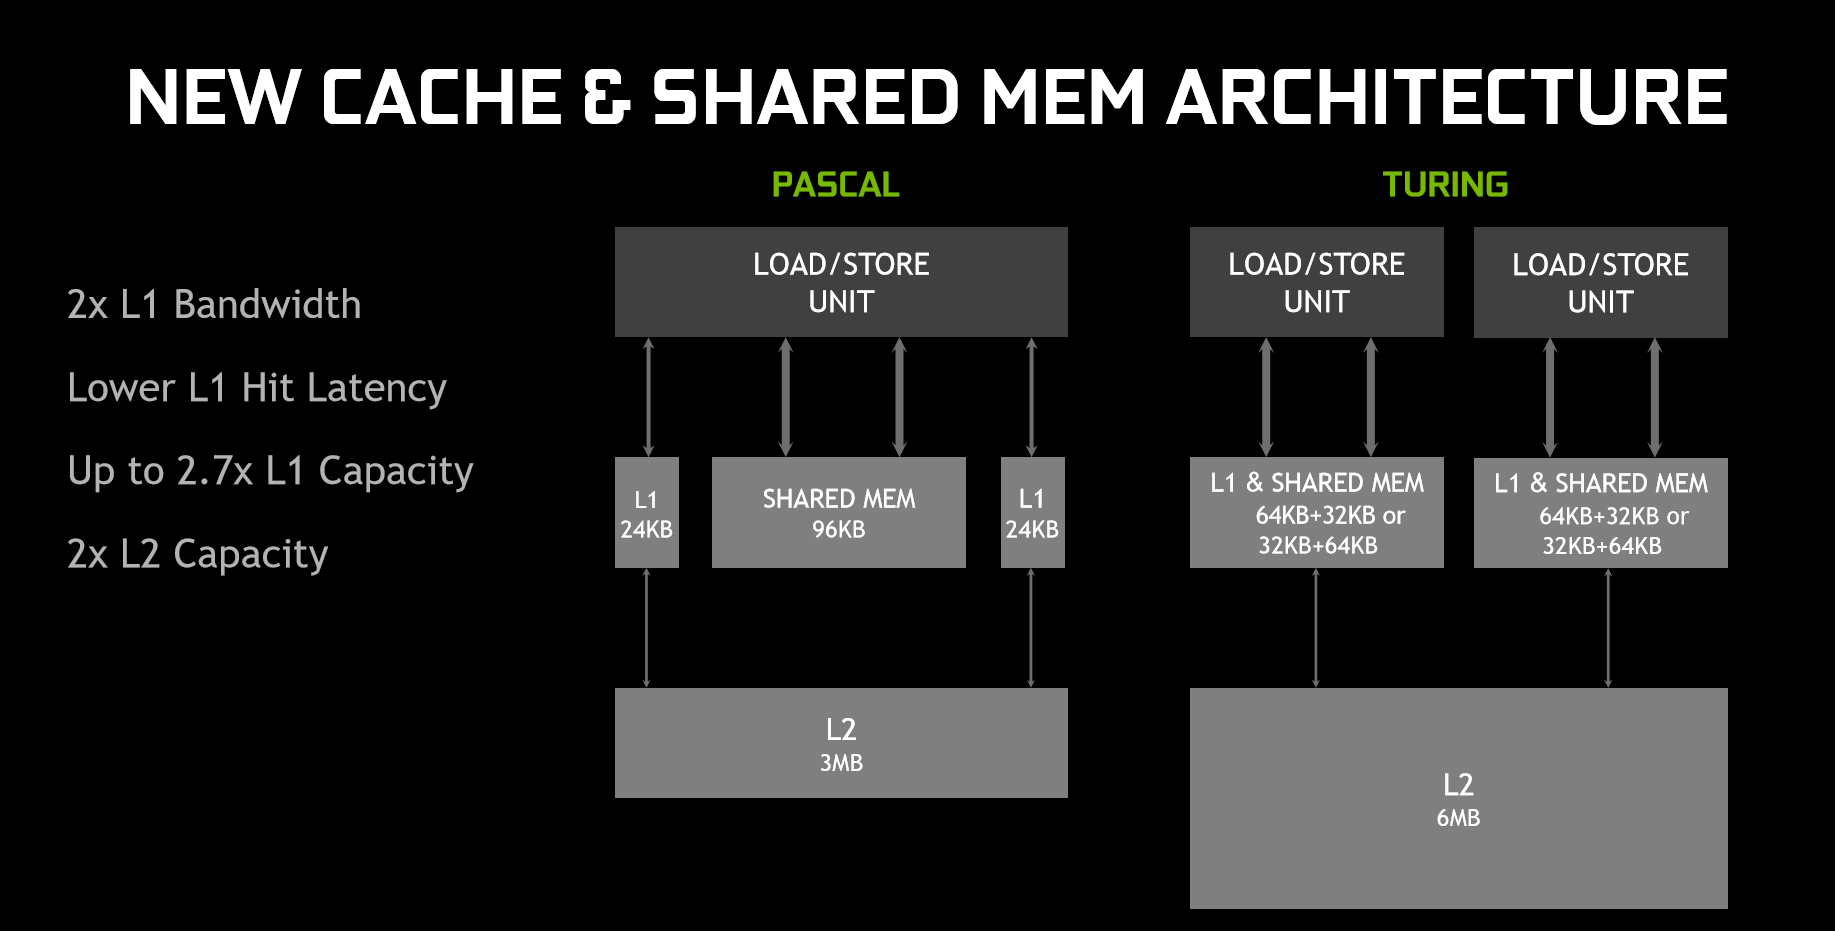
On top of that, Turing has also rejigged the memory architecture. In essence, the memory architecture is now unified, meaning the L1 (level 1) cache can ‘leverage resources', leading to twice the bandwidth per Texture Processing Cluster (TPC) when compared to Pascal. Memory can even be reconfigured when shared memory is not utilising its full capacity – for instance, L1 memory can expand/reduce to 64KB or 32KB respectively, with the former allowing less shared memory per SM, while the latter allows for more shared memory.
In sum, Nvidia claims the memory and parallel execution improvements equates to 50% improved performance per CUDA core (versus Pascal.) For real-world performance gains, this review will obviously document that later.
GDDR6
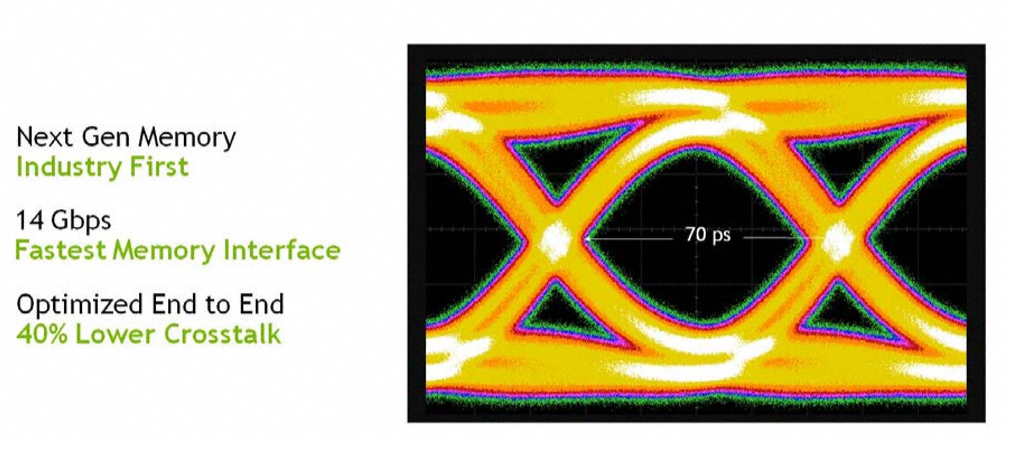
New with Turing is also GDDR6 memory – the first time such VRAM has ever been used with a GPU. With GDDR6, all three Turing GPUs can deliver 14 Gbps signalling rates, despite power efficiency improving 20% over GDDR5X (which was used with GTX 1080 and 1080 Ti). This also required Nvidia to re-work the memory sub-system, resulting in multiple improvements including a claimed 40% reduction in signal crosstalk.
Alongside this, Turing has built on Pascal's memory compression algorithms, which actually further improves memory bandwidth beyond the speeds that moving to GDDR6 itself brings. Nvidia claims this compression (or traffic reduction) as well as the speed benefit of moving to GDDR6, results in 50% higher effective bandwidth compared to Pascal.
NVLink
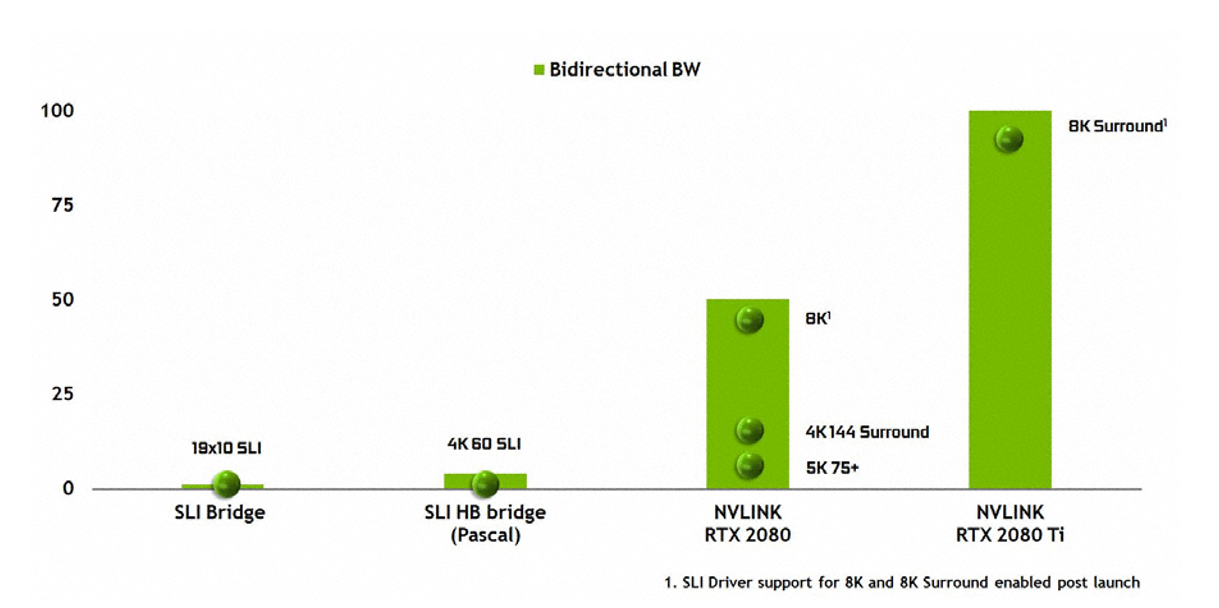
The last change to discuss here is NVLink. As we noted in our unboxing video, the traditional SLI finger has changed. Previous Nvidia GPUs used a Multiple Input/Output (MIO) interface with SLI, whereas Turing (TU102 and TU104 only) uses NVLink instead of MIO, while GPU-to-GPU data transfers use the PCIe interface.
TU102 provides two x8 second-gen NVLinks, while TU104 provides just one. Each link provides 50GB/sec bidirectional bandwidth (or 25GB/sec per direction), so TU102 will provide up to 100GB/sec bidirectionally.
Nvidia did not provide an exact figure of bandwidth for SLI used with Pascal GPUs, but from the graph above NVLink clearly provides a huge boost to bandwidth figures. It will be fascinating to test this with games in the near future.
Do remember, though, that NVLink is only supported with TU102 and TU104 – RTX 2080 Ti and RTX 2080 – so RTX 2070 buyers will not be able to take advantage of this technology.
Ray tracing and RT cores
When the GeForce 20 series was announced, almost the entire presentation was dedicated to ray tracing. How do the new GPUs do what even the GTX 1080 Ti cannot?
The secret lies with the new RT (ray tracing) cores. As mentioned, each SM features one RT core – RTX 2080 Ti has 68, and RTX 2080 has 46. These cores work together with denoising techniques, Bounding Volume Hierarchy (BVH) and compatible APIs (DXR and even Vulkan) to achieve real-time ray tracing on each Turing GPU.
As Nvidia puts its, ‘RT Cores traverse the BVH autonomously, and by accelerating traversal and ray/triangle intersection tests, they offload the SM, allowing it to handle other vertex, pixel, and compute shading work. Functions such as BVH building and refitting are handled by the driver, and ray generation and shading is managed by the application through new types of shaders.'
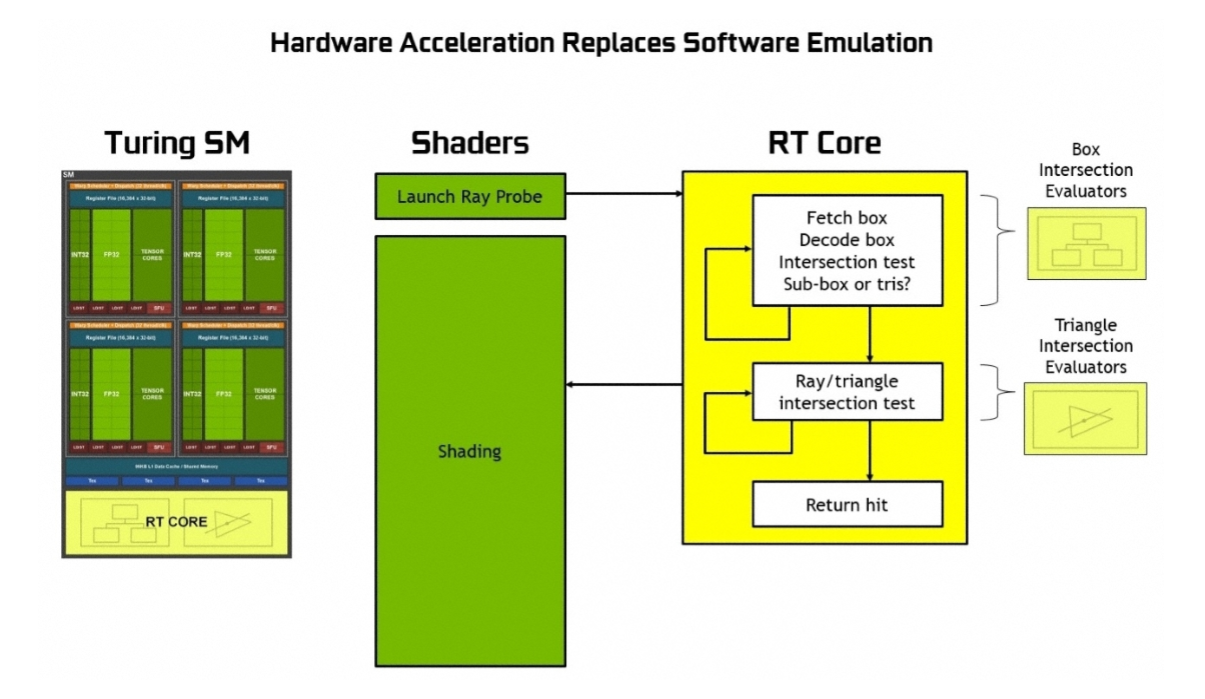
Without dedicated ray tracing hardware (i.e. Turing GPUs), each ray can only be traced using thousands of software instruction slots, which test bounding boxes within the BVH structure, until a triangle is hit – which is still only a possibility. The end result is, without dedicated RT hardware, the effort is so demanding that it couldn't be done in real-time. Instead, RT cores can be used to prevent the SM from expending thousands of instruction slots, thus significantly lessening the workload.
Each RT core is also made up of two units. One does the box bounding tests, while the other handles ray-triangle intersection tests. All the SM has to do is launch the ray probe, and the RT cores will handle the rest of the work to actually test if there has been a hit or not – data which is then returned to the SM.
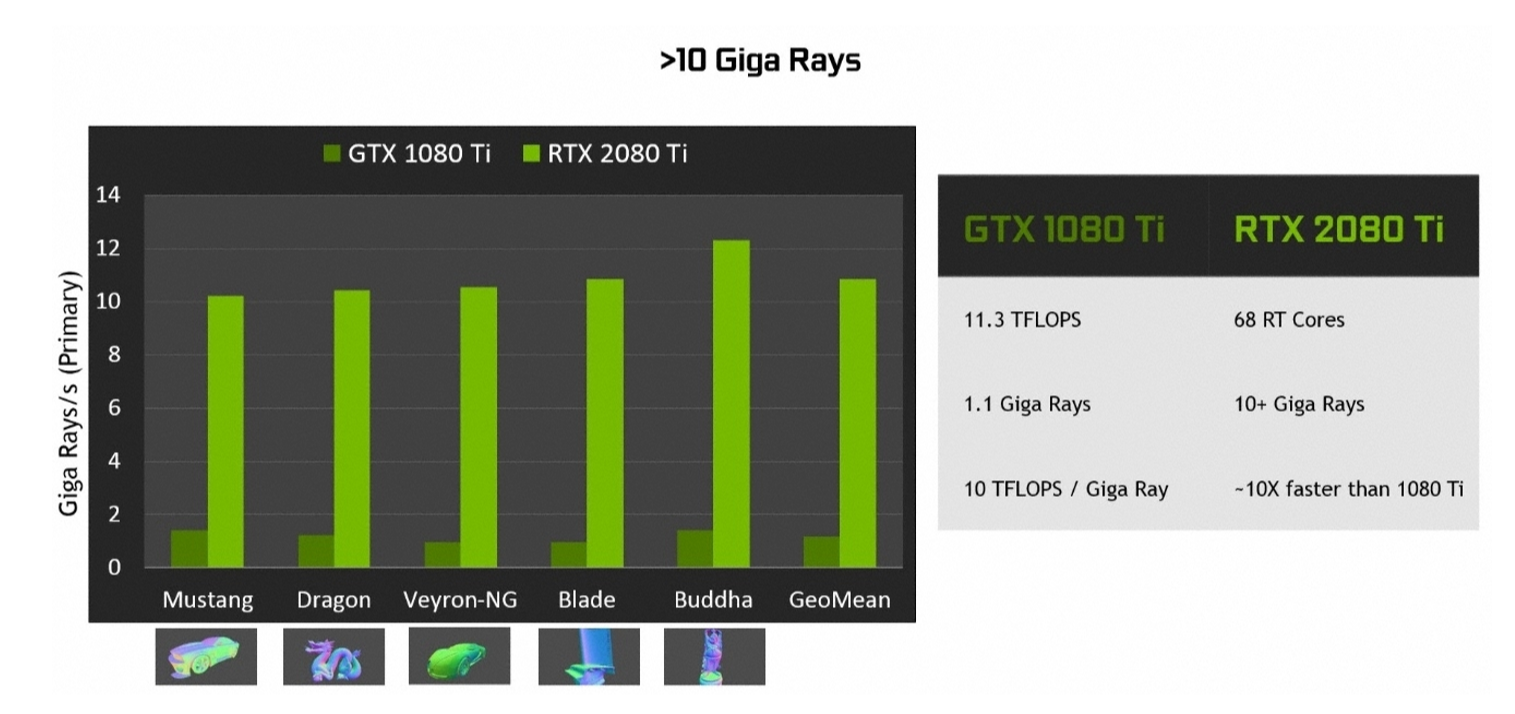
The end result is a GPU that can run real-time ray tracing 10 times faster than Pascal – as demonstrated by the amount of Giga Rays per second that can be calculated: 1.1 Giga Rays per second for the GTX 1080 Ti, but 10 Giga Rays per second for the RTX 2080 Ti.
Ray tracing and gaming
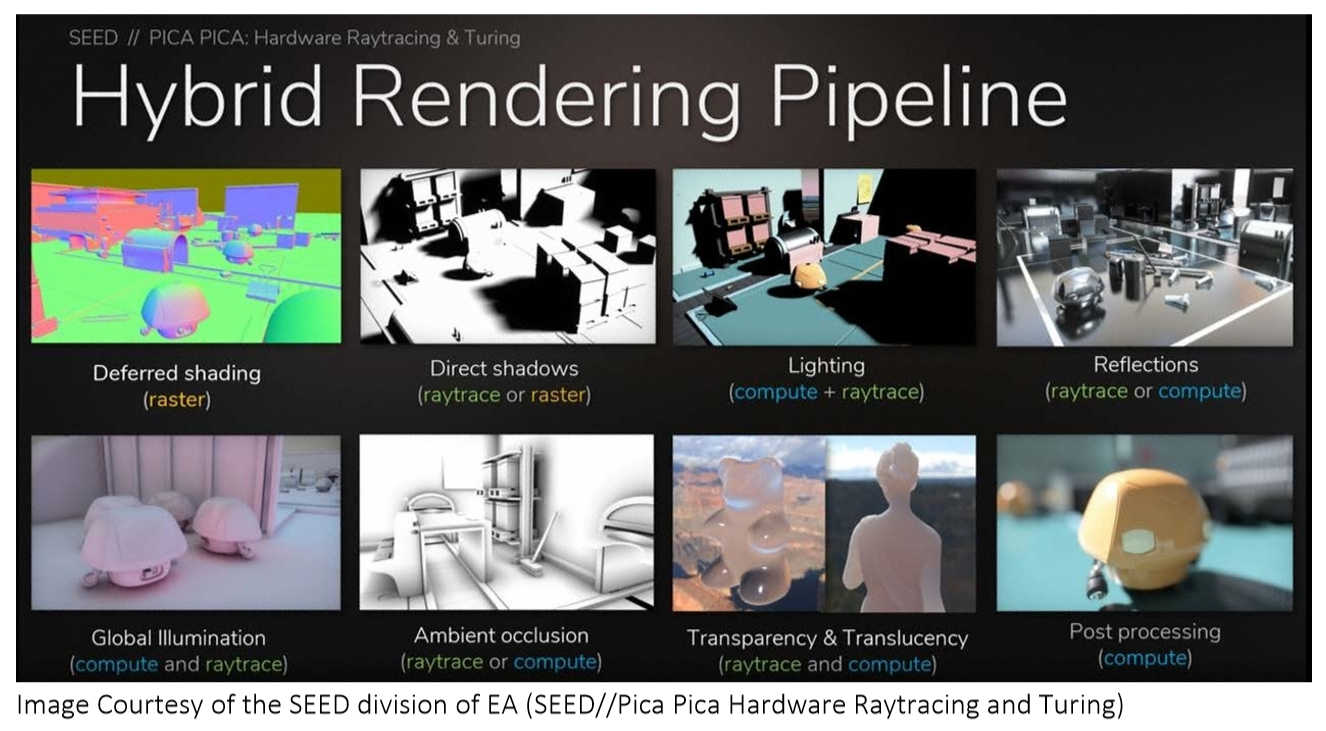
Speaking now about gaming, the RT cores should allow for real-time ray tracing to be built into games. For this aspect, Nvidia isn't yet pushing global ray tracing in games (where all light is as a result of ray tracing). Instead, the company is pushing hybrid rendering – which combines ray tracing with rasterisation, the latter being the rendering technique games currently use.
This can be demonstrated with Shadow of the Tomb Raider, a game that was demoed at the RTX launch event in Germany. This game will use the hybrid method, utilising ray tracing for the portrayal of shadows in-game. While we can't test any fully ray traced games at this point – because they don't exist, and we still need DXR – using ray tracing exclusively is almost certainly going to be too demanding, even for Turing GPUs.
So we expect to see developers pick and choose how ray tracing is used within games. Nvidia says it should be used where there is ‘most visual benefit', like when ‘rendering reflections, refractions, and shadows'.
At the moment, a list of games that will support ray tracing includes:
- Assetto Corsa Competizione from Kunos Simulazioni / 505 Games
- Atomic Heart from Mundfish
- Battlefield V from EA / DICE
- Control from Remedy Entertainment / 505 Games
- Enlisted from Gaijin Entertainment / Darkflow Software
- MechWarrior 5: Mercenaries from Piranha Games
- Metro Exodus f rom 4A Games
- Shadow of the Tomb Raider from Square Enix / Eidos-Montréal / Crystal Dynamics / Nixxes
- Justice (Ni Shui Han) from NetEase 10. JX3 from Kingsoft
Tensor Cores and DLSS
The Turing architecture also houses what is known as a Tensor Core – another feature first introduced with the Volta GV100. These add ‘INT8 and INT4 precision modes for inferencing workloads that can tolerate quantization.'
What the Tensor Cores do, though, is harness the power of deep learning for the purposes of gaming. They do this by accelerating certain aspects of Nvidia's NGX Neural Services in order to improve graphics, visual fidelity and rendering. For gaming this is primarily achieved via Deep Learning Super Sampling, or DLSS.
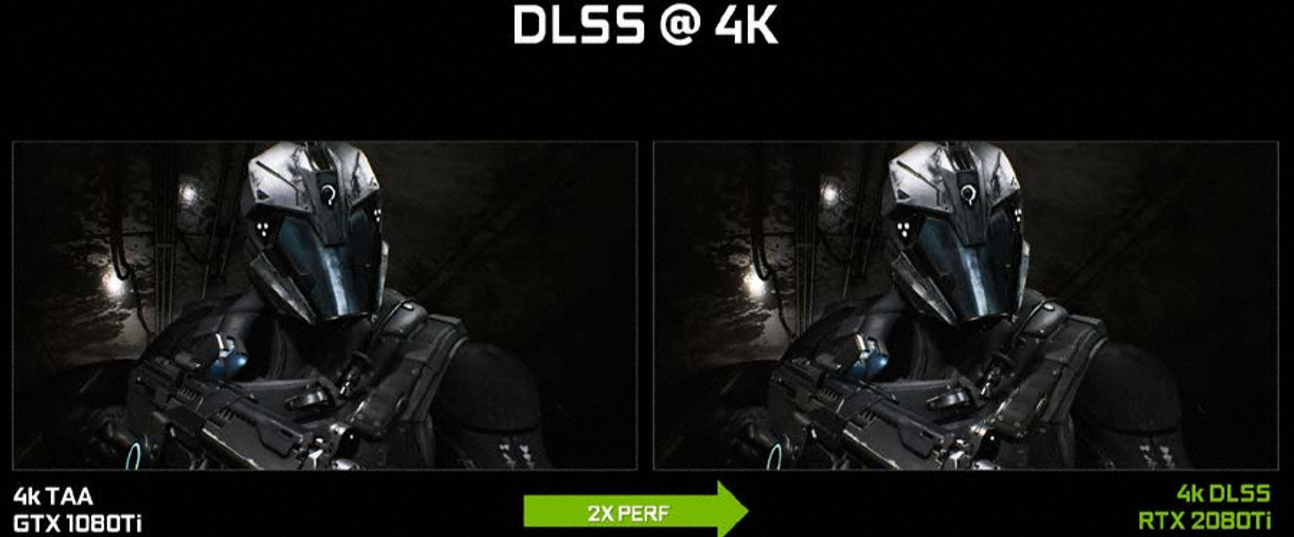
This is a new method of anti aliasing that aims to provide similar visual fidelity to TAA (temporal anti aliasing) but with significantly less performance cost. This is because, where TAA renders at your set resolution, DLSS can render faster with a lower input sample count, but then infers (upscales) the result at your set resolution – which Nvidia claims results in similar visual fidelity, but with half of the shading work.
Obviously that sounds great, but how is it achieved? That's where we circle back to the deep learning element of the Tensor Cores. Nvidia says it is the ‘training' element of the neural network which is key, where the DLSS network is asked to match thousands of high quality images (rendered with 64x supersampling). Through a back-and-forth process named ‘back propagation' this network eventually learns to produce results which resemble the quality of the 64x supersampled images while getting rid of any blurring that may have been introduced from TAA.
In a nutshell – Turing GPUs only need half the amount of samples (compared to TAA, for instance) for rendering and instead use AI and their Tensor Cores to provide the missing information and create the final image.
Now, because the network needs to be trained in regards to different scenes, games do need to specifically support DLSS, although Nvidia claims it is ‘an easy integration' for game devs. We currently have a list of 25 games that will support DLSS upon release:
- Ark: Survival Evolved from Studio Wildcard
- Atomic Heart from Mundfish
- Dauntless from Phoenix Labs
- Final Fantasy XV from Square Enix
- Fractured Lands from Unbroken Studios
- Hitman 2 from IO Interactive/Warner Bros.
- Islands of Nyne: Battle Royale from Define Human Studios
- Justice (Ni Shui Han) from NetEase
- JX3 from Kingsoft
- Mechwarrior 5: Mercenaries from Piranha Games
- PlayerUnknown’s Battlegrounds from PUBG Corp.
- Remnant: From the Ashes from Gunfire Games/Perfect World Entertainment
- Serious Sam 4: Planet Badass from Croteam/Devolver Digital
- Shadow of the Tomb Raider from Square Enix/Eidos-Montréal/Crystal Dynamics/Nixxes
- The Forge Arena from Freezing Raccoon Studios
- We Happy Few from Compulsion Games / Gearbox
- Darksiders 3 by Gunfire Games/THQ Nordic
- Deliver Us The Moon: Fortuna by KeokeN Interactive
- Fear the Wolves by Vostok Games / Focus Home Interactive
- Hellblade: Senua's Sacrifice by Ninja Theory
- KINETIK by Hero Machine Studios
- Outpost Zero by Symmetric Games / tinyBuild Games
- Overkill's The Walking Dead by Overkill Software / Starbreeze Studios
- SCUM by Gamepires / Devolver Digital
- Stormdivers by Housemarque
That does mean we can't test DLSS today with any current games, but we have been able to test a demo of FFXV provided early to press. More on that later in the review.
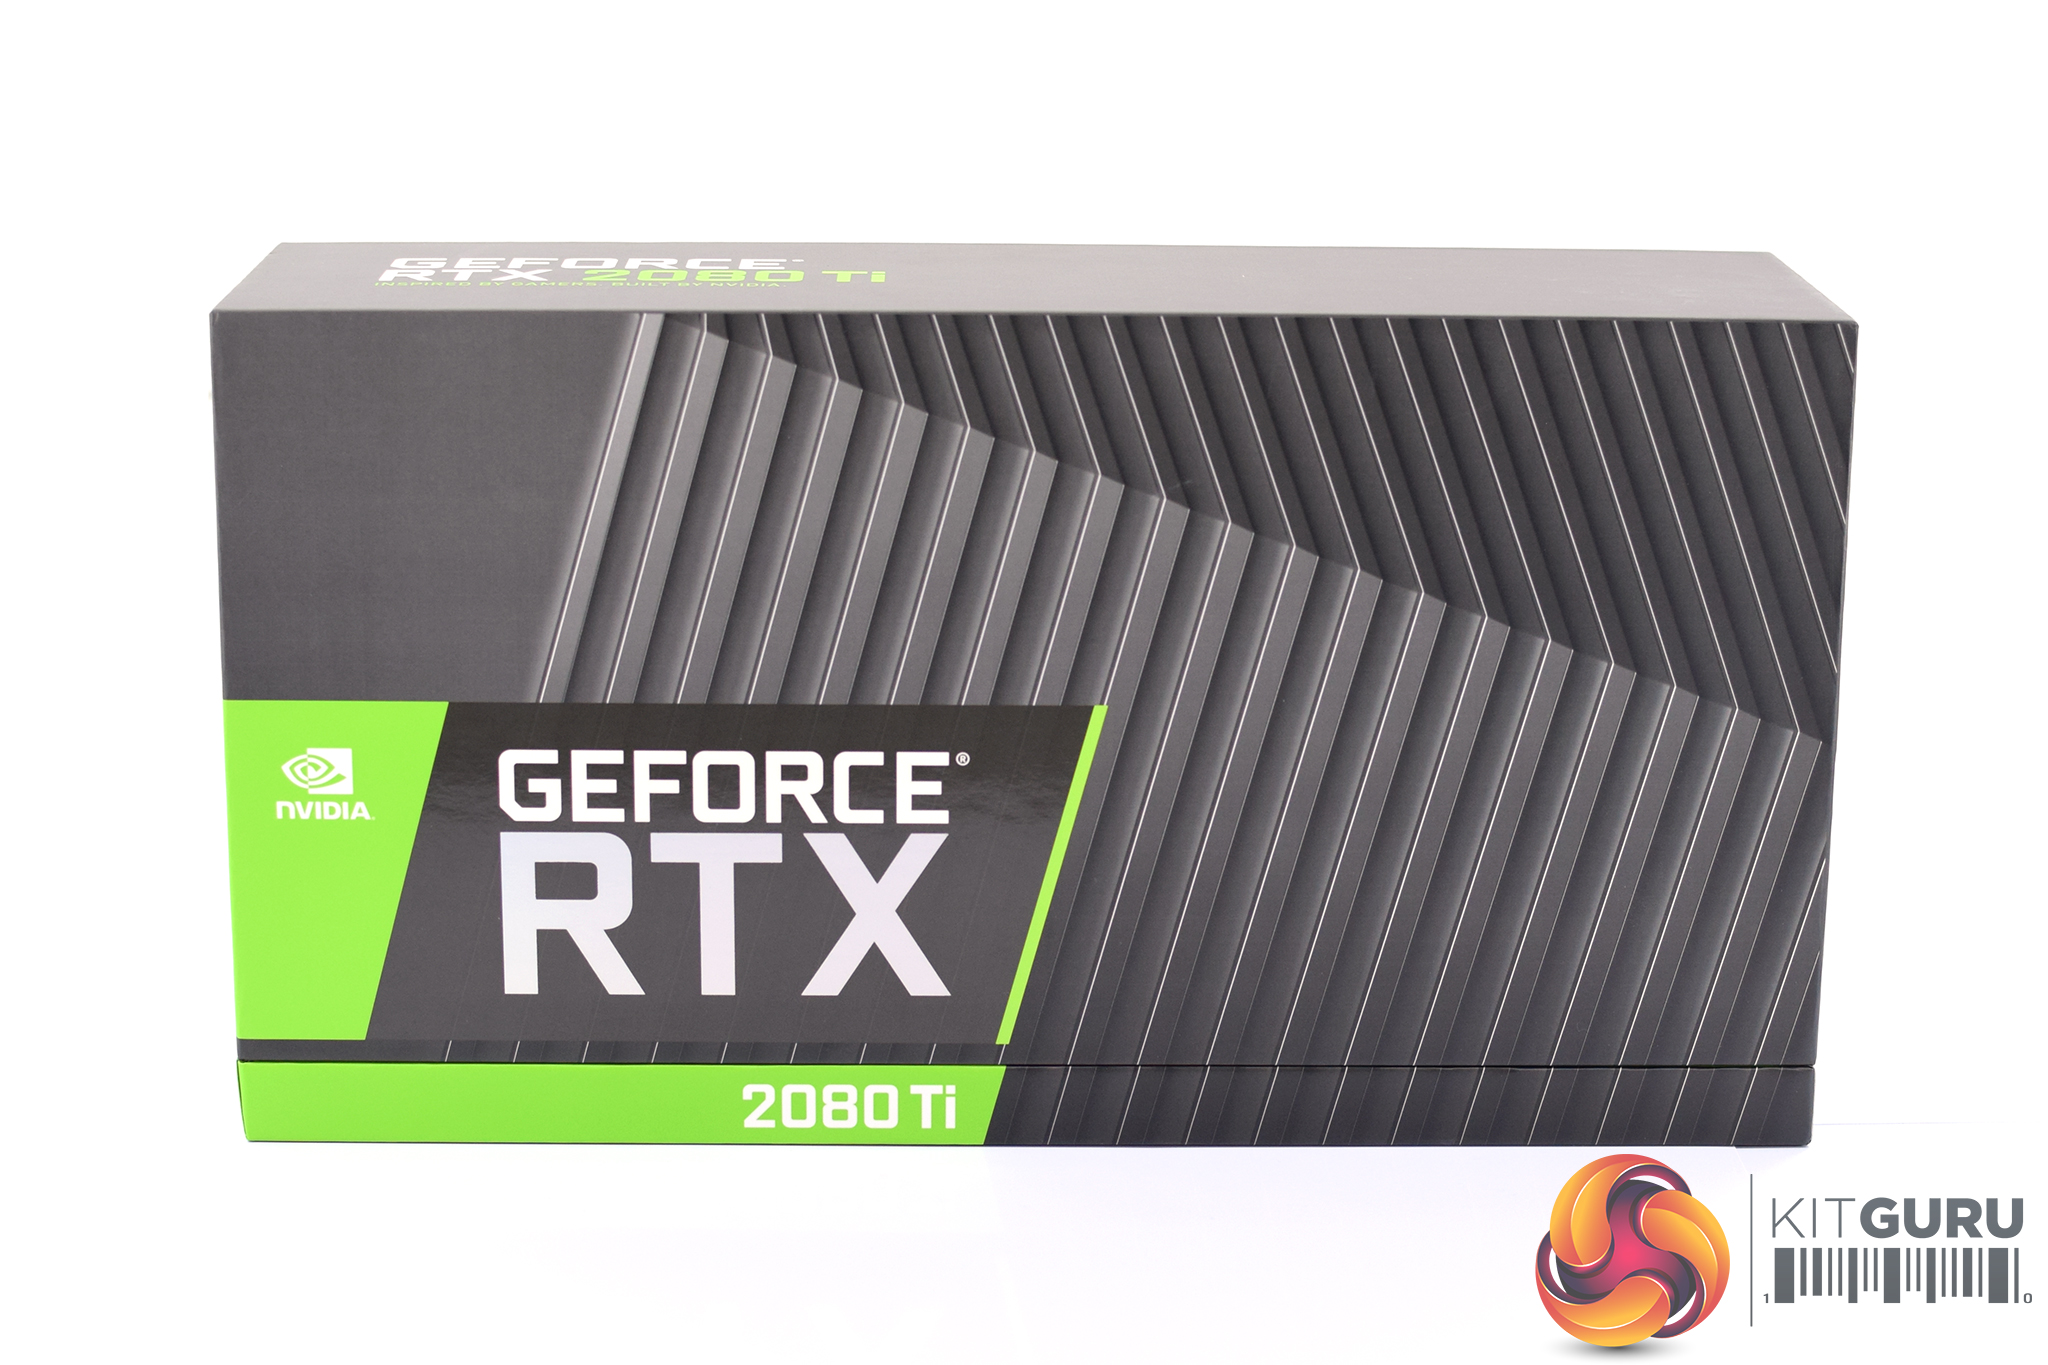
The Nvidia RTX 2080 Ti Founders Edition ships in the same style of box we have seen from previous Nvidia reference cards – it's compact, with prominent RTX branding on the front of the box, while there are also the unmistakable Nvidia green accents as well.
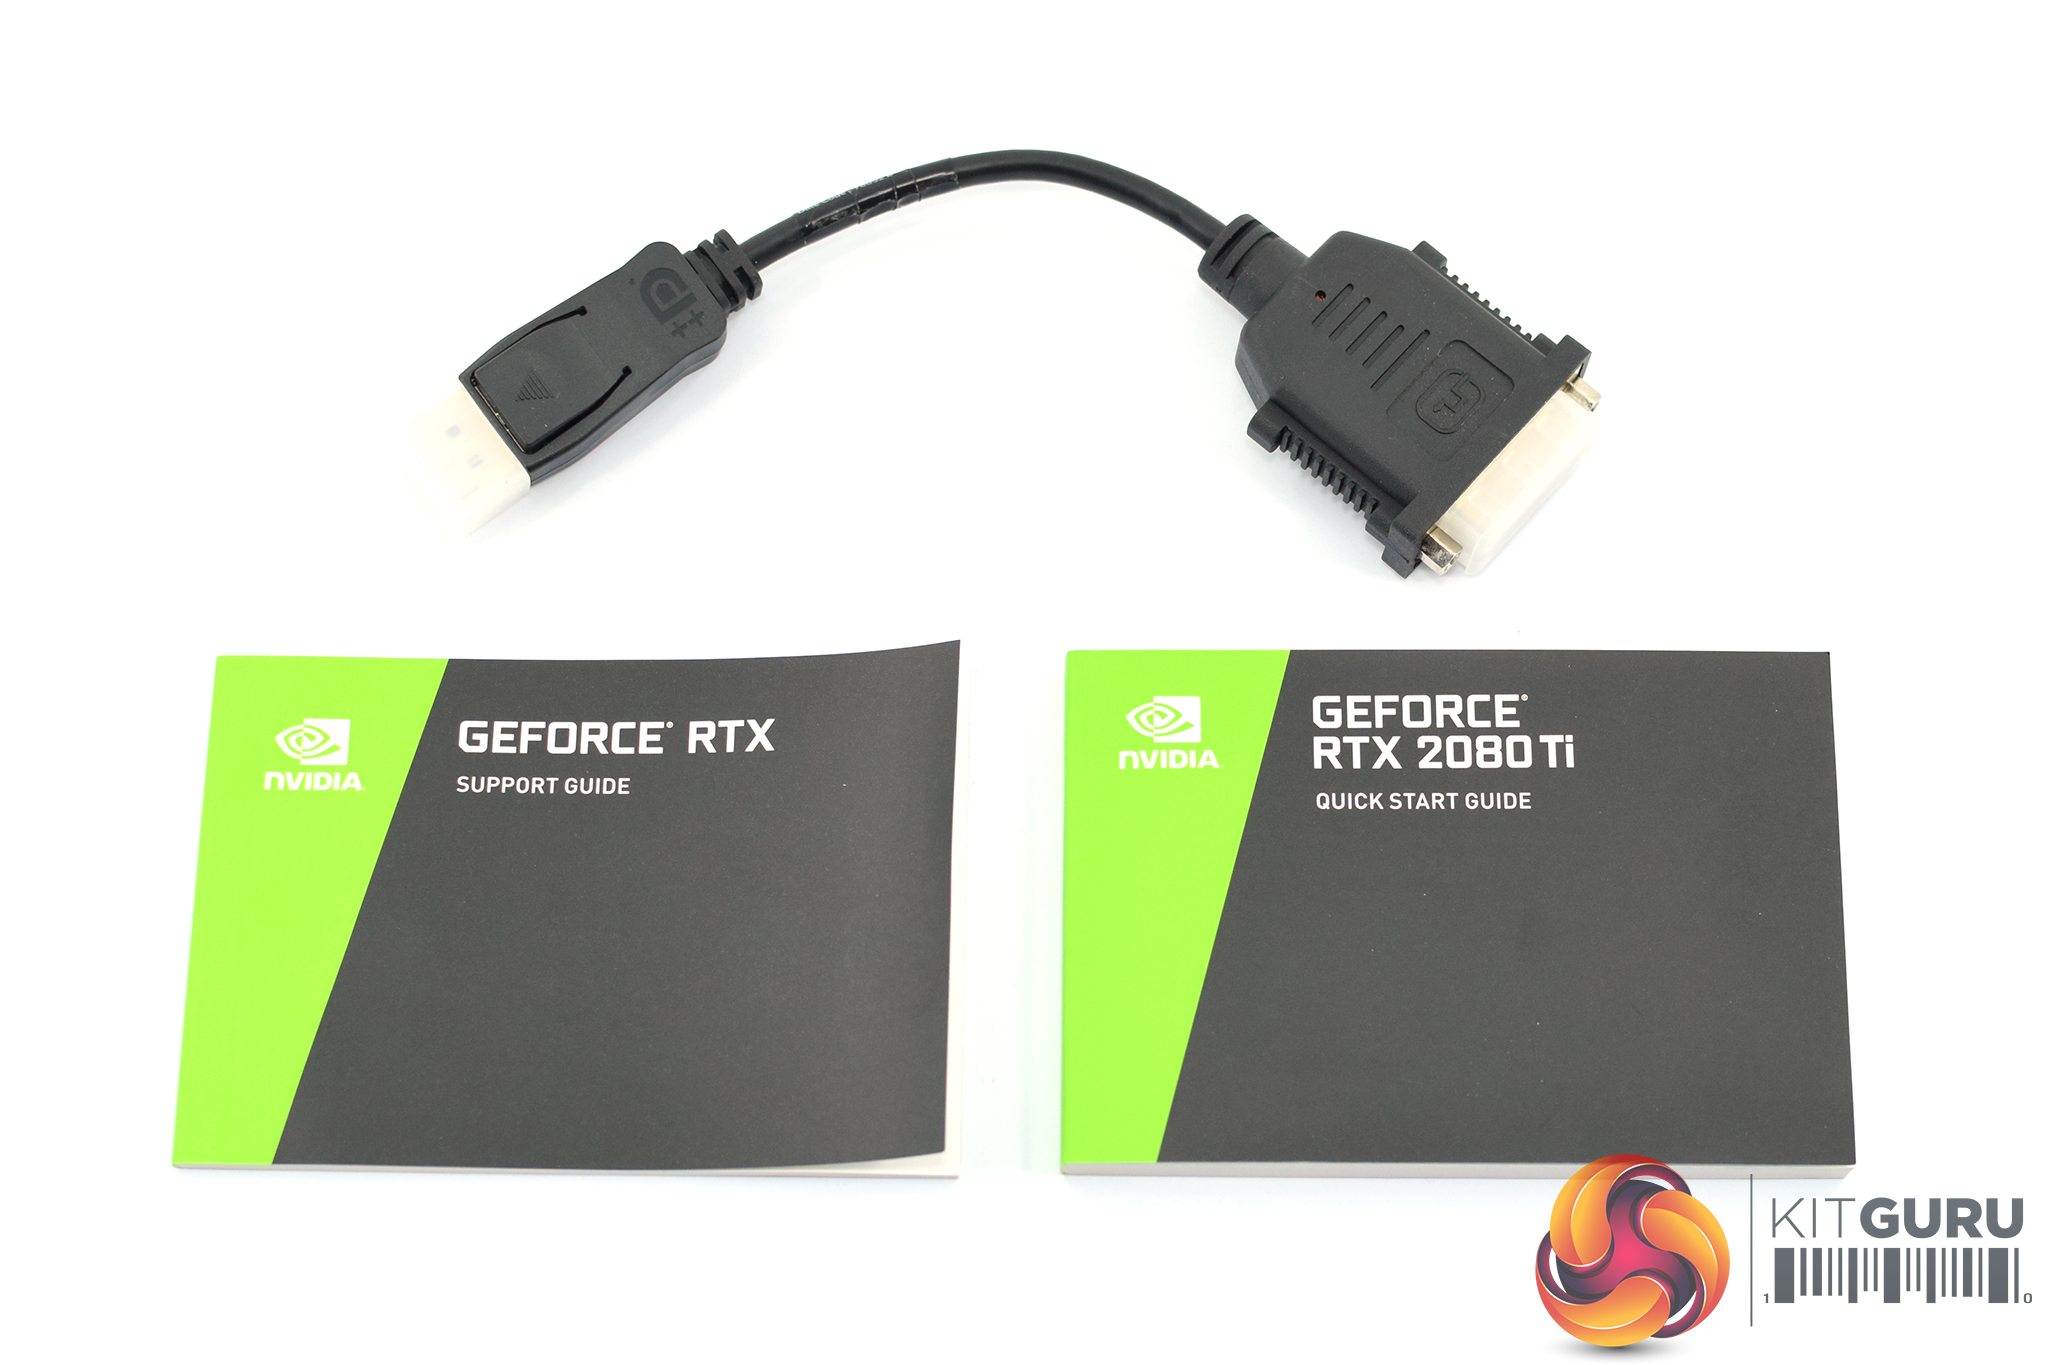
Inside the box, we don't get much in the way of accessories. One support guide, one quick start guide, and one DisplayPort to DVI adapter is all that is included – but it is the card we are interested in.
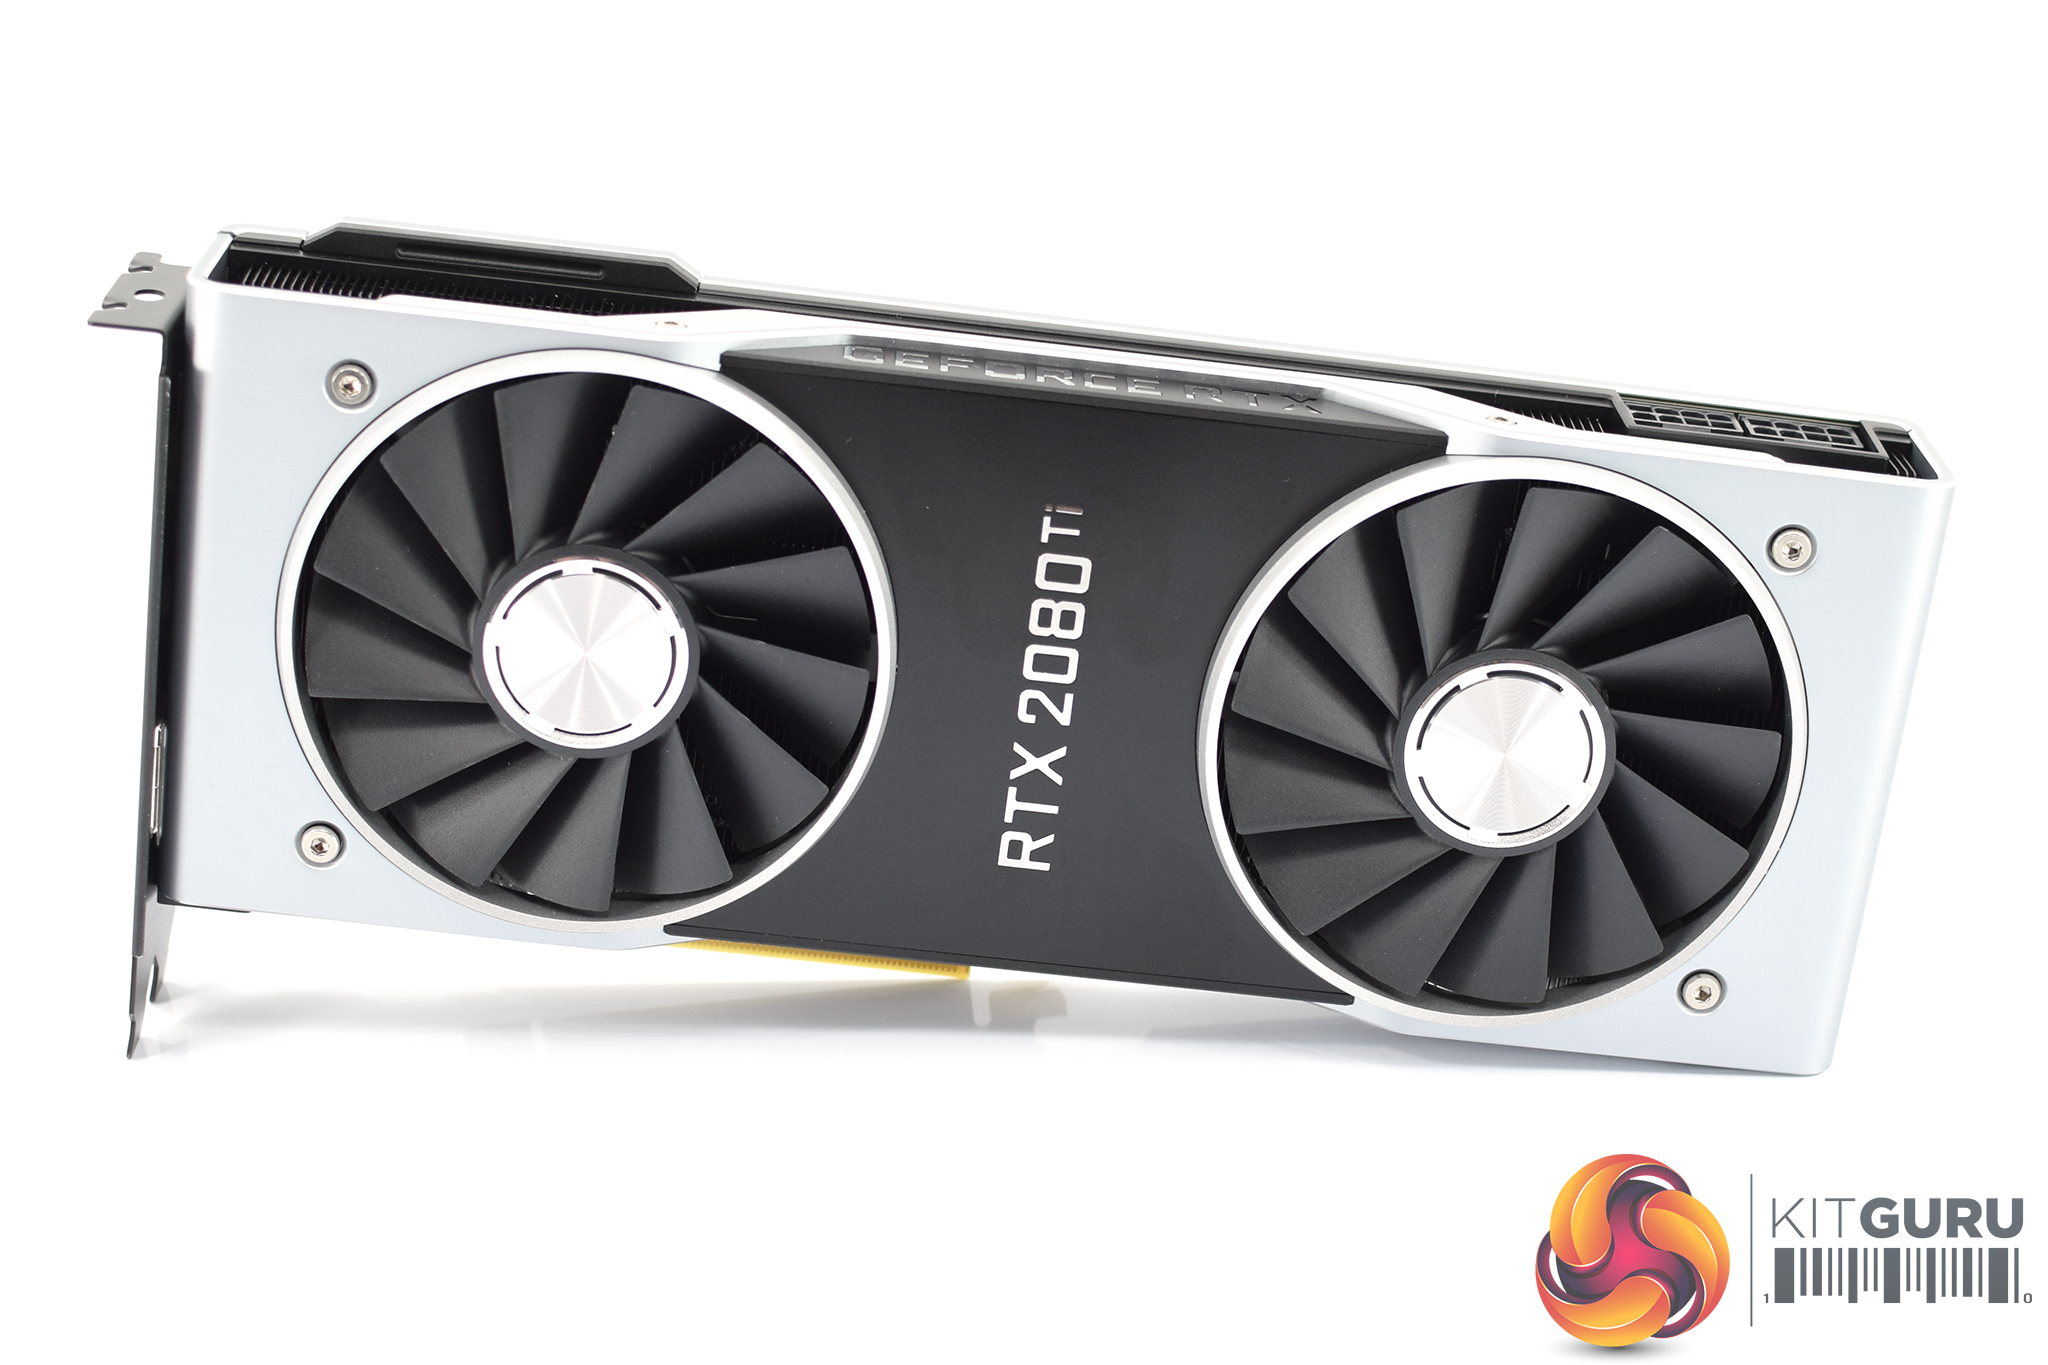
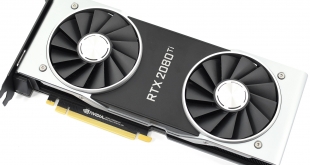
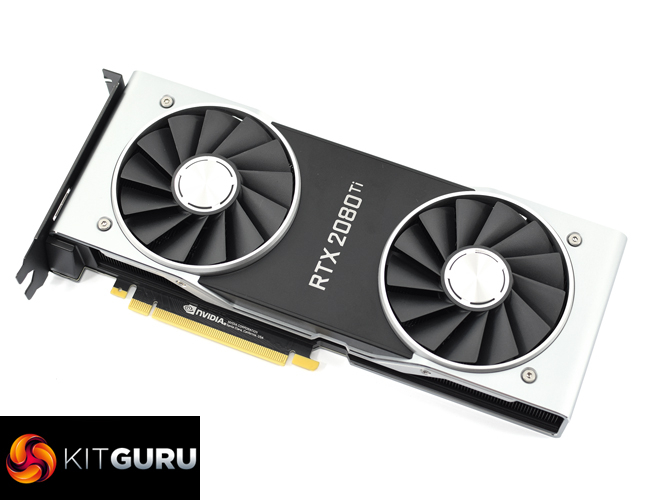
Sporting a near identical design to the RTX 2080 (the only differences being the logos and power connectors), The RTX 2080 Ti Founders Edition really is a stunning card.
Not only is it manufactured from machine-finished aluminium which gives it an incredibly premium feel, but it has also ditched the blower-style cooling setup of previous reference cards. Instead, we find dual axial fans that look similar to the ASUS Strix fans found on their GTX 10 series cards. These fans measure 90mm in diameter, with 13 blades per fan. Each fan is also powered by a three-phase motor which Nvidia says helps to reduce unwanted noise from vibrations.
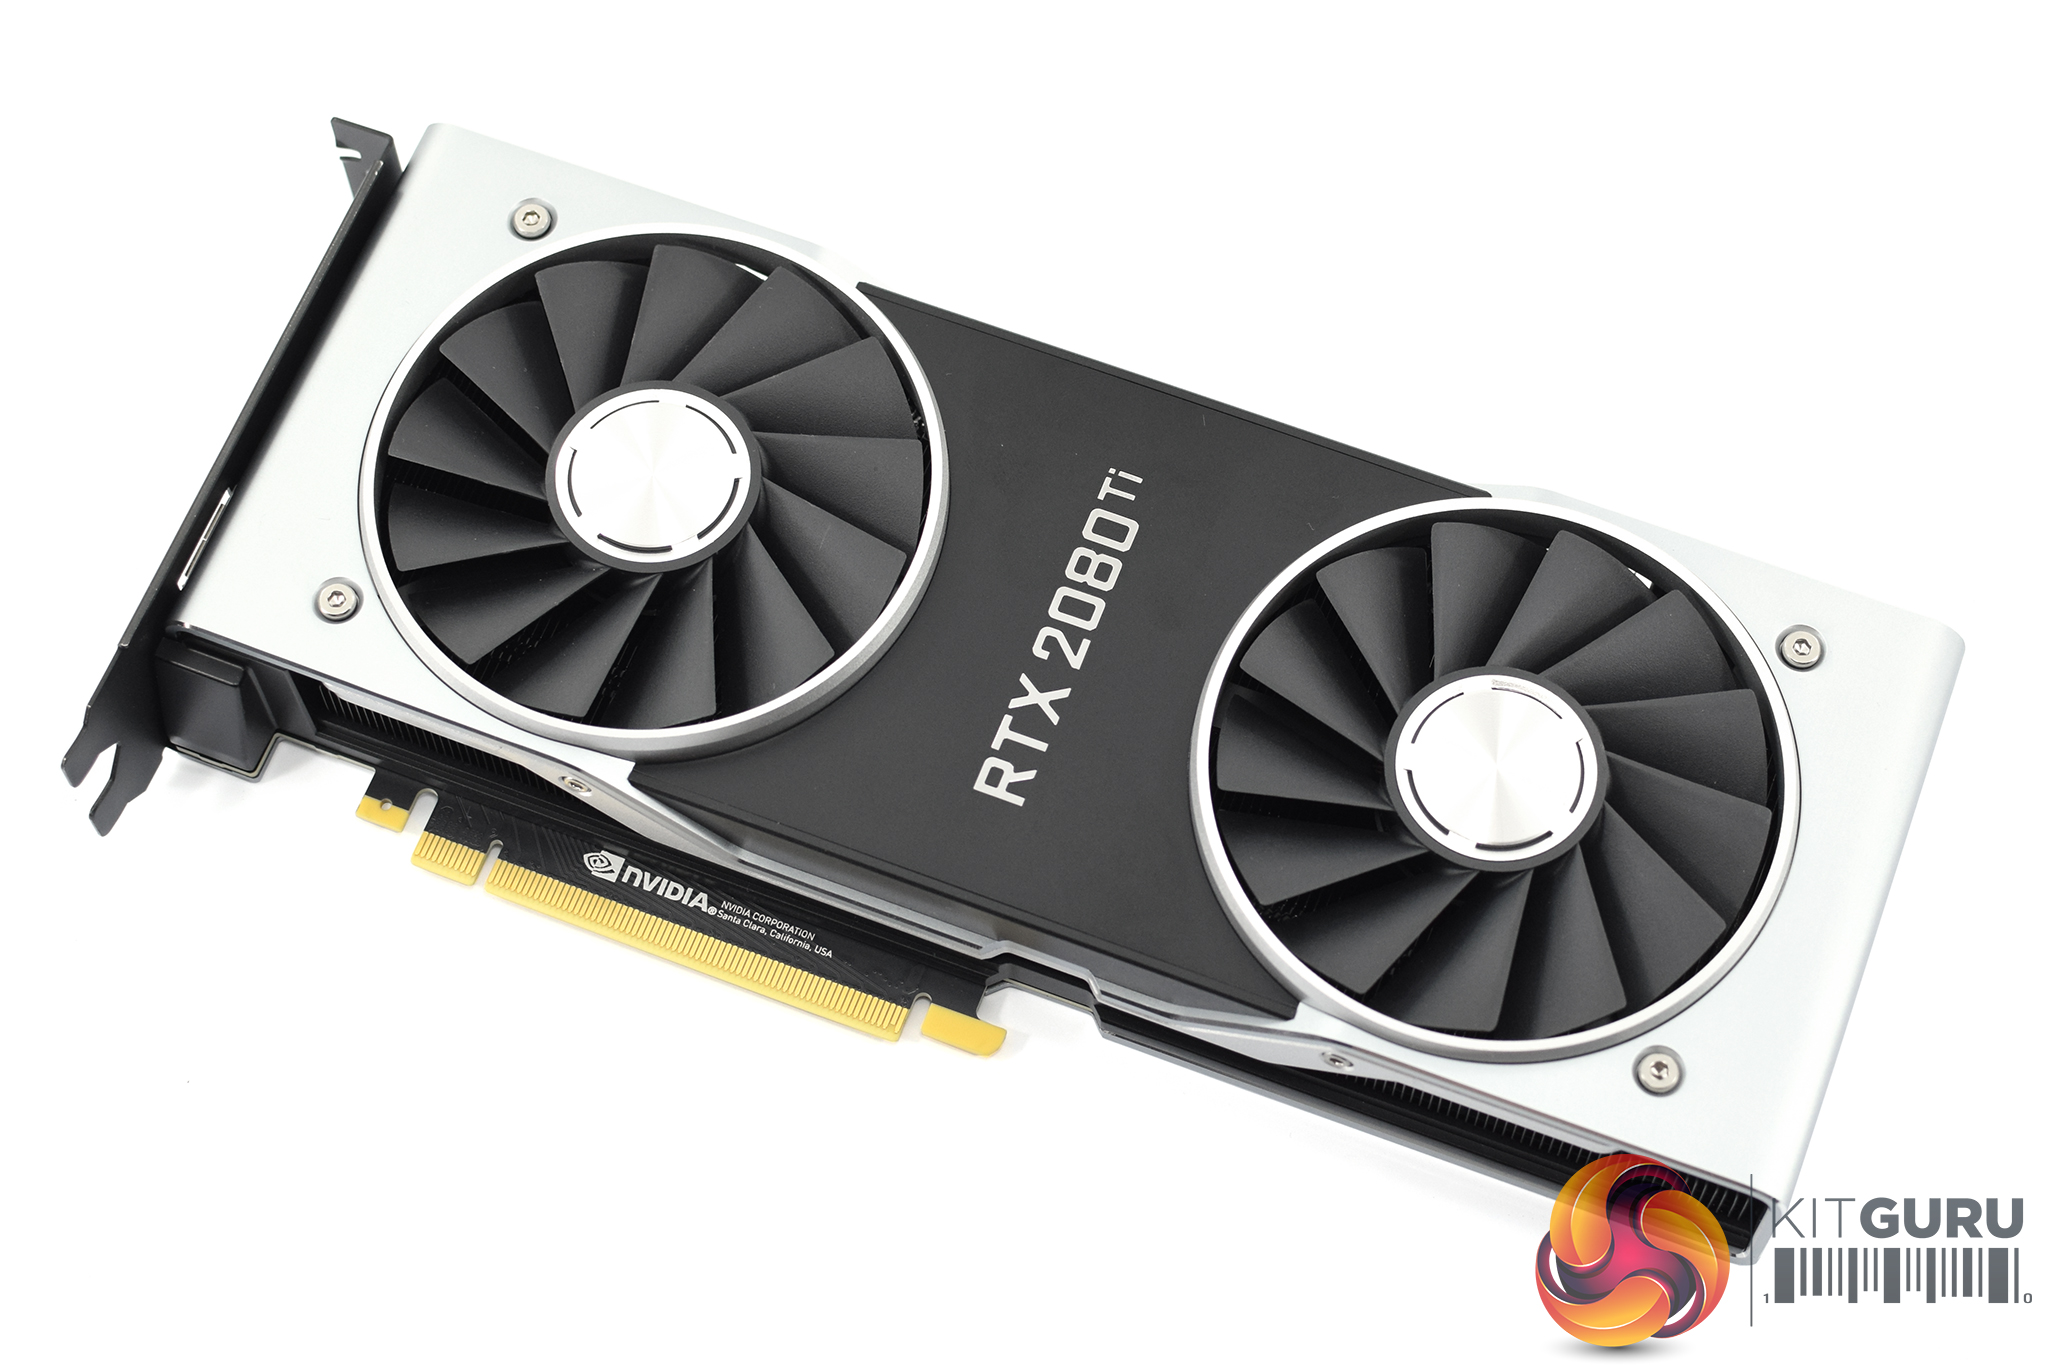
Taking the card as a whole, it measures 266.74mm long and 115.7mm high. Unlike many aftermarket card manufacturers, who are making thicker and thicker cards, this Founders Edition remains a 2-slot card.
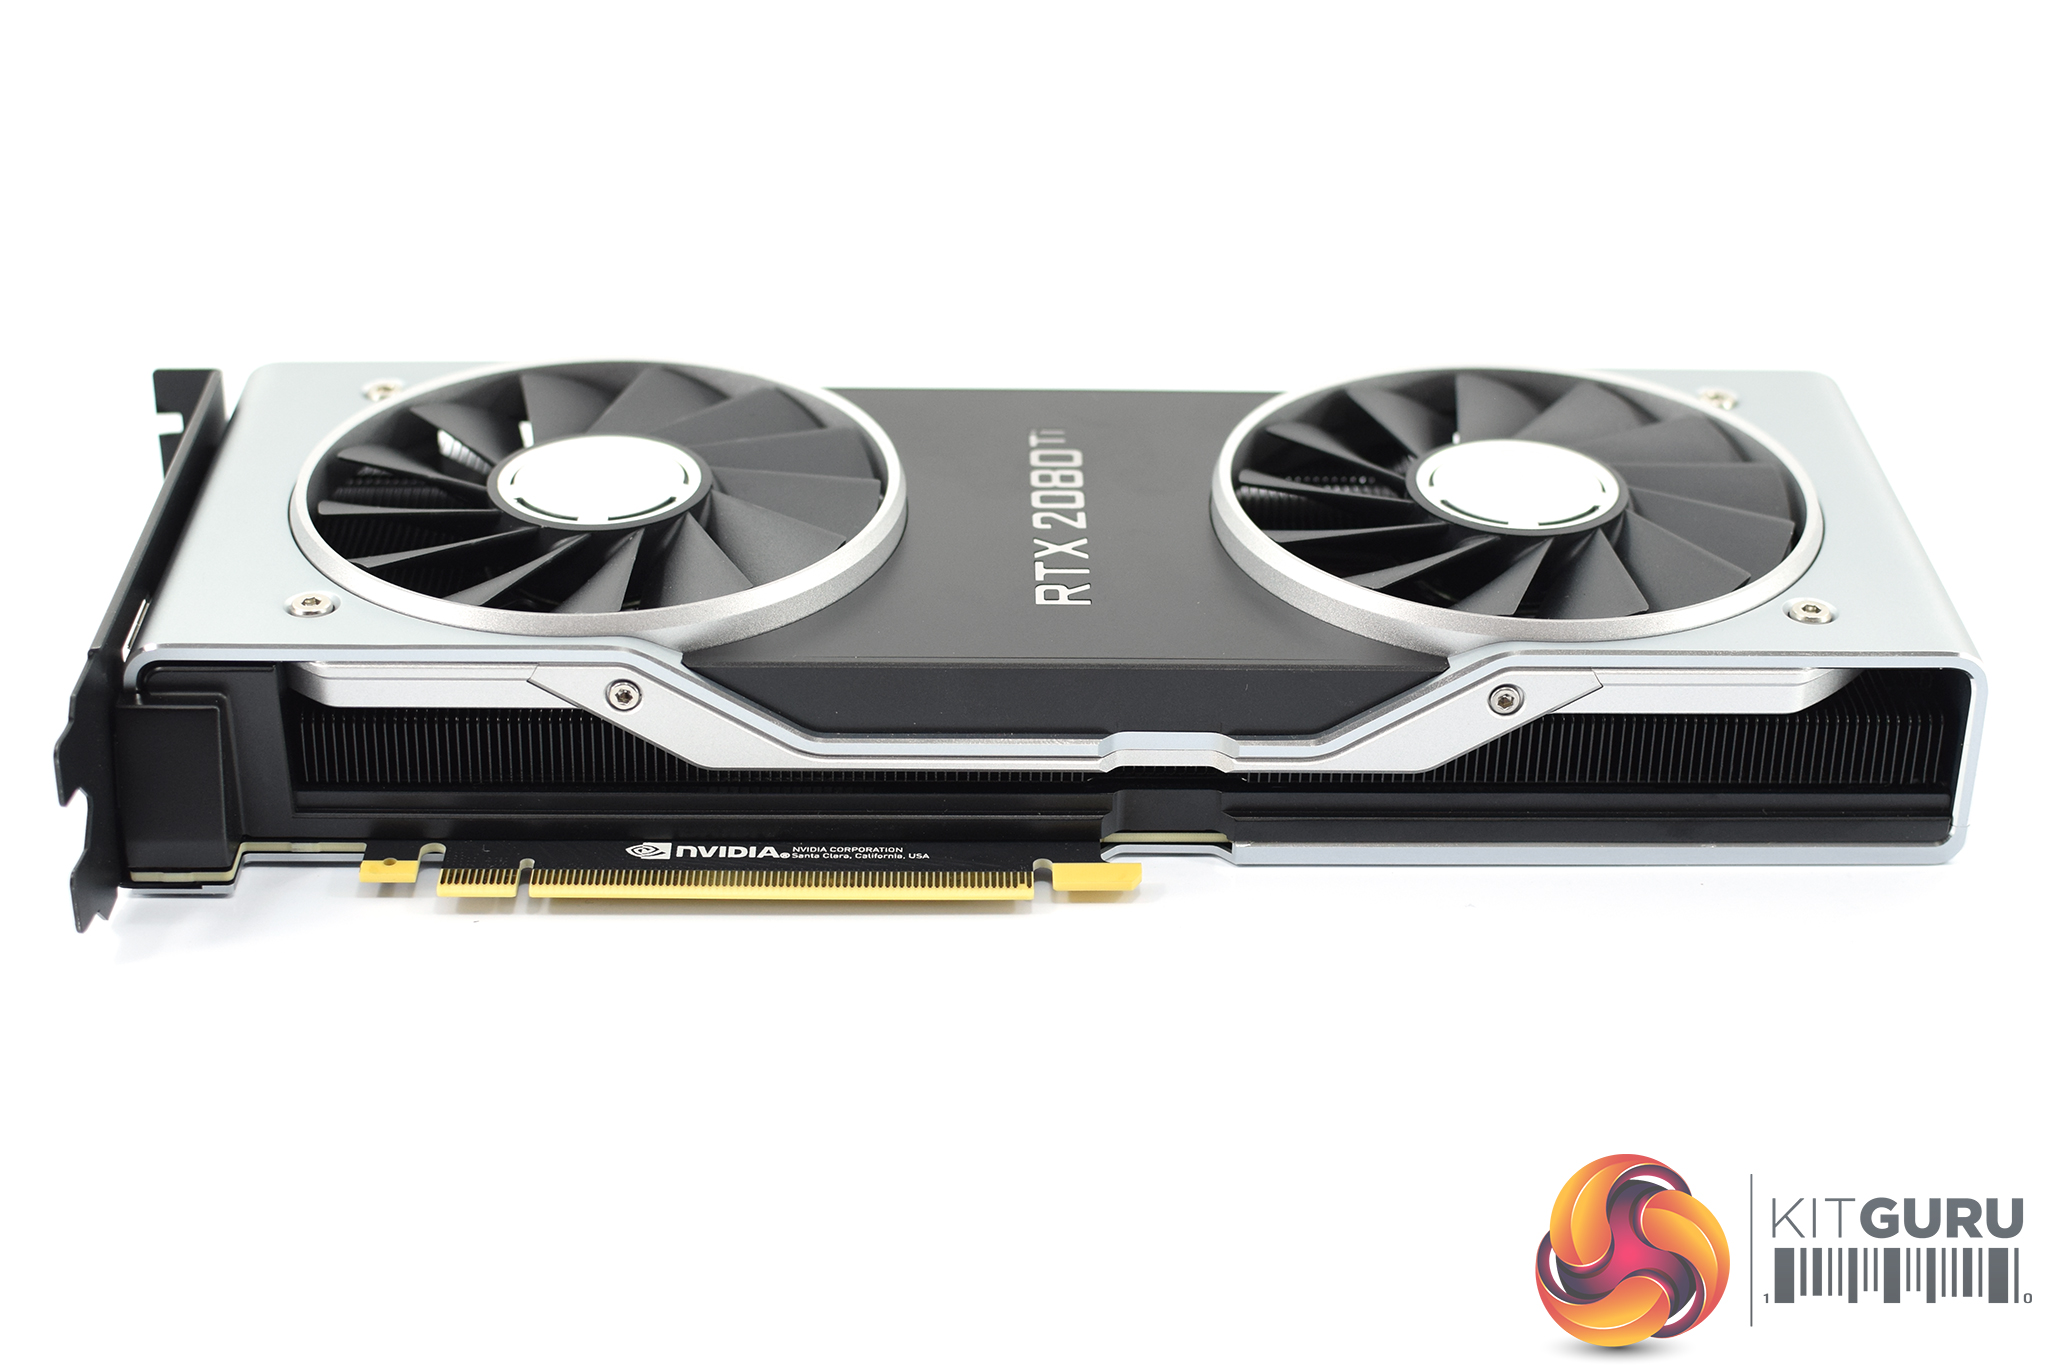
Along either side of the card you can see the aluminium fins which work in tandem with a full-length vapour chamber to cool the GPU. Air from the two fans is exhausted out of these sides, as well as through the back of the card.
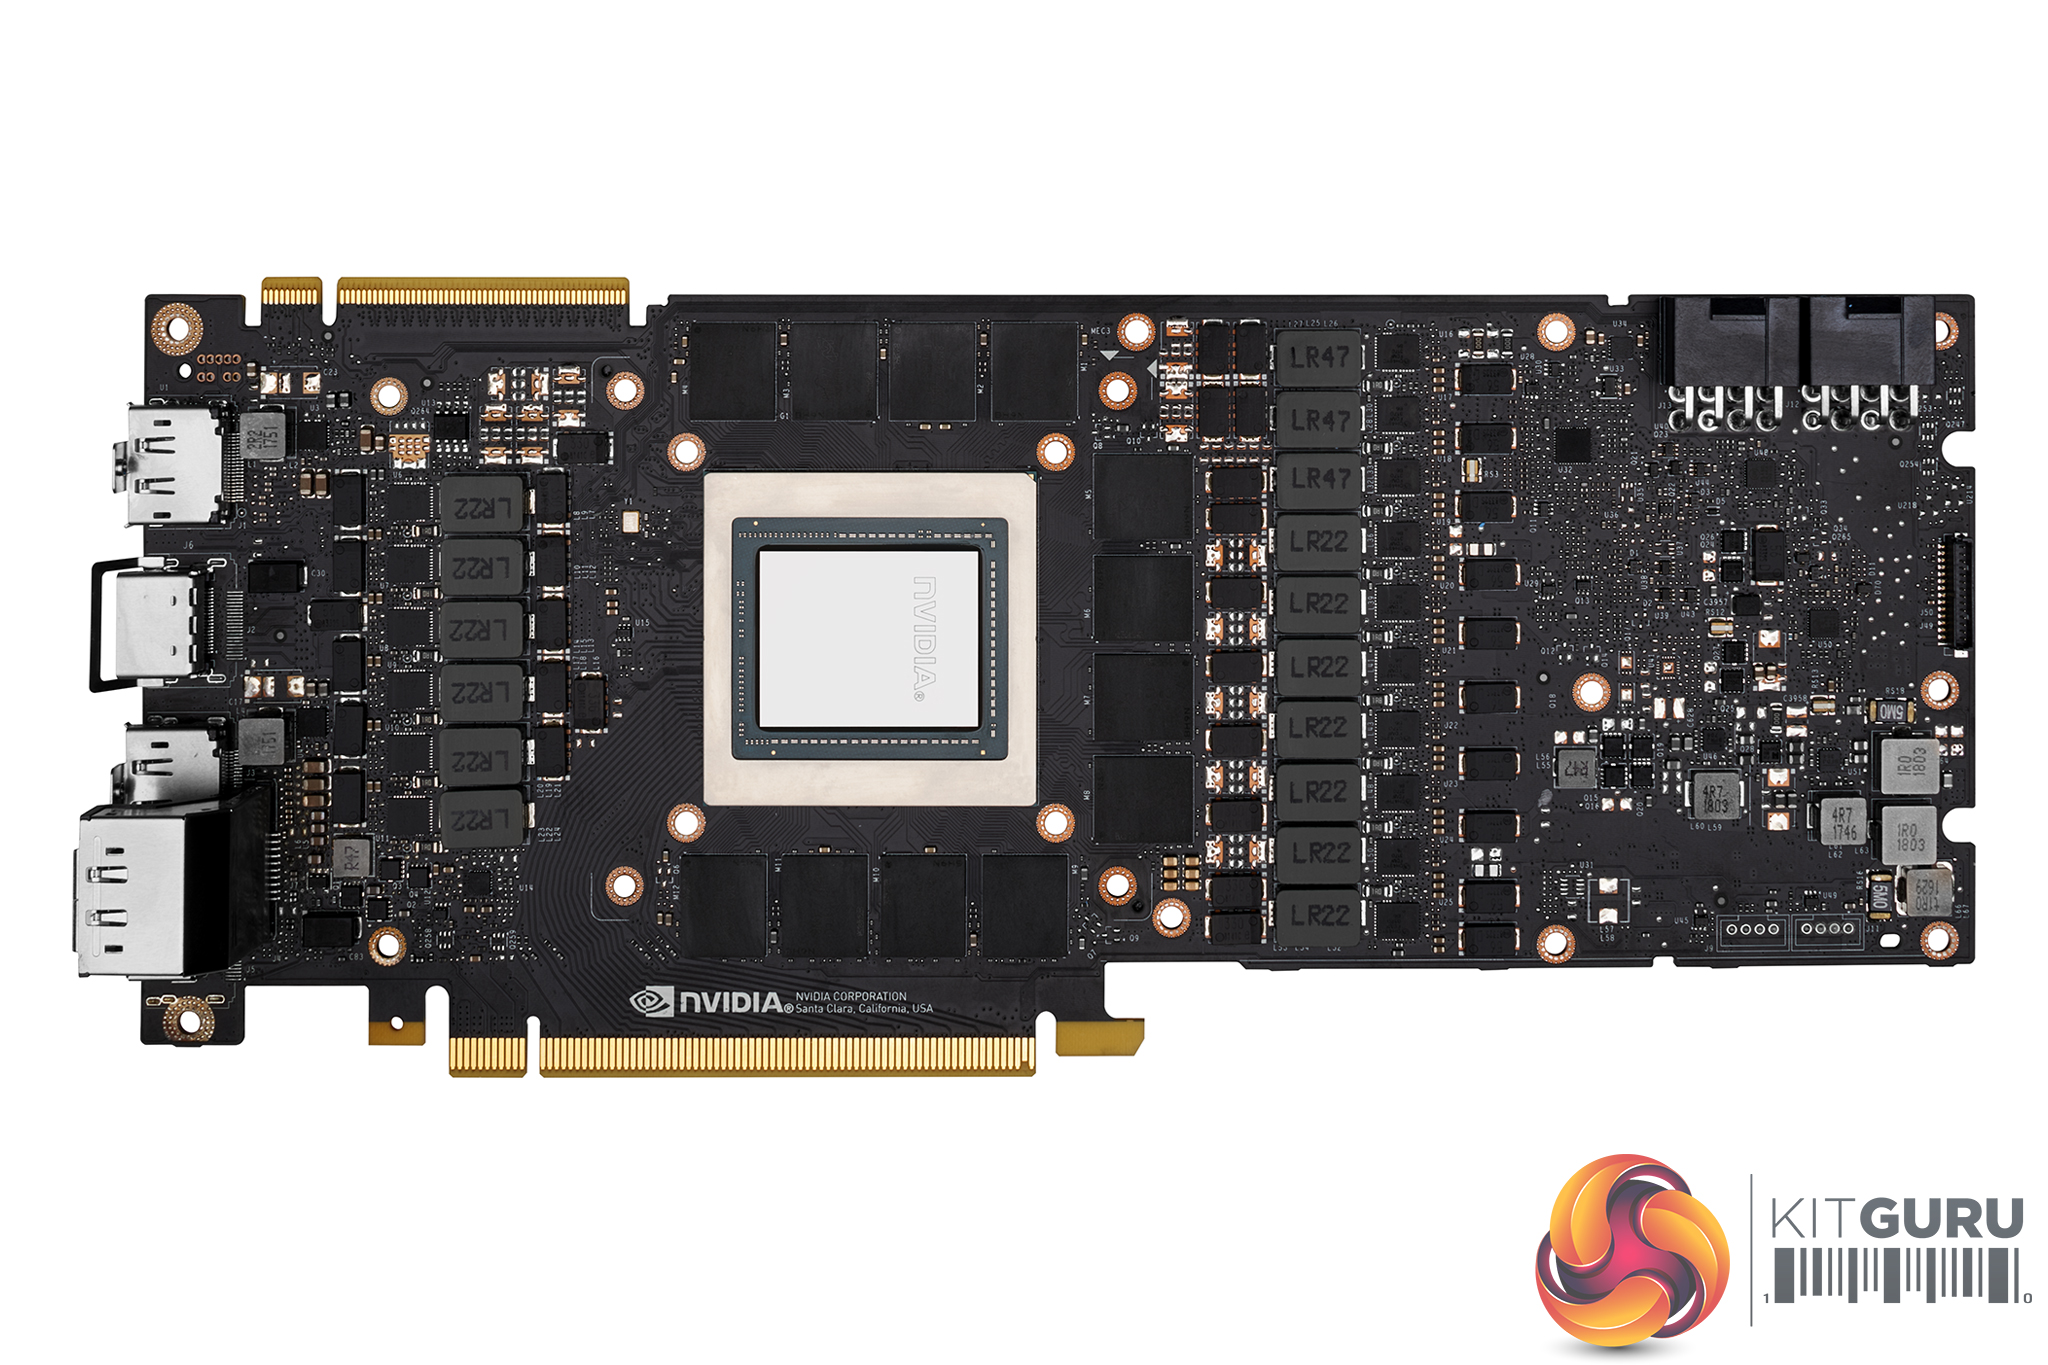

The RTX 2080 Ti sports a brand-new 13-phase iMON DrMOS power supply – and for reference, the GTX 1080 Ti uses a 7-phase dual-FET design.
A key feature of this iMON power supply design is its dynamic power management system which can handle current monitoring and control at the sub-millisecond level. This means it has very tight control of over the power flow to the GPU – thus allowing for improved power headroom which should help with overclocking.
The other key part of the iMON supply is its ability to dynamically use less power phases when not running under full load, as this enables the power supply to run at maximum efficiency when there is little load on the system – when your PC is idling, for instance.
In terms of the cooler, we have seen vapour chambers used on previous generation Nvidia reference cards – but this is the first time we have seen a full-length vapour chamber on any graphics card, let alone one manufactured by Nvidia itself. This chamber, coupled with an aluminium fin stack, promises significantly better cooling than previous reference designs.
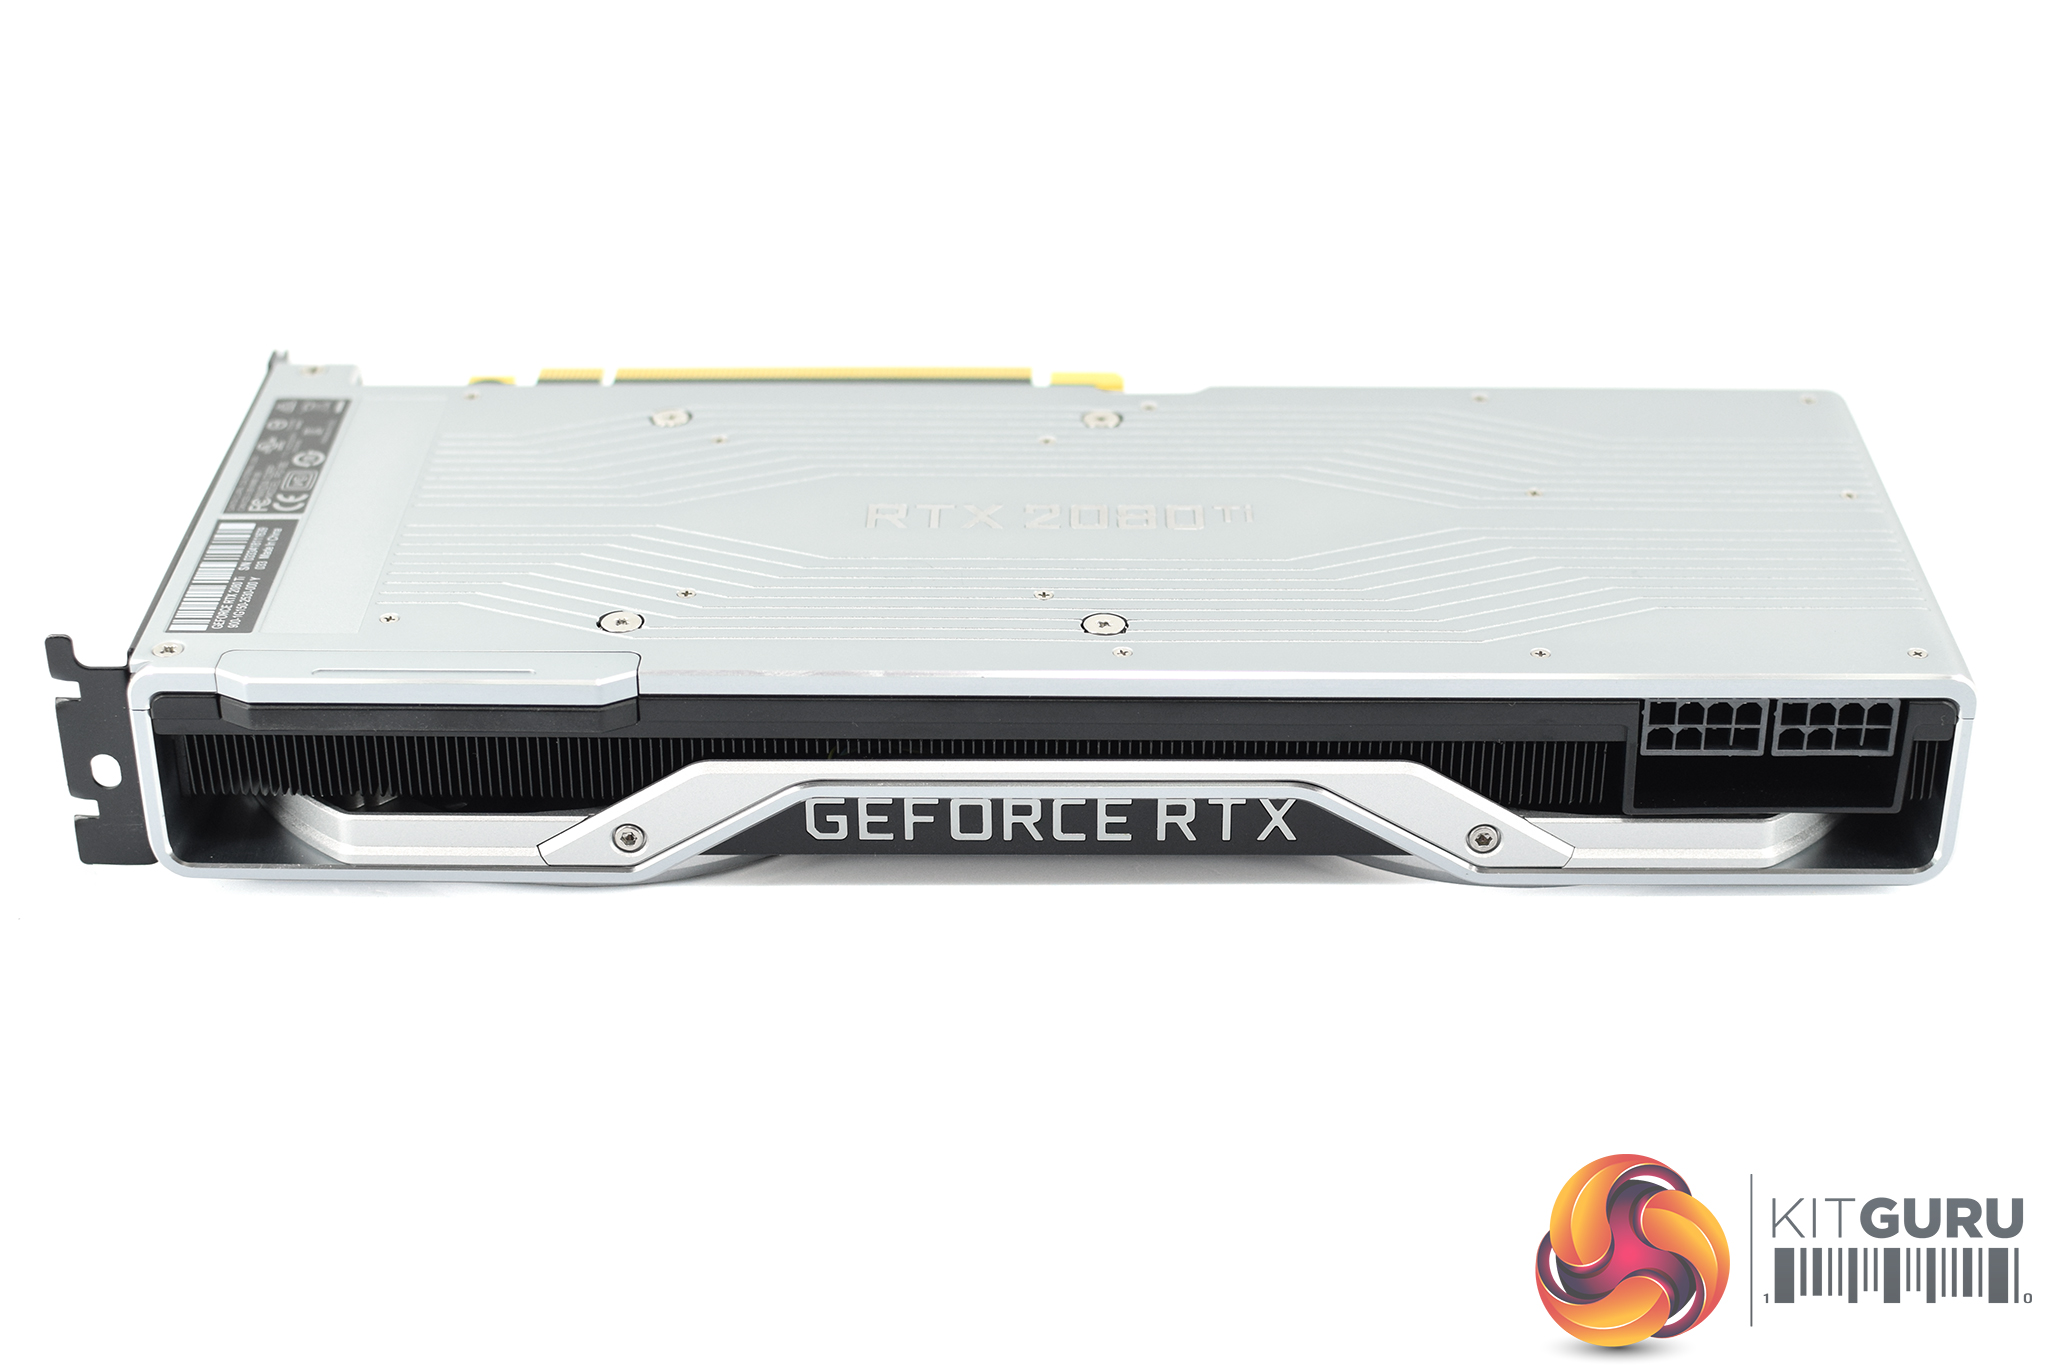
The GeForce RTX logo takes prides of place on the side of the card, and this lights up in the classic Nvidia green once your system is powered on.
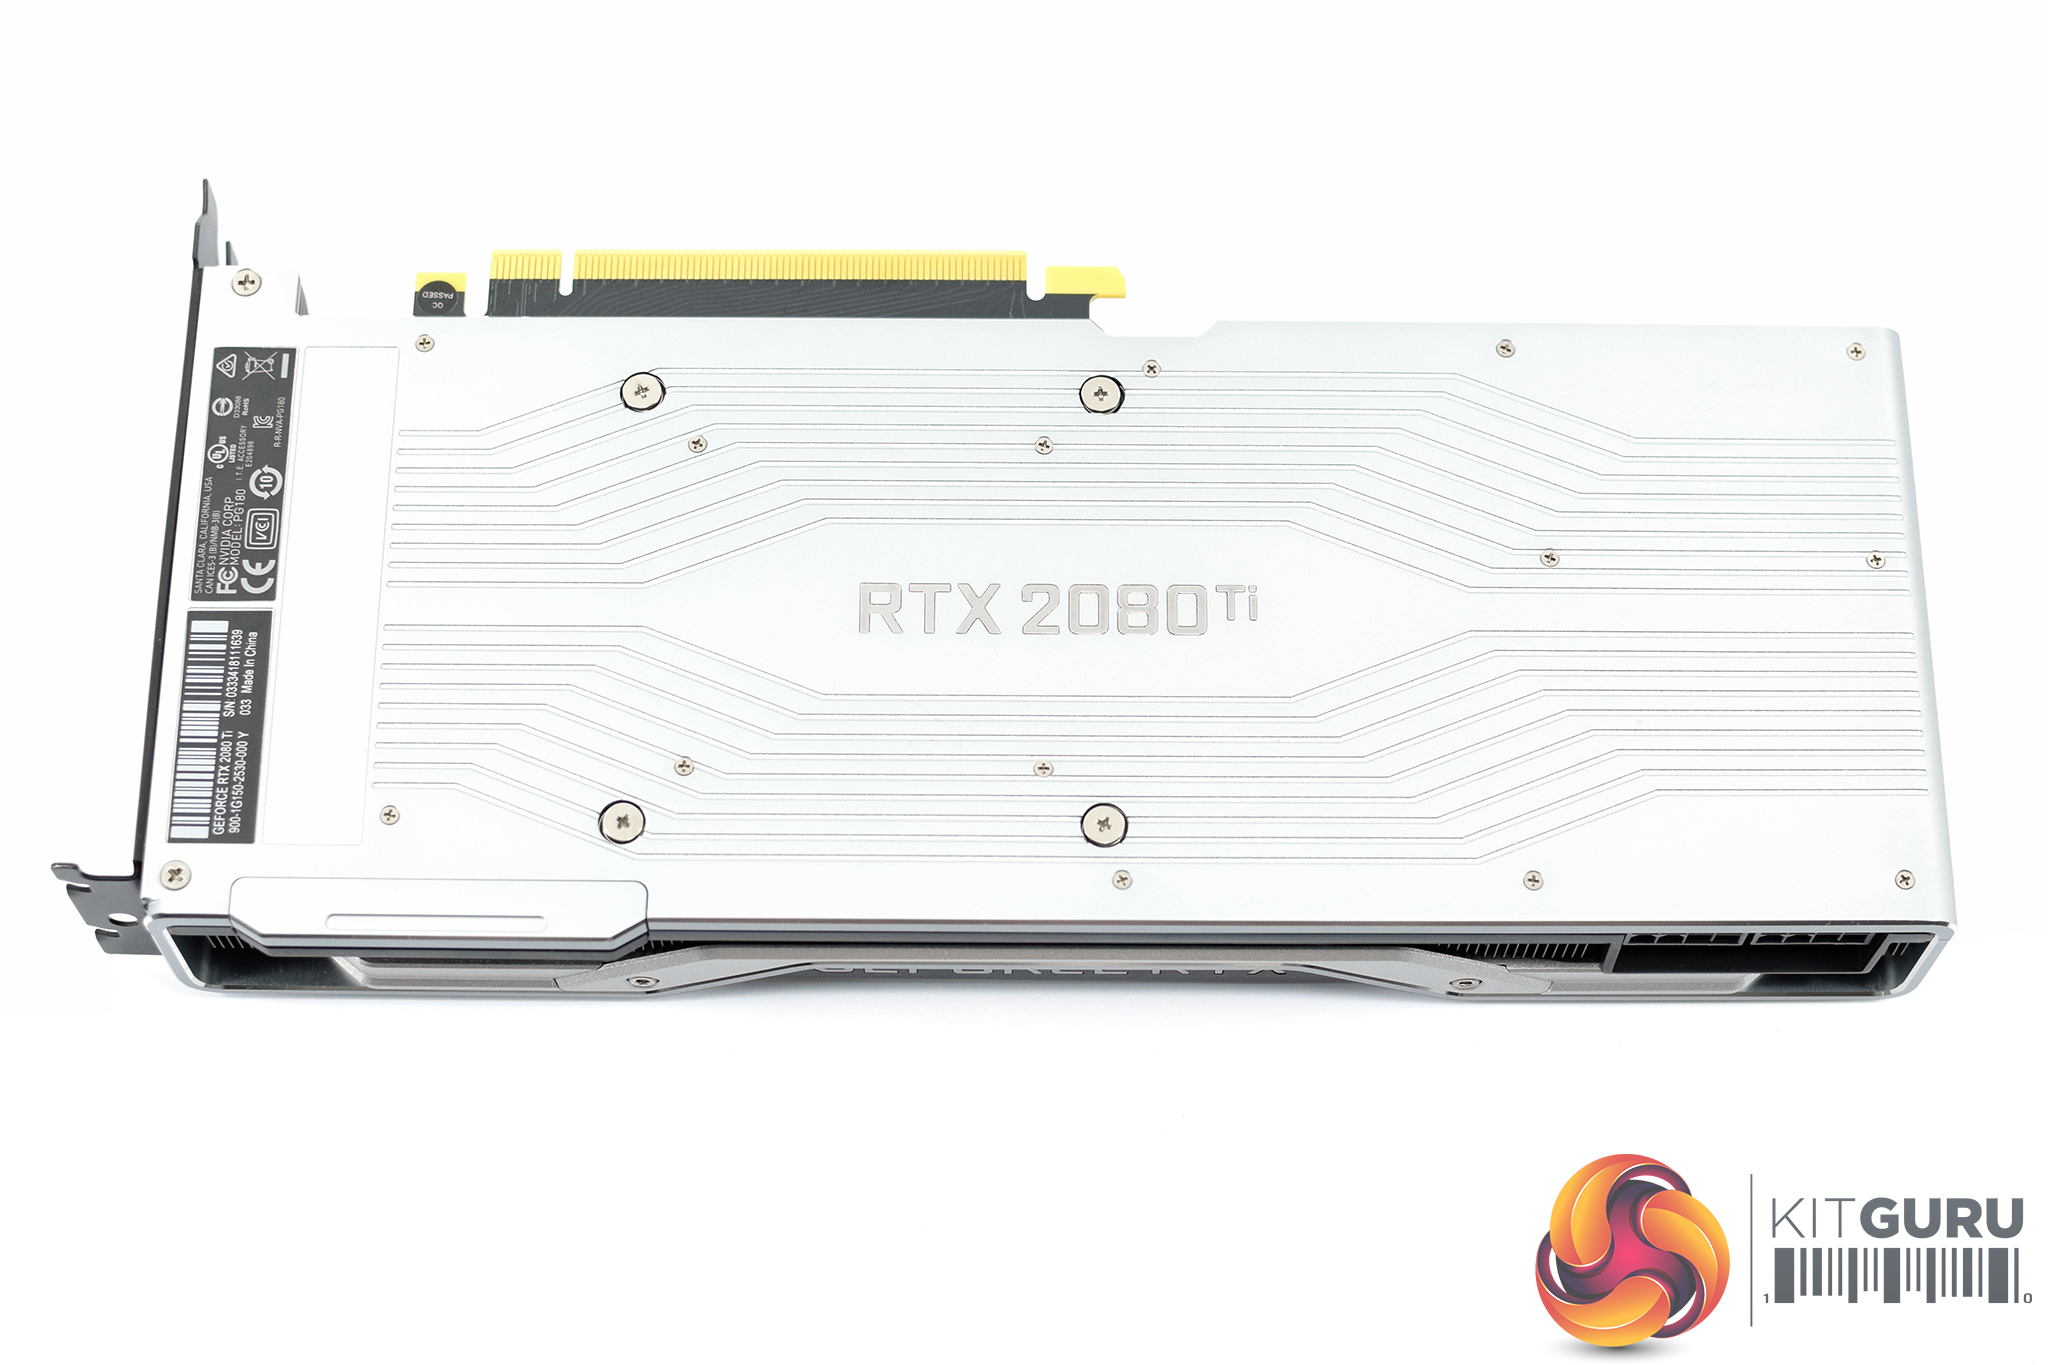
The RTX 2080 Ti logo is also positioned right in the middle of the silver aluminium backplate, and I have to say it is a lovely design. It is definitely more eye-catching than the previous all-black backplates Nvidia used, but it is still colour-neutral and should not clash with your system's colour scheme. We also expect to see this backplate help with heat dissipation.
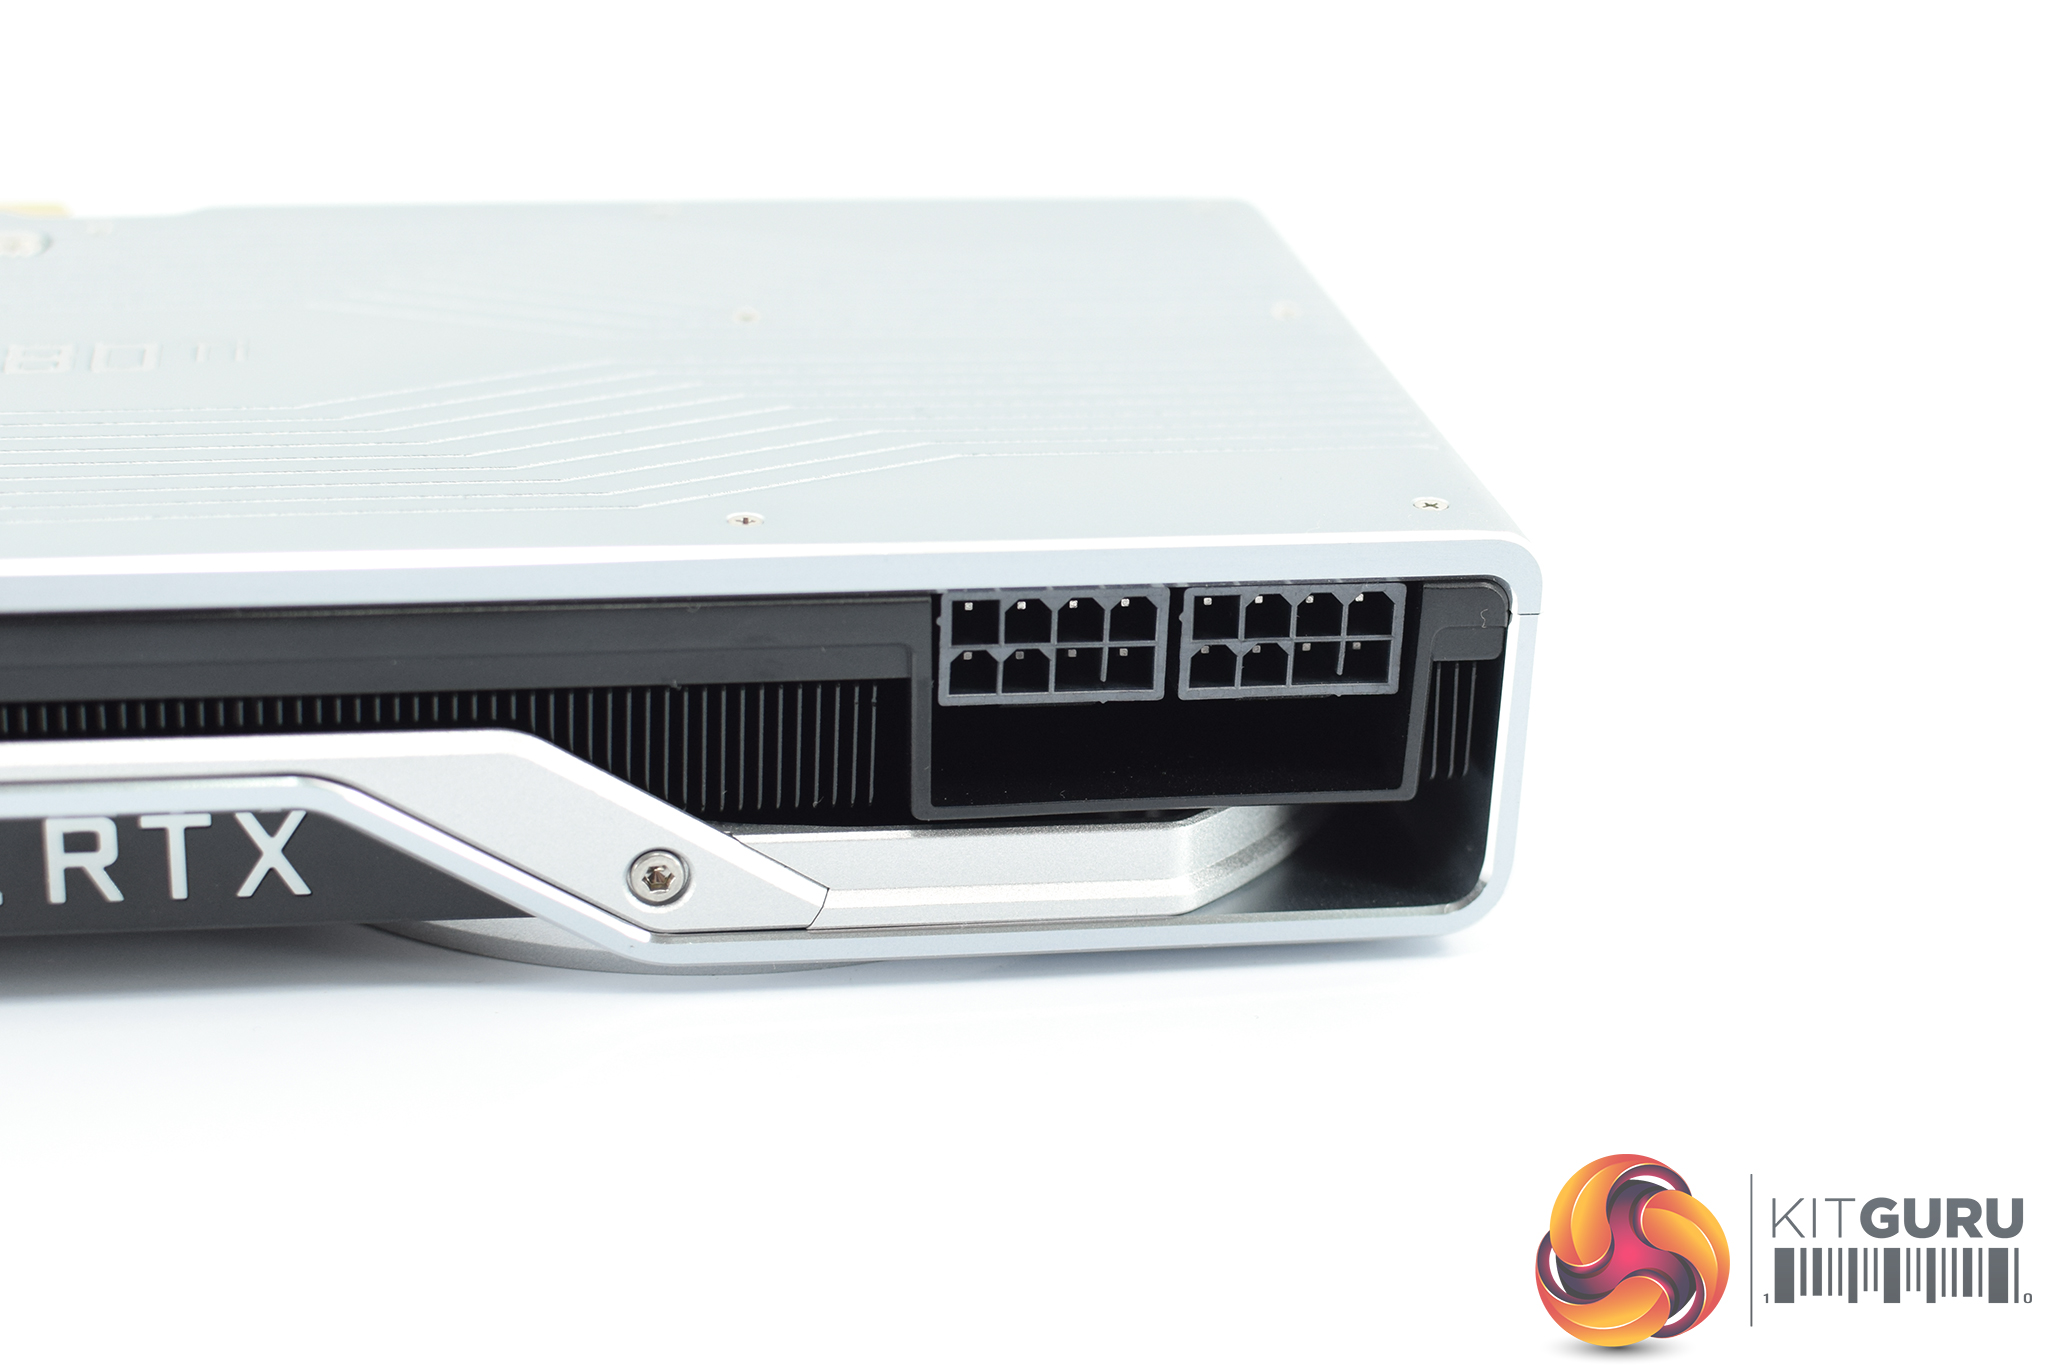
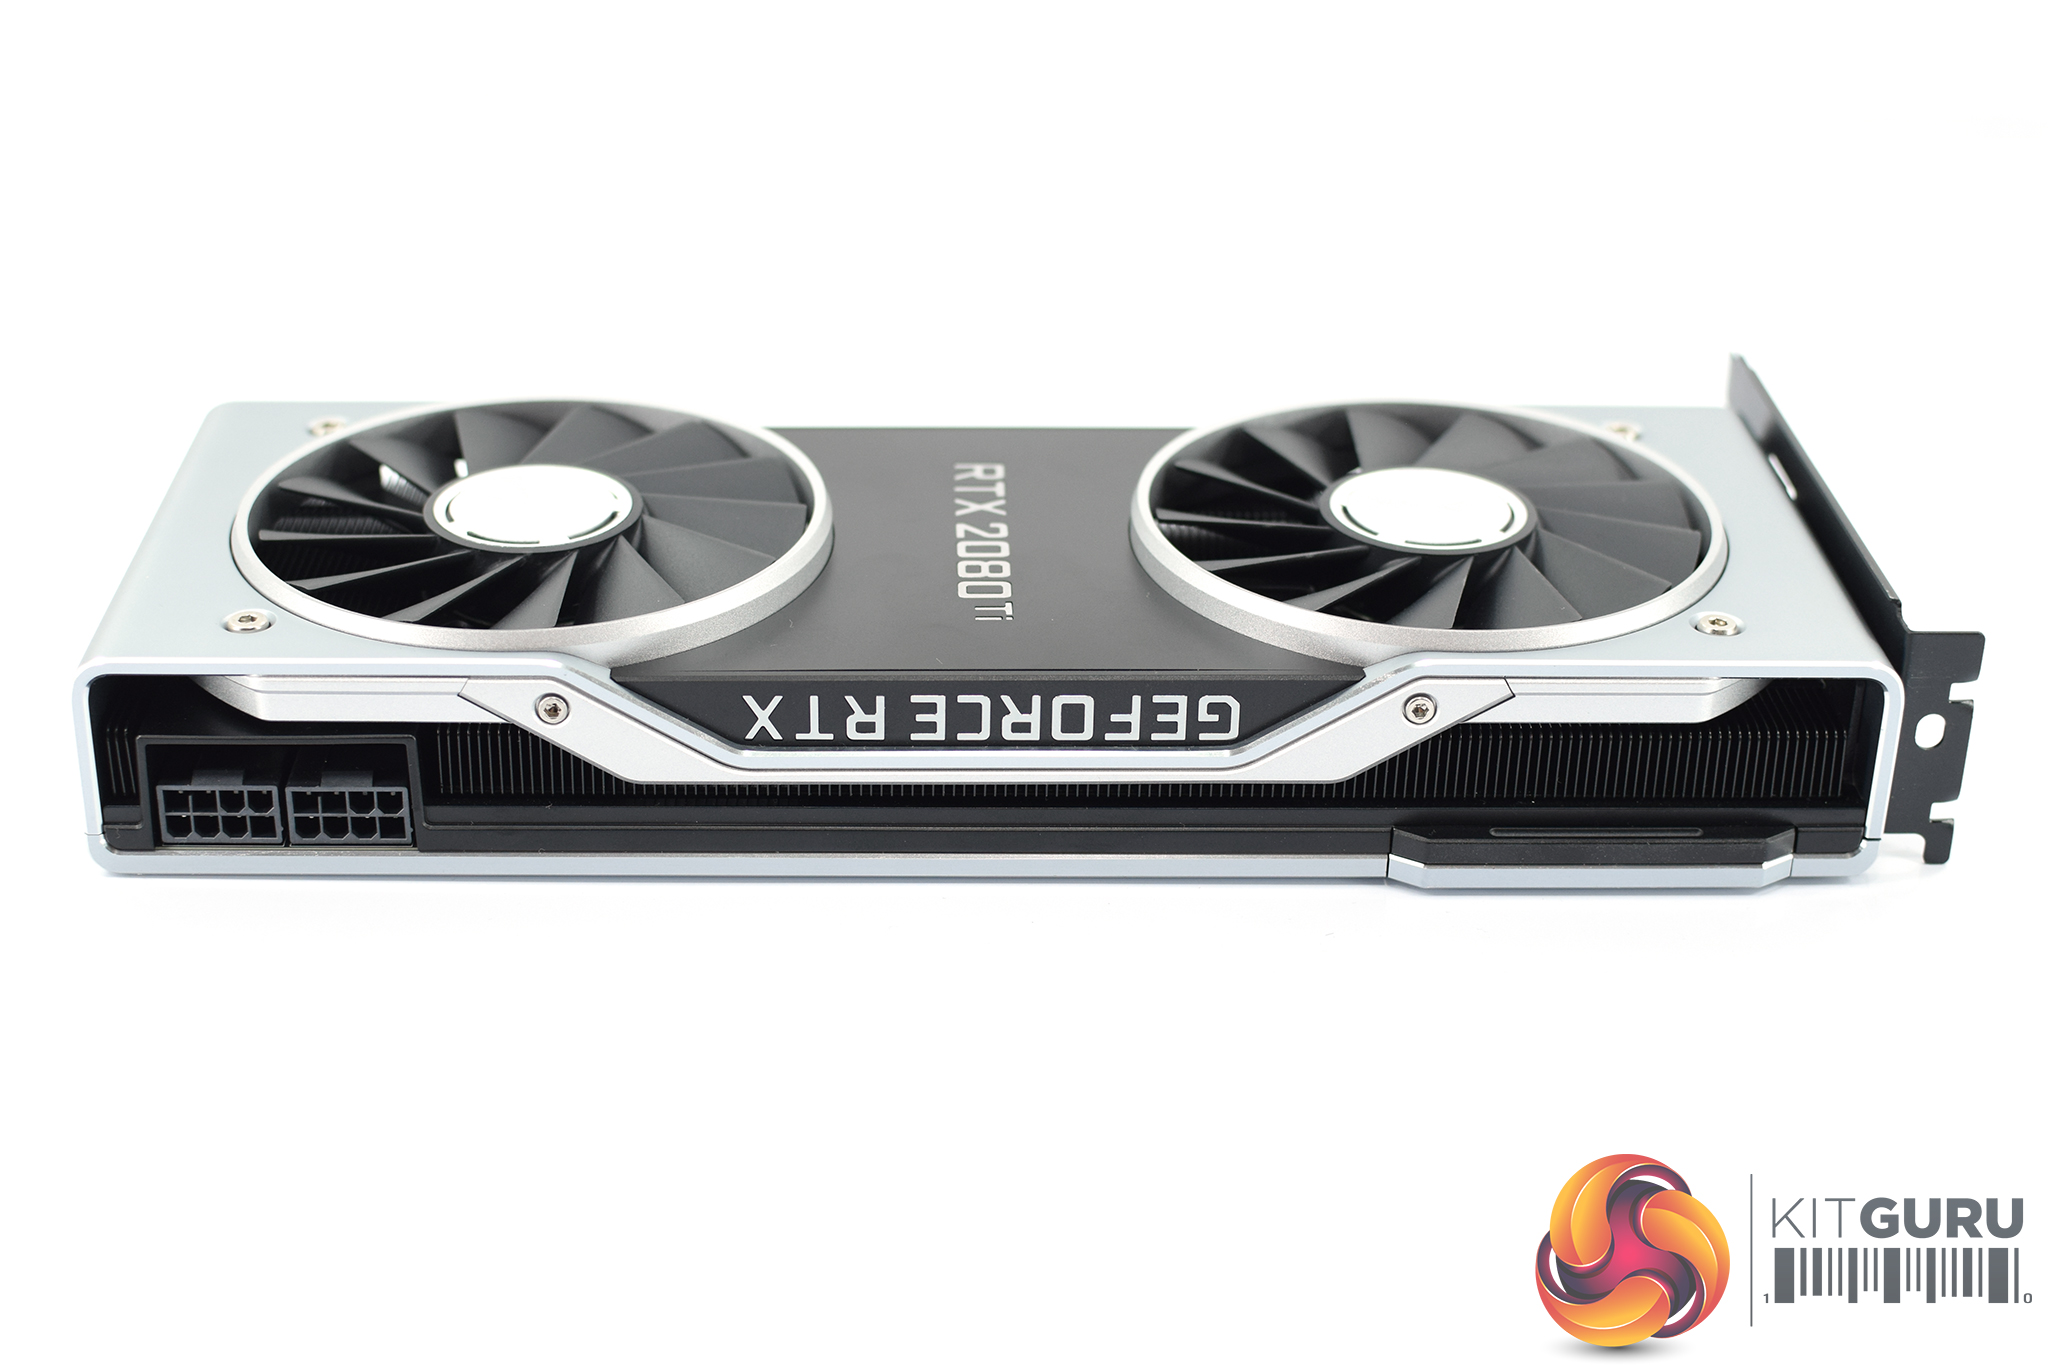
To power the RTX 2080 Ti you need 2x 8-pin PCIe power connectors, and for those interested we look at power consumption later in the review.
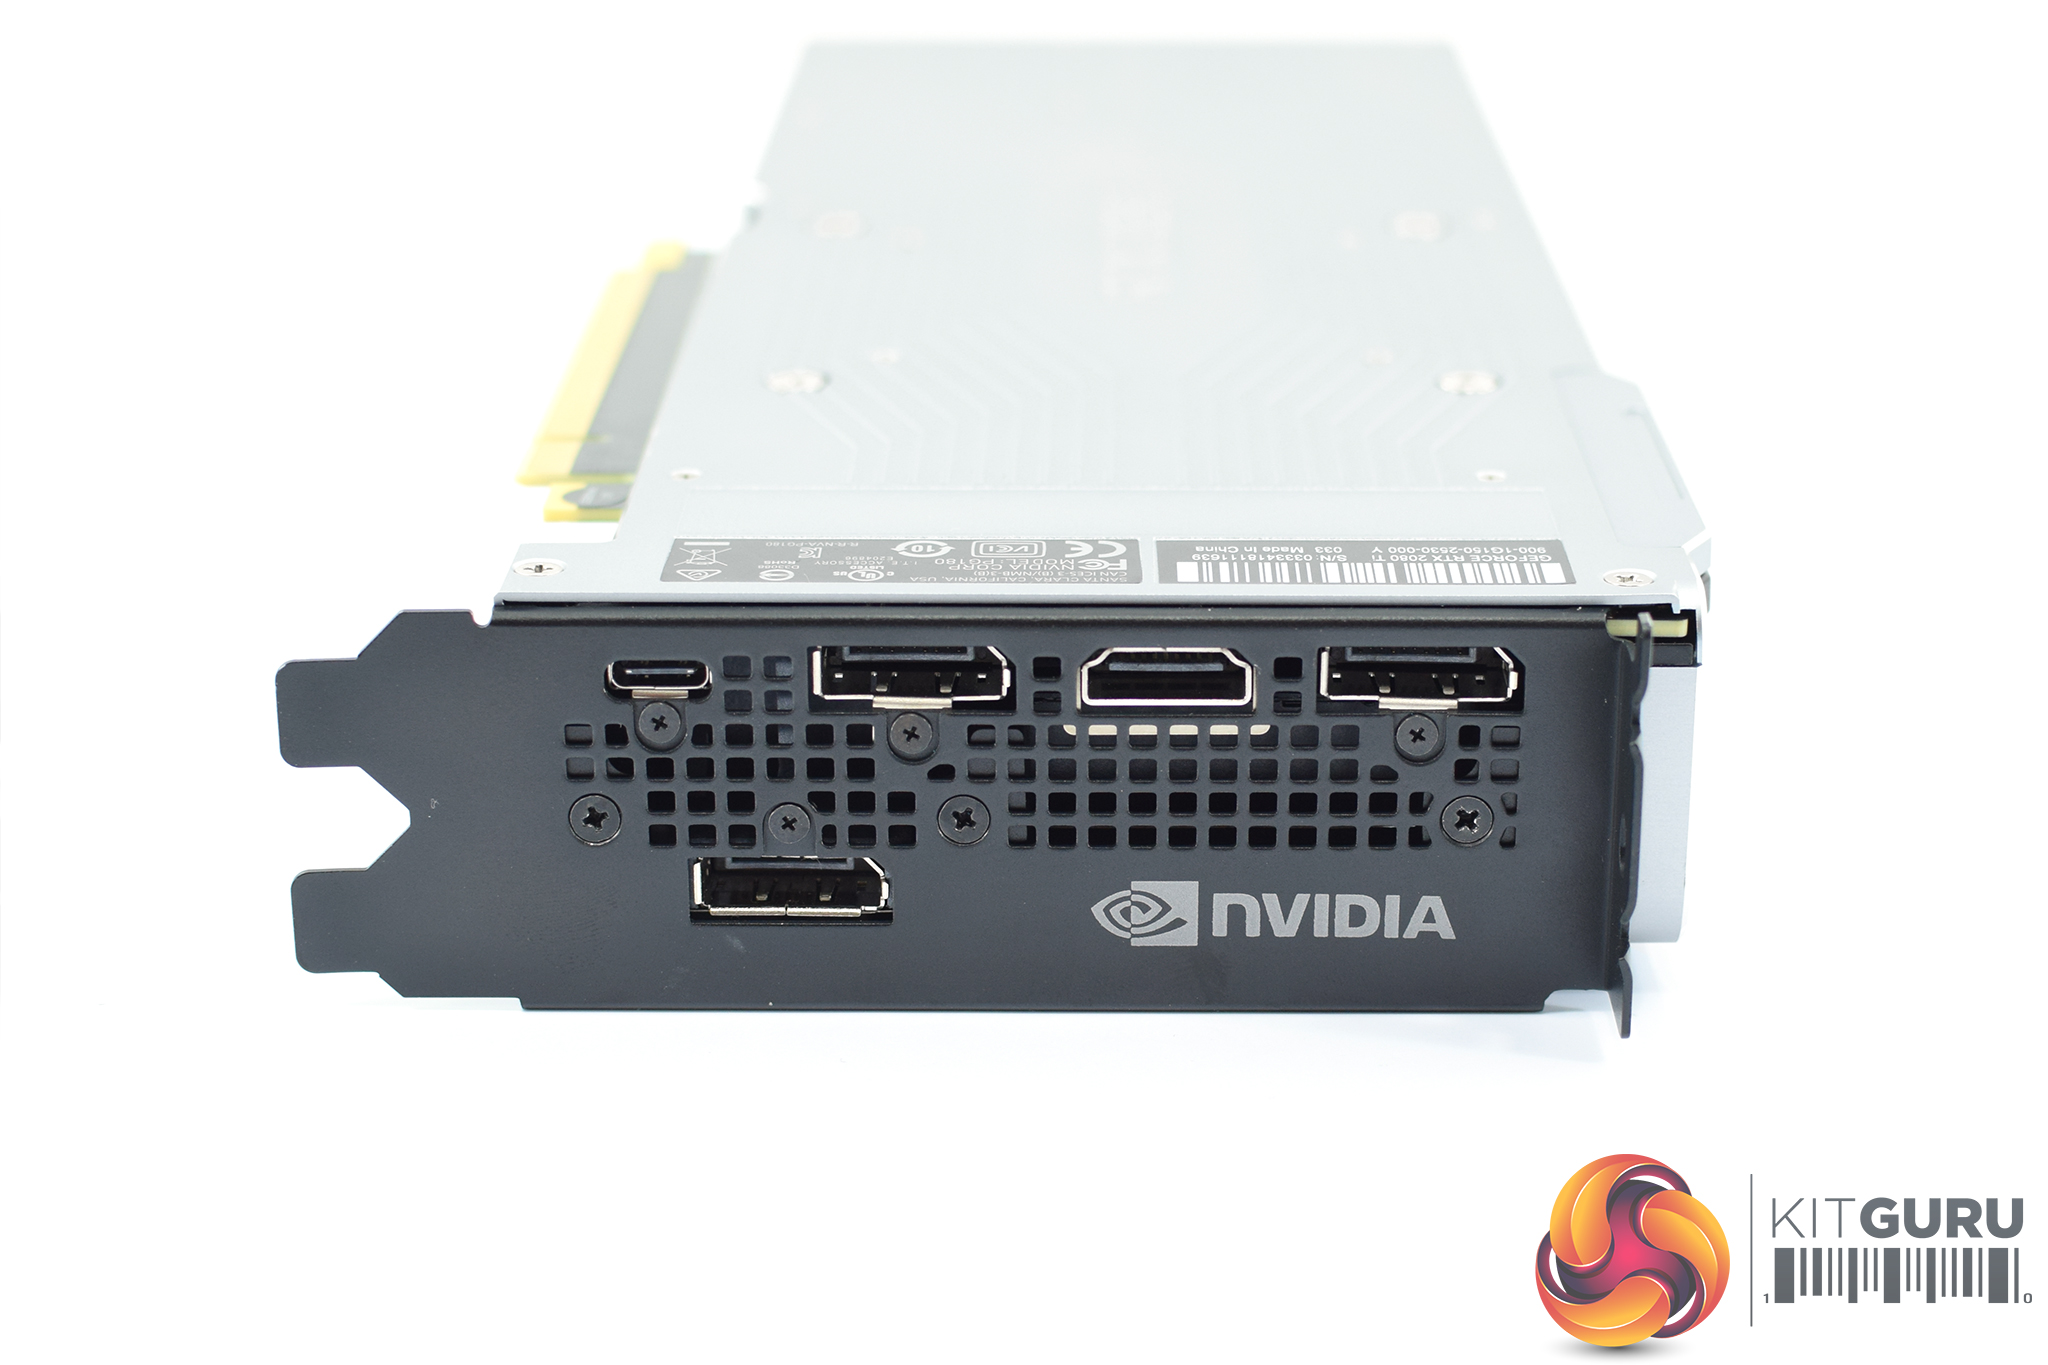
Display outputs have changed slightly from the GTX 1080 Ti as well, as we now find 3x DisplayPort 1.4a, 1x HDMI 2.0b and even 1x VirtualLink (USB-C) ports. This latter port is designed for use with next-gen VR HMDs which will only require a single USB-C cable to connect to your PC.
Our newest GPU test procedure has been built with the intention of benchmarking high-end graphics cards. We test at 1920×1080 (1080p), 2560×1440 (1440p), and 3840×2160 (4K UHD) resolutions.
We try to test using the DX12 API if titles offer support. This gives us an interpretation into the graphics card performance hierarchy in the present time and the near future, when DX12 becomes more prevalent. After all, graphics cards of this expense may stay in a gamer’s system for a number of product generations/years before being upgraded.
We tested the RX Vega64 and Vega56 using the ‘Turbo‘ power mode in AMD’s WattMan software. This prioritises all-out performance over power efficiency, noise output, and lower thermals.
Driver Notes
- AMD graphics cards were benchmarked with the Adrenalin 18.9.1 driver.
- Nvidia graphics cards (apart from RTX 20 series cards) were benchmarked with the Nvidia 399.24 driver.
- RTX 20 series cards were benchmarked with the Nvidia 411.51 driver, supplied to press.
Test System
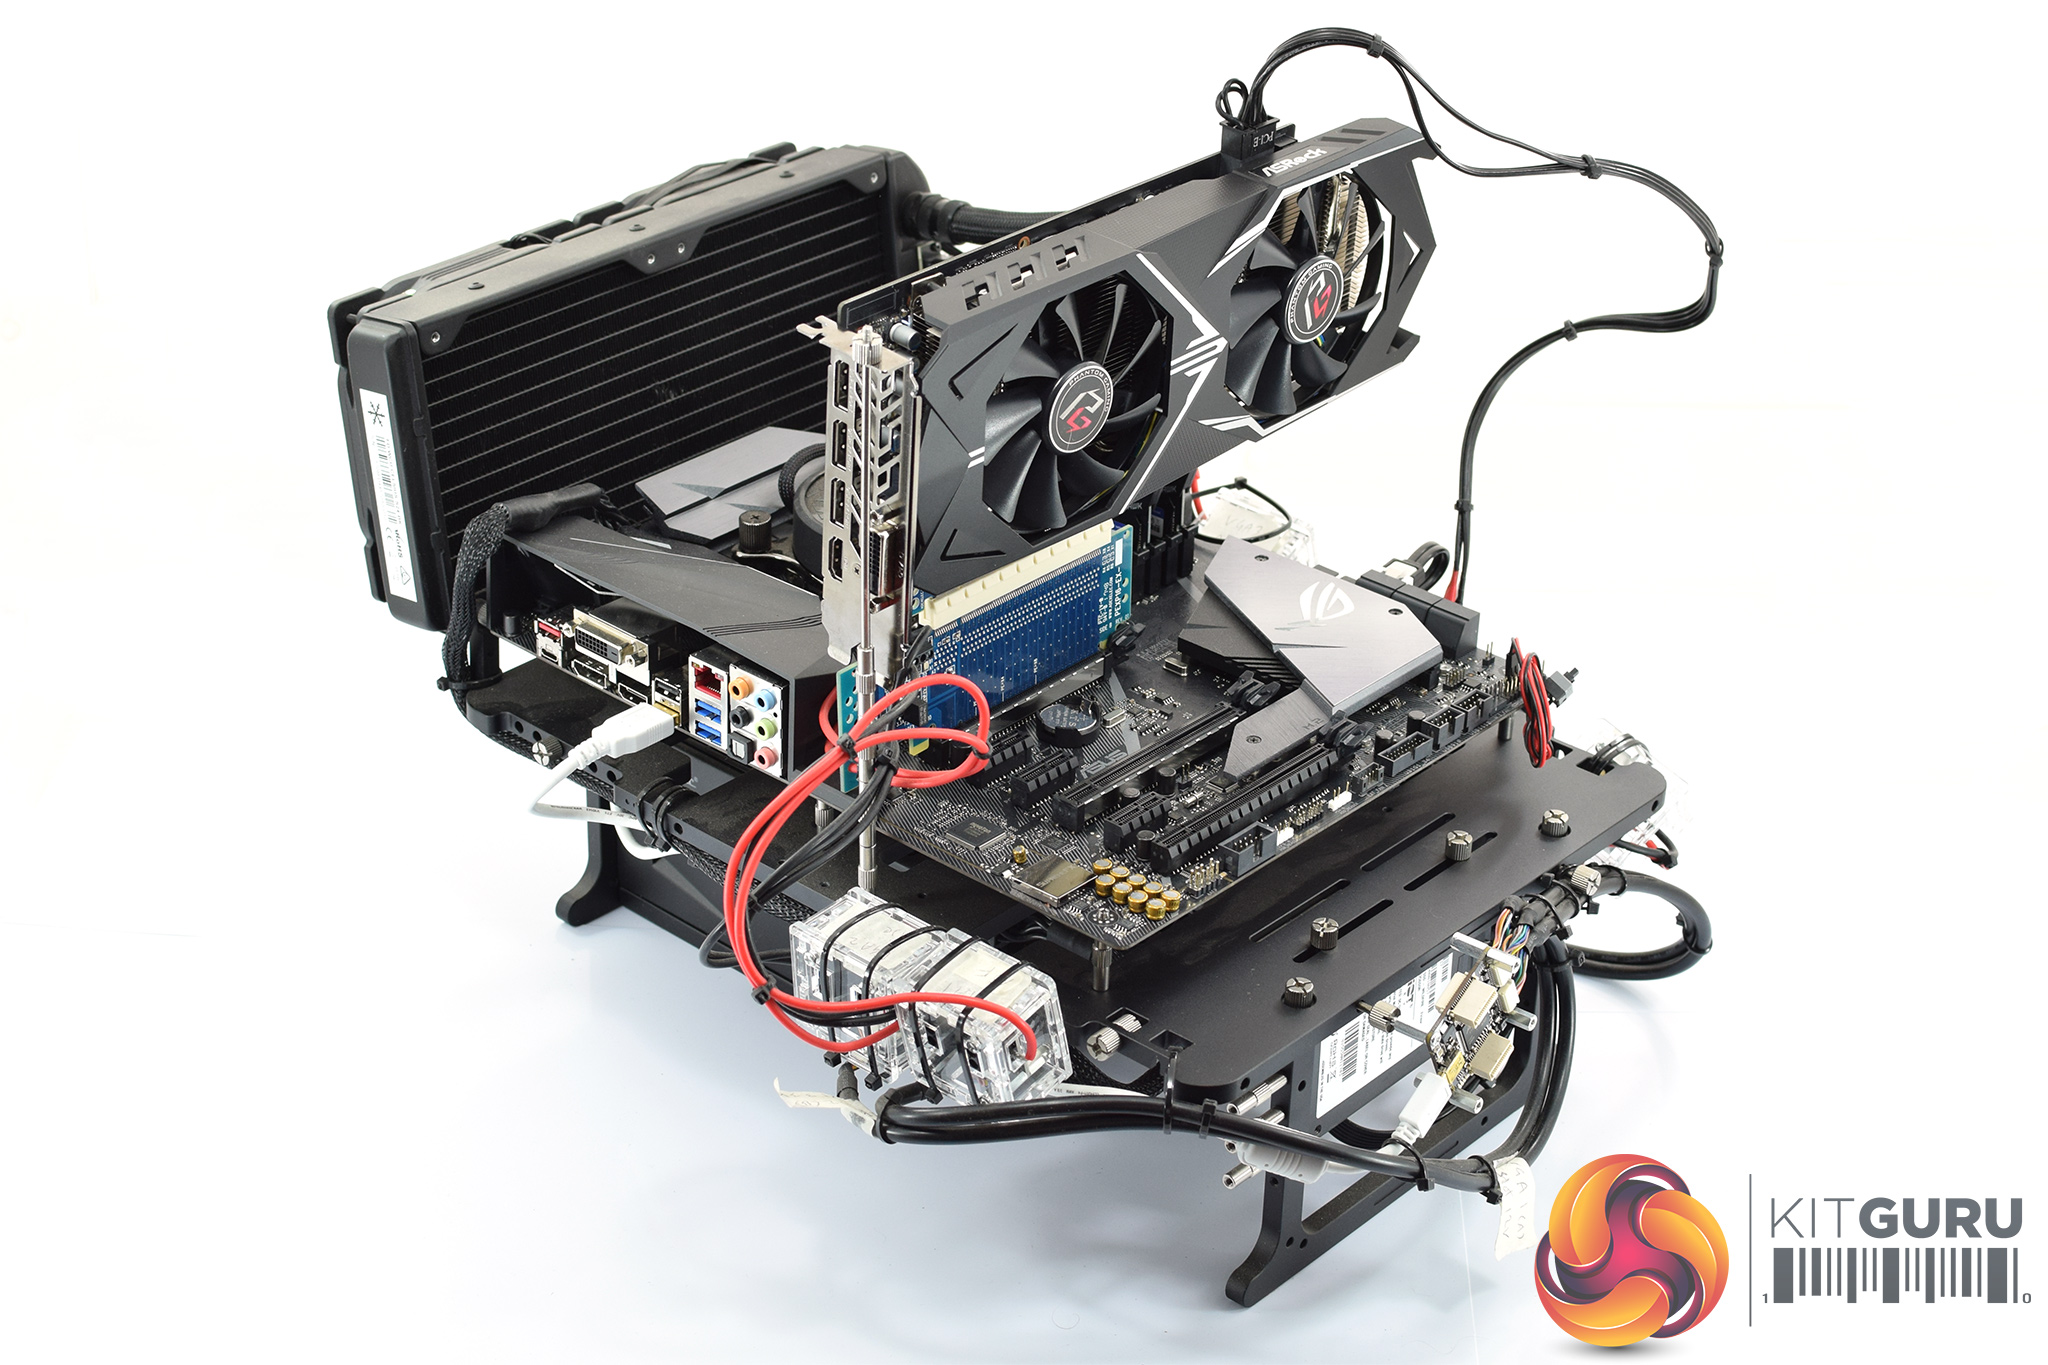
We test using the Overclockers UK Germanium pre-built system. You can read more about it over HERE. It is important to note we have had to re-house the components to an open-air test bench to accommodate our new GPU power testing (more on that later) but the core of the system is unchanged and the performance figures you see presented here are what you can expect from the Germanium.
| CPU |
Intel Core i7-8700K
Overclocked to 4.8GHz |
| Motherboard |
ASUS ROG Strix Z370-F Gaming
|
| Memory |
Team Group Dark Hawk RGB
16GB (2x8GB) @ 3200MHz 16-18-18-38 |
| Graphics Card |
Varies
|
| System Drive |
Patriot Wildfire 240GB
|
| Games Drive | Crucial M4 512GB |
| Chassis | Streacom ST-BC1 Bench |
| CPU Cooler |
OCUK TechLabs 240mm AIO
|
| Power Supply |
SuperFlower Leadex II 850W 80Plus Gold
|
| Operating System |
Windows 10 Professional
|
Comparison Graphics Cards List
- Nvidia RTX 2080 Founders Edition (FE) 8GB
- Nvidia GTX 1080 Ti Founders Edition (FE) 11GB
- Gigabyte GTX 1080 G1 Gaming 8GB
- Palit GTX 1070 Ti Super Jetstream 8GB
- Nvidia GTX 1070 Founders Edition (FE) 8GB
- Nvidia GTX 1060 Founders Edition (FE) 6GB
- Gigabyte GTX 980 Ti XTREME Gaming 6GB
- AMD RX Vega 64 Air 8GB
- AMD RX Vega 56 8GB
- Sapphire RX 580 Nitro+ Limited Edition (LE) 8GB
- ASUS RX 570 ROG Strix Gaming OC 4GB
Software and Games List
- 3DMark Fire Strike & Fire Strike Ultra (DX11 Synthetic)
- 3DMark Time Spy (DX12 Synthetic)
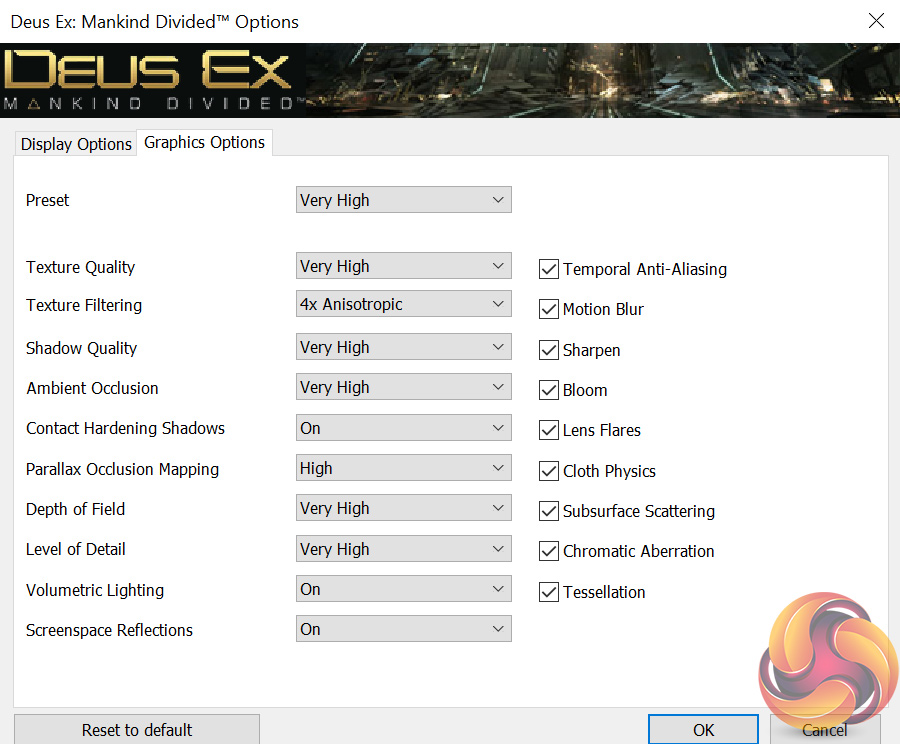
- Deus Ex: Mankind Divided (DX12)
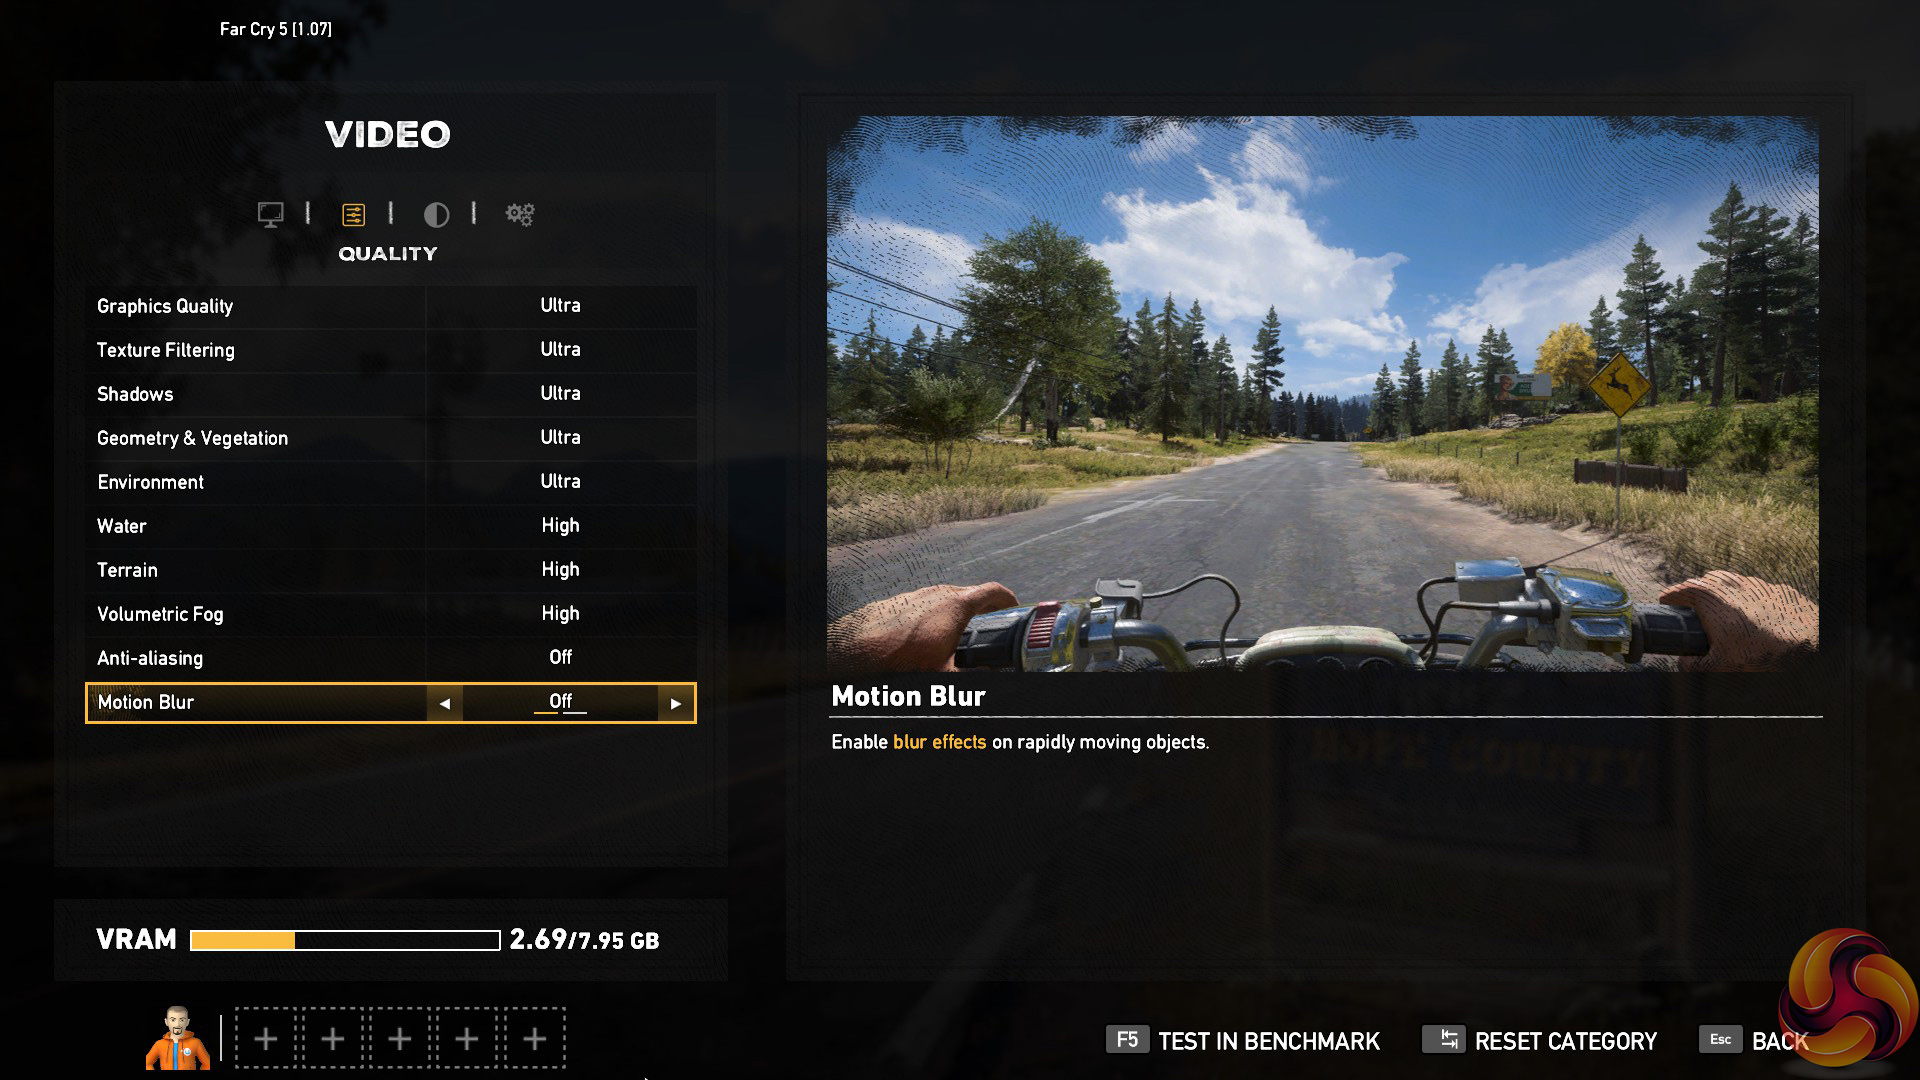
- Far Cry 5 (DX11)
- Tom Clancy’s Ghost Recon: Wildlands (DX11)
- Middle Earth: Shadow of War (DX11)
- Shadow of the Tomb Raider (DX12)
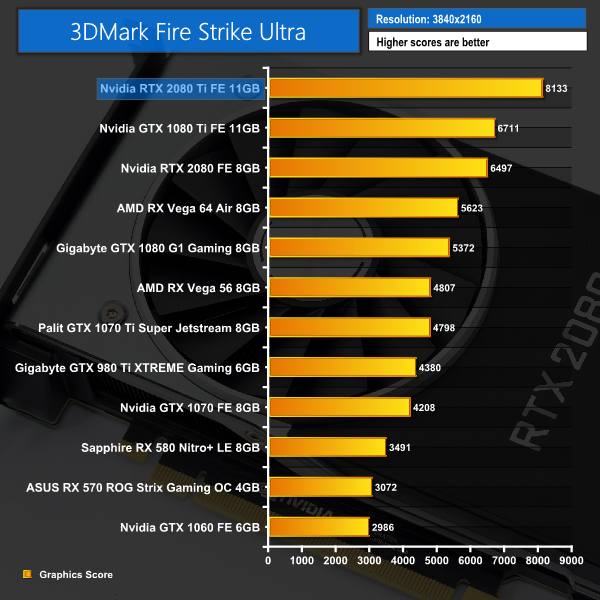
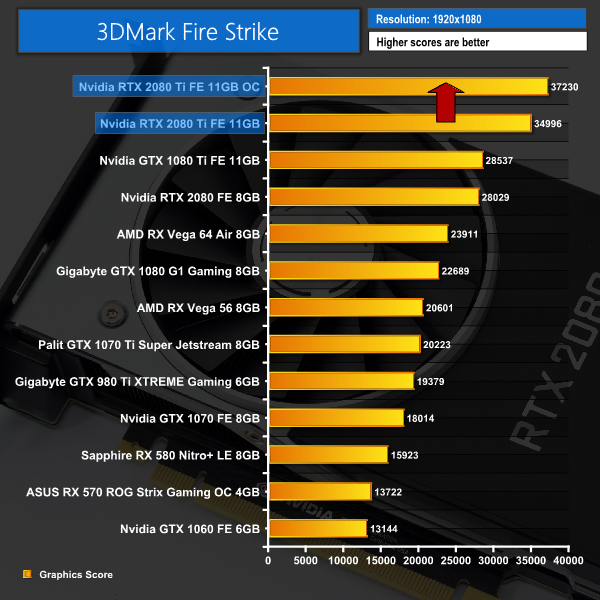
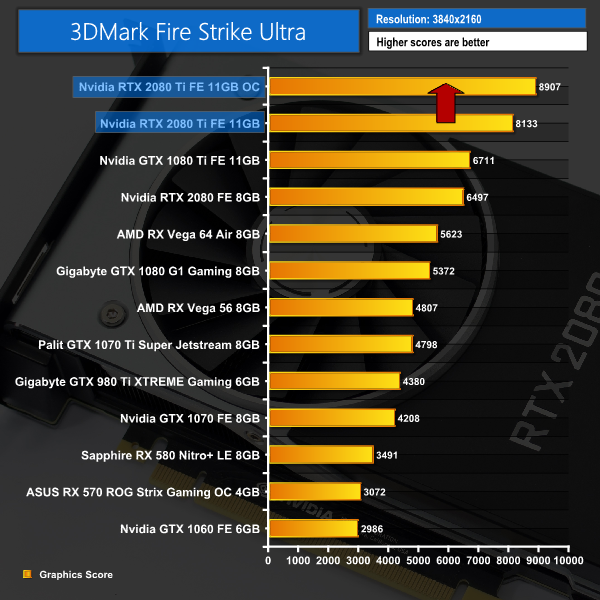
We run each benchmark/game three times, and present averages in our graphs.3DMark Fire Strike is a showcase DirectX 11 benchmark designed for today’s high-performance gaming PCs. It is our [FutureMark’s] most ambitious and technical benchmark ever, featuring real-time graphics rendered with detail and complexity far beyond what is found in other benchmarks and games today.
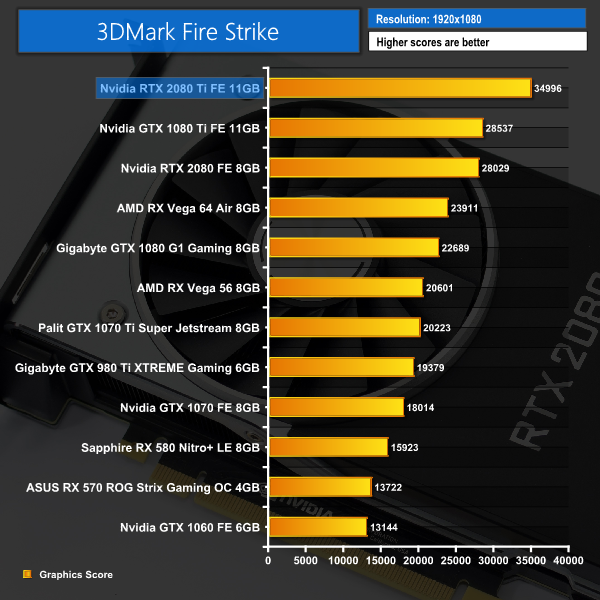
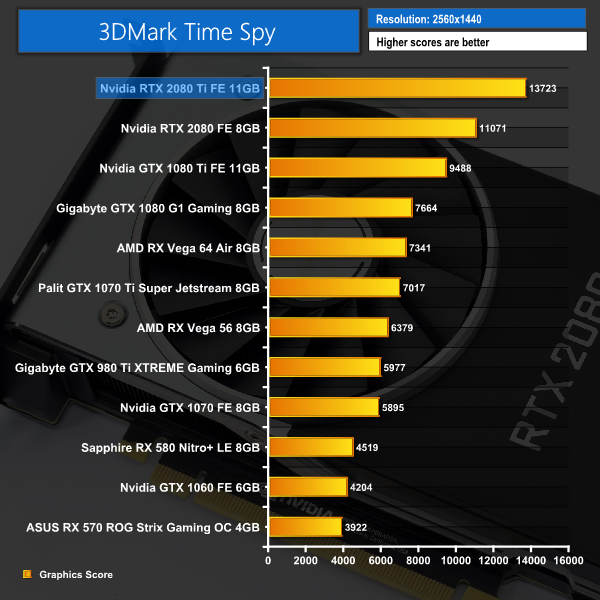
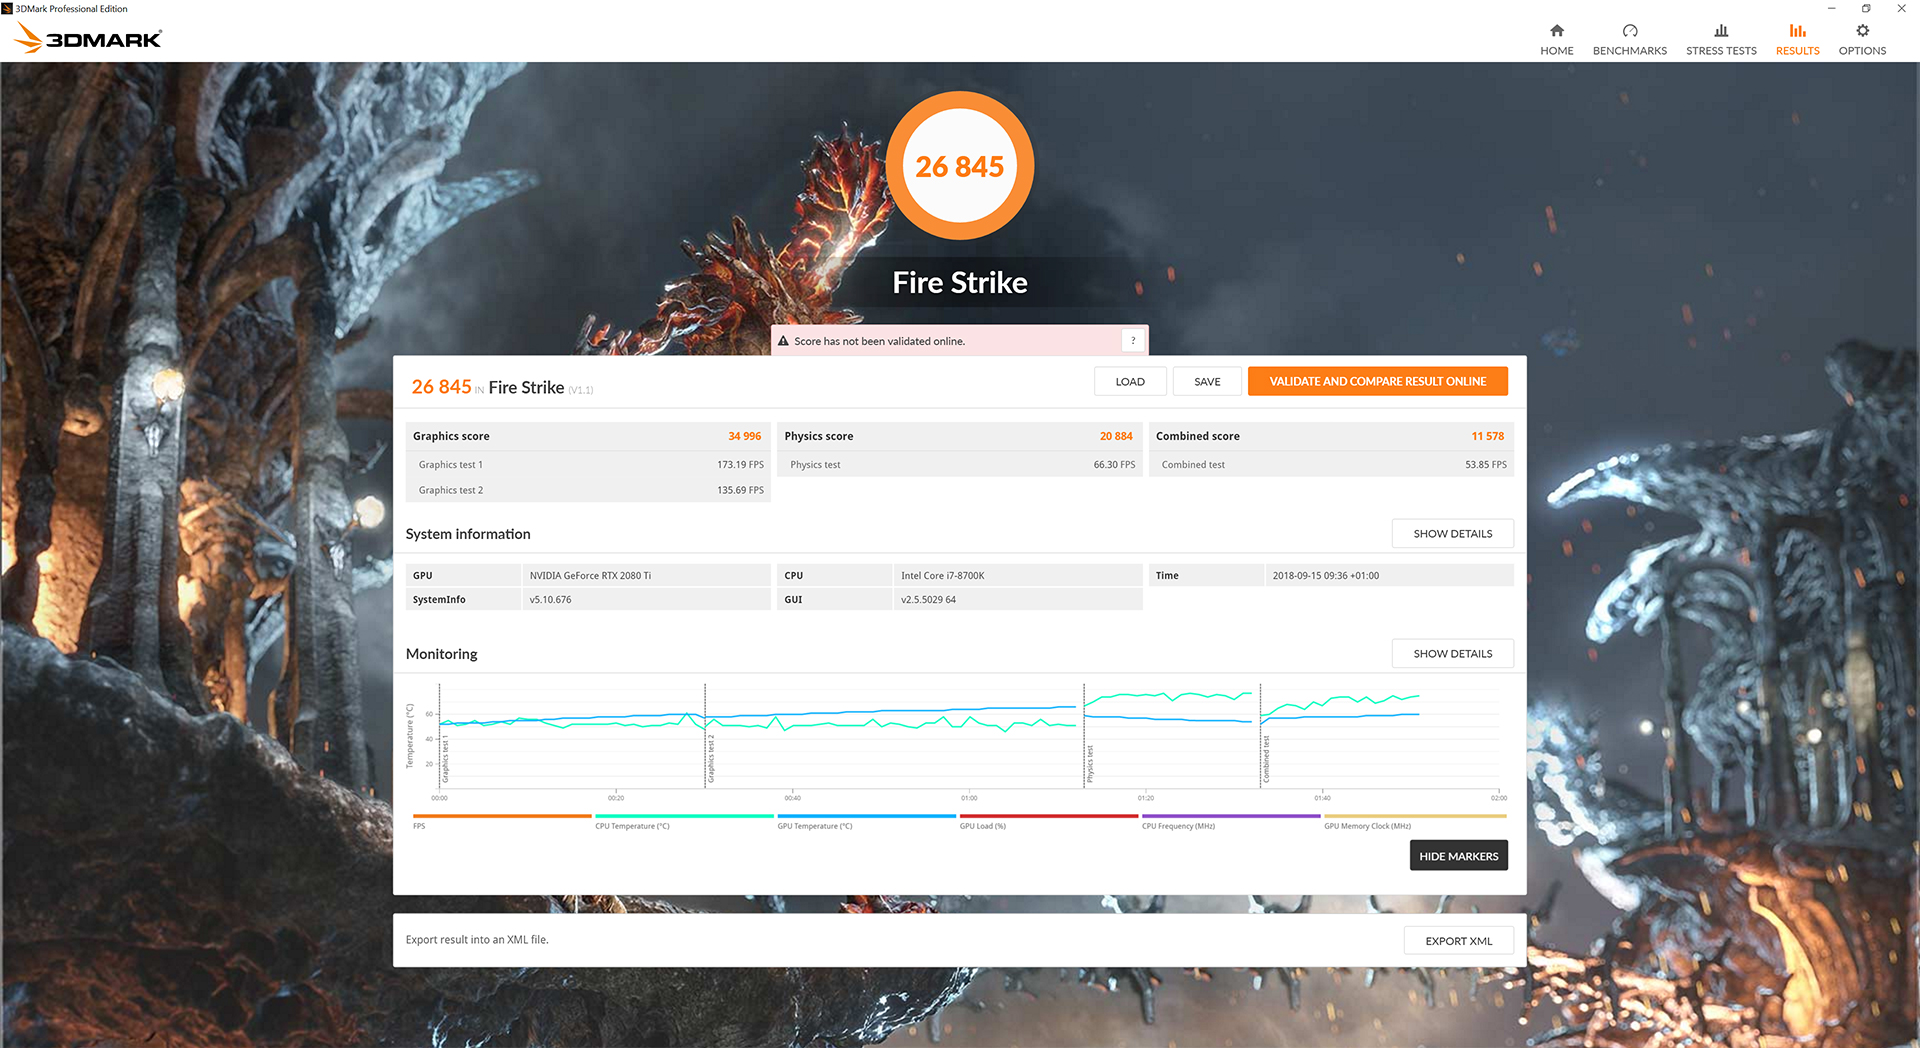
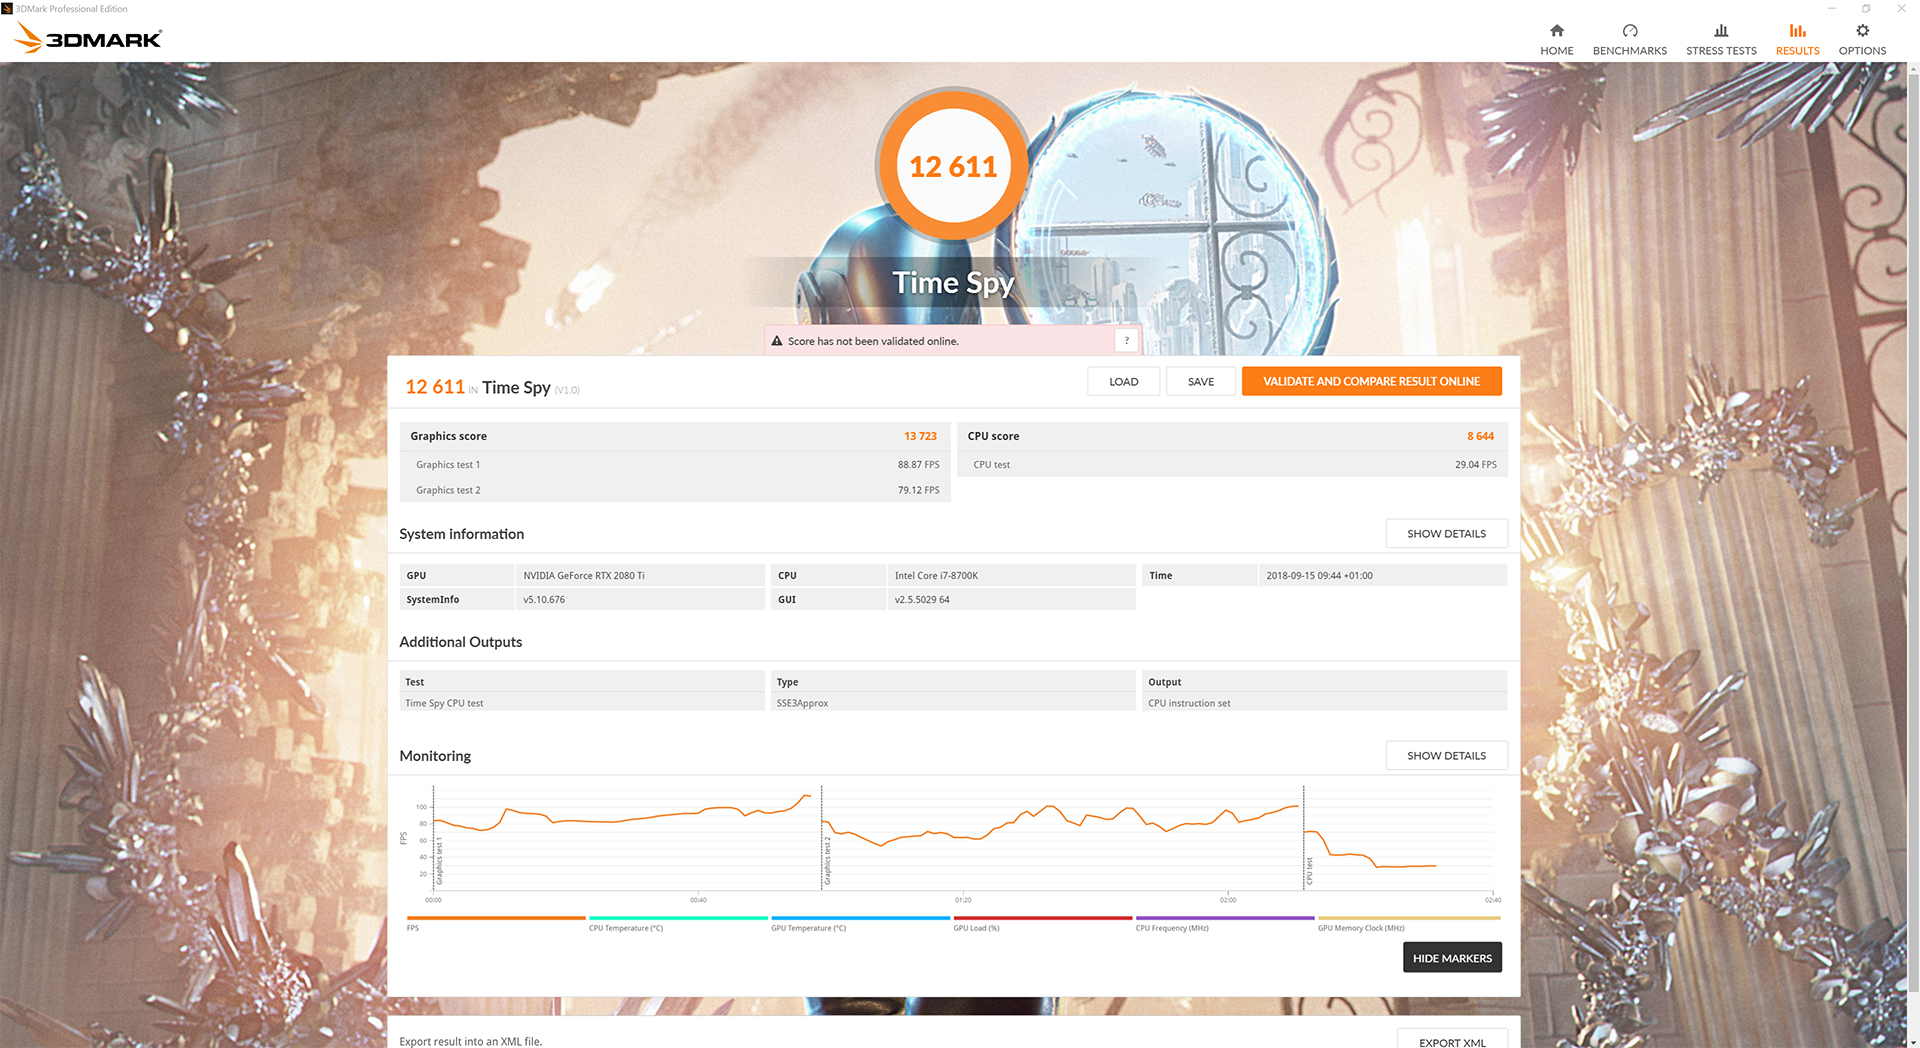

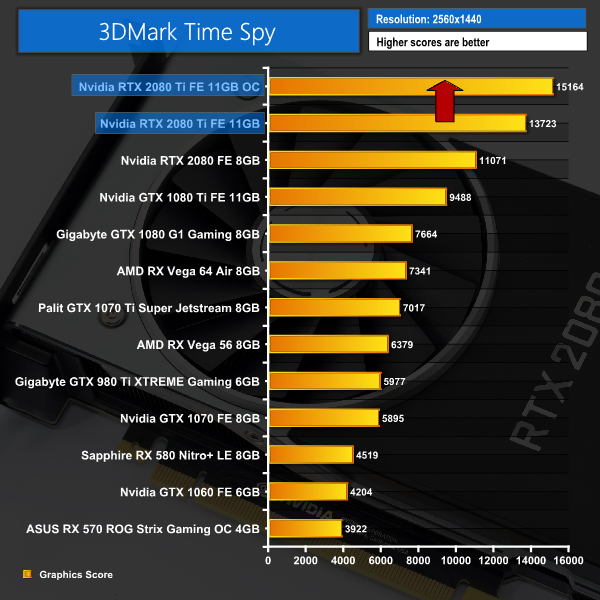
Well well well. How about that for a start – the RTX 2080 Ti kicks things off by coming in 22% than a GTX 1080 Ti in Fire Strike, while it ups this lead to a whopping 44% in the DX12 Time Spy test.
These are the highest 3DMark figures we have ever seen from a single graphics card.
Deus Ex: Mankind Divided is set in the year 2029, two years after the events of Human Revolution and the “Aug Incident”—an event in which mechanically augmented humans became uncontrollable and lethally violent. Unbeknownst to the public, the affected augmented received implanted technology designed to control them by the shadowy Illuminati, which is abused by a rogue member of the group to discredit augmentations completely. (Wikipedia).
We test using the Very High preset, with MSAA disabled. We use the DirectX 12 API.
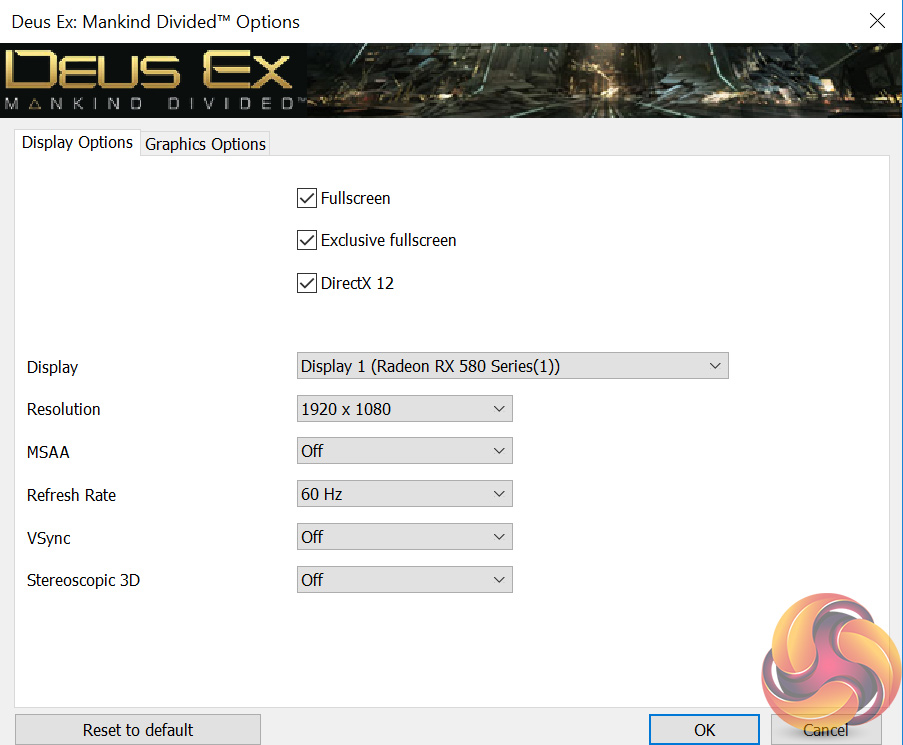
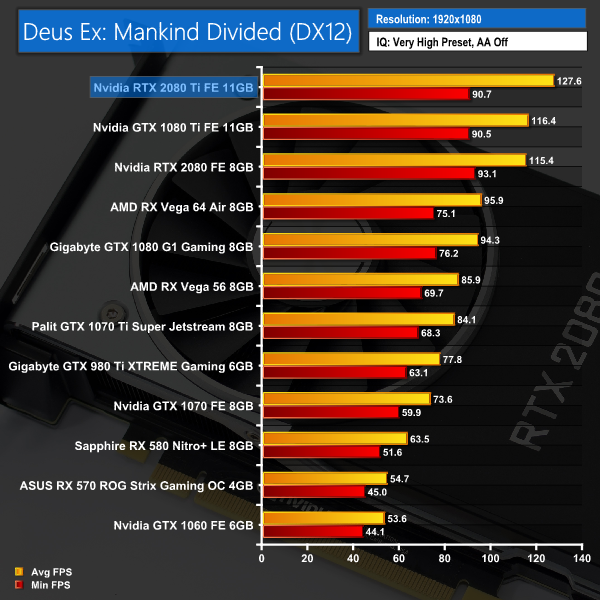
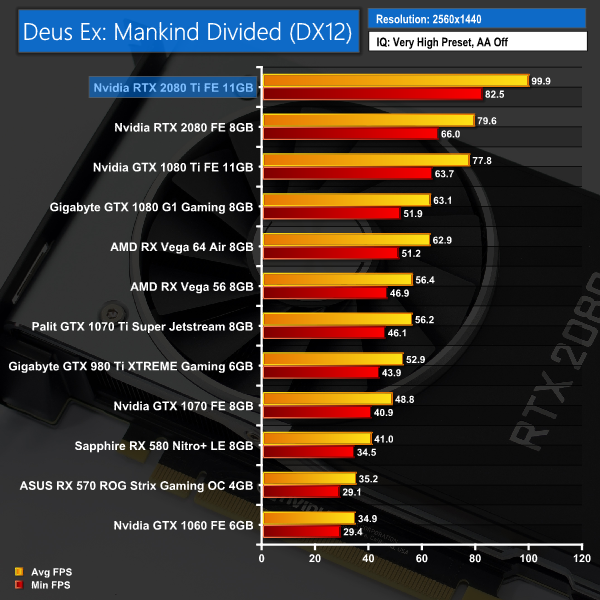
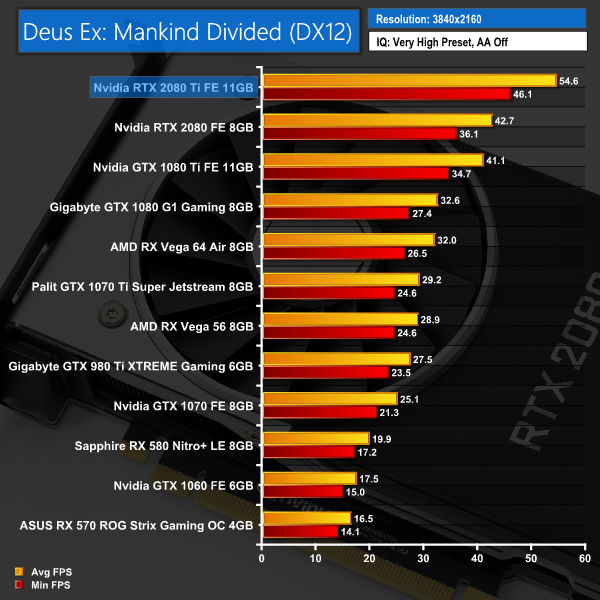
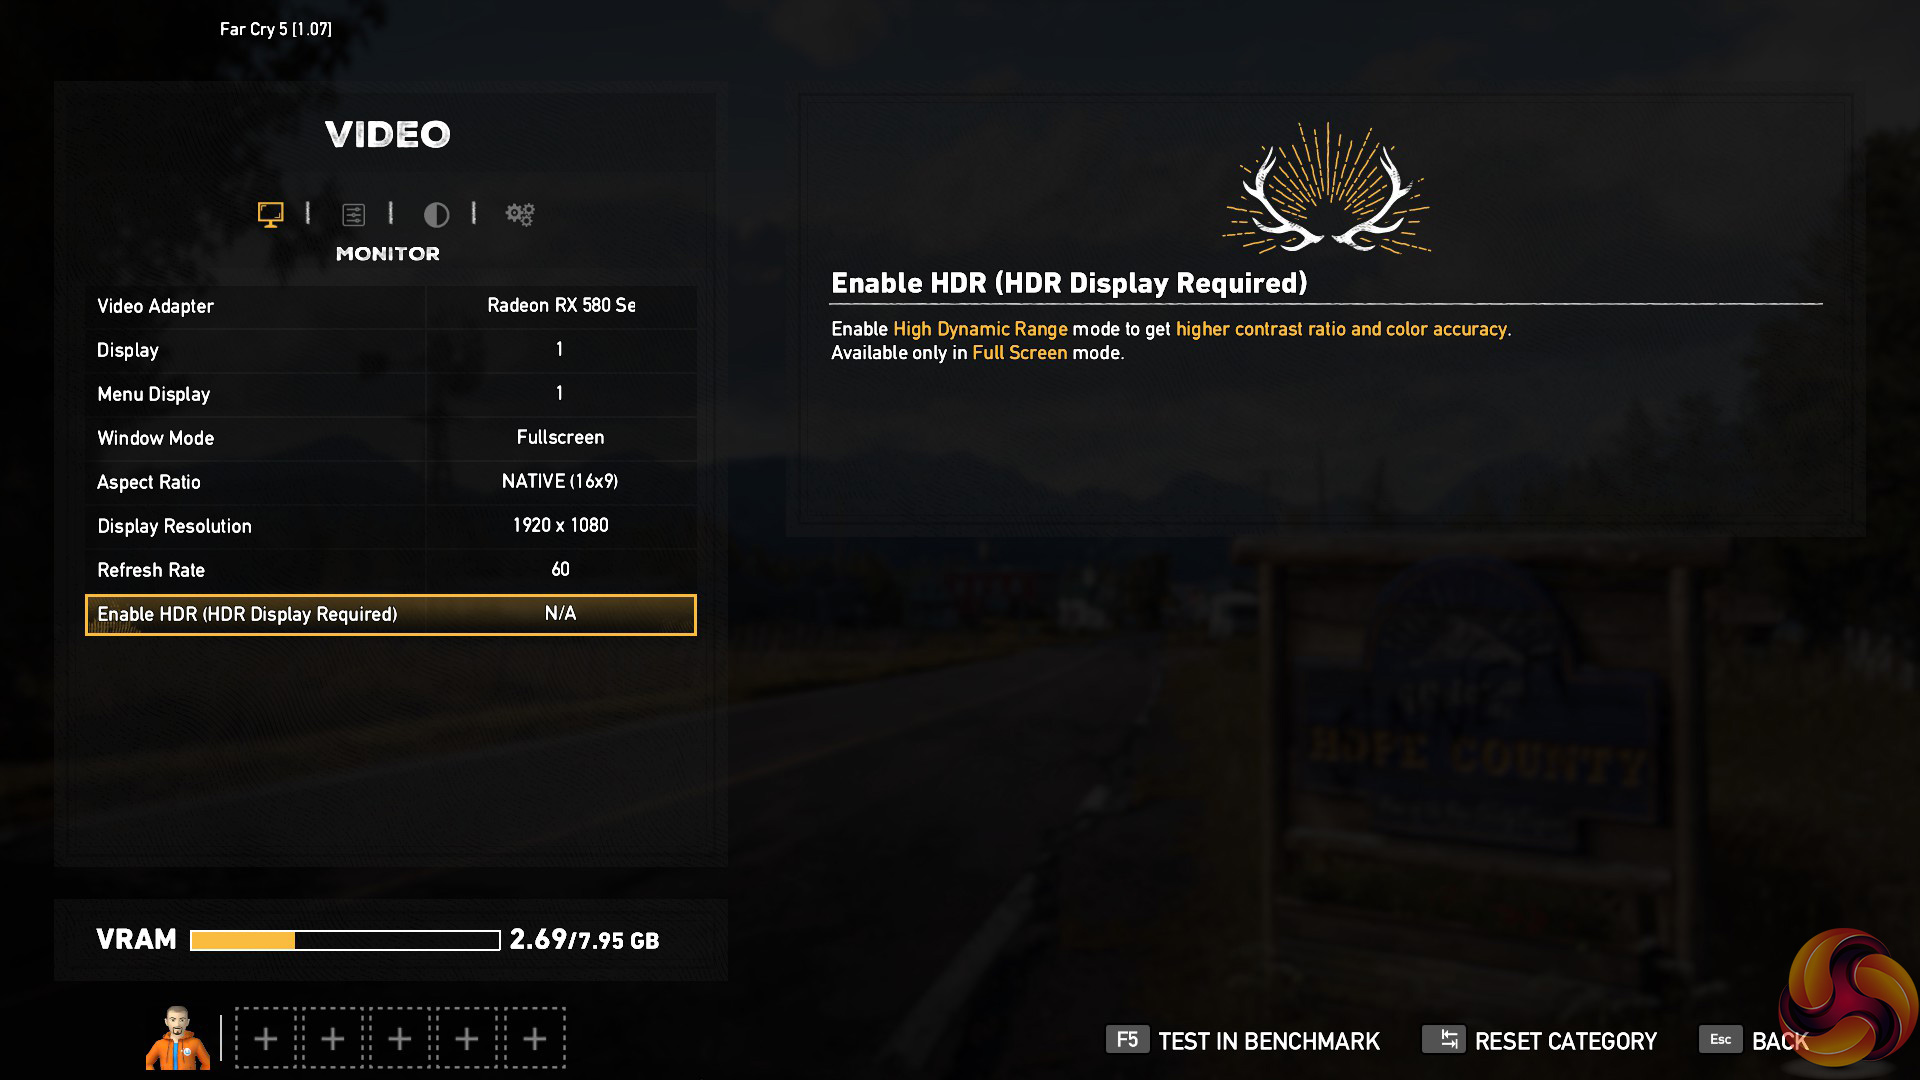
It's another strong lead for the RTX 2080 Ti when we get to Deus Ex: Mankind Divided. It's average of 54.6FPS, at 4K no less, is over 13FPS faster than the GTX 1080 Ti.Far Cry 5 is an action-adventure first-person shooter game developed by Ubisoft Montreal and Ubisoft Toronto and published by Ubisoft for Microsoft Windows, PlayStation 4 and Xbox One. It is the eleventh entry and the fifth main title in the Far Cry series, and was released on March 27, 2018.
The game takes place in the fictional Hope County, Montana, where charismatic preacher Joseph Seed and his cult Project at Eden’s Gate holds a dictatorial rule over the area. The story follows an unnamed junior deputy sheriff, who becomes trapped in Hope County and works alongside factions of a resistance to liberate the county from Eden’s Gate. (Wikipedia).
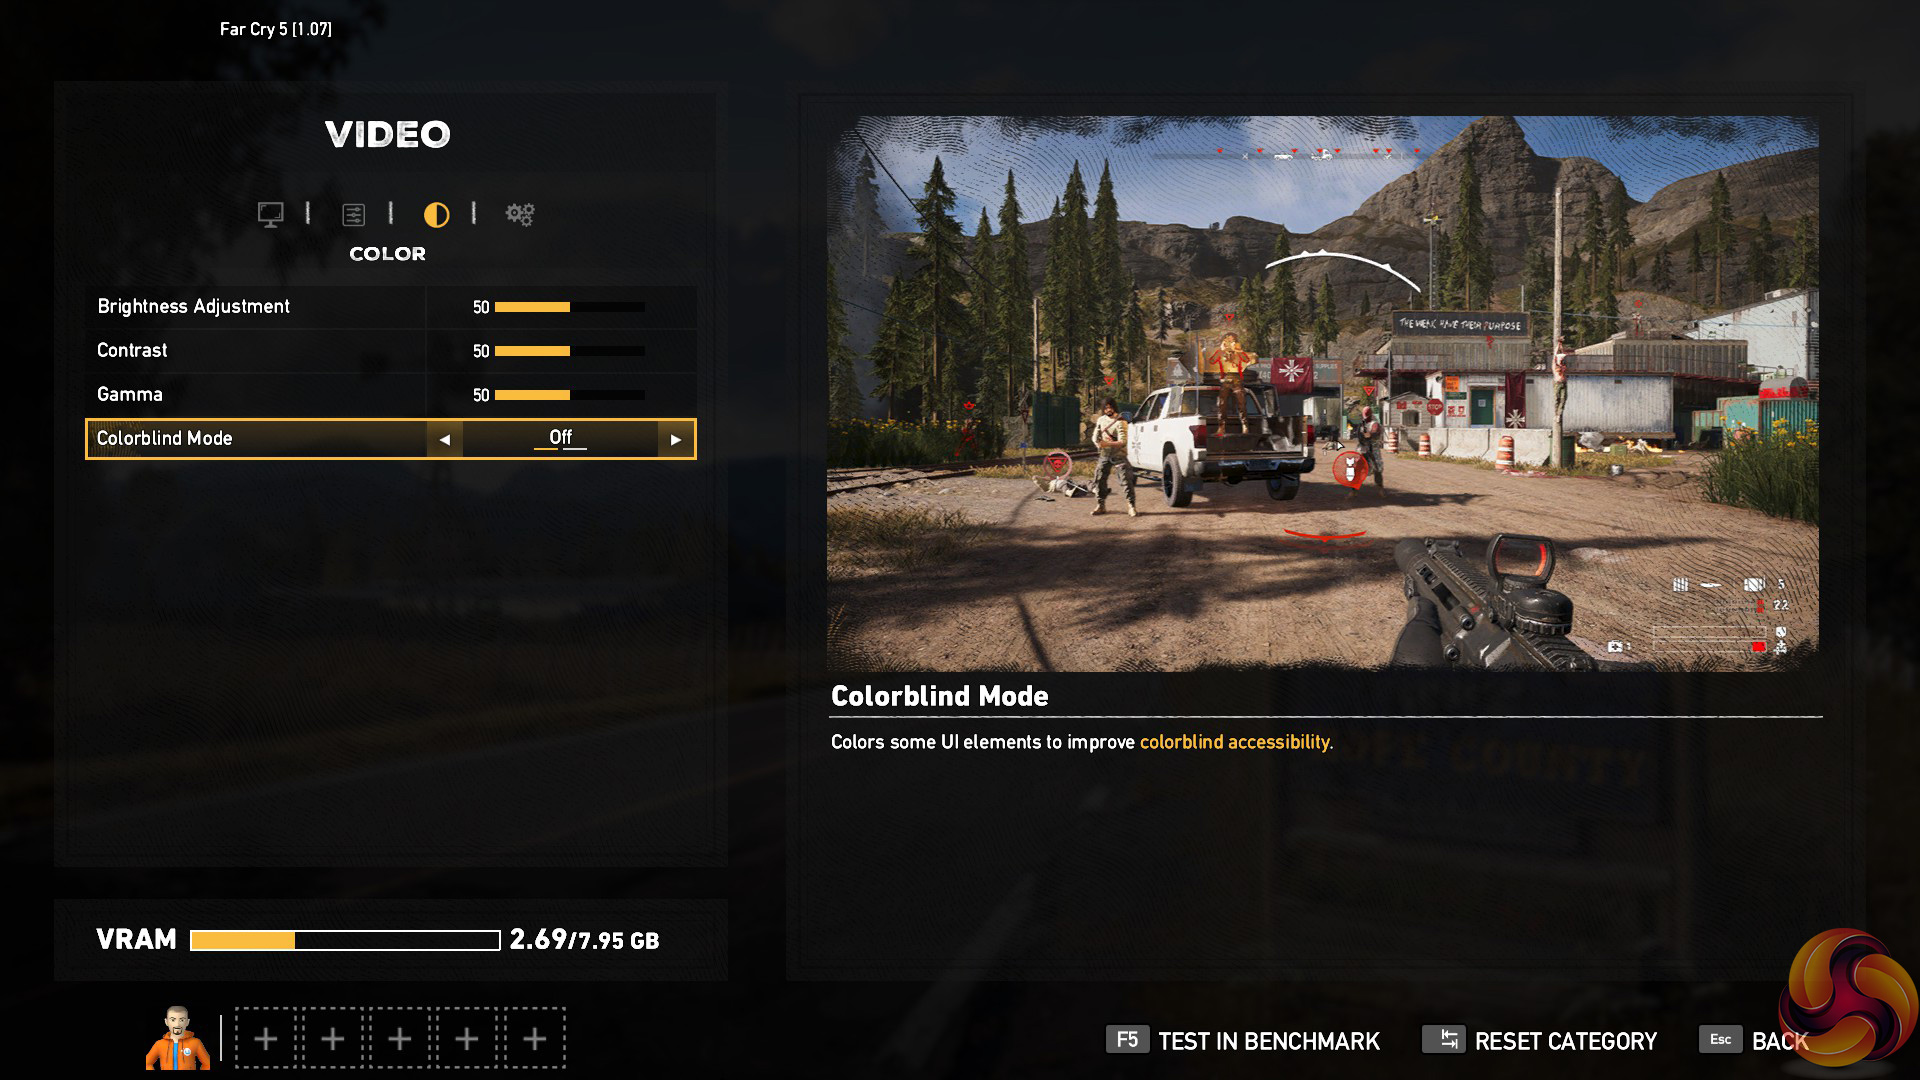
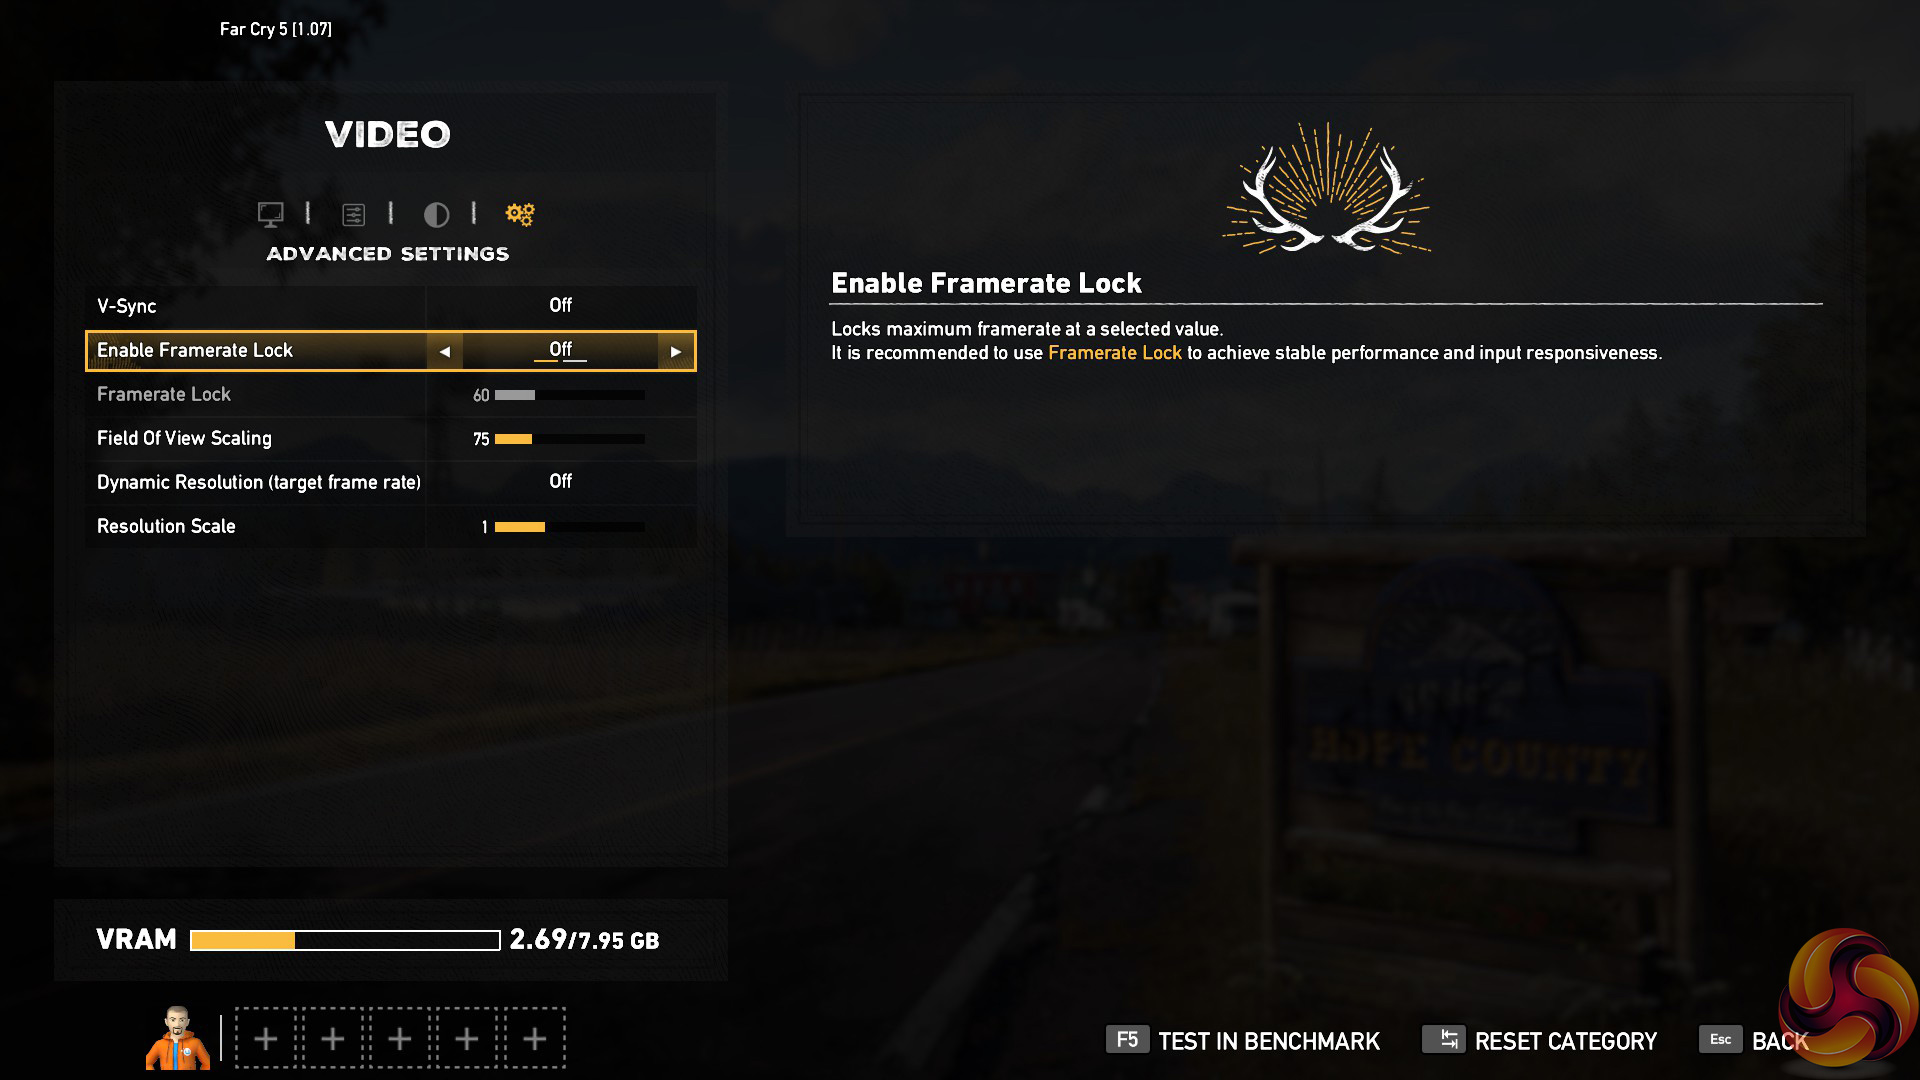
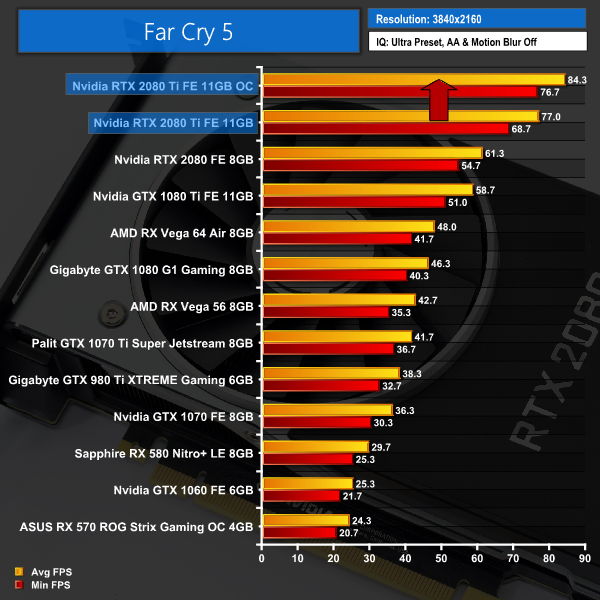
We test using the Ultra preset, with AA and motion blur disabled.
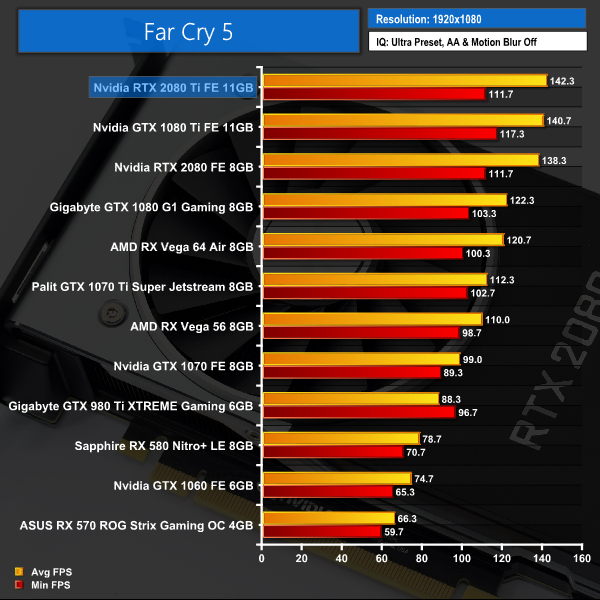
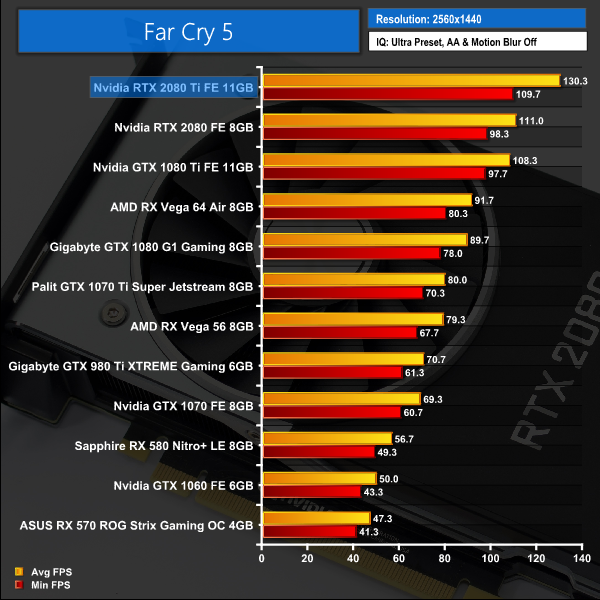
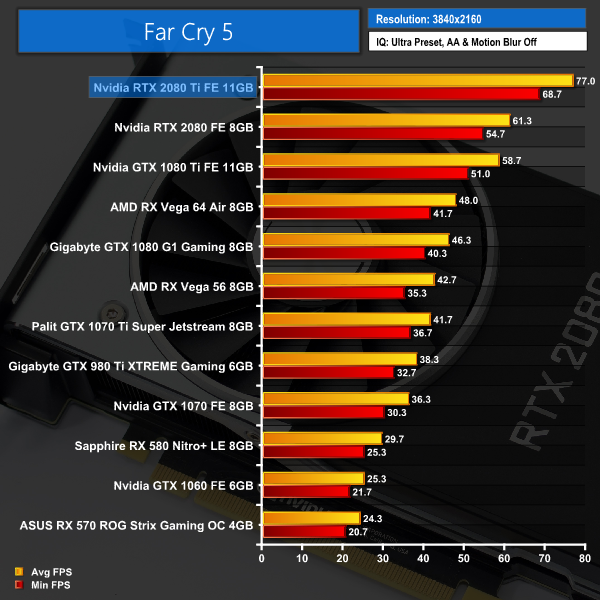
By now we know – the RTX 2080 Ti is fast. Seriously fast. 130FPS at 1440p and 77FPS at 4K? These are hugely impressive figures.
Incidentally, a loss of only 12FPS when raising the resolution from 1080p to 1440p shows us that even our overclocked 6-core i7-8700K is a bottleneck at 1080p with Far Cry 5.
Tom Clancy’s Ghost Recon Wildlands is a tactical shooter video game developed by Ubisoft Paris and published by Ubisoft. It was released worldwide on March 7, 2017, for Microsoft Windows, PlayStation 4 and Xbox One, as the tenth installment in the Tom Clancy’s Ghost Recon franchise and is the first game in the Ghost Recon series to feature an open world environment. (Wikipedia).
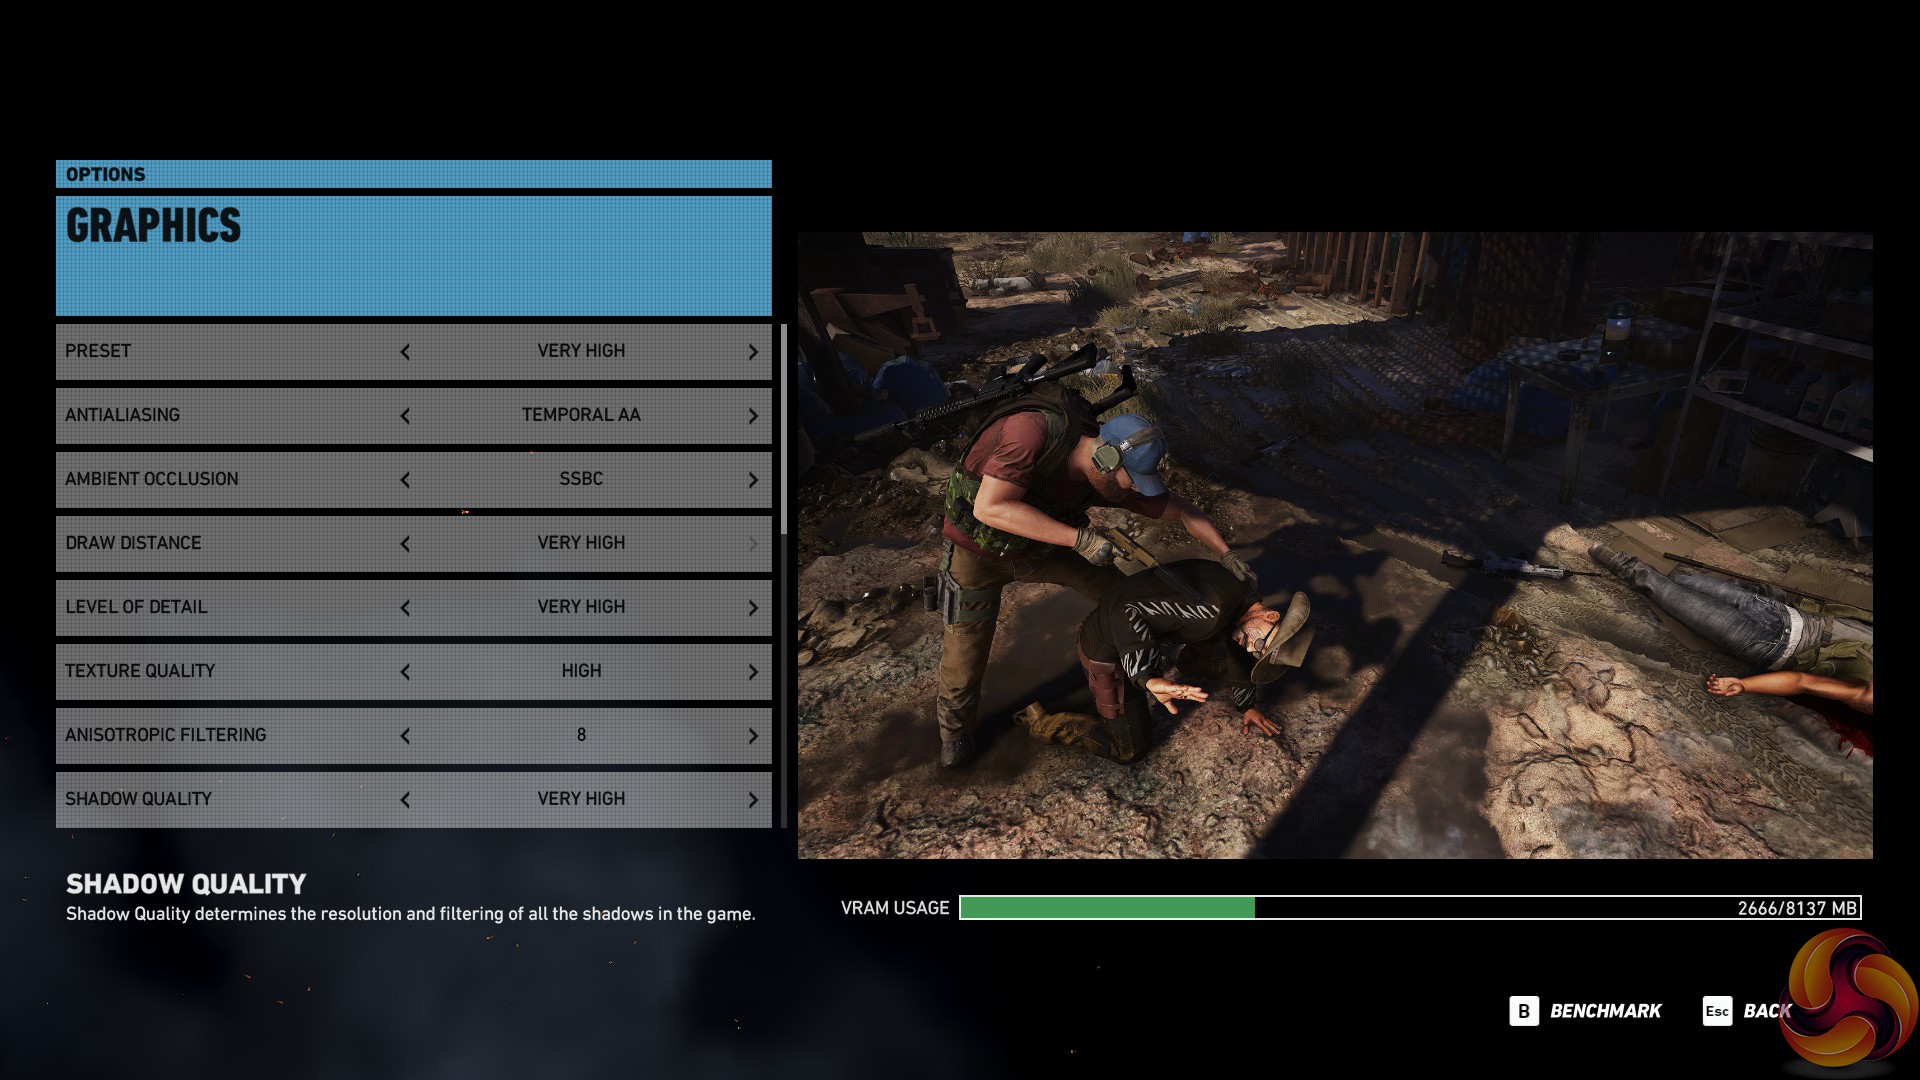
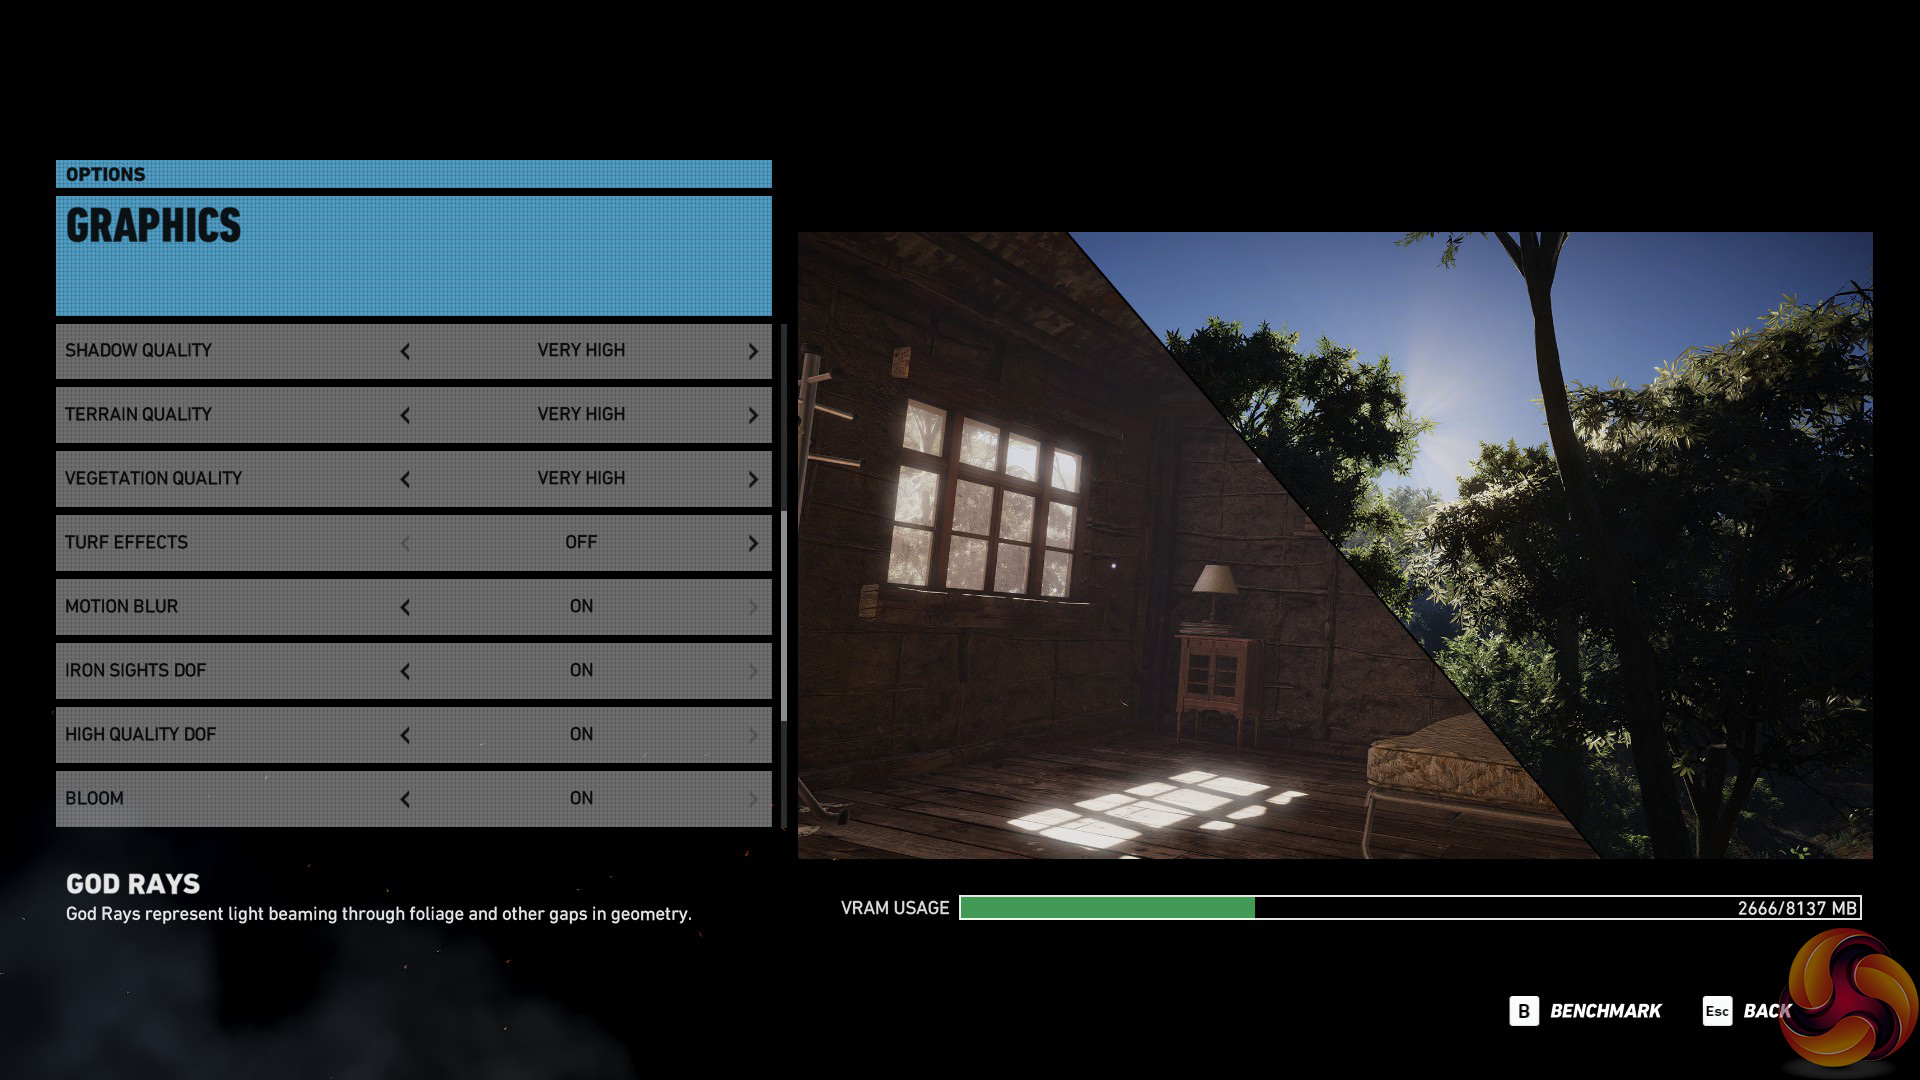
We test using the Very High preset.

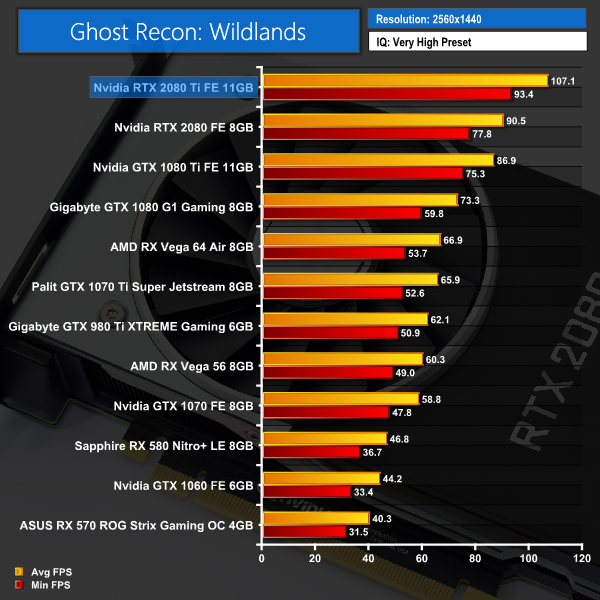
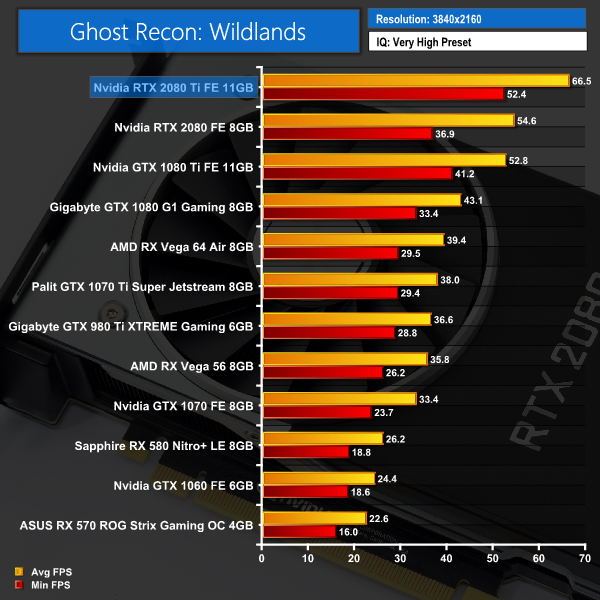
Ghost Recon: Wildlands again shows big gains to be had at 1440p and 4K resolutions – another jump of over 13FPS at the latter resolution is hugely significant for 4K gamers.
Middle-earth: Shadow of War is an action role-playing video game developed by Monolith Productions and published by Warner Bros. Interactive Entertainment. It is the sequel to 2014’s Middle-earth: Shadow of Mordor, and was released worldwide for Microsoft Windows, PlayStation 4, and Xbox One on October 10, 2017. (Wikipedia).
We test using the Very High preset.

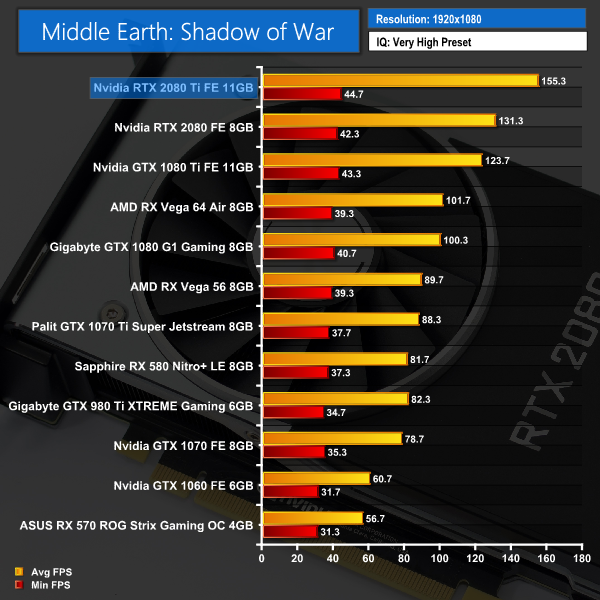
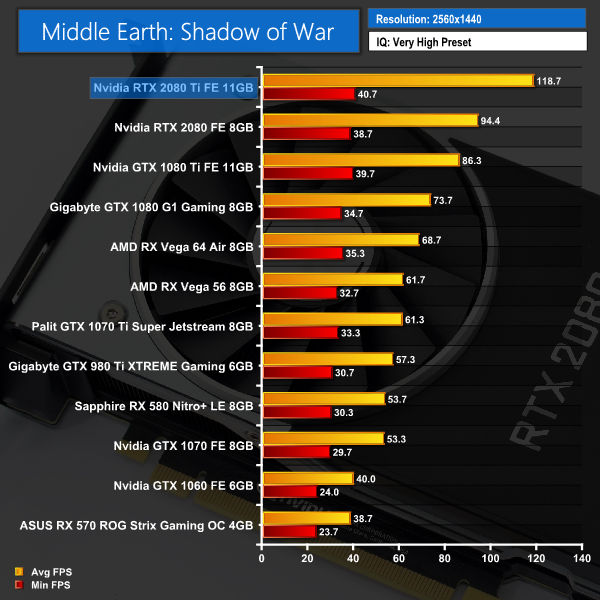
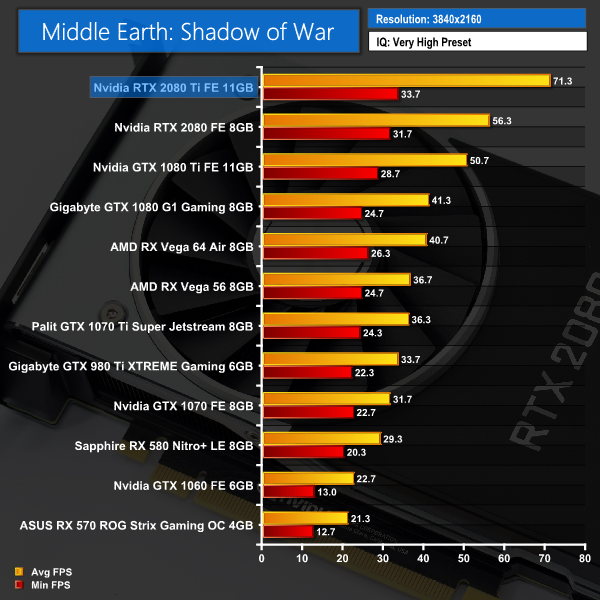
We again see average frame rates well over 60 FPS at 4K, while 1440p gamers will see frame rates getting on for 120FPS – perfect for use with a high refresh-rate monitor.Shadow of the Tomb Raider is an action-adventure video game developed by Eidos Montréal in conjunction with Crystal Dynamics and published by Square Enix. It continues the narrative from the 2013 game Tomb Raider and its sequel Rise of the Tomb Raider, and is the twelfth mainline entry in the Tomb Raider series. The game released worldwide on 14 September 2018 for Microsoft Windows, PlayStation 4 and Xbox One. (Wikipedia).
We test using the Highest preset, with AA disabled. We test using the DX12 API.
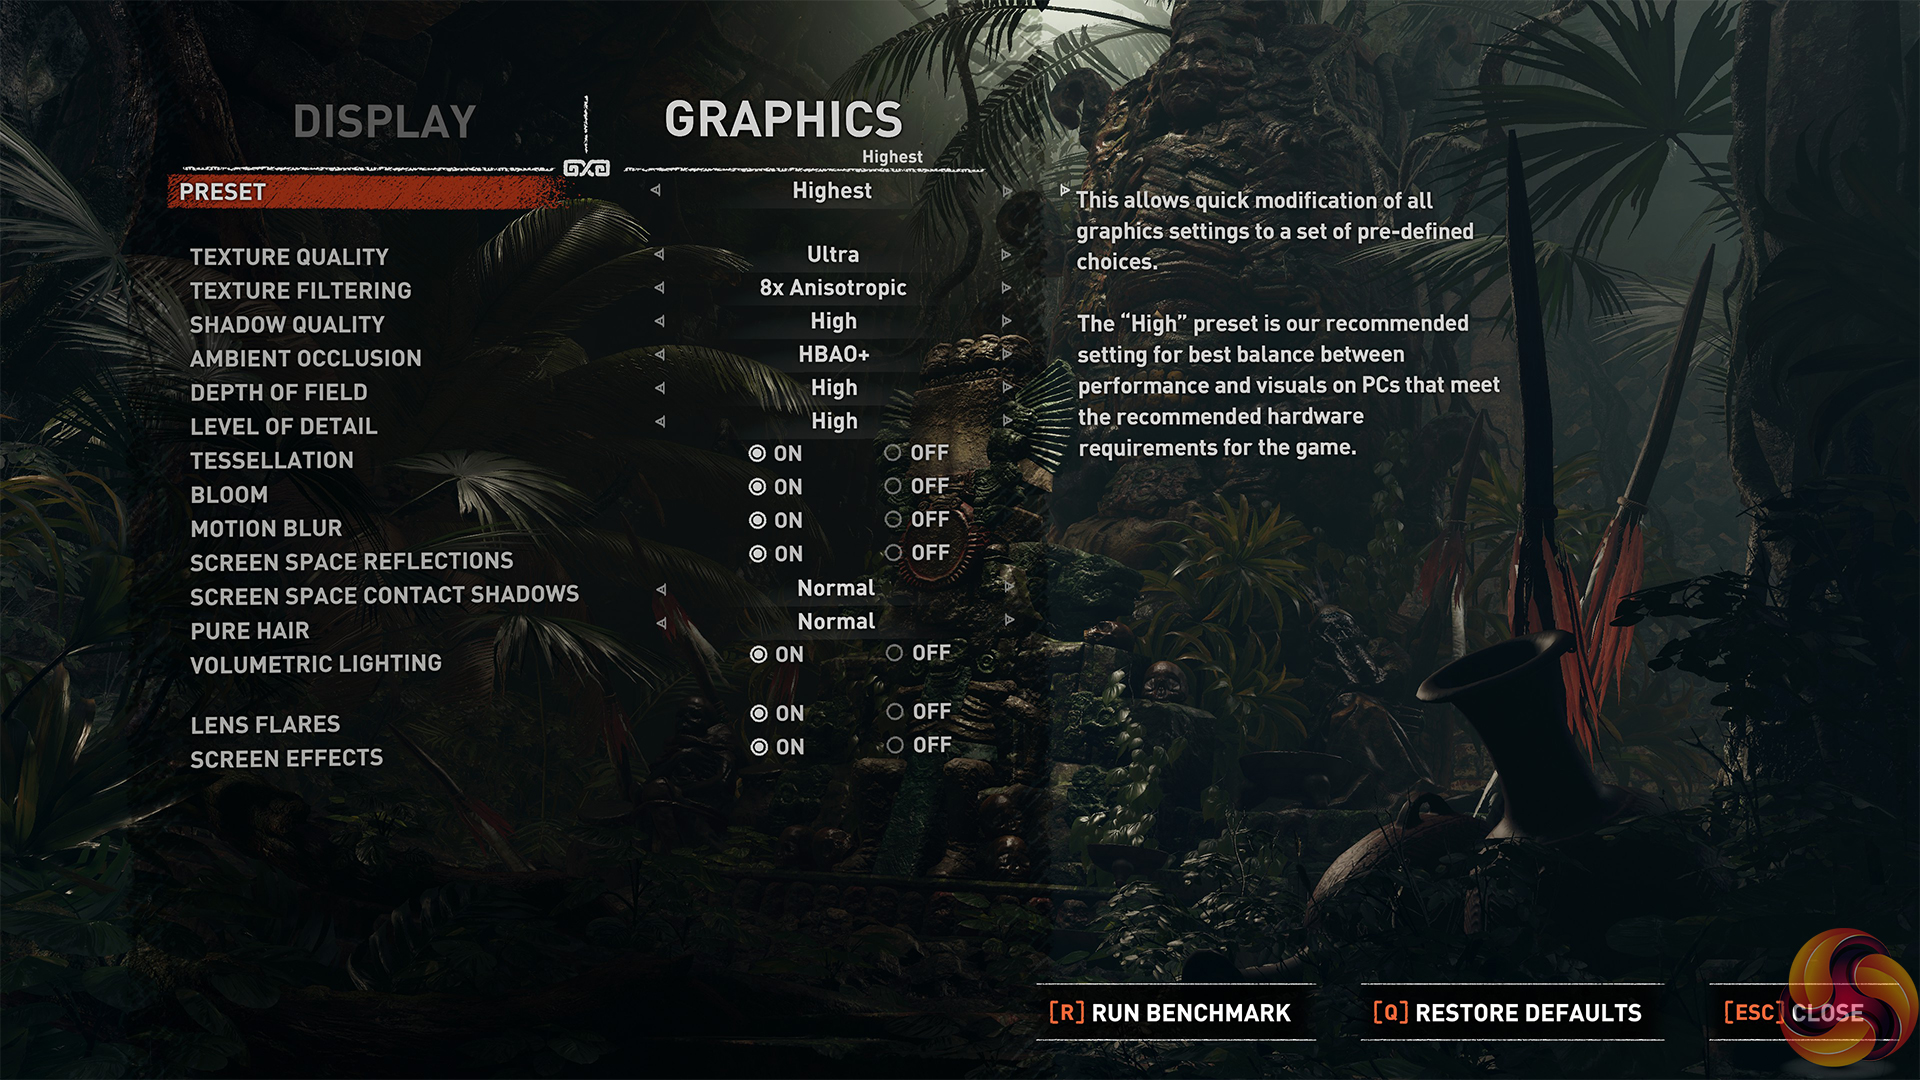
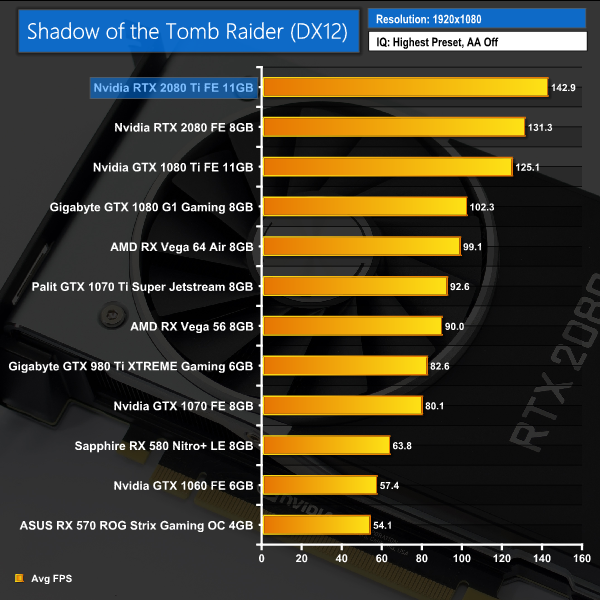
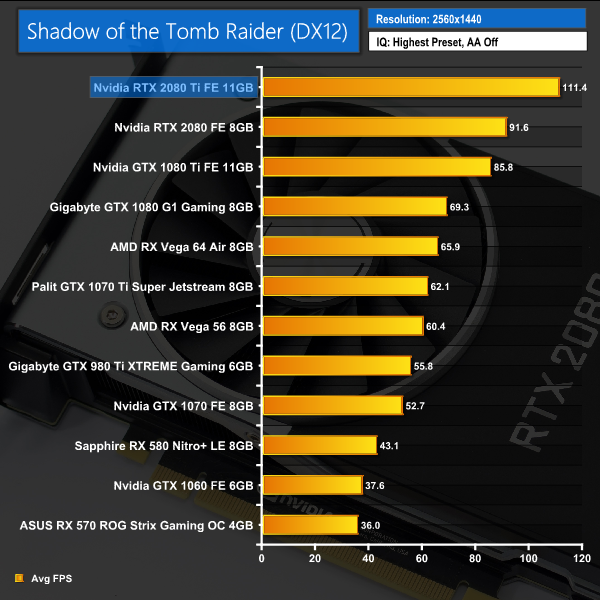
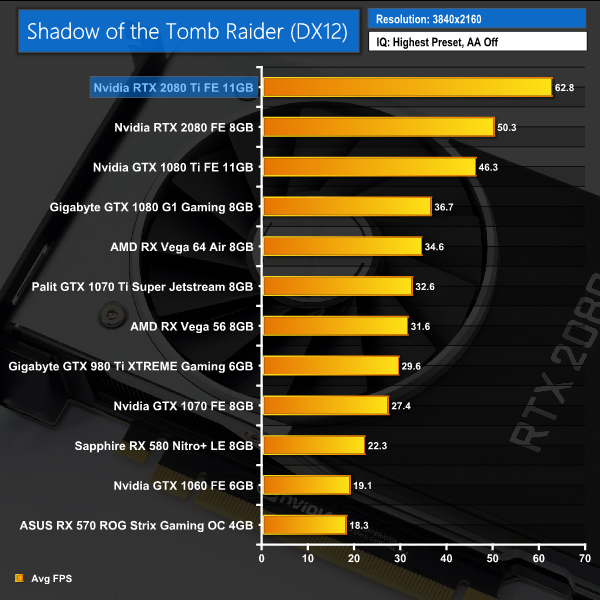
Our newest game to join the roster, Shadow of the Tomb Raider shows an average of 62FPS at 4K resolution, with the average increasing to over 110FPS at 1440p. Both results are significantly faster than the GTX 1080 Ti frame rates.As mentioned at the beginning of this review, we are unable to test real-time ray tracing in games until the release of DXR in October. Nvidia did release one demo for the press to use when testing the ray tracing capabilities of the Turing GPUs – it’s named ‘Reflections’ and you will likely have seen it plenty of times, it’s the short clip showing two stormtroopers mocking Captain Phasma. You can watch it on YouTube HERE.
While this demo shows an FPS counter while it is running, there is sadly no way to record average and minimum frame rates. The difference in frame rate is noticeable when run with different cards, though, so without being able to provide any exact benchmark figures, we filmed a short video to show you how the ray tracing demo performs with different GPUs:
As we can observe from the video, here are the trends exhibited by our four test cards:
- GTX 1080: The slowest card, the GTX 1080 ran the demo at 6-8FPS, with one or two moments where it jumped to 10FPS but no higher. It also dipped to 5FPS during the elevator scene.
- GTX 1080 Ti: This card ran the demo at between 8-10FPS. It did occasionally peak above 10FPS, but also dipped as low as 6FPS during the elevator scene. It did not look very smooth.
- RTX 2080: A much better experience here, the RTX 2080 ran the demo between 43-48FPS, with some peaks into the mid 50s. It did drop down to 35FPS during the intensive elevator scene, but overall a smooth viewing experience.
- RTX 2080 Ti: Proving even better still, the RTX 2080 Ti ran the demo around the 55-60FPS mark, with peaks almost at 70FPS. It again dipped to 46FPS, but the trend is clear to see.
So, there we have it. There’s no doubt that ray tracing works far better with Turing hardware than it does with Pascal – the GTX 1080 Ti looked like a slideshow when running the demo, whereas the RTX 2080 Ti was averaging close to the 60FPS mark based on the frame counter that I could see. That means the RTX 2080 Ti is roughly 6-7 times as fast as the GTX 1080 Ti when it comes to ray tracing.
Of course, this is only one demo, and it comes from Nvidia directly – they wouldn’t exactly gives us something that made ray tracing look bad. Because of that, we can’t conclusively say how the RTX 20 series is going to handle ray tracing when it comes to real-world game performance. At the same time, it would be foolish to dismiss the only benchmark for ray tracing performance that we currently have.
We will certainly know more when DXR is released next month and we can test actual games that use ray tracing. Still, for now – this demo does give a glimpse of the potential of the Turing architecture.We are in a similar situation with Deep Learning Super Sampling (DLSS) that we are with ray tracing – no game on the market currently supports it, though that should hopefully change soon as thankfully we do not have to wait for a Microsoft update for games to utilise the new technology. It is a Turing-specific feature, though, so it won’t be available to those with Pascal (or older) GPUs.
Nvidia supplied another demo for the purposes of this review – this time from Final Fantasy XV. We were able to run the demo at 4K with both TAA and DLSS anti aliasing solutions. We used FRAPS to extract minimum and average FPS figures, after a 1-minute run.
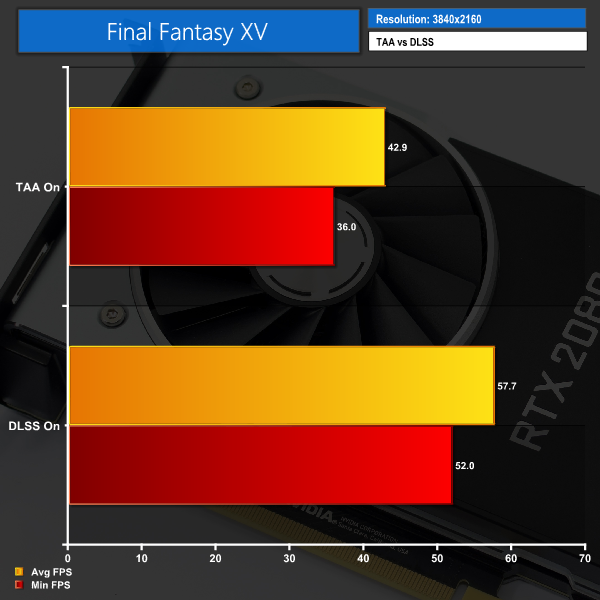
Using the FFXV demo, DLSS certainly seems to make a big difference – average frame rate improves by a huge 34%, while minimum FPS also jumps up 44%. Again, it’s only one demo – provided by Nvidia – but it does show DLSS could offer significantly better performance when running with AA on. This is exciting.
So, that’s the performance from the demo, what about visual fidelity?
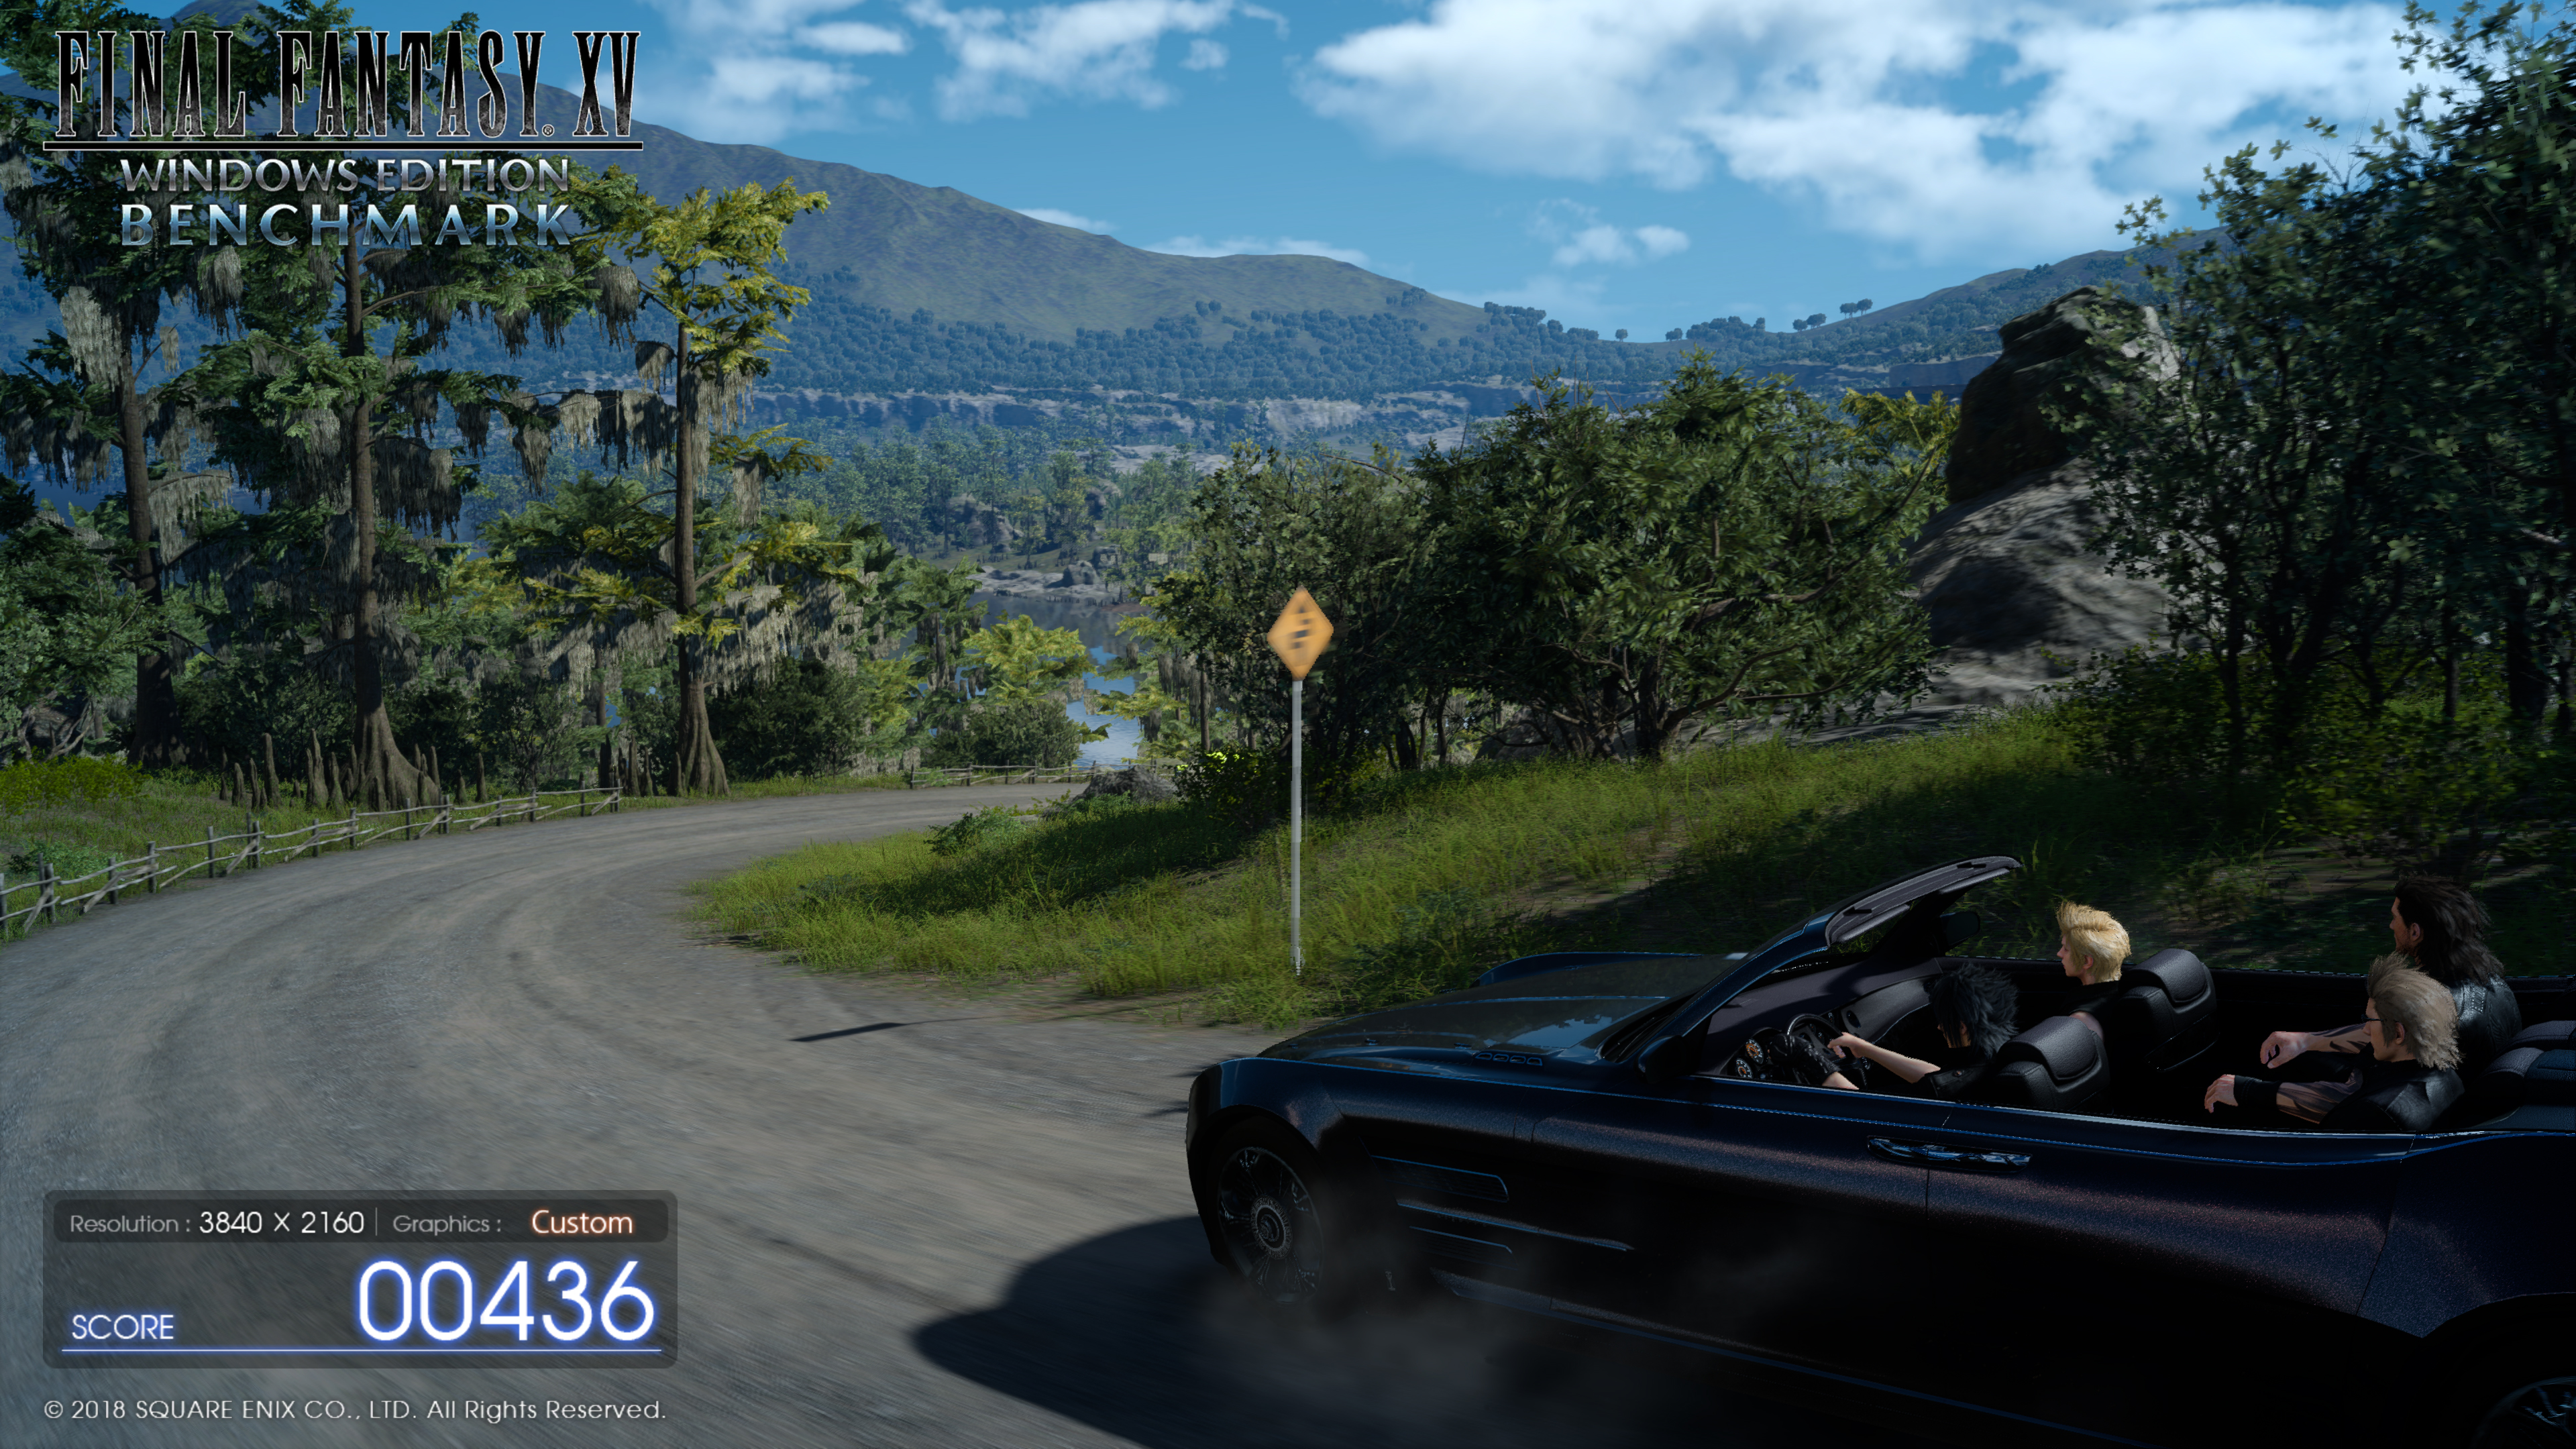
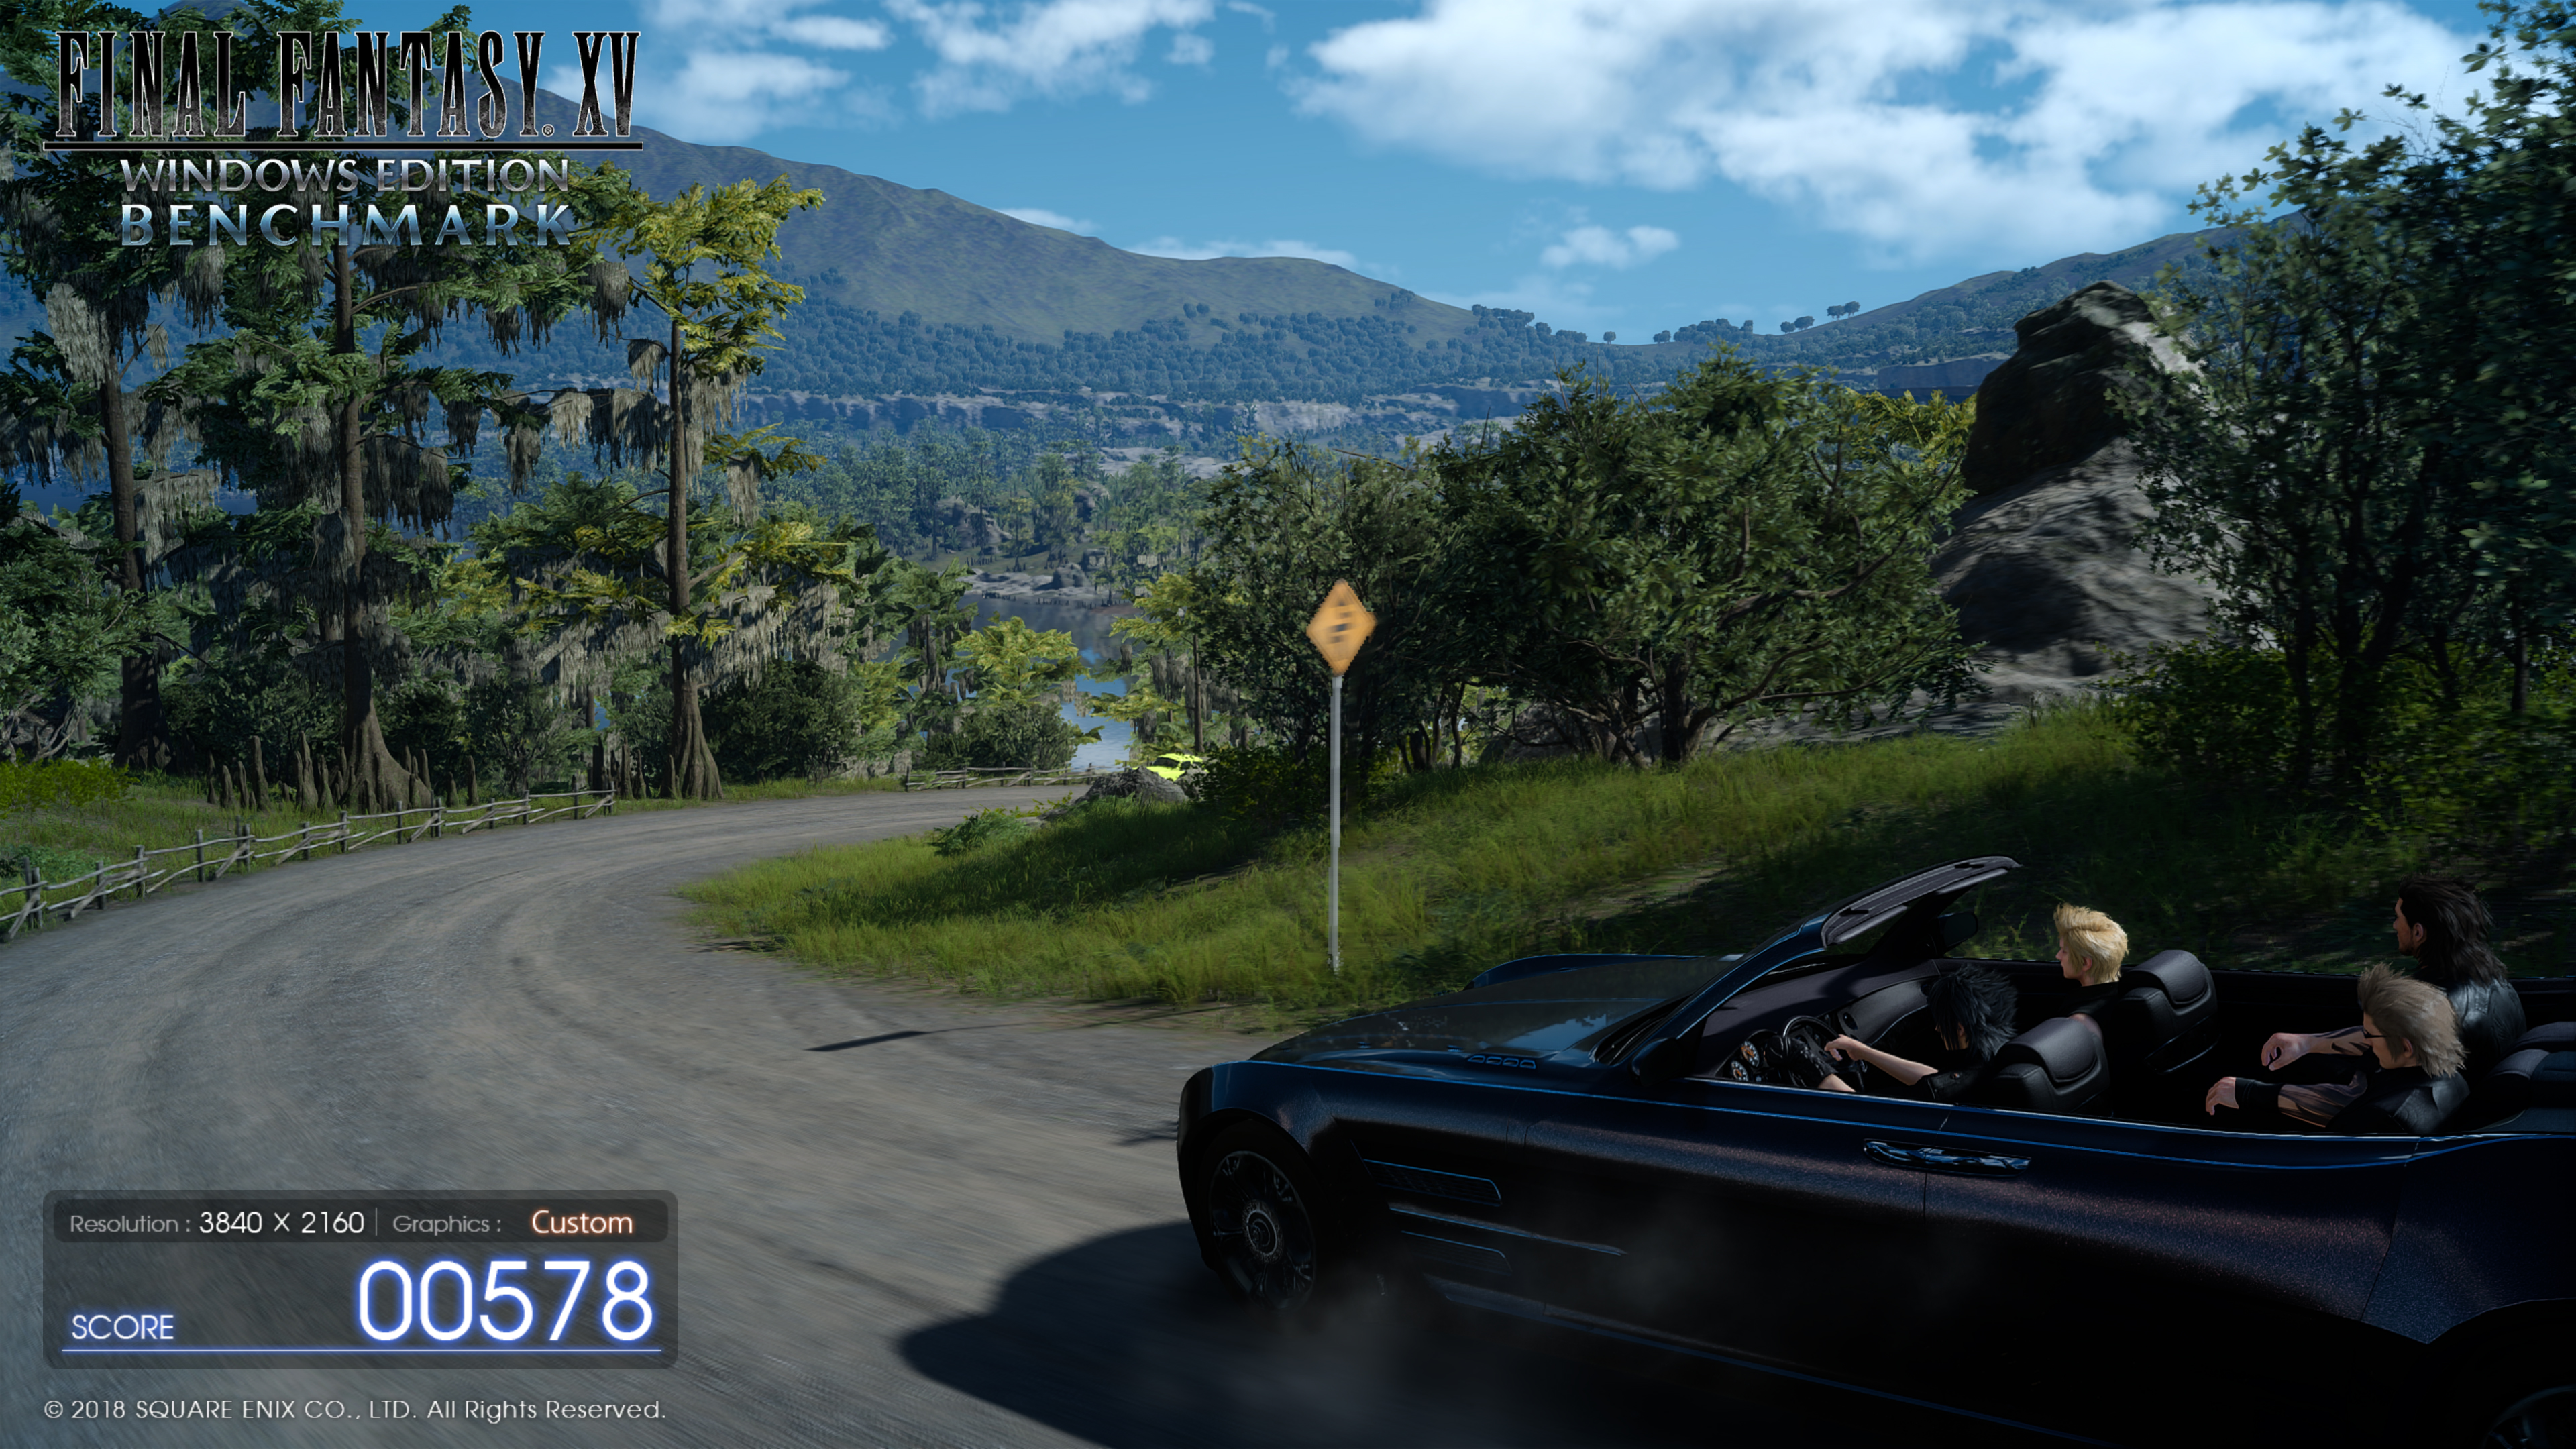
TAA on, left, versus DLSS on, right
The above screenshots were taken directly from the FFXV demo running on our RTX 2080. On the left we have the demo running 4K TAA on, and on the right the demo is at 4K with DLSS on instead. From this big-picture view, it may not look like there is much between the two.
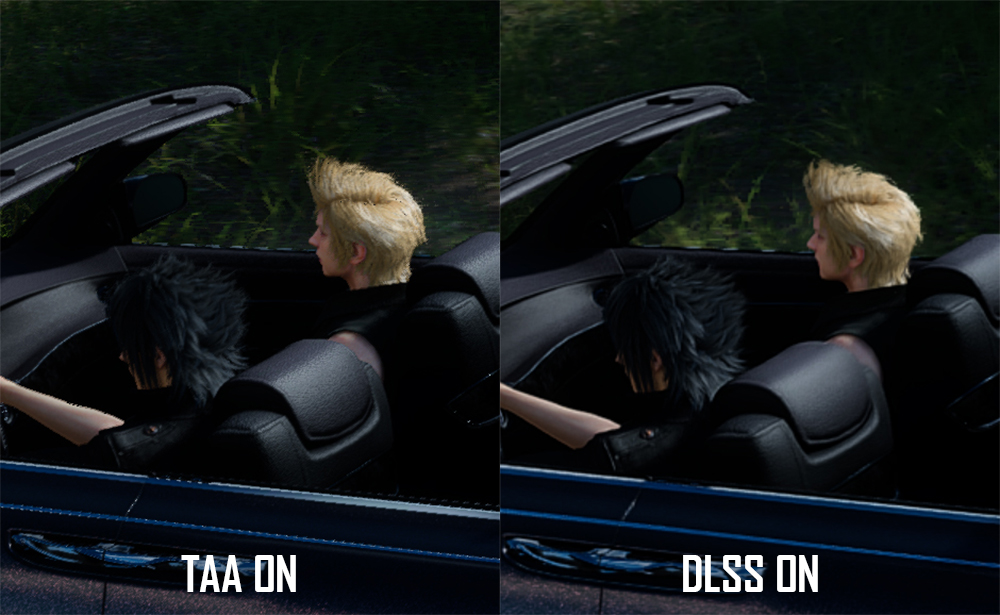
When we really crop in close, however, I think the difference is clear to see. TAA has noticeably more ‘jaggies’, while there are also some artifacts around the blonde hair. DLSS does look overall a bit softer, but it is noticeably smoother and overall a better-looking image.
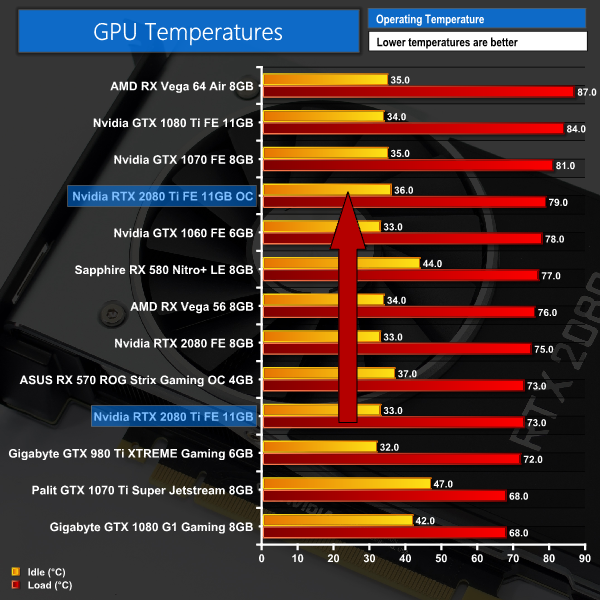
I look forward to testing this further in a real-world in-game environment. This demo has certainly given us some insight, but again – it is a single demo. We can’t really judge DLSS on a single example just yet – but just like ray tracing, the potential is there to see for DLSS and Turing GPUs.For our temperature testing, we measure the peak GPU core temperature under load, as well as the GPU temperature with the card idling on the desktop. A reading under load comes from running the 3DMark Fire Strike Ultra stress test 20 times. An idle reading comes after leaving the system on the Windows desktop for 30 minutes.
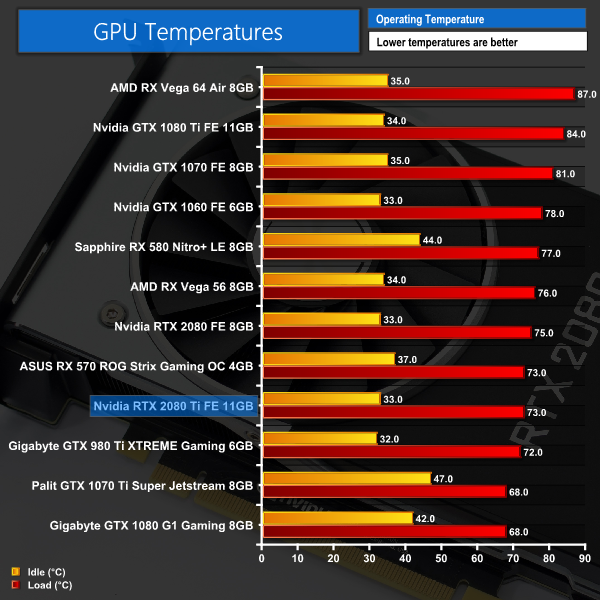
I had to double take the first time I saw the temperature results for the RTX 2080 Ti. A peak of just 73C for Nvidia's flagship GPU? It's unheard of – and goes to show just how effective the new Founders Edition cooler is, with both the full-length vapour chamber and the new axial fans to thank here.
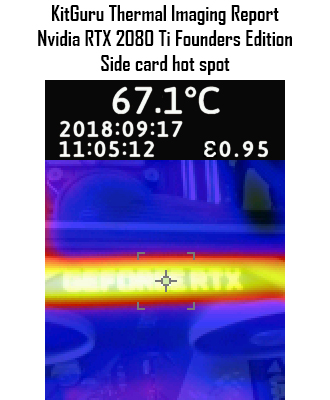
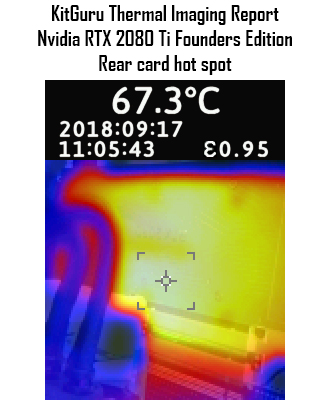
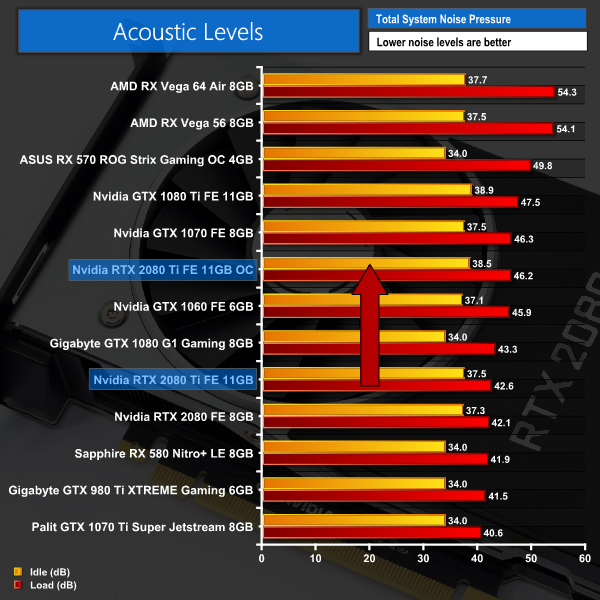
The thermal gun testing doesn't reveal any issues either – the hot spots on both the side and the back of the card did not top 70C. The 67.3C result for the back of the card also shows the benefit of having a backplate – you can see the heat is spread fairly evenly, as opposed to being concentrated in one area behind the GPU core.We take our noise measurements with the sound meter positioned 1 foot from the graphics card. I measured the sound floor to be 34 dBA, thus anything above this level can be attributed to the graphics cards. The power supply is passive for the entire power output range we tested all graphics cards in, while all CPU and system fans were disabled.
A reading under load comes from running the 3DMark Fire Strike Ultra stress test 20 times. An idle reading comes after leaving the system on the Windows desktop for 30 minutes.
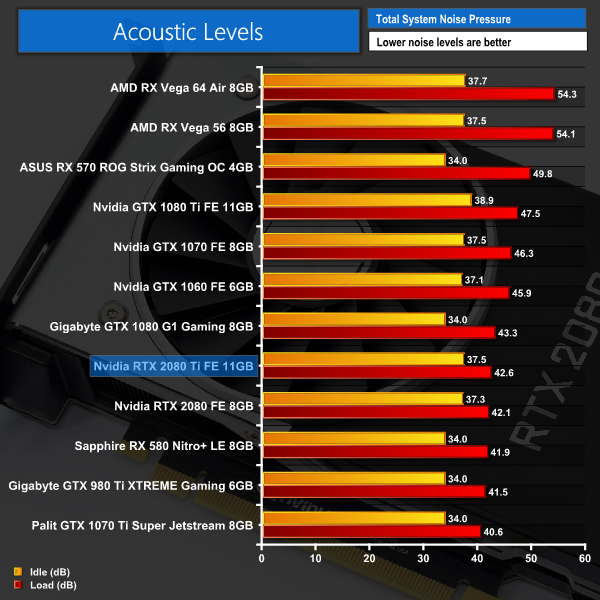
We've already seen just how impressive the new Founders Edition card is in terms of temperatures – but it is also fantastically quiet. OK, it is not the quietest card we've ever tested – but this is an Nvidia reference design, cards which usually run fairly hot and relatively loud.
This new Founders card has changed all of that, to the point where this card is quieter than some previous-generation aftermarket cards. It is hugely impressive.We have recently revamped our GPU power consumption testing. Previously we would measure the total system power draw with each graphics card installed. Given that the rest of the components did not change, this gave us an idea of the relative power consumption of each graphics card, but we could not be more specific than that.
Now, however, thanks to Cybenetics Labs and its Powenetics Project, we are able to measure the power consumption of the graphics card alone, giving much more precise and accurate data. Essentially, this works by installing sensors in the PCIe power cables, as well as the PCIe slot itself thanks to a special riser card. This data is recorded using specialist software provided by Cybenetics Labs and given it polls multiple times a second (between 6 and 8 times a second, based on my observations) we can track the power consumption in incredible detail over any given amount of time.
You can read more about the Powenetics Project over HERE.
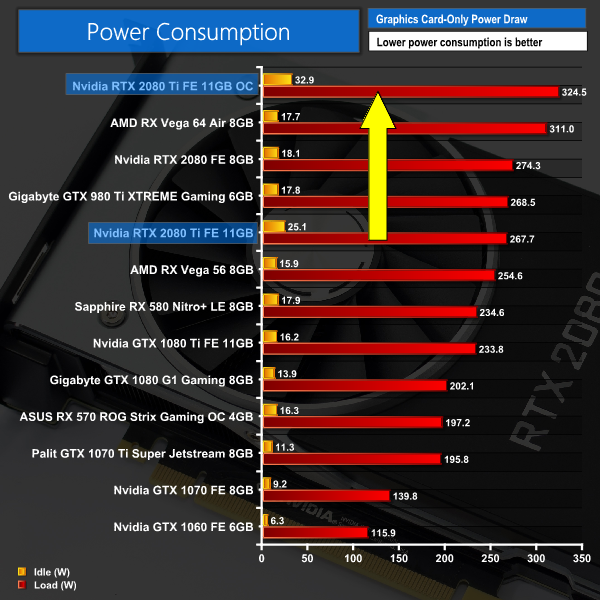
As with previous testing, a reading under load comes from running the 3DMark Fire Strike Ultra stress test 20 times. An idle reading comes after leaving the system on the Windows desktop for 30 minutes. This stress test (20 runs) produces approximately 4300 data entries in the Powenetics software, which we can then export to an Excel file and analyse further. Here we present the average continuous power consumption of each graphics card across the entire 20 run test.
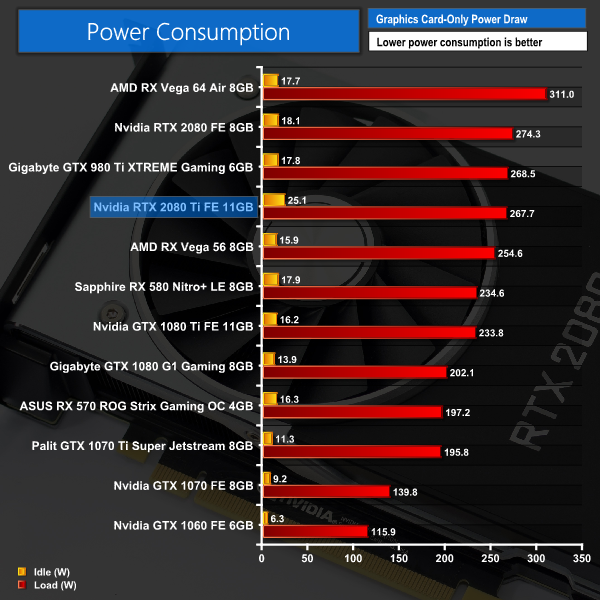
Given its TDP is 260W, to see the RTX 2080 Ti drawing 267W under load is pretty much bang on with what we'd expect. You will note that the RTX 2080 is actually drawing more power in the above test – something we discuss further in the RTX 2080's own dedicated review.
Shadow of the Tomb Raider Power Testing
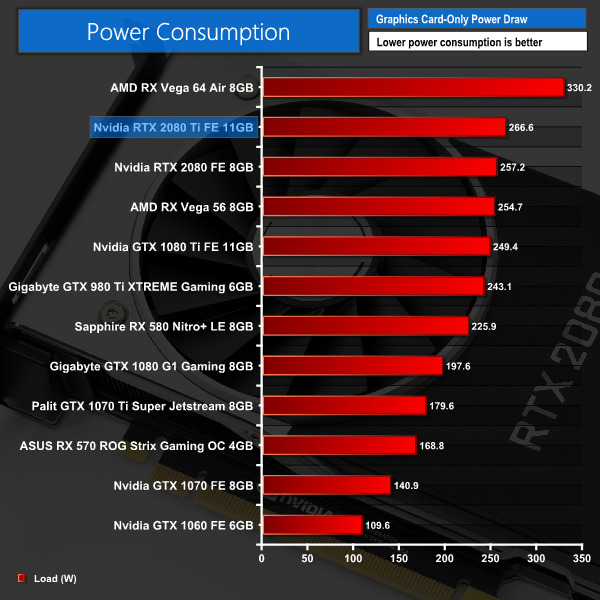
Just to test things further, we also measured the power consumption of the cards when running the Shadow of the Tomb Raider benchmark at 4K, with the Highest IQ preset.
As you can see, this hardly affected the power draw of the RTX 2080 Ti – the difference is barely 1 watt.
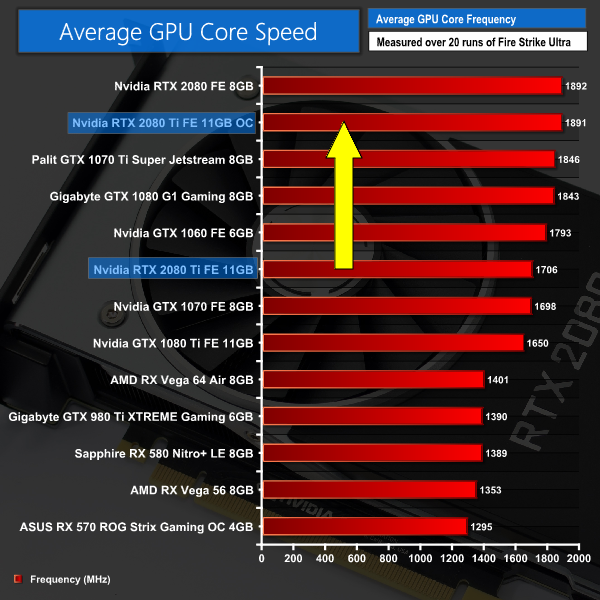
Overall the card isn't as light on the electricity as the GTX 1080 Ti – but it is not much more power hungry either. Vega 64 remains the most power hungry card we have tested by some margin.Here we present the average clock speed for each graphics card while running the 3DMark Fire Strike Ultra stress test 20 times. We use GPU-Z in tandem with the Powenetics Project (see the previous page) to record the GPU core frequency during the Fire Strike Ultra runs – at the end, we are left with around 4300 data entries. We calculate the average core frequency during the entire 20-run test to present here.
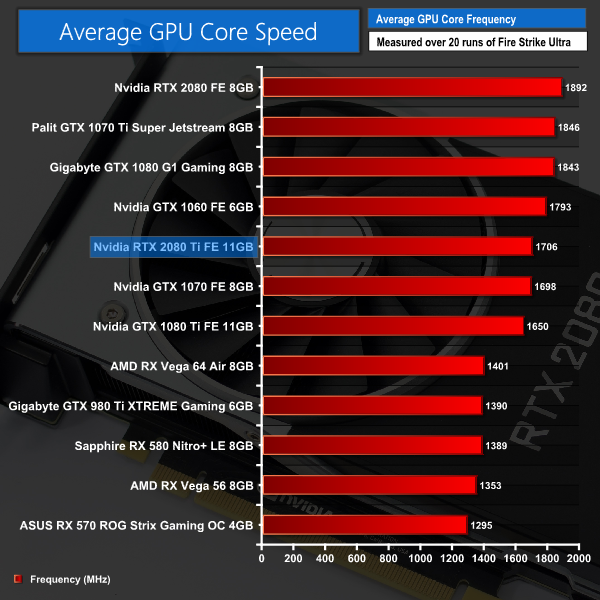
Turing is obviously a new architecture, so we can't directly compare the clock speed shown here with figures from Pascal or other cards. Over the next few weeks and months, when we will review a number of aftermarket cards, it will be interesting to have this information however, as we will then be able to see just how much faster those aftermarket cards are.The first thing to note when discussing manual overclocking of the RTX cards, is that Turing has introduced a new version of GPU Boost: we are now at GPU Boost 4.0, when Pascal used GPU Boost 3.0.
The primary difference is that where GPU Boost 3.0 dynamically adjusted core frequency based on temperature points that were locked away from the end user, GPU Boost 4.0 gives users control over these so called inflection points.
As Nvidia explains:
The algorithms used with GPU Boost 3.0 were completely inside the driver, and were not exposed to users. However, GPU Boost 4.0 now exposes the algorithms to users so they can manually modify the various curves themselves to increase performance in the GPU. The biggest benefit is in the temp domain where new inflection points have been added. Where before it was a straight line that dropped directly down to the Base Clock, the clock now holds the Boost Clock where it can be set to run longer at higher temperatures before a second temp target (T2) is reached where it will drop the clocks.
To do this, press were supplied with a new version of EVGA’s Precision software, named Precision X1. If you are trying to get the most from your graphics card, the easiest thing to do is set all the inflection points (seen below in graph form) up to the right-hand side – meaning the graphics core will stay uncapped until it hits its maximum temperature.
This software is still in beta form, and I did encounter some bugs here and there. We will revisit manual overclocking in the future to see if a finalised software package could help things further.
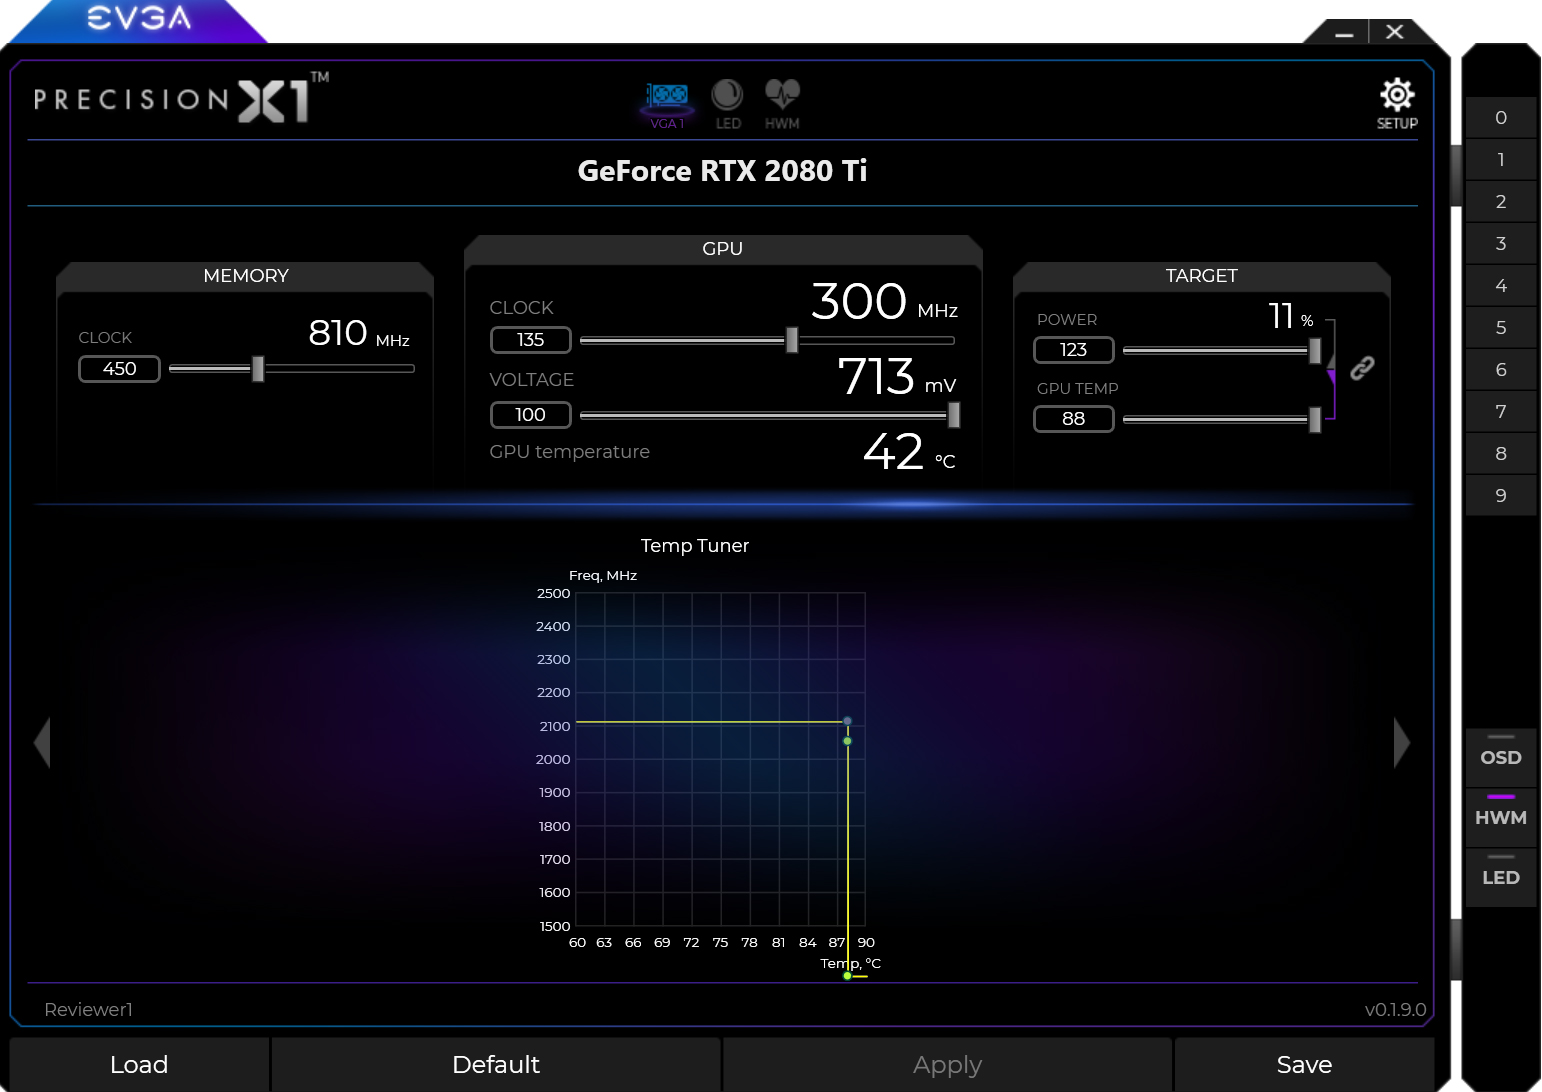
But taking Precision X1 as is, what was the best overclock I could dial in?
Well, first of all I maximised both the power limit and temperature target sliders. I also set the voltage slider to its maximum level. Then, I was able to add +135MHz to the GPU core, and +450MHz to the memory.
3DMark and Games Testing
This overclock had a big effect on the performance of the RTX 2080 Ti – the Fire Strike score jumped over 2000 points (+6.4%) while we also gained an extra 7.3FPS on average when playing Far Cry 5 at 4K.
On the next page we assess the implications this has for power draw, thermals, acoustics and the average clock speed.Here, we take a further look at the impact of our overclock, looking at the increased temperatures, acoustics, power draw, and lastly, the effect had on the average clock speed.
Temperatures
Acoustics
Power consumption
Average clock speed under load
Overview
As expected, we see increases in noise levels, core temperatures and power consumption as a result of our overclock. The GPU still only peaked at 79C, though, which is excellent for a reference card – while its noise peak of 46dB is again nothing to be concerned with considering that is with a hefty overclock.
Average GPU frequency didn't quite break past 1900MHz, but we are still seeing a huge real-world frequency increase compared to stock settings. There's definitely big potential for some significant overclocks with the RTX 2080 Ti.We have just published a review of the RTX 2080 today, but this specific review has focused on the more expensive flagship RTX 2080 Ti Founders Edition. At £1,100 it is a heck of an investment but as the Nvidia webpage shows at time of publication, it's already sold out on pre-order.
Starting with Nvidia's reference design, this Founders card is simply a showcase of stellar engineering. We saw the GPU core peak at just 73C which made us double-take – previous Nvidia reference designs would run as hot as the temperature limit was set, so to see the RTX 2080 Ti come in so cool is great to see. We have to say the decision to add a full-length vapour chamber and ditch the blower-style fan in favour of two axial fans has paid off massively.
These changes make a significant difference with noise levels as well – aside from the RTX 2080, this card is the quietest reference board we have ever tested, with its noise levels peaking at just 42dB.
With the premium design as well – plenty of aluminium is used, which gives the card a quality feel – I would not be surprised to see the market for cheaper cards from board partners shrink drastically. After all, so far we've only seen one card that is actually cheaper than the Founders Edition RTX 2080 Ti, so expect more and more people to be buying Founders cards this generation.
Our card also overclocked very well, as we were able to increase its clock speed from barely 1700MHz to 1891MHz which remained consistent under load. It's not as far as we could push the RTX 2080, but this is still hugely impressive and gained us an extra 9% performance when playing Far Cry 5 at 4K.
Moving onto real-world game testing, it's pretty easy to summarise what you are getting with the RTX 2080 Ti – it is the fastest single graphics card we have ever tested. Compared to the GTX 1080 Ti, for instance, it performs on average 28% faster at 1440p, while this rises to 33% at 4K where the 2080 Ti can really stretch its legs.
Obviously there is a significant price difference between those two cards – the 1080 Ti costs £669 directly from Nvidia, where the 2080 Ti is £1099, making it £430 more expensive. That's a 64% price hike generation to generation.
We could sit here and argue all day about this – obviously the increased price does not match up with the increased performance in games (right now anyway as no games yet support ray tracing). Then again, people who want the best, most powerful graphics card will pay for it. In any case, matters aren't helped by the fact that Nvidia simply has no competition in this sector – AMD doesn't have anything that comes close to touching the RTX 2080 Ti in terms of real-world gaming performance.
Then there's also the small matter of ray tracing – the key feature of the new Turing cards. As we mentioned at the start of this review, we are unable to test real-time ray tracing in games until Microsoft releases its DirectX Raytracing (DXR) update which is coming next month.
We were provided with a ray tracing demo from Nvidia, however, and you can see that in action on the RTX cards back on page 12 of this review. What that demo shows us is the RTX 2080 Ti outperforming the GTX 1080 Ti by up to 780% when it comes to real-time ray tracing. Of course, this is just one demo, so we can't say how this will translate to games that use a hybrid method of rendering – combining both elements of ray tracing with rasterisation. What we can say, however, is that Turing wipes the floor with Pascal in regards to ray tracing capabilities.
Deep Learning Super Sampling (DLSS) is another feature that is new to Turing. This again is dependent on games supporting it before we can test it fully, but we were provided an early-access demo of Final Fantasy XV that showed DLSS providing an increase of 34% to average FPS, when compared to TAA. To our eyes, DLSS also looks superior in terms of visual fidelity.
To wrap ray tracing and DLSS together, we do need to wait to see how actual games you can play will leverage these technologies. There is a long list of games set to support DLSS, while ray tracing will also make its way into blockbuster titles including Battlefield V and Metro Exodus. The trouble is, we just can't say how the RTX 2080 Ti will perform with those games until we can actually test them.
Even if we put that to one side, the RTX 2080 Ti still has the benefit of being the fastest single card we have ever tested – so if you want to eke out every last frame from your games and don't care about the cost, this card will be for you regardless of its ray tracing abilities.
Many people will want to wait and see how the card perform with ray tracing in games, however, and we will bring as much coverage of that as we can. For now, though, we can say that the ray tracing aspect is very promising, while you also get a hefty improvement to your frame rates versus the GTX 1080 Ti. Just be willing to part with £1,099 for the pleasure.
![]()
You can buy the Nvidia RTX 2080 Ti directly from Nvidia for £1099. Overclockers UK also has a range of aftermarket cards starting at £1049.00.
Pros
- Fastest single card we've ever tested.
- Founders Edition runs very cool.
- Noise levels are also hugely impressive.
- Overclocking yielded significant performance gains.
- Ray tracing with the RTX 2080 Ti looks promising.
- DLSS is another Turing-specific feature that has us excited.
Cons
- Very expensive at £1099.
- We are yet to see how ray tracing and DLSS translates to actual games you can play at home.
KitGuru says: It may be very expensive, but the RTX 2080 Ti does offer the best performance we've seen from a single card. We will also have to see about its real-world ray tracing ability, but it looks promising.