
Manual CPU Overclocking:
To test the Supermicro SuperO C9Z390-CG-IW motherboard’s CPU overclocking potential, we set the CPU core voltage no higher than 1.3V and push for the highest stable clock speed. We maintain the DRAM frequency at 3200MHz to take memory stability out of the overclocking equation.
Our particular CPU is not stable at 5.1GHz even with 1.45v. The final stable overclock for almost all Z390 motherboards we may test should be 5GHz, unless there is something particularly wrong with the VRM that limits the voltage or power it can supply. In the case of the Supermicro SuperO C9Z390-CG-IW it achieved 5GHz at 1.28 volts with no significant issues.
During our testing, however, we did note the voltage behaviour to be somewhat peculiar. The first peculiarity was that the VID, Voltage Identification Digital, was generally lower than the VCore – something that's not happened on any other motherboard we've tested – Z370 or Z390. In theory, the VID and VCore should be fairly similar but we saw a differential under overclocking of 0.06v, 1.23v (VID) and 1.29v (VCore).
The second peculiarity is the VCore voltage “overshoot” at all LLC levels. For example, 1.3v override became 1.4v VCore using Auto LLC, 1.36v using Level 3 LLC and 1.34v using Level 1 LLC, Level 1 is the lowest level of LLC and it still overshoots.
To get our stable overclock of 5GHz at 1.28v VCore we actually used 1.225v override with a Level 3 LLC. Supermicro should make an effort to revise the UEFI so that the Automatic LLC doesn't overshoot the user-defined voltage by such a large margin.
Another peculiarity is that CPU temperatures were much higher for the same or lower voltages than they were on other motherboards. Again, it is not quite clear why this is the case as we keep the cooling solution consistent across all reviews. Using 1.3v VCore on the ASUS and ASRock motherboards reaped maximum temperatures around 85 degrees Celsius. For this motherboard those same maximum temperatures were more like 95 degrees Celsius, and that was using a lower 1.28v VCore.
Update 26th January 2019 – Supermicro issued a test UEFI version to KitGuru, still marked 1.0b but dated 5th January 2019, which has corrected the VID/VCore issue where the VID was lower than the VCore, when it should have been the reverse. The new BIOS has also resulted in a much better LLC performance. For example 1.3v using a Level 3 LLC now equates to 1.28v VCore, rather than previously when it was 1.36v for the same settings. The new BIOS also seems to have cleared up the high CPU temperature issues too.
Motherboard Sensors
There's no temperature sensor marked as being for the VRM, so it's not possible to confirm the state of the VRM temperatures during testing.
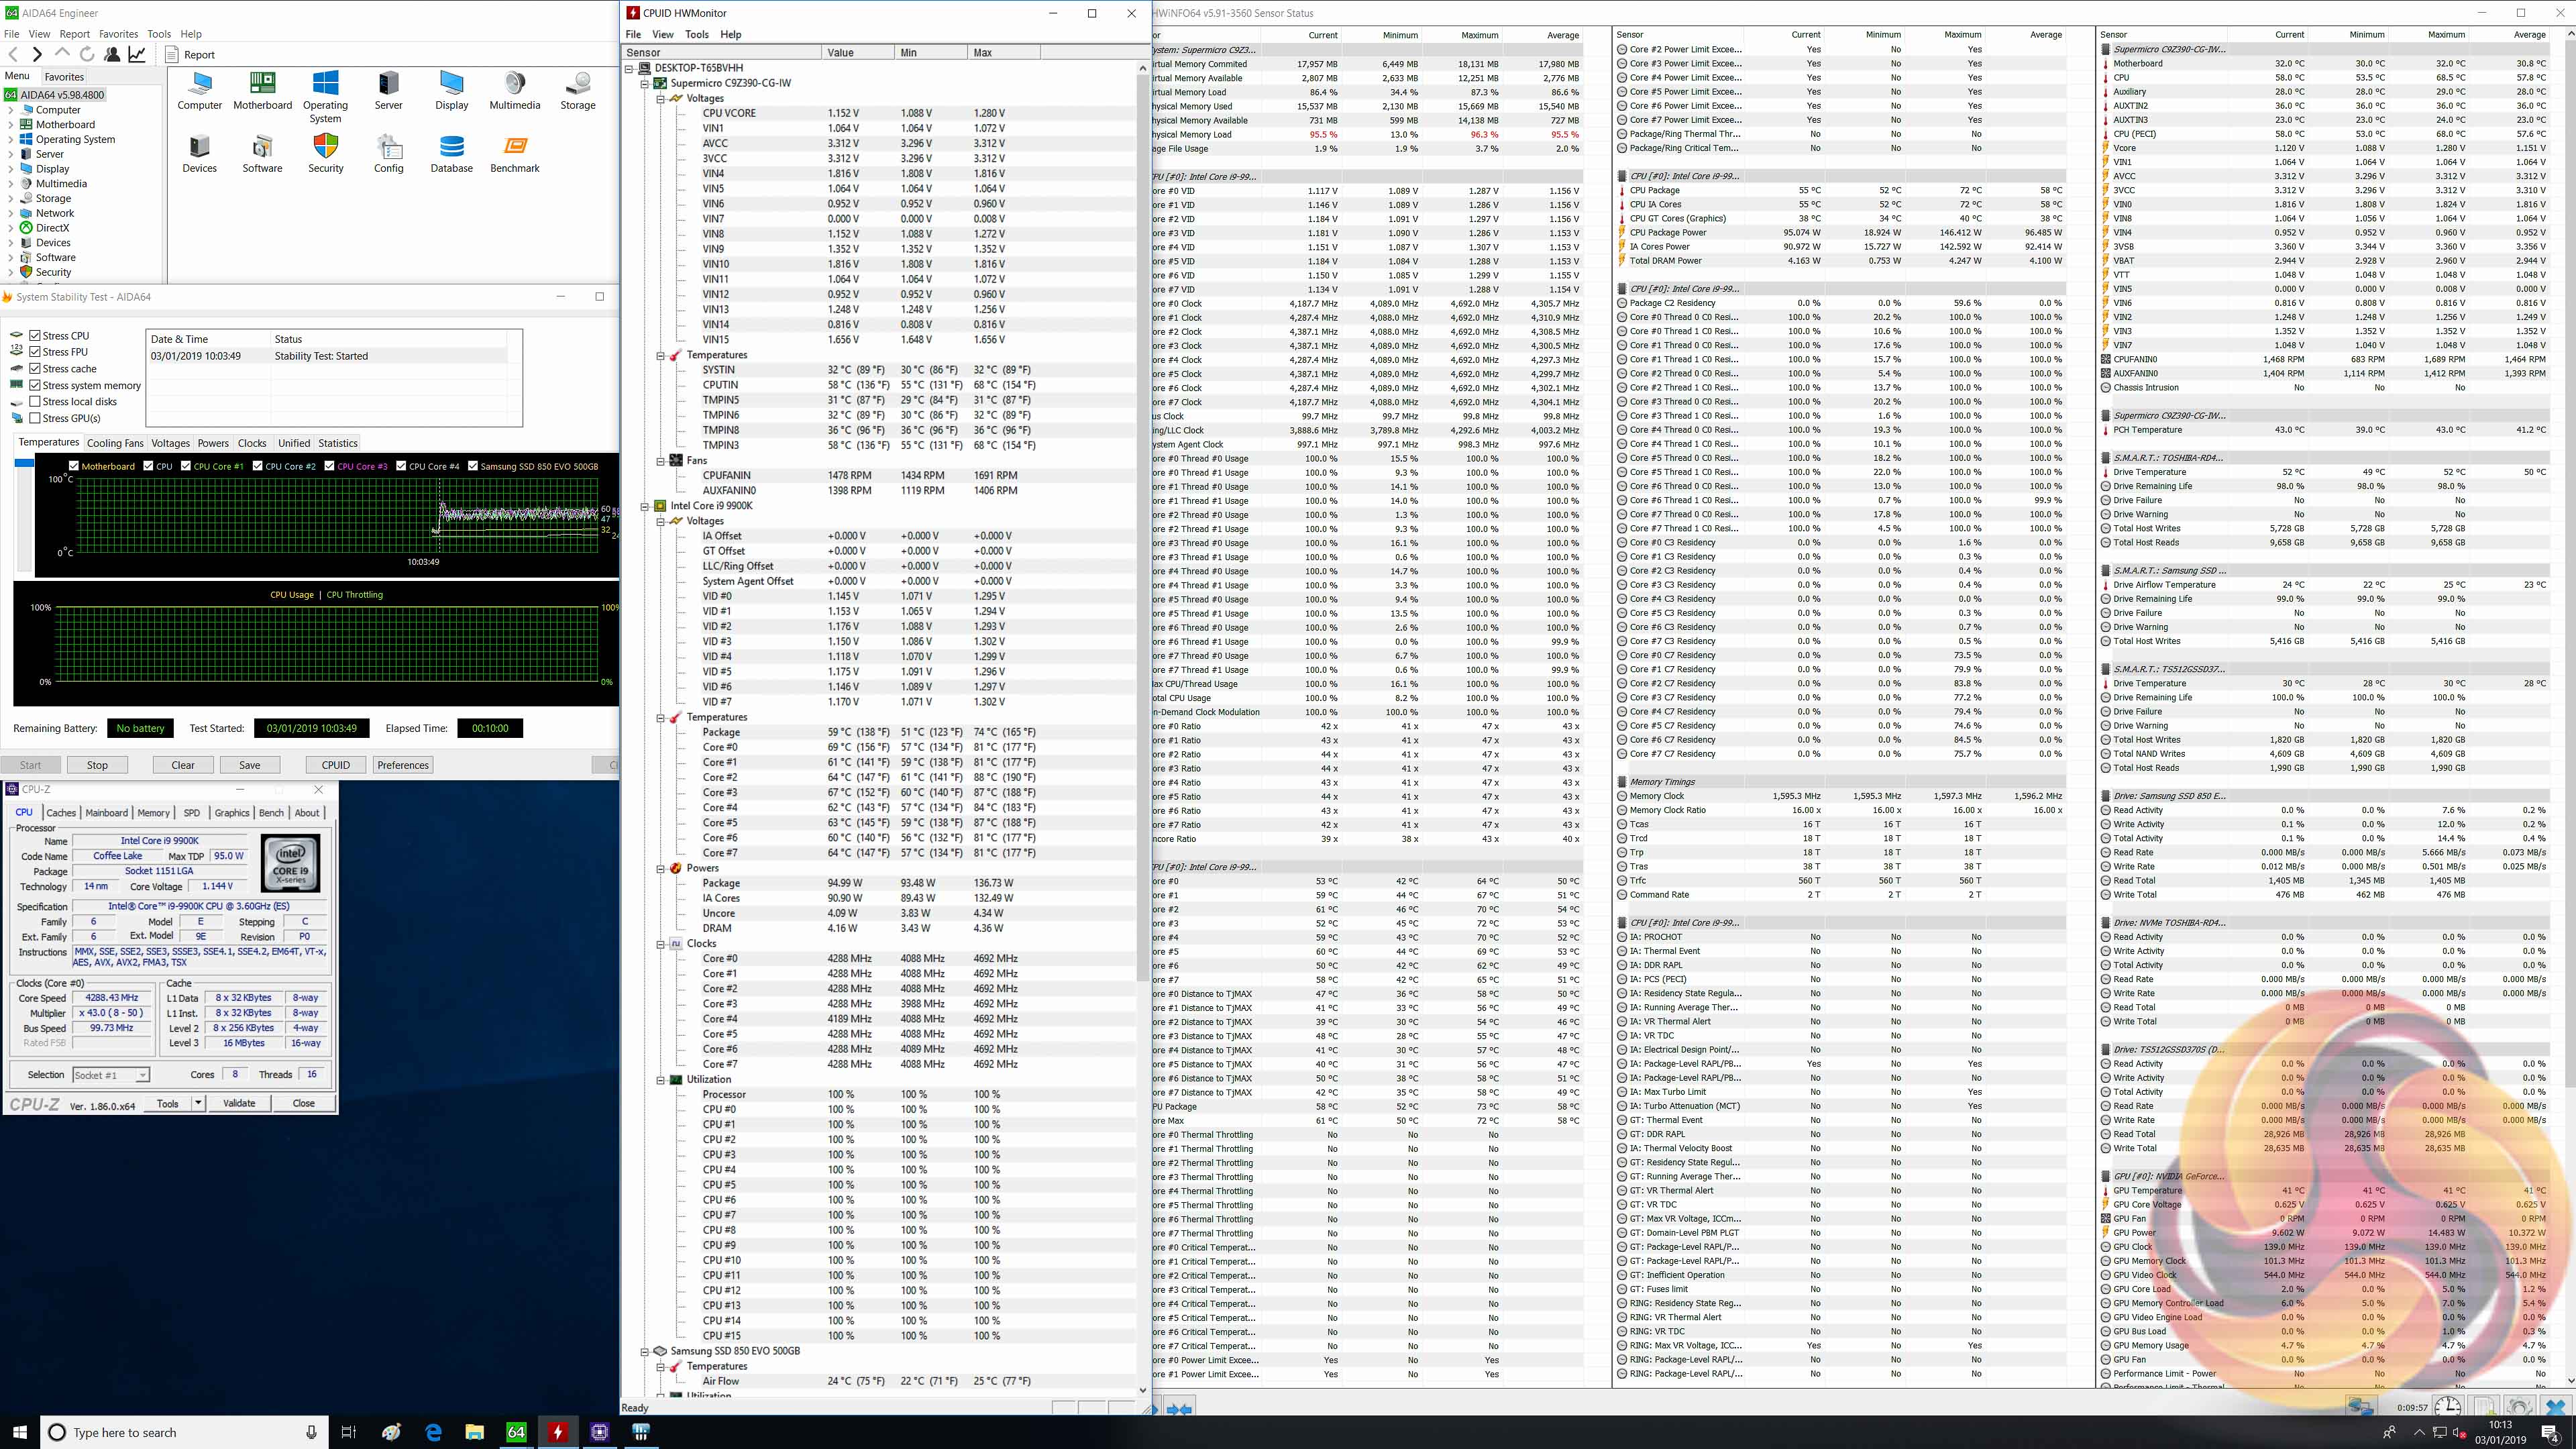
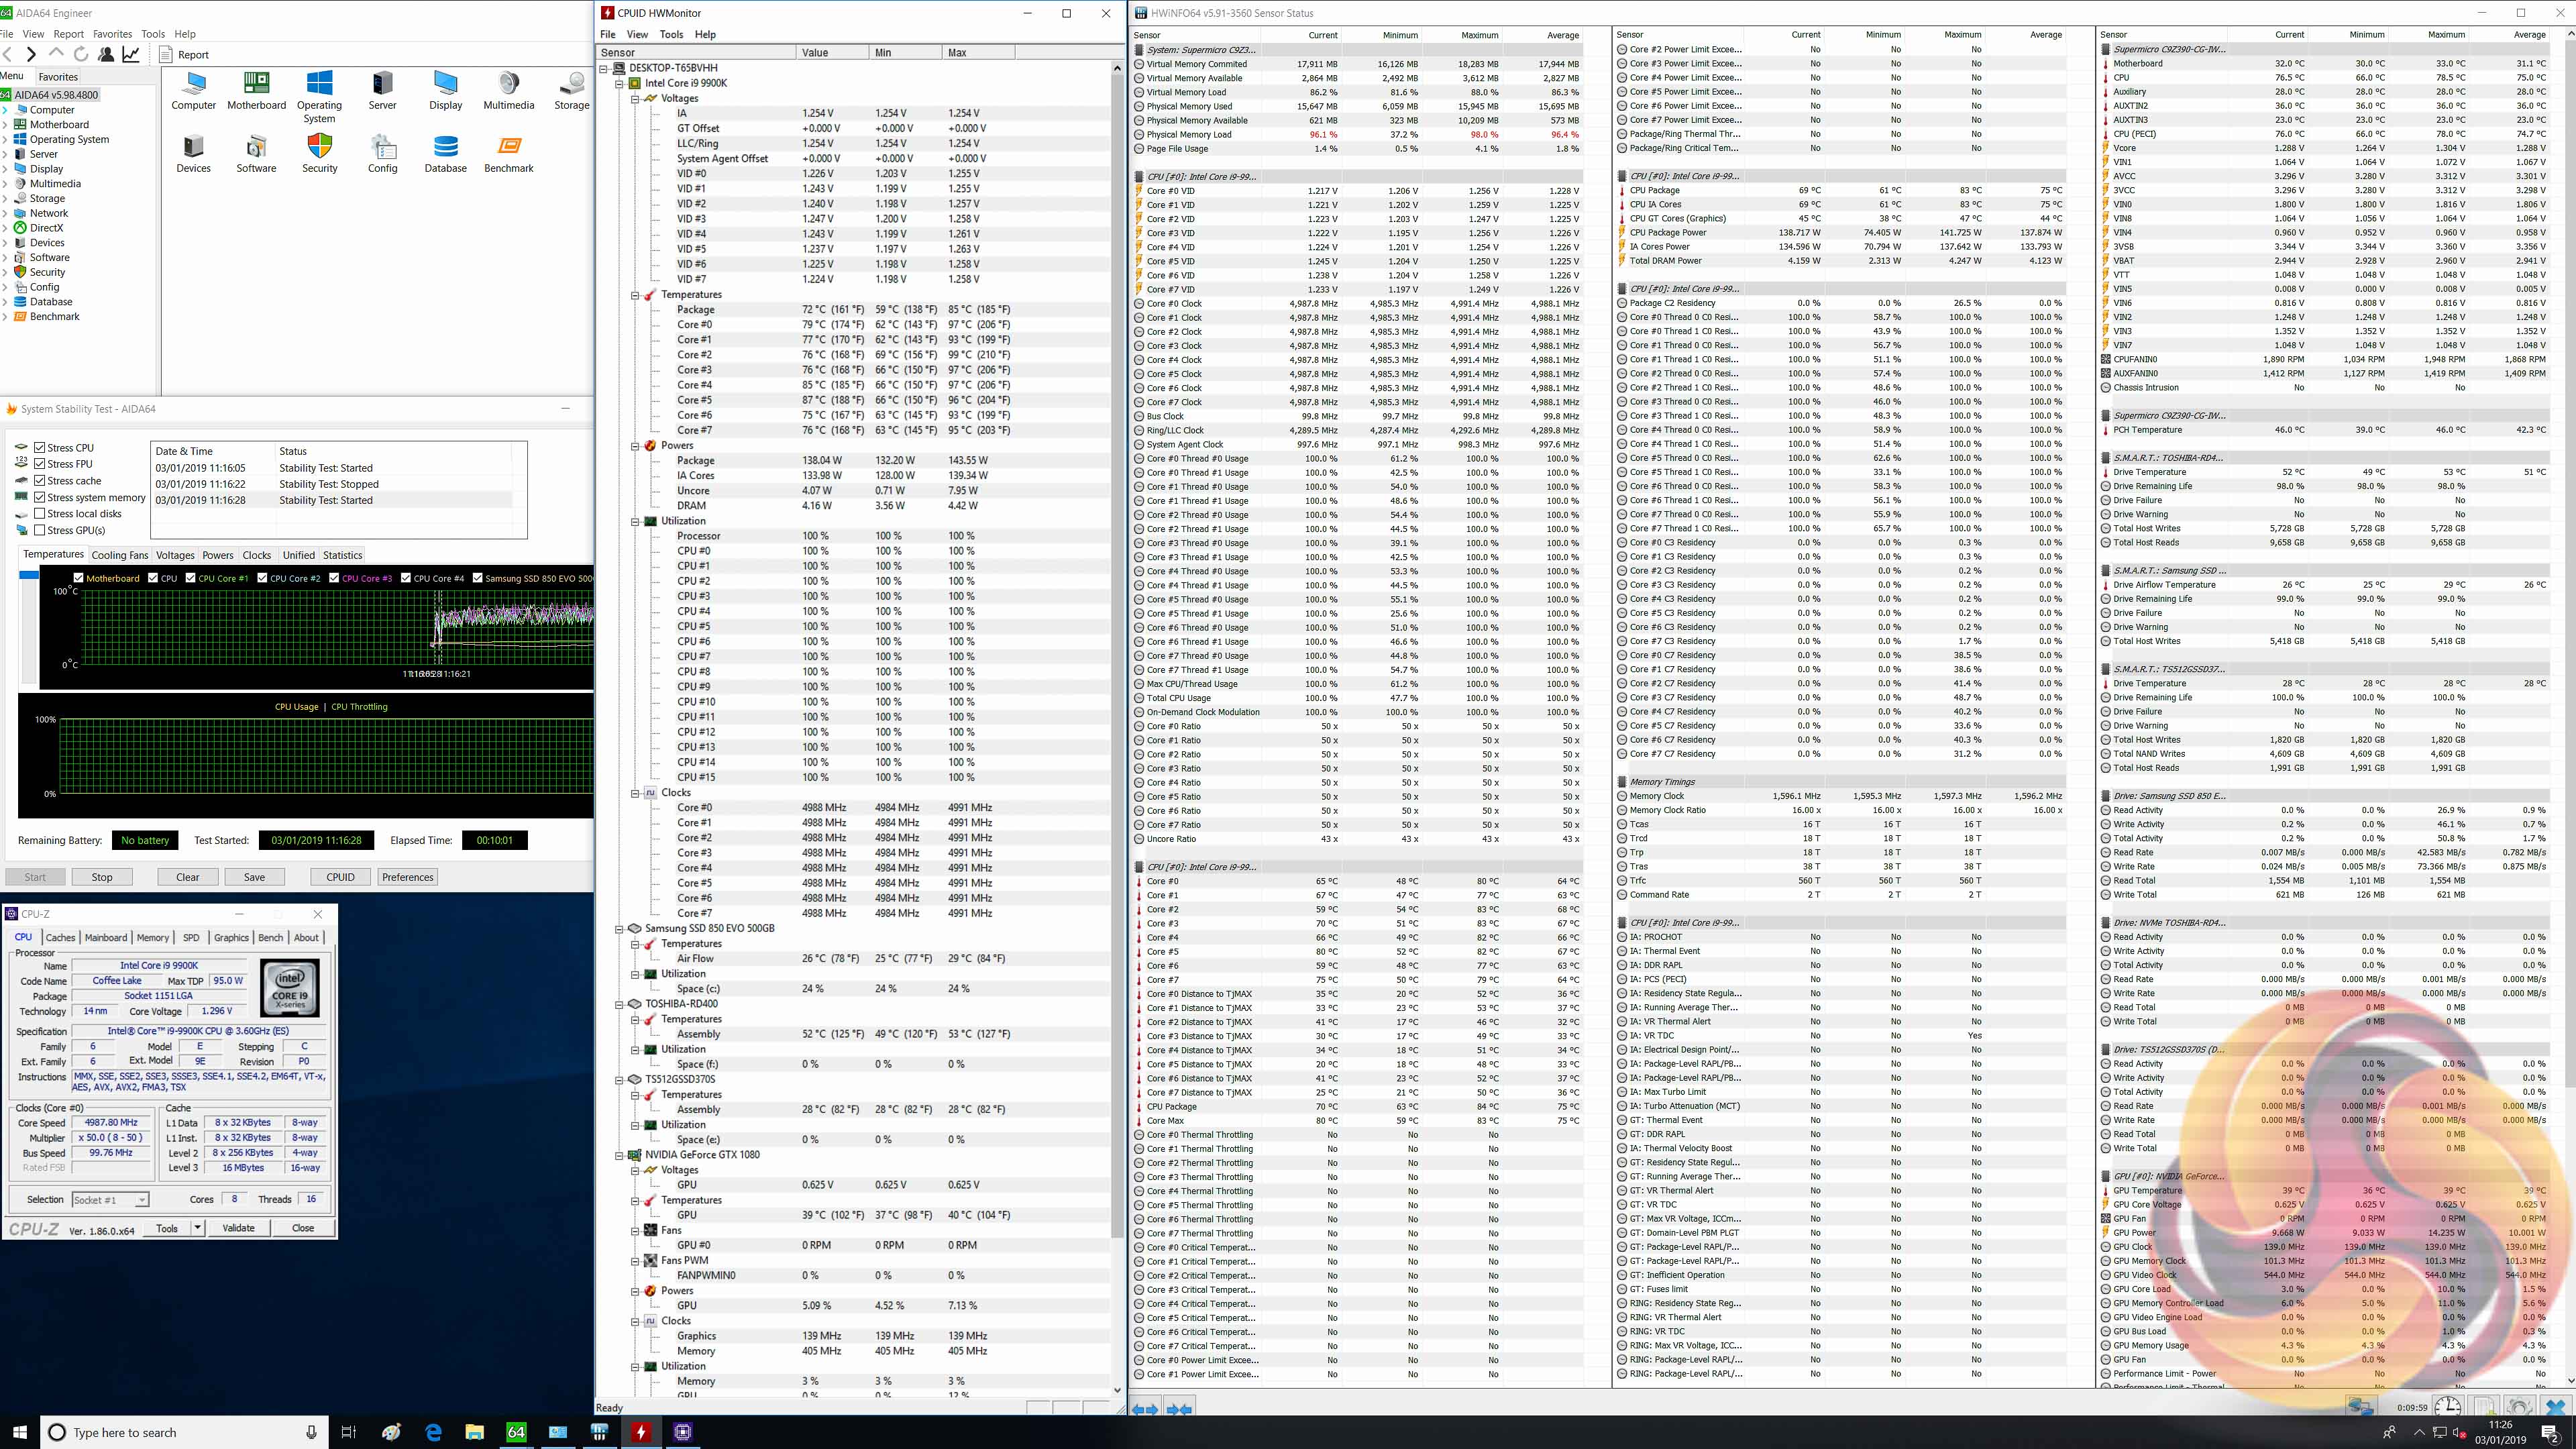
In the above screenshots it's possible to see the average core frequency, VID, VCore, reported CPU power draw and temperature data we noted during stress testing at stock (left) and overclocked (right) loads.
Update 26th January 2019 – Supermicro issued a test UEFI version to KitGuru, still marked 1.0b but dated 5th January 2019, which sets the PL1 power limit to 180W and PL2 power limit to 250W when an XMP memory profile is used. This means the CPU does not throttle after setting an XMP profile, in fact it runs consistently at 4.7GHz across all cores and runs at an approximate 145W TDP, which is well outside of Intel's stock 95W specification. The performance has improved but this is at the expense of heat and power consumption, a trade-off other motherboard vendors have also been silently making without informing consumers. This new BIOS is not yet available for public download but Supermicro informs us it will be made available soon.
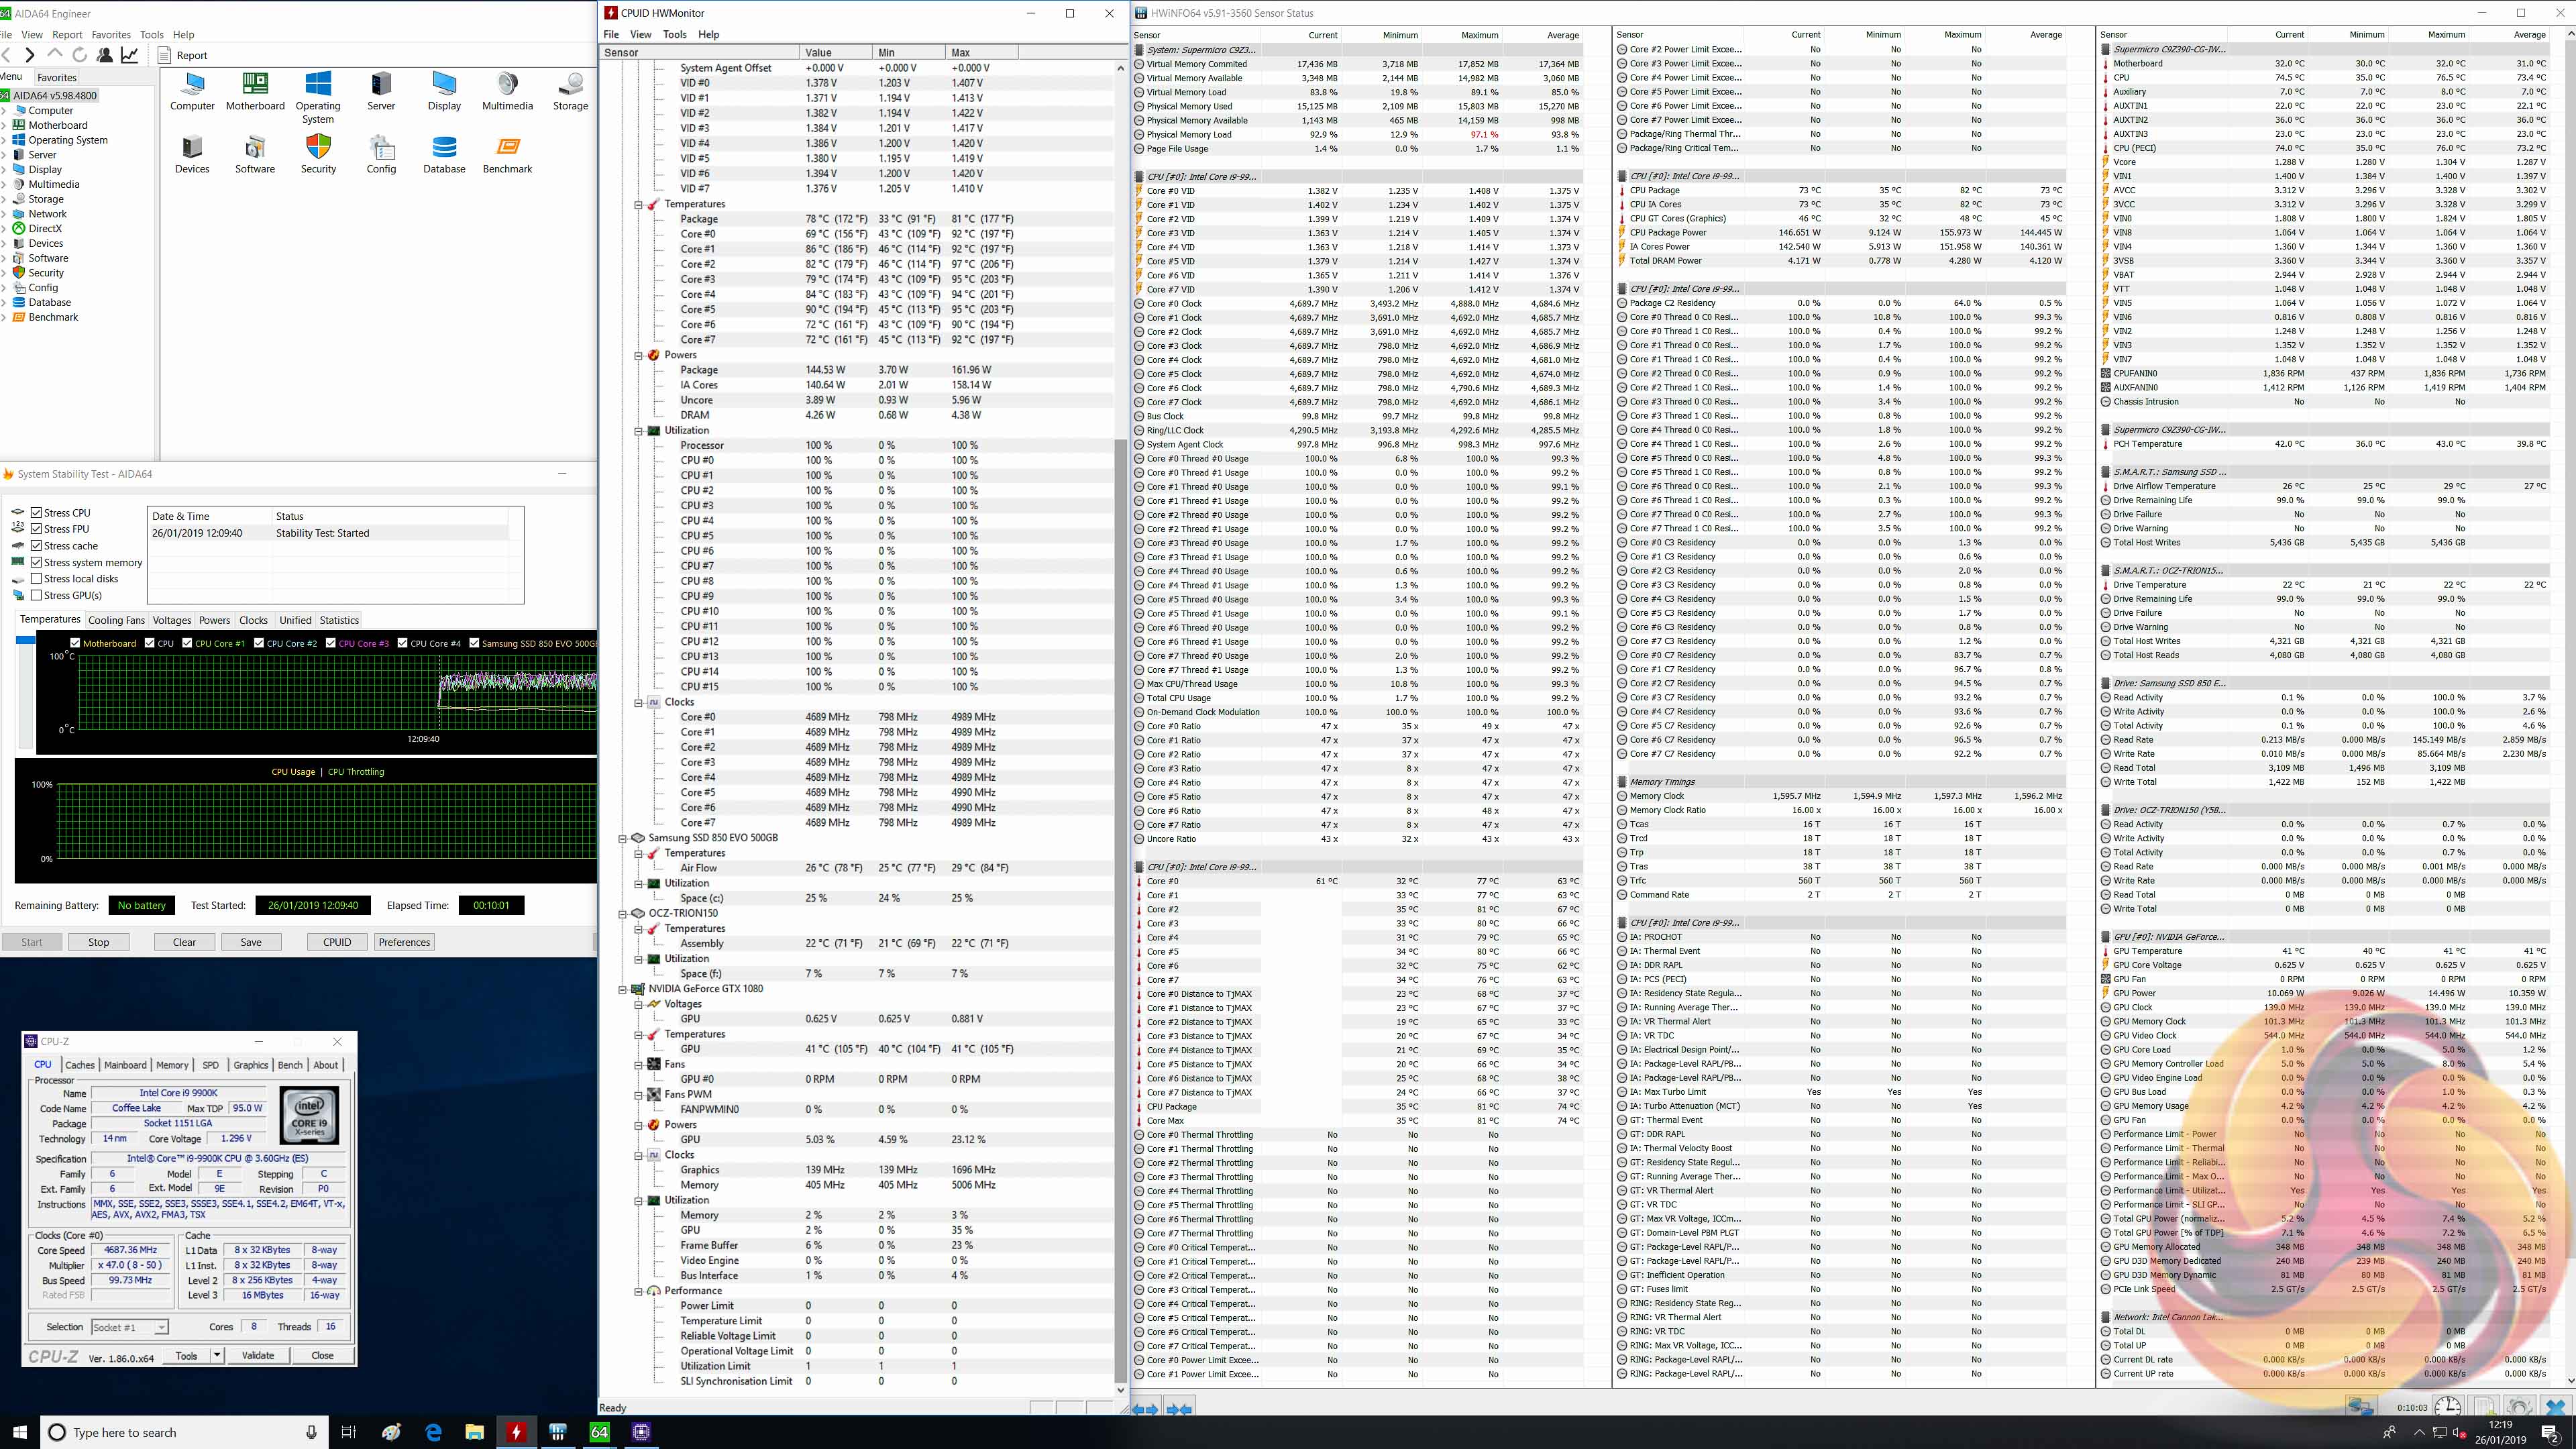
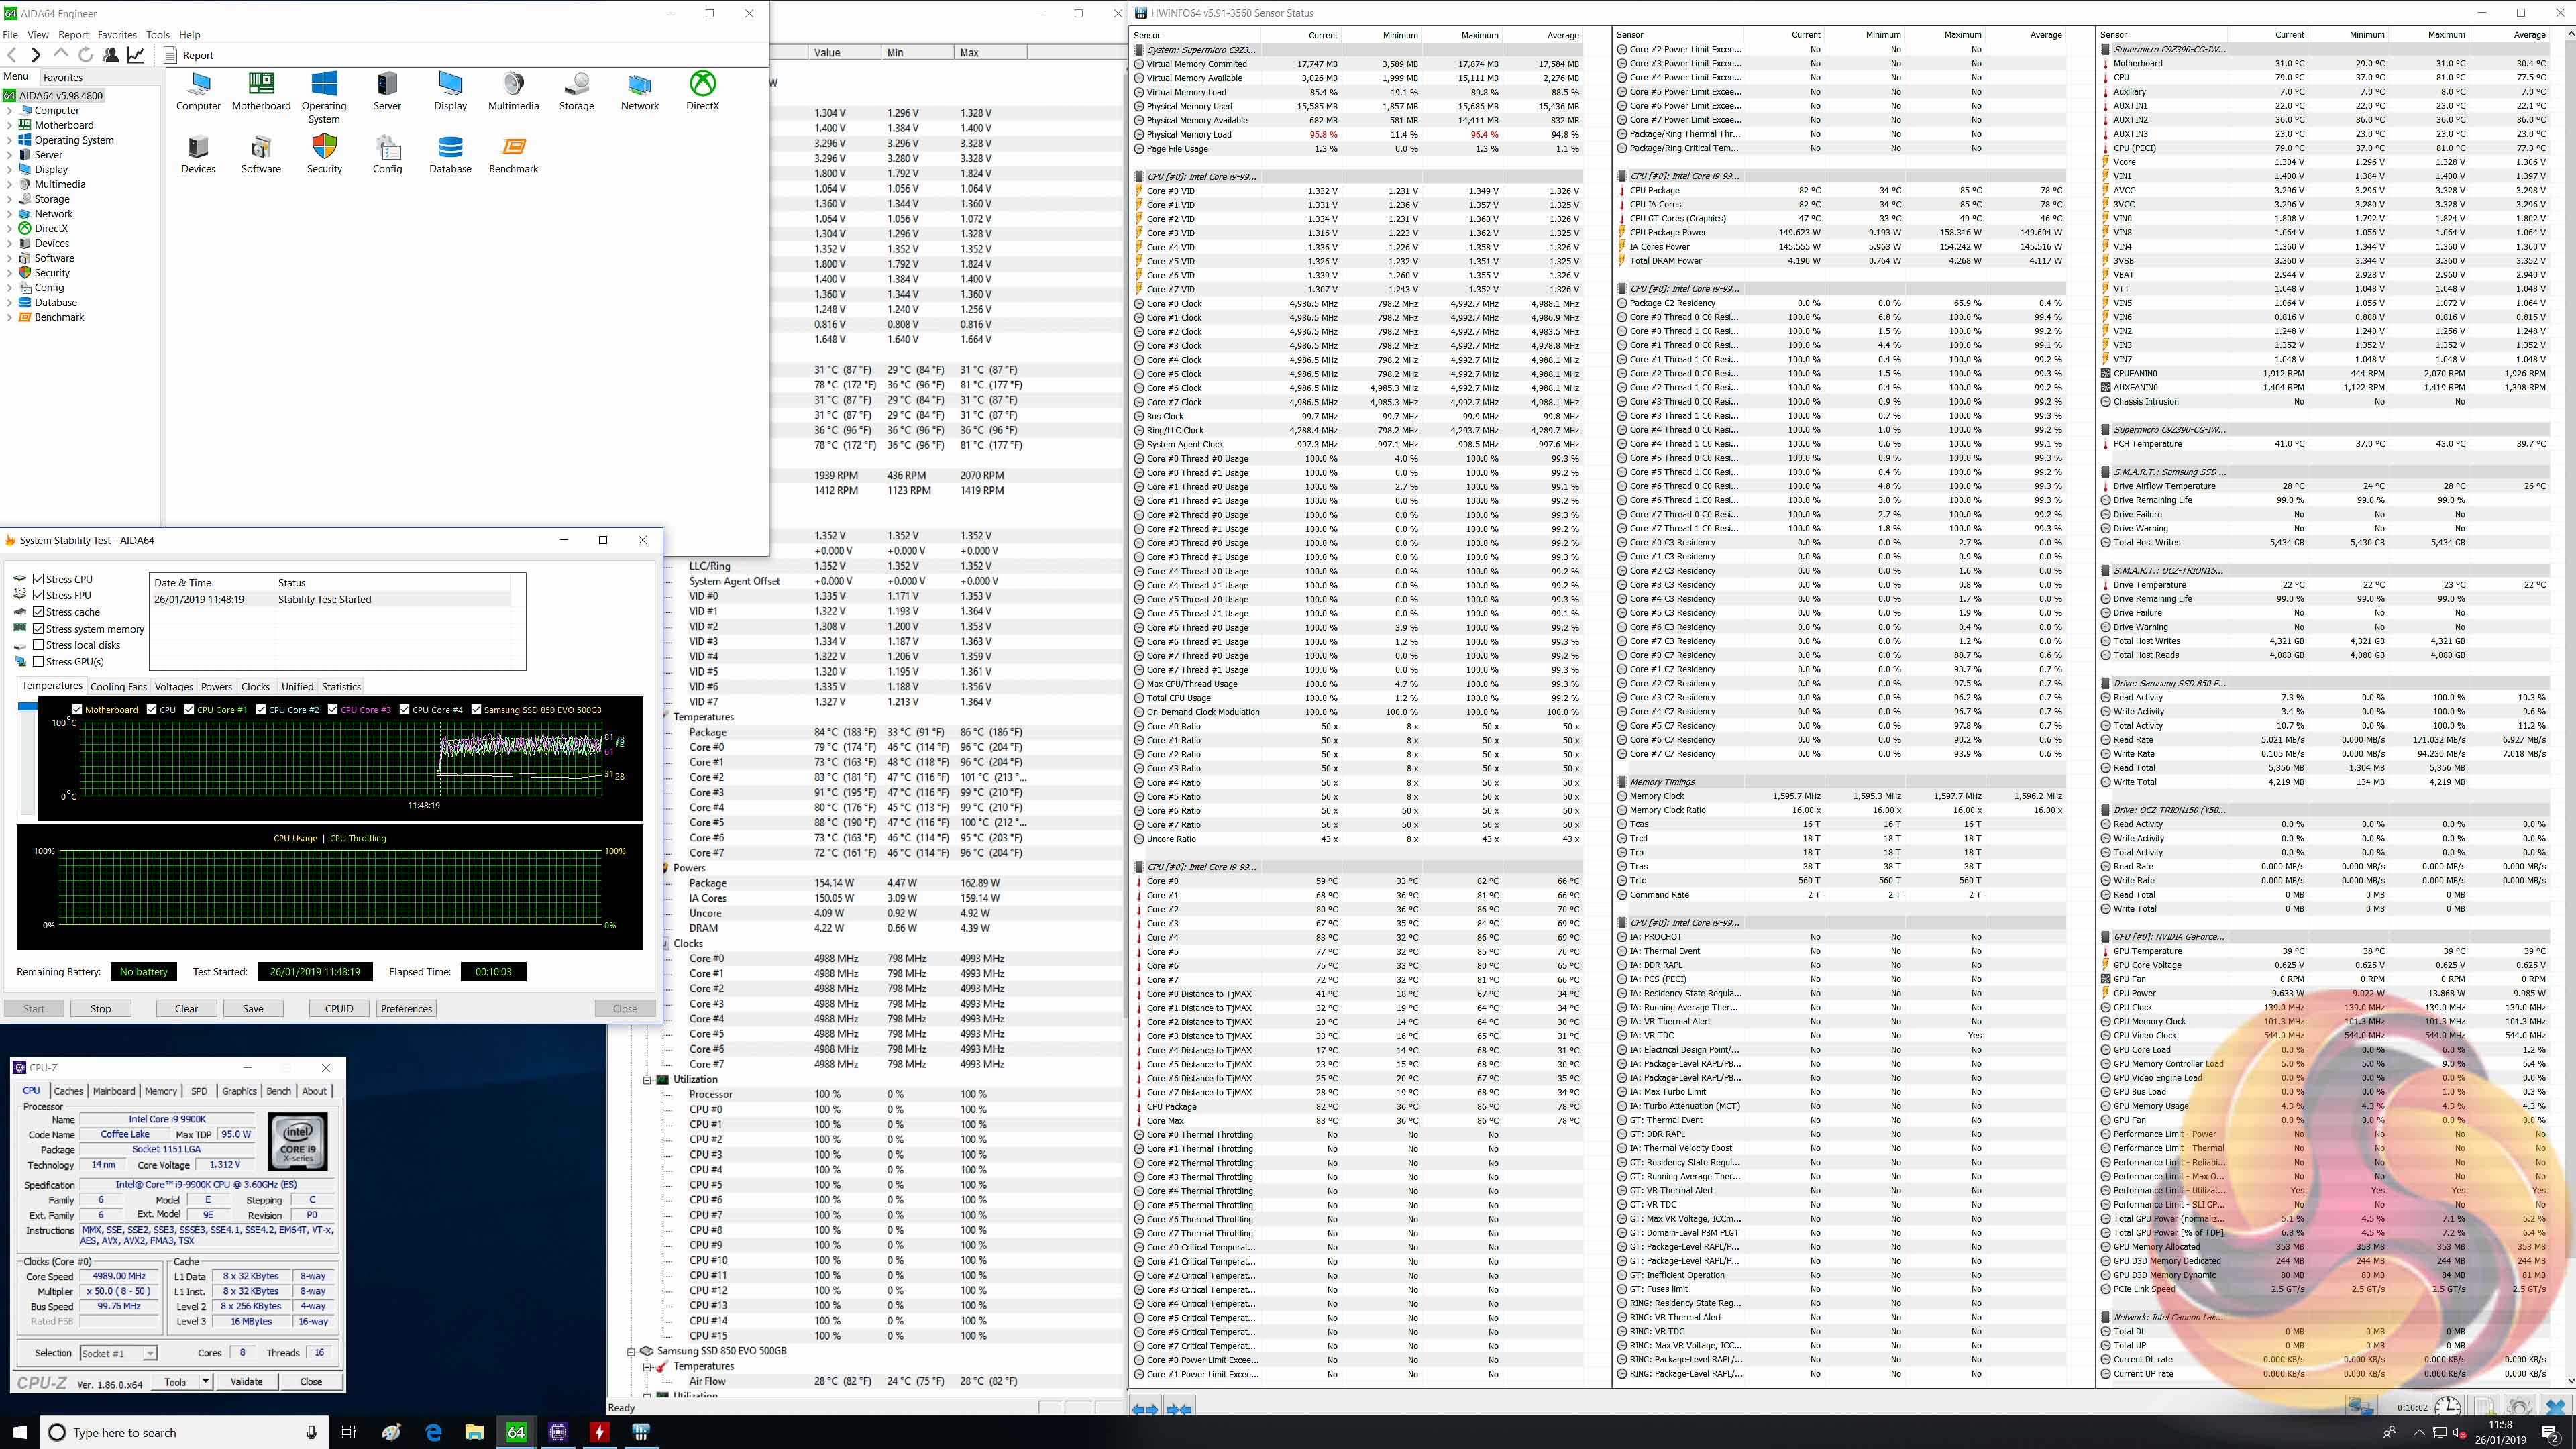
As a result of the new Supermicro BIOS the performance parameters change somewhat. For instance, at the new “stock” parameters, above left image, the average frequency under load is 4.7GHz rather than 4.3GHz, though this comes at the expense of power consumption which rises from an average package power of 96W to 144W.
The effect of the new BIOS on overclocked loads is negligible, aside from the new BIOS now seems to result in the correct relationship between VID and VCore, and LLC is more accurate with much less overshoot.
Overclocked Performance
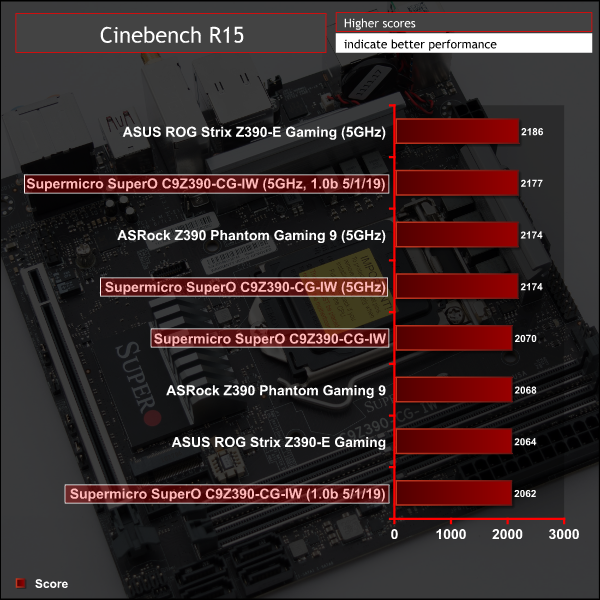
Overclocked performance was right in line with expectations.
The new UEFI BIOS did not significantly alter performance in Cinebench, as this is a very short benchmark. However, in extended benchmarks the new BIOS will perform better at stock than previously since the sustained frequency is 4.7GHz rather than 4.3GHz.
System Power Consumption
We leave the system to idle on the Windows 10 desktop for 10 minutes before taking a reading. For CPU load results we run AIDA64 CPU, FPU, Cache and Memory stress tests and take a reading after 10 minutes. The power consumption of our entire test system (at the wall) is shown in the chart.
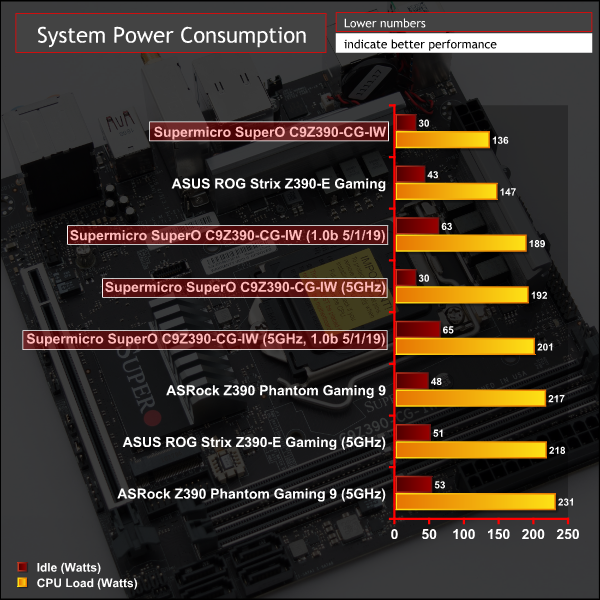
Power consumption was very low across the range of tests for the Supermicro motherboard. Part of this is down to the smaller footprint of the motherboard but also part may be down to Supermicro being more aggressive with power management and Intel TDP adherence.
It was observed that the new UEFI update increase idle power consumption by quite a significant amount, we could identify no explanation for this change.
12-volt EPS Power Consumption
During the 10-minute stress test as specified above, we record the direct CPU power consumption drawn through the EPS 8-pin socket using modified EPS 8-pin cables that have a Tinkerforge Voltage/Current 1.0 bricklet intercepting and monitoring the power flow from the power supply. That bricklet then reports its data to a Tinkerforge Master Brick. All the data collected by the Tinkerforge Master Brick is passed into an external laptop over a USB connection and analysed in the Cybenetics Powenetics Project software.
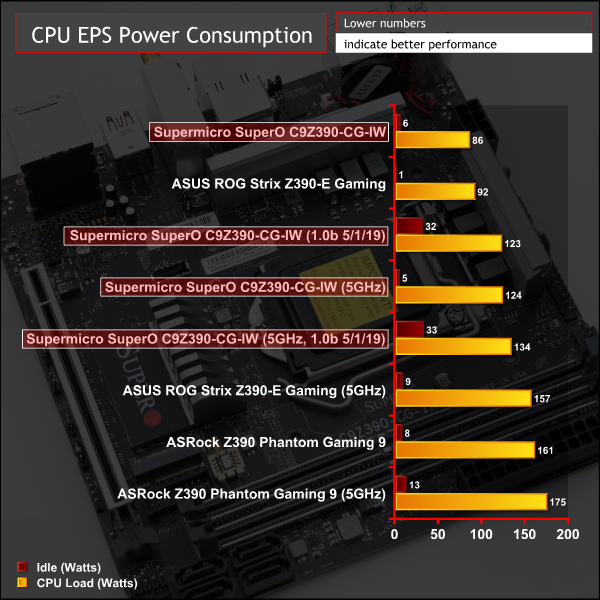
Continuing the theme of peculiarity we witnessed strange results from monitoring the 8pin EPS connection. On other motherboards the power measured at the 8pin CPU EPS cable has always been more than the power usage reported by the CPU since in theory all VRMs have an efficiency loss. To explain that simply, if a VRM is 90% efficient and the CPU reports using 95W we would expect the 8pin EPS to be supplying about 106W, with 11W “wasted” as heat or noise.
In the case of the Supermicro motherboard the EPS power was lower than the reported power usage by the CPU. For instance, the CPU reported using 95W at stock and 138W at overclocked loads, but the EPS only reported 86W and 124W, respectively. Since an efficiency greater than 100% is not possible for a VRM, the CPU and its associated components must be drawing power through the 24pin as well or incorrect data is being posted by the CPU. This is not necessarily an issue, but it is definitely unusual.
Due to this peculiarity we are not able to estimate VRM efficiency or VRM heat output.
Even after implementing Supermicro's UEFI update the relationship between EPS and CPU Package power consumption did not change. In all scenarios the package power consumption was higher than the EPS 8 pin power consumption, which doesn't make a great deal of sense. It was also observed that the new UEFI update increase idle power consumption by quite a significant amount, we could identify no explanation for this change.