

Intel's SSD DC P4510 family of drives have been designed to support a wide range of cloud workloads in the enterprise environment. The drives use Intel's 64-layer TLC 3D NAND technology, the first Intel drive series in the enterprise space to do so. This enables larger capacities to be brought to the table in the 2.5in format than the previous generation 32-layer equipped DC P4500 series.
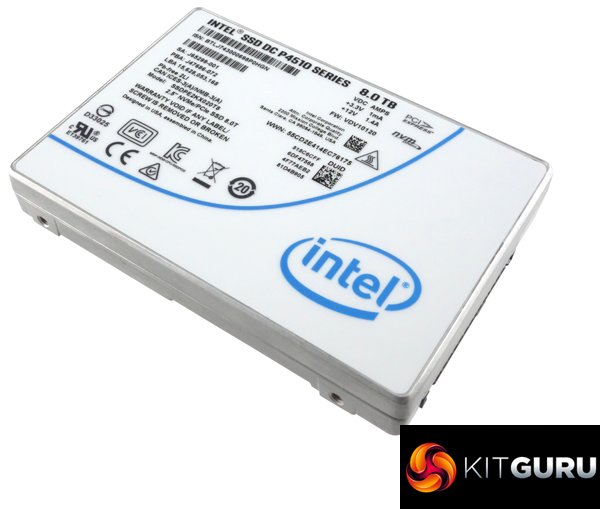
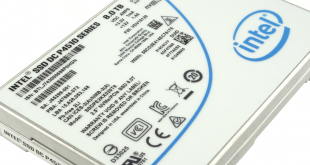
Intel's P4510 family of drives consists of four capacities; 1TB, 2TB, 4TB and the flagship 8TB model which is the one Intel kindly provided to us for review. Built on a 15mm 2.5in format the drives use a U.2 (PCIe 3.1 x4, NVMe 1.2) interface and Intel's 2nd generation NVMe SSD controller, which was also at the heart of the P45** and P46** family of drives.
Official Sequential performance figures for the 8TB drive are up to 3,200MB/s for reads and up to 3,000 MB/s for writes. Incidentally the 2TB drive has the same figure for Sequential reads as the 8TB drive but the 4TB drive is rated slightly less at 3,000MB/s. The 1TB drive gets a rating of up to 2,850MB/s. Sequential writes for the other drives in the family are; 2,900MB/s for the 4TB drive, 2,000MB/s for the 2TB unit and 1,100MB/s for the 1TB drive.
Random 4K performance for the 8TB drive is quoted at up to 637,000 IOPS for reads and up to 139,000 IOPS for writes. Random performance for the rest of the line-up is; 4TB, 625,000 IOPS reads and 113,500 IOPS writes, 637,000 IOPS and 81,500 IOPS for the 2TB drive and 465,000 IOPS and 70,000 IOPS for the 1TB unit.
Intel rate the endurance of the 8TB drive at up to 13.88PBW and back the drive with a 5 year warranty.
Physical Specifications:
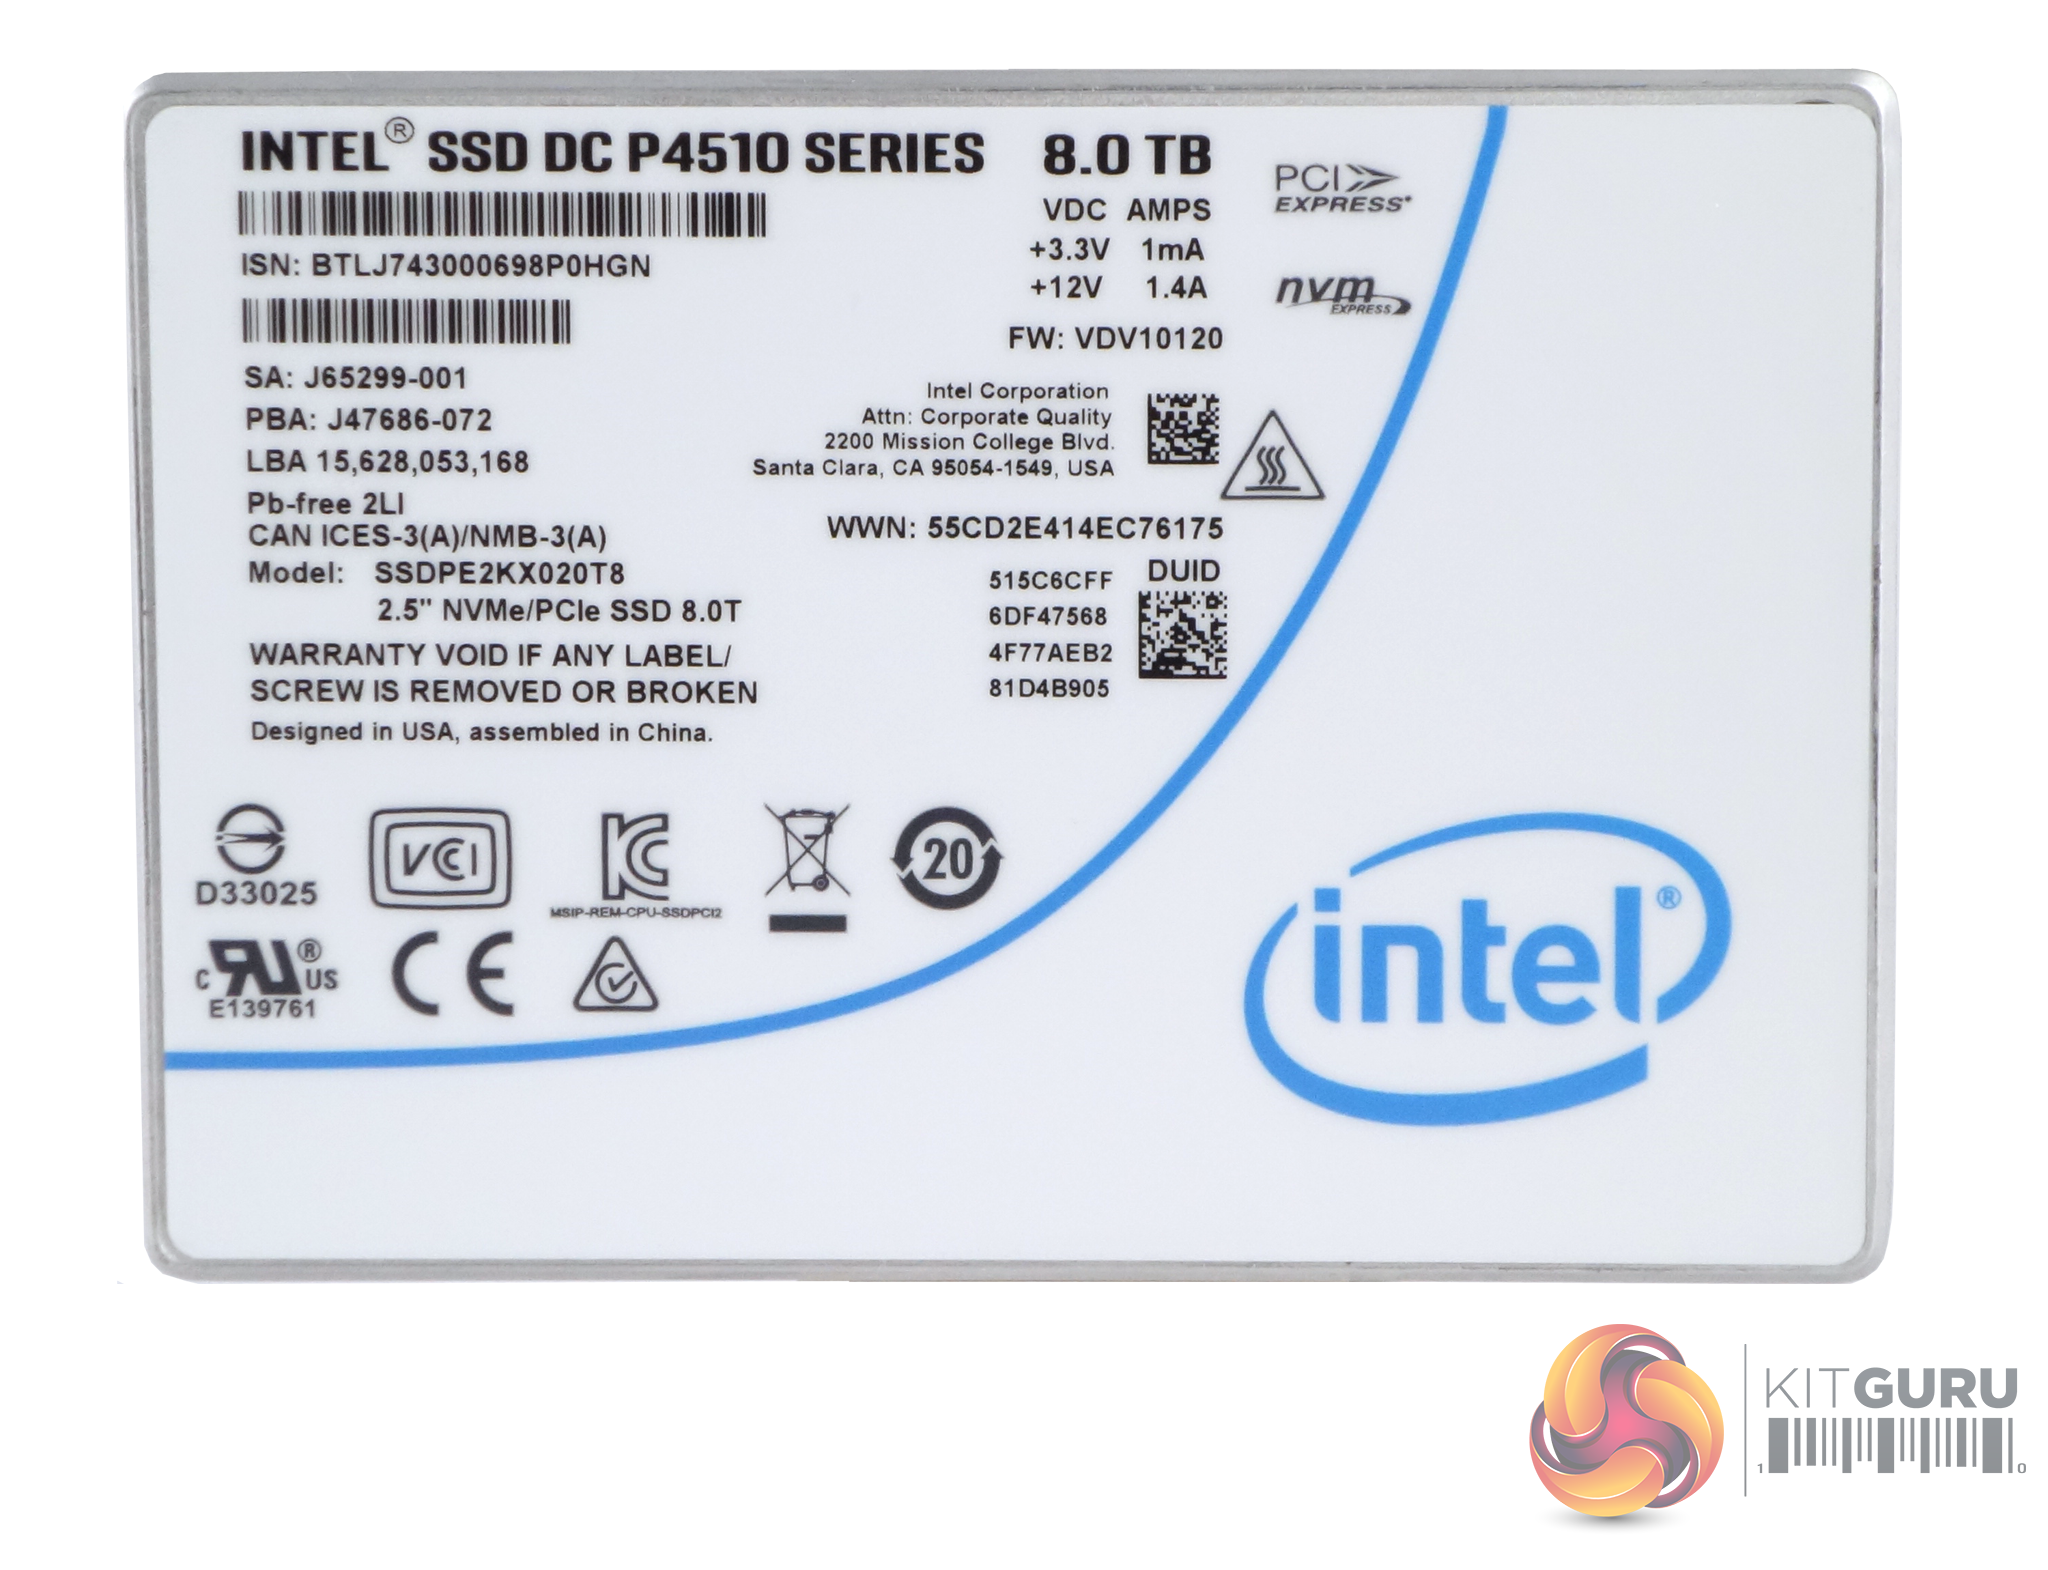
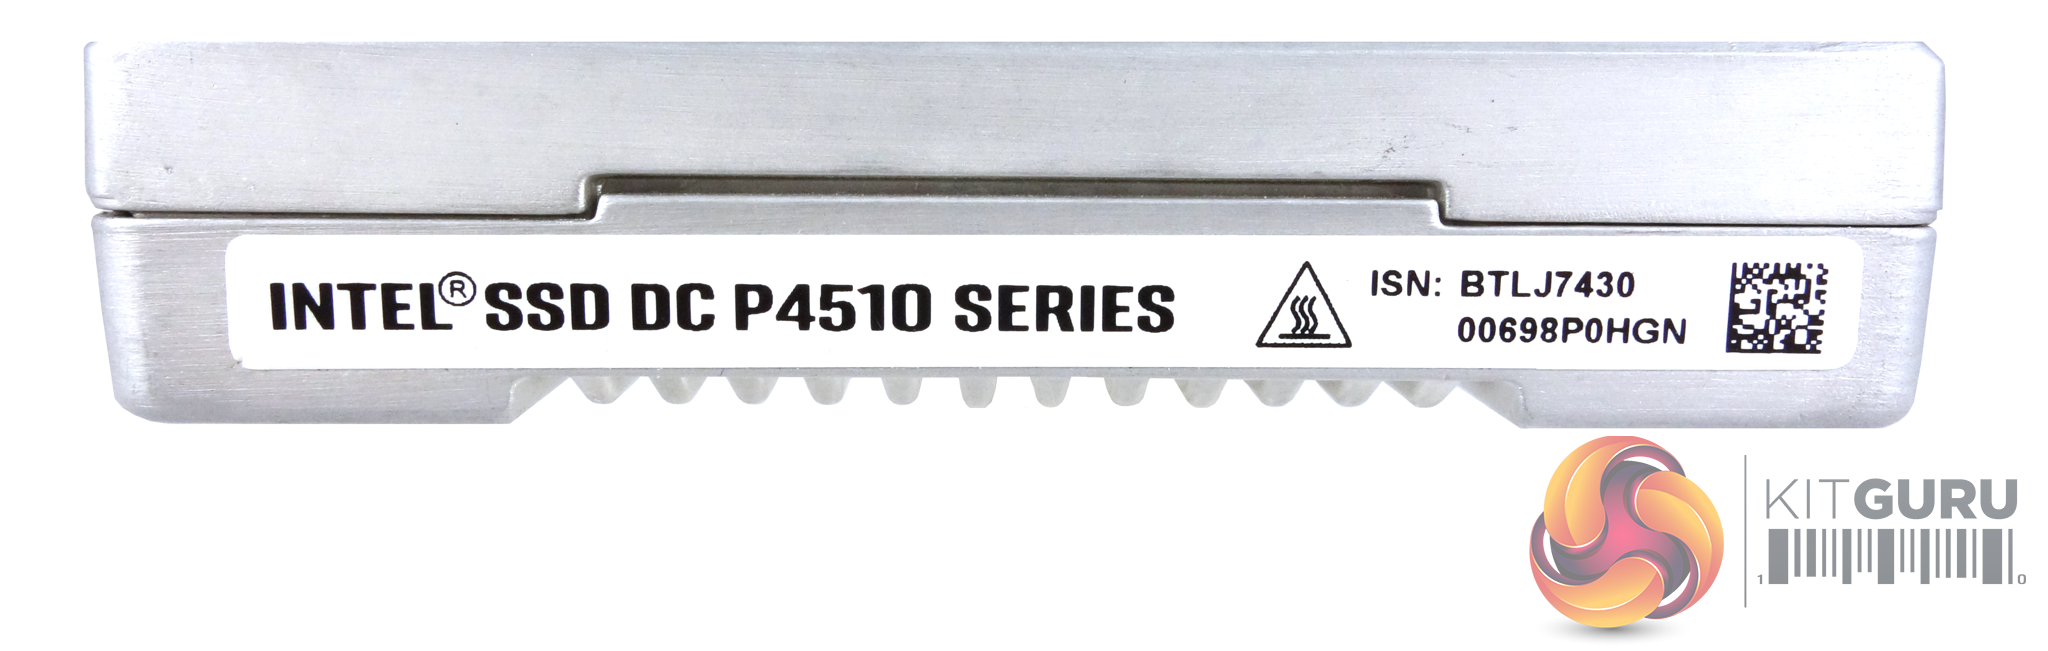
Usable Capacities: 8TB
NAND Components: Intel 512Gb 64-layer TLC 3D NAND
NAND Controller: Intel
Cache: 8GB
Interface: U.2 (PCIe 3.1 x4, NVMe 1.2)
Form Factor: 2.5in, 15mm
Dimensions: 70 x 100 x 15mm
Drive Weight: 139g
Firmware Version: 0120
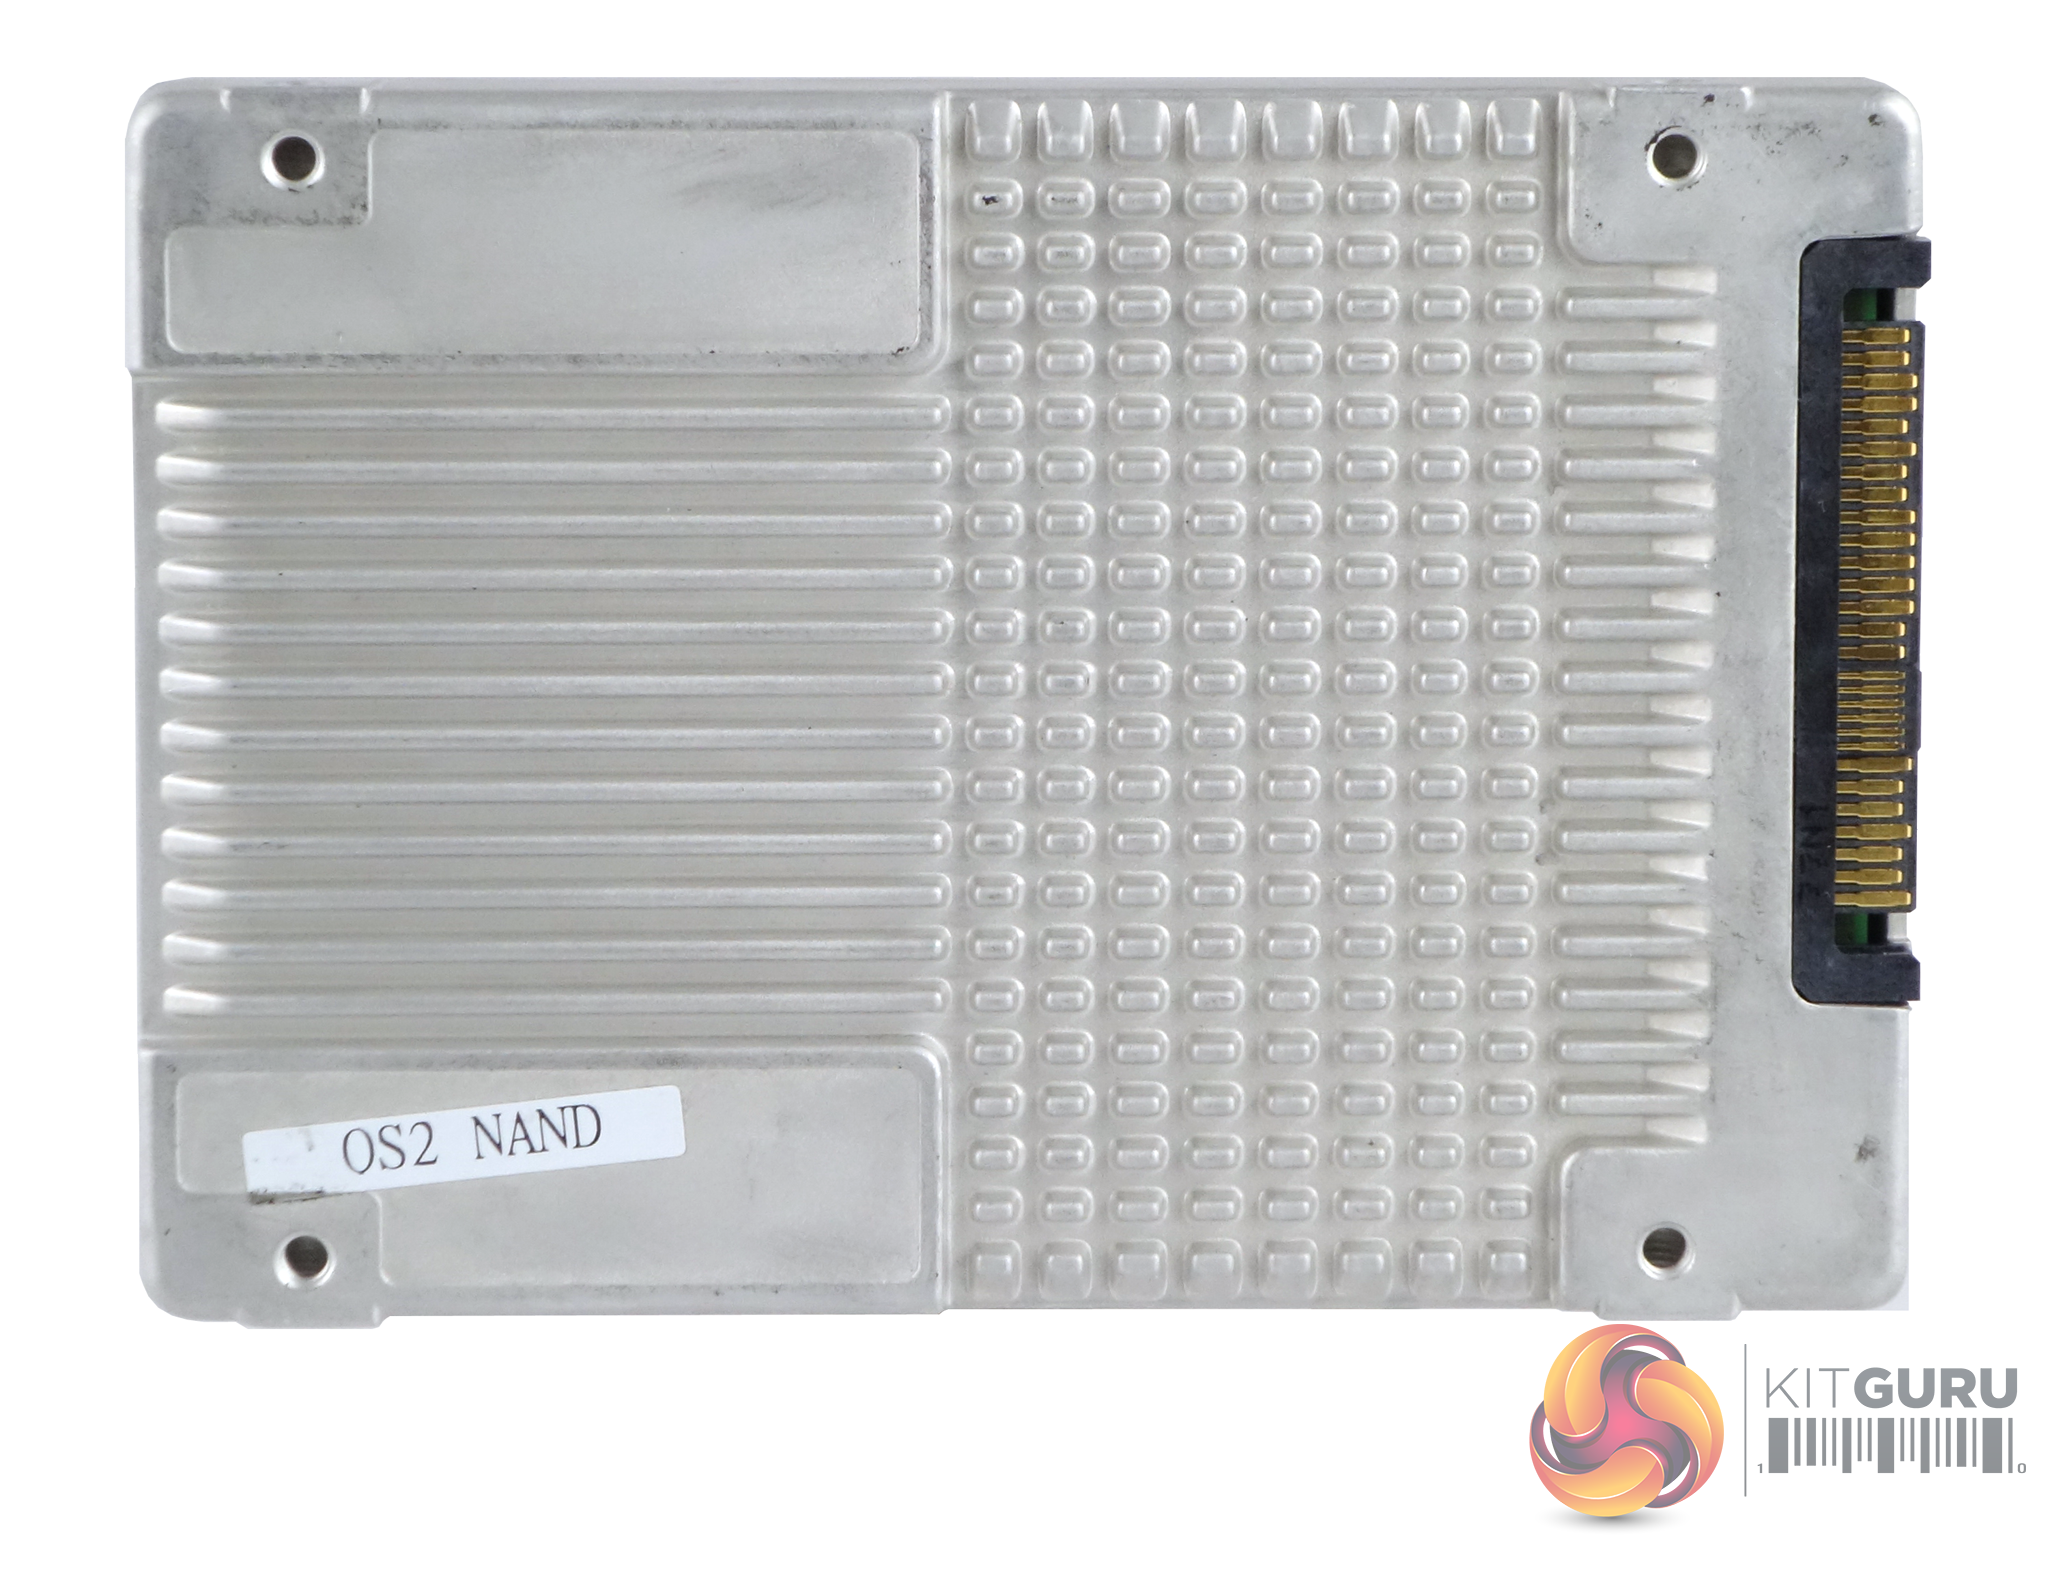
The bottom of the case is made from heavy-duty cast aluminium and has a finned heatsink design that helps dissipate the heat from the drive.
We didn't open up the P4510 to look at the internal layout, but what we do know is that it uses two PCBs joined together with a data ribbon. One carries the Intel controller along with the DRAM cache chips, a large capacitor for the power loss protection and some of the NAND packages. The second PCB carries all of the remaining 64-layer Intel 3D TLC NAND packages that make up the drives capacity.
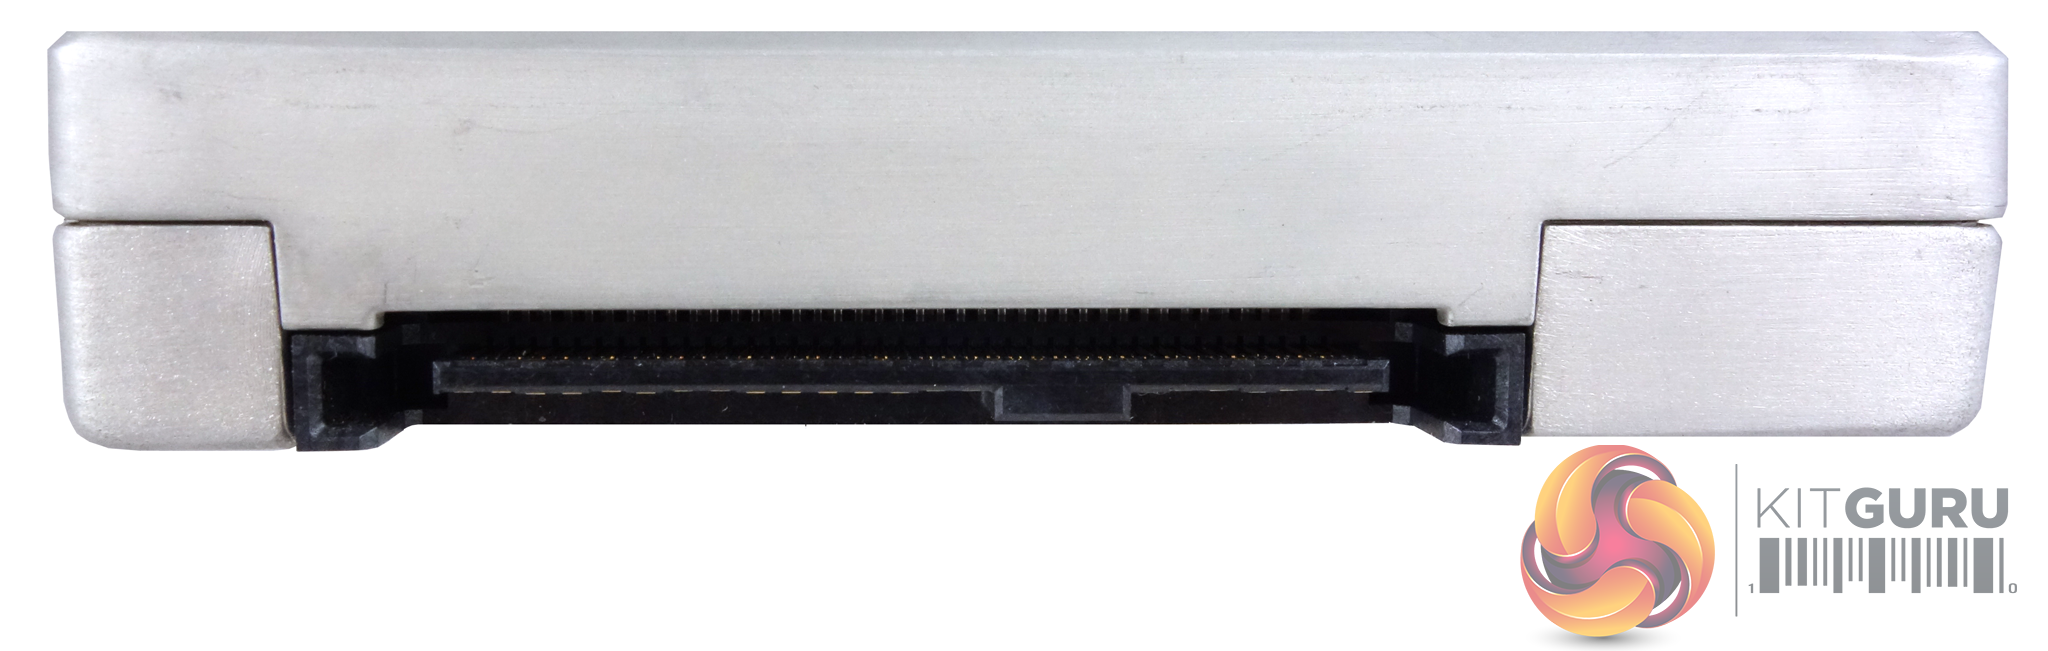
The drive uses a PCIe 3.1 x4, NVMe 1.2 U.2 interface.
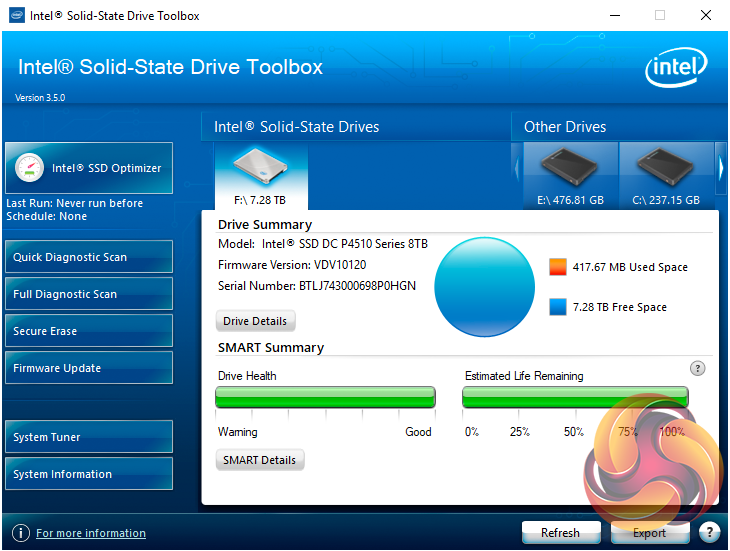
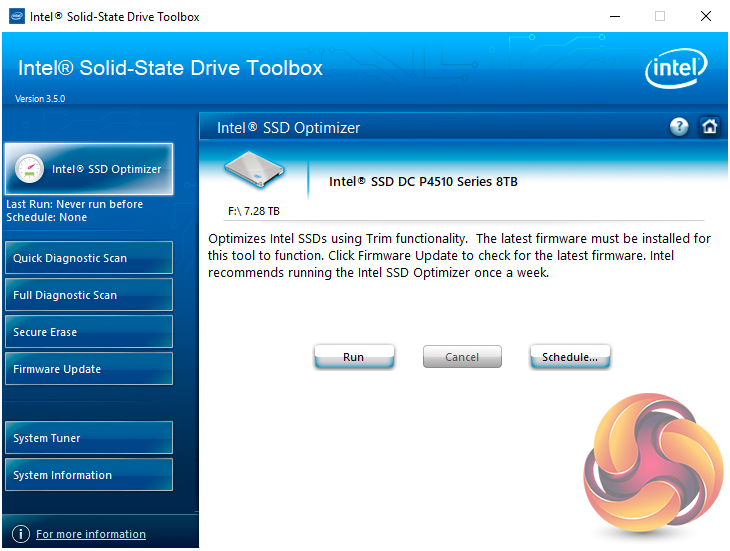
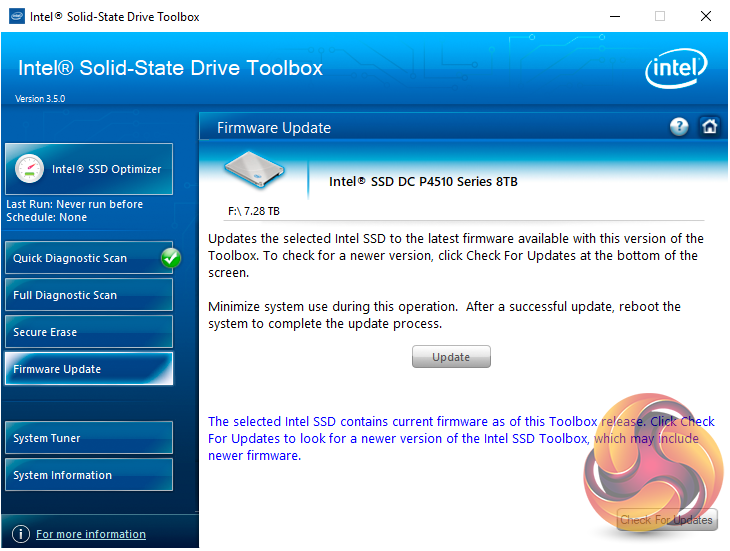
Intel's Toolbox SSD management utility supports the DC P4510 and is a pretty comprehensive tool for looking after your SSD. The home screen displays information about the drive, how the capacity is being used, its health and estimated life remaining.
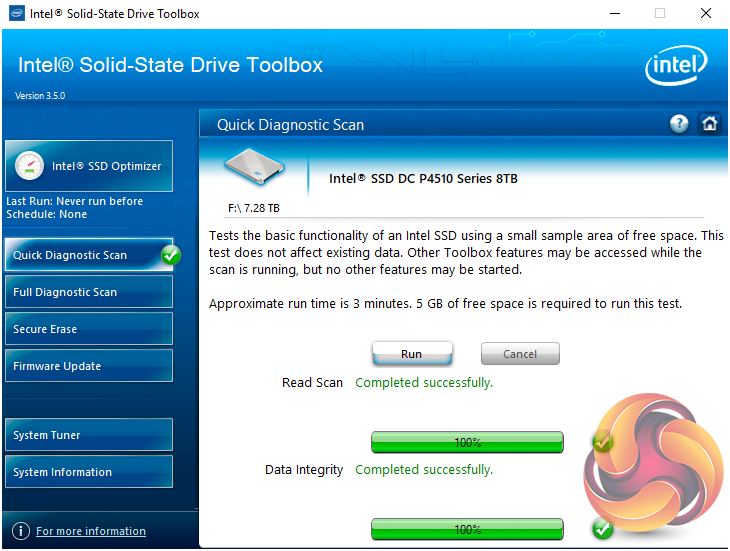
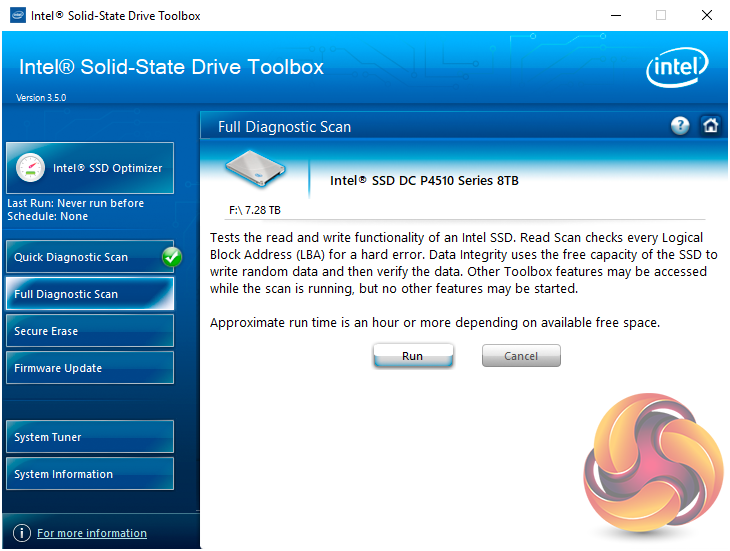
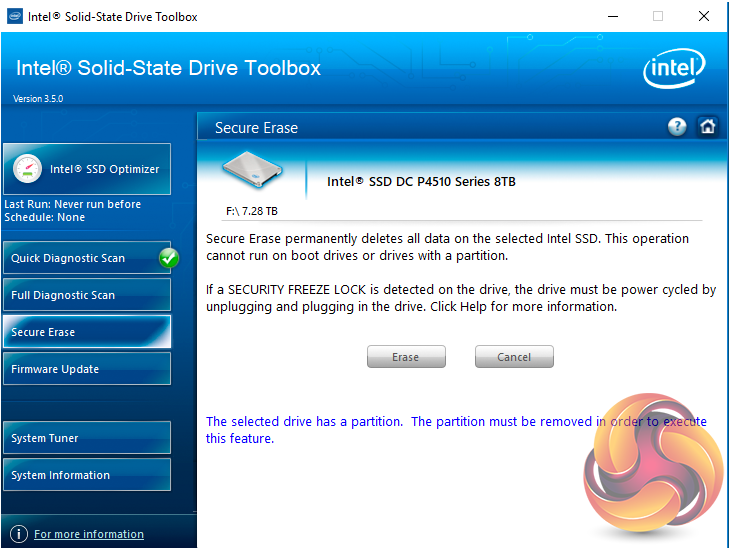
There are seven buttons on the right hand side of the utility main screen. These are for Intel’s SSD Optimizer, two drive diagnostic scans, one quick the other full, secure erase, firmware updates, a system tuner and a page for system information.
For testing, the drives are all wiped and reset to factory settings by HDDerase V4. We try to use free or easily available programs and some real world testing so you can compare our findings against your own system.
This is a good way to measure potential upgrade benefits.
Main system:
Intel Core i7-7700K with 16GB of DDR4-3200 RAM, Sapphire R9 390 Nitro and an Asus Prime Z270-A motherboard.
Software:
Atto Disk Benchmark 3.5.
IOMeter.
Futuremark PC Mark 8
All our results were achieved by running each test five times with every configuration this ensures that any glitches are removed from the results. Trim is confirmed as running by typing fsutil behaviour query disabledeletenotify into the command line. A response of disabledeletenotify =0 confirms TRIM is active.
To aid in the testing of the drive, Intel kindly supplied us with a U.2 adaptor and the appropriate data/power cabling.
The ATTO Disk Benchmark performance measurement tool is compatible with Microsoft Windows. Measure your storage systems performance with various transfer sizes and test lengths for reads and writes. Several options are available to customize your performance measurement including queue depth, overlapped I/O and even a comparison mode with the option to run continuously.
Use ATTO Disk Benchmark to test any manufacturers RAID controllers, storage controllers, host adapters, hard drives and SSD drives and notice that ATTO products will consistently provide the highest level of performance to your storage.
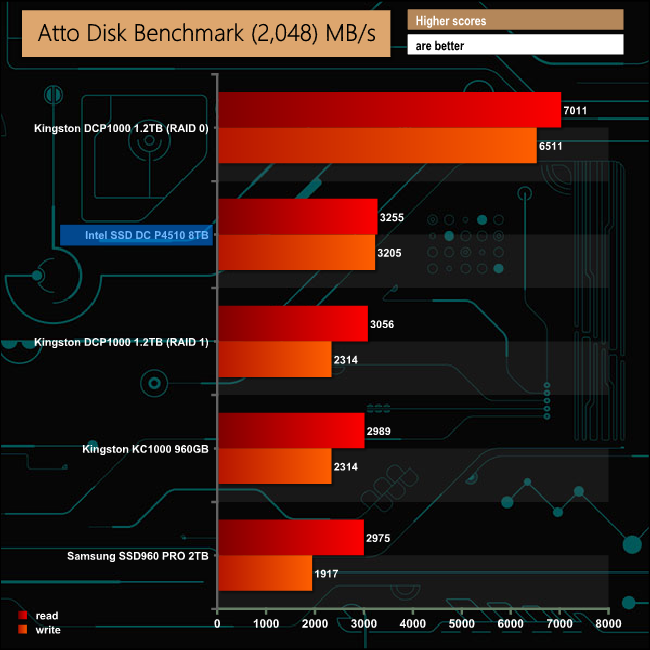
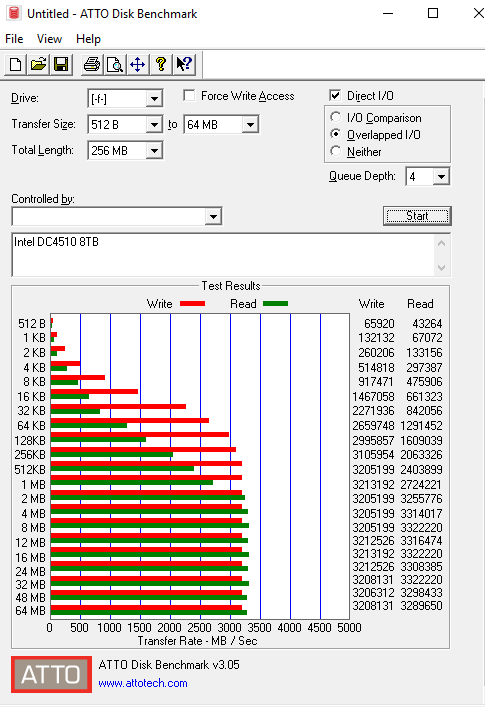
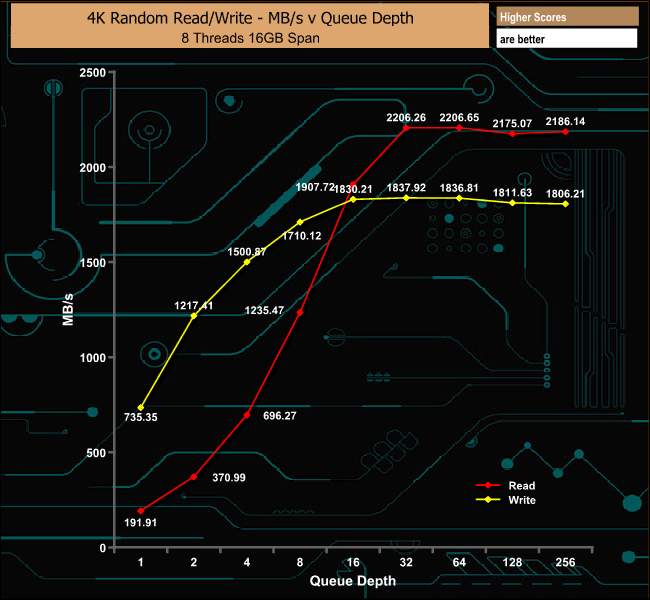
The official Sequential performance figures quoted by Intel for the 8TB DC P4510 are up to 3,200MB/s for reads and up to 3,000MB/s for writes. Both of these figures we could confirm under testing with the drive producing a read figure of 3,255MB/s and writes of 3,205MB/s in the ATTO benchmark.
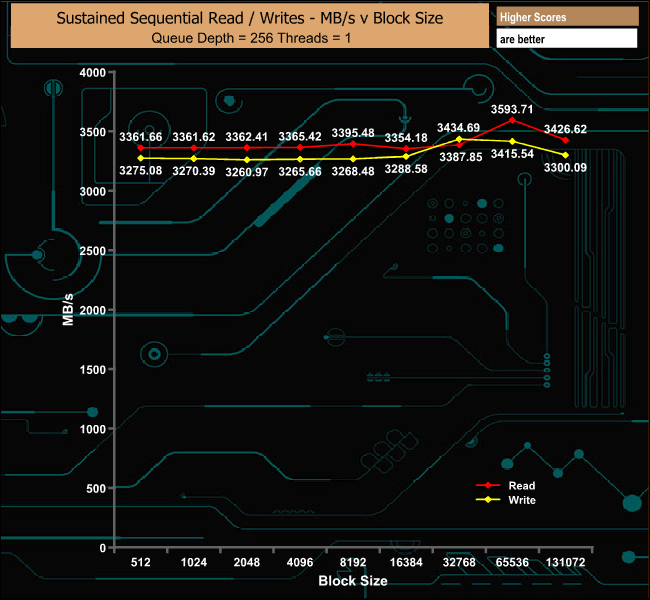
As with the ATTO benchmark, in our sustained Sequential read/write versus block size tests, the drive outperformed the official figures with the reads peaking at 3,593.71MB/s while the best write figure achieved was 3,415.54MB/s.
4KB Random Read / Write Performance
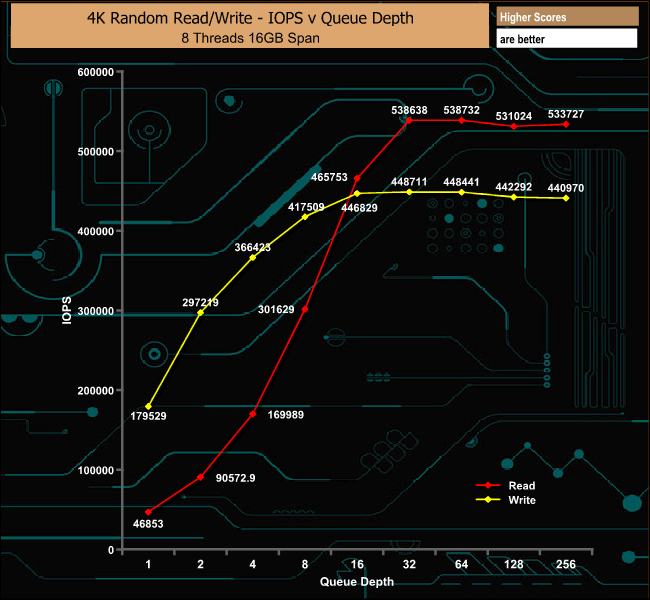
Although more in tune with a desktop environment rather than the market segment the drive is aimed at, we tested we tested the drive using a 4K data block and a 16GB span. The drives read performance peaked at 538,732 IOPS a fair way short of the maximum figure of 620,000 IOPS quoted by Intel.
However the best write figure we got from this test, 448,711 IOPS totally eclipsed the official figure of up to 139,500 IOPS.
8KB Random Read / Write Performance
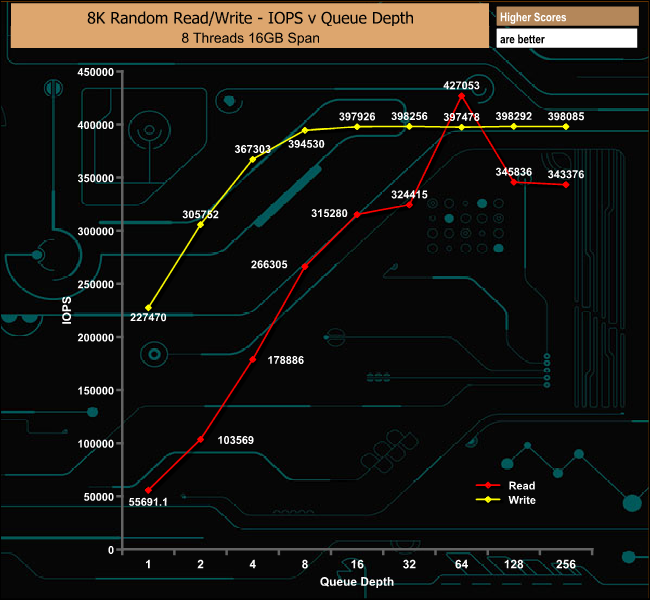
We also tested the drive using an 8KB data block and 8 threads which is much more typical of an enterprise environment, again using a 16GB span. In this test the read performance peaked at a queue depth of 64 at 427,053 IOPS before dropping back to finish the test run at 343,376 IOPS.
The write performance was a much smoother affair with a gently climb to a peak of 398,292 IOPS at a QD of 128 and ending the test at 398,085 IOPS.
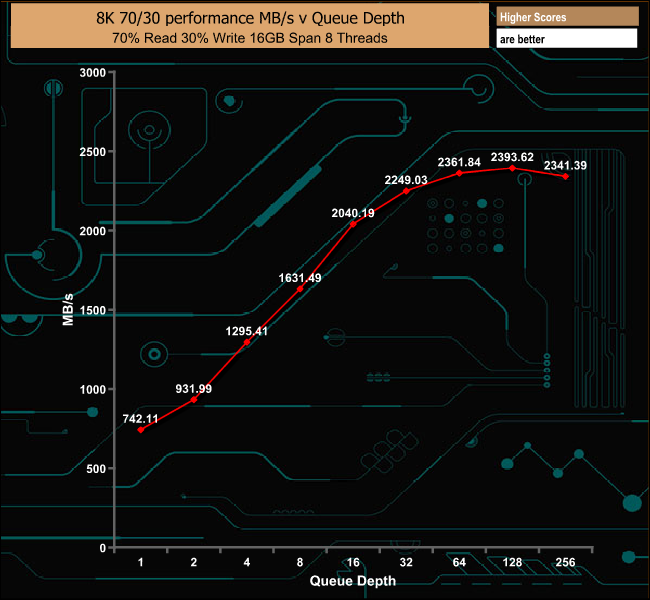
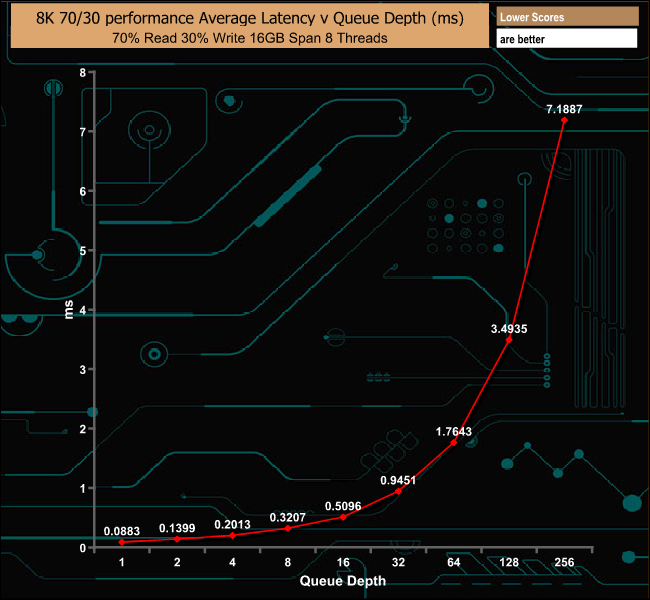
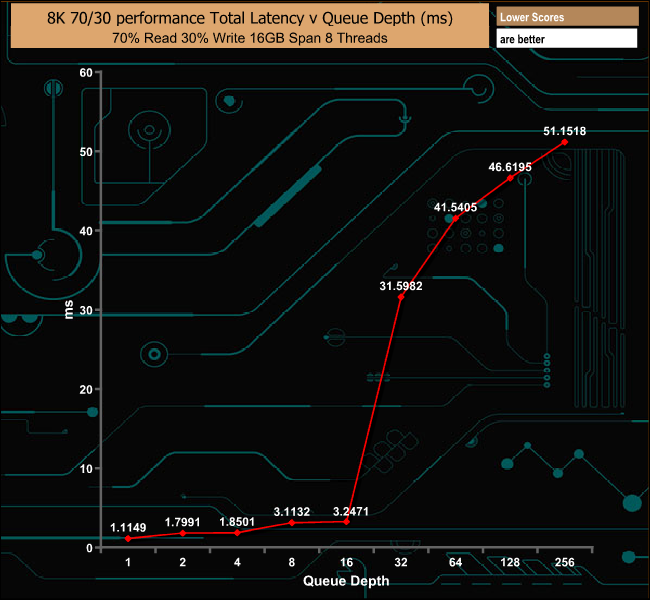
8KB 70/30 read/write
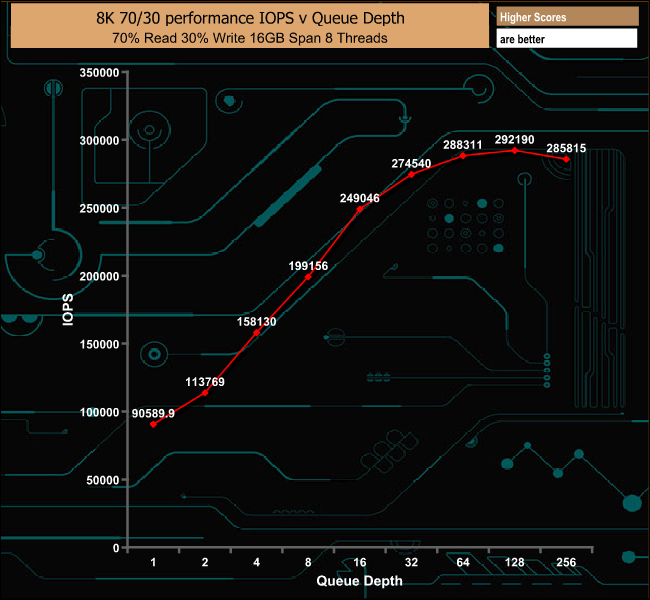
Testing the drive with a 8KB data block and a 70/30 read/write split, again another test with the enterprise environment in mind saw the drive produce a peak of 292,190 IOPS, strong performance for this particular test.
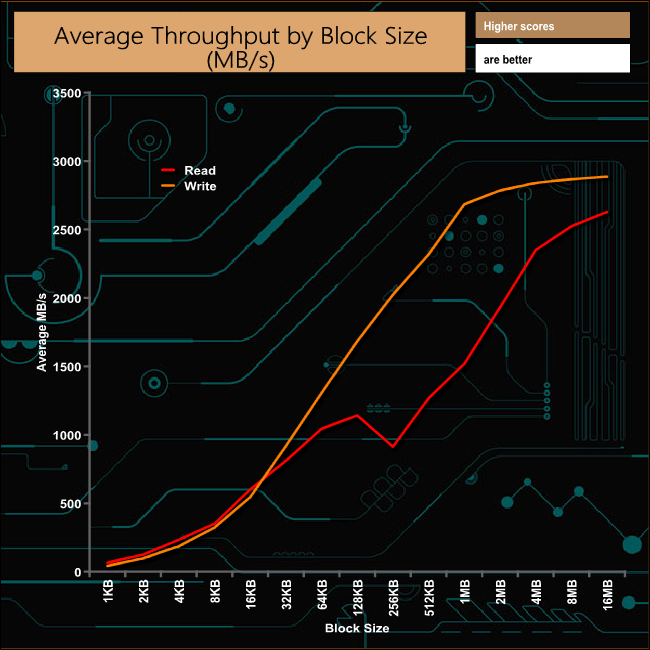
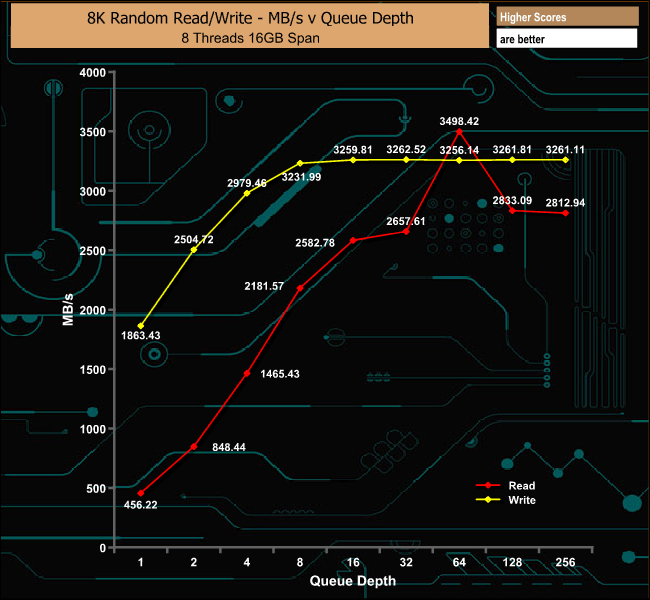
In our throughput test the drive produces a smooth performance curve for writes, peaking at the end of the test run at 2,885.93MB/s. The read curve is nowhere near as smooth with a sizable drop in performance at the 256KB block size. However, the drive recovers well to peak at 2,627.92MB/s at the end of the test.
We tested the DC P4510 in a number of scenario’s that it may be used for in the real world. The settings for these scenarios are as follows.
Database
Transfer Size: 8K Reads: 67% Writes: 33% Random: 100%
Boundary: 4K Outstanding IO: 64 Threads/Workers: 8
Exchange Server 2007
Transfer Size: 8K Reads: 67% Writes: 33% Random: 100%
Boundary: 8K Outstanding IO: 60 Threads/Workers: 1
SQL Server 2008 OLTP
Transfer Size: 8K Reads: 70% Writes: 30% Random: 100%
Boundary: 8K Outstanding IO: 60 Threads/Workers: 1
Web File Server 64KB
Transfer Size: 64K Reads: 95% Writes 5% Random: 75%
Boundary: 4K Outstanding IO: 64 Threads/Workers: 8
Web File Server 8KB
Transfer Size: 8K Reads: 95% Writes: 5% Random: 75%
Boundary: 4K Outstanding IO: 64 Threads/Workers: 8
Web File Server 4KB
Transfer Size: 8K Reads: 95% Writes: 5% Random: 75%
Boundary: 4K Outstanding IO: 64 Threads/Workers: 8
Media Streaming
Transfer Size: 64K Reads: 98% Writes: 2% Sequential: 100%
Boundary: 4K Outstanding IO: 64 Threads/Workers: 8
Video On Demand
Transfer Size: 128K Reads: 100% Writes: 0% Random: 100%
Boundary: 4K Outstanding IO: 512 Threads/Workers: 8
Decision Support DB
Transfer Size: 1MB Reads: 100% Writes: 0% Random: 100%
Boundary: 4K Outstanding IO: 64 Threads/Workers: 8
Mail Server
Transfer Size: 32K Reads: 58% Writes: 42% Random: 95%
Boundary: 4k Outstanding IO: 64 Threads/Workers:8
Search Engine
Transfer Size: 4K Reads: 100% Writes: 0% Random: 100%
Boundary: 4K Outstanding IO: 64 Threads/Workers:8
OS Paging
Transfer Size: 64K Reads: 90% Writes: 10% Sequential: 100%
Boundary: 4K Outstanding IO: 64 Threads/Workers:1
Digital Video Surveillance
Transfer Size: 512K Reads: 90% Writes: 10% Sequential: 100%
Boundary: 512K Outstanding IO: 64 Threads/Workers:8
Workstation
Transfer Size: 8K Reads: 80% Writes: 20% Random: 80%
Boundary: 8K Outstanding IO: 64 Threads/Workers 4
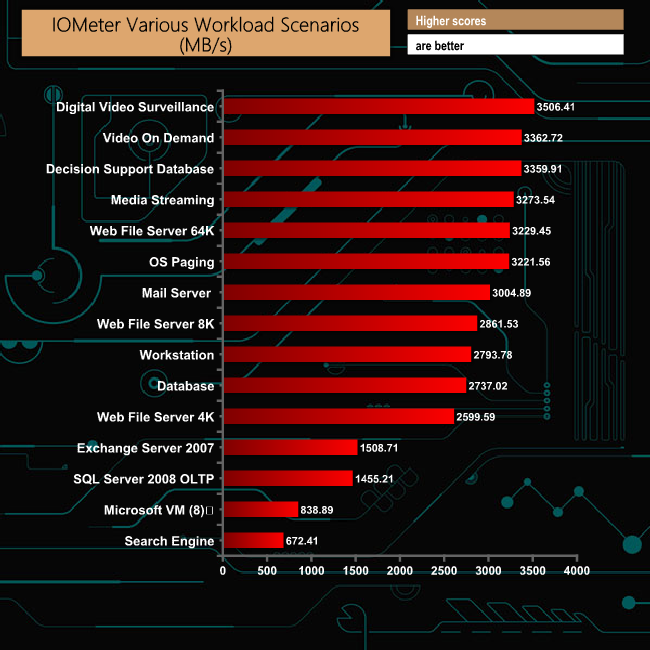
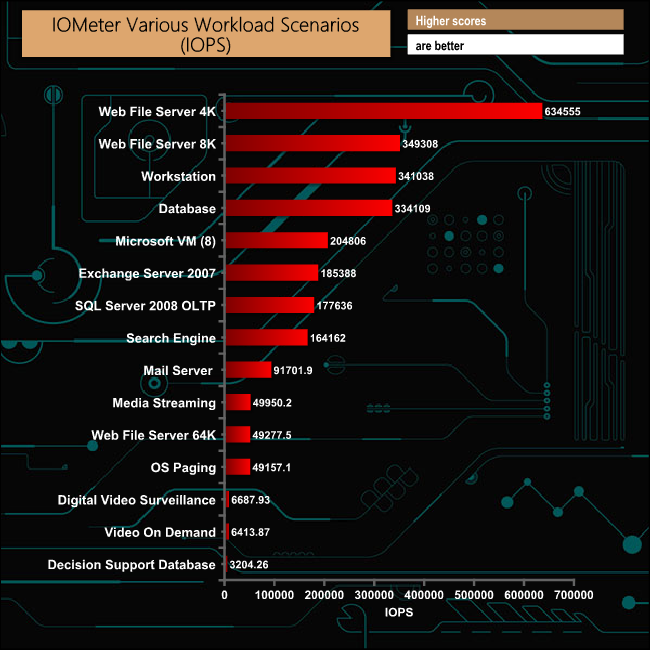
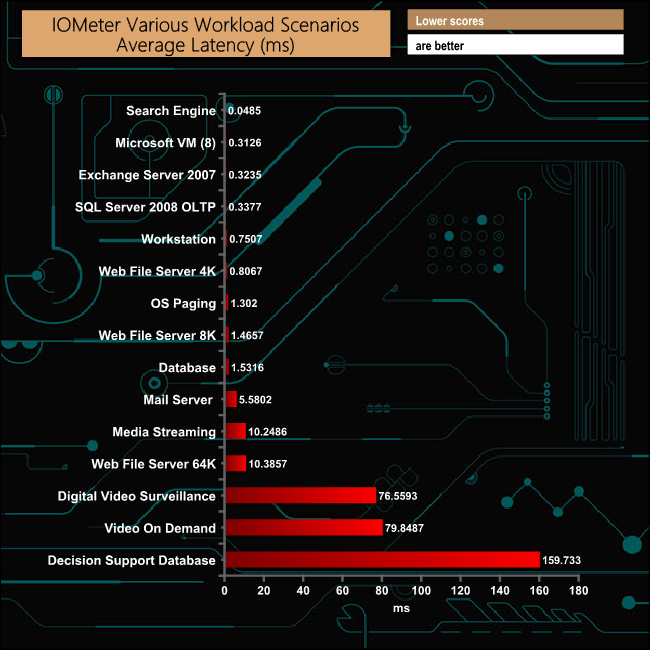
The SSD DC P4510 provided some excellent numbers in these workload scenarios. The Digital Video Surveillance, Video On Demand, Media Streaming, Decision Support Database, 64K Web File Server and OS paging tests all produced MB/s figures that surpassed the official top end figure of 3,200MB/s.
Futuremark's PCMark 8 Standard Storage test saves a large amount of performance data. The default test runs through the test suite of 10 applications three times. Here we show the total bandwidth performance for each of the individual test suites for the third and final benchmark run.
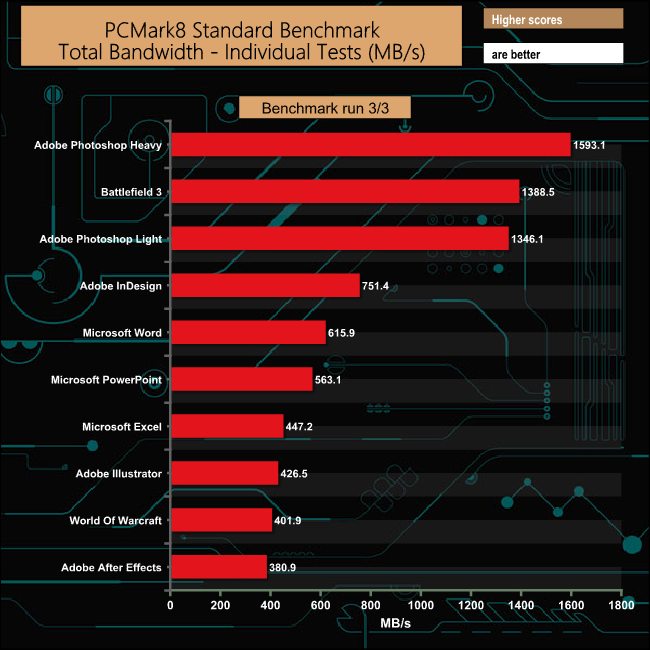
The drive showed strong performance in all the test suite applications particularly in the two Adobe Photoshop tests, and the somewhat surprisingly the Battlefield 3 test.
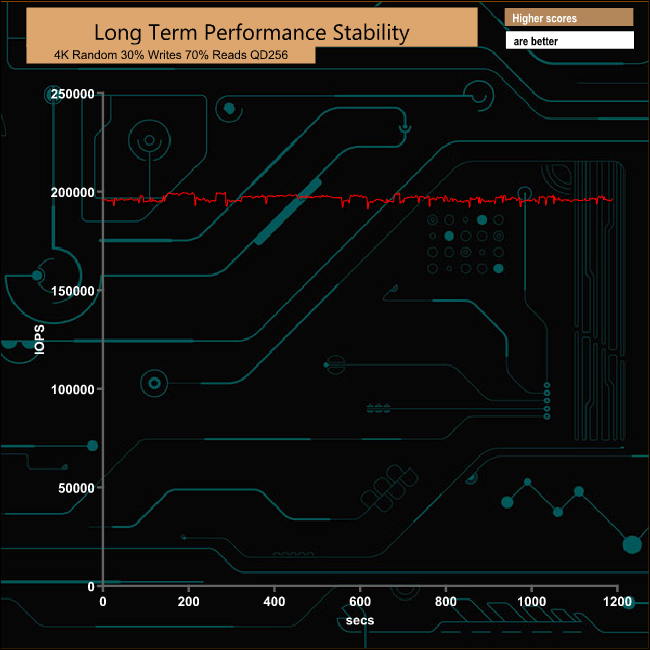
For the long term performance stability test, we set the drive up to run a 20-minute 4K random test with a 30% write, 70% read split, at a Queue Depth of 256 over the entire disk. The 8TB Intel DC P4510 averaged 196,503 IOPS for the test with a performance stability of 98.52%.
A performance stability figure of 98% and above is what should be expected or indeed demanded of a drive in the mission critical environment of a data centre.
To test real life performance of a drive we use a mix of folder/file types and by using the FastCopy utility (which gives a time as well as MB/s result) we record the performance of drive reading from & writing to a 256GB Samsung SSD850 PRO.
100GB data file.
60GB iso image.
60GB Steam folder – 29,521 files.
50GB File folder – 28,523 files.
12GB Movie folder – 24 files (mix of Blu-ray and 4K files).
10GB Photo folder – 621 files (mix of png, raw and jpeg images).
10GB Audio folder – 1,483 files (mix of mp3 and .flac files).
5GB (1.5bn pixel) photo.
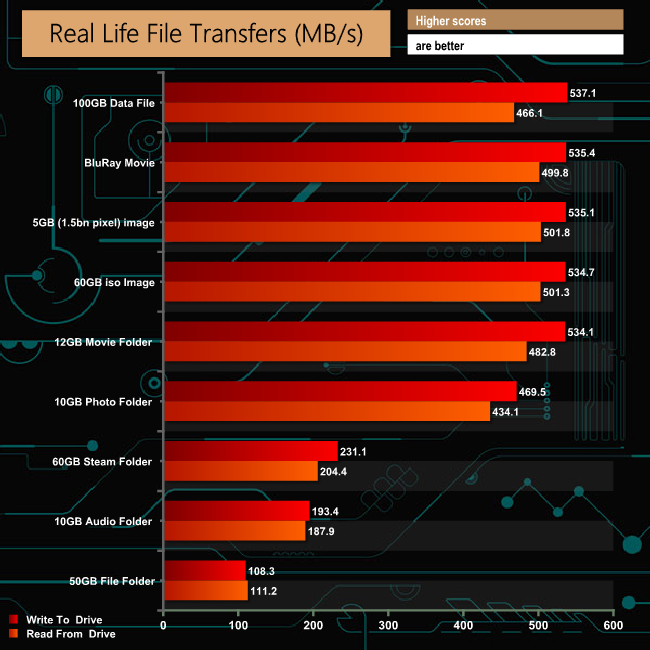
The drive deals with large files much more efficiently than the smaller files of the 60GB Steam, 50GB File and 10GB Audio folders.
To get a measure of how much faster PCIe NVMe drives are than standard SATA SSD's we use the same files but transfer to and from a 512GB Toshiba OCZ RD400
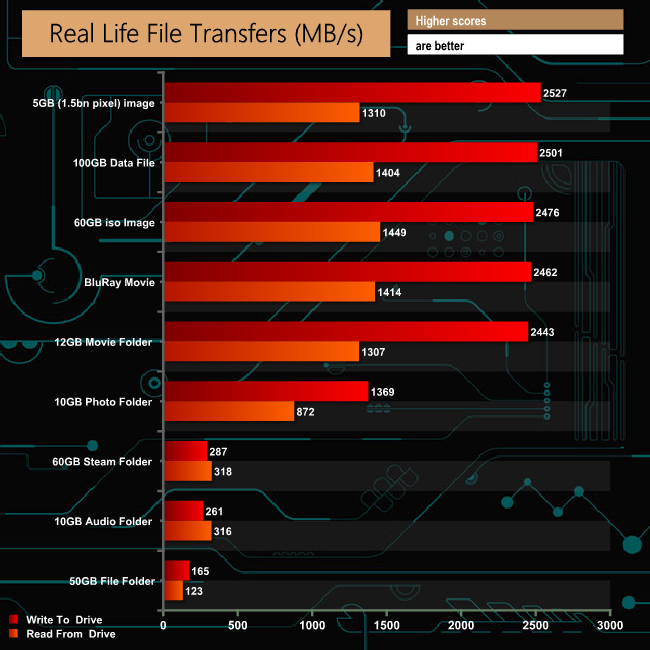
By taking the 6Gb/s interface of the Samsung drive out of the equation, we get a true idea of what the drive is capable of when dealing with our real life file transfers, particularly when dealing with the larger file sizes.
Designed to support a broad range of cloud workloads, Intel's DC P4510 builds on the success of the previous generation DC P4500 family of drives and introduces Intel's 64-layer TLC NAND to the enterprise segment enabling greater Quality Of Service (QoS) bandwidth and performance in the data centre environment.
The previous P4500 model came in three form factors depending on capacity; standard 2.5in 15mm U.2, HHHL Add In Card and EDSFF (Intel's Ruler concept). Currently (at the time of writing) the P4510 is only available as a 2.5in 15mm U.2 drive.

The new drives have enhanced SMART monitoring and a power loss imminent (PLI) protection scheme that guards against power loss if the system power is suddenly lost. The DC P4510 also supports a built in AES-XTS 256-bit encryption engine and TCG Opal 2.0.
Intel state official Sequential read/write figures for the 8TB drive as up to 3,200MB/s and 3,000MB/s respectively. Using our sustained Sequential test we could confirm and indeed better those figures with a read result of 3,593.71MB/s and 3,415.54MB/s for writes.
Official 4K Random Read/Write figures for the drive are up to 620,000 IOPS for reads and up to 139,000 IOPS for writes. Under our 4K Random read/write tests we couldn't get close to that maximum figure for reads with a peak IOPS score of 538,732 IOPS. However when it came to writes the tested drive gave a figure which eclipsed the official figure producing a peak figure of 448,711 IOPS. Tested with a 8KB data block the drive produced a peak read figure of 427,053 IOPS for reads and 398,292 IOPS for writes.
In our long term performance stability test, the drive averaged 196,503 IOPS but more importantly it achieved a performance stability of 98.52%, which is what you would expect from a drive aimed at the market segment the DC P4510 is aimed at.
The flagship 8TB DC P4510 comes with a hefty price tag but breaking it down to a very basic simple £/GB figure it works out at around 0.61p/GB which works out to be cheaper than the 4TB flagship 2.5in drive of the previous generation P4500 line-up at 0.63p/GB.
We found the 8TB Intel SSD DC P4510 on Span.co.uk for £2,168 HERE (updated April 2019).
Pros
- Overall Performance.
- 5 year warranty.
- Improved QoS.
Cons
- Couldn't match the official 4K Random Read IOPS figure under testing.
Kitguru says: The DC P4510 brings Intel's 64-layer TLC NAND to the enterprise segment allowing for larger capacities, improved performance and Quality Of Service, which in turn brings improved service levels in data centres.