A few months ago we looked at Lexar's NM600 SSD, and now it is the turn of its successor, the NM610, to go under the spotlight. Priced at just over £70 for the 500GB model, what sort of performance can this drive offer to those looking for an affordable NVMe SSD? The previous NM600 was only available in two capacities, 240GB and 480GB. The NM610 not only has slightly larger capacities; 250GB and 500GB, it also has a 1TB flagship model. The official Sequential speed ratings for the three drives are; 250GB up to 2,000MB/s reads and up to 1,200MB/s writes while the 500GB and 1TB models share the same up to 2,100MB/s read, 1,600MB/s write performance figures. Incidentally, the 250GB and 500GB figures are exactly the same as the 240GB and 480GB NM600 drives. Random 4K performance is quoted as up to 110,000 IOPS and 151,000 IOPS for reads and writes respectively for the 250GB drive with the 500GB and 1TB drive having the same up to 188,000 IOPS and 156,000 IOPS for reads and writes respectively. Again the two smaller drive figures are the same as the previous NM600 drive. Endurance ratings for the 500GB drive are 250TB TBW with the 250GB rated at 125TB and the 1TB drive 500TB. Physical Specifications: Usable Capacities: 500GB. NAND Components: 3D TLC. NAND Controller: Silicon Motion SM2263XT. Cache: None. Interface: PCIe Gen3x4 NVMe. Form Factor: M.2 2280. Dimensions: 80 x 22 x 2.25 mm. Drive Weight: 9g. Firmware Version: S0614B0. The front of the box has a large clear image of the drive on it along with notes about the fact it uses 3D NAND and supports the NVMe 1.3 specifications. The tab at the top of the box is labelled with the drive’s capacity. The rear of the box has, at the top right, the maximum rated Sequential read speed (up to 2,100MB/s). Under this are a few lines of multilingual marketing text. Like the NM600, the NM610 is a single-sided design with all the components housed on one side of the PCB. Making this layout easier to accomplish is the fact that the drive is a DRAM-less design so there is one less chunk of silicon to find a place for. At one end of the PCB, sitting on its own is the Silicon Motion SM2263XT controller while under the product label there are four packages of 64-layer 3D TLC NAND. We tried to prise the label off to see whose NAND the drive is using but whatever was used to attach the label works very well, as it refused to budge without tearing. Silicon Motion’s SM2263XT 4-channel controller supports the NVMe 1.3 specification and ONFi 3.0 / 4.0, Toggle 2.0 / 3.0 & NV-DDR3 NAND to 667MT/s. Security-wise it supports real-time full drive encryption with 256-bit AES and TCG Opal and IEEE-1667 (Microsoft’s eDrive) protocols while SMI’s NANDXtend ECC technology takes care of data protection when is in the Flash. Lexar’s SSD utility goes under the name of SSD Dash. It’s not as fully featured as some of its competitor’s from, for example, Samsung or WD, but it does offer all the basic information you might need to keep an eye on your drive in an easy to understand way. It also supports Secure Erase. For testing, the drives are all wiped and reset to factory settings by HDDerase V4. We try to use free or easily available programs and some real-world testing so you can compare our findings against your own system. This is a good way to measure potential upgrade benefits. Main system: AMD Ryzen 5 3600X, 16GB DDR4-2400, Sapphire R9 390 Nitro and an MSI MPG X570 Gaming Edge Wifi motherboard. Other drives. 500GB Class. Corsair Force MP500 480GB Gigabyte Aorus RGB 512GB Intel Optane SSD900P 480GB Intel Optane SSD905P 480GB Intel SSD760p 512GB Kingston A1000 480GB Lexar NM600 480GB Plextor M9Pe(Y) 512GB Plextor M8PeG 512GB Toshiba OCZ RD400 512GB Western Digital Blue SN500 500GB Software: Atto Disk Benchmark 3.5 & 4.0 CrystalMark 6.0.0 & 7.0.0. AS SSD 2.0. IOMeter. PCMark 08. PCMark 10. All our results were achieved by running each test five times with every configuration this ensures that any glitches are removed from the results. Trim is confirmed as running by typing fsutil behavior query disabledeletenotify into the command line. A response of disabledeletenotify =0 confirms TRIM is active. CrystalDiskMark is a useful benchmark to measure theoretical performance levels of hard drives and SSD’s. We are using v6.0 but are in the process of switching to v7. We will record results from both versions here. The Lexar NM610 doesn’t perform too well in the CrystalDiskMark 6.0 benchmark at a deep queue depth of 32, although is performance is stronger than the previous NM600 drive. Looking at the two benchmark result screens, the Silicon Motion controller doesn’t seem to have a preference as to the type of data is asked to handle. At a QD of 1, where most of today’s desktop workloads take place, the NM610's 234.3MB/s write performance is stronger than the 169.7MB/s of the NM600. There isn't a lot to choose between the drives when it comes to read performance, however. The latest version of CrystalDiskMark, version 7, includes a couple of profiles that can be used for testing – Peak Performance and Real World. The result screens for these two profiles not only display MB/s results but also IOPS and latency. Looking at the Peak Performance results for Sequential read/write performance we see that the review drive couldn't quite get to the official maximum Sequential read figure of 2,100MB/s, producing a score of 2,085.36MB/s. However, at 1,678MB/s its write score is a little better than the official maximum of 1,600MB/s. In the Peak Performance 4K random tests, the best we saw from the drive was 160,023 IOPS, well short of the official figure of 188,000 IOPS. On the other hand, the write figure of 243,983 IOPS sailed past the official maximum of 156,000 IOPS. The ATTO Disk Benchmark performance measurement tool is compatible with Microsoft Windows. Measure your storage systems performance with various transfer sizes and test lengths for reads and writes. Several options are available to customize your performance measurement including queue depth, overlapped I/O and even a comparison mode with the option to run continuously. Use ATTO Disk Benchmark to test any manufacturers RAID controllers, storage controllers, host adapters, hard drives and SSD drives and notice that ATTO products will consistently provide the highest level of performance to your storage. We are in the process of switching over to version 4.0 for our NVMe disk tests but we've included ATTO 3.5 results for the drive as well. Lexar quote Sequential performance for the 500GB NM610 as up to 2,100MB/s for reads and up to 1,600MB/s for writes. Using the ATTO benchmark we couldn’t quite reach the maximum performance rate for reads but with a result of 2,070MB/s, it’s not that far short. Writes on the other hand at 1,657MB/s did a little better than the official 1,600MB/s. In the latest version 4 of ATTO, the NM610 is a wee bit slower than the NM600 when it comes to reads and 40MB/s faster when it comes to writes. AS SSD is a great free tool designed just for benching Solid State Drives. It performs an array of sequential read and write tests, as well as random read and write tests with sequential access times over a portion of the drive. AS SSD includes a sub suite of benchmarks with various file pattern algorithms but this is difficult in trying to judge accurate performance figures. The NM610 is a little slower for both reads and writes in the AS SSD benchmark than the previous NM600 drive. IOMeter is another open-source synthetic benchmarking tool which is able to simulate the various loads placed on the hard drive and solid-state drive technology. There are many ways to measure the IOPS performance of a Solid State Drive, so our results will sometimes differ from the manufacturer’s quoted ratings. We do test all drives in exactly the same way, so the results are directly comparable. We test 128KB Sequential read and write and random read and write 4k tests. The test setup’s for the tests are listed below. Each is run five times. 128KB Sequential Read / Write. Transfer Request Size: 128KB Span: 8GB Thread(s): 1, Outstanding I/O: 1-32 Test Run: 20 minutes per test 4K Sustained Random Read / Write. Transfer Request Size: 4KB Span: 80GB Thread(s): 4, Outstanding I/O: 1-32 Test Run: 20 minutes per test 4K Random 70/30 mix Read/Write. Transfer Request Size: 4KB Span: 80GB Reads: 70% Writes: 30% Thread(s): 4 Outstanding I/O: 2 – 32 Test Run: 20 minutes With our Sequential read/write test we couldn’t quite match the official maximum read figure of 2,100MB/s at 2,091.11MB/s but we bettered the official write score of 1,600MB/s, the test runs producing a peak of 1,710.56MB/s at a QD of 8. 128KB Sequential Read Performance Compared The NM610 and NM600 are pretty much tied together throughout our tested Queue Depths with the exception of QD4 when the NM610 suffers a small dip in performance. 128KB Sequential Write Performance Compared When it comes to our Sequential write tests, at a QD of 2 the NM610 shows a marked improvement in performance over the NM600 however, at a QD of 4 the roles are reversed with the NM600 having the advantage. Lexar quote random 4K read performance for the 500GB NM610 as up to 188,000 IOPS. With our standard 4 thread testing, we couldn’t get close to that figure, the best we saw was 132,413 IOPS at a QD of 32. However, a quick test at QD32 with 8 threads saw the random read performance rise to 243,856 IOPS, surpassing the official figure. 4K Random Read v QD Performance The NM610 drive performs a little better than the NM600 throughout the tested queue depths. The official 4K random write rating for the NM610 500GB drive is up to 156,000 IOPS. As you can see from the results graph at 53,610 IOPS (QD16) we couldn’t get anywhere close to that figure with our 4 thread tests. As with the random read tests, we did a quick test using eight threads at a QD of 32 which saw a dramatic rise in IOPS, with the drive reaching a maximum of 230,445 IOPS – far exceeding the official figure. 4K Random Write v QD Performance As with the NM600, the NM610 has real problems with our 4K write tests, sitting at the bottom of the chart throughout the tested queue depths, with exception of QD2 where it climbs past the NM600. 
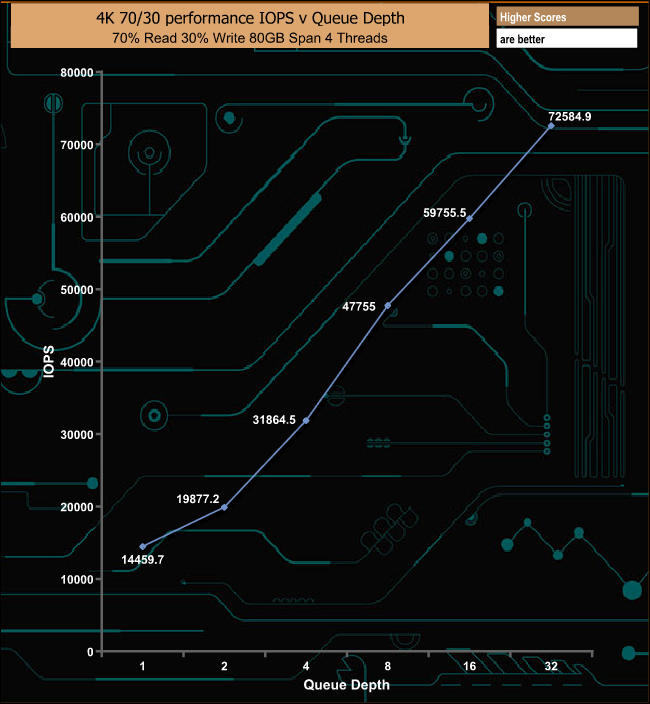
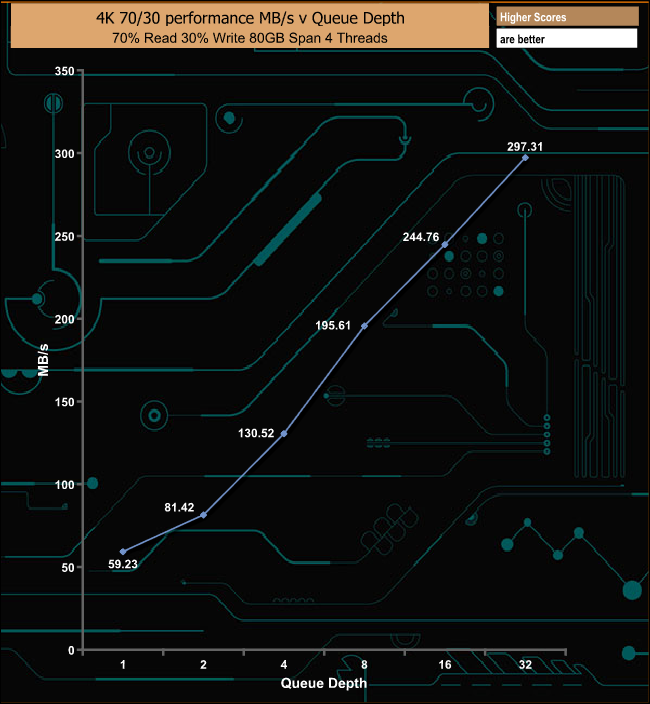
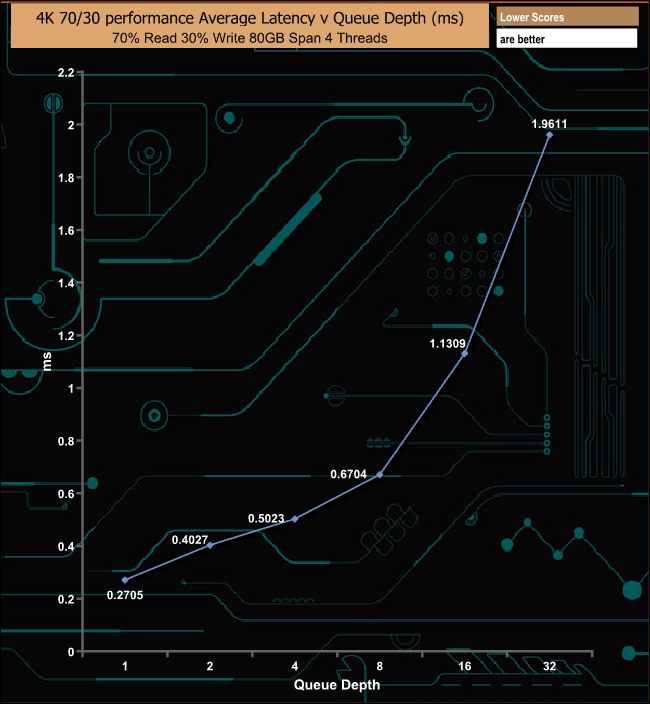
In the mixed 70/30 read/write tests, the drive was consistent through the tested queue depths, if not particularly fast. In our throughput test, the peak read figure came at the 4MB block mark at 1,824.62MB/s before dropping back to finish the test run at 1,752.18MB/s. That peak read figure of 1,824.48MB/s for the NM610 is a wee bit slower than the 1,860.52MB/s produced by the NM600. ~ The peak write throughput occurred at the 4MB block mark when the drive produced a score of 1,641.58MB/s. As with the throughput read test, the NM610 is a little slower than the NM600. PCMark 8’s Standard Storage test saves a large amount of performance data. The default test runs through the test suite of 10 applications three times. Here we show the total bandwidth performance for each of the individual test suites for the third and final benchmark run. The NM610 performs reasonably well in PCMark 8's Standard Benchmark with the best performance coming through the Adobe Photoshop Heavy trace test, the drive producing a bandwidth of 1,033MB/s. The PCMark 10 Full System Drive Benchmark uses a wide-ranging set of real-world traces from popular applications and common tasks to fully test the performance of the fastest modern drives. The benchmark is designed to measure the performance of fast system drives using the SATA bus at the low end and devices connected via PCI Express at the high end. The goal of the benchmark is to show meaningful real-world performance differences between fast storage technologies such as SATA, NVMe, and Intel’s Optane. The Full System Drive Benchmark uses 23 traces, running 3 passes with each trace. It typically takes an hour to run. Traces used: Booting Windows 10. Adobe Acrobat – starting the application until usable. Adobe Illustrator – starting the application until usable. Adobe Premiere Pro – starting the application until usable. Adobe Photoshop – starting the application until usable. Battlefield V – starting the game until the main menu. Call of Duty Black Ops 4 – starting the game until the main menu. Overwatch – starting the game until main menu. Using Adobe After Effects. Using Microsoft Excel. Using Adobe Illustrator. Using Adobe InDesign. Using Microsoft PowerPoint. Using Adobe Photoshop (heavy use). Using Adobe Photoshop (light use). Copying 4 ISO image files, 20 GB in total, from a secondary drive to the target drive (write test). Making a copy of the ISO files (read-write test). Copying the ISO to a secondary drive (read test). Copying 339 JPEG files, 2.37 GB in total, to the target drive (write test). Making a copy of the JPEG files (read-write test). Copying the JPEG files to another drive (read test). Both Lexar drives are DRAM-less designs using 64-layer 3D TLC NAND. They fall way behind the Toshiba RC500 in the PCMark 10 Full System Drive benchmark, the Toshiba drive using 96-layer 3D TLC NAND together with a 512MB DDR4-2400MHz chip looking after caching duties. For the long term performance stability test, we set the drive up to run a 20-minute 4K random test with a 30% write, 70% read split, at a Queue Depth of 256 over the entire disk. The 500GB Lexar NM610 averaged 18,118 IOPS for the test with a performance stability of 76%. To test real life performance of a drive we use a mix of folder/file types and by using the FastCopy utility (which gives a time as well as MB/s result) we record the performance of drive reading from & writing to a 256GB Samsung SSD850 PRO. We use the following folder/file types: 100GB data file. 60GB iso image. 60GB Steam folder – 29,521 files. 50GB File folder – 28,523 files. 12GB Movie folder – (15 files - 8 @ .MKV, 4 @ .MOV, 3 @ MP4). 10GB Photo folder – (304 files - 171 @ .RAW, 105 @ JPG, 21 @ .CR2, 5 @ .DNG). 10GB Audio folder – (1,483 files - 1479 @ MP3, 4 @ .FLAC files). 5GB (1.5bn pixel) photo. BluRay Movie - 42GB. 21GB 8K Movie demos - (11 demos) 16GB 4K Raw Movie Clips - (9 MP4V files). 4.25GB 3D Printer File Folder - (166 files - 105 @ .STL, 38 @ .FBX, 11 @ .blend, 5 @ .lwo, 4 @ .OBJ, 3@ .3ds). 1.5GB AutoCAD File Folder (80 files - 60 @ .DWG and 20 @.DXF). The Lexar MN610 had no real problems dealing with our real-life file transfer tests with the exception of when the 100GB data file is being written to it when it seemed to struggle somewhat. Apart from this file, the drive is much more efficient at handling larger file sizes, with over 500GB/s speeds, than the smaller files found in the 60GB Steam, 50GB file and 10GB audio folders. To get a measure of how much faster PCIe NVMe drives are than standard SATA SSD's we use the same files but transfer to and from a 512GB Toshiba OCZ RD400: Taking the SATA SSD out of the picture gives a better idea of just how capable the NM610 is at dealing with real-life file transfers, but once again the drive has a problem with the 100GB data file. Lexar introduced its range of M.2 SSDs early in 2019 and have recently refreshed the range so that (at the time of writing) it consists of just three models. The SATA based NM100 (512GB, 256GB and 128GB) and two NVMe drives, the NM700 (1TB, 512GB and 256GB capacities) aimed at professional users, and the entry-level mainstream NM610 which replaces the NM600. The NM610 brings slightly bigger capacities to the range, with 250GB and 500GB models replacing the 240GB and 480GB capacities of the NM600 line-up, and it also brings with it a new 1TB flagship drive. Just like the NM600, the NM610 uses a combination of 64-layer 3D TLC NAND and a Silicon Motion SM2263XT controller. The XT is the DRAM-less version of Silicon Motion’s 4-channel SM2263 controller which helps when trying to keep drive manufacturing costs down. To counteract the lack of DRAM cache support, the controller makes use of host memory buffer (HMB) technology which uses a small amount of system memory to cache the map table. Lexar’s official Sequential speed ratings for the 500GB drive are up to 2,100MB/s for reads and up to 1,600MB/s for writes. When tested with the ATTO benchmark, the review drive couldn’t quite get to that maximum read figure, but at 2,070MB/s it wasn’t that far short. The tested Sequential write figure of 1,657MB/s, on the other hand, was a little better than the official maximum speed. With our own Sequential tests, we got closer to that official maximum read with a result of 2,091.11MB/s, with writes peaking at 1,710.56MB/s. When it comes to 4K random performance the 500GB drive is rated as up to 188,000 IOPS for reads and 156,000 IOPS for writes. With our 4K testing, using four threads, we couldn’t get close to either of those figures, as we saw 132,413 IOPS for reads and just 53,610 IOPS for writes. We then did a quick test using 8 threads which saw the read figure climb past the official figure ending up at 243,856 IOPS at a QD of 32. It was a similar story for writes with the drive producing 230,445 IOPS at QD32. Overall, just like its predecessor, the NM600, the NM610 is clearly not the fastest SSD going – we consistently saw it placed in the bottom section of our charts for some of our testing runs. That said, Lexar has given it a fighting chance with competitive pricing so it is worth considering if you are looking for an affordable NVMe SSD. We found the 500GB Lexar NM610 for £71.49 (inc VAT) at ebuyer.com HERE. Discuss on our Facebook page HERE. Pros Decent Sequential performance. Good performance stability for this class of drive. Cons Disappointing 4K performance under our standard tests. KitGuru says: Like the NM600, the NM610 doesn’t bring anything new to the table in terms of performance or endurance but Lexar has given it a fighting chance in a highly competitive market segment with some keen pricing.