Seagate are well known for their ranges of HDD covering all market sectors, but they have been a little slower than their competitors in embracing consumer SSDs - that is until today. Aimed at gamers, the FireCuda 510 is an NVMe 2280 M.2 drive using a combination of a Phison controller and 64-layer 3D TLC NAND. At launch, the FireCuda 510 range comprises just two drives, 1TB and the flagship 2TB drive. The drive uses a combination of a Phison PS5012-E12 8-channel controller and Toshiba 64-layer BiCS 3D TLC NAND. The 1TB drive is rated at up to 3,450MB/s and 3,200MB/s for Sequential read and writes respectively which are also the performance figures of the 2TB drive. Random 4K performance for the 1TB is up to 620,000 IOPS for reads and up to 600,000 IOPS for writes. The 2TB drive is rated at the same 600,000 IOPS for writes while reads are rated as up to 485,000 IOPS The 1TB drive has a quoted TBW endurance figure of an excellent 1,300 TB and Seagate back the drive with a 5-year warranty. Physical Specifications: Usable Capacities: 1TB. NAND Components: Toshiba 64-layer BiCS 3D TLC NAND. NAND Controller: Phison PS5012-E12. Cache: 1GB DDR4 DRAM. Interface: PCIe Gen 3 ×4, NVMe 1.3. Form Factor: M.2 2280 Dimensions: 80.15 x 22.15 x 3.58mm Drive Weight: 8.1g Firmware Version: STES1020. Our review sample - the FireCuda 510 1TB came without any retail packaging we are sadly unable to show you pictures of the retail unit. The 1TB drive is a double sided design, that is to say it has components built on both sides of the PCB, all sitting under product stickers. On one side of the PCB (sitting under the FireCuda branding sticker) is the controller, a pair of Toshiba 256GB 64-layer BICS 3D TLC NAND packages and a 512MB DD4 DRAM cache chip. The other side of the PCB holds another pair of NAND packages along with the second DRAM cache IC. The controller might branded as Seagate, but under the skin it's a Phison PS5012-E12. Built on a 28nm process, the PS5012-E12 is an 8-channel controller supporting 3D TLC and 3D QLC NAND up to a total of 8TB. It supports Phison's SmartECC and LDPC (Low Density Parity Check) error correction algorithms. Seagate's SSD utility is SeaTools SSD. SeaTools SSD is a pretty comprehensive management tool that displays drive information including model, capacity, disk usage, temperature and remaining life. It also displays information about the drives interface. It has an event log that can be exported and with it you can perform firmware updates. Firmware updates are done via the Operations page. Within this page you can also run drive diagnostics, and, if the drive supports it, switch between performance optimised and capacity optimised modes. There's also a link to Seagate's disc cloning software - DiscWizard. You also have a choice of two themes, the basic SeaTools look or a flashier looking skin aimed at gamers. For testing, the drives are all wiped and reset to factory settings by HDDerase V4. We try to use free or easily available programs and some real world testing so you can compare our findings against your own system. This is a good way to measure potential upgrade benefits. Main system: Intel Core i7-7700K with 16GB of DDR4-3200 RAM, Sapphire R9 390 Nitro and an Asus Prime Z270-A motherboard. Other drives: Corsair Force MP500 480GB Corsair Force MP510 960GB Crucial P1 1TB Gigabyte Aorus RGB 512GB Intel Optane SSD900P 480GB Intel Optane SSD905P 480GB Intel SSD760p 512GB Kingston A1000 480GB Lexar NM600 480GB Plextor M9Pe(Y) 512GB Plextor M8PeG 512GB Patriot Viper VPN100 1TB PNY CS3030 1TB PNY CS2030 240GB Samsung SSD970 EVO 2TB Samsung SSD970 PRO 1TB Samsung SSD960 PRO 2TB Samsung SSD960 EVO 1TB Samsung SSD960 EVO Plus 1TB Toshiba XG6 1TB Toshiba OCZ RD400 512GB Western Digital Black SN750 1TB Western Digital Black SN750 1TB with Heatsink Western Digital Black NVMe 1TB Western Digital Black PCIe 512GB Software: Atto Disk Benchmark 3.05. CrystalMark 6.0.0. AS SSD 2.0. IOMeter. Futuremark PC Mark 8 All our results were achieved by running each test five times with every configuration this ensures that any glitches are removed from the results. Trim is confirmed as running by typing fsutil behavior query disabledeletenotify into the command line. A response of disabledeletenotify =0 confirms TRIM is active. CrystalDiskMark is a useful benchmark to measure theoretical performance levels of hard drives and SSD’s. We are using v6.0. Looking at the two CrystalDiskMark result screens it appears that the Phison PS5012-E12 controller in the FireCuda 510 is much more efficient when reading compressible data. The ATTO Disk Benchmark performance measurement tool is compatible with Microsoft Windows. Measure your storage systems performance with various transfer sizes and test lengths for reads and writes. Several options are available to customize your performance measurement including queue depth, overlapped I/O and even a comparison mode with the option to run continuously. Use ATTO Disk Benchmark to test any manufacturers RAID controllers, storage controllers, host adapters, hard drives and SSD drives and notice that ATTO products will consistently provide the highest level of performance to your storage. We are using version 3.5 for our NVMe disk tests. The official maximum Sequential read/write figures for Seagate's FireCuda 1TB drive are up to 3,450MB/s and 3,200MB/s respectively. When our review sample was tested with the ATTO benchmark it couldn't quite match those official maximums at 3,414MB/s for reads and 3,064MB/s for writes. AS SSD is a great free tool designed just for benching Solid State Drives. It performs an array of sequential read and write tests, as well as random read and write tests with sequential access times over a portion of the drive. AS SSD includes a sub suite of benchmarks with various file pattern algorithms but this is difficult in trying to judge accurate performance figures. The FireCuda 1TB drive displays strong performance in the AS SSD benchmark with its 2167 read and 2212 write scores. It joins its fellow 1TB class Phison PS5012-E12 / Toshiba 64-layer BiCS3 3D TLC NAND users, the Corsair Force MP510, PNY XLR8 CS3030 and Patriot's Viper VPN100 towards the top of the results table. IOMeter is another open source synthetic benchmarking tool which is able to simulate the various loads placed on hard drive and solid state drive technology. There are many ways to measure the IOPS performance of a Solid State Drive, so our results will sometimes differ from manufacturer’s quoted ratings. We do test all drives in exactly the same way, so the results are directly comparable. We test 128KB Sequential read and write and random read and write 4k tests. The test setup’s for the tests are listed below. Each is run five times. 128KB Sequential Read / Write. Transfer Request Size: 128KB Span: 8GB Thread(s): 1, Outstanding I/O: 1-32 Test Run: 20 minutes per test 4K Sustained Random Read / Write. Transfer Request Size: 4KB Span: 80GB Thread(s): 4, Outstanding I/O: 1-32 Test Run: 20 minutes per test 4K Random 70/30 mix Read/Write. Transfer Request Size: 4KB Span: 80GB Reads: 70% Writes: 30% Thread(s): 4 Outstanding I/O: 2 – 32 Test Run: 20 minutes. In our own Sequential read/write tests, Seagate's FireCuda 510 peak performance for both comes at the QD8 mark with reads at 3,398.71MB/s and writes at 3,058.63MB/s, both of which are shy of the official maximum figure for the drive. At deeper queue depths both read and write performance tails off. 128KB Sequential Read Performance v QD Compared At shallow queue depths the FireCuda keeps up with the other Phison PS5012-E12 controller / Toshiba 3D TLC NAND equipped drives in the read tests, but at a QD of 32, it lags a fair way behind them which is probably due to the way the Seagate have tailored the controller firmware for their needs. 128KB Sequential Write Performance v QD Compared It's a similar story with the Sequential write performance. At a QD of 1, the performance of the FireCuda 510 is good, good enough in fact to make it into the top 5 in our result chart. But as the QD deepens the drive loses touch with the likes of the Corsair Force MP510, PNY XLR8 CS3030 and Patriot Viper VPN100, but keeps ahead of the Gigabyte Aorus RGB, all of which use the same controller / NAND combo. Seagate quote 4K random read performance of the 1TB drive as up to 620.000 IOPS. With our 4-threaded 4K random read tests we couldn't get close to that figure, the best we saw was 372,352 IOPS. We did a quick test using 8-threads at a QD of 32 and got a read score of 508,651 IOPS, a good deal closer to the official maximum figure. 4K Random Read v QD Performance Compared The 4K random read performance of the FireCuda 510 compared to other drives using the same controller/NAND combination at QD's 1 & 2 is very good, leading the way in fact. At QD4 the performance compared to the others starts to fall away before coming back strongly at QD32. As with our random read tests, the 4-threaded 4K random write test result of 198,568 IOPS was nowhere close to the official figure of up to 600,000 IOPS. As we did with random reads we tested the drive at a QD of 32 using eight threads which gave us a result of 486,103 IOPS, a large way towards the official maximum IOPS figure. 4K Random Write v QD Performance Compared At the various tested queue depths the FireCuda keeps pace with the majority of the drives using the same controller and NAND combo with the exception of Corsair's Force MP510 drive at QD1 where the Corsair drive is much faster. At a QD of 32 it's the FireCuda that reigns supreme amongst the Phison PS5012-E12 / Toshiba 3D TLC NAND users. 
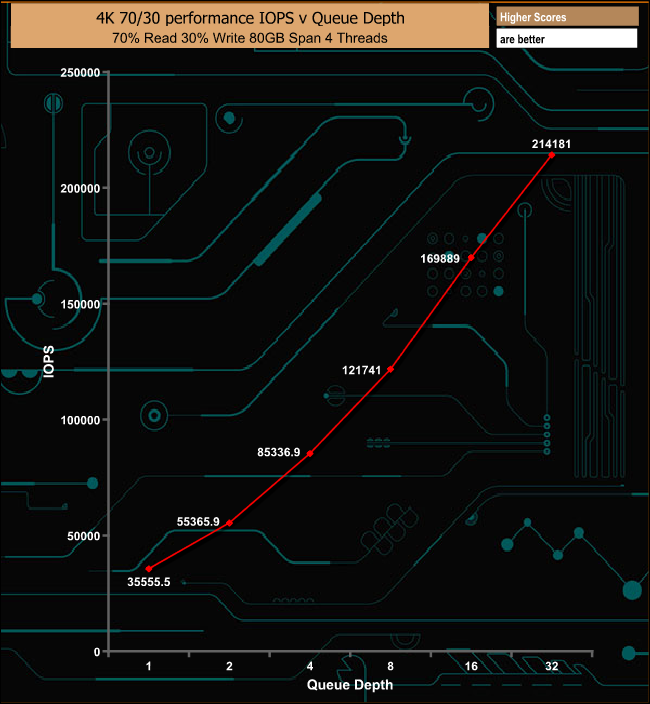
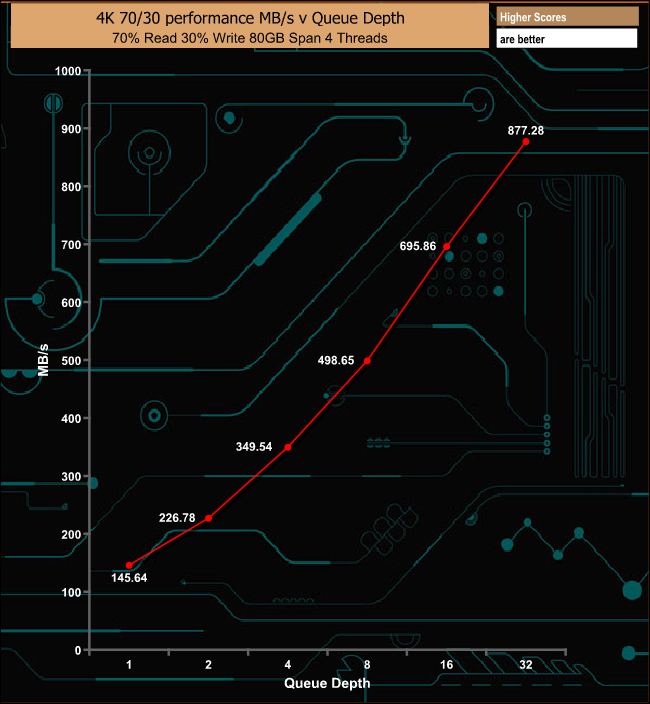
The FireCuda 510 handles the 4K 70/30 mixed test well, with the performance increasing steadily as the QD deepens. The peak average read rate of 2,841.22MB/s occurred at the 8MB block size. The read figure of 2,841.22MB/s puts the FireCuda 510 into fifth position in our results chart. Peak average write score for the FireCuda 510 in our throughput test, 2,930.49MB/s, came at the 8MB block mark. A very strong write throughput figure of 2,930.49MB/s drops the drive into second place behind PNY's XLR8 CS3030, a drive that uses the same NAND & controller combination as the FireCuda. Futuremark’s PCMark 8 is a very good all round system benchmark but it’s Storage Consistency Test takes it to whole new level when testing SSD drives. It runs through four phases; Preconditioning, Degradation, Steady State, Recovery and finally Clean Up. During the Degradation, Steady State and Recovery phases it runs performance tests using the 10 software programs that form the backbone of PCMark 8; Adobe After Effects, Illustrator, InDesign, Photoshop Heavy and Photoshop Light, Microsoft Excel, PowerPoint, Word, Battlefield 3 and World of Warcraft. With some 18 phases of testing, this test can take many hours to run. Preconditioning The drive is written sequentially through up to the reported capacity with random data, write size of 256 × 512 = 131,072 bytes. This is done twice. Degradation Run writes of random size between 8 × 512 and 2048 × 512 bytes on random offsets for 10 minutes. It then runs a performance test. These two actions are then repeated 8 times and on each pass the duration of random writes is increased by 5 minutes. Steady State Run writes of random size between 8 × 512 and 2048 × 512 bytes on random offsets for final duration achieved in degradation phase. A performance test is then run. These actions are then re-run five times. Recovery The drive is idled for 5 minutes. Then a performance test is run. These actions are then repeated five times. Clean Up The drive is written through sequentially up to the reported capacity with zero data, write size of 256 × 512 = 131,072 bytes. Seagate's FireCuda 510 handles the rigours of PCMark 8's Consistency Test rather well. Averaging 4,837MB/s total bandwidth for the Degradation and SteadyState phases and 5,635MB/s for the recovery phase. PCMark 8’s Consistency test provides a huge amount of performance data, so here we’ve looked a little closer at how the FIreCuda 510 performs in each of the benchmarks test suites. Adobe Creative Cloud In the Adobe CC part of the test it's usually the Photoshop Heavy trace that causes a drive problems but not the FireCuda 510. The bandwidth for the trace is a bit erratic, but there are no dramatic drops in performance like we sometimes see, during the test run. Microsoft Office Just like the Photoshop Heavy trace, it's normally the Word trace that causes the most problems during the MS Office part of the test but not with the IronCuda 510. There is a drop in bandwidth during the fourth Degradation run but the drive recovers straight away. Strangely the worst drop in bandwidth occurs during the recovery phases of the Word test. Casual Gaming The two casual gaming tests are poles apart when it comes to bandwidth performance. The Battlefield 3 test averages 397MB/s for the whole run while the World Of Warcraft averages 122MB/s. But that's not the whole story as for the main part of the test, the World Of Warcraft trace averages just 37.8MB/s but the dramatic rise in performance during the recovery phases sees the average bandwidth rocket up to 343MB/s for five test runs that make up this phase of the test. Just like the Consistency test, PCMark 8’s Standard Storage test also saves a large amount of performance data. The default test runs through the test suite of 10 applications three times. Here we show the total bandwidth performance for each of the individual test suites for the third and final benchmark run. Seagate's FireCuda 510 displays some strong performance figures for the third and final run of PCMark 8's Standard Storage test, particularly in the Adobe Photoshop Heavy, Light and InDesign tests. When it comes to the total bandwidth figure for the Standard Storage test, the FireCuda 510 is the fastest Phison PS5012-E12 / Toshiba 64-layer 3D TLC NAND drive we've seen to date. For the long term performance stability test, we set the drive up to run a 20-minute 4K random test with a 30% write, 70% read split, at a Queue Depth of 256 over the entire disk. The FireCuda 510 averaged 105,900 IOPS for the test with a performance stability of 78.18%, which is excellent for this class of drive. To test real life performance of a drive we use a mix of folder/file types and by using the FastCopy utility (which gives a time as well as MB/s result) we record the performance of drive reading from & writing to a 256GB Samsung SSD850 PRO. 100GB data file. 60GB iso image. 60GB Steam folder – 29,521 files. 50GB File folder – 28,523 files. 12GB Movie folder – 24 files (mix of Blu-ray and 4K files). 10GB Photo folder – 621 files (mix of .png, raw and .jpeg images). 10GB Audio folder – 1,483 files (mix of mp3 and .flac files). 5GB (1.5bn pixel) photo. Blu-ray Movie. 21GB 8K Movie demos. 11GB 4K Raw Movie Clips (8 MP4V files). The Seagate FireCuda 510 handled our real life file transfers without any problems. To get a measure of how much faster PCIe NVMe drives are than standard SATA SSD's we use the same files but transfer to and from a 512GB Toshiba OCZ RD400 Taking the SATA SSD out of the lop and using a NVMe drive instead saw some mighty transfer rates being delivered with over 1GB/s performance for all bar four of the tests and over 2GB/s for the 12GB Movie Folder, BluRay movie and 10GB Photo folder transfers. Although Seagate are primarily known for their huge range of conventional HDD's they also have SSD's in their portfolio albeit in the Enterprise market segment. So it seems strange with this knowledge of NAND based drives in-house it's taken until now to see a Seagate NVMe based SSD for the consumer space, but finally they have entered this highly competitive segment with the FireCuda 510. The FireCuda 510 uses a tried and tested NAND and controller combination that's seen a lot lately, namely a Phison PS5012-E12 8-channel controller with Toshiba 64-layer BiCS3 3D TLC NAND. At launch the FireCuda 510 range consists of just two capacities, 1TB and 2TB. The official Sequential speed ratings for the drive are up to 3,450MB/s for reads and up to 3,200MB/s for writes. Using the ATTO benchmark we got closer to the maximum read score at 3,414MB/s than we did the write, with the review drive giving a write score of 3,064MB/s. It was a similar story with our own Sequential tests which produced figures of 3,398MB/s and 3,058.63MB/s for read and writes respectively. Seagate quote 4K random read/write performance of the 1TB drive as up to 620.000 IOPS and 600,000 IOPS respectively. Using our standard 4K random read/write tests with four-threads we couldn't get close to either of those figures with reads at 372,352 IOPS and writes at 198,568 IOPS at a QD of 32. We then did a quick test again at a QD of 32 but using eight-threads, which resulted in reads of 508,651 IOPS and writes at 486,103 IOPS. Seagate's well known drive utility, SeaTools now comes in an SSD version. SeaTools SSD is a pretty comprehensive management tool that displays capacity, disk usage, temperature and remaining life of the drive. The Operations page allows the firmware to be updated, drive diagnostics to be carried out, switch between performance optimised and capacity optimised modes if this is supported by the drive and the page includes a link to Seagate's disc cloning software - DiscWizard. There's even a choice of skins for the utility allowing you to swap from the standard looking SeaTools skin to a flashier looking one aimed at gamers. With its very good all-round performance and excellent endurance, Seagate's FireCuda 510 should make its market competitors take notice of it apart from one rather significant fly in the ointment, the pricing. As it stands the drive is around £20 more expensive than WD's Black SN750 1TB drive (the standard one) but more to the point it's more expensive than some 1TB drives using the same NAND and controller such as the Corsair Force MP510, Patriot's Viper VPN100 and the PNY XLR8 CS3030. We found the 1TB version of the FireCuda on Overclockers UK for £199.99 HERE, though do bear in mind this is a sale price and the drive usually retails for £225. Pros Overall Performance. Excellent endurance. 5-year warranty Cons Pricing could do with tweaking. Couldn't match the official maximum 4K random figures under testing. Kitguru says: Seagate has finally made an entrance on the consumer NVMe SSD stage with the FireCuda 510 but although it performs well, Seagate need to do some fettling with the pricing to make it a bit more competitive.